FINAL FASD SURP presentation
38
The Relationship between Cognitive Deficits and Academic Achievement for Children with a Fetal Alcohol Spectrum Disorder Lindsey Jackson Project Mentor: Dr. Rachel Tangen, Ph.D., Neuropsychologist Division of Developmental/Behavioral Pediatrics and Psychology
-
Upload
lindsey-jackson -
Category
Documents
-
view
53 -
download
0
Transcript of FINAL FASD SURP presentation
The Relationship between Cognitive Deficits and
Academic Achievement for Children with a Fetal Alcohol
Spectrum DisorderLindsey Jackson
Project Mentor: Dr. Rachel Tangen, Ph.D., NeuropsychologistDivision of Developmental/Behavioral Pediatrics and Psychology

Outline• About FASD• Diagnosis• Previous Research• My Project• Future Directions

What is FASD?

About FASD• Describes a range of effects including physical, mental, behavioral, and learning disabilities• Caused by maternal alcohol consumption• Is not a diagnosis, only an umbrella term
(Benz et. al., 2009)
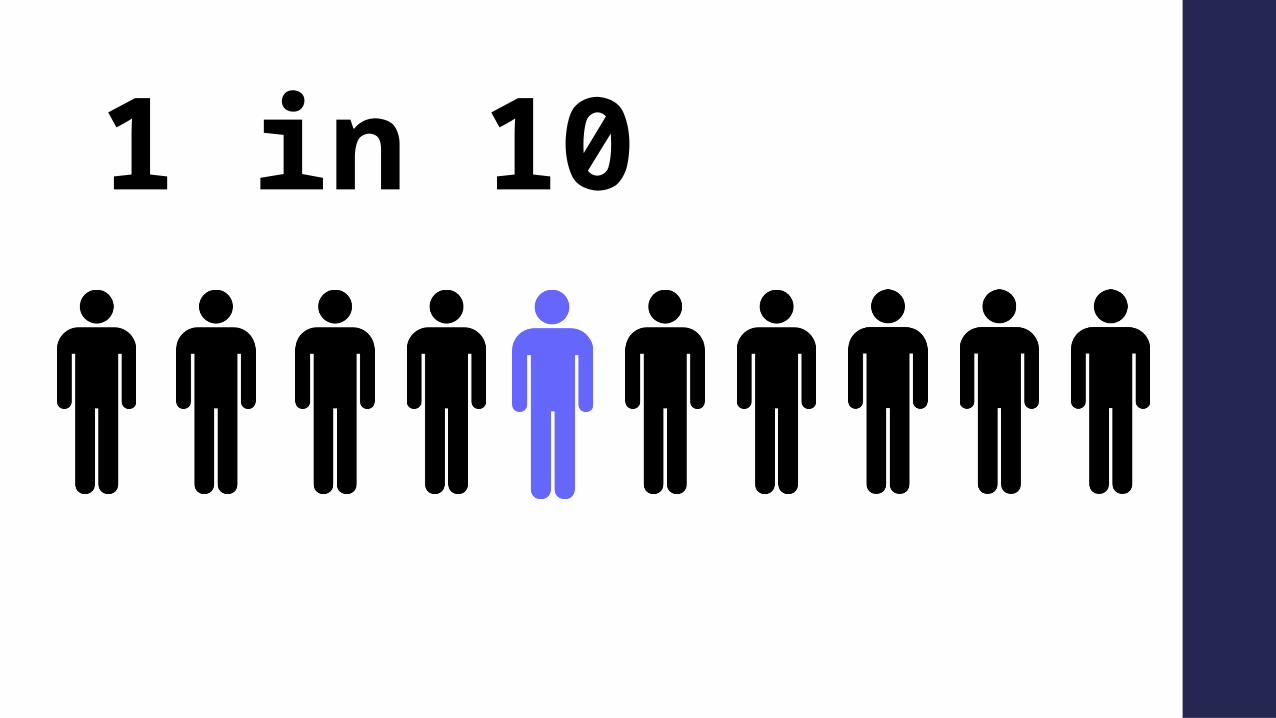
1 in 10
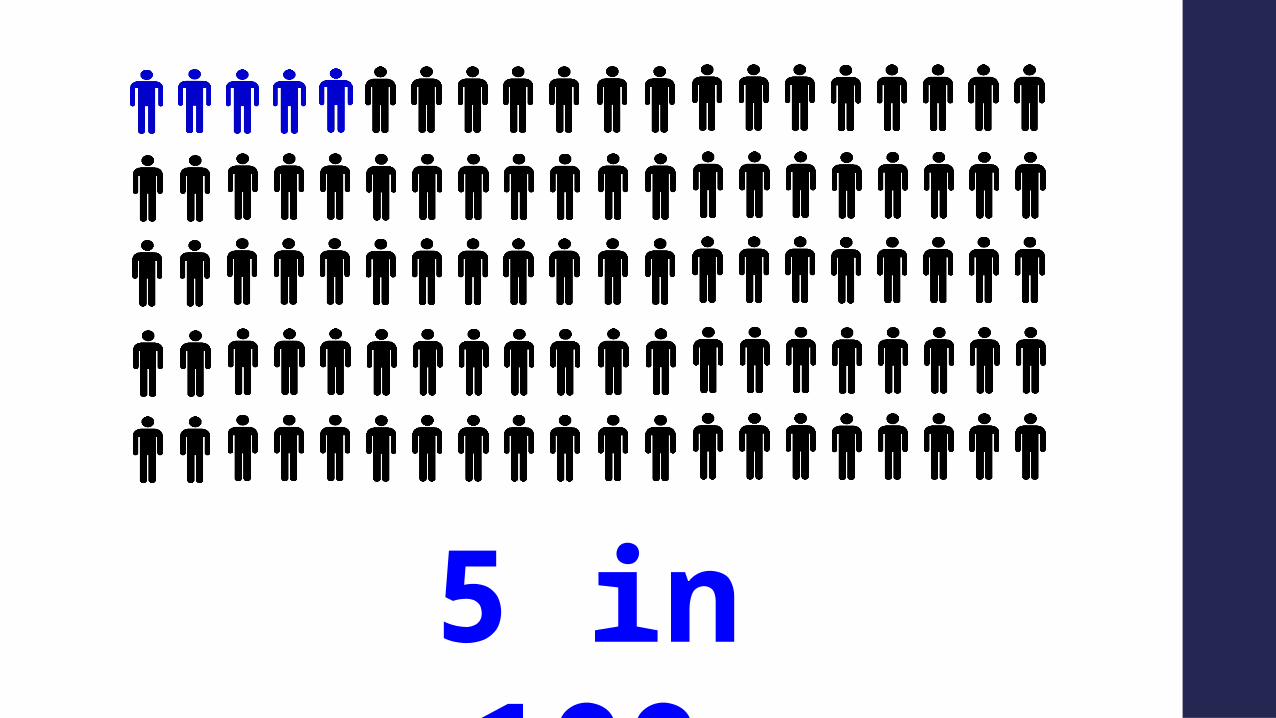
5 in 100

How is FASDdiagnosed?
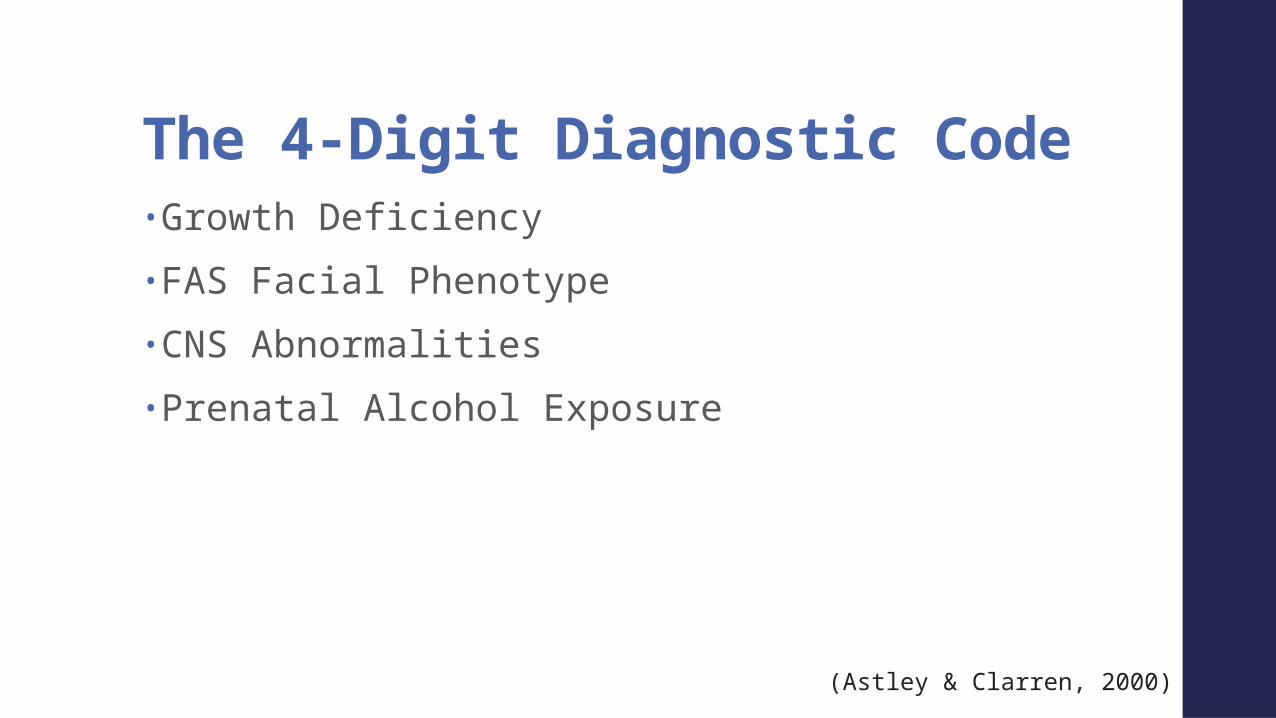
The 4-Digit Diagnostic Code• Growth Deficiency• FAS Facial Phenotype• CNS Abnormalities• Prenatal Alcohol Exposure
(Astley & Clarren, 2000)
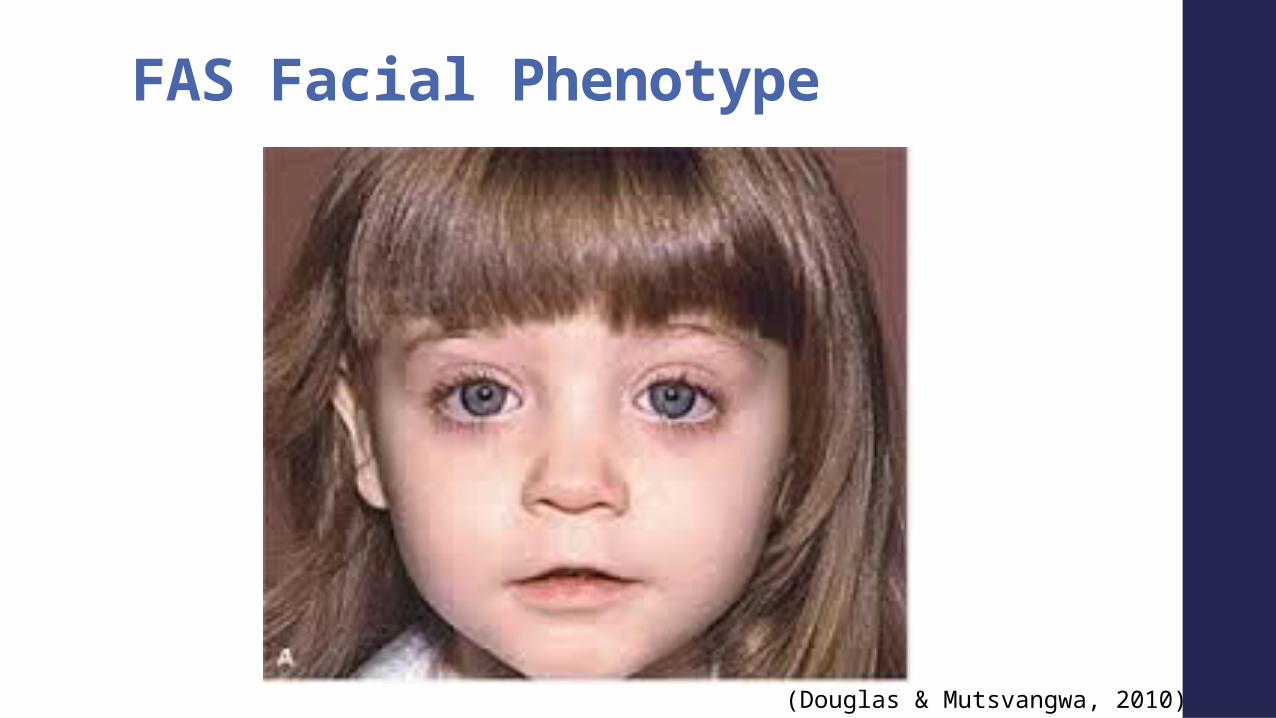
FAS Facial Phenotype
(Douglas & Mutsvangwa, 2010)
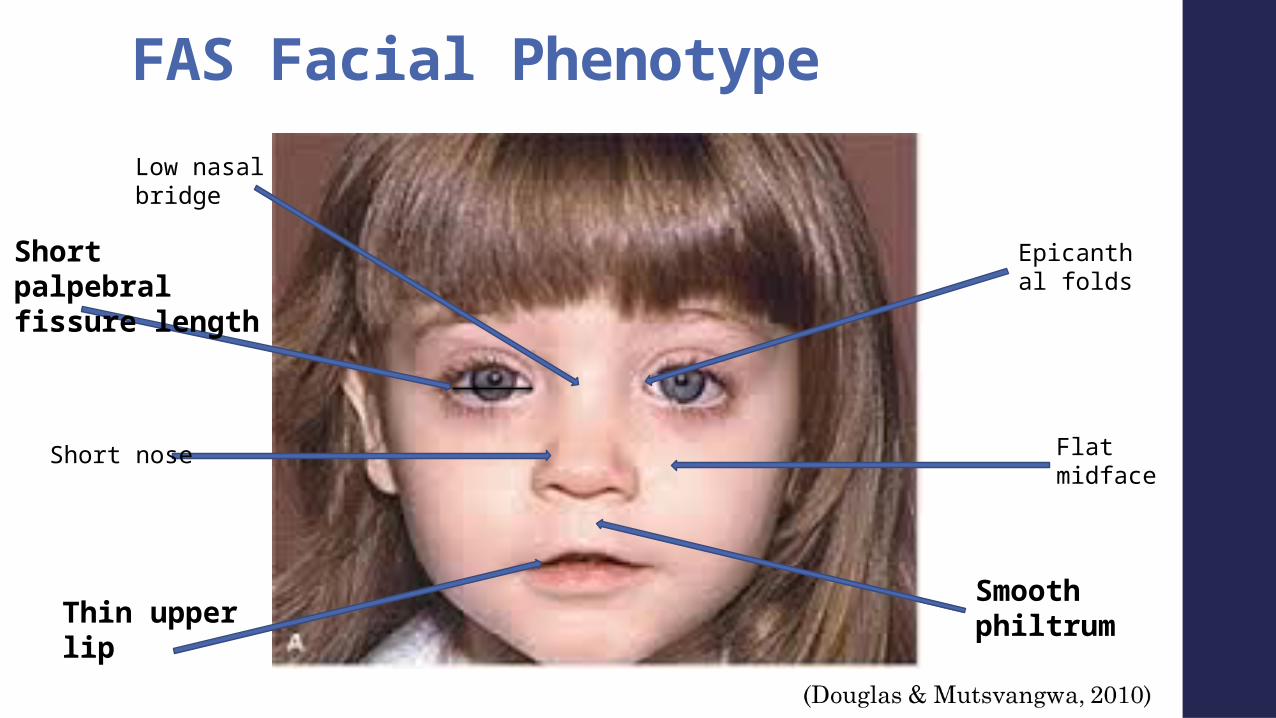
Epicanthal folds
Smooth philtrumThin upper
lip
Flat midface
Low nasal bridge
Short nose
Short palpebral fissure length
FAS Facial Phenotype

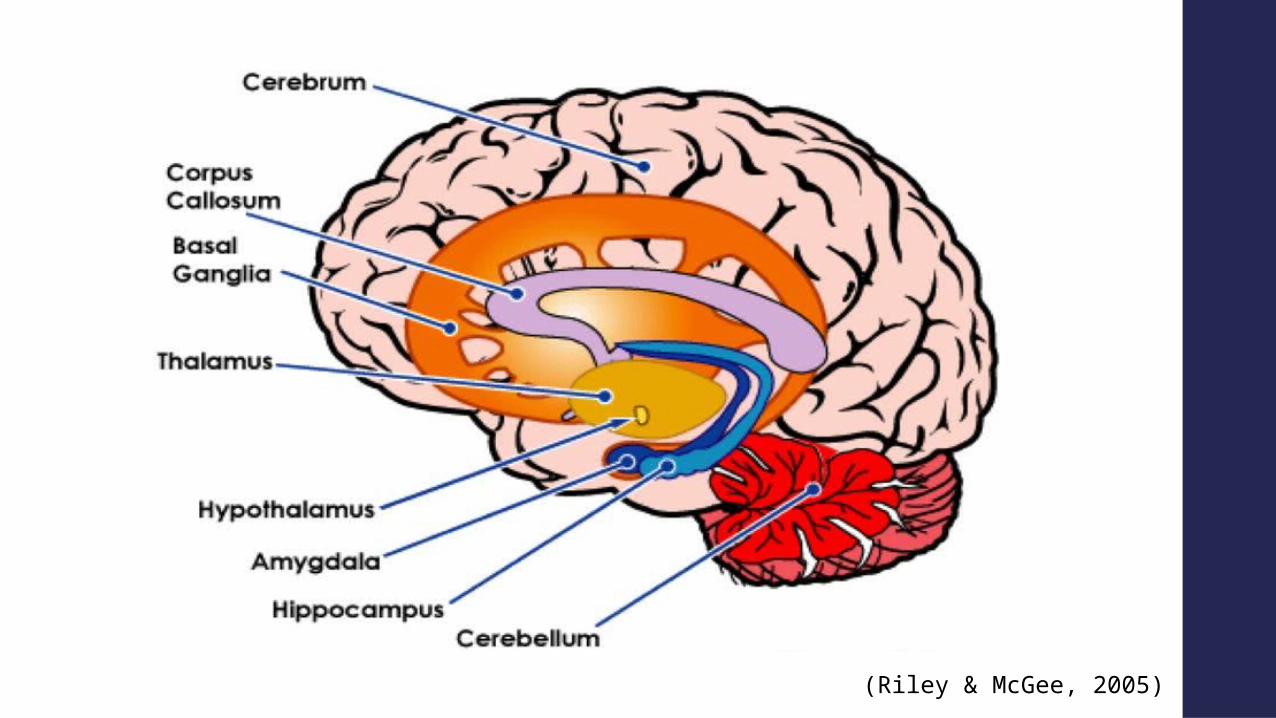
Structural CNS Damage
(Riley & McGee, 2005)
(Riley & McGee, 2005)

Neuropsychological Profile• IQ• Memory• Attention• Language• Motor skills• Executive functioning• Visual-spatial abilities
(Kodituwakku, 2009)
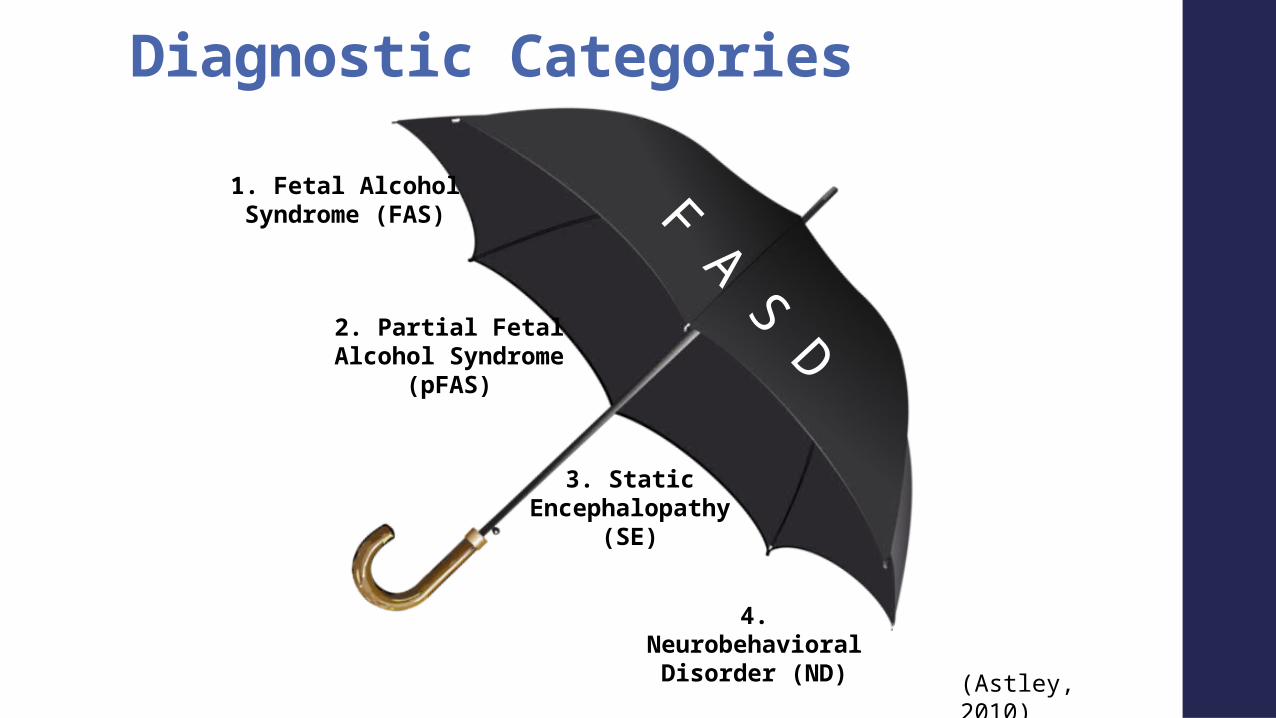
Diagnostic Categories
1. Fetal Alcohol Syndrome (FAS)
2. Partial Fetal Alcohol Syndrome
(pFAS)
3. Static Encephalopathy
(SE)
4. Neurobehavioral
Disorder (ND)
F A S D
(Astley, 2010)
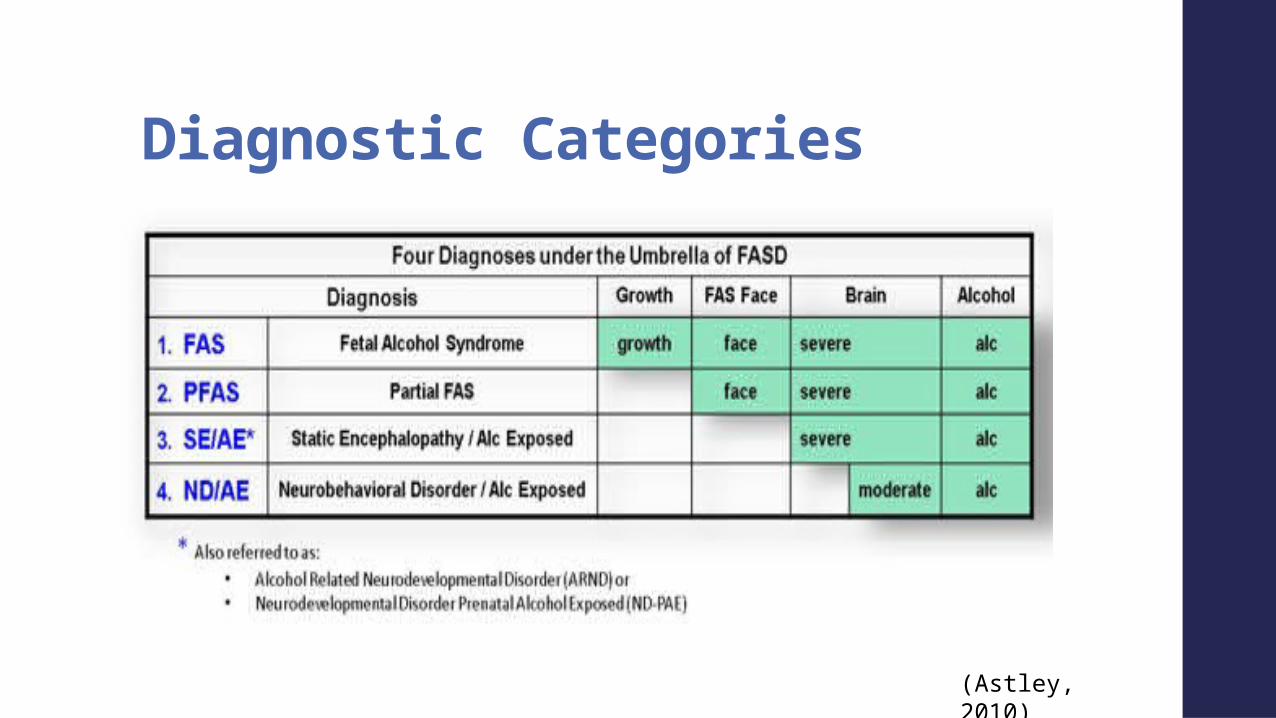
Diagnostic Categories
(Astley, 2010)

Previous Research
Academic Achievement• Limited research that looks comprehensively at reading, math, and
writing in children across different FASD diagnosis.• In available research:• Limited studies looking at math and reading abilities in the same study• Compared to other children with special needs, children
with FASD had more trouble with math (Howell et. al., 2006)• Compared to alcohol-exposed children not diagnosed with FASD, more
likely to fall in clinical range for math abilities (Nash et. al., 2013)• Australian study using standardized test scores showed poor
performance on a screening of reading, writing, and spelling• Academic achievement at age 10 showed overall poor academic
performance, especially in letter recognition and reading comprehension(Goldschmidt et. al., 2004; O’Leary et. al., 2013)
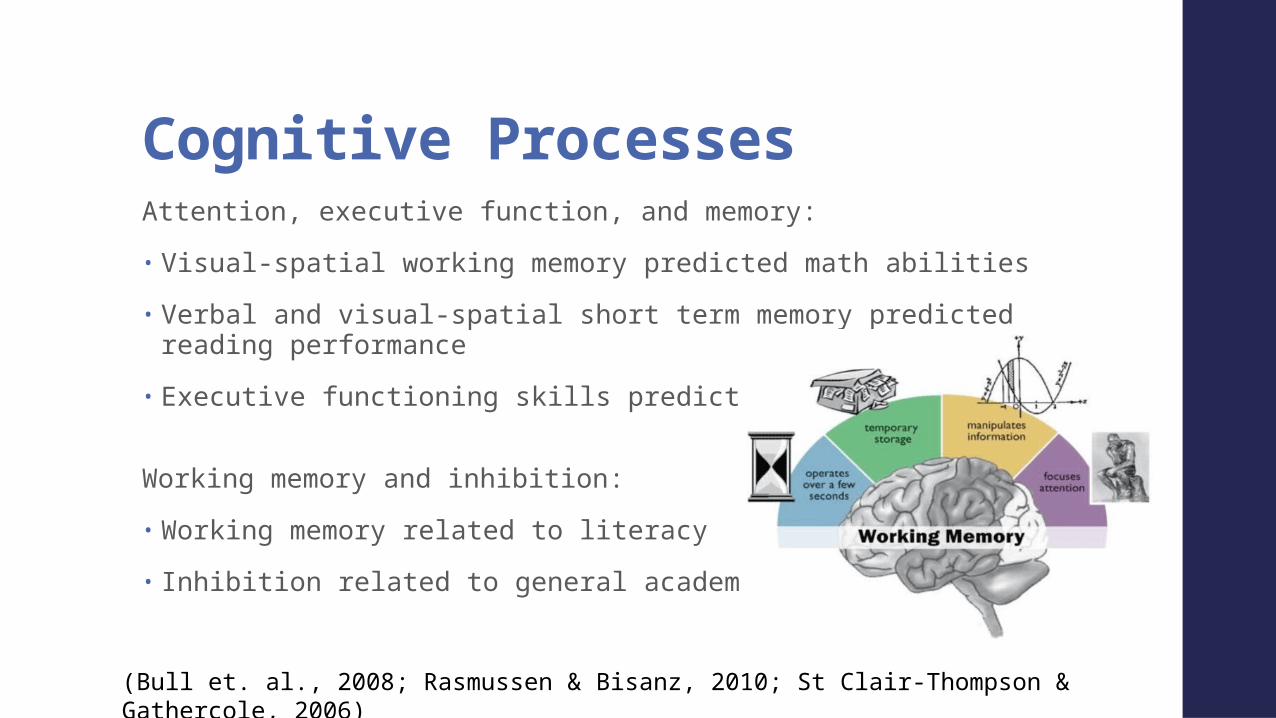
Cognitive ProcessesAttention, executive function, and memory:• Visual-spatial working memory predicted math abilities• Verbal and visual-spatial short term memory predicted reading
performance• Executive functioning skills predicted general
learningWorking memory and inhibition:• Working memory related to literacy• Inhibition related to general academic performance
(Bull et. al., 2008; Rasmussen & Bisanz, 2010; St Clair-Thompson & Gathercole, 2006)

My Project
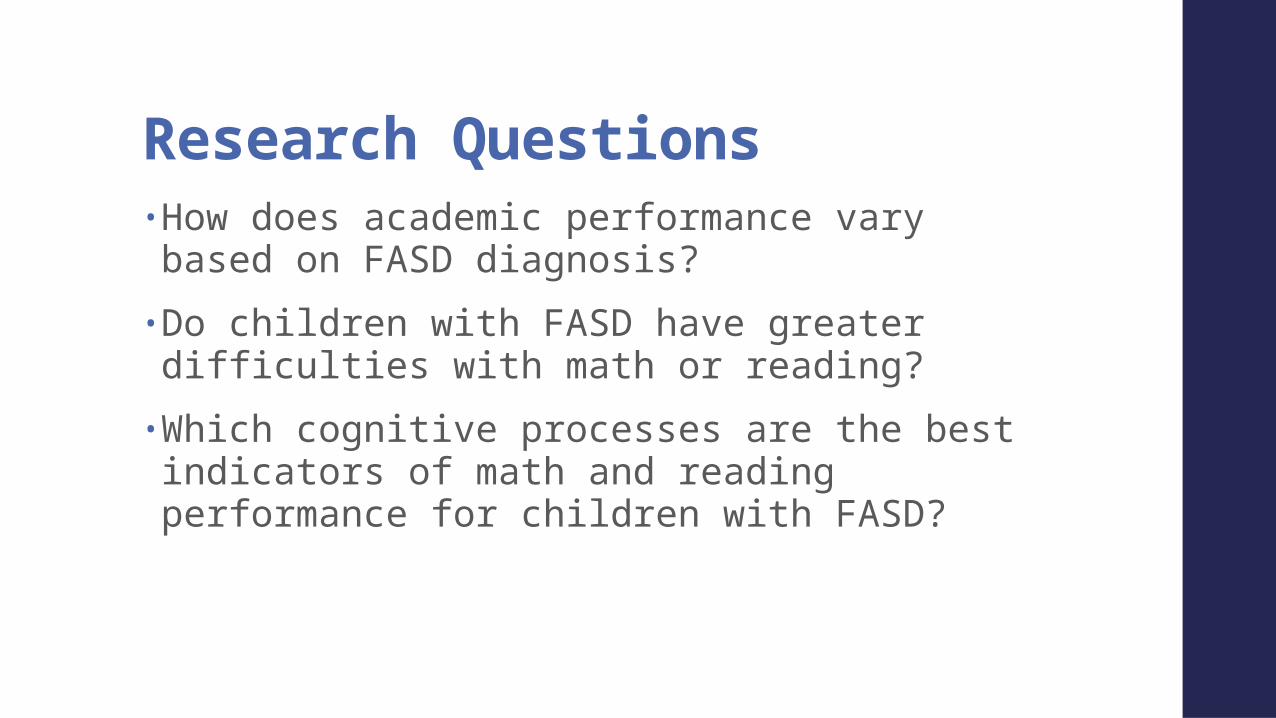
Research Questions• How does academic performance vary based on FASD diagnosis?• Do children with FASD have greater difficulties with math or reading? • Which cognitive processes are the best indicators of math and reading performance for children with FASD?
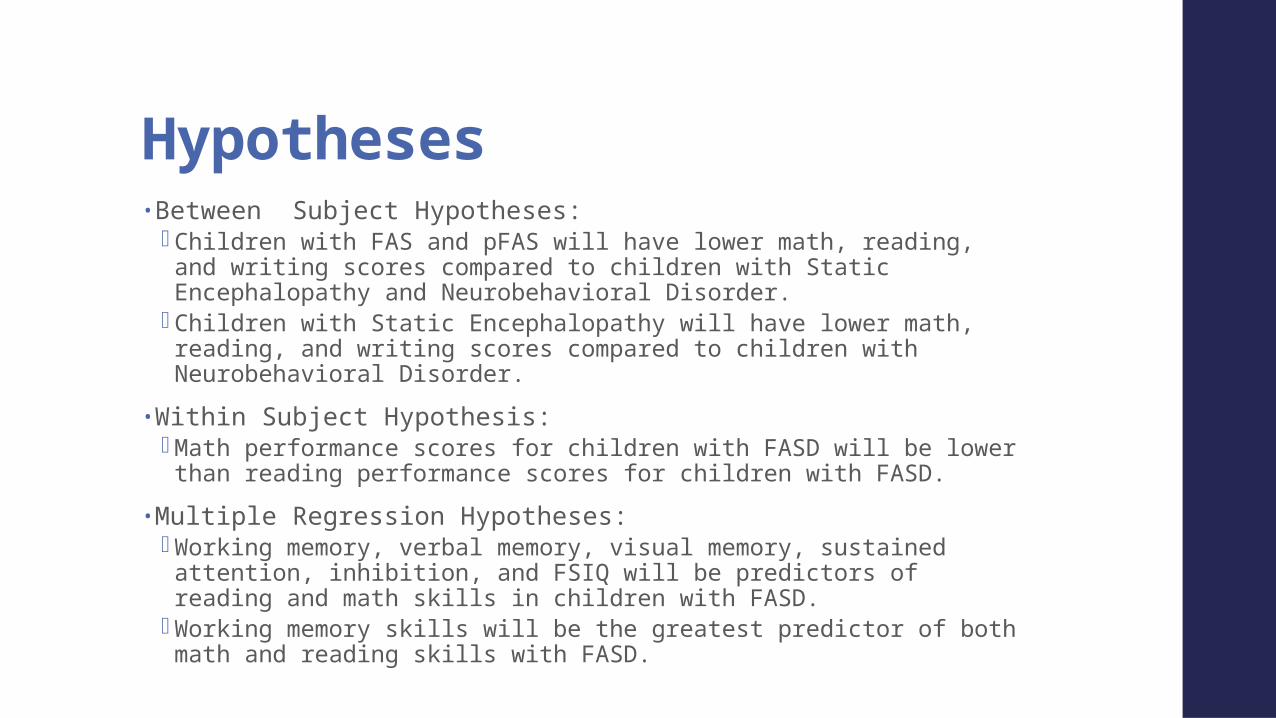
Hypotheses• Between Subject Hypotheses:
Children with FAS and pFAS will have lower math, reading, and writing scores compared to children with Static Encephalopathy and Neurobehavioral Disorder.
Children with Static Encephalopathy will have lower math, reading, and writing scores compared to children with Neurobehavioral Disorder.
• Within Subject Hypothesis: Math performance scores for children with FASD will be lower than
reading performance scores for children with FASD.• Multiple Regression Hypotheses:
Working memory, verbal memory, visual memory, sustained attention, inhibition, and FSIQ will be predictors of reading and math skills in children with FASD.
Working memory skills will be the greatest predictor of both math and reading skills with FASD.

MethodsStandardized Measures of Cognitive and Academic Achievement
(Standard Score = 100; Standard Deviation = 15)• Academic achievement- Woodcock-Johnson III and
Woodcock-Johnson IV• Memory- Children’s Memory Scale (CMS)• Attention and Disinhibition - Conners’ Continuous
Performance Test-Second Edition• Working Memory – Wechsler Intelligence Scale for Children• FSIQ- Wechsler Intelligence Scale for Children IV or Wechsler
Intelligence Scale for Children V (WISC-IV or WISC-V)
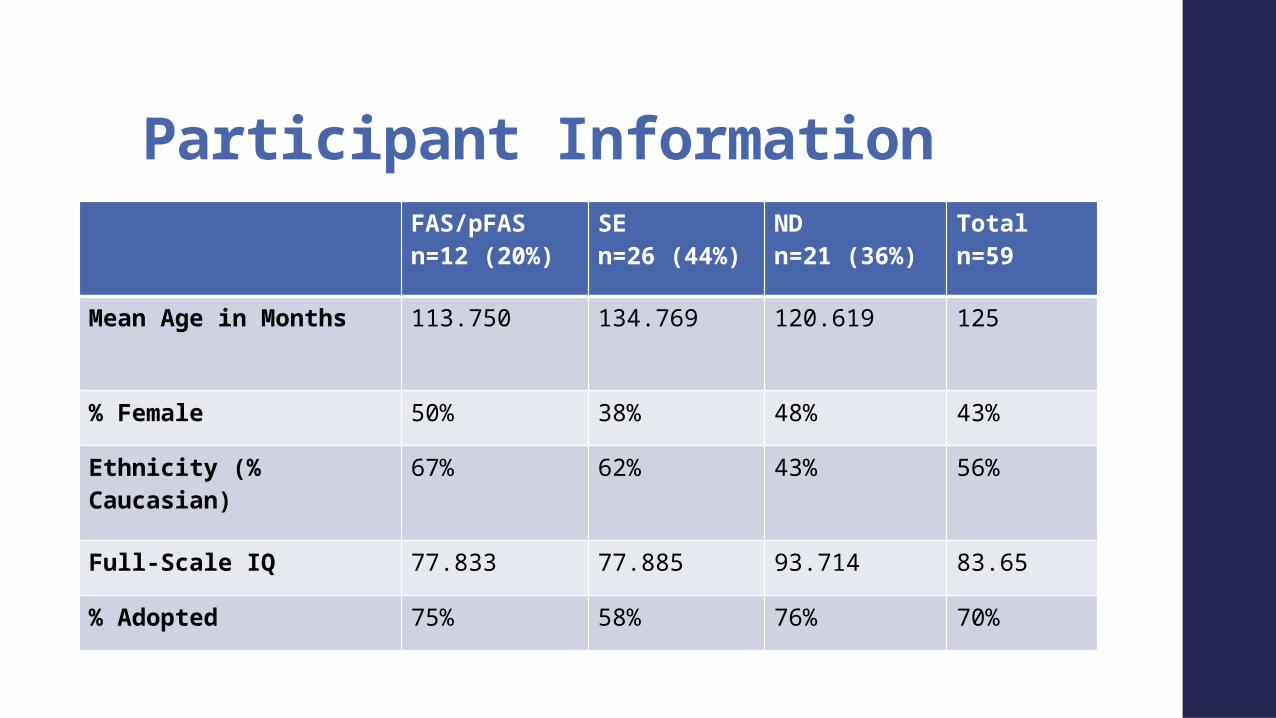
Participant InformationFAS/pFASn=12 (20%)
SEn=26 (44%)
NDn=21 (36%)
Totaln=59
Mean Age in Months 113.750 134.769 120.619 125
% Female 50% 38% 48% 43%
Ethnicity (% Caucasian)
67% 62% 43% 56%
Full-Scale IQ 77.833 77.885 93.714 83.65
% Adopted 75% 58% 76% 70%

Analyses• A series of one way ANOVAs with post hoc Bonferroni
correction were conducted to assess FASD diagnosis group differences for reading, math, and writing subtests.
• Within subject repeated measures ANOVAs were conducted to assess within subject differences on selected comparisons including: Brief Math and Brief Reading, letter/word recognition and passage comprehension, and calculations and applied problems.
• Multiple regression analyses were conducted to determine a predicative relationship between cognitive measures (WMI, visual immediate memory, verbal immediate memory, omission, commission, and FSIQ) and academic performance in math and reading.

Results
At a p<.05 level, there were significant differences between groups 2 and 3 on all academic measures. Results were not significant for all academic measures between groups 1 and 2. There were significant differences between groups 1 and 3 for several measurements: LW p=.033, Calc p=.002, and WS p=.031.
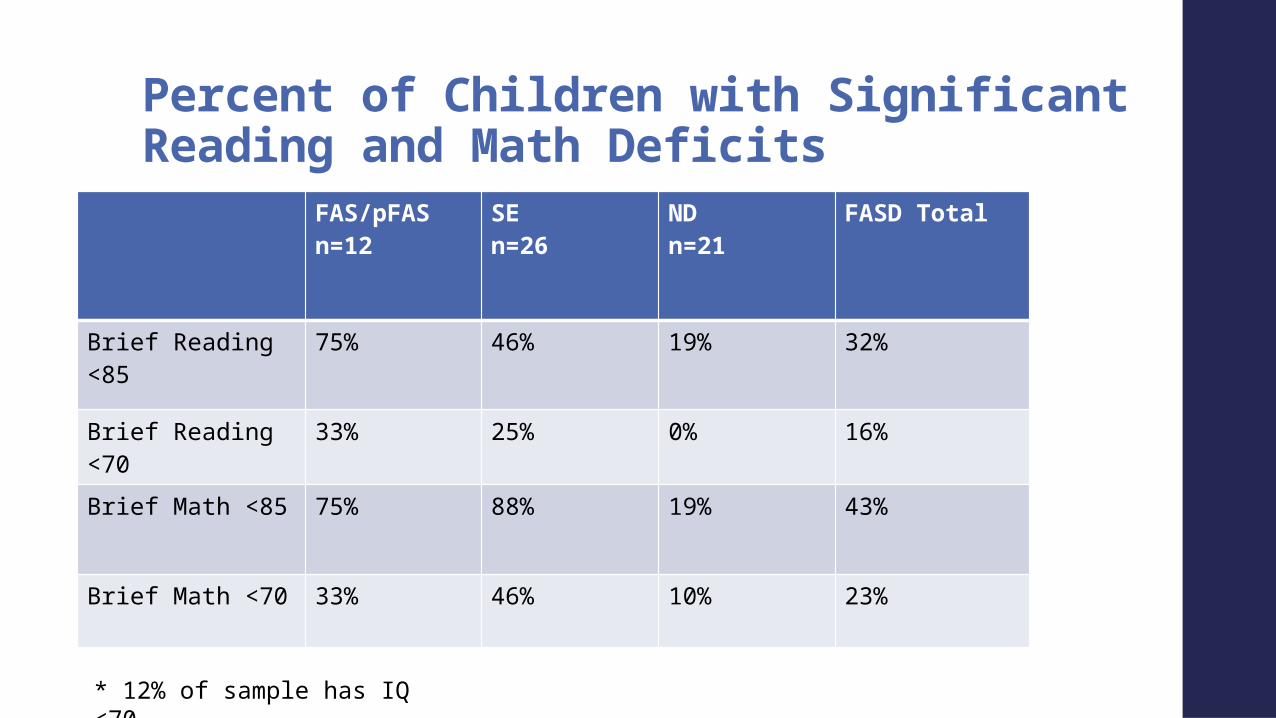
Percent of Children with Significant Reading and Math Deficits
FAS/pFAS n=12
SE n=26
ND n=21
FASD Total
Brief Reading <85
75% 46% 19% 32%
Brief Reading <70
33% 25% 0% 16%
Brief Math <85 75% 88% 19% 43%
Brief Math <70 33% 46% 10% 23%
* 12% of sample has IQ <70
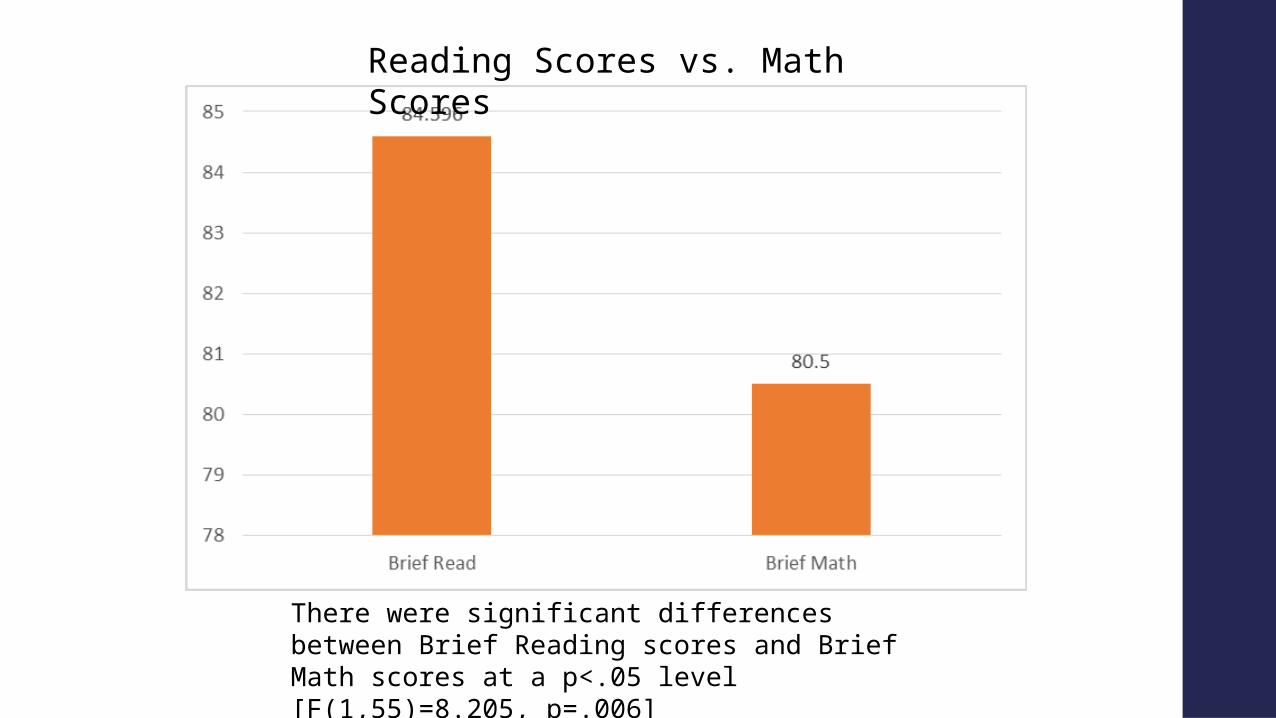
There were significant differences between Brief Reading scores and Brief Math scores at a p<.05 level[F(1,55)=8.205, p=.006]
Reading Scores vs. Math Scores
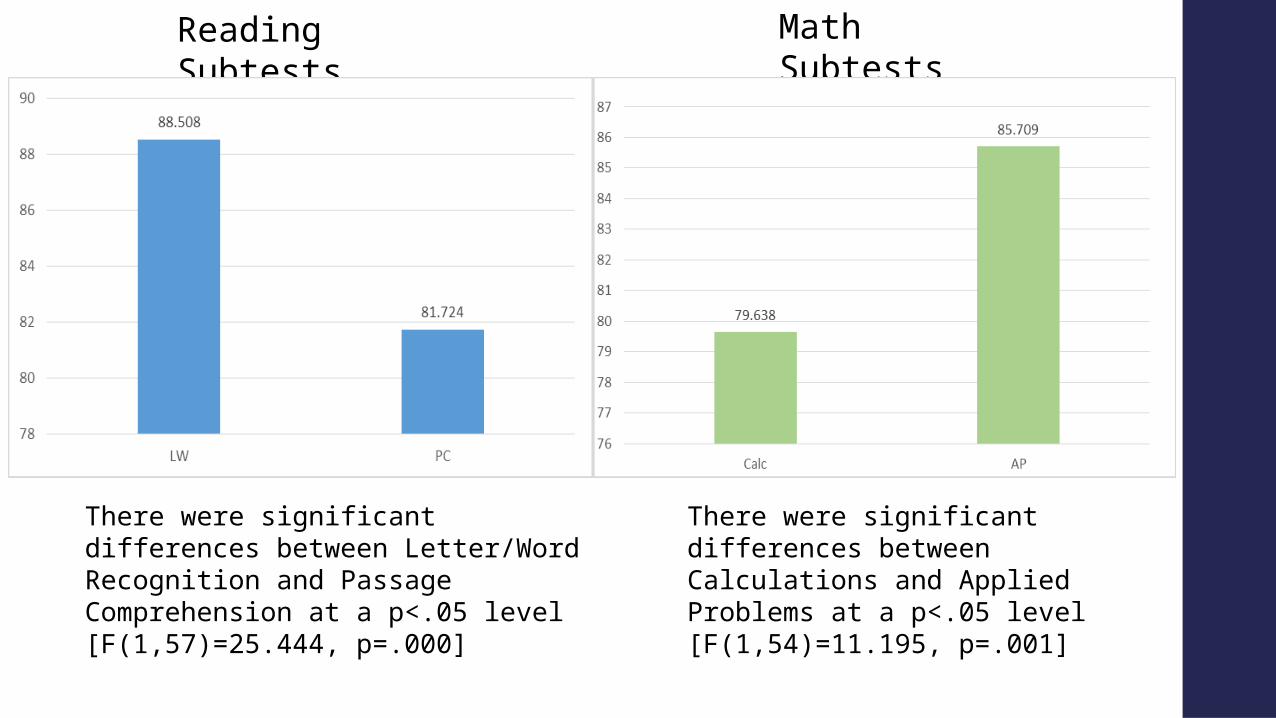
There were significant differences between Letter/Word Recognition and Passage Comprehension at a p<.05 level[F(1,57)=25.444, p=.000]
There were significant differences between Calculations and Applied Problems at a p<.05 level[F(1,54)=11.195, p=.001]
Reading Subtests Math Subtests

Applied Problems R2 F DF P.578 8.206 (6,36) .000
Predictors β t p rWorking Memory -.098 -.546 .589 -.091Visual Immediate Memory -.028 -.218 .829 -.036Verbal Immediate Memory .058 .425 .673 .071Omission -.084 -.716 .479 -.118Commission .048 .386 .702 .064FSIQ .780 4.000 .000 .555
Calculations R2 F DF P.679 13.049 (6,37) .000
Predictors β t p rWorking Memory .297 1.922 .062 .301Visual Immediate Memory -.052 -.484 .631 -.079Verbal Immediate Memory .184 1.580 .123 .251Omission -.009 -.087 .931 -.014Commission .147 1.369 .179 .220FSIQ .436 2.607 .013 .394
Letter/Word Recognition R2 F DF P.662 12.418 (6,38) .000
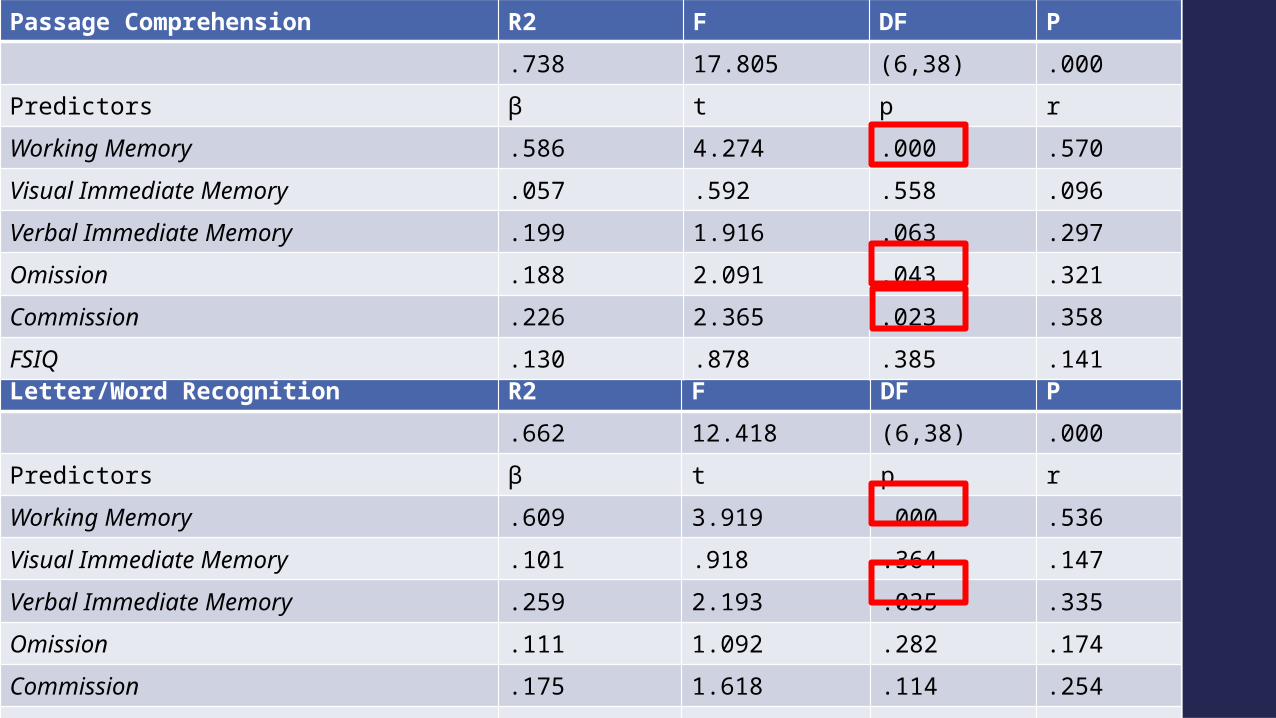
Predictors β t p r Working Memory .609 3.919 .000 .536Visual Immediate Memory .101 .918 .364 .147Verbal Immediate Memory .259 2.193 .035 .335Omission .111 1.092 .282 .174Commission .175 1.618 .114 .254FSIQ -.008 -.050 .960 -.008
Passage Comprehension R2 F DF P.738 17.805 (6,38) .000
Predictors β t p rWorking Memory .586 4.274 .000 .570Visual Immediate Memory .057 .592 .558 .096Verbal Immediate Memory .199 1.916 .063 .297Omission .188 2.091 .043 .321Commission .226 2.365 .023 .358FSIQ .130 .878 .385 .141
Discussion• Academic performance varies based on FASD diagnosis. Children with FASD do not need to have full FAS to have significant academic deficits.
Children with Static Encephalopathy and Neurobehavioral Disorder have different profiles. It may be problematic to group them under one label (Alcohol Related Neurodevelopmental Disorder).
• Children with FASD have a greater percentage of children that fall below expected levels in reading and math than the population norms. A greater number of children would be considered to have learning disabilities.
Discussion• Overall, math performance is worse than reading performance for
children with FASD, although both are below normative standards. Word reading and applied math (with visual cues) were better preserved than reading comprehension and calculation which may require greater reasoning skills.
• IQ is the best predictor of math achievement for both calculations and applied problems. In contrast, IQ is not a significant predictor for reading skills. Working memory, attention, and inhibition are the best predictors of reading comprehension ability. Working memory and verbal immediate memory are the best predictors of letter/word recognition
• Results provide better understanding of academic performance for children with FASD to influence the interventions developed and used for these children.

Limitations• Clinical research
No control group Variation in testing
• Small sample size• Limited knowledge of maternal alcohol consumption

Future Research• Longitudinal study looking at academic growth• Partnering with research facilities in other places to include other demographics in the study

ReferencesAstley, S. J. (2010). Profile of the first 1,400 patients receiving diagnostic evaluations for fetal alcohol spectrum disorder at the Washington State Fetal Alcohol Syndrome Diagnostic & Prevention Network. Can J Clin Pharmacol,17(1), e132-e164.Astley, S. J., & Clarren, S. K. (2000). Diagnosing the full spectrum of fetal alcohol-exposed individuals: introducing the 4-digit diagnostic code. Alcohol and alcoholism, 35(4), 400-410.Benz, J., Rasmussen, C., & Andrew, G. (2009). Diagnosing fetal alcohol spectrum disorder: History, challenges and future directions. Paediatrics & child health, 14(4), 231.Bull, R., Espy, K. A., & Wiebe, S. A. (2008). Short-term memory, working memory, and executive functioning in preschoolers: Longitudinal predictors of mathematical achievement at age 7 years. Developmental neuropsychology, 33(3), 205-228.Douglas, T. S., & Mutsvangwa, T. E. (2010). A review of facial image analysis for delineation of the facial phenotype associated with fetal alcohol syndrome. American Journal of Medical Genetics Part A, 152(2), 528-536.Goldschmidt, L., Richardson, G. A., Cornelius, M. D., & Day, N. L. (2004). Prenatal marijuana and alcohol exposure and academic achievement at age 10. Neurotoxicology and teratology, 26(4), 521-532.Howell, K. K., Lynch, M. E., Platzman, K. A., Smith, G. H., & Coles, C. D. (2006). Prenatal alcohol exposure and ability, academic achievement, and school functioning in adolescence: a longitudinal follow-up. Journal of Pediatric Psychology, 31(1), 116-126.Kodituwakku, P. W. (2009). Neurocognitive Profile In Children With Fetal Alcohol Spectrum Disorders. Developmental Disabilities Research Reviews,15(3), 218–224. O’Leary, C. M., Taylor, C., Zubrick, S. R., Kurinczuk, J. J., & Bower, C. (2013). Prenatal alcohol exposure and educational achievement in children aged 8–9 years. Pediatrics, peds-2012.Rasmussen, C., & Bisanz, J. (2010). The relation between mathematics and working memory in young children with fetal alcohol spectrum disorders. The Journal of Special Education.Riley, E. P., & McGee, C. L. (2005). Fetal alcohol spectrum disorders: an overview with emphasis on changes in brain and behavior. Experimental biology and medicine, 230(6), 357-365.St Clair-Thompson, H. L., & Gathercole, S. E. (2006). Executive functions and achievements in school: Shifting, updating, inhibition, and working memory. The quarterly journal of experimental psychology, 59(4), 745-759.

Thank you!• Dr. Rachel Tangen• Dr. Mitchell Drum• Connie May• SURP

Questions?