FINAL DECISION Powerlink transmission determination 2017 ... - Powerlink 2017-22 - Final... ·...
48
0 Overview | Powerlink transmission final determination 2017–22 FINAL DECISION Powerlink transmission determination 2017–18 to 2021–22 Overview April 2017
Transcript of FINAL DECISION Powerlink transmission determination 2017 ... - Powerlink 2017-22 - Final... ·...

0 Overview | Powerlink transmission final determination 2017–22
FINAL DECISION
Powerlink transmission
determination
2017–18 to 2021–22
Overview
April 2017

1 Overview | Powerlink transmission final determination 2017–22
© Commonwealth of Australia 2017
This work is copyright. In addition to any use permitted under the Copyright Act 1968,
all material contained within this work is provided under a Creative Commons
Attributions 3.0 Australia licence, with the exception of:
the Commonwealth Coat of Arms
the ACCC and AER logos
any illustration, diagram, photograph or graphic over which the Australian
Competition and Consumer Commission does not hold copyright, but which may be
part of or contained within this publication. The details of the relevant licence
conditions are available on the Creative Commons website, as is the full legal code
for the CC BY 3.0 AU licence.
Requests and inquiries concerning reproduction and rights should be addressed to the:
Director, Corporate Communications
Australian Competition and Consumer Commission
GPO Box 4141, Canberra ACT 2601
Inquiries about this publication should be addressed to:
Australian Energy Regulator
GPO Box 520
Melbourne Vic 3001
Tel: 1300 585 165
Email: [email protected]

2 Overview | Powerlink transmission final determination 2017–22
Note
This overview forms part of the AER's final decision on Powerlink's transmission
determination for 2017–22. It should be read with all other parts of the final decision.
This final decision consists of an Overview and 11 attachments. As many issues were
settled at the draft decision stage or required only minor updates we have not prepared
final decision attachments for:
Regulatory depreciation
Operating expenditure; and
Corporate income tax.
The AER's final decision on these matters is set out in this Overview. For ease of
reference the remaining attachments have been numbered consistently with the
attachment numbering in our draft decision.
The final decision includes the following documents:
Overview
Attachment 1 – Maximum allowed revenue
Attachment 2 – Regulatory asset base
Attachment 3 – Rate of return
Attachment 4 – Value of imputation credits
Attachment 6 – Capital expenditure
Attachment 9 – Efficiency benefit sharing scheme
Attachment 10 – Capital expenditure sharing scheme
Attachment 11 – Service target performance incentive scheme
Attachment 12 – Pricing methodology
Attachment 13 – Pass through events
Attachment 14 – Negotiated services

3 Overview | Powerlink transmission final determination 2017–22
Contents
Note .................................................................................................................. 2
Contents .......................................................................................................... 3
Shortened forms ............................................................................................. 5
1 Introduction ............................................................................................... 7
1.1 Structure of this Overview ................................................................ 7
2 Summary of final decision ....................................................................... 9
2.1 What is driving allowed revenue? .................................................. 10
2.2 Key differences between our draft and final decisions ................ 12
2.3 Expected impact of decision on electricity bills ........................... 13
3 Key elements of our final decision ....................................................... 15
3.1 Regulatory asset base ..................................................................... 17
3.2 Rate of return (return on capital) .................................................... 20
3.3 Value of imputation credits (gamma) ............................................. 21
3.4 Regulatory depreciation (return of capital) ................................... 23
3.5 Capital expenditure .......................................................................... 25
3.6 Operating expenditure ..................................................................... 26
3.7 Corporate income tax ...................................................................... 28
4 Incentive schemes .................................................................................. 31
4.1 Efficiency benefit sharing scheme ................................................. 31
4.2 Capital expenditure sharing scheme ............................................. 32
4.3 Service target performance incentive scheme .............................. 33
5 The regulatory framework ...................................................................... 34
5.1 Achieving the NEO to the greatest degree .................................... 37
5.2 Interrelationships between constituent components ................... 38

4 Overview | Powerlink transmission final determination 2017–22
6 Consultation ............................................................................................ 40
6.1 Consumer engagement ................................................................... 41
6.1.1 Powerlink's consumer engagement activities ............................... 42
6.1.2 Consumer submissions ................................................................ 42
6.1.3 Our view of Powerlink's consumer engagement ........................... 43
A Constituent components ....................................................................... 44
B List of submissions ................................................................................ 47

5 Overview | Powerlink transmission final determination 2017–22
Shortened forms Shortened form Extended form
AARR aggregate annual revenue requirement
AEMC Australian Energy Market Commission
AEMO Australian Energy Market Operator
AER Australian Energy Regulator
ASRR annual service revenue requirement
augex augmentation expenditure
capex capital expenditure
CCP Consumer Challenge Panel
CESS capital expenditure sharing scheme
CPI consumer price index
DMIA demand management innovation allowance
DRP debt risk premium
EBSS efficiency benefit sharing scheme
ERP equity risk premium
MAR maximum allowed revenue
MRP market risk premium
NEL national electricity law
NEM national electricity market
NEO national electricity objective
NER national electricity rules
NSP network service provider
NTSC negotiated transmission service criteria
opex operating expenditure
PPI partial performance indicators
PTRM post-tax revenue model
RAB regulatory asset base
RBA Reserve Bank of Australia
repex replacement expenditure
RFM roll forward model
RIN regulatory information notice

6 Overview | Powerlink transmission final determination 2017–22
Shortened form Extended form
RPP revenue and pricing principles
SLCAPM Sharpe-Lintner capital asset pricing model
STPIS service target performance incentive scheme
TNSP transmission network service provider
TUoS transmission use of system
WACC weighted average cost of capital

7 Overview | Powerlink transmission final determination 2017–22
1 Introduction
We, the Australian Energy Regulator (AER), are responsible for the economic
regulation of electricity transmission and distribution systems in all Australian states
and territories, with the exception of Western Australia. Powerlink owns and operates
Queensland's shared electricity transmission network. We regulate the revenues that
Powerlink can recover from its customers.
Powerlink submitted a revised revenue proposal for its electricity transmission network
on 1 December 2016. Powerlink's revised proposal sets out the revenue it proposes to
recover from electricity consumers through transmission charges for the period 2017–
22. The revised proposal was in response to our draft decision which was published on
29 September 2016. This overview, together with its attachments, constitutes our final
decision on Powerlink's revenue proposal.
The National Electricity Law (NEL) and National Electricity Rules (NER) provide the
regulatory framework governing electricity networks. In regulating Powerlink, we are
guided by the National Electricity Objective (NEO), as set out in the NEL. The NEO is:1
to promote efficient investment in, and efficient operation and use of, electricity
services for the long term interests of consumers of electricity with respect to—
(a) price, quality, safety, reliability and security of supply of electricity; and
(b) the reliability, safety and security of the national electricity system.
1.1 Structure of this Overview
This overview provides a summary of our final decision and its individual components.
The remainder is structured as follows:
Section 2 provides a high level summary of our final decision
Section 3 provides a breakdown of our final decision into its key components
Section 4 sets out our final decision on the incentive schemes that will apply to
Powerlink for the 2017–22 regulatory control period
Section 5 explains our views on the regulatory framework and the NEO
Section 6 outlines our consultation process in reaching this final decision and our
view of Powerlink's consumer engagement undertaken in developing its revenue
proposal
Appendix A contains the full list of constituent components that make up
Powerlink's proposal and our final decision on each of them
1 NEL, s. 7.

8 Overview | Powerlink transmission final determination 2017–22
Appendix B lists the stakeholder submissions received on our draft decision and
Powerlink's revised revenue proposal.
In our attachments to this decision we set out detailed analysis of the constituent
components that make up our final decision.

9 Overview | Powerlink transmission final determination 2017–22
2 Summary of final decision
Our final decision is that Powerlink can recover $3940.2 million ($ nominal, smoothed)
from consumers over the 2017–22 regulatory control period. This is a 5.3 per cent
increase from Powerlink's revised proposal revenue allowance of $3742.2 million
($ nominal).
The key item of difference between Powerlink's revised proposal and our final decision
is an increase in the allowed rate of return. This increase is reflective of a rise in
government bond rates since Powerlink submitted its revised proposal to ensure the
rate of return reflects prevailing market conditions.
Figure 2.1 compares our final decision on Powerlink's revenue for 2017–22 to its
proposed revenue and to the revenue allowed and recovered during the two previous
regulatory control periods (2007–12 and 2012–17).
Figure 2.1 Powerlink's past total revenue, proposed total revenue and
AER final decision total revenue allowance ($million, 2016–17)
Source: AER analysis.
0
200
400
600
800
1000
1200
Totalrevenue$m (real2016–17)
Actual Allowed Proposed (smoothed)
AER draft (smoothed) Revised proposed (smoothed) AER final (smoothed)

10 Overview | Powerlink transmission final determination 2017–22
2.1 What is driving allowed revenue?
Our final decision approves average annual revenues for the 2017–22 regulatory
control period that are $240.4 million ($2016–17)—or 24.7 per cent—lower than
approved in our decision for 2012–17 in real dollar terms.2 It provides 5.3 per cent
more revenue than Powerlink sought to recover through its revised revenue proposal.
Figure 2.2 compares the average annual building block revenue from our final decision
to that proposed by Powerlink for the 2017–22 regulatory control period, and to the
approved average amount for the 2012–17 regulatory control period.
Figure 2.2 AER's final decision on constituent components of total
revenue ($million, 2016–17)
Source: AER analysis.
Figure 2.3 compares our final decision for the 2017–22 regulatory control period with
Powerlink's allowed revenue for the 2012–17 regulatory control period, broken down
by the various building block components that make up the forecast revenue
allowance. These are annual amounts based on an average of unsmoothed revenues
over the two five-year regulatory control periods.
2 The comparison of the average annual revenues between the 2017–22 and 2012–17 regulatory control periods is
based on smoothed revenues. In nominal dollar terms, our final decision average annual revenues for the 2017–22
regulatory control period is about $147.8 million (or 15.8 per cent) lower than the average annual revenues
approved for the 2012–17 regulatory control period.
-50
150
350
550
750
950
1150
Allowed average2012–17
Proposed average2017–22
Revised proposed average2017–22
Draft decision average2017–22
Final decision average2017–22
$millionsreal 2016–17
Corporate tax
Revenue Adjustments
Regulatory depreciation
Opex
Return on capital
11 Overview | Powerlink transmission final determination 2017–22
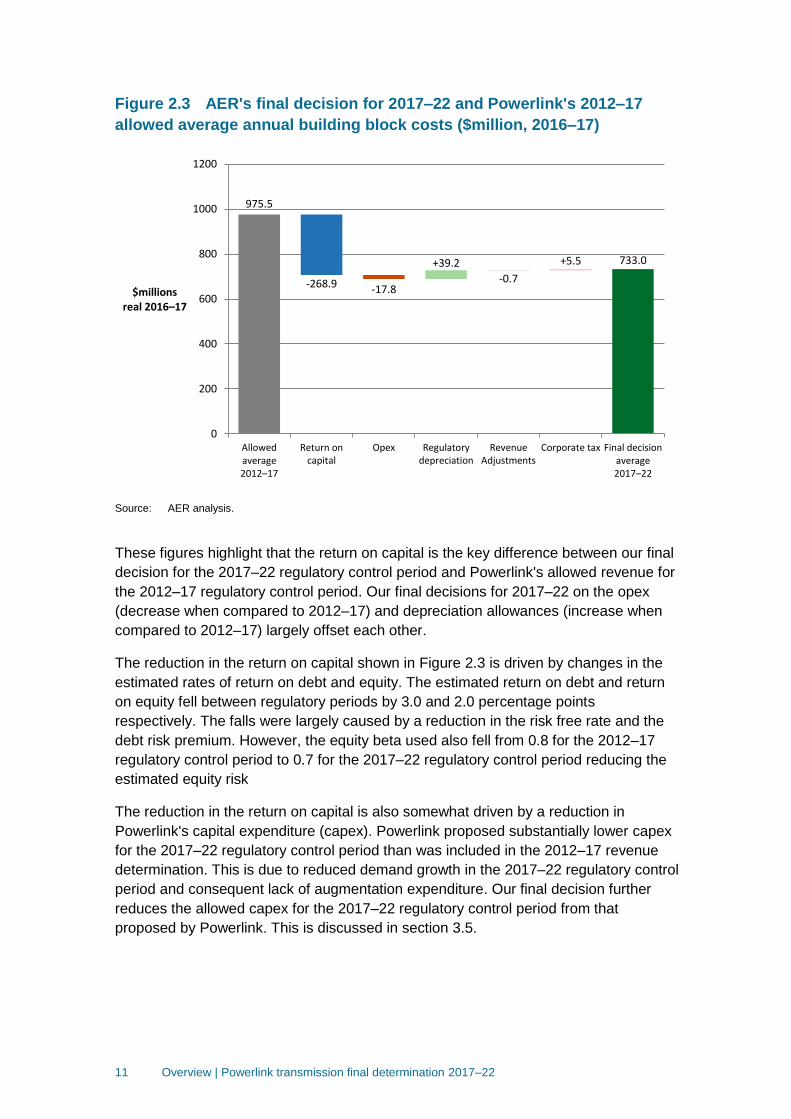
Figure 2.3 AER's final decision for 2017–22 and Powerlink's 2012–17
allowed average annual building block costs ($million, 2016–17)
Source: AER analysis.
These figures highlight that the return on capital is the key difference between our final
decision for the 2017–22 regulatory control period and Powerlink's allowed revenue for
the 2012–17 regulatory control period. Our final decisions for 2017–22 on the opex
(decrease when compared to 2012–17) and depreciation allowances (increase when
compared to 2012–17) largely offset each other.
The reduction in the return on capital shown in Figure 2.3 is driven by changes in the
estimated rates of return on debt and equity. The estimated return on debt and return
on equity fell between regulatory periods by 3.0 and 2.0 percentage points
respectively. The falls were largely caused by a reduction in the risk free rate and the
debt risk premium. However, the equity beta used also fell from 0.8 for the 2012–17
regulatory control period to 0.7 for the 2017–22 regulatory control period reducing the
estimated equity risk
The reduction in the return on capital is also somewhat driven by a reduction in
Powerlink's capital expenditure (capex). Powerlink proposed substantially lower capex
for the 2017–22 regulatory control period than was included in the 2012–17 revenue
determination. This is due to reduced demand growth in the 2017–22 regulatory control
period and consequent lack of augmentation expenditure. Our final decision further
reduces the allowed capex for the 2017–22 regulatory control period from that
proposed by Powerlink. This is discussed in section 3.5.
975.5
-268.9 -17.8
+39.2
-0.7
+5.5 733.0
0
200
400
600
800
1000
1200
Allowed average2012–17
Return oncapital
Opex Regulatorydepreciation
RevenueAdjustments
Corporate tax Final decision average2017–22
$millionsreal 2016–17

12 Overview | Powerlink transmission final determination 2017–22
2.2 Key differences between our draft and final decisions
Our final decision allows Powerlink to recover 5.9 per cent more revenue from its
customers than our September 2016 draft decision of $3720.8 million ($nominal).
Figure 2.4 shows the building block components from our final determination that make
up the annual building block revenue requirement for Powerlink, and the corresponding
components from its revised proposal and our draft decision.
Figure 2.4 Powerlink annual building block revenue requirement
($million, nominal)
Source: AER analysis
Figure 2.4 shows that the main factor driving the increase in revenue between our draft
and final decisions is the return on capital. Our final decision includes a return on
capital of $2168.0 million ($nominal) which is $174.5 million higher than our draft
decision.
In our draft decision we applied a rate of return of 5.48 per cent. While our approach to
calculating the rate of return has not changed, our final decision updates the rate of
return to reflect data from approved averaging periods for the return on equity and
debt. The rate of return of 6.0 per cent approved in this final decision is higher than our
draft decision of 5.48 per cent. This is discussed further in section 3.2.
Forecast capex is also a driver of the increase in the return on capital between our
draft and final decisions. Our final decision includes a forecast capex allowance of
-100
0
100
200
300
400
500
600
700
800
900
AER
dra
ft d
ecis
ion
Re
vise
d P
rop
osa
l
AER
fin
al d
ecis
ion
AER
dra
ft d
ecis
ion
Re
vise
d P
rop
osa
l
AER
fin
al d
ecis
ion
AER
dra
ft d
ecis
ion
Re
vise
d P
rop
osa
l
AER
fin
al d
ecis
ion
AER
dra
ft d
ecis
ion
Re
vise
d P
rop
osa
l
AER
fin
al d
ecis
ion
AER
dra
ft d
ecis
ion
Re
vise
d P
rop
osa
l
AER
fin
al d
ecis
ion
2017–18 2018–19 2019–20 2020–21 2021–22
Revenues($m,
nominal)
Return on capital Opex Depreciation Adjustments Tax

13 Overview | Powerlink transmission final determination 2017–22
$835.5 million ($2016–17) which is $60.3 million higher than our draft decision capex
allowance of $775.2 million ($2016–17).
In our draft decision, we identified concerns that some aspects of Powerlink's
forecasting methodology and key assumptions resulted in a forecast of total capex for
the 2017–22 regulatory control period that did not reasonably reflect the capex criteria.
Our alternative estimate of capex included a reduced allowance for non-load driven
capex. In its revised proposal Powerlink made further adjustments to its assumptions,
which lowered its capex forecast by $70.1 million. Powerlink also reduced its forecast
for other non-load driven capex by $4.5 million because it amended the scope of one
of its proposed projects.
While Powerlink's revised proposal addressed some of the concerns raised in our draft
decision, we are still not satisfied that the inputs and assumptions which underpin
Powerlink's use of the repex model are likely to result in a total capex forecast which
reasonably reflects the efficient costs that a prudent operator would require to achieve
the capex objectives. We have therefore made further adjustments to the inputs to the
repex model, resulting in a forecast for repex that is $53.4 million lower than
Powerlink's forecast. Our assessment of Powerlink's repex is discussed further in
section 3.5 and attachment 6.
2.3 Expected impact of decision on electricity bills
The annual electricity bill for customers in Queensland will reflect the combined cost of
all the electricity supply chain components. These components are:
the cost of purchasing electricity (the wholesale energy generation cost);
the cost of the poles/towers and wires used to transport the electricity (the
transmission and distribution networks), and other infrastructure such as metering
cost;
the cost of environmental policies, including subsidies for renewable energy, such
as solar feed-in-tariffs; and
the retailer’s costs and profit margin.
Therefore, the electricity bill changes to reflect movements in one or more of the
components in the bill. Our final decision on Powerlink affects the high voltage part of
the poles/towers and wires (transmission network charges) component of the electricity
bill for Queensland, which represent approximately 9.3 per cent of an average
customer's annual electricity bill.3 This small percentage largely explains the relatively
modest impact this final decision is likely to have on average annual electricity bills.
We estimate the expected bill impact by varying the transmission charges in
accordance with our final decision, while holding other components of the bill
3 Estimated transmission proportion of the total bill from Powerlink, Revenue proposal, Consolidated Reset RIN,
January 2016.

14 Overview | Powerlink transmission final determination 2017–22
constant. Based on this approach, we expect that our final decision will result in the
transmission component of the average annual electricity bills for residential customers
in Queensland decreasing over the 2017–22 regulatory control period. The
transmission component of the average annual residential electricity bill in 2021–22 is
expected to reduce by about $31.60 ($ nominal) below the current, 2016–17 level. We
note that this bill impact estimate is indicative only, and individual customers’ actual
bills will also depend on their usage patterns and the structure of their chosen retail
tariff offering.
While our approach isolates the effect of our decision on electricity prices, it does not
imply that other components will remain unchanged across the regulatory control
period.4 We note that in its recent electricity price trends report for Queensland, the
AEMC has indicated that wholesale costs are expected to rise on average, largely
driven by the closure of Hazelwood power station and variations in inter-regional
electricity flows.5 However, we expect the decreasing transmission network charges
flowing from this final decision will offset some of the increases from other components
of the overall bill. Further detail on our final decision impact on overall bills is set out in
attachment 1.
4 It also assumes that actual energy demand will equal the forecast in our final decision. Since Powerlink operates
under a revenue cap, changes in demand will also affect annual electricity bills across the 2017–22 regulatory
control period. 5 AEMC, Final report: 2016 Residential Electricity Price Trends, 14 December 2016, p. 96 and Queensland fact pack
and media release, p. 4.

15 Overview | Powerlink transmission final determination 2017–22
3 Key elements of our final decision
We use the building block approach to determine Powerlink's maximum allowed
revenue (MAR). The building block approach consists of five costs that a business is
allowed to recover through its revenue allowance.
The building block costs are illustrated in Figure 3.1 and include:
a return on the regulatory asset base (RAB) (or return on capital)
depreciation of the RAB (or return of capital)
forecast opex
revenue increments or decrements resulting from incentive schemes such as the
efficiency benefit sharing scheme (EBSS)
the estimated cost of corporate income tax.
Figure 3.1 The building block approach for determining total revenue
The building block costs are comprised of key elements that we determine through our
assessment process. For example, the size of the RAB—and therefore the revenue
generated from the return on capital and regulatory depreciation building blocks—is
directly affected by our assessment of forecast capex.
Return on capital
(RAB × rate of return on capital)
Regulatory depreciation
(depreciation net of indexation
applied to RAB)
Corporate income tax
(net of value of imputation
credits)
Capital costs
Operating expenditure
(opex)
Revenue adjustments
(increment or decrement)
Total revenue

16 Overview | Powerlink transmission final determination 2017–22
This section summarises our final decision on key elements of the building blocks
including:
RAB (section 3.1)
Rate of return (section 3.2)
Imputation credits (section 3.3)
Depreciation allowance (section 3.4)
Efficient level of capex (section 3.5)
Efficient level of opex (section 3.6)
Forecast level of corporate income tax (section 3.7).
Incentive schemes including the EBSS and CESS are covered in section 4. Table 3.1
shows our final decision on Powerlink's revenues including the building block
components.
Table 3.1 AER's final decision on Powerlink's revenues ($million,
nominal)
2017–18 2018–19 2019–20 2020–21 2021–22 Total
Return on capital 425.5 430.4 434.2 437.3 440.5 2168.0
Regulatory depreciationa 88.9 113.3 131.0 143.1 150.2 626.6
Operating expenditureb 201.7 205.8 209.8 214.2 219.3 1050.7
Revenue adjustmentsc –0.8 –7.1 –3.2 3.0 0.0 –8.1
Net tax allowance 17.1 19.4 22.7 24.3 24.5 108.0
Annual building block revenue
requirement (unsmoothed) 732.4 761.8 794.6 821.9 834.5 3945.2
Annual expected MAR (smoothed) 752.7 770.0 787.6 805.7 824.2 3940.2d
X factore n/a
f 0.15% 0.15% 0.15% 0.15% n/a
Source: AER analysis.
(a) Regulatory depreciation is straight-line depreciation net of the inflation indexation on the opening RAB.
(b) Operating expenditure includes debt raising costs.
(c) Includes efficiency benefit sharing scheme amounts.
(d) The estimated total revenue cap is equal to the total annual expected MAR.
(e) The X factors will be revised to reflect the annual return on debt update. Under the CPI–X framework, the X
factor measures the real rate of change in annual expected revenue from one year to the next. A negative X
factor represents a real increase in revenue. Conversely, a positive X factor represents a real decrease in
revenue.
(f) Powerlink is not required to apply an X factor for 2017–18 because we set the 2017–18 MAR in this
decision. The MAR for 2017–18 is around 27.9 per cent lower than the approved MAR for 2016–17 in real
terms, or 26.1 per cent lower in nominal terms.

17 Overview | Powerlink transmission final determination 2017–22
3.1 Regulatory asset base
We make a decision on Powerlink's opening regulatory asset base (RAB) at 1 July
2017 as part of our revenue determination. We also make a decision on Powerlink's
projected RAB for the 2017–22 regulatory control period.6
The RAB roll forward accounts for the value of Powerlink's regulated assets over the
regulatory control period. The size of the RAB substantially impacts Powerlink's
revenue and the price consumers ultimately pay. It is an input into the determination of
the return on capital and depreciation (return of capital) building blocks.7 Other things
being equal, a higher RAB increases both the return on capital and depreciation
allowances. In turn, these increase Powerlink's revenue, and prices for its services.
We determined an opening RAB value of $7069.4 million ($ nominal) as at 1 July 2017
for Powerlink. The amount is $12.7 million lower than Powerlink's revised proposal.8
This is because we have amended Powerlink’s revised proposed roll forward model
(RFM) to correct for an input error for the movements in capitalised provisions and
have replaced the revised proposal estimate for 2016–17 inflation with actual inflation.
To determine the opening RAB as at 1 July 2017, we have rolled forward the RAB over
the 2012–17 regulatory control period to determine a closing RAB value at
30 June 2017. This roll forward includes an adjustment at the end of the 2012–17
regulatory control period to account for the difference between actual 2011–12 capex
and the estimate approved at the 2012–17 determination.9
Table 3.2 summarises our final decision on the roll forward of Powerlink's RAB over
the 2012–17 regulatory control period.
6 NER, cl. 6A.6.1.
7 The size of the RAB also impacts the benchmark debt raising cost allowance. However, this amount is usually
relatively small and therefore not a significant determinant of revenues overall. 8 This RAB value is based on as-incurred capex.
9 The end of period adjustment will be positive (negative) if actual capex is higher (lower) than the estimate
approved at the 2012–17 determination.

18 Overview | Powerlink transmission final determination 2017–22
Table 3.2 AER's final decision on Powerlink's RAB for the 2012–17
regulatory control period
2012–13 2013–14 2014–15 2015–16 2016–17a
Opening RAB 6428.8 6847.9 7149.0 7152.5 7110.3
Capital expenditureb 464.3 329.1 163.8 134.7 178.0
Inflation indexation on opening RAB
160.9 200.6 95.1 93.7 151.1
Less: straight-line depreciationc 206.0 228.7 255.3 270.7 273.8
Closing RAB 6847.9 7149.0 7152.5 7110.3 7165.7
Difference between estimated and actual
capex (1 July 2011 to 30 June 2012) –65.5
Return on difference for 2011–12 capex –30.8
Opening RAB as at 1 July 2017 7069.4
Source: AER analysis.
(a) Based on estimated capex. We will adjust the RAB for actual capex at the next reset.
(b) As-incurred, net of disposals, and adjusted for actual CPI.
(c) Adjusted for actual CPI. Based on actual as-commissioned capex.
We determine a forecast closing RAB value at 30 June 2022 of $7355.7 million
($ nominal). This is $50.6 million (or 0.7 per cent) lower than the $7406.4 million
($ nominal) in Powerlink's revised proposal. Our final decision on the forecast closing
RAB reflects our changes to the opening RAB as at 1 July 2017, and our final
decisions on the expected inflation rate (attachment 3), forecast capex (attachment 6)
and forecast depreciation (section 3.4 of this Overview).
Table 3.3 sets out our final decision on the forecast RAB values for Powerlink over the
2017–22 regulatory control period.
Table 3.3 AER's final decision on Powerlink's RAB for the 2017–22
regulatory control period ($million, nominal)
2017–18 2018–19 2019–20 2020–21 2021–22
Opening RAB 7069.4 7151.5 7214.0 7266.4 7318.6
Capital expenditurea 171.0 175.8 183.4 195.4 187.3
Inflation indexation on opening RAB 173.2 175.2 176.7 178.0 179.3
Less: straight-line depreciationb 262.1 288.5 307.8 321.1 329.5
Closing RAB 7151.5 7214.0 7266.4 7318.6 7355.7
Source: AER analysis.
(a) As incurred and net of forecast disposals. In accordance with the timing assumptions of the post-tax revenue
model (PTRM), the capex includes a half-WACC allowance to compensate for the six month period before
capex is added to the RAB for revenue modelling.
(b) Based on as-commissioned capex.

19 Overview | Powerlink transmission final determination 2017–22
For this final decision, we determine that the forecast depreciation approach is to be
used to establish the opening RAB at the commencement of the 2022–27 regulatory
control period for Powerlink.10 We consider this approach, in combination with the
application of the capital expenditure sharing scheme (CESS) and our other ex post
capex measures, is sufficient to achieve the capex incentive objective.11
Figure 3.2 compares our final decision on Powerlink's forecast RAB to Powerlink's
revised proposal and actual RAB in real dollar terms ($2016–17). The RAB is expected
to decline over the 2017–22 regulatory control period.
Figure 3.2 Powerlink's actual RAB, revised proposal forecast RAB and
AER final decision forecast RAB ($ million, 2016–17)
Source: AER analysis.
When making our final decision on Powerlink's RAB we had regard to the submissions
from Consumer Challenge Panel (CCP) members Hugh Grant and David Headberry
on a number of RAB-related issues.12 These submissions stated that Powerlink's
10
NER, cl. S6A.2.2B(a). 11
Our ex post capex measures are set out in the capex incentives guideline, AER, Capital expenditure incentive
guideline for electricity network service providers, November 2013, pp. 13–19, 20–21. The guideline also sets out
how all our capex incentive measures are consistent with the capex incentive objective. 12
Consumer Challenge Panel (Hugh Grant), Submission to the AER, Powerlink Queensland 2018-22 revenue
proposal, 23 December 2016, pp. 3–5,.
0
1000
2000
3000
4000
5000
6000
7000
8000
ClosingRAB
($m, 2016-17)
Actual Estimated AER final decision (forecast) Revised proposal (forecast)

20 Overview | Powerlink transmission final determination 2017–22
overall 'extraordinary profitability levels' were a result of the AER's approach to RAB
assessment; and interactions between the return on capital and return of capital
allowances (sections 3.2 and 3.4 below).
We have carefully reviewed the material, but do not consider that the analysis in the
submissions demonstrates our approach to determine the return on capital and return
of capital building blocks is incorrect. We consider that our approach to RAB indexation
is consistent with our approach to the rate of return on capital. Jointly, these
approaches produce appropriate revenue allowances over the life of the assets in the
RAB.
However, we recognise there is an overarching concern that consumers have
expressed about the profitability of some service providers. Analysis of profitability
outcomes for ordinary unregulated companies is complex and undertaking the
equivalent analysis for regulated networks faces further complexity. Importantly, the
building block framework does not clearly accommodate amendments to individual
building blocks based on analysis of overall profitability. Nonetheless, we recognise
that this matter warrants further exploration and consider that analysis of financial
performance might be used to evaluate overall performance of the building block
framework as set out in the rules, rather than to inform parameter estimates within a
specific revenue determination.
To advance our understanding of these issues we have commenced further work on
this topic. In particular, we have engaged an external consultant to undertake an initial
scoping study into measures of financial performance that could be applied to
businesses we regulate. We will conduct public consultation on this issue after further
progression of our engagement with the external consultant.
Further detail on our final decision in regards to Powerlink's RAB (and our response to
CCP members' submissions on capital issues) is set out in attachment 2.
3.2 Rate of return (return on capital)
The return on capital is the key difference between our final decision for the 2017–22
regulatory control period and Powerlink's allowed revenue for the 2012–17 regulatory
control period. Both the estimated return on equity and estimated return on debt fell
across the periods.
The estimated return on equity fell from 9.4 per cent in the 2012–17 regulatory control
period to 7.4 per cent in the 2017–22 regulatory control period. The estimated return
on debt fell from 8.1 per cent in the 2012–17 regulatory control period to 5.1 per cent in
the 2017–22 regulatory control period.
Consumer Challenge Panel (David Headberry), Response to the AER Draft Decision and Revised Proposal to
Powerlink's electricity transmission network for a revenue reset for the 2017-2019 regulatory period, 19 December
2016, p. 7.

21 Overview | Powerlink transmission final determination 2017–22
Table 3.4 Final decision on Powerlink's rate of return (% nominal)
Previous allowed
return (2012–17)
AER draft decision
(2017–18)
AER final
decision
(2017–18)
Allowed return over
2017–22 regulatory
control period
Return on equity
(nominal post–tax) 9.37 6.50 7.4 Constant (7.4%)
Return on debt
(nominal pre–tax) 8.1 4.79 5.1 Updated annually
Gearing 60 60 60 Constant (60%)
Nominal vanilla WACC 8.61 5.48 6.0 Updated annually for
return on debt
Forecast inflation 2.60 2.45 2.45 Constant (%)
The falls were primarily caused by a reduction in the risk free rate and debt risk
premium, which flowed through to the estimated return on debt and return on equity.
However, the equity beta used for return on equity estimation also fell from a value of
0.8 for the 2012–17 regulatory control period to 0.7 for the 2017–22 regulatory control
period reducing the estimated equity risk premium.
Differences between the draft and final decisions for the 2017–22 regulatory control
period were much smaller. The rate of return of 6.0 per cent approved in this final
decision is higher than our draft decision of 5.5 per cent. Our approach to calculating
the rate of return did not change, but our final decision updates the rate of return to
reflect data from approved averaging periods used for estimating the return on equity
and return on debt.
Further detail on our final decision in regards to Powerlink's allowed rate of return is set
out in attachment 3.
3.3 Value of imputation credits (gamma)
We accept Powerlink's proposed value of imputation credits (or gamma) of 0.4. We
consider that a value for imputation credits of 0.4 will result in equity investors in the
benchmark efficient entity receiving an ex ante total return (inclusive of the value of
imputation credits) commensurate with the efficient equity financing costs of a
benchmark efficient entity.
We note Powerlink's submission that proposes the AER should apply any changes to
its approach to estimate the value of imputation credits resulting from a decision of the
Federal Court in relation to the AER's appeal of the Ausgrid Tribunal's decision to
Powerlink's 2018-22 regulatory period.13 Since the decisions for Ausgrid and others
released in April 2015 we have not departed from our 0.4 estimate for gamma and we
consider a gamma value of 0.4 is appropriate for the reasons stated in this final
13
Powerlink, Revised Revenue Proposal, 1 December 2016, pp. 10-11.

22 Overview | Powerlink transmission final determination 2017–22
decision. Nevertheless, when making future determinations we will take into account
any merits or judicial review proceedings on the value of gamma that are available to
us.
In coming to a value of imputation credits of 0.4:
We adopt a conceptual approach consistent with the Officer framework,14 which we
consider best promotes the objectives and requirements of the NER/NGR. This
approach considers the value of imputation credits is a post-tax value before the
impact of personal taxes and transaction costs.15 As such, we view the value of
imputation credits as the proportion of company tax returned to investors through
the utilisation of imputation credits.16
We consider our conceptual approach allows for the value of imputation credits to
be estimated on a consistent basis with the allowed rate of return and allowed
revenues under the post-tax framework in the NER/NGR.17
We use the widely accepted approach of estimating the value of imputation credits
as the product of two sub-parameters: the 'distribution rate' and the 'utilisation
rate'.18 Our definition of, and estimation approach for, these sub-parameters is set
out in Table 3.5.
Table 3.5 Gamma sub-parameters: definition and estimation approach
Sub-parameter Definition Estimation approach
Distribution rate (or payout ratio)
The proportion of imputation credits
generated that is distributed to
investors.
Primary reliance placed on the widely
accepted cumulative payout ratio
approach. Some regard is also given
to Lally's estimate for listed equity
from financial reports of the 20
largest listed firms.
Utilisation rate (or theta)
The utilisation value to investors in
the market per dollar of imputation
credits distributed.
A range of approaches, with due
regard to the merit of each approach:
equity ownership approach
tax statistics
implied market value studies.
Source: AER analysis.
14
The Officer framework is discussed in detail in section Error! Reference source not found.. 15
Post-tax refers to after company tax and before personal tax. 16
This means one dollar of claimed imputation credits has a post (company) tax value of one dollar to investors
before personal taxes and personal transaction costs. 17
In finance, the consistency principle requires that the definition of the cash flows in the numerator of a net present
value (NPV) calculation must match the definition of the discount rate (or rate of return / cost of capital) in the
denominator of the calculation (see Peirson, Brown, Easton, Howard, Pinder, Business Finance, McGraw-Hill, Ed.
10, 2009, p. 427). By maintaining this consistency principle, we provide a benchmark efficient entity with an ex
ante total return (inclusive of the value of imputation credits) commensurate with the efficient financing costs of a
benchmark efficient entity. 18
These sub-parameters are discussed further in section Error! Reference source not found..

23 Overview | Powerlink transmission final determination 2017–22
Overall, the evidence suggests a range of estimates for the value of imputation credits
might be reasonable. With regard to the merits of the evidence before us, we choose a
value of imputation credits of 0.4 from within a range of 0.3 to 0.5.
In considering the evidence on the distribution and utilisation rates, we have broadly
maintained the approach set out in the Rate of Return Guideline (the Guideline), but
have re-examined the relevant evidence and estimates. This re-examination, and new
evidence and advice considered since the Guideline, led us to depart from the 0.5
value of imputation credits we proposed in the Guideline.
Further detail on our final decision in regards to the value of Powerlink's imputation
credits is set out in attachment 4.
3.4 Regulatory depreciation (return of capital)
Depreciation is the allowance provided so capital investors recover their investment
over the economic life of the asset (return of capital). In deciding whether to approve
the depreciation schedules submitted by Powerlink, we make determinations on the
indexation of the RAB and depreciation building blocks for Powerlink's 2017–22
regulatory control period.19 The regulatory depreciation allowance is the net total of the
straight-line depreciation less the inflation indexation adjustment of the RAB.
Our final decision is to determine a regulatory depreciation allowance of $626.6 million
($ nominal) for Powerlink over the 2017–22 regulatory control period. This amount
represents a reduction of $17.1 million (or 2.7 per cent) from the $643.7 million
($ nominal) in Powerlink's revised proposal.20 It represents an increase of $20.8 million
or 3.4 per cent from the $605.8 million ($ nominal) in our draft decision. In coming to
our final decision:
We confirm our acceptance of Powerlink' proposed asset classes and its straight-
line depreciation method used to calculate the regulatory depreciation allowance.
This includes our acceptance of Powerlink's proposed weighted average method to
calculate the remaining asset lives as at 1 July 2017 for existing assets because
this is the standard method set out in the AER's roll forward model (RFM). In
accepting the weighted average method and as noted in the draft decision, we
have updated the remaining asset lives at 1 July 20017 as set out in Table 3.6.
This reflects the revisions to the 2015–16 and 2016–17 capex values in the RFM,
which are inputs for calculating the weighted average remaining asset lives.
We confirm our acceptance of Powerlink's proposed standard asset lives used to
calculate the regulatory depreciation allowance. The proposed standard asset lives
are consistent with those approved at the 2012–17 transmission determination and
comparable to the standard asset lives used for other TNSPs.21 We are satisfied
19
NER, cl. 6.12.1(8). 20
Powerlink, Revised regulatory proposal, PTRM, December 2016. 21
AER Consumer Challenge Panel (CCP4) Hugh Grant, Submission to the AER AER Draft 2018-22 Revenue
Decision Powerlink Revised 2018-22 Revenue Proposal, 23 December 2016, p. 58, p. 74.

24 Overview | Powerlink transmission final determination 2017–22
the approved standard asset lives (Table 3.6) would lead to a depreciation
schedule that reflects the nature of the assets over the economic lives of the asset
classes, and that the sum of the real value of the depreciation attributable to the
assets is equivalent to the value at which the assets was first included in the RAB
for Powerlink.22
We made determinations on other components of Powerlink's revised proposal that
also affect the forecast regulatory depreciation allowance—the opening RAB as at
1 July 2017 (attachment 2), expected inflation rate (attachment 3) and forecast
capital expenditure (attachment 6).
Table 3.6 shows our final decision on Powerlink's standard and remaining asset lives
as at 1 July 2017.
Table 3.6 AER's final decision on Powerlink's standard and remaining
tax asset lives as at 1 July 2017 (years)
Asset class Standard asset life Remaining asset life as at 1 July 2017
Transmission lines - overhead 50.0 30.1
Transmission lines - underground 45.0 19.8
Transmission lines - refit 30.0 27.8
Substations primary plant 40.0 26.8
Substations secondary systems 15.0 9.8
Communications other assets 15.0 10.9
Comms - civil works 40.0 17.0
Network switching centres 12.0 6.4
Land n/a n/a
Easements n/a n/a
Commercial buildings 40.0 29.8
Computer equipment 5.0 3.8
Office furniture & miscellaneous 7.0 5.4
Office machines 7.0 4.8
Vehicles 7.0 4.3
Moveable plant 7.0 4.6
Insurance spares n/a n/a
22
NER, cll. 6.5.5(b)(1)–(2).

25 Overview | Powerlink transmission final determination 2017–22
Source: AER analysis.
n/a: not applicable. We have not assigned a standard asset life to some asset classes because the assets
allocated to those asset classes are not subject to depreciation.
Table 3.7 shows our final decision on Powerlink's depreciation allowance for the
2017–22 regulatory control period.
Table 3.7 AER's final decision on Powerlink's depreciation allowance
for the 2017–22 period ($million, nominal)
2017–18 2018–19 2019–20 2020–21 2021–22 Total
Straight-line depreciation 262.1 288.5 307.8 321.1 329.5 1509.1
Less: inflation indexation on opening RAB 173.2 175.2 176.7 178.0 179.3 882.4
Regulatory depreciation 88.9 113.3 131.0 143.1 150.2 626.6
Source: AER analysis.
3.5 Capital expenditure
We are satisfied that a substantial part of Powerlink's proposed total forecast capex of
$888.9 million ($2016−17) for the 2017–22 regulatory control period reasonably
reflects the capex criteria. However, we have concerns with certain aspects of its
forecast non-load driven capex. We have therefore substituted a lower estimate of
$835.5 million.
Table 3.8 compares our decision to Powerlink's forecast.
Table 3.8 AER final decision on Powerlink's total forecast capex
($million, 2016–17)
2017–18 2018–19 2019–20 2020–21 2021–22 Total
Powerlink's revised proposal 172.1 174.1 178.6 186.9 177.1 888.9
AER final decision 164.3 164.9 168.0 174.8 163.5 835.5
Total adjustment -7.8 -9.2 -10.6 -12.1 -13.6 -53.4
Total adjustment (%) -4.6% -5.3% -5.9% -6.5% -7.7% -6.0%
Source: Powerlink, Revised regulatory proposal; 1 December 2016, p. 45; and AER analysis.
Note: Numbers may not add up due to rounding.
Powerlink's capex proposal consisted of $772.4 million for non-load driven capex,
$10.8 million for augmentation capex, and $105.8 million for non-network capex. Our
substitute estimate adopts Powerlink's forecast for augmentation and non-network
capex, but substitutes our own, lower estimate of $719 million for non-load driven
capex.

26 Overview | Powerlink transmission final determination 2017–22
Powerlink's non-load driven capex forecast consisted of asset replacement ($728
million), security and compliance ($18.8 million), and other non-load driven capex
($25.6 million). In its revised proposal Powerlink applied updated inputs to its asset
replacement forecasting methodology to reflect its current asset management strategy,
reducing its forecast replacement expenditure by $66.3 million from its initial proposal.
It also reduced its non-load driven capex by $4.5 million.
Powerlink forecast the bulk of its asset replacement capex using a top-down approach
that uses a modified version of the AER's repex model. This model uses asset age as
a proxy for the many factors that influence individual asset replacements. Powerlink
used its actual asset replacement volumes from 2010 to 2015 to calibrate the repex
model, but adjusted these inputs to ensure that any assets replaced for reasons other
than poor condition were removed from the modelling calibration.
As we stated in our draft decision, we consider that Powerlink's forecasting
methodology is generally reasonable. However, we still have concerns with how
Powerlink has implemented its approach in terms of the mean asset replacement lives
used to forecast asset replacement requirements for transmission towers. This has led
to our alternate estimate of Powerlink's non-load driven capex.
Powerlink also included seven contingent projects in its revised proposal. We do not
accept Powerlink's Southern Galilee Basin project because we do not consider that the
load growth the Powerlink forecast for this project will eventuate. We accept the
remaining six projects, including the newly proposed Queensland component of the
Queensland to South Australia Interconnection project, but require Powerlink to make
some amendments to the trigger events for these projects.
Further detail on our final decision on Powerlink’s total forecast capex is set out in
attachment 6.
3.6 Operating expenditure
Our final decision is to accept Powerlink's opex forecast of $976.7 million ($2016-17),
including debt raising costs. Powerlink's opex forecast is consistent with its initial
proposal, which we accepted in our draft decision, as set out in Table 3.9.
Table 3.9 Our final decision on total opex ($million, 2016–17)
2017–18 2018–19 2019–20 2020–21 2021–22 Total
Powerlink initial proposal 196.9 196.0 195.1 194.4 194.3 976.7
AER draft decision 196.9 196.0 195.1 194.4 194.3 976.7
Powerlink revised proposal 196.9 196.0 195.1 194.4 194.3 976.7
AER final decision 196.9 196.0 195.1 194.4 194.3 976.7
Source: Powerlink, Initial and revised regulatory proposal PTRMs, AER, Draft and final decision PTRMs. Includes
debt raising costs.

27 Overview | Powerlink transmission final determination 2017–22
To test Powerlink’s initial proposal, we developed an alternative estimate of
Powerlink's efficient opex. Our alternative estimate of forecast total opex is $994.7
million ($2016–17), including debt raising costs. This is $18.0 million (1.8 per cent)
higher than Powerlink's proposal.
Figure 3.3 compares Powerlink's forecast opex with its historical opex, historical
allowance and our alternative opex forecast.
Figure 3.3 Powerlink's actual and forecast opex ($ million, 2016–17)
Source: Powerlink, 2007-12 - PTRM - Final decision - incl. Sth Pine-Sandgate UG & fix - relates to contingent project
occurring in 2007-12; Powerlink, 2012-17 - PTRM - Final decision; AER, Final decision opex model.
Note: Includes debt raising costs and network support costs.
In response to our draft decision, CCP member Hugh Grant repeated concerns about
the efficiency of the base opex in Powerlink’s proposal. In particular, Mr Grant
considered we should use our transmission benchmarking results more
deterministically to assess Powerlink’s base opex.23 We responded to these concerns
in our draft decision (see sections 7.4.1 and 7.4.6).
In his submission Mr Grant stated ‘[r]ather than applying benchmarking, the AER’s
base year opex determination has trended forward Powerlink’s historical opex’.24
23
Consumer Challenge Panel (CCP4) (Hugh Grant), Submission to the AER – AER Draft 2018–22 Revenue
Decision; Powerlink Revised 2018–22 Revenue Proposal, 23 December 2016, pp. 89–96. 24
Consumer Challenge Panel (CCP4) (Hugh Grant), Submission to the AER – AER Draft 2018–22 Revenue
Decision; Powerlink Revised 2018–22 Revenue Proposal, 23 December 2016, p. 9.
0
50
100
150
200
250
2007-08 2009-10 2011-12 2013-14 2015-16 2017-18 2019-20 2021-22
Opex ($million, 2016-17)
Reported opex Estimated opex Approved forecast opex AER alternative estimate

28 Overview | Powerlink transmission final determination 2017–22
However, we note Powerlink included efficiency measures in its proposal that in effect
reduced its base opex by 12.2 per cent. We included those efficiency adjustments in
our alternative estimate as an efficiency adjustment to base opex. This is illustrated in
figure 3.3 as a step down in opex between 2016-17 and 2017-18.
Mr Grant also expressed concerns with our standard approach to forecasting labour
price growth. In particular, he expressed the view that we should use labour price
forecasts that are specific to the electricity network sector.25 However, in practice, only
utilities-wide data is available from the ABS. Importantly, electricity is the most material
component of the utilities index we use. Other non-energy components (water and
waste services) are small in comparison. We therefore consider the utilities index to be
a robust and reliable data source. To attempt to develop an alternative approach would
be an intensive exercise, and even if this was possible, the outcome would not likely be
a source of material difference between our forecast and Powerlink’s proposal. We
have therefore maintained our approach.
Our opex model provides the calculations for our alternative estimate of efficient opex
for Powerlink, and is available on our website. We set out our assessment approach
and the full reasons for our decision in attachment 7 of our draft decision, which is also
available on our website.26
3.7 Corporate income tax
We make a decision on the estimated cost of corporate income tax for Powerlink's
2017–22 regulatory control period as part of our revenue determination.27 This enables
Powerlink to recover the costs associated with the estimated corporate income tax
payable during the regulatory control period.
Our final decision on the estimated cost of corporate income tax is $108.0 million
($ nominal) for Powerlink over the 2017–19 regulatory control period. This amount
represents an increase of $24.4 million (or 29.2 per cent) from the $83.6 million
($ nominal) in Powerlink's revised proposal. Our final decision represents an increase
of $25.8 million (or 31.4 per cent) from the $82.2 million ($ nominal) estimated cost of
corporate income tax in our draft decision. Table 3.10 shows our final decision on the
estimated cost of corporate income tax allowance for Powerlink over the 2017–22
regulatory control period.
25
Consumer Challenge Panel (CCP4) (Hugh Grant), Submission to the AER – AER Draft 2018-22 Revenue Decision
Powerlink Revised 2018-22 Revenue Proposal, 23 December 2016, pp. 96-97. 26
www.aer.gov.au/networks-pipelines/determinations-access-arrangements/powerlink-determination-2017-
2022/draft-decision. 27
NER, cl. 6A.6.4.

29 Overview | Powerlink transmission final determination 2017–22
Table 3.10 AER's final decision on Powerlink's cost of corporate income
tax allowance for the 2017–22 regulatory control period ($million,
nominal)
2017–18 2018–19 2019–20 2020–21 2021–22 Total
Tax payable 28.5 32.3 37.9 40.5 40.8 180.0
Less: value of imputation credits 11.4 12.9 15.2 16.2 16.3 72.0
Net corporate income tax allowance 17.1 19.4 22.7 24.3 24.5 108.0
Source: AER analysis.
The increase from the revised proposal reflects our adjustments on the opening tax
asset base (TAB) discussed below, return on capital (attachments 2 and 3) and the
regulatory depreciation (section 3.4) building blocks which affect revenues, and in turn
impacts the tax calculation. The changes affecting revenues are discussed in
attachment 1.
For this final decision, we determine an opening TAB value for Powerlink of $4900.4
million as at 1 July 2017. This is $1.0 million higher than Powerlink's revised proposal
because we have amended Powerlink’s revised proposed roll forward model (RFM) to
correct for an input error for the movements in capitalised provisions. However, the
amount determined in the final decision is $123.9 million (or 2.5 per cent) lower than
our draft decision due to the updates made to the 2015–16 and 2016–17 capex inputs.
We also confirm our acceptance of:
Powerlink's proposed weighted average method to calculate the remaining tax
asset lives as at 1 July 2017. The proposed method applies the approach as set
out in the RFM. In accepting the weighted average method and as noted in the
draft decision, we have updated the remaining tax asset lives at 1 July 20017 as
set out in Table 3.11. This reflects the revisions to the 2015–16 and 2016–17
capex values in the RFM, which are inputs for calculating the weighted average
remaining tax asset lives.
Powerlink's proposed standard tax asset lives because they are:
o broadly consistent with the values prescribed by the Commissioner for
taxation in tax ruling 2016/128
o the same as those approved standard tax asset lives for the 2012–17
regulatory control period.
28
ATO, Taxation Ruling Income tax: effective life of depreciating assets (applicable from 1 July 2016), July 2016,
http://law.ato.gov.au/atolaw/view.htm?docid=%22TXR%2FTR20161%2FNAT%2FATO%2F00001%22.

30 Overview | Powerlink transmission final determination 2017–22
We are satisfied the approved standard tax asset lives (Table 3.11) provide an
appropriate estimate of the tax depreciation amount for a benchmark efficient
TNSP as required by the NER.29
Table 3.11 sets out our final decision on the standard remaining tax asset lives as at 1
July 2017 for Powerlink.
Table 3.11 AER's final decision on Powerlink's standard and remaining
tax asset lives as at 1 July 2017 (years)
Asset class Standard tax asset life Remaining tax asset life as at 1 July 2017
Transmission lines - overhead 47.5 28.6
Transmission lines - underground 45.0 17.5
Transmission lines - refit 30.0 27.8
Substations primary plant 40.0 26.4
Substations secondary systems 12.5 7.7
Communications other assets 12.5 9.1
Comms - civil works 40.0 19.8
Network switching centres 12.0 6.4
Land n/a n/a
Easements n/a n/a
Commercial buildings 40.0 32.2
Computer equipment 2.5 2.1
Office furniture & miscellaneous 15.0 5.7
Office machines 10.0 5.2
Vehicles 7.0 4.4
Moveable plant 5.0 3.7
Insurance spares n/a n/a
Source: AER analysis.
n/a: not applicable. We have not assigned a standard tax asset life to some asset classes because the assets
allocated to those asset classes are not subject to tax depreciation.
29
NER, cl. 6A.6.4.

31 Overview | Powerlink transmission final determination 2017–22
4 Incentive schemes
Incentive schemes are a component of incentive–based regulation and complement
our approach to assessing efficient costs. The incentive schemes that will apply to
Powerlink are:
the efficiency benefit sharing scheme (EBSS)
the capital expenditure sharing scheme (CESS)
the service target performance incentive scheme (STPIS).
Our incentive schemes encourage network businesses to make efficient decisions.
They give network businesses an incentive to pursue efficiency improvements in opex
and capex, and to share them with consumers. Incentives for opex and capex are
balanced with the incentives under our STPIS to maintain or improve service quality.
The incentive schemes encourage businesses to make efficient decisions on when and
what type of expenditure to incur, and meet service reliability targets.
4.1 Efficiency benefit sharing scheme
The efficiency benefit sharing scheme (EBSS) provides a continuous incentive for
service providers to pursue efficiency improvements in operating expenditure (opex).
To encourage a service provider to become more efficient, under an ex ante
framework, a service provider retains any efficiency gains it makes until the end of the
regulatory control period when its opex forecast is reset. The EBSS allows the service
provider to retain any efficiency gains it makes for a total of six years, regardless of the
year in which the gains are made.30 This provides a continuous incentive for service
providers to pursue efficiency gains over the regulatory control period. It also
discourages a service provider from incurring opex in the expected base year to
receive a higher opex allowance in the following regulatory control period.
During the 2012–17 regulatory control period, Powerlink operated under version one of
the Electricity transmission network service providers' EBSS released in September
2007.31
Our final decision is to approve the EBSS carryover amount of –$7.8 million
($2016–17) from the application of the EBSS in the 2012–17 regulatory control period.
This amount will be subtracted from Powerlink's allowed revenue. This is consistent
with our draft decision and Powerlink’s initial and revised proposal.
Our final decision for the carryover amounts from the application of the EBSS in the
2012–17 regulatory control period is outlined in Table 4.1.
30
The service provider keeps any efficiency gain in the year it makes them. The service provider then keeps those
gains for the length of the carryover period. The carryover length is usually five years so the service provider keeps
efficiency gains for a total of six years. 31
AER, Electricity transmission network service providers, Efficiency benefit sharing scheme, September 2007.

32 Overview | Powerlink transmission final determination 2017–22
Table 4.1 AER's final decision on Powerlink's EBSS carryover amounts
($million, 2016–17)
2017–18 2018–19 2019–20 2020–21 2021–22 Total
Powerlink's initial and revised proposal –0.8 –6.8 –3.0 2.8 – –7.8
AER draft and final decision –0.8 –6.8 –3.0 2.8 – –7.8
Source: Powerlink, Revenue proposal PTRM, January 2016. Powerlink, Revised revenue proposal PTRM,
December 2016.
Looking forward, our final decision is to apply version two of the EBSS to Powerlink in
the 2017–22 regulatory control period, consistent with our draft decision.32
Further detail on our final decision in regards to the application of the EBSS, including
proposed expenditure items to be excluded, is set out in attachment 9.
4.2 Capital expenditure sharing scheme
The CESS provides an incentive for service providers to pursue efficiency
improvements in capex. Similar to the EBSS, the CESS provides a network service
provider with the same reward for an efficiency saving and the same penalty for an
efficiency loss regardless of which year they make the saving or loss.
Under the CESS a service provider retains 30 per cent of the benefit or cost of an
under spend or overspend, while consumers retain 70 per cent of the benefit or cost of
an underspend or overspend. This means that for a one dollar saving in capex the
service provider keeps 30 cents of the benefit while consumers keep 70 cents of the
benefit. Conversely, in the case of an overspend, the service provider pays for 30
cents of the cost while consumers bear 70 cents of the cost.
Our final decision is to apply the CESS as set out in version 1 of the capital
expenditure incentives guideline to Powerlink in the 2017–22 regulatory control
period.33 This is consistent with the proposed approach we set out in our framework
and approach paper.34 We will apply the exclusion from the CESS of capex the service
provider incurs in delivering a priority project approved under the network capability
component of the Service Target Performance Incentive Scheme (STPIS) for
transmission network service providers.35
Further detail on our final decision in regards to the application of the CESS is set out
in attachment 10.
32
AER, Draft decision - Powerlink transmission determination - Attachment 9 - EBSS, September 2016, pp. 13–15. 33
AER, Capex incentive guideline, November 2013, pp. 5–9. 34
AER, Final Framework and approach for Powerlink, June 2015, p. 11. 35
AER, Capex incentive guideline, November 2013, p. 6.

33 Overview | Powerlink transmission final determination 2017–22
4.3 Service target performance incentive scheme
The STPIS is intended to balance a business's incentive to reduce expenditure with
the need to maintain or improve service quality. It achieves this by providing financial
incentives to businesses to maintain and improve service performance where
customers are willing to pay for these improvements.
Businesses can only retain their rewards for sustained and continuous improvements
to the reliability of supply for customers. Once improvements are made, the benchmark
performance targets will be tightened in future years.
Our final decision is to apply all components of version 5 of the STPIS to Powerlink for
the 2017–22 regulatory control period. Our final decision also accepts Powerlink's
proposed project to increase the design temperature of two 275kV transmission lines
under the STPIS network capability component. This project complies with version 5 of
the STPIS and the cost estimates are relative with industry prices.
The STPIS parameters applied in our final decision are set out in attachment 11.

34 Overview | Powerlink transmission final determination 2017–22
5 The regulatory framework
The NEO is the central feature of the regulatory framework. The NEO is to:
promote efficient investment in, and efficient operation and use of, electricity
services for the long term interests of consumers of electricity with respect to—
(a) price, quality, safety, reliability and security of supply of electricity; and
(b) the reliability, safety and security of the national electricity system.36
Energy Ministers have provided us with a substantial body of explanatory material that
guides our understanding of the NEO.37 The long term interests of consumers are not
delivered by any one of the NEO's factors in isolation, but rather by balancing them in
reaching a regulatory decision.38
In general, we consider that we will achieve this balance and, therefore, contribute to
the achievement of the NEO, where consumers are provided a reasonable level of safe
and reliable service that they value at least cost in the long run.39 We have also
considered the quality and reliability of services provided to consumers. For example,
opex allowances have been set so Powerlink may meet existing and new regulatory
requirements. Replacement expenditure (repex) allowances take into account the age
and condition of assets. Our capex allowance is based on a contemporary estimate of
the value of customer reliability. The STPIS encourages maintenance, and indeed
improvement of, service quality.
The nature of decisions under the NER is such that there may be a range of
economically efficient decisions, with different implications for the long term interests of
consumers.40 At the same time, however, there are a range of outcomes that are
unlikely to advance the NEO, or advance the NEO to the degree that others would.
For example, we do not consider that the NEO would be advanced if allowed revenues
encourage overinvestment and result in prices so high that consumers are unwilling or
unable to efficiently use the network.41 This could have significant longer term pricing
implications for those consumers who continue to use network services.
36
NEL, section 7. 37
Hansard, SA House of Assembly, 9 February 2005, pp. 1451–1460; Hansard, SA House of Assembly, 27
September 2007, pp. 963–972; Hansard, SA House of Assembly, 26 September 2013, pp. 7171–7176. 38
Hansard, SA House of Assembly, 26 September 2013, p. 7173. 39
Hansard, SA House of Assembly, 9 February 2005, p. 1452. 40
Re Michael: Ex parte Epic Energy [2002] WASCA 231 at [143].
Energy Ministers also accept this view – see Hansard, SA House of Assembly, 26 September 2013, p. 7172.
AEMC, Rule determination, National Electricity Amendment (Economic Regulation of Transmission Services) Rule
2006 No. 18, 16 November 2006, p. 50. 41
NEL, s. 7A(7).

35 Overview | Powerlink transmission final determination 2017–22
Equally, we do not consider the NEO would be advanced if allowed revenues result in
prices so low that investors are unwilling to invest as required to adequately maintain
the appropriate quality and level of service, and where customers are making more use
of the network than is sustainable. This could create longer term problems in the
network42 and could have adverse consequences for safety, security and reliability of
the network.
The NEL also includes the revenue and pricing principles (RPP),43 which support the
NEO. As the NEL requires,44 we have taken the RPPs into account throughout our
analysis.
The RPPs are:
A regulated network service provider should be provided with a reasonable
opportunity to recover at least the efficient costs the operator incurs in—
– providing direct control network services; and
– complying with a regulatory obligation or requirement or making a regulatory
payment.
A regulated network service provider should be provided with effective
incentives in order to promote economic efficiency with respect to direct control
network services the operator provides. The economic efficiency that should be
promoted includes—
– efficient investment in a distribution system or transmission system with which
the operator provides direct control network services; and
– the efficient provision of electricity network services; and
– the efficient use of the distribution system or transmission system with which
the operator provides direct control network services.
Regard should be had to the regulatory asset base with respect to a distribution
system or transmission system adopted—
– in any previous—
– as the case requires, distribution determination or transmission determination;
or
– determination or decision under the National Electricity Code or jurisdictional
electricity legislation regulating the revenue earned, or prices charged, by a
person providing services by means of that distribution system or transmission
system; or
42
NEL, s. 7A(6). 43
NEL, s. 7A. 44
NEL, s. 16(2).

36 Overview | Powerlink transmission final determination 2017–22
– in the Rules.
A price or charge for the provision of a direct control network service should
allow for a return commensurate with the regulatory and commercial risks
involved in providing the direct control network service to which that price or
charge relates.
Regard should be had to the economic costs and risks of the potential for under
and over investment by a regulated network service provider in, as the case
requires, a distribution system or transmission system with which the operator
provides direct control network services.
Regard should be had to the economic costs and risks of the potential for under
and over utilisation of a distribution system or transmission system with which a
regulated network service provider provides direct control network services.
Consistent with Energy Ministers' views, we set revenue allowances to balance all
elements of the NEO and consider each of the RPPs.45 For example:
In determining forecast opex and capex that reasonably reflects the opex and
capex criteria, we take into account the revenue and pricing principle that should
provide Powerlink with a reasonable opportunity to recover at least efficient costs.
(Refer to attachment 6 of this final decision and attachment 7 of our draft decision).
We take into account the economic costs and risks of the potential for under and
over investment by a network service provider in our assessment of Powerlink's
forecast capex and opex proposals. (Refer to attachment 6 of this final decision
and attachment 7 of our draft decision).
We consider the economic costs and risks of the potential for under and over
utilisation of Powerlink's transmission system in our demand forecasting (Refer to
attachment 6 of this final decision).
Our application of the EBSS, CESS, and STPIS in this draft decision provide
Powerlink with effective incentives which we consider will promote economic
efficiency with respect to the direct control services that Powerlink provides
throughout the regulatory control period. (Refer to attachments 9, 10 and 11 of this
final decision).
We have determined Powerlink's opening RAB taking into account the RAB
adopted in the previous transmission determination. (Refer to attachment 2 of this
final decision).
The allowed rate of return objective reflects the revenue and pricing principle in
s. 7A(5) of the NEL. We have determined a rate of return that we consider will
provide Powerlink with a return commensurate with the regulatory and commercial
45
Hansard, SA House of Assembly, 27 September 2007, p. 965; Hansard, SA House of Assembly, 26 September
2013, p. 7173.

37 Overview | Powerlink transmission final determination 2017–22
risks involved in providing direct control services. (Refer to attachment 3 of this final
decision).
Our financing determinations provide the TNSP with a reasonable opportunity to
recover at least the efficient costs of accessing debt and capital. (Refer to
attachment 3 of this final decision).
In some cases, our approach to a particular component (or part thereof) results in an
outcome towards the end of the range of options that may be favourable to the
businesses. While it can be difficult to quantify the exact revenue impact of these
individual decisions, we have identified where we have done so in our attachments.
Some of these decisions include:
selecting at the top of the range for the equity beta
setting the return on debt by reference to data for a BBB broad band credit rating,
when the benchmark is BBB+
the cash flow timing assumptions in the post-tax revenue model.
We take into account the RPPs when exercising discretion about an appropriate
estimate. This requires a recognition that for the long term interests of consumers, the
risk of under compensation for, or underinvestment by, a service provider may be less
desirable than the risk of overcompensation or overinvestment. However, the AER is
also conscious of the risk of introducing an inherent bias towards higher amounts
where estimates throughout the different components of the determination are each set
too conservatively.46 The legislative framework recognises the complexity of this task
by providing the AER with significant discretion in many aspects of the decision-making
process to make judgements on these matters.
Chapter 6A of the NER provides specifically for the economic regulation of TNSPs. It
includes rules about the constituent components of our decisions. These are intended
to contribute to the achievement of the NEO.47
5.1 Achieving the NEO to the greatest degree
Electricity transmission determinations are complex decisions and must be considered
as such. In most instances, the provisions of the NER do not point to a single answer,
either for our decision as a whole or in respect of particular components. They require
us to exercise our regulatory judgement. For example, chapter 6A of the NER requires
us to prepare forecasts, which are predictions about unknown future circumstances. As
a result, there will likely always be more than one plausible forecast.48 There is
substantial debate amongst stakeholders about the costs we must forecast, with both
46
AEMC, Rule determination, National Electricity Amendment (Economic Regulation of Transmission Services) Rule
2006 No. 18, 16 November 2006, p. 52. 47
NEL, s. 88. 48
AEMC, Rule Determination: National Electricity Amendment (Economic Regulation of Transmission Services) Rule
2006, 16 November 2006, p. 52.

38 Overview | Powerlink transmission final determination 2017–22
sides often supported by expert opinion. As a result, for certain components of our
decision there may be several plausible answers or several plausible point estimates.
When the constituent components of our decision are considered together, this means
there will almost always be several potential, overall decisions. More than one of these
may contribute to the achievement of the NEO. Where this is the case, our role is to
make an overall decision that we are satisfied contributes to the achievement of the
NEO to the greatest degree.49
We approach this from a practical perspective, accepting that it is not possible to
consider every permutation specifically. Where there are choices to be made among
several plausible alternatives each of which would result in an overall decision that
contributes to the achievement of the NEO, we have selected what we are satisfied
would result in an overall decision that contributes to the achievement of the NEO to
the greatest degree. This is our role under the NEO.
In coming to this decision we considered Powerlink's revised revenue proposal. We
have examined each of the building block components of the proposal and the
incentive mechanisms that would apply across the 2017–22 regulatory control period.
We considered the submissions we received in response to our draft decision. We
conducted our own analysis and engaged expert consultants to help us better
understand if and how Powerlink's revised proposal contributes to the achievement the
NEO. We also considered how our constituent decisions relate to each other, the
impact that particular constituent decisions have on other constituent components of
our decision, and have described these interrelationships in this decision. We have
undertaken an extensive and consultative regulatory review process to ensure we have
canvassed stakeholder issues and made as much of this information publicly available
as practicable. We have had regard to and weighed up all the information assembled
before us in making this decision.
We are satisfied that among the options before us our decision on Powerlink's
transmission determination for the 2017–22 regulatory control period contributes to the
achieving the NEO to the greatest degree.
5.2 Interrelationships between constituent components
Examining constituent components in isolation ignores the importance of the
interrelationships between components of the overall decision, and would not
contribute to the achievement of the NEO. As outlined by Energy Ministers,
considering the elements in isolation has resulted in regulatory failures in the past.50
Interrelationships can take various forms, including:
49
NEL, s. 16(1)(d). 50
SCER, Regulation impact statement: Limited merits review of decision-making in the electricity and gas regulatory
frameworks, Decision paper, 6 June 2013, p. 6

39 Overview | Powerlink transmission final determination 2017–22
underlying drivers and context which are likely to affect many constituent
components of our decision. For example, forecast demand affects the efficient
levels of capex and opex in the regulatory control period (see attachment 6 of this
final decision and attachment 7 of our draft decision).
direct mathematical links between different components of a decision. For example,
the level of gamma has an impact on the appropriate tax allowance; the benchmark
efficient entity's debt to equity ratio has a direct effect on the cost of equity, the cost
of debt, and the overall vanilla rate of return (see attachments 3 and 4 of this final
decision and attachment 8 of our draft decision).
trade-offs between different components of revenue. For example, undertaking a
particular capex project may affect the need for opex or vice versa (see attachment
6 of this final decision and attachment 7 of our draft decision).
trade-offs between forecast and actual regulatory measures. The reasons for one
part of a proposal may have impacts on other parts of a proposal. For example, an
increase in augmentation to the network means the TNSP has more assets to
maintain leading to higher opex requirements (see attachment 6 of this final
decision and attachment 7 of our draft decision).
the TNSP's approach to managing its network. The TNSP's governance
arrangements and its approach to risk management will influence most aspects of
the proposal, including capex/opex trade-offs (see attachment 6 of this final
decision).
We have considered interrelationships, including those above, in our analysis of the
constituent components of our draft decision. These considerations are explored in the
relevant attachments.

40 Overview | Powerlink transmission final determination 2017–22
6 Consultation
Stakeholder participation is important to informed decision making under the NEL and
NER. It allows us to take a range of views into account when considering how a
proposal or decision contributes to the NEO. Effective consultation and engagement
provide confidence in our processes and are good regulatory practice. This is reflected
in the consultation process set out in the NER, under which we have:
published Powerlink's revenue proposal and supporting material
published an issues paper identifying preliminary issues with the revenue proposal
invited written submissions on the revenue proposal
held a public forum on the revenue proposal
published a draft decision and reasoning
published Powerlink's revised revenue proposal and supporting material
invited written submissions on the draft decision and revised revenue proposal
published this final decision and reasoning.
We also sought advice from the CCP on Powerlink's revised revenue proposal. Both
the CCP and Powerlink met with the AER Board to discuss this review.
This process builds on consultation we undertook with a broad range of stakeholders
as part of the Better Regulation program. Following changes to the NER in 2012, we
spent much of 2013 consulting on and refining our assessment methods and
approaches to decision making. We referred to this as our Better Regulation program.
The Better Regulation program was designed to be an inclusive process that provided
an opportunity for all stakeholders to be engaged and provide their input.51
This gives us confidence the approaches set out in our various guidelines, which we
have applied in this decision, will result in outcomes that will or are likely to contribute
to the achievement of the NEO to the greatest degree. Our Better Regulation
guidelines are available on our website52 and include:
Expenditure forecast assessment guideline
Expenditure incentives guideline
Rate of return guideline
Consumer engagement guideline for network service providers
Shared assets guideline
51
AER, Overview of the Better Regulation reform package, April 2014, pp. 4 & 7–13. 52
www.aer.gov.au/better-regulation-reform-program

41 Overview | Powerlink transmission final determination 2017–22
Confidentiality guideline.
The guidelines provide businesses, investors and consumers predictability and
transparency of our approach to regulation under the new rules.
6.1 Consumer engagement
Changes to the NER in 2012 also provide further support for consumer involvement in
the regulatory process, and enable us to engage more productively with energy
consumers and businesses.53 Chapter 6A of the NER was amended to, among other
things, require:
TNSPs to submit an overview with their revenue proposal which describes how
they have engaged with consumers and sought to address any relevant concerns
identified by that engagement54
the AER to publish an issues paper after receiving the TNSP's revenue proposal.55
The purpose of the issues paper is to assist consumer representative groups to
focus on the key preliminary issues on which they should engage and comment56
the AER, when determining capex and opex allowances, to have regard to the
extent to which the forecast includes expenditure to address the concerns of
consumers as identified by the TNSP in the course of its engagement with the
consumers.57
Our Better Regulation Consumer engagement guideline sets out our expectations of
how the network businesses should engage with their customers. We expect the
network businesses to demonstrate a commitment to ongoing and genuine consumer
engagement on issues relevant to consumers. We want to see businesses being more
accountable to their consumers.58 We understand the businesses may need some time
to develop and implement robust and comprehensive engagement strategies and
approaches.59
As set out in the guideline, we monitor consumer engagement activities through the
CCP and our ongoing engagement with stakeholders. We may publicly comment in our
decisions on any shortcomings that we identify from an expenditure proposal that
reflect weaknesses in consumer engagement.60
53
AEMC, Rule determination, National Electricity Amendment (Economic Regulation of Network Service Providers),
Rule 2012. 54
NER, cl. 6A.10.1(g)(2). 55
NER, cl. 6A.11.3(b)(1). 56
AEMC, Rule determination, National Electricity Amendment (Economic Regulation of Network Service Providers),
Rule 2012. 57
NER, cll. 6A.6.6(e)(5A) and 6A.6.7(e)(5A). 58
AER, Better Regulation: Consumer engagement guideline for network service providers, November 2013, p. 5. 59
AER, Better Regulation: Consumer engagement guideline for network service providers, November 2013, p. 12. 60
AER, Better Regulation: Consumer engagement guideline for network service providers, November 2013, p. 12.

42 Overview | Powerlink transmission final determination 2017–22
We have considered the material presented in Powerlink's revised revenue proposal
(section 6.1.1), and stakeholder views presented to us in submissions (section 6.1.2) to
form a view of its progress in implementing improved engagement strategies and
approaches (section 6.1.3). We have not undertaken a substantive review of
Powerlink's consumer engagement approaches and strategies against the above best
practice principles as part of this process.
6.1.1 Powerlink's consumer engagement activities
Powerlink submitted that it has continued to engage with stakeholders following the
submission of its initial revenue proposal. Powerlink's recent engagement activities
include:61
Customer and Consumer Panel meetings in February 2016, May 2016, and
October 2016
Demand and Energy Forecasting Forum
Annual Transmission Network Forum
stakeholder perception survey
one-on-one stakeholder briefings.
Powerlink submitted that, since publication of the AER's draft decision, the focus of its
engagement discussions with customers and consumers has been on forecast
reinvestment capital expenditure (repex) and STPIS. Powerlink submitted that
feedback from customer and consumer representatives showed that, while reliability is
important, stakeholders wanted further information on potential impacts of reduced
repex to better understand the balance between reliability risk and cost. Powerlink
submitted that it has considered and used this feedback in developing its revised
proposal.62
Powerlink submitted that, while its approach to stakeholder engagement has been
generally well received to date, there is further potential to improve. Powerlink noted
that its overall focus is to continue to involve stakeholders in decision-making across all
relevant areas of the business and ensure that it continues to deliver value to
customers and consumers.63
6.1.2 Consumer submissions
Powerlink's consumer engagement work was commended in submissions from CCP
member Jo De Silva, and the Queensland Farmers Federation (QFF). The CCP
acknowledged Powerlink's openness, transparency, and willingness to engage with the
61
Powerlink, 2018-22 revised revenue proposal, December 2016, pp. 3–5. 62
Powerlink, 2018-22 revised revenue proposal, December 2016, p. 5. 63
Powerlink, 2018-22 revised revenue proposal, December 2016, p. 9.

43 Overview | Powerlink transmission final determination 2017–22
CCP throughout the determination process. The QFF also commented on Powerlink's
transparency noting that it found the consultation insightful.64
The CCP however also noted that recent discussion on Powerlink's Customer and
Consumer Panel has indicated that there are some members who are concerned
about aspects of Powerlink's proposal and the AER's draft decision. This was despite
previous positive feedback from the Customer and Consumer Panel following the
publication of Powerlink's initial proposal. The CCP suggested that this may indicate
that, as consumers became more familiar with Powerlink's proposal and external
parties' assessments, their initial reactions were challenged. This may have resulted in
a heightened expectation of finding further efficiencies and more prudent
expenditure.65
6.1.3 Our view of Powerlink's consumer engagement
As we noted in our draft decision, we consider that Powerlink has taken important
steps to engage with its customers in a very positive manner. We note that the CCP
and the QFF have made many positive comments in regards to Powerlink's consumer
engagement particularly in regards to its transparency.
We consider that Powerlink has shown a willingness to continue and to further develop
its consumer engagement to address issues raised by stakeholders. In our draft
decision we noted that the CCP had some concerns over the execution of Powerlink's
consumer engagement program. Specifically, the CCP submitted that the program was
somewhat limited in terms of the breadth of stakeholders engaged. In its revised
proposal Powerlink committed to continued engagement with the AER and CCP to
gain further insight regarding a more appropriate breadth of consumer engagement for
a TNSP.
We note that there are some concerns regarding aspects of Powerlink's revenue
proposal which stakeholders have raised with the CCP. These concerns may not have
been raised through Powerlink's stakeholder engagement program. However, as we
noted in our draft decision, stakeholder engagement is a relatively new aspect
undertaken by network service providers and should continue to improve over time.
Powerlink has submitted that it is committed to continuing and improving its practices
when it comes to stakeholder engagement.66 We expect that Powerlink will take into
account the issues raised by the CCP in developing its consumer engagement
program going forward.
64
CCP (Jo De Silva), Submission to the AER on draft decision for Powerlink's transmission determination 2017–22,
November 2016, pp. ii & 6; QFF, Response on AER draft decision on Powerlink's revenue proposal for the 2017–
22 regulatory period, November 2016, p. 2. 65
CCP (Jo De Silva), Submission to the AER on draft decision for Powerlink's transmission determination 2017–22,
November 2016, p. 6. 66
Powerlink, 2018-22 revised revenue proposal, December 2016, p. 9.

44 Overview | Powerlink transmission final determination 2017–22
A Constituent components
Our final decision on Powerlink's transmission determination includes the following
constituent components:67
Constituent component
In accordance with clause 6A.14.1(1)(i) of the NER, the AER does not approve the total revenue cap set out in Powerlink's
building block proposal. Our final decision on Powerlink's total revenue cap is $3940.2 million ($ nominal) for the 2017–22
regulatory control period. This decision is discussed in Attachment 1 of this final decision. [See also section 1.1-1.3 of the
transmission determination]
In accordance with clause 6A.14.1(1)(ii) of the NER, the AER does not approve the maximum allowed revenue (MAR) for each
regulatory year of the regulatory control period set out in Powerlink's revised building block proposal. Our decision on
Powerlink's MAR for each year of the 2017–22 regulatory control period is set out in Attachment 1 of this final decision. [See
also section 1.1-1.3 of the transmission determination]
In accordance with clause 6A.14.1(1)(iii) of the NER, the AER has decided to apply the service component, network capability
component and market impact component of Version 5 of the service target performance incentive scheme (STPIS) to
Powerlink for the 2017–22 regulatory control period. The values and parameters of the STPIS are set out in Attachment 11 of
this final decision. [See also section 1.6 of the transmission determination]
In accordance with clause 6A.14.1(1)(iv) of the NER, the AER's decision on the values that are to be attributed to the
parameters for the efficiency benefit sharing scheme (EBSS) that will apply to Powerlink in respect of the 2017–22 regulatory
control period are set out in Attachment 9 of this final decision. [See also section 1.7 of the transmission determination]
In accordance with clause 6A.14.1(1)(v) of the NER, the AER has approved the commencement and length of the regulatory
control period as Powerlink proposed in its revenue proposal. The regulatory control period will commence on 1 July 2017 and
the length of this period is five years, expiring on 30 June 2022. [See also section 1.9 of the transmission determination]
In accordance with clause 6A.14.1(2), and in accordance with clause 6A.6.7(d) of the NER, the AER has not accepted
Powerlink's total forecast capital expenditure of $888.9 million ($2016–17). The reasons for this final decision and our substitute
estimate of Powerlink's total forecast capex for the 2017–22 regulatory control period is $835.5 million ($2016–17). This is
discussed in Attachment 6 of this final decision.
In accordance with clause 6A.14.1(3)(i), and in accordance with clause 6A.6.6(c) of the NER, the AER accepts Powerlink's total
forecast operating expenditure inclusive of debt raising costs of $976.7 million ($2016–17). This is discussed in section 3.6 of
this overview.
In accordance with clause 6A.14.1(4)(i), the AER has determined that the following proposed projects are contingent projects
for the purpose of the revenue determination:
Central to North Queensland Reinforcement
Northern Bowen Basin area
Bowen Industrial Estate
QNI upgrade (Queensland component)
Gladstone area reinforcement
Queensland to South Australia Interconnection (Queensland component).
This is discussed in Attachment 6 of this final decision.
In accordance with clause 6A.14.1(4)(ii), the AER is satisfied that the capital expenditure of $445.9 million for the six contingent
projects as described in Powerlink's current regulatory proposal reasonably reflects the capital expenditure criteria, taking into
account the capital expenditure factors. This is discussed in Attachment 6 of this final decision.
67
NER, cl. 6A.14.

45 Overview | Powerlink transmission final determination 2017–22
Constituent component
In accordance with clause 6A.14.1(4)(iii), the AER has determined that the triggers proposed by Powerlink for the following five
contingent projects are inconsistent with the NER:
o Central to North Queensland Reinforcement
o Northern Bowen Basin area
o Bowen Industrial Estate
o QNI Upgrade (Queensland component)
o Queensland to South Australia Interconnection (Queensland component).
Our final decision includes revised triggers to provide greater certainty as to our approach should Powerlink seek to act on
these contingent projects. This is discussed in Attachment 6 of this final decision.
In accordance with clause 6A.14.1(4)(iv), the AER has determined that the proposed Southern Galilee Basin project is not a
contingent project.
This is discussed in Attachment 6 of this final decision.
The AER's final decision is to apply version two of the Expenditure benefit sharing scheme (EBSS) to Powerlink in the 2017–22
regulatory control period. This is set out in attachment 9 of the final decision.
In accordance with clause 6A.14.1(5A) of the NER, the AER has determined that version 1 of the capital expenditure sharing
scheme (CESS) as set out the Capital Expenditure Incentives Guideline will apply to Powerlink in the 2017–22 regulatory
control period. This is discussed in Attachment 10 of this final decision. [See also section 1.8 of the transmission determination]
In accordance with clause 6A.14.1(5B) and 6A.6.2 of the NER, the AER has decided that the allowed rate of return for the
2017–18 regulatory year is 6.02 per cent (nominal vanilla), as set out in Attachment 3 of this final decision. The rate of return for
the remaining regulatory years 2018–22 will be updated annually because our decision is to apply a trailing average portfolio
approach to estimating debt which incorporates annual updating of the allowed return on debt.
In accordance with clause 6A.14.1(5C) of the NER the AER has decided that the return on debt is to be estimated using a
methodology referred to in clause 6A.6.2(i)(2), and using the formula to be applied in accordance with clause 6A.6.2(l). The
methodology and formula are set out in Attachment 3 of this final decision.
In accordance with clause 6A.14.1(5D) of the NER the AER has decided that the value of imputation credits as referred to in
clause 6A.6.4 is 0.4. This is discussed in Attachment 4 of this final decision.
In accordance with clause 6A.14.1(5E) of the NER the AER has decided, in accordance with clause 6A.6.1 and schedule 6A.2,
that the opening regulatory asset base (RAB) as at the commencement of the 2017–22 regulatory control period, being 1 July
2017, is $7069.4 million ($ nominal). This is discussed in Attachment 2 of this final decision. [See also section 1.5 of the
transmission determination]
In accordance with clause 6A.14.1(5F) of the NER the AER has decided that the depreciation approach based on forecast
capex (forecast depreciation) is to be used to establish the RAB at the commencement of Powerlink's regulatory control period
as at 1 July 2022. This is discussed in Attachment 2 of this final decision. [See also section 1.5 of the transmission
determination]
In accordance with clause 6A.14.1(6) of the NER the AER has approved Powerlink's proposed negotiating framework. This is
set out in Attachment 14 of this final decision. [See also section 2 of the transmission determination]
In accordance with clause 6A.14.1(7) of the NER the AER has specified the negotiated transmission services criteria for
Powerlink. This is set out in Attachment 14 of this final decision. [See also section 3 of the transmission determination]
In accordance with clause 6A.14.1(8) of the NER the AER has approved Powerlink's revised proposed pricing methodology.
Our reasons for this final decision on Powerlink's proposed pricing methodology is set out in Attachment 12 of this final
decision. [See also section 4 of the transmission determination]
In accordance with clause 6A.14.1(9) of the NER the AER has approved the following nominated pass through events to apply
to Powerlink for the 2017–22 regulatory control period in accordance with clause 6A.6.9:
insurance cap event
terrorism event

46 Overview | Powerlink transmission final determination 2017–22
Constituent component
insurer credit risk event.
These events have the definitions set out in Attachment 13 of this final decision. [See also section 5 of the transmission
determination]
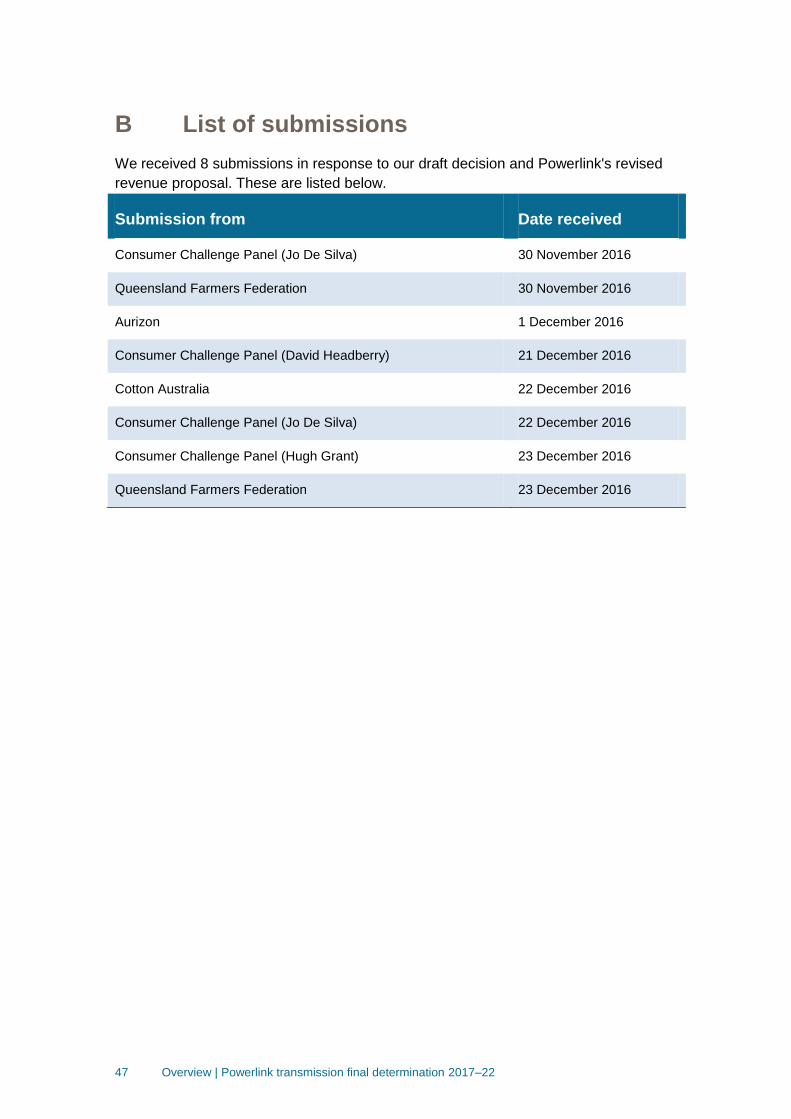
47 Overview | Powerlink transmission final determination 2017–22
B List of submissions
We received 8 submissions in response to our draft decision and Powerlink's revised
revenue proposal. These are listed below.
Submission from Date received
Consumer Challenge Panel (Jo De Silva) 30 November 2016
Queensland Farmers Federation 30 November 2016
Aurizon 1 December 2016
Consumer Challenge Panel (David Headberry) 21 December 2016
Cotton Australia 22 December 2016
Consumer Challenge Panel (Jo De Silva) 22 December 2016
Consumer Challenge Panel (Hugh Grant) 23 December 2016
Queensland Farmers Federation 23 December 2016