Final Business Rules for Calculating the 2017 ESSA School ... Busines… · participation data....
43
1 Final Business Rules for Calculating the 2017 ESSA School Index Scores This document details the business rules used to calculate ESSA School Index Scores. These business rules provide transparency in the process. The business rules reflect the details for calculating the ESSA School Index as described in the Arkansas plan for the Every Student Succeeds Act. Contents Business Rules for Calculating the ESSA School Index Scores............................................................................................... 1 Overview............................................................................................................................................................................. 2 Business Rules by Indicator and Components of Indicators ............................................................................................. 4 Participation—Percent Tested ....................................................................................................................................... 4 Weighted Achievement (Math and ELA) ....................................................................................................................... 6 Content Growth Score .................................................................................................................................................... 8 ELP Growth Score ......................................................................................................................................................... 11 School Value Added Growth Score .............................................................................................................................. 13 Graduation - 4 year Adjusted Cohort........................................................................................................................... 14 Graduation- 5 year Adjusted Cohort ........................................................................................................................... 17 School Quality and Student Success Indicator ............................................................................................................ 20 Compiling Total SQSS Score ......................................................................................................................................... 31 Special Schools: Feeder Schools and Special Grade Configurations ............................................................................... 32 Feeder Schools .............................................................................................................................................................. 32 Special Grade Configurations ....................................................................................................................................... 32 Appendix A ....................................................................................................................................................................... 33 ELA Cut Scores .............................................................................................................................................................. 33 Appendix B........................................................................................................................................................................ 34 Advanced Placement/International Baccalaureate/Concurrent Credit Course Codes .............................................. 34 Computer Science Course Codes ................................................................................................................................. 42
Transcript of Final Business Rules for Calculating the 2017 ESSA School ... Busines… · participation data....

1
Final Business Rules for Calculating the 2017 ESSA School Index Scores
This document details the business rules used to calculate ESSA School Index Scores. These business rules
provide transparency in the process. The business rules reflect the details for calculating the ESSA School Index
as described in the Arkansas plan for the Every Student Succeeds Act.
Contents Business Rules for Calculating the ESSA School Index Scores............................................................................................... 1
Overview ............................................................................................................................................................................. 2
Business Rules by Indicator and Components of Indicators ............................................................................................. 4
Participation—Percent Tested ....................................................................................................................................... 4
Weighted Achievement (Math and ELA) ....................................................................................................................... 6
Content Growth Score .................................................................................................................................................... 8
ELP Growth Score ......................................................................................................................................................... 11
School Value Added Growth Score .............................................................................................................................. 13
Graduation - 4 year Adjusted Cohort........................................................................................................................... 14
Graduation- 5 year Adjusted Cohort ........................................................................................................................... 17
School Quality and Student Success Indicator ............................................................................................................ 20
Compiling Total SQSS Score ......................................................................................................................................... 31
Special Schools: Feeder Schools and Special Grade Configurations ............................................................................... 32
Feeder Schools .............................................................................................................................................................. 32
Special Grade Configurations ....................................................................................................................................... 32
Appendix A ....................................................................................................................................................................... 33
ELA Cut Scores .............................................................................................................................................................. 33
Appendix B ........................................................................................................................................................................ 34
Advanced Placement/International Baccalaureate/Concurrent Credit Course Codes .............................................. 34
Computer Science Course Codes ................................................................................................................................. 42
2
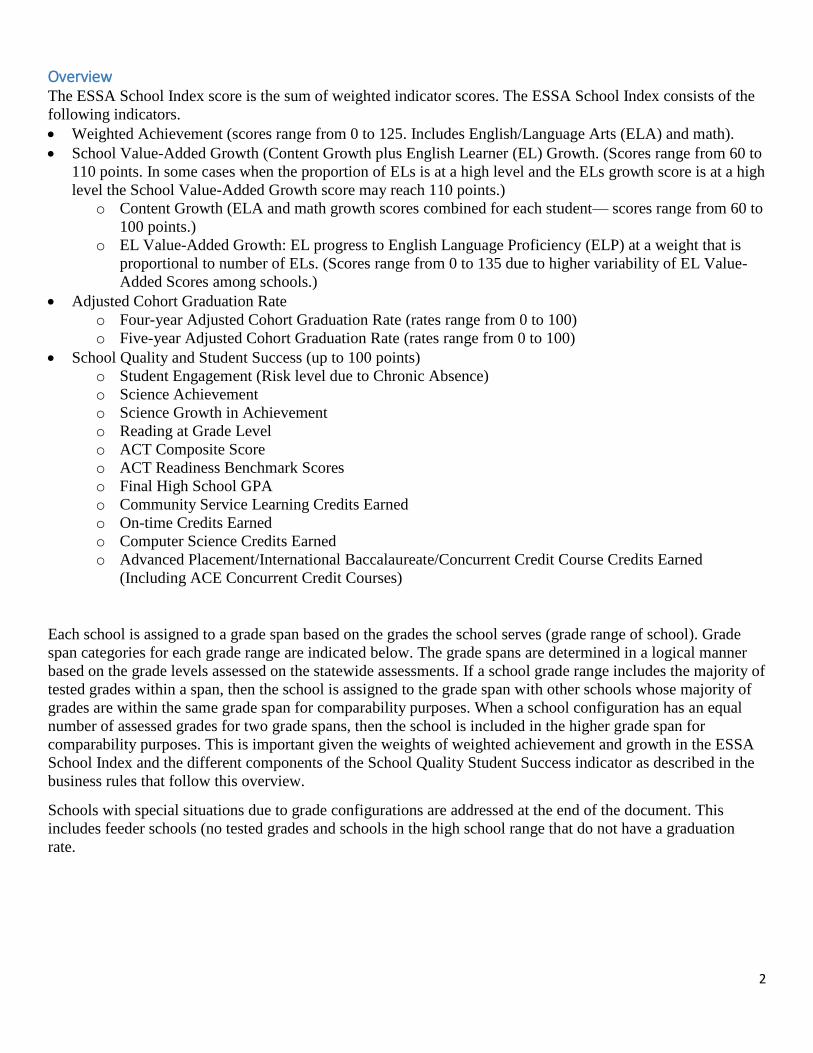
Overview The ESSA School Index score is the sum of weighted indicator scores. The ESSA School Index consists of the
following indicators.
Weighted Achievement (scores range from 0 to 125. Includes English/Language Arts (ELA) and math).
School Value-Added Growth (Content Growth plus English Learner (EL) Growth. (Scores range from 60 to
110 points. In some cases when the proportion of ELs is at a high level and the ELs growth score is at a high
level the School Value-Added Growth score may reach 110 points.)
o Content Growth (ELA and math growth scores combined for each student— scores range from 60 to
100 points.)
o EL Value-Added Growth: EL progress to English Language Proficiency (ELP) at a weight that is
proportional to number of ELs. (Scores range from 0 to 135 due to higher variability of EL Value-
Added Scores among schools.)
Adjusted Cohort Graduation Rate
o Four-year Adjusted Cohort Graduation Rate (rates range from 0 to 100)
o Five-year Adjusted Cohort Graduation Rate (rates range from 0 to 100)
School Quality and Student Success (up to 100 points)
o Student Engagement (Risk level due to Chronic Absence)
o Science Achievement
o Science Growth in Achievement
o Reading at Grade Level
o ACT Composite Score
o ACT Readiness Benchmark Scores
o Final High School GPA
o Community Service Learning Credits Earned
o On-time Credits Earned
o Computer Science Credits Earned
o Advanced Placement/International Baccalaureate/Concurrent Credit Course Credits Earned
(Including ACE Concurrent Credit Courses)
Each school is assigned to a grade span based on the grades the school serves (grade range of school). Grade
span categories for each grade range are indicated below. The grade spans are determined in a logical manner
based on the grade levels assessed on the statewide assessments. If a school grade range includes the majority of
tested grades within a span, then the school is assigned to the grade span with other schools whose majority of
grades are within the same grade span for comparability purposes. When a school configuration has an equal
number of assessed grades for two grade spans, then the school is included in the higher grade span for
comparability purposes. This is important given the weights of weighted achievement and growth in the ESSA
School Index and the different components of the School Quality Student Success indicator as described in the
business rules that follow this overview.
Schools with special situations due to grade configurations are addressed at the end of the document. This
includes feeder schools (no tested grades and schools in the high school range that do not have a graduation
rate.

3
Arkansas stakeholders included the required indicators in the customized ESSA School Index and identified
weights to each indicator to determine the contribution of each indicator to the total ESSA School Index score
for each school.
Arkansas’ ESSA School Index weights are detailed below.
Component Weight of
Indicator within
Index Grades K –
5 & 6 - 8
Component Weight of Indicator
within Index
High Schools
Weighted Achievement
Indicator
35% Weighted Achievement
and Academic Growth
70% total with
Weighted Achievement
accounting for half
(35%) and School
Growth Score
accounting for half
(35%)
Growth Indicator
Academic Growth
English Language
Progress
50%
Progress to English
Language Proficiency*
Weight of indicator
in School Value-
Added Growth
Score is
proportionate to
number of English
Learners
Progress to English
Language Proficiency*
Weight of indicator in
School Value-Added
Growth Score is
proportionate to
number of English
Learners
Graduation Rate
Indicator
4-Year Adjusted
Cohort Rate
5-Year Adjusted
Cohort Rate
NA 15% total
4-Yr = 10%
5-Yr = 5%
School Quality and
Student Success
Indicator
15% 15%
Grade Span Grade Ranges
PK-5 P - P P - K P - 1 P - 2 P - 3 P - 4 P - 5 P - 6 K - K K - 1 K - 2 K - 3
K - 4 K - 5 K - 6 1 - 2 1 - 3 1 - 4 1 - 5 1 - 6 2 - 3 2 - 4 2 - 5 2 - 6
3 - 3 3 - 5 3 - 6 4 - 5 4 - 6 5 - 5
Grades 6-8 P - 8 K - 8 4 - 7 4 - 8 5 - 6 5 - 7 5 - 8 6 - 6 6 - 7 6 - 8 7 - 8 7 - 9
8 - 8
Gr. 9 - 12 8 - 9 9 - 9 K - 12 5 - 12 6 - 12 7 - 12 8 - 12 9 - 12 10 - 12 11 - 12

4
Business Rules by Indicator and Components of Indicators
The following tables provide the detailed business rules for each indicator. Some indicators have multiple
components and these components are detailed within the description of the indicator.
Participation—Percent Tested Description of
Component or
Indicator
To calculate assessment participation (95% tested), all students are included: full-academic year
and highly mobile students. Percent Tested is included in the ESSA School Index calculation to the
extent that if schools do not test 95% of students or 95% of a subgroup of students, the
denominator for achievement calculations are adjusted to 95% of students expected to test at the
school or in the subgroup as per ESEA Section 1111 (c)(4)(e)
Participation data Student enrollment, identification, and demographic information must be entered
accurately into eSchool by 4 pm the day before the designated download date for
participation data.
Participation information is downloaded from TRIAND which updates student
information nightly from eSchool, starting at 4 p.m. Participation download date for 2017
was May 5, 2017.
The date for the participation download is determined by ADE Office of Student
Assessment and the Public School Accountability division.
Full academic year and highly mobile students enrolled in a school at the time of testing
are expected to take the state achievement test. Students who are continuously enrolled in
a particular school on or before October 1st through the test window are considered full
academic year students (not highly mobile).
Included
Subgroups
1. All Students – All students in the school.
2. White – Student identified race is White and no other race or ethnicity is indicated.
3. African American – Student’s race is identified as African American and no other race or
ethnicity is indicated.
4. Hispanic/Latino(a) – Student’s ethnicity is identified as Hispanic/Latino/a. A student is
designated as Hispanic/Latino(a) regardless of whether any other races are identified for
the student.
5. Economically Disadvantaged – Student is indicated as participating in the Federal Free
and Reduced Price Lunch Program.
6. English Learner – Student is indicated as an English Learner (EL) or student is indicated
as a Former Monitored (EL) (for up to four years after exiting EL services).
7. Student with Disability(ies) – Student is indicated as receiving special education services.
Assessments &
Grade Levels
Included
1. ACT Aspire, Grades: 3 – 10
2. Multi-State Alternate Assessment (MSAA) for English Language Arts (ELA) and math,
Grades: 3 – 8, 11 for students flagged for alternate ELA and math assessment.
3. Arkansas Alternative Portfolio Assessment for Science (APA Science), Grades: 5, 7, 10,
for students flagged for alternate science portfolio Included Subjects 1. Math
2. ELA
3. Science
Students excluded
from calculations
1. Students are removed from enrollment based on the following resident codes downloaded
from TRIAND for the participation data:
a. Resident Codes X, 1, 2, and 4 (Home school codes)
b. Educational Placement Codes Correctional Facility (CF), Private Residential (RI),
Parent Placed (PP), Hospital/Homebound (HH)

5
Participation—Percent Tested 2. Students automatically excluded from percent tested calculations are students with the
following Reasons Not Tested:
a. ACT Aspire
(1) Incarcerated/ Juvenile Detention
(2) EL Less than 1 year (ELA) -- Beginning in 2018 EVERY student will be
expected to test.
(3) Moved to a different state/out of country
(4) Deceased
b. MSAA
(1) Exempt (ELA) only for EL Less than 1 year-- Beginning in 2018 EVERY
student will be expected to test.
(2) Exempt
(3) Administration Irregularity
c. APA Science
(1) Moved to a different state/out of country
(2) Out-of-state transfer student enrolled after January 15, 2017
(3) Participated in regular assessment
(4) Health problems or pregnancy resulted in extended absence or death
Determining
percent tested
Perform the following calculations for all students and each subgroup of students:
1. Count the number of students who tested (tested flag = 1) and those who were expected to
test but did not (tested flag = 0) by subject for each of the ESSA subgroups at each school.
2. Sum the two counts (tested flag = 1 and tested flag = 0) to produce the total number of
students expecting to test at each school by subject for each of the ESSA subgroups.
3. Determine the percent tested for each subgroup as the number who actually tested divided
by the number expected to test as in the formula below.
𝑃𝑒𝑟𝑐𝑒𝑛𝑡 𝑇𝑒𝑠𝑡𝑒𝑑 = (# 𝑠𝑡𝑢𝑑𝑒𝑛𝑡𝑠 𝑡𝑒𝑠𝑡𝑒𝑑
# 𝑠𝑡𝑢𝑑𝑒𝑛𝑡𝑠 𝑒𝑥𝑝𝑒𝑐𝑡𝑒𝑑 𝑡𝑜 𝑡𝑒𝑠𝑡) × 100
4. Round percent tested calculation to two decimal places.
Adjustment for
Testing Fewer
than 95%
For any school that did not test at least 95% in ELA and/or math for any group (all students and/or
any subgroup of students), an adjusted denominator will be calculated for use in the Weighted
Achievement Score.
The adjusted denominator for any group is the number that is equal to 95% of the number of
students expected to test for that group/subject. The adjusted denominator will be truncated
(rounded down) to the lowest whole number in the case where 95% results in a fraction of a
student.
Variables in final
Percent Tested
Table
District LEA
District Name
School LEA
School Name
Subgroup
Number of students tested in Math
Total number of students expected to test for Math
Percent of students tested in Math
Number of students that equal 95% of those expected to test in Math
Number of students tested in ELA
Total number of students expected to test for ELA
Percent of students tested in ELA
Number of students that equal 95% of those expected to test in ELA
Number of students tested in Science
Total number of students expected to test for Science
6
Participation—Percent Tested Percent of students tested in Science
Number of students that equal 95% of those expected to test in Science
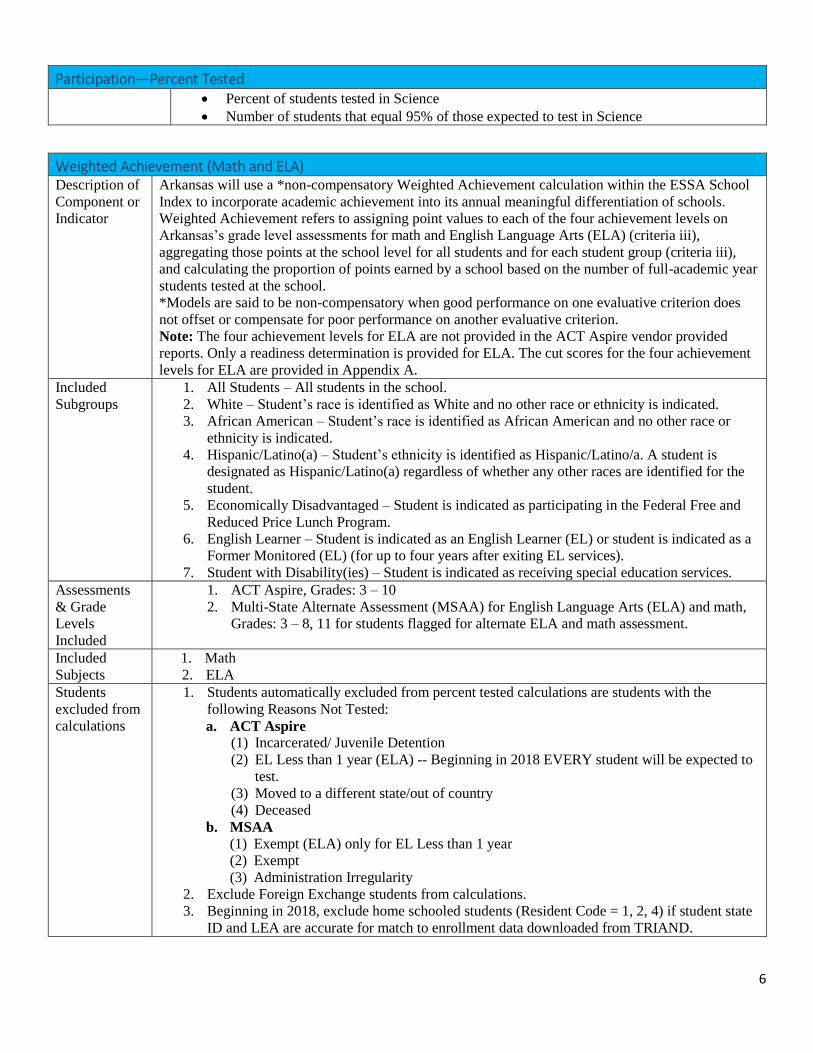
Weighted Achievement (Math and ELA) Description of
Component or
Indicator
Arkansas will use a *non-compensatory Weighted Achievement calculation within the ESSA School
Index to incorporate academic achievement into its annual meaningful differentiation of schools.
Weighted Achievement refers to assigning point values to each of the four achievement levels on
Arkansas’s grade level assessments for math and English Language Arts (ELA) (criteria iii),
aggregating those points at the school level for all students and for each student group (criteria iii),
and calculating the proportion of points earned by a school based on the number of full-academic year
students tested at the school.
*Models are said to be non-compensatory when good performance on one evaluative criterion does
not offset or compensate for poor performance on another evaluative criterion.
Note: The four achievement levels for ELA are not provided in the ACT Aspire vendor provided
reports. Only a readiness determination is provided for ELA. The cut scores for the four achievement
levels for ELA are provided in Appendix A.
Included
Subgroups
1. All Students – All students in the school.
2. White – Student’s race is identified as White and no other race or ethnicity is indicated.
3. African American – Student’s race is identified as African American and no other race or
ethnicity is indicated.
4. Hispanic/Latino(a) – Student’s ethnicity is identified as Hispanic/Latino/a. A student is
designated as Hispanic/Latino(a) regardless of whether any other races are identified for the
student.
5. Economically Disadvantaged – Student is indicated as participating in the Federal Free and
Reduced Price Lunch Program.
6. English Learner – Student is indicated as an English Learner (EL) or student is indicated as a
Former Monitored (EL) (for up to four years after exiting EL services).
7. Student with Disability(ies) – Student is indicated as receiving special education services.
Assessments
& Grade
Levels
Included
1. ACT Aspire, Grades: 3 – 10
2. Multi-State Alternate Assessment (MSAA) for English Language Arts (ELA) and math,
Grades: 3 – 8, 11 for students flagged for alternate ELA and math assessment.
Included
Subjects
1. Math
2. ELA
Students
excluded from
calculations
1. Students automatically excluded from percent tested calculations are students with the
following Reasons Not Tested:
a. ACT Aspire
(1) Incarcerated/ Juvenile Detention
(2) EL Less than 1 year (ELA) -- Beginning in 2018 EVERY student will be expected to
test.
(3) Moved to a different state/out of country
(4) Deceased
b. MSAA
(1) Exempt (ELA) only for EL Less than 1 year
(2) Exempt
(3) Administration Irregularity
2. Exclude Foreign Exchange students from calculations.
3. Beginning in 2018, exclude home schooled students (Resident Code = 1, 2, 4) if student state
ID and LEA are accurate for match to enrollment data downloaded from TRIAND.

7
Weighted Achievement (Math and ELA) 4. Exclude students who are not full academic year (highly mobile students) from accountability
calculations, respectively. Full academic year students are those who were continuously
enrolled on or before October 1 through the test window.
5. Students who do not have a test score are excluded from Achievement calculations.
Determining
Weighted
Achievement
Perform the following calculations for the All Students group and each subgroup of students:
1. Sum the number of full academic year students at each achievement level (Levels 1-4) in
ELA and math to obtain the #L1 (math + ELA), #L2 (math + ELA), #L3 (math + ELA), #L4
(math + ELA). Include MSAA and ACT Aspire in the sum for each achievement level.
2. Compare the sum of math and ELA L1 students to the sum of math and ELA L4 students to
determine number of L4 students multiplied by 1.00 and # of L4 students multiplied by 1.25.
a. If #L1 students ≥ #L4 students then all L4 students multiplied by 1.00;
b. If #L1 students < #L4 students then #L1 = #L4 students multiplied by 1.00 and #L4
students >#L1 students multiplied by 1.25.
c. For all other achievement levels multiply # at each level by points for the level.
d. Example 1:
#L1
students
#L2
students
#L3
students
#L4
students
ELA 2 3 4 7
Math 7 4 3 2
SUM at each level 9 7 7 9*
Points at each level 9*0.00
=0.00
7*0.50 =
3.50
7*1.00=
7.00
9*1.00 =
9.00
*Sum at L1 = 9 = Sum at L4. Subtract #L1s from #L4s. 9 – 9 =0. Therefore, #L4
multiplied by 1.00 point. 9*1.00 = 9 points for L4.
d. Example 2:
#L1
students
#L2
students
#L3
students
#L4
students
ELA 3 2 4 2
Math 2 4 3 2
SUM at each level 5 6 7 4*
Multiply # at each
level to get Points at
each level
5*0.00 =
0.00
6*0.50 =
3.00
7*1.00 =
7.00
4*1.00 =
4.00
*Sum at L1 = 5 > Sum at L4 = 4. Subtract #L1s from #L4s. 4-5 = -1. Therefore, #L4
multiplied by 1.00 point. 4*1.00 = 4.00 points for L4.
e. Example 3:
#L1
students
#L2
students
#L3
students
#L4
students
ELA 2 3 4 7
Math 3 2 5 6
SUM at each Level 5 5 9 13*
Multiply # at each
level to get Points at
each level
5*0.00 =
0.00
5*0.50 =
2.50
9*1.00 =
9.00
(5*1.00) +
(8*1.25) =
(5 + 10) =
15
*Sum at L1 = 5 < Sum at L4 = 13. Subtract #L1 from #L4. The difference is
multiplied by 1.25. Since there are 5 L1s then 5L4s must be multiplied by 1.00 and
the remaining L4s are multiplied by 1.25.
T(5L4s*1.00) + (8L4s*1.25) points = 15 points for L4.
8
Weighted Achievement (Math and ELA)
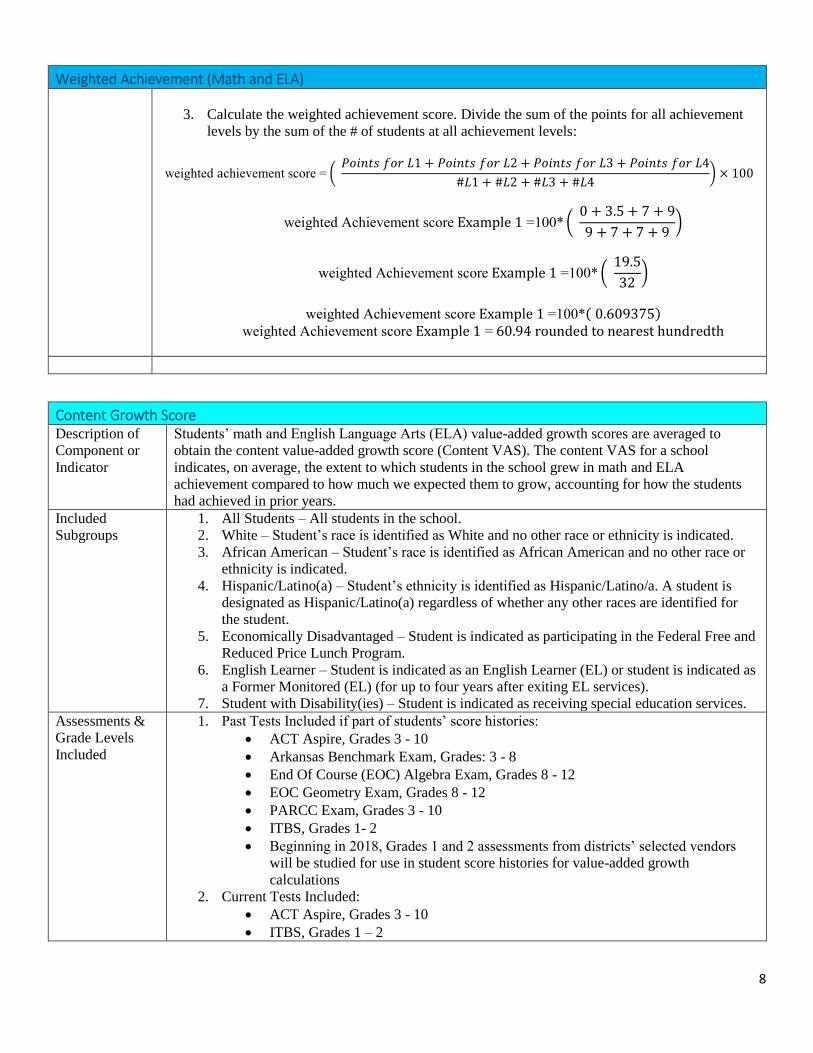
3. Calculate the weighted achievement score. Divide the sum of the points for all achievement
levels by the sum of the # of students at all achievement levels:
weighted achievement score = ( 𝑃𝑜𝑖𝑛𝑡𝑠 𝑓𝑜𝑟 𝐿1 + 𝑃𝑜𝑖𝑛𝑡𝑠 𝑓𝑜𝑟 𝐿2 + 𝑃𝑜𝑖𝑛𝑡𝑠 𝑓𝑜𝑟 𝐿3 + 𝑃𝑜𝑖𝑛𝑡𝑠 𝑓𝑜𝑟 𝐿4
#𝐿1 + #𝐿2 + #𝐿3 + #𝐿4) × 100
weighted Achievement score Example 1 =100* ( 0 + 3.5 + 7 + 9
9 + 7 + 7 + 9)
weighted Achievement score Example 1 =100* ( 19.5
32)
weighted Achievement score Example 1 =100*( 0.609375)
weighted Achievement score Example 1 = 60.94 rounded to nearest hundredth
Content Growth Score Description of
Component or
Indicator
Students’ math and English Language Arts (ELA) value-added growth scores are averaged to
obtain the content value-added growth score (Content VAS). The content VAS for a school
indicates, on average, the extent to which students in the school grew in math and ELA
achievement compared to how much we expected them to grow, accounting for how the students
had achieved in prior years.
Included
Subgroups
1. All Students – All students in the school.
2. White – Student’s race is identified as White and no other race or ethnicity is indicated.
3. African American – Student’s race is identified as African American and no other race or
ethnicity is indicated.
4. Hispanic/Latino(a) – Student’s ethnicity is identified as Hispanic/Latino/a. A student is
designated as Hispanic/Latino(a) regardless of whether any other races are identified for
the student.
5. Economically Disadvantaged – Student is indicated as participating in the Federal Free and
Reduced Price Lunch Program.
6. English Learner – Student is indicated as an English Learner (EL) or student is indicated as
a Former Monitored (EL) (for up to four years after exiting EL services).
7. Student with Disability(ies) – Student is indicated as receiving special education services.
Assessments &
Grade Levels
Included
1. Past Tests Included if part of students’ score histories:
ACT Aspire, Grades 3 - 10
Arkansas Benchmark Exam, Grades: 3 - 8
End Of Course (EOC) Algebra Exam, Grades 8 - 12
EOC Geometry Exam, Grades 8 - 12
PARCC Exam, Grades 3 - 10
ITBS, Grades 1- 2
Beginning in 2018, Grades 1 and 2 assessments from districts’ selected vendors
will be studied for use in student score histories for value-added growth
calculations
2. Current Tests Included:
ACT Aspire, Grades 3 - 10
ITBS, Grades 1 – 2

9
Content Growth Score Beginning in 2018, Grades 1 and 2 assessments from districts’ selected vendors
will be evaluated for use in student score histories for value-added growth
calculations. These assessments are from NWEA, I-Station, and Renaissance.
Included
Subjects
1. Math
2. ELA
Student Scores
Included in
Calculations.
1. Students in Grades 3 – 10 with current year scores on the ACT Aspire are included in
calculations. Score histories are constructed for these students using their current year score
and up to four prior years of assessment scores.
2. Four prior years of assessment scores for students in Grades 3 – 10 include their prior
scores from assessments in Grades 1-9 in ELA and in math which may include Algebra
&/or Geometry End of Course Exams (EOCs).
a. Scores from students’ assessments in Grades 1 and 2 are only used for Grade 3
students’ score histories when available to enable growth calculations for Grade 3
students.
b. Algebra and Geometry scores from prior years of the Arkansas Benchmark Exam
and/or PARCC Exam for students who were in Grades 8 - 10 at the time are
included in students’ score histories where applicable.
3. Grades 3 – 10 science scores for 2016 and 2017 ACT Aspire were used for science growth.
Science growth is available for Grades 4 – 10.
Students
Excluded from
Calculations
1. Exclude students with scores from the MSAA ELA and math assessments and the APA
Science assessments.
2. Exclude students who do not have a current year test score.
3. Beginning in 2018, exclude home schooled students (Resident Code = 1, 2, 4) if student
state ID and LEA are accurate for match to enrollment data downloaded from TRIAND.
4. Exclude students who are highly mobile from aggregations. However, highly mobile
students are included in calculations of individual student growth scores.
Special Student
Level
Considerations
1. For students who were retained or repeated a course (Algebra and/or Geometry), their most
recent score for the retained grade/course is used in their score history.
2. ELA scores for students in Grades 1 and 2 are the average of the ITBS Language and
Reading Scale Scores.
Student Growth
Score
Calculations
1. Student score histories are compiled by subject and contain from two to five data points.
2. Scores are standardized by year, subject, grade and test group to support a growth model
calculation across the different assessments.
3. Controlling for English language level: Students’ English Language Proficiency (ELP)
levels for the current year (ELPA21 Levels 1, 2 or 3) are included at the student level of the
model to control for students’ English Learning levels. If a student is not indicated as an EL
student, the student is designated “English Only” thus the student was no expected to take
the ELP assessment and therefore does not have an ELPA21 score. English Only students
are assigned as English Proficient (ELPA21 Level 3).
4. For each subject, standardized scores of students with more than one year of data are put
into a mixed model from which a predicted score and residual (difference between actual
score and predicted score) are calculated conditioned on student’s individual achievement
score history and student’s ELP.
5. Calculate a combined student growth score by averaging the math and ELA growth scores
for each student. If the students only tested in ELA or math, that content score will be the
students combined growth score.
Determining
Mean School
ELA and Math
VAS
Perform the following calculations for math and ELA to determine the average school value-added
content scores:
1. Count the total number of full academic year students tested for all students and for each
subgroup. These totals will serve as the denominators for the mean school calculations.
2. Sum the student content growth scores of full academic year students for all students and
each subgroup.

10
Content Growth Score 3. Determine the school level mean growth scores (Math (Math VAS) and ELA (ELA VAS)).
The school level mean growth score for each subject can be calculated by summing the
student growth scores for full academic year students and dividing by the total number of
full academic year students with growth scores.
For example, the math growth score for each school’s all students group is calculated using
the following formula:
𝑀𝑎𝑡ℎ𝑎𝑙𝑙 𝑉𝐴𝑆
= (∑ 𝑚𝑎𝑡ℎ 𝑔𝑟𝑜𝑤𝑡ℎ 𝑠𝑐𝑜𝑟𝑒𝑠 𝑜𝑓 𝑎𝑙𝑙 𝑠𝑡𝑢𝑑𝑒𝑛𝑡𝑠 𝑎𝑡 𝑡ℎ𝑒 𝑠𝑐ℎ𝑜𝑜𝑙
𝑇𝑜𝑡𝑎𝑙 𝑛𝑢𝑚𝑏𝑒𝑟 𝑜𝑓 𝑠𝑡𝑢𝑑𝑒𝑛𝑡𝑠 𝑎𝑡 𝑡ℎ𝑒 𝑠𝑐ℎ𝑜𝑜𝑙 𝑤𝑖𝑡ℎ 𝑎 𝑚𝑎𝑡ℎ 𝑔𝑟𝑜𝑤𝑡ℎ 𝑠𝑐𝑜𝑟𝑒)
4. School growth scores for all students and for each subgroup are transformed to a 100-point
scale where a score of 80 represents that students, on average, are meeting expected growth
in the school.
For example, the math transformed score is calculated using the following formula:
𝑀𝑎𝑡ℎ𝑎𝑙𝑙 𝑉𝐴𝑆
𝑇𝑟𝑎𝑛𝑠𝑓𝑜𝑟𝑚𝑒𝑑= (35 × 𝑀𝑎𝑡ℎ𝑎𝑙𝑙 𝑉𝐴𝑆) + 80
Determining
Mean School
Combined
ELA/Math
Content VAS
1. The school mean Content VAS score is calculated in a multi-step process. The first step is
to determine a student-level content VAS for each full academic year student (those
students not highly mobile).
a. For students who have only one subject score, the content VAS = subject VAS.
i. If student has only a math VAS then the student’s content VAS = math
VAS.
1. Example: Student A has only a math VAS = 0.22. Therefore,
content VAS for Student A = 0.22
ii. If student has only an ELA VAS then the student’s content VAS = ELA
VAS.
1. Example: Student B has only an ELA VAS = -1.27. Therefore,
content VAS for Student B = -1.27.
b. For students who have both subjects, the student’s content VAS = 𝐸𝐿𝐴 𝑉𝐴𝑆+𝑀𝑎𝑡ℎ 𝑉𝐴𝑆
2
1. Example: Student C has a math VAS = 1.67 and an ELA VAS =
0.86. Therefore, content VAS for Student C = 1.67 + 0.86
2=
2.53
2=
1.265
2. The school mean Content VAS can be calculated by summing the content growth scores of
the full academic year students and dividing the sum by the total number of full academic
year students with combined growth scores. The school level mean Content VAS is
calculated using the following formula:
𝑆𝑐ℎ𝑜𝑜𝑙 𝐶𝑜𝑛𝑡𝑒𝑛𝑡 𝑉𝐴𝑆 = (∑ 𝑐𝑜𝑛𝑡𝑒𝑛𝑡 𝑔𝑟𝑜𝑤𝑡ℎ 𝑠𝑐𝑜𝑟𝑒𝑠
𝑇𝑜𝑡𝑎𝑙 𝑛𝑢𝑚𝑏𝑒𝑟 𝑜𝑓 𝑠𝑡𝑢𝑑𝑒𝑛𝑡𝑠 𝑤𝑖𝑡ℎ 𝑎 𝑐𝑜𝑛𝑡𝑒𝑛𝑡 𝑔𝑟𝑜𝑤𝑡ℎ 𝑠𝑐𝑜𝑟𝑒)
Example:

11
Content Growth Score 𝑆𝑐ℎ𝑜𝑜𝑙 𝐶𝑜𝑛𝑡𝑒𝑛𝑡 𝑉𝐴𝑆
= (𝐶𝑜𝑛𝑡𝑒𝑛𝑡 𝑉𝐴𝑆 𝑠𝑡𝑢𝑑𝑒𝑛𝑡 𝐴 + 𝑐𝑜𝑛𝑡𝑒𝑛𝑡 𝑉𝐴𝑆 𝑠𝑡𝑢𝑑𝑒𝑛𝑡 𝐵 + 𝑐𝑜𝑛𝑡𝑒𝑛𝑡 𝑉𝐴𝑆 𝑠𝑡𝑢𝑑𝑒𝑛𝑡 𝐶
3)
𝑆𝑐ℎ𝑜𝑜𝑙 𝐶𝑜𝑛𝑡𝑒𝑛𝑡 𝑉𝐴𝑆 = (0.22+ −1.27+1.265
3) = (
0.215
3) = 0.0717
3. To include school mean Content VAS in the ESSA School Index, the values must be
transformed to a 100 point scale that will work within the total point scale for the rating
system. A score of ~80 represents expected growth. Content VAS are transformed using
the equation below.
𝐶𝑜𝑛𝑡𝑒𝑛𝑡 𝑉𝐴𝑆 𝑇𝑟𝑎𝑛𝑠𝑓𝑜𝑟𝑚𝑒𝑑
= (35 × 𝐶𝑜𝑛𝑡𝑒𝑛𝑡 𝑉𝐴𝑆) + 80
Example:
𝐶𝑜𝑛𝑡𝑒𝑛𝑡 𝑉𝐴𝑆 𝑇𝑟𝑎𝑛𝑠𝑓𝑜𝑟𝑚𝑒𝑑
= (35 × 0.0717) + 80 = 2.5095 + 80 = 82.5095 = 82.51
Variables in
Final Content
Growth Table
District LEA
District Name
School LEA
School Name
Subgroup
Test Group
Math N
Math School VAS
ELA N
ELA School VAS
Combined Content Growth N (the number of students with math and/or ELA; a score-
single count)
School Content VAS
School Content VAS Transformed
Content VAS Standard Error of the Mean Transformed
Content VAS Lower Confidence Limit Transformed
Content VAS Upper Confidence Limit Transformed
Math VAS Standard Error of the Mean
Math VAS Lower Confidence Limit
Math VAS Upper Confidence Limit
Math VAS Confidence Interval
ELA VAS Standard Error of the Mean
ELA VAS Lower Confidence Limit
ELA VAS Upper Confidence Limit
ELA VAS Confidence Interval
ELP Growth Score Description of
Component or
Indicator
A mean English Language Proficiency value-added growth score (ELP VAS) is obtained for each
school that has one or more English learners. The ELP VAS indicates, on average, the extent to

12
ELP Growth Score which students in the school grew in English Language Proficiency (ELP) compared to what was
expected, accounting for how the student had been progressing in English language in prior years.
Included
Subgroups
1. All Students – All students in the school.
2. White – Student’s race is identified as White and no other race or ethnicity is indicated.
3. African American – Student’s race is identified as African American and no other race or
ethnicity is indicated.
4. Hispanic/Latino(a) – Student’s ethnicity is identified as Hispanic/Latino/a. A student is
designated as Hispanic/Latino(a) regardless of whether any other races are identified for
the student.
5. Economically Disadvantaged – Student is indicated as participating in the Federal Free and
Reduced Price Lunch Program.
6. English Learner – Student is indicated as an English Learner (EL) or student is indicated
as a Former Monitored (EL) (for up to four years after exiting EL services).
7. Student with Disability(ies) – Student is indicated as receiving special education services.
Assessments &
Grade Levels
Included
1. Past Test Included:
ELDA, Grades K - 12
2. Current Test Included:
ELPA21, Grades: K - 12
Student
Observations
Included in
Calculations
1. Student score histories contain from two to five data points: current year ELPA21 scores
and up to four prior years of assessment scores.
2. Scores are standardized by year, grade, and test group to support a growth model
calculation across the different assessments.
3. If a student has more than one ELP score for a given year, the observation with the highest
score for that student will be retained.
4. Scores for students with current grade values of K-12 are included.
5. Demographics of ELs who have assessments in math, ELA, and/or science will be
assigned the demographics from the content test as those have gone through the
corrections process. If no content test exists for the student, demographics from the ELP
assessment will be used.
6. Highly mobile students are included in calculations of student growth scores, but excluded
from aggregations of school level ELP VAS.
Scores for
Students
Excluded from
Calculations
1. Exclude students who do not have a current year test score.
2. Beginning in 2018, exclude home schooled students (Resident Code = 1, 2, 4) if student
state ID and LEA are accurate for match to enrollment data downloaded from TRIAND.
Student ELP
Growth Score
Calculations
1. Current students are matched with their prior years of ELP assessment scores to construct
an ELP score history for the student.
2. Scores are standardized within grade level and test for each year.
3. Standardized scores of students with more than one year of data are put into a mixed
model from which a predicted score and residual (difference between actual score and
predicted score) are calculated from a student’s individual ELP achievement score history.
4. Students’ initial English language proficiency level (values of 1 – 5 for ELDA and values
of 1 – 3 for ELPA21) are included in the model along with the year of their initial
assessment to control for ELs entry language and test given their entry year.
Determining
Mean School ELP
VAS
Repeat the following steps for the all students group and all subgroups.
1. Count the total number of full academic year students with an ELP growth score tested at
each level. This total will serve as the denominator for the mean ELP VAS calculation.
2. Sum ELP growth scores of full academic year students.
3. Determine the school mean ELP VAS by dividing the sum of the ELP growth for full
academic year students by the total number of full academic year students with an ELP
growth score. The ELP growth score is calculated using the following formula:
13
ELP Growth Score
𝐸𝐿𝑃 𝑉𝐴𝑆 = (∑ 𝐸𝐿 𝑔𝑟𝑜𝑤𝑡ℎ 𝑠𝑐𝑜𝑟𝑒𝑠
𝑇𝑜𝑡𝑎𝑙 𝑛𝑢𝑚𝑏𝑒𝑟 𝑠𝑡𝑢𝑑𝑒𝑛𝑡𝑠 𝑤𝑖𝑡ℎ 𝐸𝐿 𝑔𝑟𝑜𝑤𝑡ℎ 𝑆𝑐𝑜𝑟𝑒𝑠)
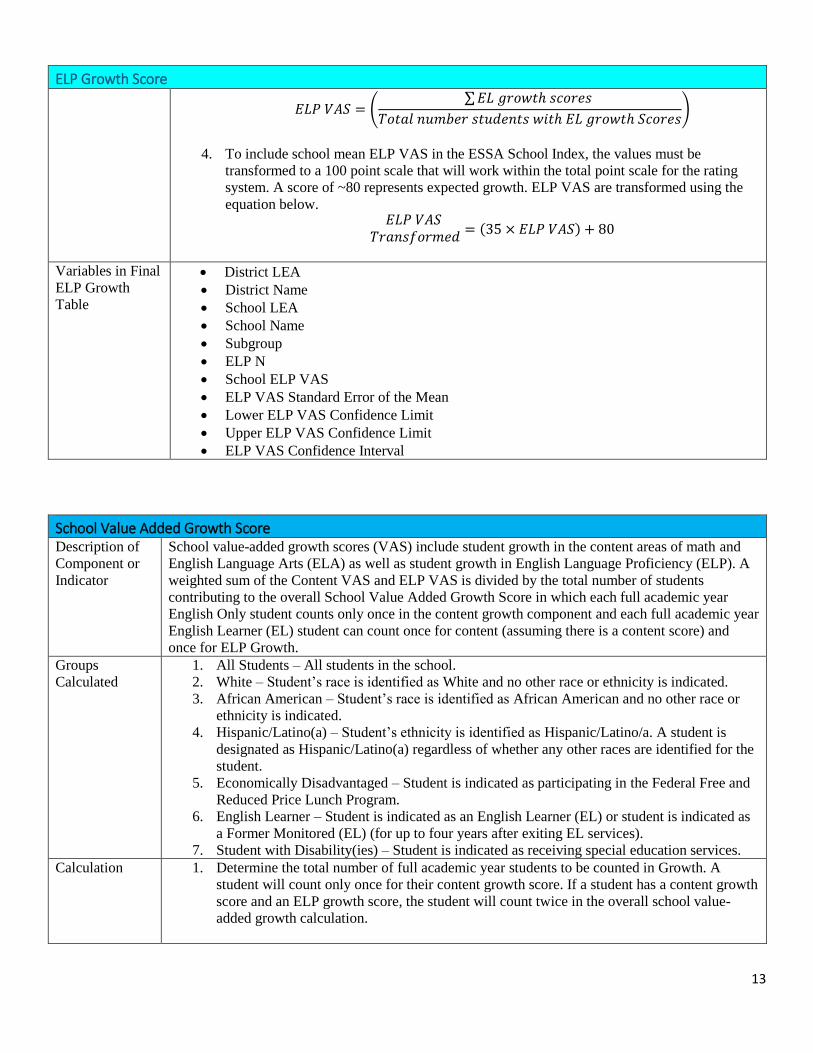
4. To include school mean ELP VAS in the ESSA School Index, the values must be
transformed to a 100 point scale that will work within the total point scale for the rating
system. A score of ~80 represents expected growth. ELP VAS are transformed using the
equation below. 𝐸𝐿𝑃 𝑉𝐴𝑆
𝑇𝑟𝑎𝑛𝑠𝑓𝑜𝑟𝑚𝑒𝑑= (35 × 𝐸𝐿𝑃 𝑉𝐴𝑆) + 80
Variables in Final
ELP Growth
Table
District LEA
District Name
School LEA
School Name
Subgroup
ELP N
School ELP VAS
ELP VAS Standard Error of the Mean
Lower ELP VAS Confidence Limit
Upper ELP VAS Confidence Limit
ELP VAS Confidence Interval
School Value Added Growth Score Description of
Component or
Indicator
School value-added growth scores (VAS) include student growth in the content areas of math and
English Language Arts (ELA) as well as student growth in English Language Proficiency (ELP). A
weighted sum of the Content VAS and ELP VAS is divided by the total number of students
contributing to the overall School Value Added Growth Score in which each full academic year
English Only student counts only once in the content growth component and each full academic year
English Learner (EL) student can count once for content (assuming there is a content score) and
once for ELP Growth.
Groups
Calculated
1. All Students – All students in the school.
2. White – Student’s race is identified as White and no other race or ethnicity is indicated.
3. African American – Student’s race is identified as African American and no other race or
ethnicity is indicated.
4. Hispanic/Latino(a) – Student’s ethnicity is identified as Hispanic/Latino/a. A student is
designated as Hispanic/Latino(a) regardless of whether any other races are identified for the
student.
5. Economically Disadvantaged – Student is indicated as participating in the Federal Free and
Reduced Price Lunch Program.
6. English Learner – Student is indicated as an English Learner (EL) or student is indicated as
a Former Monitored (EL) (for up to four years after exiting EL services).
7. Student with Disability(ies) – Student is indicated as receiving special education services.
Calculation 1. Determine the total number of full academic year students to be counted in Growth. A
student will count only once for their content growth score. If a student has a content growth
score and an ELP growth score, the student will count twice in the overall school value-
added growth calculation.

14
School Value Added Growth Score 𝑁𝑢𝑚𝑏𝑒𝑟 𝑜𝑓 𝑆𝑡𝑢𝑑𝑒𝑛𝑡𝑠
𝑖𝑛 𝐺𝑟𝑜𝑤𝑡ℎ 𝐶𝑎𝑙𝑐𝑢𝑙𝑎𝑡𝑖𝑜𝑛=
#𝑜𝑓 𝑠𝑡𝑢𝑑𝑒𝑛𝑡𝑠 𝑤𝑖𝑡ℎ 𝑎 𝑐𝑜𝑚𝑏𝑖𝑛𝑒𝑑𝑐𝑜𝑛𝑡𝑒𝑛𝑡 𝑔𝑟𝑜𝑤𝑡ℎ 𝑠𝑐𝑜𝑟𝑒
+#𝑜𝑓 𝑠𝑡𝑢𝑑𝑒𝑛𝑡𝑠 𝑤𝑖𝑡ℎ
𝑎𝑛 𝐸𝐿𝑃 𝐺𝑟𝑜𝑤𝑡ℎ 𝑆𝑐𝑜𝑟𝑒
2. Calculate the School Value-added Growth Score with a weighted average of combined
content growth and ELP growth.
𝑆𝑐ℎ𝑜𝑜𝑙 𝑉𝑎𝑙𝑢𝑒𝐴𝑑𝑑𝑒𝑑 𝐺𝑟𝑜𝑤𝑡ℎ
=
#𝑖𝑛 𝐶𝑜𝑚𝑏𝑖𝑛𝑒𝑑 𝐶𝑜𝑛𝑡𝑒𝑛𝑡 𝐺𝑟𝑜𝑤𝑡ℎ
(𝑇𝑟𝑎𝑛𝑠𝑓𝑜𝑟𝑚𝑒𝑑 𝑆𝑐ℎ𝑜𝑜𝑙 𝐶𝑜𝑛𝑡𝑒𝑛𝑡 𝐺𝑟𝑜𝑤𝑡ℎ 𝑆𝑐𝑜𝑟𝑒
) +#𝑖𝑛 𝐸𝐿𝑃𝐺𝑟𝑜𝑤𝑡ℎ
(𝑇𝑟𝑎𝑛𝑠𝑓𝑜𝑟𝑚𝑒𝑑 𝑆𝑐ℎ𝑜𝑜𝑙
𝐸𝐿𝑃 𝐺𝑟𝑜𝑤𝑡ℎ 𝑆𝑐𝑜𝑟𝑒)
# 𝑖𝑛 𝐶𝑜𝑚𝑏𝑖𝑛𝑒𝑑 𝐶𝑜𝑛𝑒𝑛𝑡 𝐺𝑟𝑜𝑤𝑡ℎ + # 𝑖𝑛 𝐸𝐿𝑃 𝐺𝑟𝑜𝑤𝑡ℎ
3. Calculate a two-year* weighted average of the School Valued-added Growth Score to be
used for schools who have less than 15 students in the Growth Calculation.
𝑁𝑢𝑚𝑏𝑒𝑟 𝑜𝑓 𝑆𝑡𝑢𝑑𝑒𝑛𝑡𝑠
𝑖𝑛 2𝑦𝑟 𝐺𝑟𝑜𝑤𝑡ℎ 𝐶𝑎𝑙𝑐𝑢𝑙𝑎𝑡𝑖𝑜𝑛=
𝑁𝑢𝑚𝑏𝑒𝑟 𝑜𝑓 𝑆𝑡𝑢𝑑𝑒𝑛𝑡𝑠𝑖𝑛 2016 𝐺𝑟𝑜𝑤𝑡ℎ 𝐶𝑎𝑙𝑐𝑢𝑙𝑎𝑡𝑖𝑜𝑛
+𝑁𝑢𝑚𝑏𝑒𝑟 𝑜𝑓 𝑆𝑡𝑢𝑑𝑒𝑛𝑡𝑠
𝑖𝑛 2017 𝐺𝑟𝑜𝑤𝑡ℎ 𝐶𝑎𝑙𝑐𝑢𝑙𝑎𝑡𝑖𝑜𝑛
𝑆𝑐ℎ𝑜𝑜𝑙 2 𝑦𝑟 𝑉𝑎𝑙𝑢𝑒
𝐴𝑑𝑑𝑒𝑑 𝐺𝑟𝑜𝑤𝑡ℎ=
𝑁𝑢𝑚𝑏𝑒𝑟 𝑜𝑓 𝑆𝑡𝑢𝑑𝑒𝑛𝑡𝑠 𝑖𝑛2016 𝐺𝑟𝑜𝑤𝑡ℎ 𝐶𝑎𝑙𝑐𝑢𝑙𝑎𝑡𝑖𝑜𝑛
(2016 𝑆𝑐ℎ𝑜𝑜𝑙 𝑉𝑎𝑙𝑢𝑒
𝐴𝑑𝑑𝑒𝑑 𝐺𝑟𝑜𝑤𝑡ℎ) +
𝑁𝑢𝑚𝑏𝑒𝑟 𝑜𝑓 𝑆𝑡𝑢𝑑𝑒𝑛𝑡𝑠 𝑖𝑛2017 𝐺𝑟𝑜𝑤𝑡ℎ 𝐶𝑎𝑙𝑐𝑢𝑙𝑎𝑡𝑖𝑜𝑛
(2017 𝑆𝑐ℎ𝑜𝑜𝑙 𝑉𝑎𝑙𝑢𝑒
𝐴𝑑𝑑𝑒𝑑 𝐺𝑟𝑜𝑤𝑡ℎ)
𝑁𝑢𝑚𝑏𝑒𝑟 𝑜𝑓 𝑆𝑡𝑢𝑑𝑒𝑛𝑡𝑠 𝑖𝑛 2𝑦𝑟 𝐺𝑟𝑜𝑤𝑡ℎ 𝐶𝑎𝑙𝑐𝑢𝑙𝑎𝑡𝑖𝑜𝑛
*Starting with the 2017-2018 school year, when the All Students group has fewer than 15 students, a
three-year weighted average will be used for the School Value-added Growth Score.
Graduation - 4 year Adjusted Cohort Description of
Component or
Indicator
Students are expected to graduate within four years. A student will be identified for an adjusted
cohort group by the year the student is first enrolled as a ninth grade student. Early graduates will be
credited to the four-year adjusted cohort group created in which the student enrolled as a ninth grade
student.
Included
Subgroups
1. All Students – All students in the school.
2. White – Student’s race is identified as White and no other race or ethnicity is indicated.
3. African American – Student’s race is identified as African American and no other race or
ethnicity is indicated.
4. Hispanic/Latino(a) – Student’s ethnicity is identified as Hispanic/Latino/a. A student is
designated as Hispanic/Latino(a) regardless of whether any other races are identified for the
student.
5. Economically Disadvantaged – Student is indicated as participating in the Federal Free and
Reduced Price Lunch Program.
6. English Learner – Student is indicated as an English Learner (EL) or student is indicated as a
Former Monitored (EL) (for up to four years after exiting EL services).
7. Student with Disability(ies) – Student is indicated as receiving special education services.
Excluded
Students
Students are removed from a school’s cohort if the student meets the definition of a transfer as per
USDE Guidance Question B-3 on page 16.
https://www2.ed.gov/policy/elsec/leg/essa/essagradrateguidance.pdf
A transfer out of a cohort occurs when a student leaves a high school and enrolls in another high
school or in an educational program from which the student is expected to receive a regular high
school diploma or State-defined alternate diploma that meets the requirements described in question
A16.
A State may not count as a transfer a student who is retained in grade, enrolls in a general
equivalency diploma program, is transferred to a prison or juvenile facility that does not
provide (or from which the student is not expected to receive) a regular high school diploma or

15
Graduation - 4 year Adjusted Cohort a State defined alternate diploma that meets the requirements described in question A-16, or
leaves high school for any other reason in the four-year or extended-year graduation rate; such
students must remain in the adjusted cohort (i.e., must be included in the denominator of the
graduation rate for that cohort). (ESEA section 8101(23)(C) and (25)(C); 34 C.F.R. §
200.34(b)(2)-(3)).
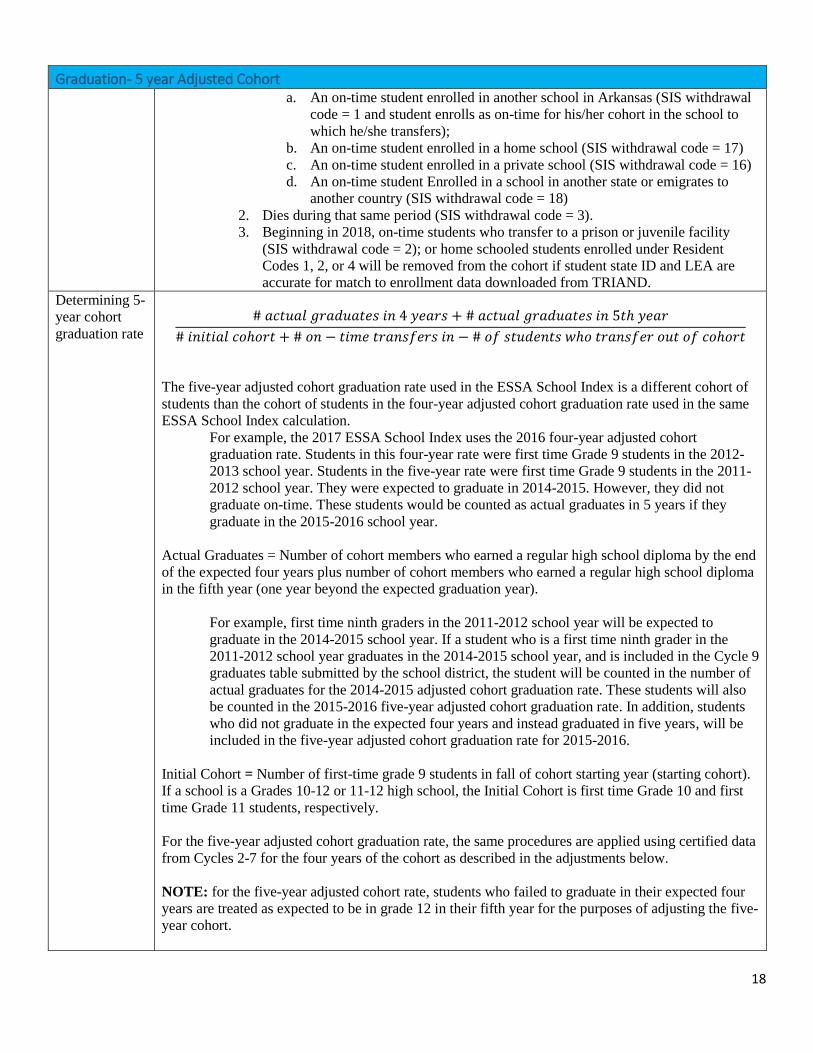
Transfers out;
a. An on-time student enrolled in another school in Arkansas (SIS withdrawal code = 1
and student enrolls as on-time for his/her cohort in the school to which he/she
transfers);
b. An on-time student enrolled in a home school (SIS withdrawal code = 17)
c. An on-time student enrolled in a private school (SIS withdrawal code = 16)
d. An on-time student Enrolled in a school in another state or emigrates to another
country (SIS withdrawal code = 18)
Dies during that same period (SIS withdrawal code = 3).
Beginning in 2018, on-time students who transfer to a prison or juvenile facility (SIS
withdrawal code = 2); or home schooled students enrolled under Resident Codes 1, 2, or 4
will be removed from the cohort if student state ID and LEA are accurate for match to
enrollment data downloaded from TRIAND.
Determining 4-
year cohort
graduation rate
# 𝑎𝑐𝑡𝑢𝑎𝑙 𝑔𝑟𝑎𝑑𝑢𝑎𝑡𝑒𝑠 (𝑎𝑠 𝑟𝑒𝑝𝑜𝑟𝑡𝑒𝑑 𝑖𝑛 𝐶𝑦𝑐𝑙𝑒 9 𝐺𝑟𝑎𝑑𝑢𝑎𝑡𝑒𝑠 𝑡𝑎𝑏𝑙𝑒)
# 𝑖𝑛𝑖𝑡𝑖𝑎𝑙 𝑐𝑜ℎ𝑜𝑟𝑡 + # 𝑜𝑛𝑡𝑖𝑚𝑒 𝑡𝑟𝑎𝑛𝑠𝑓𝑒𝑟𝑠 𝑖𝑛 − # 𝑜𝑓 𝑠𝑡𝑢𝑑𝑒𝑛𝑡𝑠 𝑤ℎ𝑜 𝑡𝑟𝑎𝑛𝑠𝑓𝑒𝑟 𝑜𝑢𝑡 𝑜𝑓 𝑐𝑜ℎ𝑜𝑟𝑡
Actual Graduates = Number of cohort members who earned a regular high school diploma by the end
of the school year four years after the year the cohort was established.
For example, first time ninth graders in the 2012-2013 school year will be expected to
graduate in the 2015-2016 school year. If a student who is a first time ninth grader in the
2012-2013 school year graduates in the 2015-2016 school year, and is included in the Cycle
9 graduates table submitted by the school district, the student will be counted in the number
of actual graduates.
Initial Cohort = Number of first-time grade 9 students in fall of cohort starting year (starting cohort).
If a school is configured as a Grades 10-12 or 11-12 high school, the Initial Cohort is the first time
Grade 10 and first time Grade 11 students, respectively.
Adjustments = The Initial cohort is adjusted by the number of students who transfer in during the
four school years (three years for Grades 10-12 and two years for Grades 11-12 schools) of the
cohort and the number of students who transfer out, emigrate to another country, transfer to a prison
or juvenile facility, or die during the four schools years for the cohort.
Certified data from Cycles 2 – 7 are used to adjust the cohort for transfers in and transfers out.
Students’ School LEAs in the adjusted cohort are the School LEAs where the students were last
considered on-time based on grade level and expected progression from entry in the cohort.
First time Grade 9 students are expected to be in grades 10, 11, and 12 in the three
successive years of their cohort. For Grades 10-12 schools, first time Grade 10 students are
expected to progress to grades 11 and 12 in the successive two years. For Grades 11-12
schools, first time Grade 11 students are expected to progress to Grade 12 in their second
year in the cohort.
Grade level of the student in each cycle is used to determine if a student transfers in ‘on-
time’. A student can fall behind and catch up within the same year or across multiple years.

16
Graduation - 4 year Adjusted Cohort If a student transfers into a school and appears to have repeated a grade, based on grade level
in initial cohort and expected grade level at transfer in, then the student is no longer on-time
and is not added to the school’s cohort to which the student transfers. Instead, the student is
retained in the school cohort in which the student was last on-time as indicated by whether
the grade level of the student meets or exceeds the expected grade-level.
If a student repeats a grade or falls behind within the same school year and later catches up,
and that student transfers into another school at the grade level expected based on the
student’s entry into the new school, then the student is removed from the former cohort and
added to the transfer school’s cohort as an on-time transfer.
Early graduates should be properly coded as early graduates and counted in the cohort that is
the students’ first on-time Grade 9 (schools with Grades 9-12), first on-time Grade 10
(schools with Grades 10-12), or first on-time Grade 11 (schools with Grades 11-12). Early
graduates are not counted in the year they graduate as they are not part of that particular
adjusted cohort.
Note: for Grades 10-12 schools, the cohort is determined by first time tenth graders. If a
student repeated ninth grade and enrolls in a Grade 10-12 school as a first time tenth grader,
the student becomes part of the Grades 10-12 school’s cohort. The same is true for students
in Grades 11-12 schools. The student is considered an on-time student in the school’s cohort
if they are first time eleventh grader, regardless of whether the student repeated Grade 9
and/or Grade 10.
Actual Graduates are those students listed as graduated in the certified Cycle 9 Graduates
table for the year of expected graduation for cohort. The TRIAND transcript system is not
used to pull graduation status of students in the initial calculation of the adjusted cohort
graduation rate. Only certified Cycle 9 data are used.
Determining a
three-year 4-
year cohort
graduation rate
for schools who
did not have at
least 15
students
expected to
graduate in
2016.
If a school has fewer than 15 students in the expected graduates of the 4-year adjusted cohort then a
three-year weighted average of the 4 Yr. Adjusted Cohort Graduation Rates is calculated using the
following formula.
3𝑌𝑟. 𝑊𝑒𝑖𝑔ℎ𝑡𝑒𝑑 𝐴𝑣𝑒.
𝐴𝐶𝐺𝑅 𝑓𝑜𝑟 2016=
# 𝑖𝑛 2014 𝐶𝑜ℎ𝑜𝑟𝑡 (𝐴𝐶𝐺𝑅14) + # 𝑖𝑛 2015 𝐶𝑜ℎ𝑜𝑟𝑡 (𝐴𝐶𝐺𝑅15) + # 𝑖𝑛 2016 𝐶𝑜ℎ𝑜𝑟𝑡 (𝐴𝐶𝐺𝑅16)
# 𝑖𝑛 2014 𝐶𝑜ℎ𝑜𝑟𝑡 + # 𝑖𝑛 2015 𝐶𝑜ℎ𝑜𝑟𝑡 + # 𝑖𝑛 2016 𝐶𝑜ℎ𝑜𝑟𝑡
EXAMPLE
3𝑌𝑟. 𝑊𝑒𝑖𝑔ℎ𝑡𝑒𝑑 𝐴𝑣𝑒𝑟𝑎𝑔𝑒𝐴𝐶𝐺𝑅 𝑓𝑜𝑟 2016
= 15 𝑖𝑛 2014 𝐶𝑜ℎ𝑜𝑟𝑡 (89.00) + 11 𝑖𝑛 2015 𝐶𝑜ℎ𝑜𝑟𝑡 (95.00) + 7 𝑖𝑛 2016 𝐶𝑜ℎ𝑜𝑟𝑡 (100.00)
15 𝑖𝑛 2014 𝐶𝑜ℎ𝑜𝑟𝑡 + 11 𝑖𝑛 2015 𝐶𝑜ℎ𝑜𝑟𝑡 + 7𝑖𝑛 2016 𝐶𝑜ℎ𝑜𝑟𝑡
3𝑌𝑟. 𝑊𝑒𝑖𝑔ℎ𝑡𝑒𝑑 𝐴𝑣𝑒𝑟𝑎𝑔𝑒 𝐴𝐶𝐺𝑅 𝑓𝑜𝑟 2016 = 1335 + 1045 + 700
33
3𝑌𝑟. 𝑊𝑒𝑖𝑔ℎ𝑡𝑒𝑑 𝐴𝑣𝑒𝑟𝑎𝑔𝑒 𝐴𝐶𝐺𝑅 𝑓𝑜𝑟 2016 = 3080
33
3𝑌𝑟. 𝑊𝑒𝑖𝑔ℎ𝑡𝑒𝑑 𝐴𝑣𝑒𝑟𝑎𝑔𝑒 𝐴𝐶𝐺𝑅 𝑓𝑜𝑟 2016 = 93.33
Variables in
Final Four-Year District LEA
District Name
School LEA

17
Graduation - 4 year Adjusted Cohort Graduation
Table School Name
Subgroup
N Actual Graduates 2016
N Expected Graduates 2016
Graduation Rate 2016
N Actual Graduates 2015
N Expected Graduates 2015
Graduation Rate 2015
N Actual Graduates 2014
N Expected Graduates 2014
Graduation Rate 2014
3 Yr N Actual Graduates
3 Yr N Expected Graduates
3 Yr Graduation Rate
Graduation- 5 year Adjusted Cohort Description of
Component or
Indicator
Students will be identified for an adjusted cohort group by the year the student is first enrolled as a
Grade 9 student. Students that graduate in five years, one year following the expected graduation
date, will be counted in the five-year adjusted cohort graduation rate as a successful graduate. This
new graduation rate that includes the 5-year graduates is considered the 5-year graduation rate.
Included
Subgroups
1. All Students – All students in the school.
2. White – Student’s race is identified as White and no other race or ethnicity is indicated.
3. African American – Student’s race is identified as African American and no other race or
ethnicity is indicated.
4. Hispanic/Latino(a) – Student’s ethnicity is identified as Hispanic/Latino/a. A student is
designated as Hispanic/Latino(a) regardless of whether any other races are identified for the
student.
5. Economically Disadvantaged – Student is indicated as participating in the Federal Free and
Reduced Price Lunch Program.
6. English Learner – Student is indicated as an English Learner (EL) or student is indicated as a
Former Monitored (EL) (for up to four years after exiting EL services).
7. Student with Disability(ies) – Student is indicated as receiving special education services.
Excluded
Students
Students are removed from a school’s cohort if the student meets the definition of a transfer as per
USDE Guidance Question B-3 on page 16.
https://www2.ed.gov/policy/elsec/leg/essa/essagradrateguidance.pdf
A transfer out of a cohort occurs when a student leaves a high school and enrolls in another high
school or in an educational program from which the student is expected to receive a regular high
school diploma or State-defined alternate diploma that meets the requirements described in question
A16.
A State may not count as a transfer a student who is retained in grade, enrolls in a general
equivalency diploma program, is transferred to a prison or juvenile facility that does not
provide (or from which the student is not expected to receive) a regular high school diploma or
a State defined alternate diploma that meets the requirements described in question A-16, or
leaves high school for any other reason in the four-year or extended-year graduation rate; such
students must remain in the adjusted cohort (i.e., must be included in the denominator of the
graduation rate for that cohort). (ESEA section 8101(23)(C) and (25)(C); 34 C.F.R. §
200.34(b)(2)-(3)).
1. Transfers out;
18
Graduation- 5 year Adjusted Cohort a. An on-time student enrolled in another school in Arkansas (SIS withdrawal
code = 1 and student enrolls as on-time for his/her cohort in the school to
which he/she transfers);
b. An on-time student enrolled in a home school (SIS withdrawal code = 17)
c. An on-time student enrolled in a private school (SIS withdrawal code = 16)
d. An on-time student Enrolled in a school in another state or emigrates to
another country (SIS withdrawal code = 18)
2. Dies during that same period (SIS withdrawal code = 3).
3. Beginning in 2018, on-time students who transfer to a prison or juvenile facility
(SIS withdrawal code = 2); or home schooled students enrolled under Resident
Codes 1, 2, or 4 will be removed from the cohort if student state ID and LEA are
accurate for match to enrollment data downloaded from TRIAND.
Determining 5-
year cohort
graduation rate
# 𝑎𝑐𝑡𝑢𝑎𝑙 𝑔𝑟𝑎𝑑𝑢𝑎𝑡𝑒𝑠 𝑖𝑛 4 𝑦𝑒𝑎𝑟𝑠 + # 𝑎𝑐𝑡𝑢𝑎𝑙 𝑔𝑟𝑎𝑑𝑢𝑎𝑡𝑒𝑠 𝑖𝑛 5𝑡ℎ 𝑦𝑒𝑎𝑟
# 𝑖𝑛𝑖𝑡𝑖𝑎𝑙 𝑐𝑜ℎ𝑜𝑟𝑡 + # 𝑜𝑛 − 𝑡𝑖𝑚𝑒 𝑡𝑟𝑎𝑛𝑠𝑓𝑒𝑟𝑠 𝑖𝑛 − # 𝑜𝑓 𝑠𝑡𝑢𝑑𝑒𝑛𝑡𝑠 𝑤ℎ𝑜 𝑡𝑟𝑎𝑛𝑠𝑓𝑒𝑟 𝑜𝑢𝑡 𝑜𝑓 𝑐𝑜ℎ𝑜𝑟𝑡
The five-year adjusted cohort graduation rate used in the ESSA School Index is a different cohort of
students than the cohort of students in the four-year adjusted cohort graduation rate used in the same
ESSA School Index calculation.
For example, the 2017 ESSA School Index uses the 2016 four-year adjusted cohort
graduation rate. Students in this four-year rate were first time Grade 9 students in the 2012-
2013 school year. Students in the five-year rate were first time Grade 9 students in the 2011-
2012 school year. They were expected to graduate in 2014-2015. However, they did not
graduate on-time. These students would be counted as actual graduates in 5 years if they
graduate in the 2015-2016 school year.
Actual Graduates = Number of cohort members who earned a regular high school diploma by the end
of the expected four years plus number of cohort members who earned a regular high school diploma
in the fifth year (one year beyond the expected graduation year).
For example, first time ninth graders in the 2011-2012 school year will be expected to
graduate in the 2014-2015 school year. If a student who is a first time ninth grader in the
2011-2012 school year graduates in the 2014-2015 school year, and is included in the Cycle 9
graduates table submitted by the school district, the student will be counted in the number of
actual graduates for the 2014-2015 adjusted cohort graduation rate. These students will also
be counted in the 2015-2016 five-year adjusted cohort graduation rate. In addition, students
who did not graduate in the expected four years and instead graduated in five years, will be
included in the five-year adjusted cohort graduation rate for 2015-2016.
Initial Cohort = Number of first-time grade 9 students in fall of cohort starting year (starting cohort).
If a school is a Grades 10-12 or 11-12 high school, the Initial Cohort is first time Grade 10 and first
time Grade 11 students, respectively.
For the five-year adjusted cohort graduation rate, the same procedures are applied using certified data
from Cycles 2-7 for the four years of the cohort as described in the adjustments below.
NOTE: for the five-year adjusted cohort rate, students who failed to graduate in their expected four
years are treated as expected to be in grade 12 in their fifth year for the purposes of adjusting the five-
year cohort.

19
Graduation- 5 year Adjusted Cohort Adjustments = Initial cohort is adjusted by the number of students who transfer in during the first
four school years (first three years for Grades 10-12 and first two years for Grades 11-12 schools) of
the cohort and the number of students who transfer out, emigrate to another country, transfer to a
prison or juvenile facility, or die during the four schools years for the cohort.
Certified data from Cycles 2 – 7 are used to adjust the cohort for transfers in and transfers out.
Students’ School LEAs in the adjusted cohort is the School LEA where the students were last
considered on-time based on grade level and expected progression from entry in the cohort.
First time Grade 9 students are expected to be in grades 10, 11, and 12 in the three successive
years of their cohort. For Grades 10-12 schools, first time Grade 10 students are expected to
progress to grades 11 and 12 in the successive two years. For Grades 11-12 schools, first time
Grade 11 students are expected to progress to grade 12 in their second year in the cohort. If
the student fails to graduate in four years and is enrolled in, or transfers into, a school in the
fifth year for their cohort the student is counted in the five-year adjusted cohort of students
expected to graduate in five years.
Grade level of the student in each cycle is used to determine if a student transfers in ‘on-
time’. A student can fall behind and catch up within the same year or across multiple years.
If a student transfers into a school and appears to have repeated a grade, based on grade level
in initial cohort and expected grade level at transfer in, then the student is no longer on-time
and is not added to the school’s cohort to which the student transfers. Instead, the student is
retained in the school cohort in which the student was last on-time as indicated by whether
the grade level of the student meets or exceeds the expected grade-level.
If a student repeats a grade or falls behind within the same school year and later catches up,
and that student transfers into another school at the grade level expected based on the
student’s entry into the new school, then the student is removed from the former cohort and
added to the transfer school’s cohort as an on-time transfer. For students who fail to graduate
in four years, the student is treated as expected to be in Grade 12 in their fifth year.
Therefore, if a student transfers into a school in their fifth year as a Grade 12 student the
student is added to the school’s five-year adjusted cohort. If the student graduates at the end
of that year, the student is added as a five-year actual graduate.
Early graduates should be properly coded as early graduates and counted in the cohort that is
the students’ first on-time grade 9 (schools with Grades 9-12), first on-time grade 10 (schools
with Grades 10-12), or first on-time grade 11 (schools with Grades 11-12). Early graduates
are not counted in the year they graduate as they are not part of that particular adjusted
cohort.
Note: for Grades 10-12 schools, the cohort is determined by first time tenth graders. If a
student repeated ninth grade and enrolls in a Grade 10-12 school as a first time tenth grader,
the student becomes part of the Grades 10-12 school’s cohort. The same is true for students in
Grades 11-12 schools. The student is considered an on-time student in the school’s cohort if
they are first time eleventh grader, regardless of whether the student repeated grade 9 and/or
grade 10.
Actual Graduates are those students listed as graduated in the certified Cycle 9 Graduates
table for the four-year adjusted cohort plus students who graduate one year after their
expected graduation year for their cohort. The TRIAND transcript system is not used to pull
graduation status of students in the initial calculation of the adjusted cohort graduation rate.
Only certified Cycle 9 data are used.
Determining a
three-year 5-
year cohort
graduation rate
3𝑌𝑟. 𝑊𝑒𝑖𝑔ℎ𝑡𝑒𝑑 𝐴𝑣𝑒.𝐴𝐶𝐺𝑅 𝑓𝑜𝑟 2016
= # 𝑖𝑛 2014 𝐶𝑜ℎ𝑜𝑟𝑡 (𝐴𝐶𝐺𝑅14) + # 𝑖𝑛 2015 𝐶𝑜ℎ𝑜𝑟𝑡 (𝐴𝐶𝐺𝑅15) + # 𝑖𝑛 2016 𝐶𝑜ℎ𝑜𝑟𝑡 (𝐴𝐶𝐺𝑅16)
# 𝑖𝑛 2014 𝐶𝑜ℎ𝑜𝑟𝑡 + # 𝑖𝑛 2015 𝐶𝑜ℎ𝑜𝑟𝑡 + # 𝑖𝑛 2016 𝐶𝑜ℎ𝑜𝑟𝑡

20
Graduation- 5 year Adjusted Cohort for schools
who did not
have at least 15
expected
graduates by
2016
EXAMPLE
3𝑌𝑟. 𝑊𝑒𝑖𝑔ℎ𝑡𝑒𝑑 𝐴𝑣𝑒𝑟𝑎𝑔𝑒
𝑜𝑓 𝑡ℎ𝑒 𝑓𝑖𝑣𝑒 − 𝑦𝑒𝑎𝑟 𝐴𝐶𝐺𝑅 𝑓𝑜𝑟 2016
= 12 𝑖𝑛 2014 5𝑦𝑟 𝐶𝑜ℎ𝑜𝑟𝑡 (84.00) + 11 𝑖𝑛 2015 5𝑦𝑟 𝐶𝑜ℎ𝑜𝑟𝑡 (93.00) + 12 𝑖𝑛 2016 5𝑦𝑟 𝐶𝑜ℎ𝑜𝑟𝑡 (100.00)
12 𝑖𝑛 5𝑦𝑟 2014 𝐶𝑜ℎ𝑜𝑟𝑡 + 11 𝑖𝑛 5𝑦𝑟 2015 𝐶𝑜ℎ𝑜𝑟𝑡 + 12 𝑖𝑛 2016 5𝑦𝑟 𝐶𝑜ℎ𝑜𝑟𝑡
3𝑌𝑟. 𝑊𝑒𝑖𝑔ℎ𝑡𝑒𝑑 𝐴𝑣𝑒𝑟𝑎𝑔𝑒 𝑜𝑓 𝑡ℎ𝑒 𝑓𝑖𝑣𝑒 − 𝑦𝑒𝑎𝑟 𝐴𝐶𝐺𝑅 𝑓𝑜𝑟 2016 = 1008 + 1023 + 1200
35
3𝑌𝑟. 𝑊𝑒𝑖𝑔ℎ𝑡𝑒𝑑 𝐴𝑣𝑒𝑟𝑎𝑔𝑒 𝑜𝑓 𝑡ℎ𝑒 𝑓𝑖𝑣𝑒 − 𝑦𝑒𝑎𝑟 𝐴𝐶𝐺𝑅 𝑓𝑜𝑟 2016 = 3231
35
3𝑌𝑟. 𝑊𝑒𝑖𝑔ℎ𝑡𝑒𝑑 𝐴𝑣𝑒𝑟𝑎𝑔𝑒 𝑓𝑜𝑟 𝑡ℎ𝑒 𝑓𝑖𝑣𝑒 − 𝑦𝑒𝑎𝑟 𝐴𝐶𝐺𝑅 𝑓𝑜𝑟 2016 = 92.31
Variables in
Final Five-
Year
Graduation
Table
District LEA
District Name
School LEA
School Name
Subgroup
N Actual Graduates 2016 (5 yr)
N Expected Graduates 2016 (5 yr)
Graduation Rate 2016 (5 yr)
N Actual Graduates 2015 (5 yr)
N Expected Graduates 2015 (5 yr)
Graduation Rate 2015 (5 yr)
N Actual Graduates 2014 (5 yr)
N Expected Graduates 2014 (5 yr)
Graduation Rate 2014 (5 yr)
3 Yr N Actual Graduates (5 yr)
3 Yr N Expected Graduates (5 yr)
3 Yr Graduation Rate (5 yr)
School Quality and Student Success Indicator
The School Quality and Student Success (SQSS) Indicator is composed of a number of different components.
The components are calculated as the percentage of points earned out of points possible per student. This
provides comparability among schools statewide. Points per student are earned by schools for each component
that applies to the grades served by the school. The points earned and points possible are summed across all
indicators and the percentage of points earned is calculated for SQSS for the school. The following sections
describe the calculation for each component of SQSS.
Student Engagement Component Description of
Component or
Indicator
Using student-level attendance and student absenteeism risk level as proxy for student
engagement.
Included
Subgroups
1. All Students – All students in the school. (Cycle 7)

21
Student Engagement Component 2. White – Student’s race is identified as White and no other race or ethnicity is indicated.
(Cycle 7)
3. African American – Student’s race is identified as African American and no other race or
ethnicity is indicated(Cycle 7)
4. Hispanic/Latino(a) – Student’s ethnicity is identified as Hispanic/Latino/a. A student is
designated as Hispanic/Latino(a) regardless of whether any other races are identified for
the student. (Cycle 7)
5. Economically Disadvantaged – Student is indicated as participating in the Federal Free
and Reduced Price Lunch Program. (Cycle 7)
6. English Learner – Student is indicated as an English Learner (EL) or student is indicated
as a Former Monitored (EL) (for up to four years after exiting EL services). (Cycle 7)
7. Student with Disability(ies) – Student is indicated as receiving special education services.
(Cycle 2 for 16-17)
Included Students Grades K - 11 students enrolled at each school--certified in cycle 7 of the statewide information
system data collection schedule (June 15) each school year. This is the denominator of the
student engagement component and is comparable for schools across the state. The following
conditions are applied to the students included in the calculation.
Mobile students are included.
Students who were enrolled for a minimum of 10 days.
If a student was enrolled in multiple schools during the school year, the student would be
included in each school.
For juvenile justice school (DYS) and department of health services schools, students
must have been enrolled for a minimum of 60 days.
Excluded Students 1. Beginning in 2018, exclude home schooled students (Resident Code = 1, 2, 4) if student
state ID and LEA are accurate for match to enrollment data downloaded from TRIAND.
Student Level
Chronic Absence
Calculations
1. Calculate attendance rate for each student at each school, which is (total present days) /
(total present days + total absent days).
2. Determine risk level for chronic absence for each student at each school.
a. Students absent 0-less than 5% of days enrolled considered low risk and assigned
1 point.
b. Students absent 5% to less than 10% of days enrolled considered moderate risk
and assigned 0.5 points.
c. Students absent 10% or more of days enrolled considered high risk for chronic
absence and assigned 0 points.
Calculate percent
of points earned
per student for risk
level related to
Chronic Absence
1. Determine the school-level points earned per student for student engagement.
a. School-level points earned for student engagement = Sum of points earned per
student for absence risk level / number of students enrolled
𝑆𝑐ℎ𝑜𝑜𝑙 𝐸𝑛𝑔𝑎𝑔𝑒𝑚𝑒𝑛𝑡 𝑃𝑜𝑖𝑛𝑡𝑠 = ∑ 𝑃𝑜𝑖𝑛𝑡𝑠 𝐸𝑎𝑟𝑛𝑒𝑑 𝑃𝑒𝑟 𝑆𝑡𝑢𝑑𝑒𝑛𝑡 𝐸𝑛𝑟𝑜𝑙𝑙𝑒𝑑
𝑁𝑢𝑚𝑏𝑒𝑟 𝑜𝑓 𝑆𝑡𝑢𝑑𝑒𝑛𝑡𝑠 𝐸𝑛𝑟𝑜𝑙𝑙𝑒𝑑
Variables related to
Chronic Absence Number of Students Enrolled in School (Cycle 7 Certified Submission)
Days Absent and Days Present for Enrolled Students (Cycles 3, 5, 6,7)
Student Absence Risk Level: Low, Moderate, High
Number of Points Possible for Student Engagement (Number of student enrolled)
Number of Points Earned Per Student for Engagement (sum of points for risk level of
students)
22
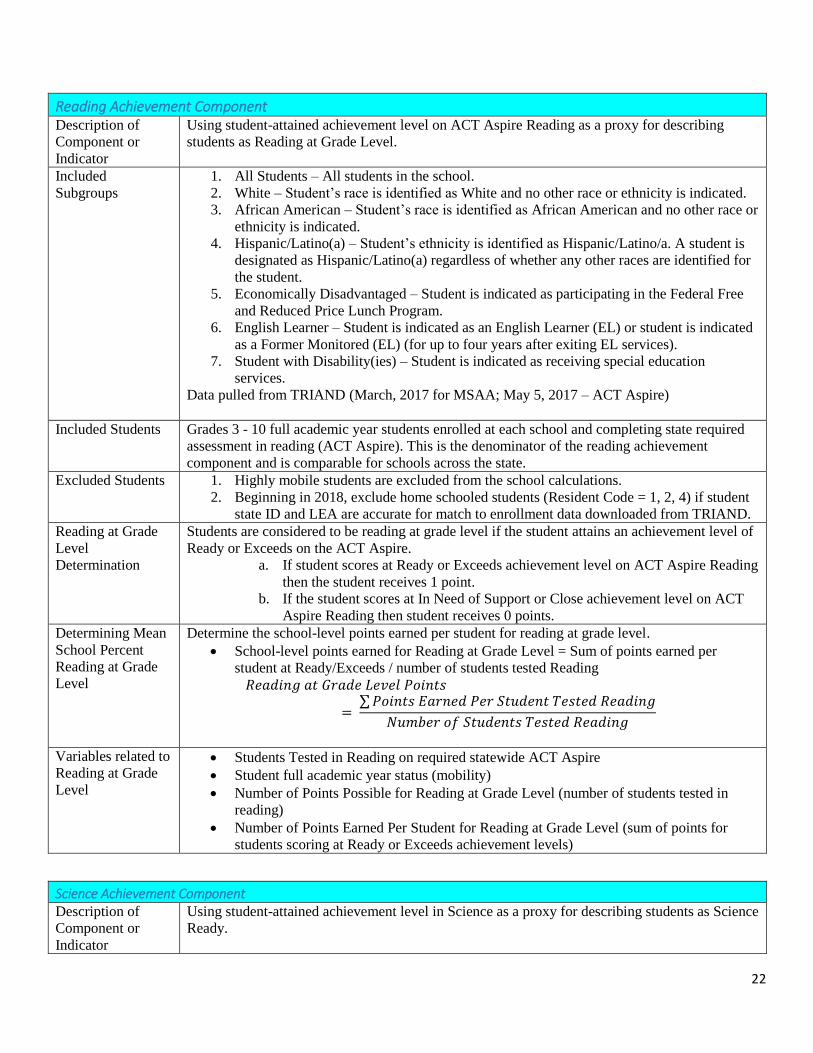
Reading Achievement Component Description of
Component or
Indicator
Using student-attained achievement level on ACT Aspire Reading as a proxy for describing
students as Reading at Grade Level.
Included
Subgroups
1. All Students – All students in the school.
2. White – Student’s race is identified as White and no other race or ethnicity is indicated.
3. African American – Student’s race is identified as African American and no other race or
ethnicity is indicated.
4. Hispanic/Latino(a) – Student’s ethnicity is identified as Hispanic/Latino/a. A student is
designated as Hispanic/Latino(a) regardless of whether any other races are identified for
the student.
5. Economically Disadvantaged – Student is indicated as participating in the Federal Free
and Reduced Price Lunch Program.
6. English Learner – Student is indicated as an English Learner (EL) or student is indicated
as a Former Monitored (EL) (for up to four years after exiting EL services).
7. Student with Disability(ies) – Student is indicated as receiving special education
services.
Data pulled from TRIAND (March, 2017 for MSAA; May 5, 2017 – ACT Aspire)
Included Students Grades 3 - 10 full academic year students enrolled at each school and completing state required
assessment in reading (ACT Aspire). This is the denominator of the reading achievement
component and is comparable for schools across the state.
Excluded Students 1. Highly mobile students are excluded from the school calculations.
2. Beginning in 2018, exclude home schooled students (Resident Code = 1, 2, 4) if student
state ID and LEA are accurate for match to enrollment data downloaded from TRIAND.
Reading at Grade
Level
Determination
Students are considered to be reading at grade level if the student attains an achievement level of
Ready or Exceeds on the ACT Aspire.
a. If student scores at Ready or Exceeds achievement level on ACT Aspire Reading
then the student receives 1 point.
b. If the student scores at In Need of Support or Close achievement level on ACT
Aspire Reading then student receives 0 points.
Determining Mean
School Percent
Reading at Grade
Level
Determine the school-level points earned per student for reading at grade level.
School-level points earned for Reading at Grade Level = Sum of points earned per
student at Ready/Exceeds / number of students tested Reading
𝑅𝑒𝑎𝑑𝑖𝑛𝑔 𝑎𝑡 𝐺𝑟𝑎𝑑𝑒 𝐿𝑒𝑣𝑒𝑙 𝑃𝑜𝑖𝑛𝑡𝑠
= ∑ 𝑃𝑜𝑖𝑛𝑡𝑠 𝐸𝑎𝑟𝑛𝑒𝑑 𝑃𝑒𝑟 𝑆𝑡𝑢𝑑𝑒𝑛𝑡 𝑇𝑒𝑠𝑡𝑒𝑑 𝑅𝑒𝑎𝑑𝑖𝑛𝑔
𝑁𝑢𝑚𝑏𝑒𝑟 𝑜𝑓 𝑆𝑡𝑢𝑑𝑒𝑛𝑡𝑠 𝑇𝑒𝑠𝑡𝑒𝑑 𝑅𝑒𝑎𝑑𝑖𝑛𝑔
Variables related to
Reading at Grade
Level
Students Tested in Reading on required statewide ACT Aspire
Student full academic year status (mobility)
Number of Points Possible for Reading at Grade Level (number of students tested in
reading)
Number of Points Earned Per Student for Reading at Grade Level (sum of points for
students scoring at Ready or Exceeds achievement levels)
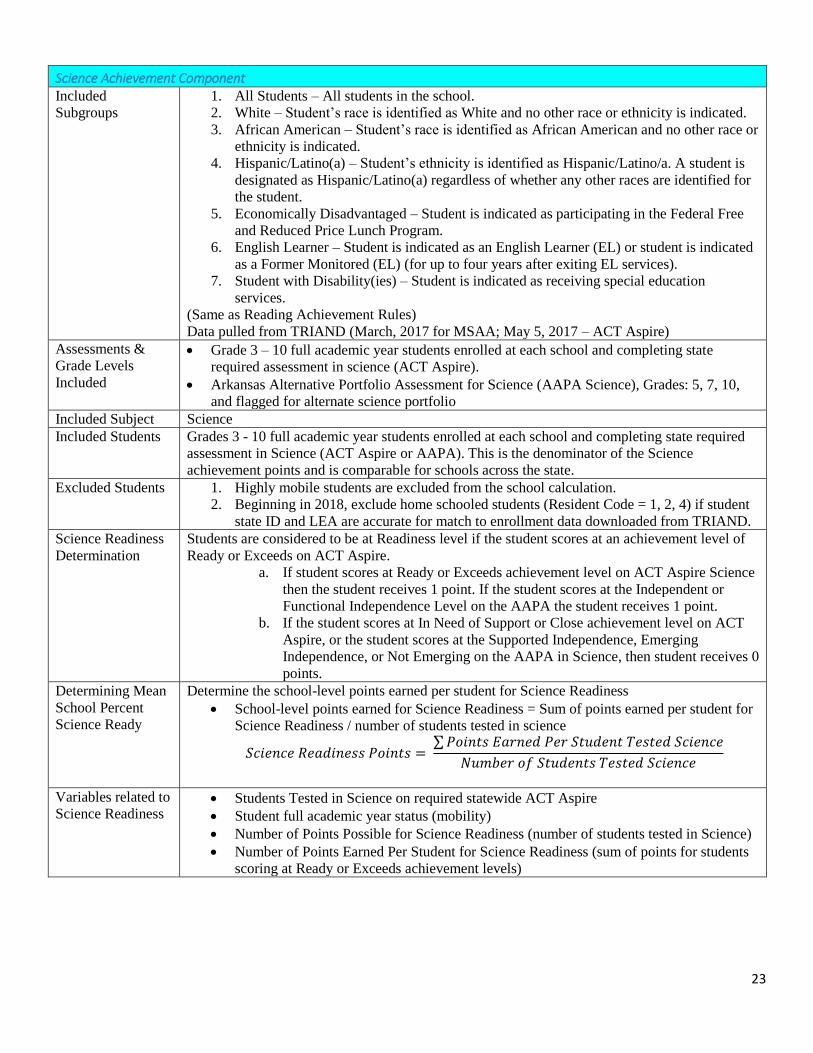
Science Achievement Component Description of
Component or
Indicator
Using student-attained achievement level in Science as a proxy for describing students as Science
Ready.
23
Science Achievement Component Included
Subgroups
1. All Students – All students in the school.
2. White – Student’s race is identified as White and no other race or ethnicity is indicated.
3. African American – Student’s race is identified as African American and no other race or
ethnicity is indicated.
4. Hispanic/Latino(a) – Student’s ethnicity is identified as Hispanic/Latino/a. A student is
designated as Hispanic/Latino(a) regardless of whether any other races are identified for
the student.
5. Economically Disadvantaged – Student is indicated as participating in the Federal Free
and Reduced Price Lunch Program.
6. English Learner – Student is indicated as an English Learner (EL) or student is indicated
as a Former Monitored (EL) (for up to four years after exiting EL services).
7. Student with Disability(ies) – Student is indicated as receiving special education
services.
(Same as Reading Achievement Rules)
Data pulled from TRIAND (March, 2017 for MSAA; May 5, 2017 – ACT Aspire)
Assessments &
Grade Levels
Included
Grade 3 – 10 full academic year students enrolled at each school and completing state
required assessment in science (ACT Aspire).
Arkansas Alternative Portfolio Assessment for Science (AAPA Science), Grades: 5, 7, 10,
and flagged for alternate science portfolio
Included Subject Science
Included Students Grades 3 - 10 full academic year students enrolled at each school and completing state required
assessment in Science (ACT Aspire or AAPA). This is the denominator of the Science
achievement points and is comparable for schools across the state.
Excluded Students 1. Highly mobile students are excluded from the school calculation.
2. Beginning in 2018, exclude home schooled students (Resident Code = 1, 2, 4) if student
state ID and LEA are accurate for match to enrollment data downloaded from TRIAND.
Science Readiness
Determination
Students are considered to be at Readiness level if the student scores at an achievement level of
Ready or Exceeds on ACT Aspire.
a. If student scores at Ready or Exceeds achievement level on ACT Aspire Science
then the student receives 1 point. If the student scores at the Independent or
Functional Independence Level on the AAPA the student receives 1 point.
b. If the student scores at In Need of Support or Close achievement level on ACT
Aspire, or the student scores at the Supported Independence, Emerging
Independence, or Not Emerging on the AAPA in Science, then student receives 0
points.
Determining Mean
School Percent
Science Ready
Determine the school-level points earned per student for Science Readiness
School-level points earned for Science Readiness = Sum of points earned per student for
Science Readiness / number of students tested in science
𝑆𝑐𝑖𝑒𝑛𝑐𝑒 𝑅𝑒𝑎𝑑𝑖𝑛𝑒𝑠𝑠 𝑃𝑜𝑖𝑛𝑡𝑠 = ∑ 𝑃𝑜𝑖𝑛𝑡𝑠 𝐸𝑎𝑟𝑛𝑒𝑑 𝑃𝑒𝑟 𝑆𝑡𝑢𝑑𝑒𝑛𝑡 𝑇𝑒𝑠𝑡𝑒𝑑 𝑆𝑐𝑖𝑒𝑛𝑐𝑒
𝑁𝑢𝑚𝑏𝑒𝑟 𝑜𝑓 𝑆𝑡𝑢𝑑𝑒𝑛𝑡𝑠 𝑇𝑒𝑠𝑡𝑒𝑑 𝑆𝑐𝑖𝑒𝑛𝑐𝑒
Variables related to
Science Readiness Students Tested in Science on required statewide ACT Aspire
Student full academic year status (mobility)
Number of Points Possible for Science Readiness (number of students tested in Science)
Number of Points Earned Per Student for Science Readiness (sum of points for students
scoring at Ready or Exceeds achievement levels)
24
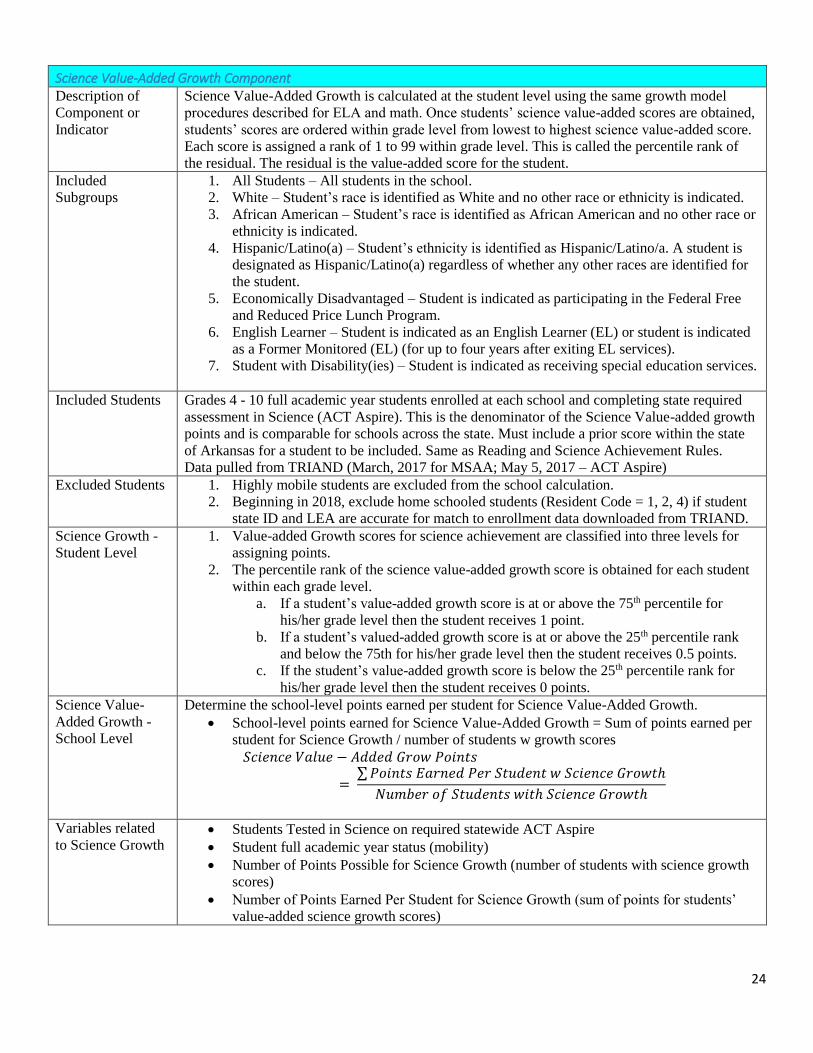
Science Value-Added Growth Component Description of
Component or
Indicator
Science Value-Added Growth is calculated at the student level using the same growth model
procedures described for ELA and math. Once students’ science value-added scores are obtained,
students’ scores are ordered within grade level from lowest to highest science value-added score.
Each score is assigned a rank of 1 to 99 within grade level. This is called the percentile rank of
the residual. The residual is the value-added score for the student.
Included
Subgroups
1. All Students – All students in the school.
2. White – Student’s race is identified as White and no other race or ethnicity is indicated.
3. African American – Student’s race is identified as African American and no other race or
ethnicity is indicated.
4. Hispanic/Latino(a) – Student’s ethnicity is identified as Hispanic/Latino/a. A student is
designated as Hispanic/Latino(a) regardless of whether any other races are identified for
the student.
5. Economically Disadvantaged – Student is indicated as participating in the Federal Free
and Reduced Price Lunch Program.
6. English Learner – Student is indicated as an English Learner (EL) or student is indicated
as a Former Monitored (EL) (for up to four years after exiting EL services).
7. Student with Disability(ies) – Student is indicated as receiving special education services.
Included Students Grades 4 - 10 full academic year students enrolled at each school and completing state required
assessment in Science (ACT Aspire). This is the denominator of the Science Value-added growth
points and is comparable for schools across the state. Must include a prior score within the state
of Arkansas for a student to be included. Same as Reading and Science Achievement Rules.
Data pulled from TRIAND (March, 2017 for MSAA; May 5, 2017 – ACT Aspire)
Excluded Students 1. Highly mobile students are excluded from the school calculation.
2. Beginning in 2018, exclude home schooled students (Resident Code = 1, 2, 4) if student
state ID and LEA are accurate for match to enrollment data downloaded from TRIAND.
Science Growth -
Student Level
1. Value-added Growth scores for science achievement are classified into three levels for
assigning points.
2. The percentile rank of the science value-added growth score is obtained for each student
within each grade level.
a. If a student’s value-added growth score is at or above the 75th percentile for
his/her grade level then the student receives 1 point.
b. If a student’s valued-added growth score is at or above the 25th percentile rank
and below the 75th for his/her grade level then the student receives 0.5 points.
c. If the student’s value-added growth score is below the 25th percentile rank for
his/her grade level then the student receives 0 points.
Science Value-
Added Growth -
School Level
Determine the school-level points earned per student for Science Value-Added Growth.
School-level points earned for Science Value-Added Growth = Sum of points earned per
student for Science Growth / number of students w growth scores
𝑆𝑐𝑖𝑒𝑛𝑐𝑒 𝑉𝑎𝑙𝑢𝑒 − 𝐴𝑑𝑑𝑒𝑑 𝐺𝑟𝑜𝑤 𝑃𝑜𝑖𝑛𝑡𝑠
= ∑ 𝑃𝑜𝑖𝑛𝑡𝑠 𝐸𝑎𝑟𝑛𝑒𝑑 𝑃𝑒𝑟 𝑆𝑡𝑢𝑑𝑒𝑛𝑡 𝑤 𝑆𝑐𝑖𝑒𝑛𝑐𝑒 𝐺𝑟𝑜𝑤𝑡ℎ
𝑁𝑢𝑚𝑏𝑒𝑟 𝑜𝑓 𝑆𝑡𝑢𝑑𝑒𝑛𝑡𝑠 𝑤𝑖𝑡ℎ 𝑆𝑐𝑖𝑒𝑛𝑐𝑒 𝐺𝑟𝑜𝑤𝑡ℎ
Variables related
to Science Growth Students Tested in Science on required statewide ACT Aspire
Student full academic year status (mobility)
Number of Points Possible for Science Growth (number of students with science growth
scores)
Number of Points Earned Per Student for Science Growth (sum of points for students’
value-added science growth scores)
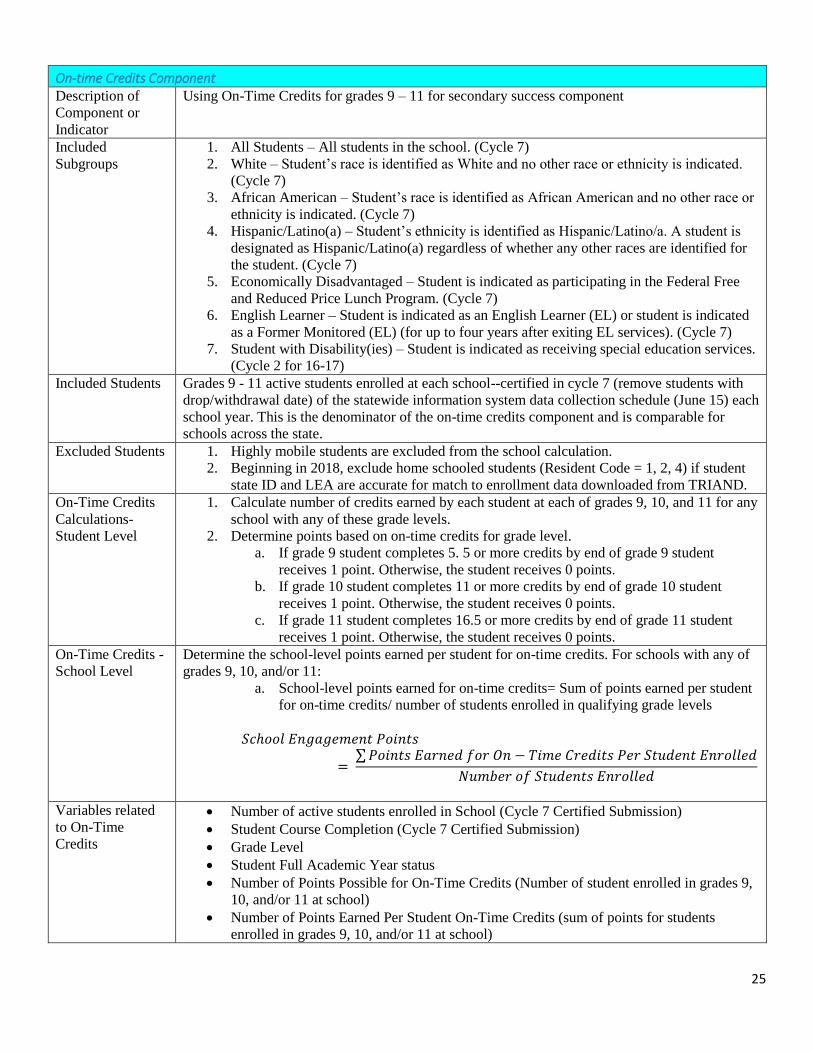
25
On-time Credits Component Description of
Component or
Indicator
Using On-Time Credits for grades 9 – 11 for secondary success component
Included
Subgroups
1. All Students – All students in the school. (Cycle 7)
2. White – Student’s race is identified as White and no other race or ethnicity is indicated.
(Cycle 7)
3. African American – Student’s race is identified as African American and no other race or
ethnicity is indicated. (Cycle 7)
4. Hispanic/Latino(a) – Student’s ethnicity is identified as Hispanic/Latino/a. A student is
designated as Hispanic/Latino(a) regardless of whether any other races are identified for
the student. (Cycle 7)
5. Economically Disadvantaged – Student is indicated as participating in the Federal Free
and Reduced Price Lunch Program. (Cycle 7)
6. English Learner – Student is indicated as an English Learner (EL) or student is indicated
as a Former Monitored (EL) (for up to four years after exiting EL services). (Cycle 7)
7. Student with Disability(ies) – Student is indicated as receiving special education services.
(Cycle 2 for 16-17)
Included Students Grades 9 - 11 active students enrolled at each school--certified in cycle 7 (remove students with
drop/withdrawal date) of the statewide information system data collection schedule (June 15) each
school year. This is the denominator of the on-time credits component and is comparable for
schools across the state.
Excluded Students 1. Highly mobile students are excluded from the school calculation.
2. Beginning in 2018, exclude home schooled students (Resident Code = 1, 2, 4) if student
state ID and LEA are accurate for match to enrollment data downloaded from TRIAND.
On-Time Credits
Calculations-
Student Level
1. Calculate number of credits earned by each student at each of grades 9, 10, and 11 for any
school with any of these grade levels.
2. Determine points based on on-time credits for grade level.
a. If grade 9 student completes 5. 5 or more credits by end of grade 9 student
receives 1 point. Otherwise, the student receives 0 points.
b. If grade 10 student completes 11 or more credits by end of grade 10 student
receives 1 point. Otherwise, the student receives 0 points.
c. If grade 11 student completes 16.5 or more credits by end of grade 11 student
receives 1 point. Otherwise, the student receives 0 points.
On-Time Credits -
School Level
Determine the school-level points earned per student for on-time credits. For schools with any of
grades 9, 10, and/or 11:
a. School-level points earned for on-time credits= Sum of points earned per student
for on-time credits/ number of students enrolled in qualifying grade levels
𝑆𝑐ℎ𝑜𝑜𝑙 𝐸𝑛𝑔𝑎𝑔𝑒𝑚𝑒𝑛𝑡 𝑃𝑜𝑖𝑛𝑡𝑠
= ∑ 𝑃𝑜𝑖𝑛𝑡𝑠 𝐸𝑎𝑟𝑛𝑒𝑑 𝑓𝑜𝑟 𝑂𝑛 − 𝑇𝑖𝑚𝑒 𝐶𝑟𝑒𝑑𝑖𝑡𝑠 𝑃𝑒𝑟 𝑆𝑡𝑢𝑑𝑒𝑛𝑡 𝐸𝑛𝑟𝑜𝑙𝑙𝑒𝑑
𝑁𝑢𝑚𝑏𝑒𝑟 𝑜𝑓 𝑆𝑡𝑢𝑑𝑒𝑛𝑡𝑠 𝐸𝑛𝑟𝑜𝑙𝑙𝑒𝑑
Variables related
to On-Time
Credits
Number of active students enrolled in School (Cycle 7 Certified Submission)
Student Course Completion (Cycle 7 Certified Submission)
Grade Level
Student Full Academic Year status
Number of Points Possible for On-Time Credits (Number of student enrolled in grades 9,
10, and/or 11 at school)
Number of Points Earned Per Student On-Time Credits (sum of points for students
enrolled in grades 9, 10, and/or 11 at school)

26
High School GPA Component Description of
Component or
Indicator
Using cumulative state GPA as high school success and postsecondary readiness indicator.
Included
Subgroups
1. All Students – All students in the school. (Cycle 7)
2. White – Student’s race is identified as White and no other race or ethnicity is indicated.
(Cycle 7)
3. African American – Student’s race is identified as African American and no other race or
ethnicity is indicated. (Cycle 7)
4. Hispanic/Latino(a) – Student’s ethnicity is identified as Hispanic/Latino/a. A student is
designated as Hispanic/Latino(a) regardless of whether any other races are identified for
the student. (Cycle 7)
5. Economically Disadvantaged – Student is indicated as participating in the Federal Free
and Reduced Price Lunch Program. (Cycle 7)
6. English Learner – Student is indicated as an English Learner (EL) or student is indicated
as a Former Monitored (EL) (for up to four years after exiting EL services). (Cycle 7)
7. Student with Disability(ies) – Student is indicated as receiving special education services.
(Cycle 2 for 16-17)
Included Students Grade 12 students enrolled at each school--certified in cycle 7 of the statewide information
system data collection schedule (June 15) each school year. This is the denominator of the High
School GPA component and is comparable for schools across the state.
Excluded Students 1. Highly mobile Grade 12 students are excluded from the school calculation.
2. Beginning in 2018, exclude home schooled students (Resident Code = 1, 2, 4) if student
state ID and LEA are accurate for match to enrollment data downloaded from TRIAND.
High School GPA
Calculations-
Student Level
1. Final High School GPAs are submitted to the statewide information system in Cycle 7
certified submission. These final high school GPAs are used for this component.
2. Determine points for high school GPA.
a. Students with a high school GPA greater than or equal to 2.8 receive 1 point.
b. Students with a high school GPA less than 2.8 receive 0 points.
High School GPA
—School Level
Determine the school-level points earned per student for high school GPA.
School-level points earned for high school GPA = Sum of points earned per student /
number of Grade 12 students enrolled:
𝐻𝑖𝑔ℎ 𝑆𝑐ℎ𝑜𝑜𝑙 𝐺𝑃𝐴 𝑃𝑜𝑖𝑛𝑡𝑠 = ∑ 𝑃𝑜𝑖𝑛𝑡𝑠 𝐸𝑎𝑟𝑛𝑒𝑑 𝑃𝑒𝑟 𝐺𝑟𝑎𝑑𝑒 12 𝑆𝑡𝑢𝑑𝑒𝑛𝑡 𝐸𝑛𝑟𝑜𝑙𝑙𝑒𝑑
𝑁𝑢𝑚𝑏𝑒𝑟 𝑜𝑓 𝐺𝑟𝑎𝑑𝑒 12 𝑆𝑡𝑢𝑑𝑒𝑛𝑡𝑠 𝐸𝑛𝑟𝑜𝑙𝑙𝑒𝑑
Variables related to
High School GPA Number of active Grade 12 Students Enrolled in School (Cycle 7 Certified Submission)
Final High School GPA submitted for Grade 12 students in Cycle 7 Certified Submission
Full Academic Year Status
Number of Points Possible for High School GPA (Number of Grade 12 students enrolled)
Number of Points Earned for High School GPA (sum of points Grade 12 students)
ACT Scores Component Description of
Component or
Indicator
Using ACT Composite and Subject Scores for postsecondary readiness indicator.
Included Subgroups 1. All Students – All students in the school. (Cycle 7)
2. White – Student’s race is identified as White and no other race or ethnicity is indicated.
(Cycle 7)
3. African American – Student’s race is identified as African American and no other race
or ethnicity is indicated. (Cycle 7)

27
ACT Scores Component 4. Hispanic/Latino(a) – Student’s ethnicity is identified as Hispanic/Latino/a. A student is
designated as Hispanic/Latino(a) regardless of whether any other races are identified for
the student. (Cycle 7)
5. Economically Disadvantaged – Student is indicated as participating in the Federal Free
and Reduced Price Lunch Program. (Cycle 7)
6. English Learner – Student is indicated as an English Learner (EL) or student is indicated
as a Former Monitored (EL) (for up to four years after exiting EL services). (Cycle 7)
7. Student with Disability(ies) – Student is indicated as receiving special education
services. (Cycle 2)
Included Students Grade 12 students who are enrolled at each school—certified in cycle 7 of the statewide
information system data collection schedule (June 15) each school year. This is the denominator
of the ACT component and is comparable for schools across the state.
Excluded Students 1. Highly mobile Grade 12 students are excluded from the school calculation.
2. Beginning in 2018, exclude home schooled students (Resident Code = 1, 2, 4) if student
state ID and LEA are accurate for match to enrollment data downloaded from TRIAND.
ACT Composite-
Student Level
1. Grade 12 students enrolled at each school are submitted to the statewide information
system in Cycle 7 certified submission. The active students in Grade 12 are used for this
component.
2. Determine students’ highest ACT Composite score. Look back at all ACT scores
received in prior 3 years to obtain highest ACT Composite score. Cumulative data files
received from vendor in August. Last test score included is June assessment.
3. Determine points for ACT Composite.
a. Students with an ACT Composite greater than or equal to 19 receive 1 point.
b. Students with an ACT Composite less than 19 receive 0 points.
ACT Composite -
School Level
Determine the school-level points earned per Grade 12 students for ACT Composite.
School-level points earned for ACT Composite = Sum of points earned per student /
number of Grade 12 students enrolled:
𝐴𝐶𝑇 𝐶𝑜𝑚𝑝𝑜𝑠𝑖𝑡𝑒 𝑃𝑜𝑖𝑛𝑡𝑠 = ∑ 𝑃𝑜𝑖𝑛𝑡𝑠 𝐸𝑎𝑟𝑛𝑒𝑑 𝑃𝑒𝑟 𝐺𝑟𝑎𝑑𝑒 12 𝑆𝑡𝑢𝑑𝑒𝑛𝑡 𝐸𝑛𝑟𝑜𝑙𝑙𝑒𝑑
𝑁𝑢𝑚𝑏𝑒𝑟 𝑜𝑓 𝐺𝑟𝑎𝑑𝑒 12 𝑆𝑡𝑢𝑑𝑒𝑛𝑡𝑠 𝐸𝑛𝑟𝑜𝑙𝑙𝑒𝑑
Variables related to
ACT Composite Number of active Grade 12 Students Enrolled in School (Cycle 7 Certified Submission)
ACT Scores for 3 years from national and state administrations
Full Academic Year Status
Number of Points Possible for ACT Composite(Number of Grade 12 students enrolled)
Number of Points Earned for ACT Composite (sum of points Grade 12 students with
ACTs)
ACT Readiness Benchmark Component Description of
Component or
Indicator
Using ACT Readiness Benchmark Scores for postsecondary readiness indicator.
Included Subgroups 1. All Students – All students in the school. (Cycle 7)
2. White – Student’s race is identified as White and no other race or ethnicity is indicated.
(Cycle 7)
3. African American – Student’s race is identified as African American and no other race
or ethnicity is indicated. (Cycle 7)
4. Hispanic/Latino(a) – Student’s ethnicity is identified as Hispanic/Latino/a. A student is
designated as Hispanic/Latino(a) regardless of whether any other races are identified for
the student. (Cycle 7)
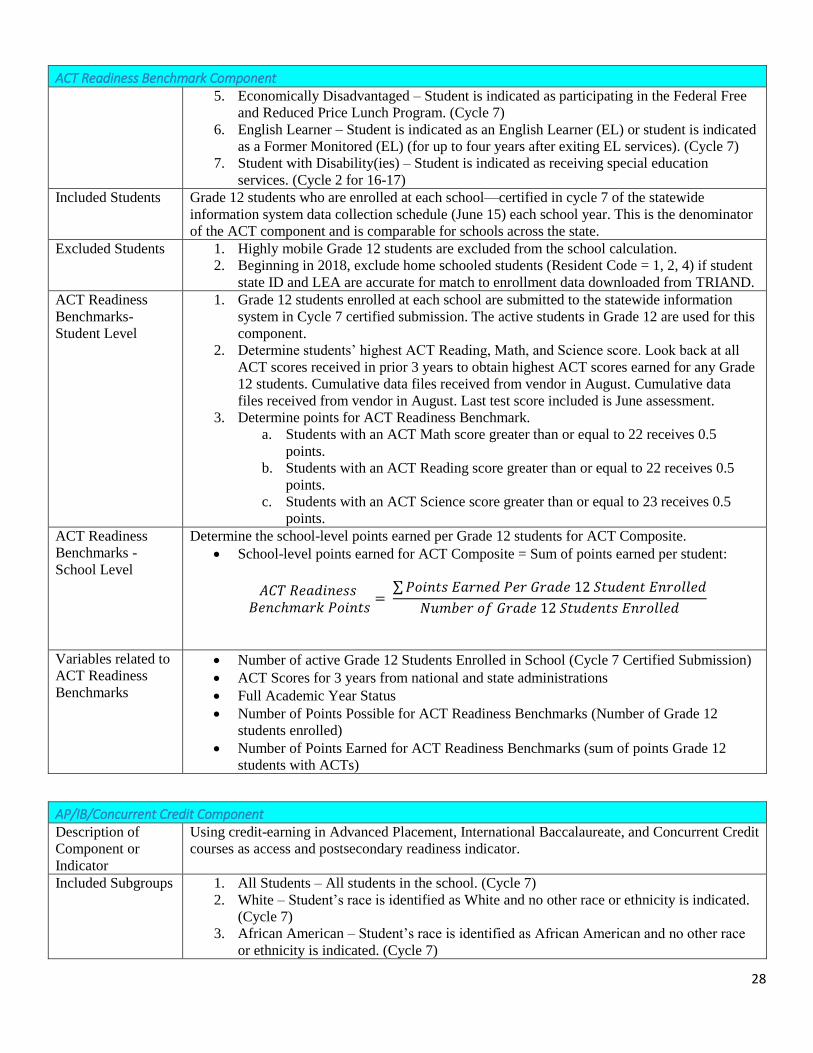
28
ACT Readiness Benchmark Component 5. Economically Disadvantaged – Student is indicated as participating in the Federal Free
and Reduced Price Lunch Program. (Cycle 7)
6. English Learner – Student is indicated as an English Learner (EL) or student is indicated
as a Former Monitored (EL) (for up to four years after exiting EL services). (Cycle 7)
7. Student with Disability(ies) – Student is indicated as receiving special education
services. (Cycle 2 for 16-17)
Included Students Grade 12 students who are enrolled at each school—certified in cycle 7 of the statewide
information system data collection schedule (June 15) each school year. This is the denominator
of the ACT component and is comparable for schools across the state.
Excluded Students 1. Highly mobile Grade 12 students are excluded from the school calculation.
2. Beginning in 2018, exclude home schooled students (Resident Code = 1, 2, 4) if student
state ID and LEA are accurate for match to enrollment data downloaded from TRIAND.
ACT Readiness
Benchmarks-
Student Level
1. Grade 12 students enrolled at each school are submitted to the statewide information
system in Cycle 7 certified submission. The active students in Grade 12 are used for this
component.
2. Determine students’ highest ACT Reading, Math, and Science score. Look back at all
ACT scores received in prior 3 years to obtain highest ACT scores earned for any Grade
12 students. Cumulative data files received from vendor in August. Cumulative data
files received from vendor in August. Last test score included is June assessment.
3. Determine points for ACT Readiness Benchmark.
a. Students with an ACT Math score greater than or equal to 22 receives 0.5
points.
b. Students with an ACT Reading score greater than or equal to 22 receives 0.5
points.
c. Students with an ACT Science score greater than or equal to 23 receives 0.5
points.
ACT Readiness
Benchmarks -
School Level
Determine the school-level points earned per Grade 12 students for ACT Composite.
School-level points earned for ACT Composite = Sum of points earned per student:
𝐴𝐶𝑇 𝑅𝑒𝑎𝑑𝑖𝑛𝑒𝑠𝑠 𝐵𝑒𝑛𝑐ℎ𝑚𝑎𝑟𝑘 𝑃𝑜𝑖𝑛𝑡𝑠
= ∑ 𝑃𝑜𝑖𝑛𝑡𝑠 𝐸𝑎𝑟𝑛𝑒𝑑 𝑃𝑒𝑟 𝐺𝑟𝑎𝑑𝑒 12 𝑆𝑡𝑢𝑑𝑒𝑛𝑡 𝐸𝑛𝑟𝑜𝑙𝑙𝑒𝑑
𝑁𝑢𝑚𝑏𝑒𝑟 𝑜𝑓 𝐺𝑟𝑎𝑑𝑒 12 𝑆𝑡𝑢𝑑𝑒𝑛𝑡𝑠 𝐸𝑛𝑟𝑜𝑙𝑙𝑒𝑑
Variables related to
ACT Readiness
Benchmarks
Number of active Grade 12 Students Enrolled in School (Cycle 7 Certified Submission)
ACT Scores for 3 years from national and state administrations
Full Academic Year Status
Number of Points Possible for ACT Readiness Benchmarks (Number of Grade 12
students enrolled)
Number of Points Earned for ACT Readiness Benchmarks (sum of points Grade 12
students with ACTs)
AP/IB/Concurrent Credit Component Description of
Component or
Indicator
Using credit-earning in Advanced Placement, International Baccalaureate, and Concurrent Credit
courses as access and postsecondary readiness indicator.
Included Subgroups 1. All Students – All students in the school. (Cycle 7)
2. White – Student’s race is identified as White and no other race or ethnicity is indicated.
(Cycle 7)
3. African American – Student’s race is identified as African American and no other race
or ethnicity is indicated. (Cycle 7)

29
AP/IB/Concurrent Credit Component 4. Hispanic/Latino(a) – Student’s ethnicity is identified as Hispanic/Latino/a. A student is
designated as Hispanic/Latino(a) regardless of whether any other races are identified for
the student. (Cycle 7)
5. Economically Disadvantaged – Student is indicated as participating in the Federal Free
and Reduced Price Lunch Program. (Cycle 7)
6. English Learner – Student is indicated as an English Learner (EL) or student is indicated
as a Former Monitored (EL) (for up to four years after exiting EL services). (Cycle 7)
7. Student with Disability(ies) – Student is indicated as receiving special education
services. . (Cycle 2 for 16-17)
Included Students Active Grade 12 students who are enrolled at each school—certified in cycle 7 of the statewide
information system data collection schedule (June 15) each school year. This is the denominator
of the AP/IB/Concurrent Credit component and is comparable for schools across the state.
Concurrent Credit includes Arkansas Career Education (ACE) concurrent credit courses.
Excluded Students 1. Highly mobile Grade 12 students are excluded from the school calculation.
2. Beginning in 2018, exclude home schooled students (Resident Code = 1, 2, 4) if student
state ID and LEA are accurate for match to enrollment data downloaded from TRIAND.
AP/IB/Concurrent
Credit -Student
Level
1. Grade 12 students enrolled at each school are submitted to the statewide information
system in Cycle 7 certified submission. The active students in Grade 12 are used for this
component.
2. Course completion and credit data from cycle 7 certified submission for each of four
years of high school for the current grade 12 class.
3. Determine points for AP/IB/Concurrent Credit.
a. Students with one or more AP/IB/Concurrent Credit course credits earn 1.0
point. Otherwise students earn 0 points.
b. Course Codes for this component are listed in Appendix B.
AP/IB/Concurrent
Credit -School
Level
Determine the school-level points earned per Grade 12 students for AP/IB/Concurrent Credit.
School-level points earned for AP/IB/Concurrent Credit = Sum of points earned per
student
AP/IB/Concurrent Credit 𝑃𝑜𝑖𝑛𝑡𝑠
= ∑ 𝑃𝑜𝑖𝑛𝑡𝑠 𝐸𝑎𝑟𝑛𝑒𝑑 𝑃𝑒𝑟 𝐺𝑟𝑎𝑑𝑒 12 𝑆𝑡𝑢𝑑𝑒𝑛𝑡 𝐸𝑛𝑟𝑜𝑙𝑙𝑒𝑑
𝑁𝑢𝑚𝑏𝑒𝑟 𝑜𝑓 𝐺𝑟𝑎𝑑𝑒 12 𝑆𝑡𝑢𝑑𝑒𝑛𝑡𝑠 𝐸𝑛𝑟𝑜𝑙𝑙𝑒𝑑
Variables related to
AP/IB/Concurrent
Credit
Number of active Grade 12 Students Enrolled in School (Cycle 7 Certified Submission)
Course Credits Earned for each high school year for Grade 12 class
Number of Points Possible for AP/IB/Concurrent Credit (Number of Grade 12 students
enrolled)
Number of Points Earned for AP/IB/Concurrent Credit (sum of points Grade 12
students)
Computer Science Component Description of
Component or
Indicator
Using credit-earning in computer science as access and postsecondary readiness indicator.
For the 2016-2017 SQSS, the course codes used are listed in Appendix B-Computer Science
Course Codes.
Included
Subgroups
1. All Students – All students in the school. (Cycle 7)
2. White – Student’s race is identified as White and no other race or ethnicity is indicated.
(Cycle 7)
3. African American – Student’s race is identified as African American and no other race or
ethnicity is indicated. (Cycle 7)

30
Computer Science Component 4. Hispanic/Latino(a) – Student’s ethnicity is identified as Hispanic/Latino/a. A student is
designated as Hispanic/Latino(a) regardless of whether any other races are identified for
the student. (Cycle 7)
5. Economically Disadvantaged – Student is indicated as participating in the Federal Free
and Reduced Price Lunch Program. (Cycle 7)
6. English Learner – Student is indicated as an English Learner (EL) or student is indicated
as a Former Monitored (EL) (for up to four years after exiting EL services). (Cycle 7)
7. Student with Disability(ies) – Student is indicated as receiving special education services.
(Cycle 2)
Included Students Grade 12 students who are enrolled at each school—certified in cycle 7 of the statewide
information system data collection schedule (June 15) each school year. This is the denominator
of the computer science component and is comparable for schools across the state.
Excluded Students 1. Highly mobile Grade 12 students are excluded from the school calculation.
2. Beginning in 2018, exclude home schooled students (Resident Code = 1, 2, 4) if student
state ID and LEA are accurate for match to enrollment data downloaded from TRIAND.
Computer Science-
Student Level
1. Grade 12 students enrolled at each school are submitted to the statewide information
system in Cycle 7 certified submission. The active students in Grade 12 are used for this
component.
2. Course completion and credit data from cycle 7 certified submission for each of four
years of high school for the current grade 12 class. For 16-17 and 17-18: Pulls credits
from grades 9-12.
3. Determine points for computer science.
c. Students with one or more computer science course credits earn 1.0 point.
Otherwise students earn 0 points.
Computer Science
-School Level
Determine the school-level points earned per Grade 12 students for computer science.
School-level points earned for computer science = Sum of points earned per student
𝐶𝑜𝑚𝑝𝑢𝑡𝑒𝑟 𝑆𝑐𝑖𝑒𝑛𝑐𝑒 𝑃𝑜𝑖𝑛𝑡𝑠 = ∑ 𝑃𝑜𝑖𝑛𝑡𝑠 𝐸𝑎𝑟𝑛𝑒𝑑 𝑃𝑒𝑟 𝐺𝑟𝑎𝑑𝑒 12 𝑆𝑡𝑢𝑑𝑒𝑛𝑡 𝐸𝑛𝑟𝑜𝑙𝑙𝑒𝑑
𝑁𝑢𝑚𝑏𝑒𝑟 𝑜𝑓 𝐺𝑟𝑎𝑑𝑒 12 𝑆𝑡𝑢𝑑𝑒𝑛𝑡𝑠 𝐸𝑛𝑟𝑜𝑙𝑙𝑒𝑑
Variables related to
Computer Science Number of Grade 12 Students Enrolled in School (Cycle 7 Certified Submission)
Course Credits Earned for each high school year for Grade 12 class
Number of Points Possible for Computer Science (Number of Grade 12 students enrolled)
Number of Points Earned for Computer Science (sum of points Grade 12 students)
Community Service/Service Learning Component Description of
Component or
Indicator
Using credit-earning in community service/service learning as access and postsecondary
readiness indicator.
Included
Subgroups
1. All Students – All students in the school. (Cycle 7)
2. White – Student’s race is identified as White and no other race or ethnicity is indicated.
(Cycle 7)
3. African American – Student’s race is identified as African American and no other race or
ethnicity is indicated. (Cycle 7)
4. Hispanic/Latino(a) – Student’s ethnicity is identified as Hispanic/Latino/a. A student is
designated as Hispanic/Latino(a) regardless of whether any other races are identified for
the student. (Cycle 7)
5. Economically Disadvantaged – Student is indicated as participating in the Federal Free
and Reduced Price Lunch Program. (Cycle 7)
6. English Learner – Student is indicated as an English Learner (EL) or student is indicated
as a Former Monitored (EL) (for up to four years after exiting EL services). (Cycle 7)

31
Community Service/Service Learning Component 7. Student with Disability(ies) – Student is indicated as receiving special education services.
(Cycle 2)
Included Students Grade 12 students who are enrolled at each school—certified in cycle 7 of the statewide
information system data collection schedule (June 15) each school year. This is the denominator
of the Community Service component and is comparable for schools across the state.
Excluded Students 1. Highly mobile students are excluded from the school calculation.
2. Beginning in 2018, exclude home schooled students (Resident Code = 1, 2, 4) if student
state ID and LEA are accurate for match to enrollment data downloaded from TRIAND.
Community
Service -Student
Level
1. Grade 12 students enrolled at each school are submitted to the statewide information
system in Cycle 7 certified submission. The active students in Grade 12 are used for this
component.
2. Course completion and credit data from cycle 7 certified submission for each of four
years of high school for the current grade 12 class. For 16-17 and 17-18, Community or
Service Learning Course Codes 999120 and 496010 are used. For 18-19 and beyond,
code 496010 is used.
3. Determine points for Community Service.
a. Students with one or more Community Service course credits earn 1.0 point.
Otherwise students earn 0 points.
Community
Service -School
Level
Determine the school-level points earned per Grade 12 students for computer science.
School-level points earned for Community Service = Sum of points earned per student
Community Service 𝑃𝑜𝑖𝑛𝑡𝑠 = ∑ 𝑃𝑜𝑖𝑛𝑡𝑠 𝐸𝑎𝑟𝑛𝑒𝑑 𝑃𝑒𝑟 𝐺𝑟𝑎𝑑𝑒 12 𝑆𝑡𝑢𝑑𝑒𝑛𝑡 𝐸𝑛𝑟𝑜𝑙𝑙𝑒𝑑
𝑁𝑢𝑚𝑏𝑒𝑟 𝑜𝑓 𝐺𝑟𝑎𝑑𝑒 12 𝑆𝑡𝑢𝑑𝑒𝑛𝑡𝑠 𝐸𝑛𝑟𝑜𝑙𝑙𝑒𝑑
Variables related to
Community
Service
Number of active Grade 12 Students Enrolled in School (Cycle 7 Certified Submission)
Course Credits Earned for each high school year for Grade 12 class
Number of Points Possible for Community Service (Number of Grade 12 students
enrolled)
Number of Points Earned for Community Service (sum of points Grade 12 students)
Compiling Total SQSS Score The SQSS Score is compiled by summing points earned across all components in the numerator
and points possible in the denominator.
Groups Calculated 1. All Students – All students in the school.
2. White – Student’s race is identified as White and no other race or ethnicity is indicated.
3. African American – Student’s race is identified as African American and no other race or
ethnicity is indicated.
4. Hispanic/Latino(a) – Student’s ethnicity is identified as Hispanic/Latino/a. A student is
designated as Hispanic/Latino(a) regardless of whether any other races are identified for
the student.
5. Economically Disadvantaged – Student is indicated as participating in the Federal Free
and Reduced Price Lunch Program.
6. English Learner – Student is indicated as an English Learner (EL) or student is indicated
as a Former Monitored (EL) (for up to four years after exiting EL services).
7. Student with Disability(ies) – Student is indicated as receiving special education
services.
Calculation 1. Calculate possible points (ppt) and earned points (ept) for each component of each
student. Students may have different components due to different grade levels so the
points possible provides a way to make the denominator comparable statewide within
grade spans.
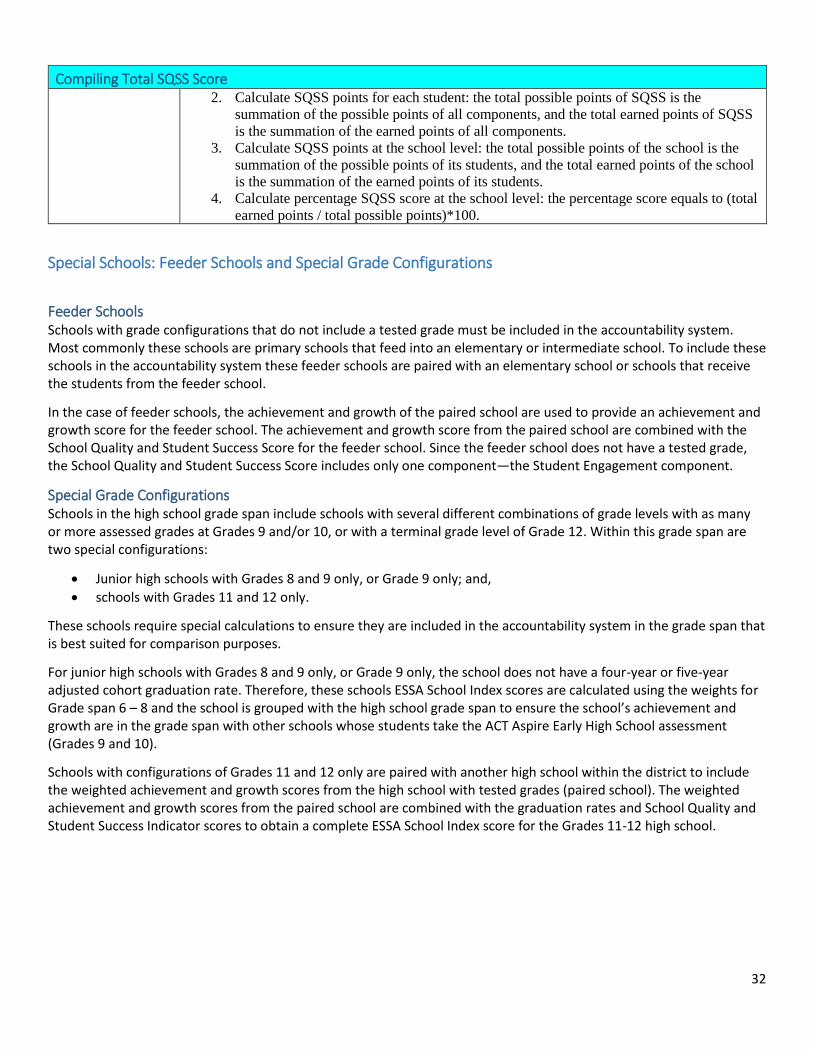
32
Compiling Total SQSS Score 2. Calculate SQSS points for each student: the total possible points of SQSS is the
summation of the possible points of all components, and the total earned points of SQSS
is the summation of the earned points of all components.
3. Calculate SQSS points at the school level: the total possible points of the school is the
summation of the possible points of its students, and the total earned points of the school
is the summation of the earned points of its students.
4. Calculate percentage SQSS score at the school level: the percentage score equals to (total
earned points / total possible points)*100.
Special Schools: Feeder Schools and Special Grade Configurations
Feeder Schools Schools with grade configurations that do not include a tested grade must be included in the accountability system. Most commonly these schools are primary schools that feed into an elementary or intermediate school. To include these schools in the accountability system these feeder schools are paired with an elementary school or schools that receive the students from the feeder school.
In the case of feeder schools, the achievement and growth of the paired school are used to provide an achievement and growth score for the feeder school. The achievement and growth score from the paired school are combined with the School Quality and Student Success Score for the feeder school. Since the feeder school does not have a tested grade, the School Quality and Student Success Score includes only one component—the Student Engagement component.
Special Grade Configurations Schools in the high school grade span include schools with several different combinations of grade levels with as many or more assessed grades at Grades 9 and/or 10, or with a terminal grade level of Grade 12. Within this grade span are two special configurations:
Junior high schools with Grades 8 and 9 only, or Grade 9 only; and,
schools with Grades 11 and 12 only.
These schools require special calculations to ensure they are included in the accountability system in the grade span that is best suited for comparison purposes.
For junior high schools with Grades 8 and 9 only, or Grade 9 only, the school does not have a four-year or five-year adjusted cohort graduation rate. Therefore, these schools ESSA School Index scores are calculated using the weights for Grade span 6 – 8 and the school is grouped with the high school grade span to ensure the school’s achievement and growth are in the grade span with other schools whose students take the ACT Aspire Early High School assessment (Grades 9 and 10).
Schools with configurations of Grades 11 and 12 only are paired with another high school within the district to include the weighted achievement and growth scores from the high school with tested grades (paired school). The weighted achievement and growth scores from the paired school are combined with the graduation rates and School Quality and Student Success Indicator scores to obtain a complete ESSA School Index score for the Grades 11-12 high school.
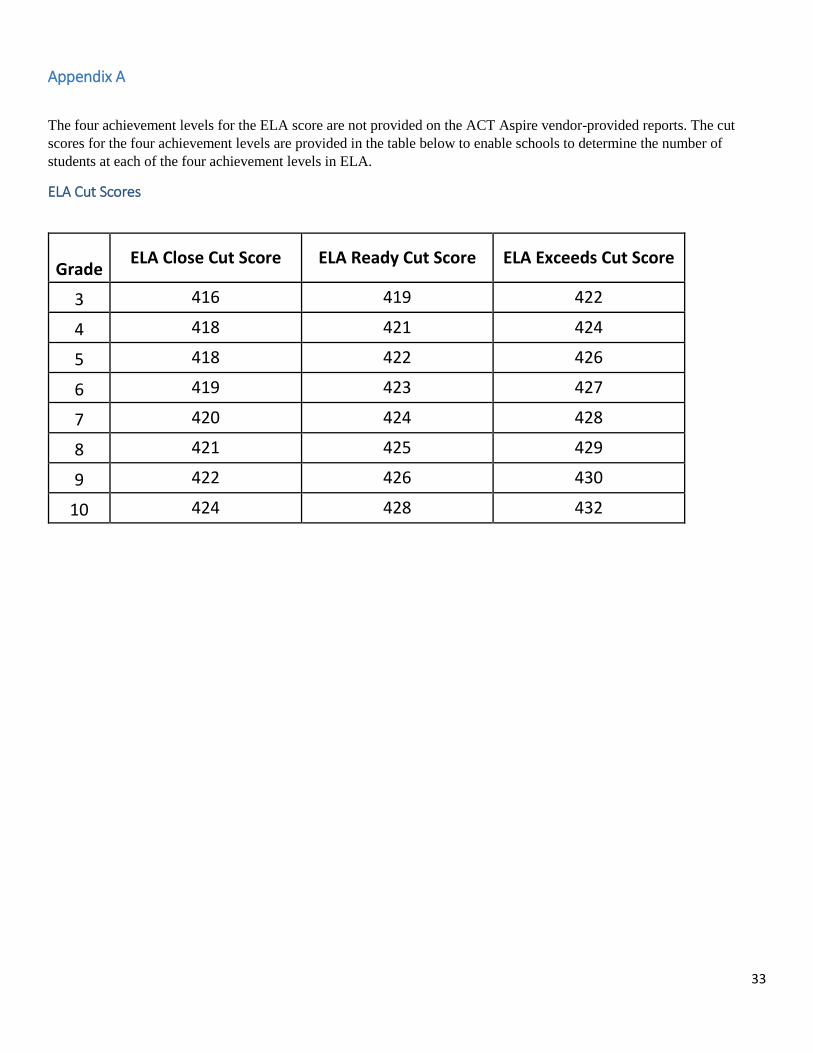
33
Appendix A
The four achievement levels for the ELA score are not provided on the ACT Aspire vendor-provided reports. The cut
scores for the four achievement levels are provided in the table below to enable schools to determine the number of
students at each of the four achievement levels in ELA.
ELA Cut Scores
Grade ELA Close Cut Score ELA Ready Cut Score ELA Exceeds Cut Score
3 416 419 422
4 418 421 424
5 418 422 426
6 419 423 427
7 420 424 428
8 421 425 429
9 422 426 430
10 424 428 432
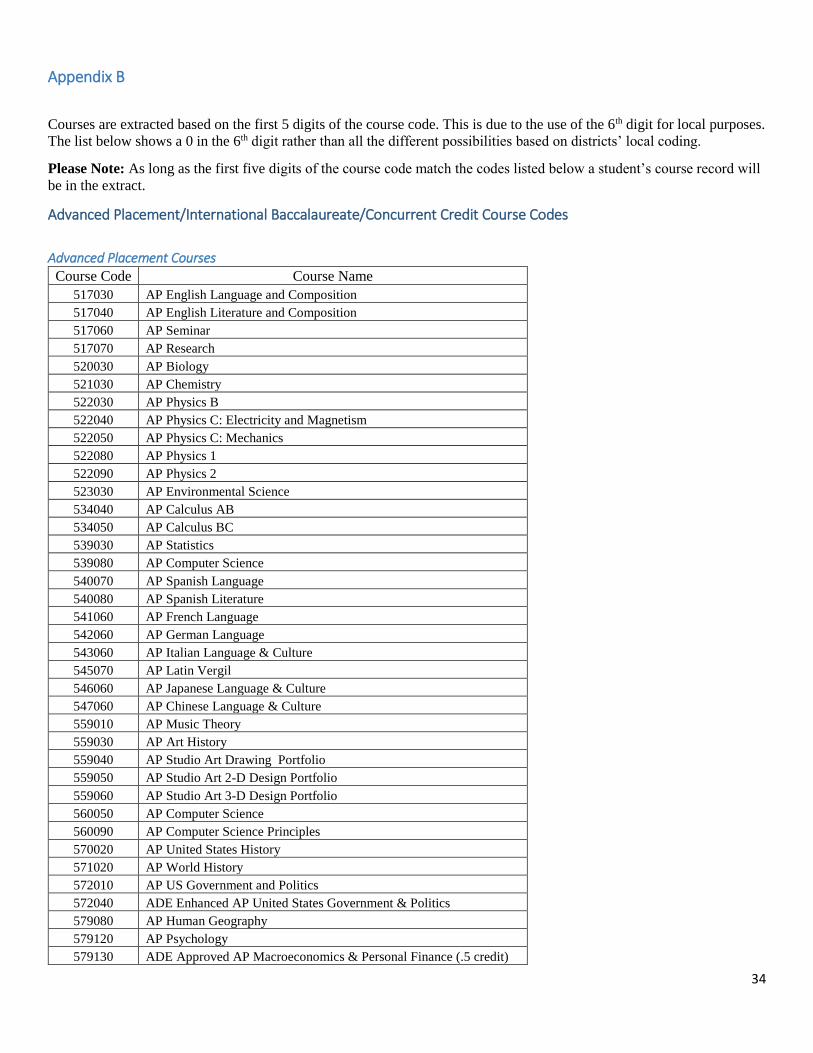
34
Appendix B
Courses are extracted based on the first 5 digits of the course code. This is due to the use of the 6th digit for local purposes.
The list below shows a 0 in the 6th digit rather than all the different possibilities based on districts’ local coding.
Please Note: As long as the first five digits of the course code match the codes listed below a student’s course record will
be in the extract.
Advanced Placement/International Baccalaureate/Concurrent Credit Course Codes
Advanced Placement Courses
Course Code Course Name
517030 AP English Language and Composition
517040 AP English Literature and Composition
517060 AP Seminar
517070 AP Research
520030 AP Biology
521030 AP Chemistry
522030 AP Physics B
522040 AP Physics C: Electricity and Magnetism
522050 AP Physics C: Mechanics
522080 AP Physics 1
522090 AP Physics 2
523030 AP Environmental Science
534040 AP Calculus AB
534050 AP Calculus BC
539030 AP Statistics
539080 AP Computer Science
540070 AP Spanish Language
540080 AP Spanish Literature
541060 AP French Language
542060 AP German Language
543060 AP Italian Language & Culture
545070 AP Latin Vergil
546060 AP Japanese Language & Culture
547060 AP Chinese Language & Culture
559010 AP Music Theory
559030 AP Art History
559040 AP Studio Art Drawing Portfolio
559050 AP Studio Art 2-D Design Portfolio
559060 AP Studio Art 3-D Design Portfolio
560050 AP Computer Science
560090 AP Computer Science Principles
570020 AP United States History
571020 AP World History
572010 AP US Government and Politics
572040 ADE Enhanced AP United States Government & Politics
579080 AP Human Geography
579120 AP Psychology
579130 ADE Approved AP Macroeconomics & Personal Finance (.5 credit)

35
Course Code Course Name
579140 ADE Approved AP Microeconomics with Personal Finance (.5 credit)
579150 AP Macroeconomics
579160 AP Microeconomics
579170 AP European History
579180 AP Comparative Government & Politics
596110 AP Capstone
International Baccalaureate Courses Course Code Course Name
517100 IB English 11
517200 IB English 12
521040 IB Chemistry
522060 IB Physics
529030 IB Biology
530030 IB Algebra I
531030 IB Geometry
532030 IB Algebra II
533160 IB Pre Calculus/Trig
534060 IB Calculus
539040 IB Trigonometry
539060 IB Mathematical Studies
539070 IB Mathematics SL
539110 IB Computer Science SL
539120 IB Computer Science HL
540020 IB Spanish
540130 IB Spanish III
540140 IB Spanish IV
540150 IB Spanish Ab Initio
541070 IB French III
541080 IB French ab initio SL
542080 IB German ab inito SL
547070 IB Chinese IV
559120 IB Theatre HL
559810 IB Fine Arts
559820 IB Visual Arts
560060 IB Computer Science
570040 IB Contemporary American History
570050 IB History of the Americas
572030 IB American Government
579020 IB World Religions
579030 IB Psychology
579190 IB Geography
592100 IB Intro to Technology in Global Society
592200 IB Business and Management
596200 IB Theory of Knowledge

36
Concurrent Credit Courses Course Code Course Name
497100 Teacher Cadet (Concurrent Credit)
514000 Concurrent Credit Oral Communication
519900 Other Concurrent Credit Language Arts
519910 Concurrent Credit English 9
519920 Concurrent Credit English 10
519930 Concurrent Credit English 11
519940 Concurrent Credit English 12
529900 Other Concurrent Credit Science
529910 Concurrent Credit Biology
529920 Concurrent Credit Physical Science
529930 Concurrent Credit Chemistry
539900 Concurrent Credit Beyond Algebra II
539910 Concurrent Credit Algebra I
539920 Concurrent Credit Geometry
539930 Concurrent Credit Algebra II
539960 Other Concurrent Credit Math
549900 Other Concurrent Credit Foreign Language
559000 Concurrent Credit Fine Arts
560900 Other Concurrent Credit Computer Science
574000 Concurrent Credit Economics
579900 Other Concurrent Credit Social Studies
579910 Concurrent Credit World History
579920 Concurrent Credit American History
579930 Concurrent Credit Civics
580900 Other Concurrent Credit Health Ed.
585900 Concurrent Credit Physical Ed.
590140 ACE Concurrent Credit Agribusiness Systems I
590150 ACE Concurrent Credit Animal Systems I
590160 ACE Concurrent Credit Natural Resource & Environmental Systems I
590170 ACE Concurrent Credit Plant Systems I
590180 ACE Concurrent Credit Power, Structural & Technical Systems I
590190 ACE Concurrent Credit Construction Technology I
590200 ACE Concurrent Credit Media Communications I
590210 ACE Concurrent Credit Management I
590220 ACE Concurrent Credit Entrepreneurship I
590230 ACE Concurrent Credit Education and Training I
590240 ACE Concurrent Credit Accounting & Finance I
590250 ACE Concurrent Credit National Security I
590260 ACE Concurrent Credit Health Services I
590270 ACE Concurrent Credit Hospitality Administration I
590280 ACE Concurrent Credit Food Production, Management, and Services I
590290 ACE Concurrent Credit Consumer Services I
590300 ACE Concurrent Credit Information Technology I
590310 ACE Concurrent Credit Law & Public Safety I
590320 ACE Concurrent Credit Advanced Manufacturing I
590330 ACE Concurrent Credit STEM Engineering & Technology I
590340 ACE Concurrent Credit STEM Engineering & Technology II
590350 ACE Concurrent Credit Aviation Technology I

37
Course Code Course Name
590360 ACE Concurrent Credit Transportation
590370 ACE Concurrent Credit Auto Collision Repair I
590380 ACE Concurrent Credit Auto Collision Repair II
590390 ACE Concurrent Credit Auto Collision Repair III
590400 ACE Concurrent Credit Auto Collision Repair IV
590410 ACE Concurrent Credit Auto Service Technology I
590420 ACE Concurrent Credit Auto Service Technology II
590430 ACE Concurrent Credit Auto Service Technology III
590440 ACE Concurrent Credit Auto Service Technology IV
590450 ACE Concurrent Credit Diesel Mechanics I
590460 ACE Concurrent Credit Diesel Mechanics II
590470 ACE Concurrent Credit Diesel Mechanics III
590480 ACE Concurrent Credit Diesel Mechanics IV
590490 ACE Concurrent Credit Media Communications II
590500 ACE Concurrent Credit Media Communications III
590510 ACE Concurrent Credit Media Communications IV
590520 ACE Concurrent Credit Education and Training II
590530 ACE Concurrent Credit Education and Training III
590540 ACE Concurrent Credit Education and Training IV
590550 ACE Concurrent Credit Hospitality Administration II
590560 ACE Concurrent Credit Hospitality Administration III
590570 ACE Concurrent Credit Hospitality Administration IV
590580 ACE Concurrent Credit Food Production, Management, and Services II
590590 ACE Concurrent Credit Food Production, Management, and Services III
590600 ACE Concurrent Credit Food Production, Management, and Services IV
590610 ACE Concurrent Credit Construction Technology II
590620 ACE Concurrent Credit Construction Technology III
590630 ACE Concurrent Credit Construction Technology IV
590640 ACE Concurrent Credit HVAC Systems I
590650 ACE Concurrent Credit HVAC Systems II
590660 ACE Concurrent Credit HVAC Systems III
590670 ACE Concurrent Credit HVAC Systems IV
590680 ACE Concurrent Credit Health Services II
590690 ACE Concurrent Credit Health Services III
590700 ACE Concurrent Credit Health Services IV
590710 ACE Concurrent Credit CNA I
590720 ACE Concurrent Credit CNA II
590730 ACE Concurrent Credit Law & Public Safety II
590740 ACE Concurrent Credit Law & Public Safety III
590750 ACE Concurrent Credit Law & Public Safety IV
590760 ACE Concurrent Credit Information Technology II
590770 ACE Concurrent Credit Information Technology III
590780 ACE Concurrent Credit Information Technology IV
590790 ACE Concurrent Credit Advanced Manufacturing II
590800 ACE Concurrent Credit Advanced Manufacturing III
590810 ACE Concurrent Credit Advanced Manufacturing IV
590820 ACE Concurrent Credit Industrial Equipment Maintenance I
590830 ACE Concurrent Credit Industrial Equipment Maintenance II
590840 ACE Concurrent Credit Industrial Equipment Maintenance III

38
Course Code Course Name
590850 ACE Concurrent Credit Industrial Equipment Maintenance IV
590860 ACE Concurrent Credit Welding I
590870 ACE Concurrent Credit Welding II
590880 ACE Concurrent Credit Welding III
590890 ACE Concurrent Credit Welding IV
590900 ACE Concurrent Credit STEM Engineering & Technology III
590910 ACE Concurrent Credit STEM Engineering & Technology IV
590920 ACE Concurrent Credit Health Services V
590930 ACE Concurrent Credit Health Services VI
590940 ACE Concurrent Credit EMT I
590950 ACE Concurrent Credit EMT II
590960 ACE Concurrent Credit Agribusiness Systems II
590970 ACE Concurrent Credit Agribusiness Systems III
590980 ACE Concurrent Credit Agribusiness Systems IV
590990 ACE Concurrent Credit
591000 ACE Concurrent Credit (.5 credit)
591050 ACE Concurrent Credit Agribusiness Systems VI
591060 ACE Concurrent Credit Agribusiness Systems VII
591070 ACE Concurrent Credit Agribusiness Systems VIII
591080 ACE Concurrent Credit Animal Systems II
591090 ACE Concurrent Credit Animal Systems III
591100 ACE Concurrent Credit Animal Systems IV
591110 ACE Concurrent Credit Animal Systems V
591120 ACE Concurrent Credit Animal Systems VI
591130 ACE Concurrent Credit Animal Systems VII
591140 ACE Concurrent Credit Animal Systems VIII
591150 ACE Concurrent Credit Natural Resource & Environmental Systems II
591160 ACE Concurrent Credit Natural Resource & Environmental Systems III
591170 ACE Concurrent Credit Natural Resource & Environmental Systems IV
591180 ACE Concurrent Credit Natural Resource & Environmental Systems V
591190 ACE Concurrent Credit Natural Resource & Environmental Systems VI
591200 ACE Concurrent Credit Natural Resource & Environmental Systems VII
591210 ACE Concurrent Credit Natural Resource & Environmental Systems VIII
591220 ACE Concurrent Credit Plant Systems II
591230 ACE Concurrent Credit Plant Systems III
591240 ACE Concurrent Credit Plant Systems IV
591250 ACE Concurrent Credit Plant Systems V
591260 ACE Concurrent Credit Plant Systems VI
591270 ACE Concurrent Credit Plant Systems VII
591280 ACE Concurrent Credit Plant Systems VIII
591290 ACE Concurrent Credit Power, Structural & Technical Systems II
591300 ACE Concurrent Credit Power, Structural & Technical Systems III
591310 ACE Concurrent Credit Power, Structural & Technical Systems IV
591320 ACE Concurrent Credit Power, Structural & Technical Systems V
591330 ACE Concurrent Credit Power, Structural & Technical Systems VI
591340 ACE Concurrent Credit Power, Structural & Technical Systems VII
591350 ACE Concurrent Credit Power, Structural & Technical Systems VIII
591360 ACE Concurrent Credit Management II
591370 ACE Concurrent Credit Management III

39
Course Code Course Name
591380 ACE Concurrent Credit Management IV
591390 ACE Concurrent Credit Management V
591400 ACE Concurrent Credit Management VI
591410 ACE Concurrent Credit Management VII
591420 ACE Concurrent Credit Management VIII
591430 ACE Concurrent Credit Office Administration I
591440 ACE Concurrent Credit Office Administration II
591450 ACE Concurrent Credit Office Administration III
591460 ACE Concurrent Credit Office Administration IV
591470 ACE Concurrent Credit Office Administration V
591480 ACE Concurrent Credit Office Administration VI
591490 ACE Concurrent Credit Office Administration VII
591500 ACE Concurrent Credit Office Administration VIII
591510 ACE Concurrent Credit Entrepreneurship II
591520 ACE Concurrent Credit Entrepreneurship III
591530 ACE Concurrent Credit Entrepreneurship IV
591540 ACE Concurrent Credit Entrepreneurship V
591550 ACE Concurrent Credit Entrepreneurship VI
591560 ACE Concurrent Credit Entrepreneurship VII
591570 ACE Concurrent Credit Entrepreneurship VIII
591580 ACE Concurrent Credit Accounting & Finance II
591590 ACE Concurrent Credit Accounting & Finance III
591600 ACE Concurrent Credit Accounting & Finance IV
591610 ACE Concurrent Credit Accounting & Finance V
591620 ACE Concurrent Credit Accounting & Finance VI
591630 ACE Concurrent Credit Accounting & Finance VIII
591640 ACE Concurrent Credit Accounting & Finance VII
591650 ACE Concurrent Credit Banking Services I
591660 ACE Concurrent Credit Banking Services II
591670 ACE Concurrent Credit Banking Services III
591680 ACE Concurrent Credit Banking Services IV
591690 ACE Concurrent Credit Banking Services V
591700 ACE Concurrent Credit Banking Services VI
591710 ACE Concurrent Credit Banking Services VII
591720 ACE Concurrent Credit Banking Services VIII
591730 ACE Concurrent Credit Securities, Investments, Insurance and Risk Management I
591740 ACE Concurrent Credit Securities, Investments, Insurance and Risk Management II
591750 ACE Concurrent Credit Securities, Investments, Insurance and Risk Management III
591760 ACE Concurrent Credit Securities, Investments, Insurance and Risk Management IV
591770 ACE Concurrent Credit Securities, Investments, Insurance and Risk Management V
591780 ACE Concurrent Credit Securities, Investments, Insurance and Risk Management VI
591790 ACE Concurrent Credit Securities, Investments, Insurance and Risk Management VII
591800 ACE Concurrent Credit Securities, Investments, Insurance and Risk Management VIII
591810 ACE Concurrent Credit Web Design I
591820 ACE Concurrent Credit Web Design II
591830 ACE Concurrent Credit Web Design III
591840 ACE Concurrent Credit Web Design IV
591850 ACE Concurrent Credit Web Design V
591860 ACE Concurrent Credit Web Design VI

40
Course Code Course Name
591870 ACE Concurrent Credit Web Design VII
591880 ACE Concurrent Credit Web Design VIII
591890 ACE Concurrent Credit Marketing Technology & Research I
591900 ACE Concurrent Credit Marketing Technology & Research II
591910 ACE Concurrent Credit Marketing Technology & Research III
591920 ACE Concurrent Credit Marketing Technology & Research IV
591930 ACE Concurrent Credit Marketing Technology & Research V
591940 ACE Concurrent Credit Marketing Technology & Research VI
591950 ACE Concurrent Credit Marketing Technology & Research VII
591960 ACE Concurrent Credit Marketing Technology & Research VIII
591970 ACE Concurrent Credit Hospitality Administration VI
591980 ACE Concurrent Credit Hospitality Administration VII
591990 ACE Concurrent Credit Hospitality Administration VIII
592000 ACE Concurrent Credit Consumer Services II
592010 ACE Concurrent Credit Consumer Services III
592020 ACE Concurrent Credit Consumer Services IV
592030 ACE Concurrent Credit Consumer Services V
592040 ACE Concurrent Credit Consumer Services VI
592050 ACE Concurrent Credit Consumer Services VII
592060 ACE Concurrent Credit Consumer Services VIII
592070 ACE Concurrent Credit Child Care Guidance, Management, and Services I
592080 ACE Concurrent Credit Child Care Guidance, Management, and Services II
592090 ACE Concurrent Credit Child Care Guidance, Management, and Services III
592110 ACE Concurrent Credit Child Care Guidance, Management, and Services V
592120 ACE Concurrent Credit Child Care Guidance, Management, and Services VI
592130 ACE Concurrent Credit Child Care Guidance, Management, and Services VII
592140 ACE Concurrent Credit Child Care Guidance, Management, and Services VIII
592150 ACE Concurrent Credit Culinary Arts I
592160 ACE Concurrent Credit Culinary Arts II
592170 ACE Concurrent Credit Culinary Arts III
592180 ACE Concurrent Credit Culinary Arts IV
592190 ACE Concurrent Credit Culinary Arts V
592210 ACE Concurrent Credit Culinary Arts VII
592220 ACE Concurrent Credit Culinary Arts VIII
592230 ACE Concurrent Credit Food Production, Management, and Services V
592240 ACE Concurrent Credit Food Production, Management, and Services VI
592250 ACE Concurrent Credit Food Production, Management, and Services VII
592260 ACE Concurrent Credit Food Production, Management, and Services VIII
592270 ACE Concurrent Credit Education and Training V
592280 ACE Concurrent Credit Education and Training VI
592290 ACE Concurrent Credit Education and Training VII
592300 ACE Concurrent Credit Education and Training VIII
592310 ACE Concurrent Credit Auto Collision Repair V
592320 ACE Concurrent Credit Auto Collision Repair VI
592330 ACE Concurrent Credit Auto Collision Repair VII
592340 ACE Concurrent Credit Auto Collision Repair VIII
592350 ACE Concurrent Credit Auto Service Technology V
592360 ACE Concurrent Credit Auto Service Technology VI
592370 ACE Concurrent Credit Auto Service Technology VII

41
Course Code Course Name
592380 ACE Concurrent Credit Auto Service Technology VIII
592390 ACE Concurrent Credit Diesel Mechanics V
592400 ACE Concurrent Credit Diesel Mechanics VI
592410 ACE Concurrent Credit Diesel Mechanics VII
592420 ACE Concurrent Credit Diesel Mechanics VIII
592430 ACE Concurrent Credit Construction Technology V
592440 ACE Concurrent Credit Construction Technology VI
592450 ACE Concurrent Credit Construction Technology VII
592460 ACE Concurrent Credit Construction Technology VIII
592470 ACE Concurrent Credit HVAC Systems V
592480 ACE Concurrent Credit HVAC Systems VI
592490 ACE Concurrent Credit HVAC Systems VII
592500 ACE Concurrent Credit HVAC Systems VIII
592510 ACE Concurrent Credit Law & Public Safety V
592520 ACE Concurrent Credit Law & Public Safety VI
592530 ACE Concurrent Credit Law & Public Safety VII
592540 ACE Concurrent Credit Law & Public Safety VIII
592550 ACE Concurrent Credit Information Technology V
592560 ACE Concurrent Credit Information Technology VI
592570 ACE Concurrent Credit Information Technology VII
592580 ACE Concurrent Credit Information Technology VIII
592590 ACE Concurrent Credit Advanced Manufacturing V
592600 ACE Concurrent Credit Advanced Manufacturing VI
592610 ACE Concurrent Credit Advanced Manufacturing VII
592620 ACE Concurrent Credit Advanced Manufacturing VIII
592630 ACE Concurrent Credit Industrial Equipment Maintenance V
592640 ACE Concurrent Credit Industrial Equipment Maintenance VI
592650 ACE Concurrent Credit Industrial Equipment Maintenance VII
592660 ACE Concurrent Credit Industrial Equipment Maintenance VIII
592670 ACE Concurrent Credit Welding V
592680 ACE Concurrent Credit Welding VI
592690 ACE Concurrent Credit Welding VII
592700 ACE Concurrent Credit Welding VIII
592710 ACE Concurrent Credit STEM Engineering & Technology V
592720 ACE Concurrent Credit STEM Engineering & Technology VI
592730 ACE Concurrent Credit STEM Engineering & Technology VII
592740 ACE Concurrent Credit STEM Engineering & Technology VIII
592770 ACE Concurrent Credit Health Services VII
592780 ACE Concurrent Credit Health Services VIII
592790 ACE Concurrent Credit Media Communications V
592800 ACE Concurrent Credit Media Communications VI
592810 ACE Concurrent Credit Media Communications VII
592820 ACE Concurrent Credit Media Communications VIII
592830 ACE Concurrent Credit Aviation Technology II
592840 ACE Concurrent Credit Aviation Technology III
592850 ACE Concurrent Credit Aviation Technology IV
592860 ACE Concurrent Credit Aviation Technology V
592870 ACE Concurrent Credit Aviation Technology VI
592880 ACE Concurrent Credit Aviation Technology VII

42
Course Code Course Name
592890 ACE Concurrent Credit Aviation Technology VIII
592900 ACE Concurrent Credit Hospitality Administration V
592910 ACE Concurrent Credit Health Services IX
592920 ACE Concurrent Credit Health Services X
592930 ACE Concurrent Credit Agribusiness Systems V
592940 ACE Concurrent Credit Child Care Guidance, Management, and Services IV
592950 ACE Concurrent Credit Culinary Arts VI
596500 Miscellaneous Concurrent Credit
696200 Other Concurrent Credit/Local Credit Only
Computer Science Course Codes
2016-2017 Courses Used
Course Code Course Name
439100 Computer Science with Mathematics
460020 Essentials of Computer Programming
460050 Computer Science With Mathematics
492390 Programming I (.5 credit)
492391 Programming I (.5 credit)
492397 Programming I (.5 credit)
492400 Programming II (.5 credit)
492401 Programming II (.5 credit)
492570 Database Programming - Oracle Internet Academy (.5 credit)
492580 Introduction to Java - Oracle Internet Academy (.5 credit)
492590 Java Programming - Oracle Internet Academy (.5 credit)
492680 ACE Approved Intro to Object Oriented Programming
495040 Computer Science and Software Engineering (PLTW)
495050 Computer Game Design and Development
495060 Introduction to Mobile Application Development
495070 Mobile Application Development I (MAD I)
495080 Mobile Application Development II (MAD II)
495120 Mobile Application Development Lab A (MAD Lab A)
495130 Mobile Application Development Lab B (MAD Lab B)
539080 AP Computer Science
539110 IB Computer Science SL
560000 ADE Approved Computer Science
560050 AP Computer Science
560050 AP Computer Science A
560051 AP Computer Science A
560058 AP Computer Science A
56005A AP Computer Science A
56005U AP Computer Science A
560060 IB Computer Science
560069 AP Computer Science B
560090 AP Computer Science Principles
560900 Other Concurrent Credit Computer Science
560901 Other Concurrent Credit Computer Science
560902 Other Concurrent Credit Computer Science
56090C Other Concurrent Credit Computer Science

43
Course Code Course Name