Final 2018 Energy Efficiency Forecast - iso-ne.com · 1/05/2018 · • This presentation contains...
52
ISO-NE PUBLIC MAY 1, 2018 | HOLYOKE, MA Final 2018 Energy Efficiency Forecast
Transcript of Final 2018 Energy Efficiency Forecast - iso-ne.com · 1/05/2018 · • This presentation contains...

ISO-NE PUBLIC
M A Y 1 , 2 0 1 8 | H O L Y O K E , M A
Final 2018 Energy Efficiency Forecast

ISO-NE PUBLIC
Table of Contents
Slide
• Introduction 3-7
• Forecast Methodology and Assumptions 8-12
• Update to Forecast Methodology 13-16
• Forecast Inputs 17-27
• Final 2018 Forecast – New England 28-33
• Final 2018 Forecast – States 34-52
2

ISO-NE PUBLIC ISO-NE PUBLIC
INTRODUCTION
3

ISO-NE PUBLIC
Acronyms
• EE Energy Efficiency • EEFWG Energy Efficiency Forecast Working Group • FCM Forward Capacity Market • FCA Forward Capacity Auction (FCM) • CSO Capacity Supply Obligation (FCM) • ARA 3 Third Annual Reconfiguration Auction (FCM) • ICR Installed Capacity Requirement • PA Program Administrator • RGGI Regional Greenhouse Gas Initiative • SBC System Benefit Charge • CELT 10-year forecast of Capacity, Energy, Loads and
Transmission
4

ISO-NE PUBLIC
Introduction
• This presentation contains the final EE forecast for the period 2018 through 2027
• The forecast estimates reductions in energy and demand from state-sponsored EE programs in the New England control area by region and state (CT, MA, ME, NH, RI, VT)
• The data used to create the forecast originates from state-sponsored EE Program Administrators and state regulatory agencies
5

ISO-NE PUBLIC
Introduction Process
• This forecast follows the same fundamental forecast process and methodology used in prior years, starting in 2012
• The EE forecast is based on average production costs, peak-to-energy ratios, and projected budgets of state-sponsored EE programs
• The EE forecast is updated annually and is incorporated into the CELT report
• A generalized characterization of the forecast process can be found in the “Energy-Efficiency Forecast Background Report” available at https://www.iso-ne.com/static-assets/documents/2016/05/Final_EEF_Background_Report_050116.pdf
6

ISO-NE PUBLIC
Introduction Impacts
• The EE forecast is used in ISO studies including: – Long-term transmission planning studies – Economic planning studies
• EE forecast will not impact: – ICR/Local Sourcing Requirement/Maximum Capacity Limit/Demand
Curves – FCM auctions – FCM related reliability studies (qualification, de-list bid reliability
reviews)
7
ISO-NE PUBLIC ISO-NE PUBLIC
FORECAST ASSUMPTIONS AND METHODOLOGY
8

ISO-NE PUBLIC 9
Forecast Model General Assumptions
• Annual EE budgets provided by the Commissions or representatives on their behalf were used in the model and held constant in years after the latest approved budget
• Production cost baselines were derived from a three-year average of recent performance
• Peak-to-Energy Ratios were derived from a three-year average of recent performance and held constant through the forecast period
• Inflation rate set at 2.5% per year
• Current CELT energy forecast used in conjunction with SBC rates to forecast SBC dollars
• FCM revenue has no effect on overall budget in ME, VT, MA, and RI
ISO-NE PUBLIC 10
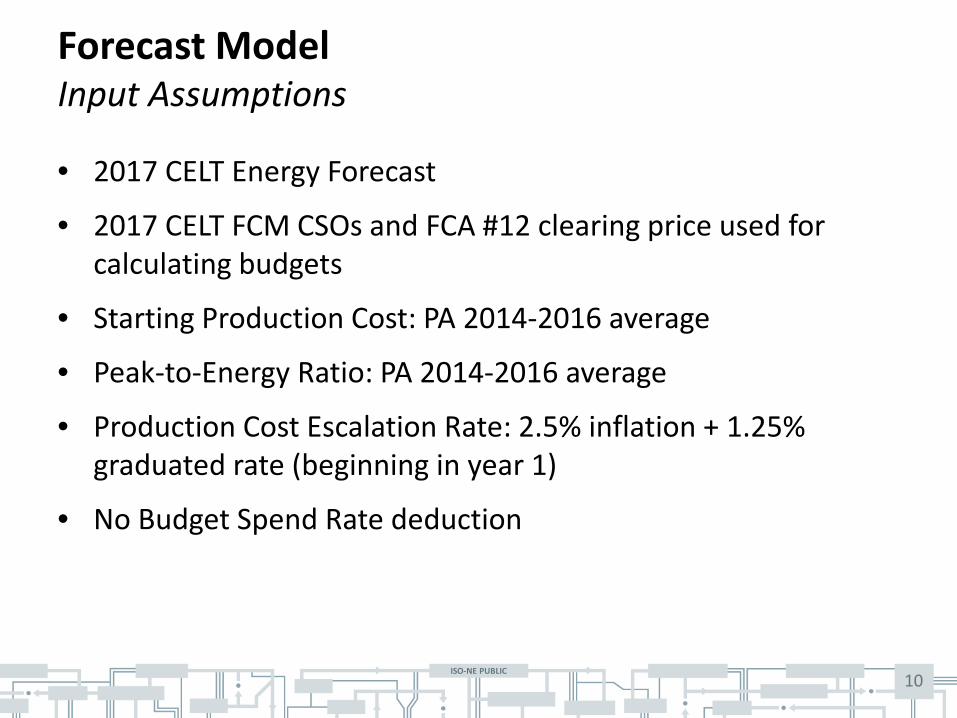
Forecast Model Input Assumptions
• 2017 CELT Energy Forecast
• 2017 CELT FCM CSOs and FCA #12 clearing price used for calculating budgets
• Starting Production Cost: PA 2014-2016 average
• Peak-to-Energy Ratio: PA 2014-2016 average
• Production Cost Escalation Rate: 2.5% inflation + 1.25% graduated rate (beginning in year 1)
• No Budget Spend Rate deduction

ISO-NE PUBLIC 11
Forecast Model Assumptions Regarding the Forward Capacity Market
• FCM clearing price was held constant at the FCA #12 clearing price of $4.63/kW-month†
• ISO assumes that all achieved EE capacity will be bid into and clear in future FCA’s‡
† FCA clearing price used is for modeling purposes only and should not be considered an indication of future clearing prices. ‡ The ISO assumption that all achieved EE capacity would be bid into and clear in future FCA’s is only for modeling purposes and should not be considered an indication of any future FCA outcome.

ISO-NE PUBLIC
Forecast Model Fundamentals
• Compute Annual Energy Savings
12
Annual Energy Savings = (1 − Budget Spend Rate Modifier) ∗ (Budget)
(Production Cost) ∗ (Production Cost Esclator)
Annual Demand Savings = (Annual Energy Savings) ∗ (Peak−to−Energy Ratio)
• Compute Annual Demand Savings
• Where: – Budget Spend Rate Modifier (%) = % to reduce state budgets – Budget ($) = $SBC + $RGGI + $FCM + $Policy – Production Cost ($/MWh) = cost to develop a MWh of annual savings – Production Cost Escalator (%) = % increase in annual production cost – Peak-to-Energy Ratio (MW/MWh) = ratio of annual demand to annual
energy savings

ISO-NE PUBLIC ISO-NE PUBLIC
UPDATE TO FORECAST METHODOLOGY Incorporating ARA 3 Qualification
13

ISO-NE PUBLIC 14
2018 Update to Forecast Methodology Background
• FCM values are used as the starting point for the EE forecast and determine the overall magnitude of the EE forecast
• In 2012 and 2013 the actuals in the EE forecast were FCM CSO as acquired through the primary FCA – The CSO values were found to under represent EE in the market – Projects that delisted or failed to clear in the primary FCA were still in
operation
• Beginning in 2014, the EE forecast actuals were represented by FCM Existing Qualified + New Cleared – Existing Qualified + New Cleared is a value determined over 3-years prior
to the start of the relevant Capacity Commitment Period
• Qualification for ARA 3 is held just a few months prior to the start of the relevant Capacity Commitment Period
• ISO has observed that ARA 3 Qualification diverges from, and is higher than, Existing Qualified + New Cleared, especially in recent years
ISO-NE PUBLIC 15
2018 Update to Forecast Methodology Background
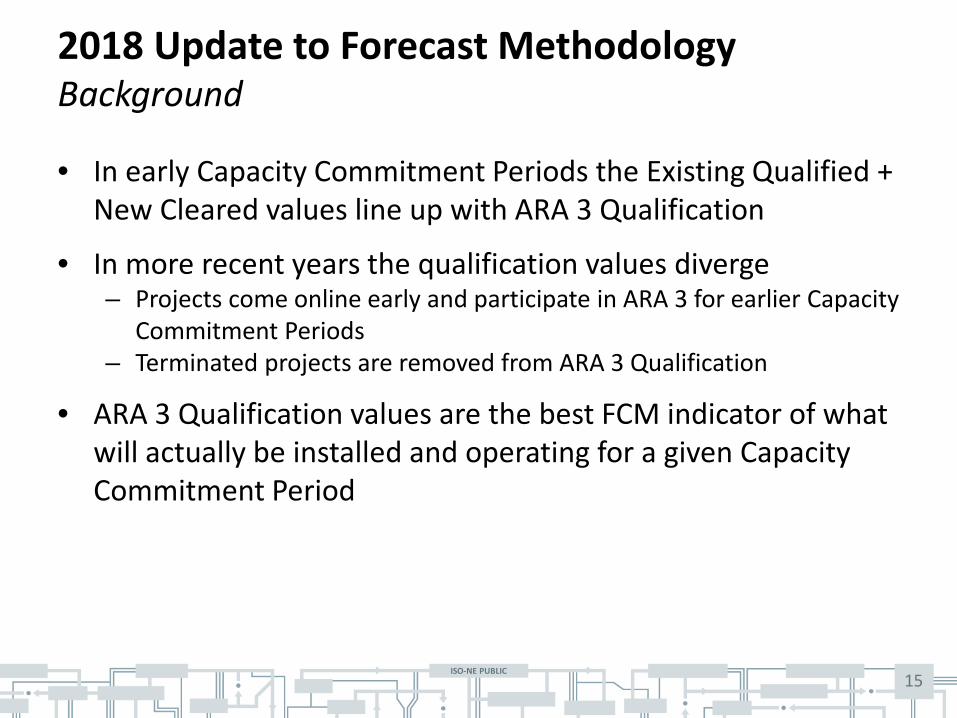
• In early Capacity Commitment Periods the Existing Qualified + New Cleared values line up with ARA 3 Qualification
• In more recent years the qualification values diverge – Projects come online early and participate in ARA 3 for earlier Capacity
Commitment Periods – Terminated projects are removed from ARA 3 Qualification
• ARA 3 Qualification values are the best FCM indicator of what will actually be installed and operating for a given Capacity Commitment Period

ISO-NE PUBLIC
2018 Update to Forecast Methodology Structural Changes
• Replace Existing Qualified + New Cleared with ARA 3 Qualification – ARA 3 Qualification is the most up to-date annual FCM quantity
available for any given Capacity Commitment Period – ARA 3 Qualification accounts for projects that come online early as
well as those that undergo full or partial termination
• Impacts – Year 1 of the forecast will be ARA 3 Qualification (fixed) – Years 2 through 10 of the forecast will be forecast values
• Forecast methodology will remain unchanged (budgets, production costs, peak-to-energy ratios)
16

ISO-NE PUBLIC ISO-NE PUBLIC
FORECAST INPUTS Summary of Program Administrator Data and Model Parameters
17
ISO-NE PUBLIC 18
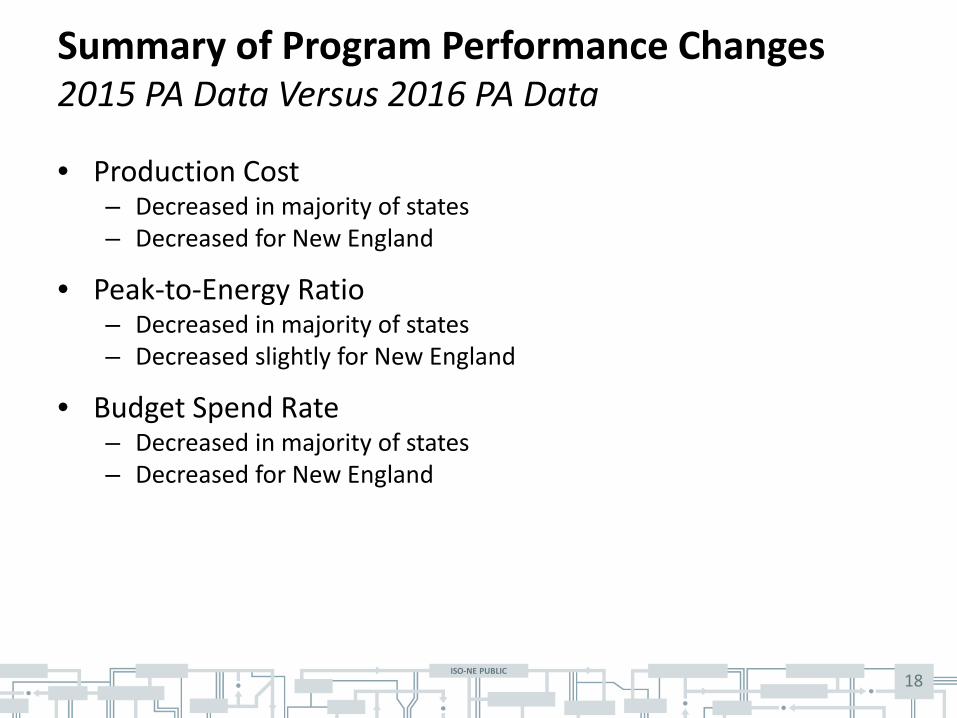
Summary of Program Performance Changes 2015 PA Data Versus 2016 PA Data
• Production Cost – Decreased in majority of states – Decreased for New England
• Peak-to-Energy Ratio – Decreased in majority of states – Decreased slightly for New England
• Budget Spend Rate – Decreased in majority of states – Decreased for New England

ISO-NE PUBLIC
Program Data Summary
19
Period Budget ($1000's)
Total Costs ($1000's)
Achieved Annual
Energy (MWh)
Dollars per MWh
Achieved Summer
Peak (MW)
Dollars per MW
% Energy Achieved
% Budget Spent
% Peak Achieved
Peak to Energy Ratio Achieved
(MW/GWh)
Achieved Lifetime Energy
(MWh)
Lifetime Dollars Per
MWh
New England 2011 665,087 518,865 1,575,302 329 200 2,588,882 90% 78% 75% 0.127 17,638,158 29 2012 745,761 648,848 1,723,357 377 221 2,930,052 98% 87% 86% 0.128 18,384,080 35 2013 727,655 707,930 1,833,883 386 254 2,787,351 109% 97% 105% 0.138 20,414,118 35 2014 857,984 862,384 2,063,624 418 275 3,140,299 139% 101% 99% 0.133 18,120,338 48 2015 897,172 923,581 2,375,192 389 333 2,774,547 123% 103% 129% 0.140 26,658,969 35 2016 976,266 908,011 2,454,794 370 335 2,707,974 117% 93% 122% 0.137 23,522,755 39
Avg 2013-2015 827,604 831,298 2,090,899 398 287 2,900,732 123% 100% 111% 0.137 21,731,142 39 Avg 2014-2016 910,474 897,992 2,297,870 392 314 2,874,273 126% 99% 117% 0.137 22,767,354 40
Massachusetts 2011 432,796 283,898 777,100 365 101 2,823,162 86% 66% 67% 0.129 10,177,753 28 2012 508,987 400,607 980,105 409 125 3,198,050 88% 79% 75% 0.128 10,724,658 37 2013 499,584 438,951 1,116,236 393 160 2,737,910 93% 88% 92% 0.144 11,999,747 37 2014 511,262 517,796 1,217,150 425 166 3,115,182 151% 101% 103% 0.137 9,264,658 56 2015 518,345 541,862 1,396,513 388 195 2,771,794 116% 105% 129% 0.140 16,295,573 33 2016 579,676 533,147 1,471,088 362 206 2,593,869 110% 92% 118% 0.140 12,591,048 42
Avg 2013-2015 509,730 499,536 1,243,300 402 174 2,874,962 120% 98% 108% 0.140 12,519,993 42 Avg 2014-2016 536,428 530,935 1,361,584 392 189 2,826,948 126% 99% 117% 0.139 12,717,093 44
Connecticut 2011 129,909 119,426 381,974 313 43 2,769,490 93% 92% 87% 0.113 3,163,706 38 2012 120,177 121,826 308,428 395 40 3,032,738 131% 101% 124% 0.130 3,116,688 39 2013 97,955 121,612 271,480 448 33 3,648,317 139% 124% 130% 0.123 2,885,413 42 2014 174,992 176,459 377,073 468 50 3,507,071 103% 101% 106% 0.133 4,067,290 43 2015 181,980 179,351 411,055 436 64 2,816,838 108% 99% 113% 0.155 4,282,544 42 2016 199,205 199,188 427,036 466 59 3,396,595 107% 100% 110% 0.137 4,977,875 40
Avg 2013-2015 151,642 159,141 353,203 451 49 3,324,075 117% 108% 117% 0.137 3,745,082 42 Avg 2014-2016 185,392 184,999 405,055 457 58 3,240,168 106% 100% 110% 0.142 4,442,569 42
Rhode Island 2011 48,649 36,494 96,009 380 14 2,673,405 94% 75% 71% 0.142 1,076,778 34 2012 61,246 48,870 119,666 408 20 2,504,009 93% 80% 82% 0.163 1,288,325 38 2013 64,179 61,547 149,033 413 25 2,453,415 104% 96% 123% 0.168 1,602,369 38 2014 73,766 74,537 193,613 385 24 3,161,426 107% 101% 59% 0.122 1,781,643 42 2015 86,326 84,400 214,512 393 27 3,069,598 116% 98% 112% 0.128 2,121,586 40 2016 88,468 73,867 213,865 345 27 2,722,154 107% 83% 105% 0.127 2,027,270 36
Avg 2013-2015 74,757 73,494 185,720 397 25 2,894,813 109% 98% 98% 0.139 1,835,199 40 Avg 2014-2016 82,853 77,601 207,330 375 26 2,984,393 110% 94% 92% 0.126 1,976,833 39

ISO-NE PUBLIC
Program Data Summary
20
Period Budget ($1000's)
Total Costs ($1000's)
Achieved Annual
Energy (MWh)
Dollars per MWh
Achieved Summer
Peak (MW)
Dollars per MW
% Energy Achieved
% Budget Spent
% Peak Achieved
Peak to Energy Ratio Achieved
(MW/GWh)
Achieved Lifetime Energy
(MWh)
Lifetime Dollars Per
MWh
Maine 2011 - 22,817 152,663 149 18 1,248,326 117% 0% 100% 0.120 1,447,766 16 2012 - 23,712 143,532 165 12 1,904,497 101% 0% 114% 0.087 1,266,751 19 2013 - 24,279 141,978 171 15 1,603,990 0% 0% 0% 0.107 2,043,036 12 2014 26,976 21,972 115,847 190 14 1,621,745 0% 81% 0% 0.117 1,014,155 22 2015 41,991 45,493 166,500 273 21 2,124,405 0% 108% 0% 0.129 1,499,177 30 2016 39,288 32,608 139,037 235 21 1,564,454 0% 83% 0% 0.150 1,518,286 21
Avg 2013-2015 22,989 30,581 141,442 211 17 1,783,380 0% 63% 0% 0.117 1,518,789 21 Avg 2014-2016 36,085 33,358 140,461 232 19 1,770,201 0% 91% 0% 0.132 1,343,873 24
Vermont 2011 36,066 37,325 109,514 341 15 2,502,506 72% 103% 69% 0.136 1,099,092 34 2012 35,678 35,130 117,653 299 16 2,172,427 119% 98% 109% 0.137 1,320,789 27 2013 39,495 35,989 96,323 374 12 2,966,434 97% 91% 81% 0.126 1,119,186 32 2014 44,690 45,795 96,557 474 11 4,121,184 113% 102% 74% 0.115 1,141,386 40 2015 44,637 46,598 113,112 412 13 3,516,048 101% 104% 89% 0.117 1,457,163 32 2016 45,189 46,346 134,107 346 15 3,140,437 117% 103% 99% 0.110 1,455,297 32
Avg 2013-2015 42,941 42,794 101,997 420 12 3,534,555 104% 99% 81% 0.119 1,239,245 35 Avg 2014-2016 44,839 46,246 114,592 411 13 3,592,556 110% 103% 88% 0.114 1,351,282 35
New Hampshire 2011 17,667 18,904 58,042 326 10 1,910,689 123% 107% 121% 0.170 673,064 28 2012 19,673 18,703 53,973 347 8 2,376,052 106% 95% 101% 0.146 666,868 28 2013 26,442 25,552 58,833 434 8 3,207,104 111% 97% 107% 0.135 764,368 33 2014 26,298 25,826 63,384 407 10 2,622,172 124% 98% 76% 0.155 851,207 30 2015 23,894 25,877 73,499 352 12 2,240,227 129% 108% 119% 0.157 1,002,926 26 2016 24,441 22,856 69,661 328 8 2,724,396 139% 94% 103% 0.120 952,980 24
Avg 2013-2015 25,545 25,752 65,239 398 10 2,689,834 121% 101% 101% 0.149 872,834 30 Avg 2014-2016 24,878 24,853 68,848 363 10 2,528,932 131% 100% 99% 0.144 935,705 27

ISO-NE PUBLIC
FCM and RGGI Funds
21
RGGI Dollars ($1000's) Applied to EE Annually
New England MA CT* ME RI VT NH 76,513 64,757 7,192 - 2,009 - 2,555
FCM MW
New England MA CT ME RI VT NH 2021 2,975 1,609 681 165 280 120 121
FCM Dollars ($1000's, clearing price of $4.63*)
New England MA CT ME RI VT NH 2021 149,549 89,439 37,862 - 15,544 - 6,704
FCM Dollars for EE ($1000’s)
New England MA CT ME RI VT NH 2019 174,753 107,268 41,694 - 18,293 - 7,498 2020 162,353 98,301 39,448 - 16,964 - 7,641 2021 149,549 89,439 37,862 - 15,544 - 6,704 2022 149,549 89,439 37,862 - 15,544 - 6,704 2023 149,549 89,439 37,862 - 15,544 - 6,704 2024 149,549 89,439 37,862 - 15,544 - 6,704 2025 149,549 89,439 37,862 - 15,544 - 6,704 2026 149,549 89,439 37,862 - 15,544 - 6,704 2027 149,549 89,439 37,862 - 15,544 - 6,704
* RGGI dollars were discounted in 2019, 2020, and 2021 to account for CT budget cuts ** Auction clearing price for Rest-of-Pool

ISO-NE PUBLIC
Energy Forecast
22
2017 CELT Energy Forecast (GWh)
New England MA CT ME RI VT NH 2019 143,447 66,996 34,587 12,885 9,347 6,953 12,679 2020 144,611 67,706 34,733 13,003 9,410 6,992 12,767 2021 145,799 68,400 34,909 13,137 9,472 7,035 12,845 2022 147,127 69,147 35,128 13,291 9,542 7,085 12,933 2023 148,507 69,919 35,359 13,453 9,611 7,137 13,028 2024 149,884 70,691 35,586 13,611 9,685 7,189 13,122 2025 151,233 71,453 35,802 13,763 9,760 7,240 13,215 2026 152,593 72,227 36,018 13,910 9,836 7,291 13,311 2027 153,953 73,002 36,234 14,058 9,911 7,342 13,406
2017 CELT Energy Forecast - FCM Passive Demand Resources (GWh)
New England MA CT ME RI VT NH 2019 128,536 59,055 31,617 11,622 8,036 6,147 12,059 2020 127,573 58,437 31,126 11,825 7,861 6,263 12,062 2021 128,761 59,131 31,302 11,958 7,924 6,306 12,140 2022 130,089 59,878 31,521 12,113 7,994 6,356 12,227 2023 131,469 60,650 31,752 12,275 8,063 6,408 12,322 2024 132,846 61,421 31,979 12,433 8,136 6,460 12,416 2025 134,195 62,183 32,195 12,585 8,211 6,511 12,509 2026 135,555 62,958 32,411 12,732 8,287 6,562 12,605 2027 136,915 63,733 32,626 12,880 8,363 6,613 12,701

ISO-NE PUBLIC
Energy Forecast
23
SBC Eligible
MA CT ME RI VT NH 85.9% 94.7% 98.7% 100.0% 100.0% 100.0%
SBC Eligible 2017 Energy Forecast - FCM Passive Demand Resources (GWh)
New England MA CT ME RI VT NH 2019 118,382 50,728 29,941 11,471 8,036 6,147 12,059 2020 117,530 50,197 29,476 11,671 7,861 6,263 12,062 2021 118,609 50,793 29,643 11,803 7,924 6,306 12,140 2022 119,818 51,435 29,850 11,955 7,994 6,356 12,227 2023 121,075 52,098 30,069 12,115 8,063 6,408 12,322 2024 122,329 52,761 30,284 12,272 8,136 6,460 12,416 2025 123,557 53,416 30,488 12,422 8,211 6,511 12,509 2026 124,795 54,081 30,693 12,567 8,287 6,562 12,605 2027 126,032 54,746 30,897 12,712 8,363 6,613 12,701

ISO-NE PUBLIC
Energy Sales and System Benefit Charge
24
Sales (GWh)
New England MA CT ME RI VT NH 2019 111,682 47,857 28,247 10,821 7,581 5,799 11,377 2020 110,877 47,356 27,808 11,010 7,416 5,908 11,379 2021 111,895 47,918 27,965 11,135 7,475 5,949 11,453 2022 113,036 48,524 28,161 11,279 7,541 5,996 11,535 2023 114,222 49,149 28,367 11,429 7,606 6,045 11,625 2024 115,405 49,774 28,570 11,577 7,675 6,094 11,714 2025 116,563 50,392 28,763 11,718 7,747 6,142 11,801 2026 117,731 51,020 28,955 11,855 7,818 6,190 11,892 2027 118,898 51,648 29,148 11,993 7,889 6,239 11,982
SBC Rate ($/kWh)
MA CT ME RI VT NH 0.00250 0.00300 - 0.01122 - 0.00275
SBC Dollars ($1000’s)
New England MA CT* ME RI VT NH 2019 320,715 119,642 11,858 - 85,047 - 31,286 2020 321,848 118,390 25,330 - 88,743 - 31,292 2021 325,218 119,796 78,966 - 90,032 - 31,494 2022 328,865 121,310 79,553 - 91,351 - 31,722 2023 332,557 122,873 80,172 - 92,615 - 31,968 2024 336,228 124,436 80,780 - 93,870 - 32,212 2025 339,820 125,980 81,358 - 95,098 - 32,454 2026 343,398 127,550 81,937 - 96,280 - 32,702 2027 346,928 129,119 82,516 - 97,415 - 32,950
* Reflects reduced SBC funds to account for CT budget cuts

ISO-NE PUBLIC
Impacts of New EE on Revenue Streams
25
Lost SBC Dollars ($1000’s)
New England MA CT ME RI VT NH 2022 14,808 6,854 2,212 - 5,247 - 494 2023 21,297 9,850 3,180 - 7,556 - 712 2024 27,154 12,548 4,052 - 9,645 - 908 2025 32,382 14,953 4,829 - 11,516 - 1,084 2026 36,997 17,071 5,515 - 13,172 - 1,239 2027 41,028 18,918 6,112 - 14,623 - 1,375
New FCM Dollars ($1000’s)
New England MA CT ME RI VT NH 2022 31,662 21,141 5,814 - 3,265 - 1,442 2023 45,514 30,380 8,357 - 4,701 - 2,076 2024 58,003 38,704 10,650 - 6,001 - 2,649 2025 69,138 46,120 12,693 - 7,165 - 3,161 2026 78,958 52,654 14,494 - 8,195 - 3,614 2027 87,522 58,350 16,064 - 9,097 - 4,010

ISO-NE PUBLIC
Policy Dollars and Total Budgets
26
Policy Dollars ($1000’s)*
New England MA CT ME RI VT NH 2019 525,897 423,965 81,409 39,494 - 53,911 - 2020 555,472 434,184 85,659 39,494 - 54,229 - 2021 610,803 434,205 86,877 39,494 - 55,156 - 2022 603,128 425,839 86,877 39,494 - 55,847 - 2023 596,073 418,032 86,877 39,494 - 56,598 - 2024 589,755 410,844 86,877 39,494 - 57,470 - 2025 585,577 404,288 86,877 39,494 - 59,847 - 2026 580,384 398,303 86,877 39,494 - 60,639 - 2027 575,211 392,885 86,877 39,494 - 60,885 -
Total Budget Dollars ($1000’s)
New England MA CT ME RI VT NH 2019 1,097,879 715,631 142,153 39,494 105,350 53,911 41,339 2020 1,116,186 715,631 157,629 39,494 107,715 54,229 41,488 2021 1,173,606 715,631 212,771 39,494 109,308 55,156 41,246 2022 1,177,892 715,631 215,086 39,494 109,905 55,847 41,928 2023 1,182,103 715,631 217,281 39,494 110,508 56,598 42,591 2024 1,186,280 715,631 219,308 39,494 111,165 57,470 43,212 2025 1,191,773 715,631 221,153 39,494 111,858 59,847 43,790 2026 1,195,513 715,631 222,847 39,494 112,566 60,639 44,336 2027 1,198,538 715,631 224,399 39,494 113,286 60,885 44,844
* Policy dollars are funds not from SBC, RGGI, or FCM revenues. Policy dollars are present in states that set the SBC rate based on budget alone (VT and ME) and states that have a surcharge to cover the balance of the total budget (MA and CT). MA is adjusted to reflect a lower portion of budget coming from SBC due to higher FCM revenue.
ISO-NE PUBLIC
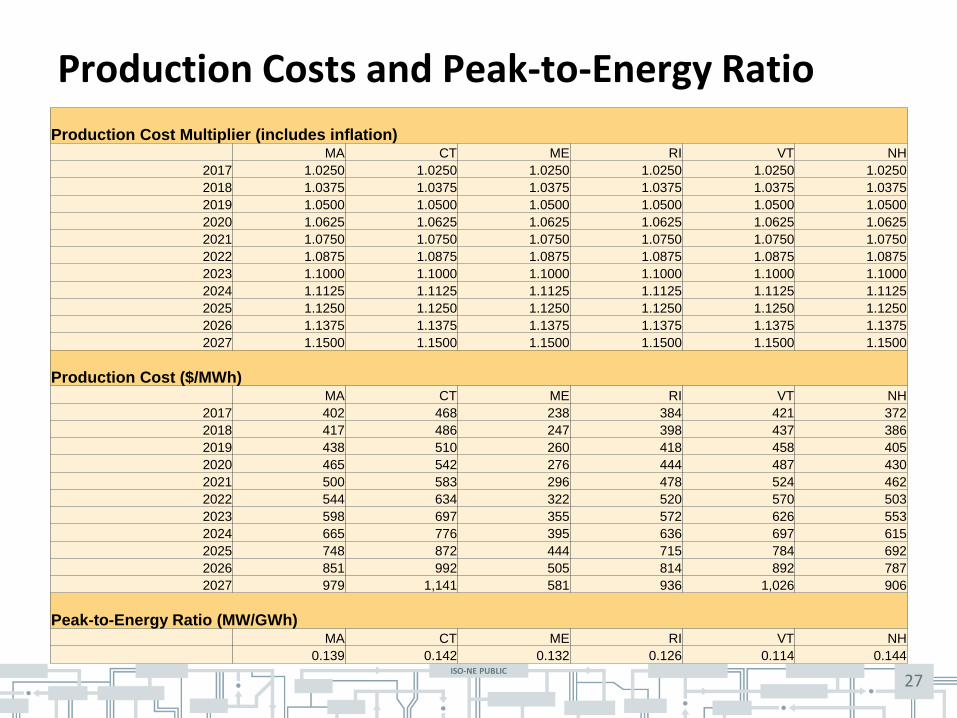
Production Costs and Peak-to-Energy Ratio
27
Production Cost Multiplier (includes inflation)
MA CT ME RI VT NH 2017 1.0250 1.0250 1.0250 1.0250 1.0250 1.0250 2018 1.0375 1.0375 1.0375 1.0375 1.0375 1.0375 2019 1.0500 1.0500 1.0500 1.0500 1.0500 1.0500 2020 1.0625 1.0625 1.0625 1.0625 1.0625 1.0625 2021 1.0750 1.0750 1.0750 1.0750 1.0750 1.0750 2022 1.0875 1.0875 1.0875 1.0875 1.0875 1.0875 2023 1.1000 1.1000 1.1000 1.1000 1.1000 1.1000 2024 1.1125 1.1125 1.1125 1.1125 1.1125 1.1125 2025 1.1250 1.1250 1.1250 1.1250 1.1250 1.1250 2026 1.1375 1.1375 1.1375 1.1375 1.1375 1.1375 2027 1.1500 1.1500 1.1500 1.1500 1.1500 1.1500
Production Cost ($/MWh)
MA CT ME RI VT NH 2017 402 468 238 384 421 372 2018 417 486 247 398 437 386 2019 438 510 260 418 458 405 2020 465 542 276 444 487 430 2021 500 583 296 478 524 462 2022 544 634 322 520 570 503 2023 598 697 355 572 626 553 2024 665 776 395 636 697 615 2025 748 872 444 715 784 692 2026 851 992 505 814 892 787 2027 979 1,141 581 936 1,026 906
Peak-to-Energy Ratio (MW/GWh)
MA CT ME RI VT NH 0.139 0.142 0.132 0.126 0.114 0.144

ISO-NE PUBLIC ISO-NE PUBLIC
FINAL FORECAST New England
28

ISO-NE PUBLIC
Energy and Summer Peak EE Forecast
29
Energy Savings (GWh)
New England MA CT ME RI VT NH 2019 2,690 1,733 295 161 267 125 108 2020 2,568 1,631 308 152 257 118 102 2021 2,494 1,517 387 141 243 112 95 2022 2,302 1,395 360 130 224 104 88 2023 2,099 1,269 330 118 205 96 82 2024 1,893 1,140 300 106 185 87 74 2025 1,690 1,014 269 94 166 81 67 2026 1,490 891 238 83 147 72 60 2027 1,299 775 208 72 128 63 52
Total 2019-2027 18,527 11,366 2,696 1,058 1,822 857 729 Average 2,059 1,263 300 118 202 95 81
Demand Savings (MW)
New England MA CT ME RI VT NH 2019 367 241 42 21 34 14 16 2020 351 226 44 20 32 13 15 2021 341 211 55 19 30 13 14 2022 315 194 51 17 28 12 13 2023 287 176 47 16 26 11 12 2024 259 158 43 14 23 10 11 2025 231 141 38 12 21 9 10 2026 204 124 34 11 18 8 9 2027 177 108 30 10 16 7 8
Total 2019-2027 2,531 1,577 382 139 229 98 105 Average 281 175 42 15 25 11 12

ISO-NE PUBLIC 30
EE Forecast Comparison PA Average Production Cost ($/MWh)
New England MA CT ME RI VT NH 2017 EE Forecast 402 451 211 398 420 398 2018 EE Forecast 392 457 232 375 411 363
PA Average Peak-to-Energy Ratio (MW/GWh)
New England MA CT ME RI VT NH 2017 EE Forecast 0.140 0.137 0.117 0.139 0.119 0.149 2018 EE Forecast 0.139 0.142 0.132 0.126 0.114 0.144
Total EE Dollars (1000s)
New England MA CT ME RI VT NH 2017 EE Forecast
Total 2018-2026 10,699,221 6,451,205 2,188,561 355,446 825,036 568,241 310,733 Average 1,188,802 716,801 243,173 39,494 91,671 63,138 34,526
2018 EE Forecast Total 2019-2027 10,519,771 6,440,682 1,832,627 355,446 991,660 514,582 384,774
Average 1,168,863 715,631 203,625 39,494 110,184 57,176 42,753 Summer Peak Impacts (MW)
New England MA CT ME RI VT NH 2017 EE Forecast
Total 2018-2026 2,386 1,491 509 56 212 37 80 Average 265 166 57 6 24 4 9
2018 EE Forecast Total 2019-2027 2,531 1,577 382 139 229 98 105
Average 281 175 42 15 25 11 12

ISO-NE PUBLIC
New England Energy Efficiency on Summer Peak
31

ISO-NE PUBLIC
New England Energy Efficiency on Summer Peak
32

ISO-NE PUBLIC
New England Energy Efficiency on Annual Energy
33

ISO-NE PUBLIC ISO-NE PUBLIC
FINAL FORECAST States
34

ISO-NE PUBLIC
Massachusetts Energy Efficiency on Summer Peak
35

ISO-NE PUBLIC
Massachusetts Energy Efficiency on Summer Peak
36

ISO-NE PUBLIC
Massachusetts Energy Efficiency on Annual Energy
37

ISO-NE PUBLIC
Connecticut Energy Efficiency on Summer Peak
38

ISO-NE PUBLIC
Connecticut Energy Efficiency on Summer Peak
39

ISO-NE PUBLIC
Connecticut Energy Efficiency on Summer Peak
40

ISO-NE PUBLIC
Maine Energy Efficiency on Summer Peak
41

ISO-NE PUBLIC
Maine Energy Efficiency on Summer Peak
42

ISO-NE PUBLIC
Maine Energy Efficiency on Annual Energy
43
ISO-NE PUBLIC
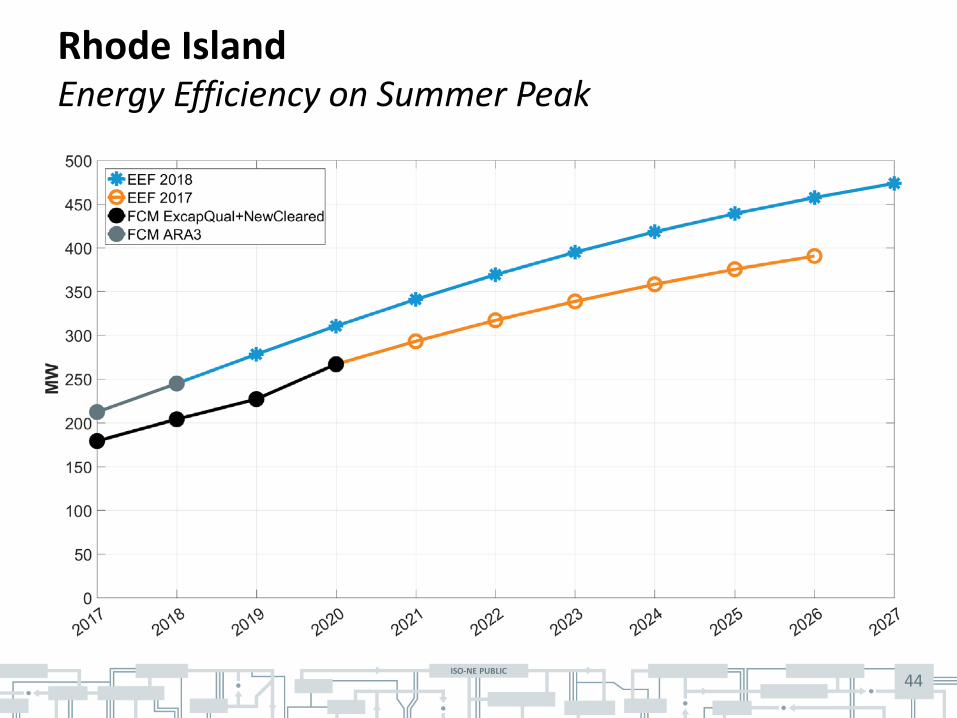
Rhode Island Energy Efficiency on Summer Peak
44
ISO-NE PUBLIC
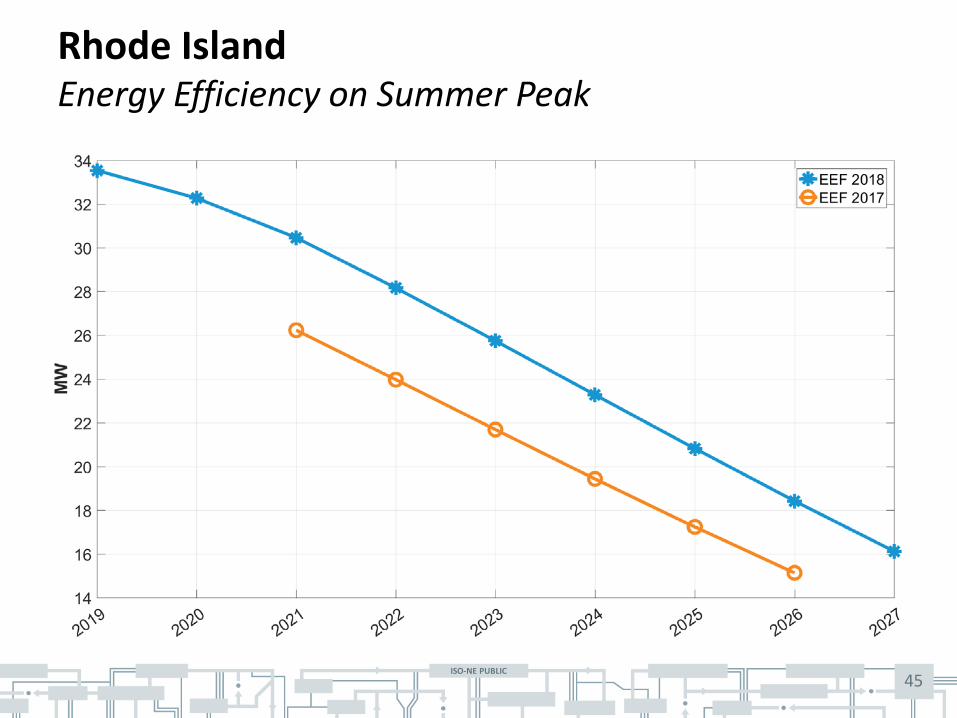
Rhode Island Energy Efficiency on Summer Peak
45

ISO-NE PUBLIC
Rhode Island Energy Efficiency on Annual Energy
46

ISO-NE PUBLIC
Vermont Energy Efficiency on Summer Peak
47

ISO-NE PUBLIC
Vermont Energy Efficiency on Summer Peak
48

ISO-NE PUBLIC
Vermont Energy Efficiency on Annual Energy
49

ISO-NE PUBLIC
New Hampshire Energy Efficiency on Summer Peak
50

ISO-NE PUBLIC
New Hampshire Energy Efficiency on Summer Peak
51
ISO-NE PUBLIC
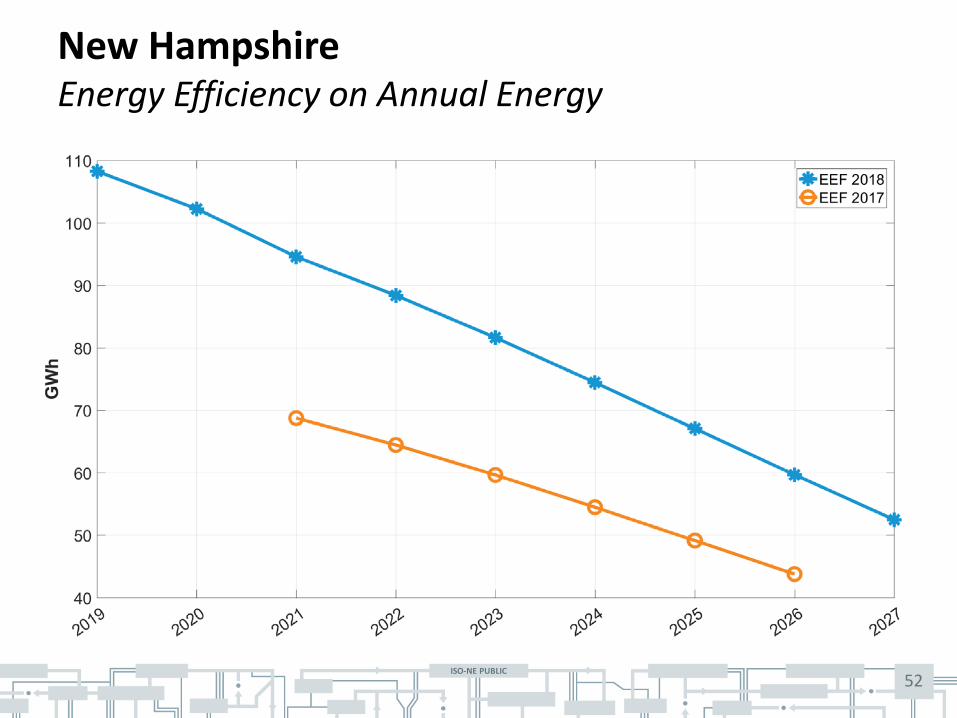
New Hampshire Energy Efficiency on Annual Energy
52