Dale Osborn Midwest ISO October 13, 2008 [email protected] EE 590 Transmission Planning with...
35
Dale Osborn Midwest ISO October 13, 2008 [email protected] g EE 590 Transmission Planning with Significant Energy Resources
-
Upload
denis-eaton -
Category
Documents
-
view
214 -
download
1
Transcript of Dale Osborn Midwest ISO October 13, 2008 [email protected] EE 590 Transmission Planning with...

Dale OsbornMidwest ISO
October 13, [email protected]
EE 590Transmission Planning with
Significant Energy Resources

Historical Methods
• Clair’s presentation– Local generation to serve local load-expanded on
NERC or local reliability criteria– Interties built for reliability, power purchase
opportunities, economics are a plus• LOLE, LOLP reduce the amount of generation that must be
constructed• Contingency for major transmission loss- ice storms• Also sell capacity and energy-power purchase would justify
the line in early years• Sell economy energy

Transmission Planning Methods
• Traditional Reliability Planning-David Duebner– Find a problem– Find the “best” solution
• Energy ( Economic) Planning-Dale Osborn– Find the opportunity– Design a system that would capture an
economic share of the opportunity

New Factors that Require Changes in the Planning Methods
• Open Access Transmission Tariffs• RTO’s- breadth and speed of decision options greatly expanded
– Generation Queue processes– Single transmission source– Energy Markets– Reliability decisions on a wide area and not the sum of individual
decisions-State Estimator Model, Outage Coordination, AFC calcuations,Reliability Coordination, Settlements
– Utility focused planning still required-RTO’s fit the pieces together, they do not define the pieces
• Energy Markets• Ancillary Service Markets and Balancing Area consolidation• Wind Energy- RPS• Carbon reductions• Environmental restrictions• Load response

Transmission Design
• Present transmission systems were not designed to run in multi-RTO energy market environments.
• Generation generally was planned to serve load in a utility area.
• Interconnections were used to increase reliability by pooling generation reserves and for economic energy and power exchanges.
• Transmission could be designed to make the multiple energy markets efficient in the Eastern Interconnection.
• Capacity would still be planned locally for reliability purposes.

Design Criteria
• What do you wish to have the transmission capable of doing?– Peak power delivery- reliability– Economic energy delivery- Benefit/Cost ratio– Both- assignment of capabilities– Exporting of wind energy diversity
• Who would pay for it?– Integrated AC design– HVDC to separate the desing
• How would they pay for it?• Where would it be constructed?• Sequencing- can you get from here to there?

What is needed to plan a transmission system
• Stakeholder participation- Clair-scope of study• Models-transmission, generation, loads-David
Duebner• Generation Forecasts- John Lawhorn• Criteria- present, future
– Political will– Economic performance criteria-order matters– Reliability performance critieria– Evaluation procedure
• Merit evaluation definition

OverlayHub
SPP
MISO
PJM
NYISO
ISO-NE
TVA
EntergySouthern

Dale Osborn, Zheng ZhouMidwest ISOApril, 2008
[email protected]@midwestiso.org
Transmission Plan Based on Economic Studies
Paper 08TD0721 Slides

MISO PJMJoint and CommonMarket

WWW.JCSPSTUDY.ORG

Potential Congestion Relief $M/yr
MISO, $5,808
PJM, $6,679MAPP, $1,131
NYISO, $2,908
SPP, $1,162
SE, $4,288
IMO, $1,143


240,000 MW of Wind Generation

Market Flow


West to East Interface Flows OH-PA
0
5000
10000
15000
20000
25000
0 720 1440 2160 2880 3600 4320 5040 5760 6480 7200 7920 8640
Hour of the Year
MW
Jan Feb Mar Apr May Jun Jul Aug Sep Oct Nov Dec

West to East Flow with HVDC
0
5000
10000
15000
20000
25000
1 1008 2015 3022 4029 5036 6043 7050 8057
Hours
Flo
w (
MW
)
80% of Maximum Loading


765 2200 2600-4500

345 kV - 765 kv Delivery Capacitywith a 5% voltage drop
on a losseles line
0
0.5
1
1.5
2
2.5
3
3.5
0 50 100 150 200 250 300 350
Miles
PU
SIL

Transmission and Substation Costs per Mw-mile by Transmission Voltage And Type of Construction
0
400
800
1,200
1,600
2,000
2,400
2,800
3,200
3,600
4,000
345 kVSteel
WoodedAreas
2-345kkVon Steel
500 kV 765 kV 765 HSIL 800 kV GIL 1200 mile-800kVHVDC
$/M
w-M
ile
Lowest cost options
600 1200 1300 2600 5400 5300 6400Target typical planned loading Mw, use economics to choose voltage

HVDC Advantages• Lower cost per Mw-mile• Smaller ROW- higher power density• Does not interfere with railroad operations• Can be undergrounded for water crossings for longer distances- Norway to the
Netherlands is the longest -420 miles• Provides unique dynamic characteristics to spread a disturbance over a large
generation base quickly in a parallel manner. Can link New Jersey to North Dakota. • No short circuit contributions• No intermediate reactive control substations needed- if you need a tap use AC• Combined with AC systems for contingent operation-5,000 Mw contingency design• Schedulable
– Power flow– Price differences– Frequency– Wind variability– Contingency response– Minimize loop flow

4,00016,000
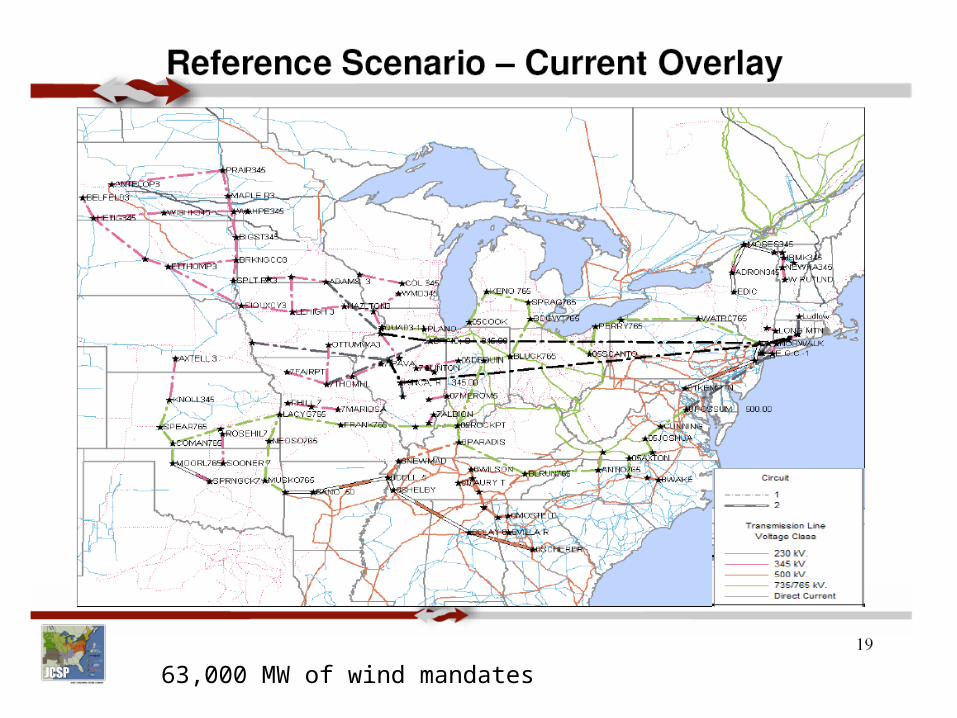
63,000 MW of wind mandates


765 kV
800 kV HVDC
6400 MVA

Generation Connection Capability
• 240,000 MW of wind generation modeled as connected to the transmission system including the overlay
• 180,000 MW of conventional generation modeled as connected to the transmission system including the overlay
• The overlay provides a place to connect generation and deliver the energy

1200/1600 MVA
1200/1600 MVA
1200/1600 MVA
1200/1600 MVA
400 kV
+800 kV
+800 kV
-800 kV
-800 kV
-400 kV
Bi Polar Transmission line
3 HVDC Lines would have 12 terminals at the source and 12 terminals at the sinks-14,400 MW –self contingentA
C
400 MW can be connected per terminal, 1600 Mw total per line with a radial AC backup system

To HVDC
For standard 2600 MW rated765 kV lines 2600 MW can bedelivered to the HVDC lineWhich is rated at 4800 MW
Series capacitors, double circuits,HSIL construction all could doubleThe delivery capability and thus Increase the generation Connection and delivery capability
Advantage of looping transmission

To HVDC
Advantage of looping transmission
Cross links to a terminal or terminals can double the delivery to the HVDC terminal
5200 MW for
standard rated 765 kV
2600 MW
2600 Mw


Determine FuturesRenewable Future20% Wind Energy
+Environmental
$25/Ton CarbonTax+..
Generation Forecastand
Generation Location
Transmission Development
Evaluation of other Futureswith this Futures
Transmission
Selection of A RobustTransmission Conceptwith Future Specific
Transmission Expansions
Reliability Study
Wind Integration StudySimulations to DetermineAdequacy of GenerationControls to Fit the Short
Term
Real Time Simulation
Wind Hourly Data
LOLE
Wind Data fromSeconds to Hours
Power System Conceptual Design