Film Availability in Netflix Country Stores in the EU · 3 Abstract This study compares the film...
23
INSTITUTE FOR PROSPECTIVE TECHNOLOGICAL STUDIES DIGITAL ECONOMY WORKING PAPER 2015/11 Authors: Michail Batikas, Estrella Gomez- Herrera and Bertin Martens Film Availability in Netflix Country Stores in the EU 2015
Transcript of Film Availability in Netflix Country Stores in the EU · 3 Abstract This study compares the film...
INSTITUTE FOR PROSPECTIVE TECHNOLOGICAL STUDIES DIGITAL ECONOMY WORKING PAPER 2015/11
Authors: Michail Batikas, Estrella Gomez-Herrera and Bertin Martens
Film Availability in Netflix Country Stores in the EU
2015

Film Availability in Netflix Country Stores in the EU

This publication is a Working Paper by the Joint Research Centre of the European Commission. It results from the Digital Economy Research Programme at the JRC Institute for Prospective Technological Studies, which carries out economic
research on information society and EU Digital Agenda policy issues, with a focus on growth, jobs and innovation in the Single Market. The Digital Economy Research Programme is co-financed by the Directorate General Communications Networks, Content and Technology
It aims to provide evidence-based scientific support to the European policy-making process. The scientific output expressed does not imply a policy position of the European Commission. Neither the European Commission nor any person
acting on behalf of the Commission is responsible for the use which might be made of this publication.
JRC Science Hub
https://ec.europa.eu/jrc
JRC98020
© European Union, 2015
Reproduction is authorised provided the source is acknowledged.
All images © European Union 2015
How to cite:
Michail Batikas, Estrella Gomez-Herrera and Bertin Martens (2015). Film Availability in Netflix Country Stores in
the EU. Institute for Prospective Technological Studies Digital Economy Working Paper 2015/11. JRC98020

2
Table of Contents
Abstract ............................................................................................................ 3
1. Introduction .............................................................................................. 4
2. Data ......................................................................................................... 6
3. Timing and duration of product availability in Netflix ....................................... 7
4. The drivers of cross-border availability .......................................................... 9
5. Conclusions ............................................................................................. 11
References ...................................................................................................... 12
Annex: Figures and Tables ................................................................................ 13

3
Abstract
This study compares the film catalogues among the 11 Netflix country stores in the EU
that provide film streaming services to consumers on the basis of a subscription (SVOD)
business model. We estimate cross-border availability of films in Netflix in the EU at
31%, somewhat lower than the 40% availability of downloadable films in the Apple
iTunes stores in the EU. Availability patterns are to a large extent driven by consumer
preferences and geographical and linguistic proximity. The average delay in availability
between theatre and Netflix release (“windowing”) in the EU11 is 326 days, with wide
variations across countries, compared to only 112 days delay in the US. Windowing
delays are shortening for more recent films. For a sample of films in the UK Netflix
catalogue we find that they remain available for 340 days on average.

4
1. Introduction
With the rise of the internet, worldwide unimpeded access to all kinds of online services,
irrespective of geographical distance or state borders has become the norm. However,
the reality is often quite different for digital media, especially in the EU. Some studies
have documented this fragmentation. Gomez-Herrera & Martens (2015) find that cross-
border availability in the Apple iTunes stores across the EU28 is around 80% for music
and only 40% for film. Gomez-Herrera and Martens (2015) find that cross-border
accessibility of VoD services in the EU is very limited. It is often argued that geographical
market segmentation is caused by consumer preferences for local media content.
However, consumers have preferences for a variety of media content, both foreign and
domestic. Aguiar & Waldfogel (2015) show that further opening of digital music markets
in the EU would increase both consumer welfare and producer revenue. Legal, regulatory
and commercially driven market segmentation do not necessarily result in an optimal
outcome for consumers or producers. Market segmentation restricts competition in
domestic markets and may boost revenue for local producers. The EU Digital Single
Market policy seeks to overcome territorial restrictions in the EU’s internal market for
digital media services and make digital content more widely available, accessible and
portable across borders between EU Member States.
The market for Video-on-demand (VoD) film streaming services is growing rapidly. In
the US, over 40% of all households use one or more video streaming services. Netflix is
the market leader in the US, delivering film streaming to 36% of all households, followed
by Amazon (13%) and Hulu (6%)1. Netflix subscription in Europe is much lower, with
UK subscription reported to be around 14% of all households. Since the EU VoD market
is very fragmented across hundreds of mostly national service providers it is very hard
to estimate Netflix' market shares in all these countries. The impressive take-up of VoD
services in national markets hides the fact that there is virtually no cross-border access
to these online services in the EU. Beyond cross-border access, a trailblazer study the
European Audio-Visual Observatory (2014) finds that availability of a list of 50 top films
among six national video-on-demand (VoD) providers in seven EU Member States is
around 19% only.
In this study we focus on geographical market segmentation in Netflix, a subscription
VoD platform that has relatively wide geographical coverage in the EU. At the time of
writing Netflix offered streaming services for film and TV series in 22 countries, including
11 EU Member States: Austria, Belgium, Denmark, Finland, France, Germany, Ireland,
Luxembourg, Netherlands, Sweden and United Kingdom 2 . Its nearest competitor,
Amazon Instant Video, is available in the UK, Germany and Austria only and offers both
streaming and downloads film services on a transaction basis (TVoD). Apple iTunes and
Google Play cover the EU28 but only provide film download services (rental and
purchase). After a successful start in the UK and Ireland (shared language with its home
market in the US) and in the Nordic countries (high broadband penetration rates) it
started in France and Germany and in shared language markets Belgium, Luxemburg
and Austria. Expansion into shared language markets is a logical strategy since language
is a very strong driver in (cross-border) demand for digital content (Gomez & Martens,
2015).
Netflix services in the EU come with geographical limitations: they are distributed
through separate national stores that are digitally sealed off. As a result, cross-border
accessibility is zero: users living in one country cannot subscribe to Netflix in another
country – unless they use VPN to hide their true IP address and location. Cross-border
portability is also very limited. Netflix services are accessible only in the country where
1 See http://www.geekwire.com/2015/netflix-still-king-of-streaming-video-but-amazon-gaining-market-share/
2 It expanded services to Spain and Portugal in October 2015.

5
a user has established his account and in other geographic locations where Netflix is
available. The available content will vary by geographic location though. Netflix states
that it will use technologies to verify a user’s geographic location3. Early 2015 Netflix
announced plans to make its content available across the globe without users needing to hide their IP by means of a VPN4. It seeks to negotiate content deals on a global basis. It
remains to be seen however if content producers will agree to this and when these plans
become a reality. In the absence of cross-border access, more overlap in Netflix
catalogues between countries would improve cross-border availability and wider access
to all content. In this study we measure to what extent Netflix catalogues in the EU11
actually overlap, or the degree of cross-border availability of films.
In order to fill its country catalogues, Netflix uses a mix of own films and series
productions and deals with other film and TV producers. This market is highly segmented
on a national basis, also because cinema and TV distribution, still the main sources of
film revenue, are organised through national networks. Netflix own productions are
mostly released globally through all Netflix stores but geographical segmentation
remains the dominant option for other producers. Netflix explains that there are three
reasons why a product may not be available in some countries:
Consumer preferences: It adapts the catalogue to regional consumer tastes.
Windowing: There may be different rights owners for a single film which often
implies different timings for making a product available.
No release: Rights for a film may not be available at all in a given region.
The territoriality segmented copyright management regime in the EU is often blamed for
this situation. Making films available in other countries often entails additional costs
associated with the copyright regime. However, film producers and distributors may
decide to restrict availability and accessibility for commercial reasons. Differences in the
“windowing” or timing of online releases across countries, and the interaction with
cinema releases, may play a role. National distributors often get exclusive territorial
distribution licenses that do not allow for cross-border release. Film licenses are usually
agreed for a limited period of time and can expire. If Netflix does not renew the license it
removes the film from the catalogue. Translation and publicity costs may affect
producers’ decisions to make a local version available.
The objective of this study is to document and measure the extent of market
segmentation. It does not try to explain the causes of market segmentation in Netflix.
Since cross-border accessibility is zero and portability is very limited in the EU, we focus
on cross-border availability as the most appropriate measure of market segmentation in
Netflix. In other words, the question that we want to address is to what extent Netflix’
national film catalogues in EU Member States overlap? We compare Netflix film
catalogues in each of the EU11 and in the US to calculate availability. We find that
average availability is about 31% of what it could be in a fully open EU Digital Single
Market, somewhat lower than the 40% availability in Apple iTunes film download stores
in the EU26 (Gomez & Martens, 2015). We also find that common border and language
are the most important drivers of cross-border film availability in the Netflix country
catalogues in the EU.
3 See Netflix Terms and Conditions, Article 6c at
https://www.netflix.com/TermsOfUse?locale=en-GB 4 See http://www.zdnet.com/article/how-netflix-wants-to-end-geoblocking/

6
2. Data
Netflix catalogue data per country were collected from the website www.netflixable.com
on 8th March 2015. Netflixable claims to provide the complete inventory of all films and
TV series that were at least once listed in the Netflix catalogue. We cannot independently
assess the veracity of this claim. The film titles are in the original language in the
Netflixable database. Netflix offers films in translated versions (dubbed or subtitled) in
the destination countries. We consider original language and translated versions to be
identical products.
We combined this with information on the release dates of films and series on Netflix
that were obtained from the website www.istreamguide.com . This leaves the problem
of exit dates from the Netflix catalogue. Netflix usually negotiates a license with film
producers for a limited time period after which films and series are taken off the
catalogue. Information on product exits or the duration of film screenings on Netflix
could be found only for a sample of films in the UK Netflix catalogue on the website
www.netflix.maft.uk. To the best of our knowledge, exit data on other Netflix stores are
not available. Data is available from June 2013 to April 2015. During that period, 1,884
movies/series have been removed. We have initial Netflix release dates for 747 out of
these 1884 products, so we restrict the analysis to that subsample.
We added the country of origin of each film and TV series, based on information obtained
from the OMDB (Open Movie DataBase www.omdbapi.com ) by means of an API. For
films with more than one co-producing country we took the first country in the list
mentioned in the OMDB. This is usually but not necessarily the main producer country.
Finally, we added the theatrical release dates of films per country using data obtained
from The Movie Database (TMDB at www.themoviedb.org )
Altogether there were 7,238 unique films and TV series5 available on Netflix in March
2015 in the combined country catalogues in the EU11 and 8,404 in US (See Table 1 in
annex). Around 22% of all available titles in the Netflix catalogues are TV series. Note
however that our procedure to separate TV series from films did not work for about 17%
of all titles. About 17% of all EU11 films are co-produced between two or more
countries. On average, a co-produced EU11 film has 4.2 co-producing partner countries.
The number of films available varies considerably across the EU11, from 1705 in Austria
to 3230 in Ireland. 909 of the 7,234 unique films in the EU11 are available in only 1
country, ranging from 3 in Austria to 416 films that are only available in France. France
has by far the highest percentage (23%) of films in the Netflix catalogue that are only
available in France. This still remains below the 40% local content requirement for film
and cinema services in France which apparently also applies to online streaming services
(EAO, 2014, p 179). The Netherlands also stands out as having a large offer of very
country specific content, though not all of these are necessarily Dutch films. On the
other hand, only 218 films are available everywhere in the EU11 in each of the 11 EU
catalogues.
Almost one third of the films and TV series offered by Netflix are relatively new and has
been released to theatres or TV channels in the last 4-5 years (see Figure 1 and Table
1). 2,308 films (28%) available in EU11 catalogues were released in 2011 or later.
However, the age distribution varies considerably by country. France has the lowest
percentage of more recent films (19%). This may be due to the windowing rule in
France that restricts digital distribution to films older than 3 years (EAO, 2014).
Table 2A shows film availability in the EU11 by country of origin (CoO) of the films. We
were not able to identify a CoO for each film or series; the CoO of 18% of all films
available in the EU11 remains undefined. Where the CoO was identified, more than 50%
of all catalogue content was from the US. Local content in most EU catalogues is very
5 Each season of the same TV series is considered as a different product.

7
low, except in the main film producing countries Germany (5.9%), France (10%) and the
UK (10%).
With the data from Table 2A we can calculate cross-border availability or the overlap
between Netflix catalogues in each of the EU11 (Table 2B). Overall availability in the
EU11is only 31%, considerably lower than the 40% cross-border film availability in the
iTunes country stores in the EU26 (Gomez et al, 2015). Most films are available in 1-3
countries only. Tables 3A and 3B look at bilateral cross-border availability patterns or
catalogue overlap between each of the EU11 and the US. This reveals strong overlaps
between neighbouring countries and countries that share the same language: Austria-
Germany, Belgium-France-Luxemburg-Netherlands, Ireland-UK, Finland-Sweden.
Cultural proximity and shared language turn out to be the main drivers of cross-border
availability. A more formal analysis of the drivers of cross-border availability is
presented in section 4.
3. Timing and duration of product availability in Netflix
In the previous section we discussed availability at one point in time. However,
availability also varies in time, for at least two reasons. First, “windowing” rules and
practices cause a delay between Netflix and theatre film releases. Second, films are
released on Netflix only for a limited time period.
Windowing refers to the timing and sequence of distribution channels through which
audio-visual content is made available to consumers. Films are released in different
distribution channels (cinema theatres, Pay TV and DVD, Transactional and Streaming
VoD channels). Each channel has its own market and pricing structure. Cinema is
normally the first in the sequence because it fetches the highest revenue. Sequencing
enables producers and distributors to price discriminate between different consumer
groups and to monetize more consumer surplus and increase their revenue.
Ranaivoson et al (2014) provide a comprehensive overview of windowing practices and
regulation in the EU Member States including the pressures and changes that digitisation
is inducing in the market. The regulation of windowing is a Member State competence,
resulting in a wide variety in windowing practices across the EU. There is increasing
pressure to shorten the cinema window in favour of digital releases, also because the
number of competing release channels has increased in recent years (with VoD channels
being added) and smaller films have a hard time making it into the cinemas6. The high
revenue cinema and Pay TV channels resist this pressure however because they remain
the most important sources of revenue and financing of new investments. Moreover,
opening up cross-border online sales across the EU would force some degree of
convergence in release windows, especially for the cinema window. Ranaivoson et al
(2014) document the variety in windowing practices across the EU.
We explore the time lag between theatrical and Netflix release dates for films (see Table
4). Out of the 8,382 films in our sample we found both theatrical and Netflix release
dates for 4,325 films only on TMDB and www.istreamguide.com7.
Table 4 shows differences in theatrical and Netflix release dates for each EU11 and for
the US. The left panel of Table 4 shows this for all films in the Netflix catalogues; the
right hand panel only for films released in theatres in 2013 or later. The left panel
6 See for instance the open letter by Danish film director Anette Olesen (2012) “Danish film is locked inside the cinema” available at http://www.filmdirectors.eu/?p=2452
7 Much of these data are generated through crowd-sourcing on user-editable webpages. Some dates may not be correct. Release dates may not be given for the original film but for a
remake. This may explains some negative figures for the minimum difference in release dates in the second part of Table 4.

8
shows essentially that most films in Netflix are rather old – or that Netflix is a relatively
young distribution channel - with an average delay between theatre and Netflix release
of 2200 days or 6 years in the EU11 and 4500 days (12 years) in the US. It simply
demonstrates that the average film in the US catalogue is twice as old as in the EU11
catalogues. The right hand panel is more informative. It shows that the average delay
between theatrical and Netflix release dates is 326 days in the EU11 and only about a
third (112 days) in the US. The UK (132 days) comes closest to the short theatrical
windows in the US. Other EU11 countries have theatrical windows up to three or four times longer than in the US8. Apart from the UK, other EU consumers have to wait much
longer than US consumers before they get to see their favourite films through SVoD
distribution channels. Longer delays may boost producer revenue but reduce consumer
welfare. Ranaivoson et al (2013, p 6) report the increasing use of day-and-date
simultaneous releases through different distribution channels and reverse windowing
practices that puts (transactional) VoD release before theatres, especially in the US and
for smaller films that do not benefit so much from theatre releases and established
windowing practices. To the best of our knowledge there are no empirical economic
studies yet on the overall welfare implications of shorter theatre release windows and
new sequencing models.
Release or entry dates do not give us any information on the duration of availability of
films (the “holdback period”) or exit dates from Netflix. Netflix explains on its website
that "if we're unable or choose not to renew the license, we have to remove the movie or
TV show from our library. Although Netflix makes every effort to license complete series
of both movies and TV shows; the rights to each particular title are separate and may
not always be available for Netflix to license at the same time9."
Figure 2 (in annex) shows the duration of availability or the screening period for a
sample of Netflix products in the UK catalogue. The dotted line represents the average
number of days that a film/series remains available in Netflix UK (340 days). Figure 3
breaks this time profile down by type of product (films and series, and undefined).
Clearly, the vast majority of products remain available for approximately one year and
then disappear from the catalogue. Lower peaks appear around 15 and 18 months, and
around 1, 3 and 6 months. This shows that Netflix has licence agreements of fixed
duration with most film producers. Figure 3 shows that the time distribution is much
smoother for TV series. There is also a peak around 1 year but it is far less pronounced
and tailing out much more smoothly towards both sides. The category of “undefined”
products comes closer to the time distribution for films, indicating that this category
probably consists mostly of films.
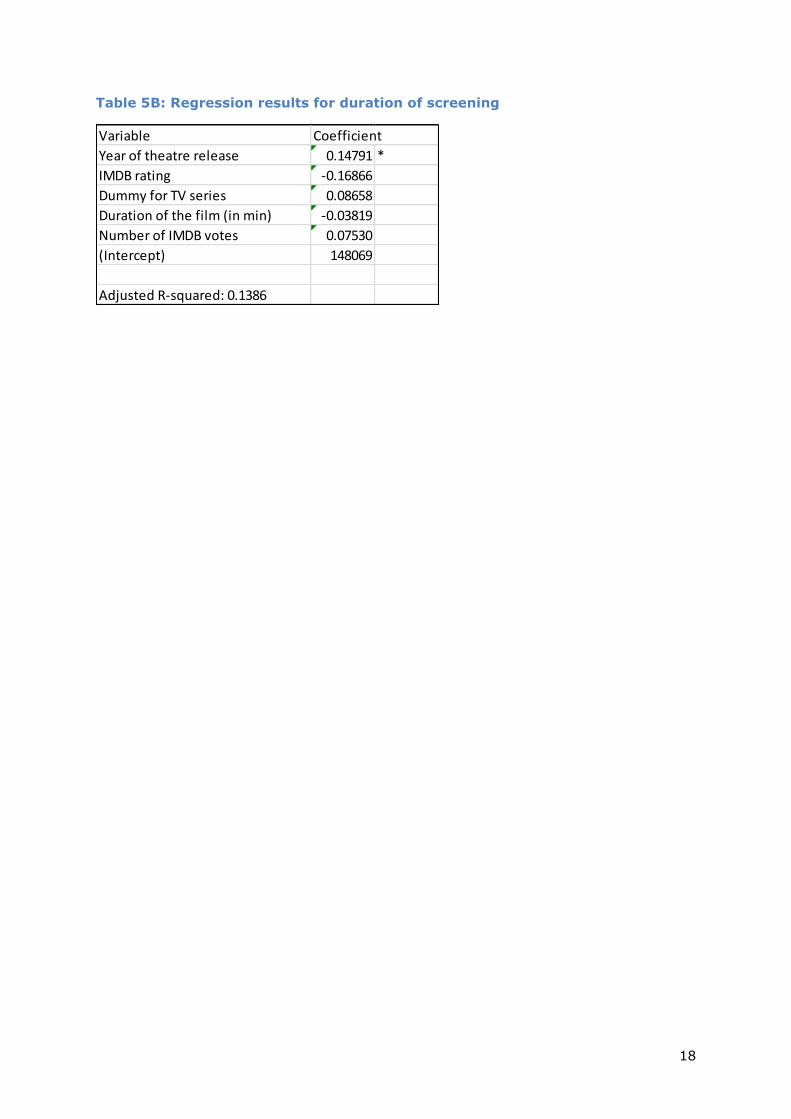
We applied regression analysis (Table 5B) to find out if the duration of screening on
Netflix UK was in any way related to the age of the film, the country of origin, the
runtime (duration) of the film or the quality rating and the number of votes on IMDB.
The results show that the duration is not statistically significantly correlated with any of
these film characteristics except age of the film. The variable "Year" is positive and
significant: more recent films remain on Netflix for a longer period on time. We also
applied regressions to check whether the difference between the theatrical and the
Netflix release dates (“windowing”) for a given movie is related to its characteristics. We
find that more recent films tend to have shorter release delays on Netflix.
8 The data for Belgium and Austria may not be very representative since they rely on a very small sample.
9 https://help.netflix.com/en/node/4976

9
4. The drivers of cross-border availability
The above descriptive statistics on cross-border availability in the Netflix film catalogues
already gave us some indications that cultural proximity factors such as shared language
and geographical distance could be important drivers of availability patterns. To confirm
this hypothesis we run the well-known gravity model on the availability data. The
intuition behind this model is that the volume of trade between two countries (in this
case the number of films available) is a function of the geographical distance between
them, consumer preferences (including language and preference for home market
products) and unobserved country specific factors. Here we run the gravity model on
availability data, a supply side concept. We have no consumer demand or preference
data other than language preferences. Home bias could therefore be interpreted here as
the film producers' and distributors' preferences to make local films available in local
markets. The empirical soundness of the gravity model has been proved many times in
the international trade literature (Anderson and Van Wincoop, 2003; Anderson, 2011)
and well as in the study of international trade in media products and internet services.
Ferreira and Waldfogel (2012) or Gomez-Herrera et al. (2014) provide examples of
applications of these models to the digital music market. We use the following
specification of the gravity model:
ijjiijijijijijtborderlangeldistAvail
4321homlog
where Availijt is the number of films and TV series available from country of origin i
available in country of destination j; ldistij is the logarithm of geographical distance
between the two countries; homeij is a dummy variable that takes value 1 if
consumption is local and langij is a dummy variable that takes value 1 if origin and
destination countries share the same language. i and j
are a set of importer and
exporter dummies to capture all possible unobserved heterogeneity in a given country.
Data on geographical distance are taken from CEPII (2010).
The reason for including the shared language variable is not to gauge the importance of
the original language of the films in their cross-border availability. All films and series in
Netflix are translated into the language of the destination country before being made
available there. Instead, we use language as a proxy for cultural distance between
consumers. Melitz and Toubal (2014) constructed a set of variables to measure
language “distance” from several angles. They include the variables Common official
language (COL), common spoken language (CSL), common native language (CNL) and
linguistic proximity (LP). Using three of these - COL, CNL and LP - they also construct a
composite common language index. With this index they try to capture three different
aspects: (1) the aggregate impact of all linguistic factors on bilateral trade, (2) the
separate role of ease of communication as distinct from ethnicity and trust, and (3) the
contribution of translation and interpreters to ease of communication10.
Another important factor that may shorten cultural distance between countries is a
common border. In equation (2) in Table 5a we substitute langij by the variable borderij,
which takes value 1 when two countries share are contiguous. We introduce these two
variables in separate regressions since they are collinear.
10 In the Melitz and Toubal (2014) dataset, common language index is not defined at domestic level. We use the value 0 in that case. Additionally, they define Belgium and Luxembourg as a single country. We do likewise here. Finally, we reduce the number of countries in this gravity
analysis since the common language index is not defined for all the origin countries in our Netflix dataset.

10
Table 5A shows the results of the gravity model estimation at the country level using
OLS. The dependent variable is the logarithm of the number of films and TV series from
a given country of origin available in one of the 11 EU countries of destination catalogues
in Netflix. A problem with this approach is that approximately half of the country pair
(origin-destination) observations are zero. Since the logarithm of zero is undefined, we
are forced to re-estimate the equations adding 1 to the dependent variable to avoid that
it is excluded in the regression (columns 4-6). This trick plays havoc with the estimation
results. Geographical distance is not statistically significant in any of the specifications.
Home bias is positive and strongly significant: local films are more likely to be available
in national film catalogues. Common border is not robustly significant and then only at
the 10% level in some cases. Both the composite index for language distance and the
dummy for shared language are positive and highly significant. The language index
comes with a higher coefficient than the language dummy.
To avoid the problems posed by the zero observations in the OLS country level
regressions we turn to product level Probit regressions (see Table 6). In this case, the
dependent variable is a binary variable that takes value 1 when a given film or TV series
is available in a Netflix country catalogue, and zero otherwise. We also separate the film
and TV series datasets. The much higher number of observations at product level
produces statistically significant estimations for all variables in almost all specifications.
Geographical distance and home bias have the expected signs and are statistically
significant. TV series show higher coefficient values for both variables. The language
coefficients on the other hand are stronger for films. TV series are often produced by
national TV chains and more tuned to consumer preferences in the home market. This
may explain stronger home bias and a faster attrition in availability with increasing
distance.
The results from these regressions are similar to those in other studies for digital media
products (Lendle et al, 2013; Gomez-Herrera et al, 2014; Gomez-Herrera and Martens,
2015; Alaveras and Martens, 2015). The conclusion from these gravity tests it that
consumer preferences (preference for home market products and for cultural proximity
products) are strong drivers of cross-border availability patterns. Of course, this still
leaves a large margin for other explanatory variables such as geographical fragmentation
in copyright management systems in the EU and commercial strategies of film producers
and distributors. We have no data on these aspects to include in the regression analysis.

11
5. Conclusions
This study compares the film catalogues among the 11 Netflix country stores in the EU
that provide film streaming services to consumers on the basis of a subscription video-
on-demand (SVoD) business model. We estimate cross-border availability of films in
Netflix in the EU at 31%, somewhat lower than the 40% availability of downloadable
films in the Apple iTunes stores in the EU. Geo-blocking of access implies that
consumers cannot overcome restrictions in availability of films across EU11 countries,
unless they apply VPN services to circumvent these restrictions.
We find that availability patterns are to a large extent driven by consumer preferences
for home market products and by geographical and linguistic proximity. We also
document the delay between theatre and Netflix releases of films. In the EU11 this
delay is close to one year, with large variations across EU11 countries, compared to only
112 days delay in the US. EU11 consumers clearly have to wait much longer than their
US counterparts before they get to see their favourite films through VoD channels. We
also find that in the UK the Netflix catalogue carries a film an average for about 1 year
only.
This study measures the extent of geographical fragmentation in the EU SVoD market
and shows that there is still a long way to go to achieve the EU’s policy objectives of an
open and unified Digital Single Market for these services. Will Netflix succeed in
overcoming the barriers to cross-border availability and accessibility in DSM as it
announced in early 2015 by negotiating global licences with its suppliers, or will this
require regulatory intervention? As documented elsewhere (Gomez-Herrera and Martens,
2015), music distribution in the EU made progress in this respect in the last decade with
the gradual shift to multi-territorial licensing and the emergence of multi-national
copyright management companies. Whether this can be replicated in the film industry
remains to be seen.
As a next step in research it would be interesting to assess the economic impact of
market fragmentation on consumers as well as film producers, similar to earlier research
on the digital music market (Aguiar & Waldfogel, 2015). To carry out this economic
welfare analysis, data are required on consumer demand and product pricing by film title
and by country. Netflix does not release any information on demand for its films.

12
References
Aguiar, L. and Waldfogel J. (2015) “The welfare effects of music trade”, JRC/IPTS Digital
Economy working paper 2015/01.
Alaveras G. and B. Martens (2015).”Online trade in services”, JRC/IPTS Digital Economy
working paper.
Anderson, J. (1979) "A theoretical foundation for the gravity equation", American
Economic Review, vol 69, pp 106-116.
Anderson, J. and Van Wincoop, E. (2003) "Gravity with gravitas: a solution to the border
puzzle", American Economic Review, vol 93:1, pp170-192.
Berthelon, M. and Freund, C. (2004) “On the conservation of distance in international
trade”, World Bank working paper 3293.
Blum, B and Goldfarb, A. (2006) “Does the internet defy the law of gravity”, Journal of
international economics, vol 70, pp 384-405.
CEPII (2010) "Gravity data set", available at
http://www.cepii.fr/anglaisgraph/bdd/gravity.htm
European Audio-Visual Observatory (2014) “On-demand audio-visual markets in the EU”,
produced for the European Commission. Available at http://ec.europa.eu/digital-
agenda/en/news/demand-audiovisual-markets-european-union-smart-20120028
Gomez, E., Martens, B and Turlea, G. (2014) “The drivers and impediments for cross-
border e-commerce in the EU”, Information Economics and Policy, Volume 28,
September 2014.
Gomez-Herrera E. and Martens B (2015) “Language, copyright and geographic
segmentation in the EU Digital Single Market for music and film”, JRC/IPTS Digital
Economy working paper.
Gomez-Herrera E and Martens B (2015) “Cross-border access to Video-on-Demand
services in the EU28”, JRC/IPTS Digital Economy working pape.
Lendle, Andreas, Marcelo Olarreaga, Simon Schropp and Pierre-Louis Vezina (2012),
"There goes gravity: how eBay reduces trade costs", CEPR discussion paper,
London
Ranaivoson H, De Vinck S, Van Rompuy B (2014) “An analysis of the rules for
exploitation windows and commercial practices in EU Member States and of the
importance of exploitation windows for new business practices”, Final report of a
study for the European Commission by iMinds.

13
Annex: Figures and Tables
Figure 1: Age distribution of Netflix films
Source: Netflixable and authors’ calculations.
Figure 2: Length of Netflix screening period (all products)

14
Figure 3: Length of Netflix screening period (by type of product)
Table 1: Netflix film catalogue characteristics by country
Table 1: Netflix film catalogue characteristics by country
Country
store #films
#unique
films/cty
Vintage
2011-15 %recent #Films #Series #Undef
Co-
produced
Defined
origin
%co-
produced
AT 1705 3 490 29% 1054 372 279 400 1391 28.8%
BE 2079 93 506 24% 1289 421 369 488 1652 29.5%
DE 1736 34 513 30% 1085 367 284 417 1447 28.8%
DK 2442 17 654 27% 1497 570 375 584 2067 28.3%
FI 2372 20 648 27% 1475 536 361 571 2015 28.3%
FR 1713 416 324 19% 989 367 357 426 1354 31.5%
IE 3230 24 1165 36% 2029 698 503 542 2728 19.9%
LU 1762 7 458 26% 1082 384 296 415 1451 28.6%
NL 2155 273 654 30% 1299 490 366 499 1793 27.8%
SE 2446 14 652 27% 1485 581 380 587 2071 28.3%
UK 3229 8 1170 36% 2023 697 509 526 2620 20.1%
US 8404 3231 38% 4999 1673 1732 1243 6636 18.7%
#films EU11 7238 909
Source: Netflix data and JRC/IPTS calculations

15
Table 2A: Film availability in the EU11 Netflix categories
Table 2: Film availability in the EU11 Netflix catalogues
Origin/Destination AU BE DE DK FI FR IE LX NL SE UK US
Argentina 4 6 4 7 6 6 6 5 5 7 6 15
Australia 25 18 26 26 25 24 47 14 19 26 44 82
Austria 2 6 8 2 2 4 5 1 4 2 4 12
Belgium 3 35 3 3 3 7 4 8 9 3 4 19
Bosnia 1 1 1 2 1 1 1 1 1
Brazil 1 1 1 2 1 1 2 1 10
Bulgaria 1
Canada 86 73 87 100 93 66 156 69 82 100 150 338
China 9 2 9 4 3 3 12 3 4 4 8 47
Croatia 2
Czech Republic 1 6
Denmark 6 7 6 33 22 4 15 8 5 23 15 25
Estonia 1
Georgia 1
Finland 2 2 2 3 13 5 1 1 3 2 6
France 61 113 66 56 57 171 59 112 59 58 58 189
Germany 93 25 102 29 28 11 31 61 24 29 31 95
Greece 1 2 1 2 2 1 1 1 2 1 3
Hong Kong 5 2 5 11 11 5 5 3 5 11 5 48
Hungary 5 4 2 1 5 1 4
Iceland 2 2 2 1 3 1 2 1 1 1 2
India 2 2 2 7 7 1 66 2 4 7 65 124
Iran 1 2 1 1 1 1 2 2 8
Ireland 9 9 9 9 9 10 19 1 11 9 19 22
Israel 1 3 2 1 1 5 5 3 3 1 5 12
Italy 12 13 15 13 13 14 16 10 10 14 15 59
Japan 23 15 24 12 10 24 37 10 11 11 37 116
Latvia 1
Liechtenstein 2
Luxembourg 1 1 1
Mexico 2 1 3 4 4 3 2 4 3 30
Netherlands 4 22 1 1 1 4 4 3 53 1 4 24
New Zealand 1 7 1 6 23
Norway 3 1 3 21 17 7 4 18 7 18
Philippines 1 1 1 1 2 2 1 1 2 9
Poland 1 3 3 5
Portugal 1 1 1 5
Romania 1 2 2 3 1 2 3 6
Russia 3 1 1 3 4 2 3 1 4 19
Serbia 1 1 1 2 1 3
Slovakia 1
South Africa 1 1 1 1 14
South Korea 2 2 2 3 3 5 9 2 3 3 9 94
Spain 14 16 13 15 15 9 14 17 13 15 15 49
Sweden 6 10 7 21 21 4 6 4 10 22 6 18
Switzerland 1 1 1 2 2 1 2 9
Taiwan 1 1 1 1 10
Thailand 4 1 4 1 1 4 2 1 1 1 2 17
Turkey 1 2 1 1 1 1 4
UK 141 167 147 237 239 115 412 115 207 236 323 678
US 854 1080 873 1423 1388 820 1748 981 1224 1438 1745 4295
Rest of World* 7 7 11 9 8 11 12 4 6 10 12 54
Undefined origin 314 427 289 375 357 359 502 311 362 375 609 1768
Total 1705 2079 1736 2442 2372 1712 3230 1762 2155 2446 3229 8404
% undefined 18.4% 20.5% 16.6% 15.4% 15.1% 21.0% 15.5% 17.7% 16.8% 15.3% 18.9% 21.0%
% from US 50.1% 51.9% 50.3% 58.3% 58.5% 47.9% 54.1% 55.7% 56.8% 58.8% 54.0% 51.1%
% domestic 0.1% 1.7% 5.9% 1.4% 0.5% 10.0% 0.6% 0.0% 2.5% 0.9% 10.0% 51.1%
Source: Netfl ixxable, OMDB and authors' calculations
Note: Rest of the World = Afghanistan, Algeria, Bahamas, Botswana, Cambodia, Chad, Chechoslovakia, Chile,
Colombia, Costa Rica, Dominican Republic, Egypt, Ethiopia, Ghana, Jamaica, Jordan, Indonesia, Kazakhstan, Laos,
Malaysia, Mali, Morocco, Nigeria, Nepal, Pakistan, Palestine, Papua New Guinea, Peru, Puerto Rico, Saudi Arabia,
Senegal, Singapore, Syria, Tanzania, Uruguay, Venezuela, Vietnam

16
Table 2B: Netflix film availability
Table 3A: Cross-border availability of films in Netflix – Netflix film catalogue
overlap between EU11 and US stores (number of films)
Table 3B: Cross-border availability of films in Netflix – Netflix film catalogue
overlap between EU11 and US stores (in percentages)
Table 3A: Netflix film catalogue overlap between EU11 and US stores (number of films)
AT BE DE DK FI FR IE LU NL SE UK US
AT 1705 785 1673 615 604 646 523 975 678 623 528 504
BE 785 2079 785 785 770 1074 701 1350 1349 792 701 606
DE 1673 785 1736 615 603 643 517 971 679 621 522 507
DK 615 785 615 2442 2325 562 910 700 997 2400 912 887
FI 604 770 603 2325 2372 558 886 691 965 2318 887 856
FR 646 1074 643 562 558 1713 534 948 653 569 536 530
IE 523 701 517 910 886 534 3230 599 871 913 3173 1278
LU 975 1350 971 700 691 948 599 1762 985 707 599 558
NL 678 1349 679 997 965 653 871 985 2155 1000 876 742
SE 623 792 621 2400 2318 569 913 707 1000 2446 915 887
UK 528 701 522 912 887 536 3173 599 876 915 3229 1283
US 504 606 507 887 856 530 1278 558 742 887 1283 8404
Source: Netflixxable and OMDB data and JRC/IPTS calculations
Table 3B: Netflix film catalogue overlap between EU11 and US stores (in percentage)
AT BE DE DK FI FR IE LU NL SE UK US
AT 100% 46% 98% 36% 35% 38% 31% 57% 40% 37% 31% 30%
BE 38% 100% 38% 38% 37% 52% 34% 65% 65% 38% 34% 29%
DE 96% 45% 100% 35% 35% 37% 30% 56% 39% 36% 30% 29%
DK 25% 32% 25% 100% 95% 23% 37% 29% 41% 98% 37% 36%
FI 25% 32% 25% 98% 100% 24% 37% 29% 41% 98% 37% 36%
FR 38% 63% 38% 33% 33% 100% 31% 55% 38% 33% 31% 31%
IE 16% 22% 16% 28% 27% 17% 100% 19% 27% 28% 98% 40%
LU 55% 77% 55% 40% 39% 54% 34% 100% 56% 40% 34% 32%
NL 31% 63% 32% 46% 45% 30% 40% 46% 100% 46% 41% 34%
SE 25% 32% 25% 98% 95% 23% 37% 29% 41% 100% 37% 36%
UK 16% 22% 16% 28% 27% 17% 98% 19% 27% 28% 100% 40%
US 6% 7% 6% 11% 10% 6% 15% 7% 9% 11% 15% 100%
Average 47% (incl domestic)
36% (excl shared language)
41% (incl shared language)
Cross-border
Cross-border

17
Table 4: Theatre versus Netflix film release dates (ranked by difference in
release days >2013
Table 5A: Gravity equation at country level (OLS estimation)
(1) (2) (3) (4) (5) (6)
OLS OLS OLS
OLS (1+X)
OLS (1+X)
OLS (1+X)
ldist -0.0992 -0.0807 -0.0465 0.0079 -0.0064 0.0428
(0.096) (0.086) (0.096) (0.066) (0.065) (0.068)
Home 0.9655*** 1.0315*** 1.4213*** 1.1194*** 1.0850*** 1.5450***
(0.339) (0.314) (0.339) (0.280) (0.269) (0.286)
Common border 0.2769*
0.1772 0.3431***
0.2450*
(0.165)
(0.172) (0.132)
(0.139)
Common lang dummy
0.4508***
0.2837***
(0.115)
(0.073)
Common lang index
0.8275***
0.8175***
(0.260)
(0.189)
Constant 0.3479 0.2485 -0.2605 -0.2281 -0.0813 -0.6208
(0.850) (0.755) (0.839) (0.560) (0.546) (0.581)
Observations 540 540 517 1,068 1,068 1,006
R-squared 0.914 0.917 0.916 0.912 0.913 0.916
Robust standard errors in parentheses. All specifications include origin and destination country fixed effects.
*** p<0.01, ** p<0.05, * p<0.1
Table 4: Theatre versus Netflix film release dates (ranked by difference in release days ≥ 2013)
Total
#films
#Films
with
release
date info
Mean
diff in
release
dates
(days) Max diff Min diff
Total
#films
#Films
with
release
date info
Mean
diff in
release
dates
(days) Max diff Min diff
UK 3211 530 3,234 26,375 592- 528 93 132 733 -592
IE 3217 88 936 8,827 381- 526 32 234 695 -381
FR 1709 290 4,941 26,694 2 130 2 251 499 2
DE 1723 402 3,064 14,693 15- 173 29 339 731 -15
FI 2364 74 2,539 9,539 264 275 13 358 582 264
DK 2437 219 2,320 13,714 88 275 23 375 728 88
SE 2439 98 1,695 9,904 104 275 24 393 727 104
NL 2135 209 1,978 13,213 196- 240 22 394 694 -196
BE 2073 77 1,602 8,971 257 168 7 441 644 257
AT 1693 53 1,899 8,365 675 168 1 675 675 675
LU 1750 0 na na na 171 0 na na na
EU11 7238 2,201 12,754 19 326 610 19
US 8382 2986 4,515 36,249 924- 1531 57 112 16490 -924
Note: negative values in minimum difference are probably due to errors in the data sources
Source: Netflixxable, TMDB and authors' calculations
All films Films released in theatres ≥ 2013
18
Table 5B: Regression results for duration of screening
Table 5: Regression results for duration of screening
Variable Coefficient
Year of theatre release 0.14791 *
IMDB rating -0.16866
Dummy for TV series 0.08658
Duration of the film (in min) -0.03819
Number of IMDB votes 0.07530
(Intercept) 148069
Adjusted R-squared: 0.1386

19
Table 6: Gravity model regressions for cross-border film availability in Netflix (product level Probit regressions)
Table 6: Gravity model regressions for cross-border film availability in Netflix (product level Probit regressions)
(1) (2) (3) (4) (1) (2) (3) (4)
VARIABLES
Log of geographical distance 0.0166 -0.0234 -0.0423*** -0.0099 -0.1562*** -0.2654*** -0.2672*** -0.1595***
(0.019) (0.015) (0.015) (0.018) (0.033) (0.027) (0.027) (0.033)
Home bias 0.2169*** 0.2956*** 0.5449*** 0.5943*** 0.6576*** 0.5012*** 0.5640*** 0.7337***
(0.049) (0.044) (0.050) (0.053) (0.084) (0.078) (0.098) (0.104)
Contiguity 0.2952*** 0.1017*** 0.3783*** 0.3596***
(0.031) (0.034) (0.061) (0.063)
Common official language 0.3937*** 0.1548***
(0.020) (0.044)
Common language index 0.8036*** 0.7576*** 0.2520*** 0.1223
(0.042) (0.045) (0.093) (0.096)
Constant -1.9045*** -1.4788*** -1.5061*** -1.7773*** 1.5366*** 2.5874*** 2.5156*** 1.5432***
(0.343) (0.324) (0.321) (0.335) (0.430) (0.390) (0.393) (0.429)
Country fixed effects Yes Yes Yes Yes Yes Yes Yes Yes
Observations 98,484 98,484 98,352 98,352 28,008 28,008 28,008 28,008
Pseudo R-squared 0.0881 0.0910 0.0908 0.120 0.119 0.119 0.120
Robust standard errors in parentheses
*** p<0.01, ** p<0.05, * p<0.1
Films Series

How to obtain EU publications
Our publications are available from EU Bookshop (http://publications.europa.eu/howto/index_en.htm),
where you can place an order with the sales agent of your choice.
The Publications Office has a worldwide network of sales agents.
You can obtain their contact details by sending a fax to (352) 29 29-42758.
Europe Direct is a service to help you find answers to your questions about the European Union
Free phone number (*): 00 800 6 7 8 9 10 11
(*) Certain mobile telephone operators do not allow access to 00 800 numbers or these calls may be billed.
A great deal of additional information on the European Union is available on the Internet.
It can be accessed through the Europa server http://europa.eu

2
JRC Mission
As the Commission’s
in-house science service,
the Joint Research Centre’s
mission is to provide EU
policies with independent,
evidence-based scientific
and technical support
throughout the whole
policy cycle.
Working in close
cooperation with policy
Directorates-General,
the JRC addresses key
societal challenges while
stimulating innovation
through developing
new methods, tools
and standards, and sharing
its know-how with
the Member States,
the scientific community
and international partners.
Serving society Stimulating innovation Supporting legislation