Filipa Vaz de Carvalho Alves - Estudo Geral · ii ABSTRACT In order to achieve maximum patient...
120
Filipa Vaz de Carvalho Alves PREPARATION AND CHARACTERIZATION OF ORODISPERSIBLE FILMS Master thesis in Pharmaceutical Biotechnology, supervised by Dr Jorge Coelho and by Dr. Sérgio Simões, submitted to the Faculty of Pharmacy of the University of Coimbra. July 2013
-
Upload
nguyenquynh -
Category
Documents
-
view
212 -
download
0
Transcript of Filipa Vaz de Carvalho Alves - Estudo Geral · ii ABSTRACT In order to achieve maximum patient...

Filipa Vaz de Carvalho Alves
PREPARATION AND CHARACTERIZATION
OF ORODISPERSIBLE FILMS
Master thesis in Pharmaceutical Biotechnology, supervised by Dr Jorge Coelho and by Dr. Sérgio Simões, submitted to the Faculty of Pharmacy of the University of Coimbra.
July 2013

i
ACKNOWLEDGMENTS
I would like to thank to my supervisor, Dr Jorge Coelho, for his guidance and support,
expertise and availability throughout this work.
Special thanks to Dr. Sérgio Simões for the great opportunity and to whom I am truly
indebted.
I would like to give particular thanks to everyone in the lab for the help and support. Ana
Borges, Cátia Costa e Branca Silva, many thanks for all the time you spend, for your
friendship and availability.
Thank you, Rui for your love. Thank you for your never-ending support, for your patient and
motivation during the most difficult times.
To all my friends, because this thesis is the culmination of an academic journey that would
not be the same without your friendship. Vanda, Maria João, Luís, Patrícia, Inês, Sara, Licas,
Carlinha, Beto and João, to everyone from Spreita: Alex, Pedro, Artur, and Christian. A
special thank to all of you.
To my brother Eduardo thanks for being a wonderful friend. And finally but not at least, I
would like to thank my parents for all the support and encouragement through these years
and to whom I owe everything I’ve accomplished.

ii
ABSTRACT
In order to achieve maximum patient compliance, pharmaceutical companies have directed
their research to the development of innovative delivery systems. As this matter, oral films
have been claimed as one of the most promising approaches as a new drug delivery for oral
administration, showing great interest and a market opportunity.
As a relatively new pharmaceutical form, there is a lack of information and available studies
concerning this technology. Therefore, it is extremely important to investigate the
characteristics of commercially available oral films, which can provide essential information
to the development of a new product. The main goal of this project was the chemical,
thermal and mechanical characterization of two oral films available in the market: Listerine
from Pfizer and Gas-X from Novartis.
The characterization of the films was carried out using different techniques: chemical
characterization, by FTIR analysis; thermal characterization by TGA, DSC and DMTA;
mechanical properties, by tensile tests. Other important characteristics, such as
disintegration time and water content were also evaluated.
In order to understand the relationship between the composition, preparation procedures
and the final properties of films, an attempt to reproduce Listerine and Gas-X was carried
out. Throughout this work, methodologies for characterization of films were established and
some relevant conclusions were taken. On the matter, it was possible to develop a
formulation with higher similarity to commercial available film (Listerine), which is extremely
relevant in the contribution to the development of new technologies for oral films.
The results presented in Listerine revealed the importance of the formulation used in the
properties of the oral films.

iii
RESUMO
Muitas indústrias farmacêuticas têm direcionado a sua área de investigação para o
desenvolvimento de novos sistemas de entrega de fármacos inovadores. Desta forma, e
devido às inúmeras vantagens inerentes a esta tecnologia, os filmes orais têm sido apontados
como uma das abordagens mais promissoras como novo sistema para administração oral,
revelando-se de grande interesse como oportunidade de mercado.
Sendo uma nova forma farmacêutica, há uma falta de informação disponível e os estudos
incidentes sobre este tema são muito limitados e pouco desenvolvidos. Deste modo, é
extremamente importante procurar investigar as características dos filmes orais
comercialmente disponíveis. Esta informação é fundamental para o desenvolvimento de
novas aplicações e tecnologias de administração oral.
O principal objectivo deste trabalho é a caracterização química, térmica e mecânica de dois
filmes orais disponíveis actualmente no mercado: Listerine produzido pela Pzifer, e o Gas-X
desenvolvido pela Novartis.
A caracterização dos filmes foi realizada recorrendo a diversas técnicas. Caracterização
química por análise de FTIR; caracterização térmica por TGA, DSC e DMTA; e
caracterização mecânica por testes de tracção. Outras características importantes foram
também avaliadas, nomeadamente, o tempo de desintegração dos filmes e o conteúdo de
água residual.
De forma a compreender a relação entre a composição, preparação e as propriedades finais
dos filmes, procedeu-se a uma tentativa de reprodução dos filmes comerciais Listerine e
Gas-X. Ao longo deste trabalho, foram desenvolvidas e estabelecidas metodologias para a
caracterização de filmes orais, o que permitiu obter conclusões muito relevantes não só ao
nível da influência de excipientes nas propriedades. Na verdade, conseguiu-se obter um filme
com grande semelhança ao comercial (Listerine), o que se revela uma mais valia e
contribuição para o desenvolvimento de novas tecnologias de filmes orais.
Os resultados apresentados para o Listerine revelam a importância da formulação nas
propriedades dos filmes orais.
iv
LIST OF ACRONYMS
API Active Pharmaceutical Ingredient
ATR Attenuated Total Reflectance
DMTA Dynamic Mechanical Thermal Analysis
DTG Differential Thermogravimetric Analysis
DoE Design of Experiments
DSC Differential Scanning Calorimetry
Et Young’s modulus
E’ Elastic modulus
E’’ Loss modulus
FDA Food and Drug Administration
FTIR Fourier Transform Infrared Spectroscopy
Tan δ Damping
Tg Glass Transition Temperature
Tonset Extrapolated Tonset Temperature
HPMC Hydropropyl Methylcellulose, Hypromellose
IR Infrared
MDX Maltodextrin
PEG Polyethylene Glycol
TGA Thermogravimetric Analysis
UTS Ultimate Tensile Strength
α Thermal Transition
β Thermal Transition
γ Thermal Transition
εB Elongation
σB Tensile stress at break

CONTENTS
Acknowledgments ........................................................................................................................................ i
Abstract ......................................................................................................................................................... ii
Resumo ......................................................................................................................................................... iii
List of acronyms ......................................................................................................................................... iv
I. Introduction .......................................................................................................................................... 1 1.1 Oral administration ..................................................................................................................... 1 1.2 Oral Strip Technology ................................................................................................................ 2 1.3 Characterization of oral films .................................................................................................... 9
Fourier Transform Infrared Spectroscopy (FTIR) ................................................................. 9 Thermogravimetric Analysis (TGA) ........................................................................................ 10 Differential Scanning Calorimetry ........................................................................................... 11 Mechanical Properties ................................................................................................................ 12 Dynamic Mechanical Thermal Analysis (DMTA) .................................................................. 13 Karl Fisher ..................................................................................................................................... 14 Contact Angle Measurement .................................................................................................... 15 Disintegration ............................................................................................................................... 15
II. Aims of study .................................................................................................................................... 16
III. Material and Methods .................................................................................................................... 17 1. Material ........................................................................................................................................... 17 2. Methods .......................................................................................................................................... 18
2.1 Films preparation ...................................................................................................................... 18 2.2 Storage ..................................................................................................................................... 18 2.3 Characterization ..................................................................................................................... 19
IV. Results ............................................................................................................................................... 22 1. Characterization of commercial films ......................................................................................... 22
i. FTIR analysis ........................................................................................................................... 22 ii. TGA analyses ........................................................................................................................ 24 iii. DSC analysis ......................................................................................................................... 25 iv. Mechanical Properties ........................................................................................................ 26 v. DMTA analysis ...................................................................................................................... 27 vi. Karl Fischer Titration ......................................................................................................... 28 vii. Contact Angle Measurement .......................................................................................... 29 viii. Disintegration .................................................................................................................... 29
2. Characterization of developed formulations ......................................................................... 31 2.1 Listerine ........................................................................................................................................ 31
i. FTIR analysis ........................................................................................................................... 32 ii. TGA analyses ........................................................................................................................ 33 iii. DSC analyses ........................................................................................................................ 38 iv. Mechanical Properties ........................................................................................................ 38 v. DMTA ..................................................................................................................................... 43 vi. Karl Fischer Titration ......................................................................................................... 43 vii. Contact Angle Measurement .......................................................................................... 46 viii. Disintegration .................................................................................................................... 47
2.1.1 Listerine – summary ............................................................................................................... 50 i. FTIR analysis ........................................................................................................................... 51 ii. TGA analysis ......................................................................................................................... 51 iii. DSC analysis ......................................................................................................................... 52 iv. Mechanical Properties ........................................................................................................ 52
v. DMTA ..................................................................................................................................... 53 vi. Karl Fischer Titration ......................................................................................................... 54 vii. Contact Angle Measurement .......................................................................................... 54 viii. Disintegration .................................................................................................................... 55
2.2 Gas-X I ......................................................................................................................................... 56 i. FTIR analysis ........................................................................................................................... 57 ii. TGA analyses ........................................................................................................................ 59 iii. DSC analyses ........................................................................................................................ 62 iv. Mechanical Properties ........................................................................................................ 63 v. DMTA ..................................................................................................................................... 65 vi. Karl Fischer Titration ......................................................................................................... 65 vii. Disintegration ..................................................................................................................... 67
2.3 Gas-X II ........................................................................................................................................ 69 2.4 Gas-X III. ...................................................................................................................................... 70
i. FTIR analysis ........................................................................................................................... 71 ii. TGA analyses ........................................................................................................................ 72 iii. DSC analyses ........................................................................................................................ 75 iv. Mechanical Properties ........................................................................................................ 76 v. DMTA ..................................................................................................................................... 79 vi. Karl Fischer Titration ......................................................................................................... 80 vii. Contact Angle Measurement .......................................................................................... 81 viii. Disintegration .................................................................................................................... 82
2.4.1 Gas-x summary ....................................................................................................................... 84
V. Conclusions ........................................................................................................................................ 85
Future Work .............................................................................................................................................. 86
References .................................................................................................................................................. 87
Appendix A - Chemical structures of excipients ............................................................................... 90
Appendix B - FTIR spectra .................................................................................................................... 92
Appendix C- TGA profiles .................................................................................................................... 96
Appendix D - DSC traces ..................................................................................................................... 101
Appendix E - Stress-strain curves ...................................................................................................... 103
LIST OF TABLES
Table 1: Main components of commercial oral films evaluated. ...................................................................................... 22
Table 2: Typical temperatures extracted from TGA curve. ............................................................................................. 24
Table 3: Summary results of mechanical properties of commercial films . .................................................................... 26
Table 4: Developed and characterized formulations based on DoE screening (List). ................................................. 31
Table 5: Developed formulations with and without Sucralose and acessulfame potassium. ..................................... 32
Table 6: Temperatures extracted from TGA curve (List).. ............................................................................................... 34
Table 7: Main formulations discussed in TGA analysis (List). ........................................................................................... 34
Table 8: Composition of developed formulations (List-Weight loss) ............................................................................. 36
Table 9: Composition of films with TGA profile similar to Listerine. ............................................................................ 37
Table 10: Summary results of developed formulations (Mechanical Properties) ......................................................... 39
Table 11: Developed Formulations. (List-Young's Modulus)t ............................................................................................ 40
Table 12: Developed Formulations. (List-Tensile Strenght). ............................................................................................. 41
Table 14: Developed formulations. (List-Karl-Fischer vs TGA). ...................................................................................... 46
Table 15: Developed formulations. (List-Disintegration time) ......................................................................................... 48
Table 16: Developed formulation with disintegration time similar to Listerine. .......................................................... 49
Table 17: Summary of characterization of List formulations ............................................................................................ 50
Table 18: Defined ranges for concentration %(w/w) on Listerine. .................................................................................. 50
Table 19: Desirable formulation developed. ......................................................................................................................... 50
Table 20: List D and List5 formulations. ................................................................................................................................ 51
Table 21: Summary results of properties of desirable formulation ................................................................................. 52
Table 22: Developed and characterized formulations (Gas I.). ........................................................................................ 56
Table 23: Developed formulations (Gas I. FTIR). ................................................................................................................ 58
Table 24: Temperatures extracted from TGA curve (Gas I.).. ........................................................................................ 60
Table 25: Developed formulations.(Gas I. - Tonset). .............................................................................................................. 60
Table 26: Summary results of mechanical properties of formulations (Gas I) .............................................................. 63
Table 27: Developed formulations (Gas I. Elongation). ...................................................................................................... 64
Table 28: Developed formulation. (Gas I. Water content) ............................................................................................... 66
Table 29: Developed formulations. (Gas I. Disintegration time) ..................................................................................... 68
Table 30: Developed and characterized Gas III. formulations. ......................................................................................... 70
Table 31: Formulations representative of FTIR analysis.. ................................................................................................... 71
Table 32: Temperatures extracted from TGA curve. (Gas III.) ....................................................................................... 73
Table 33: Developed formulations.(Gas III. - Tonset) ............................................................................................................ 74

Table 34: Summary results of mechanical properties of developed formulations (Gas III.).. .................................... 77
Table 35: Developed Gas III formulations. (Gas III. - Mechanical Properties) .............................................................. 77
Table 36: Developed formulations.(Gas III. - Disintegration time). ................................................................................. 82
Table 37: Summary of Gas III characterization. .................................................................................................................... 84

LIST OF FIGURES
Figure 1: Thermogravimetric profiles obtained for different polymers (Gabbott, 2008)................................. 11
Figure 2: Stress-strain curve with representation of yield point. (Adapted from (Blaga, 1973)..................... 13
Figure 3: Schematic representation of preparation of oral films ........................................................................... 18
Figure 4: FTIR spectra of commercial films................................................................................................................ 22
Figure 5: Thermogravimetric analysis of commercial films .................................................................................... 24
Figure 6: DSC traces of commercial films. ................................................................................................................. 25
Figure 7: Stress-strain curves of commercial films ................................................................................................... 26
Figure 8: Dynamic mechanical analysis of commercial films .................................................................................. 27
Figure 9: Residual Water Content in commercial films .......................................................................................... 29
Figure 10: Contact Angle Measurement of commercial films ................................................................................ 29
Figure 11: Disintegration time of commercial films ................................................................................................. 30
Figure12: FTIR analysis of representative formulations. ......................................................................................... 32
Figure 13: Pullulan and Listerine FTIR spectra ......................................................................................................... 33
Figure 14: TGA profiles of representative formulations with and without plasticizer .................................... 33
Figure 15: TGA profile of propylene glycol. .............................................................................................................. 33
Figure 16: TGA profiles of pullulan and Listerine ..................................................................................................... 34
Figure 17: TGA profile of sucralose. ........................................................................................................................... 35
Figure 18: Weight loss until 100ºC .............................................................................................................................. 36
Figure 19: TGA profiles similar to Listerine (List5 and List18). ............................................................................ 37
Figure 20: DSC traces of List formulations ................................................................................................................ 38
Figure 21: Summary results of mechanical properties of developed formulations. .......................................... 39
Figure 22: Stress-strain curves of Listerine and most similar film (List5) ........................................................... 42
Figure 23: DMTA traces (1Hz) of List formulations and comparison with Listerine. ...................................... 43
Figure 24: Residual water content determined by Karl Fischer Titration .......................................................... 43
Figure 25: Comparison of two methods for determination of residual solvent. .............................................. 45
Figure 26: Contact Angle of representative films. .................................................................................................... 46
Figure 27: Disintegration time of developed formulations. .................................................................................... 47
Figure 28: TGA profile of List D (A) and List 5 (B) and its comparison with Listerine. .................................. 51
Figure 29: DSC curve of List D and comparison with Listerine. .......................................................................... 52
Figure 30: Summary results of mechanical properties of desirable formulation. .............................................. 52
Figure 31: Stress-strain curves for Desirable formulation and Listerine ............................................................. 53
Figure 32: DMTA traces of List D, List5 and Listerine. ........................................................................................... 53
Figure 33: Residual water in List D and Listerine...................................................................................................... 54
Figure 34: Contact angle of List D and Listerine....................................................................................................... 54
Figure 35: Disintegration time of List D and Listerine. ........................................................................................... 55
Figure 36: FTIR analysis of Gas I developed formulations ...................................................................................... 57
Figure 37: FTIR analysis of Gas-X and simethicone................................................................................................... 57
Figure 38: TGA profiles of representative formulations. ....................................................................................... 59
Figure 39: TGA curve of HPMC. .................................................................................................................................. 60
Figure 40: Weight loss until 100ºC ............................................................................................................................. 61

Figure 41: DSC curves of representative Gas I. formulations. ............................................................................. 62
Figure 42: DSC curve of simethicone .......................................................................................................................... 62
Figure 43: Summary results of mechanical properties of developed formulations ........................................... 63
Figure 44: Stress-strain curves of Gas-x and most similar (Gas I.10). ................................................................. 65
Figure 45: Residual water content determined by Karl Fischer Titration. ......................................................... 65
Figure 46: Comparison between two methods for determination of residual solvent. .................................. 66
Figure 47: Disintegration time of developed formulations. .................................................................................... 67
Figure 48: FTIR analysis of Gas III developed formulations .................................................................................... 71
Figure 49: TGA curves representative of all Gas III. formulations. ...................................................................... 72
Figure 50: Weight loss until 100ºC of Gas III. formulations .................................................................................. 74
Figure 51: DSC curves for some Gas III. Formulations. ......................................................................................... 75
Figure 52: Summary results of mechanical properties of developed formulations .......................................... 76
Figure 53: Stress Strain curves of Gas-X and similar films. (Gas III.11 and Gas III.19) .................................... 79
Figure 54: DMTA traces (1Hz) of Gas III formulations, Gas I.10 and Gas-X. .................................................. 80
Figure 55: Percentage of water content determined by Karl-Fischer technique. ............................................. 80
Figure 56: Comparison between two methods for determination of residual solvent ................................... 81
Figure 57: Contact angle of developed formulations. ............................................................................................. 81
Figure 58: Disintegration time for Gas III. formulations ......................................................................................... 82

I. INTRODUCTION
1
I. INTRODUCTION
1.1 Oral administration
Due to its ease access and robustness against local stress, oral route is the most preferable
way of administration for the general population. Although it is a convenient and flexible
route for patients, when administrated in oral cavity, drugs are susceptible of enzymatic
degradation and pH variation along the digestive process. Therefore, drugs bioavailability is
decreased and high doses of active principle are required to compensate this gap (Mujoriya
et. al., 2011; Morales et. al., 2011).
Buccal mucosa has demonstrated an excellent platform for absorption of molecules that
have poor dermal penetration, since oral route’s permeability is greater than that in the skin
by approximately 4-4000 times (Dixit et. al., 2009). On the other hand, besides the greater
bioavailability, intestinal epithelium has a larger permeability when compared to buccal
mucosa. Because of this, research has been directed to the use of permeation enhancers in
order to improve the permeation characteristics of the drug and a large investment has been
made in the development of new oral dosage forms, which can lead to eliminate this
limitation (Morales et. al., 2011).
To overcome these and other problems associated with patients’ compliance, several fast-
dissolving drug delivery systems are being developed. Most recently, oral strip technology
has been claimed as one of the most promising approaches as a new drug delivery system
for oral administration.
Besides being a non-invasive system, oral strips have become an important technology for
the application of active pharmaceutical ingredients (API) that are disposed to high level of
degradation in the gastrointestinal tract (Dixit et. al., 2009). Drugs can be directly absorbed
and then first-hepatic metabolism can be bypassed and stomach’s acidic environment can be
avoided. Consequently, efficacy and safety profile of the therapeutic agent can be enhanced
and bioavailability can be improved. The latter results in the use of lower doses and
improved clinical performance through a reduction of side effects (Prajapati et. al., 2009;
Garsuch et. al., 2009).

I. INTRODUCTION
2
1.2 Oral Strip Technology
In order to achieve maximum patient compliance, many pharmaceutical companies have
directed their research to the development of innovative and suitable delivery systems.
Hence, oral strips are gaining the interest of these companies due to more flexibility and
comfort for patients.
Orodispersible films were introduced in 1970’s and have emerged as an advanced alternative
to the traditional tablets, capsules and syrups, since this oral forms require swallowing
(Mishra et. al., 2011). Pfizer introduced Listerine PocketPaks in 2001 as the first thin strip
for breath freshening. However, only nine years after the first oral film in the market,
Zuplenz was approved in US as the first film accepted for prescription, followed by several
(Hoffmann et. al, 2011).
This delivery system consists on a very thin film prepared using hydrophilic polymers and
other excipients, which undergo disintegration in the salivary fluids in less than a minute,
where the API is released. According to regulatory aspects, all the excipients used in the
formulation of oral films should be approved for use in oral pharmaceutical dosage forms.
Furthermore, should be Generally Regarded as Safe, i.e. GRAS listed, according to Food and
Drug Administration (FDA) (Ravneet et. al., 2012; Dixit et. al., 2009; Mahajan et. al., 2011).
The main advantage of oral strips administration is the rapid dissolution on the oral cavity,
without the need of water or chewing. Consequently, geriatric, pediatric and psychiatric
patients are the most prone groups for this recent technology, since these patients have
special drug administration requirements, e.g. they experience difficulties swallowing
traditional oral solid forms. Bedridden, patients with persistent nausea, patients suffering
from dysphagia and Parkinson’s disease or travelling people are also candidates that can take
advantages of this technology.
This technology presents no risks of chocking or suffocation, thus providing improved safety
and patient compliance. Furthermore, intake of the films is very discreet due to its excellent
musoadhesion, and bioavailability is significantly greater than those observed from
conventional tablet dosage form (Siddiqui et. al., 2011; Mahajan et. al., 2011).
Orodispersible films have become very promising in oral drug delivery, facing the traditional
oral forms in the market. In spite of dose uniformity is a technical challenge, oral strips offer
the convenience of administration and accurate dosing when compared to liquid
formulations such as drops or syrups (Arya et. al., 2010).

I. INTRODUCTION
3
The greater disadvantage inherent to this technology is the amount of drug that can be
incorporated into the strip. High doses of drugs are difficult to formulate into oral films
(Hoffmann et. al., 2011). However, researchers have proven that concentration level of API
can extend up to 50% per dose weight. Actually, Novartis Consumer Health’s Gas-X thin
film has a loading of 62.5mg of API, which corresponds to approximately 60% of the film
(Dixit et. al., 2009; Siddiqu et. al., 2011).
As most of the drugs are unpalatable, bitter drugs should be avoided or taste masking is
required to improve patient compliance (Siddiqui et. al., 2011).
Due to its hygroscopic nature, this product requires an extra care during consumer handling
and storage, since it has a high sensitivity to environmental conditions, namely temperature
and moisture (Prajapati et. al., 2009).
1.2.1 Composition
The formulation of oral strips includes a polymer as the essential ingredient for film
formation. The other crucial excipients that should be present in its formulation, apart from
API and polymer, include film stabilizing agents, plasticizers, sweeteners, flavours and colours,
and saliva stimulating agents.
Either alone or in combination to obtain the desired film properties, polymers are used in
the preparation of oral strips. As the most essential component of these films, at least 45%
of this excipient should be present on total weight (Dixit et. al., 2009). However, typically 60
to 65%w/w are preferred to obtain desired properties (Nagar et. al., 2011).
One of the most critical and important parameter for the success of the development of film
formulation is the selection of the polymer. In fact, a right choice in the selection of film
formation can lead to improvements in some characteristics of oral films as hydrophilicity,
flexibility, mouth feel and solubility (Ravneet et. al., 2012).
Since the primary use of oral disintegrating films relies on their disintegration in saliva,
polymers should solubilize on water very easily. Therefore, it is required the use of
hydrophilic polymers that will form a strong non covalent bond with the mucin
molecules/epithelial surface in the buccal mucosa (Morales et. al., 2011; Mujoriya et. al.,
2011).

I. INTRODUCTION
4
Polymers employed in oral film preparation should not retard disintegration time of film
(Nagar et. al., 2011). In fact, polymers with lower molecular weight dissolve quicker,
whereas using a higher molecular weight polymer results in films with better mechanical
properties (Hoffmann et. al., 2011). On this matter, it is important to find an optimum
comprise between the mechanical properties and the time required for dissolution.
The polymer used in oral strip formulation should be non-toxic, non-irritant, devoid of
impurities, should not cause secondary infections in the oral mucosa or dental regions. The
strip robustness and stiffness depends on the type of polymer and the amount in the
formulation. As referred lately, the final product should be tough enough avoiding extra care
during consumer handling and during transportation (Ravneet et. al., 2012).
Another important issue is the cost of the polymers used, which requires that polymers
have to be available in large-scale production at an affordable cost.
Presently, both natural and synthetic polymers are used for preparation of fast dissolving
oral film. Pullulan, starches and modified starches, gelatin or maltodextrin are some of the
natural polymers used in development of strip formulations. On the other hand, hydropropyl
methylcellulose (HPMC) and kollicoat are examples of synthetic polymers commonly used
(Nagar et al., 2011).
Plasticizer has been reported as a critical excipient that affects mechanical properties of oral
strips, such as tensile strength and elongation (Siddiqui et. al., 2011).
The relation between the amount of plasticizer and mechanical properties is dependent on
the volatile nature plasticizer and the type of interaction with the polymer backbone. In fact,
this excipient interacts with film forming polymers by reducing the glass transition
temperature and thereby improving flexibility of the final product. Therefore, selection of
the proper plasticizer relies on compatibility with the polymer and also the type of the
solvent employed in film’s casting. In certain cases, drug molecules themselves can act as a
plasticizer (Kumar et. al., 2010).
High concentrations of plasticizers or inappropriate use may result in film cracking, splitting
and peeling of the strip. Furthermore, the use of this excipient may affect the solubility of
API and the absorption rate of the drug. On the other hand, whereas the brittleness of the
films is reduced, the flexibility is improved (Dixit et. al., 2009; Hoffmann et. al., 2011).
Any active pharmaceutical ingredient that can be administered orally or through the buccal
mucosa is good candidate for film formulation. However, potent drugs that have high first

I. INTRODUCTION
5
pass metabolism and patient non-compliant are the favourites to incorporate onto oral strips.
Furthermore, because the drug loading is limited, high potency low-dose drugs are deserved
(Mahajan et. al., 2011).
As referred lately, the use of taste masking excipient is often essential since many API have
an unpleasant taste. Nevertheless, depending on API physical state in the film and its
solubility in saliva, different methods can be used to improve palatability of the formulation.
The simplest technique is called obscuration technique and involves the addition of
excipients with pleasurable taste, namely flavours or sweeteners. On the other hand,
complexation, encapsulation and polymeric coating can be used as barrier methods. The
type and the amount of the agents can affect disintegration time, stability and mechanical
properties (Dixit et. al., 2009; Hoffmann et.al, 2011).
All these taste-masking techniques affect maximum drug load, hence the rate of drug release
varies. Therefore, the selection of the taste-masking agents should be done carefully for each
individual case and drug.
In the therapy of paediatric patients, if the formulation is too sweet and too pleasurable like
a candy, there is a potential risk for overdosing (Hoffmann et. al., 2011). Consequently, the
use of sweeting agents needs to be restricted and carefully evaluated, not only for paediatric
population, but also for diabetic patients and people with overweight problems. On this
matter, artificial sweeteners have gained popularity in pharmaceutical preparations. Indeed,
multiple artificial sweeteners do not contribute to dental caries and required lower
concentrations when compared to natural sugars (Dixit et. al., 2009).
In order to improve patient compliant, flavours approved by FDA can also be added to films
formulation, alone or in combination. Synthetic flavour oils like peppermint and cinnamon,
or fruit essences like apple, cherry and pineapple are some examples of flavours used in oral
films. The flavour perception it is an individual feeling, depending upon different factors. Also,
the selection of this excipient depends on the type of drug incorporated in formulation and
its amount depends on the flavour type and strength.
For the films administration acceptability, Brown (2003) showed that taste and mouth-feel
are more important than short disintegration times. However, it is a fact that disintegration
rates are a crucial factor in oral strip final product. One strategy to enhance the
disintegration rates is based on the use of excipients to improve salivation. As a matter of
fact, the purpose of using saliva-stimulating agents is to increase the production of saliva that
would help in the faster disintegration of oral films. These agents, generally acids, can be

I. INTRODUCTION
6
used either alone or in combination as salivary stimulants (Ravneet et. al., 2012). Other
excipients referred lately, as sweeteners, are also used as salivary stimulants.
In some formulations, stability and thickening enhancers are employed to improve the
consistency and to prevent particles from sedimentation. Surfactants and emulsifying agents
are also used in small amount as solubilising or dispersing agents, to reduce the
disintegration times and improve the properties of the strips (Siddiqui et al., 2011).
1.2.2 Methods to prepare oral films
The most commonly used industrial methods to prepare oral film are the film casting and
hot melt extrusion methods. In the extrusion process, film-forming polymers, API and other
excipients are mixed in solid and dry state. The blend is subjected to heating process where
solvents are completely eliminated and then extruded out in molten state. Melt is shaped in
films by dies and is further cooled down and cut to film desired size. Due to high
temperature used in this process, API can be degraded and this is an important drawback of
hot extrusion process (Ravneet et. al., 2012; Dixit et. al., 2009; Hoffmann et. al., 2011). In
addition, since extruders are not commonly used in pharmaceutical industry, it is normally
required an extra investment in production equipment (Greb, 2009).
Solvent casting is undoubtedly the most widely used method to formulate oral films, mainly
due to the easiness of the process (Morales et. al., 2011). Preparation of the casting solution
involves the mixing of film-forming polymers and other water-soluble ingredients. Other
excipients, including API, are dissolved in a suitable solvent or solvent system, forming a
clear viscous solution (Mahajan et. al., 2011). Both solutions are mixed and stirred together
and further casted.
During manufacture of the films, some particular factors should be observed with particular
attention, since they can jeopardize the quality of the final product. Hence, particular
emphasis should be given to desired mass to be cast, content or dosage uniformity, air
bubbles entrapped and residual solvents in the final product (Morales et. al., 2011).
The selection of the solvents essentially depends on the API to be incorporated and its
physicochemical properties. Therefore, heat sensitivity and compatibility with excipients and
solvents are some examples of factors that must be critically studied (Dixit et. al., 2009).

I. INTRODUCTION
7
In spite of improving API’s solubility and reducing drying time (an important factor in
manufacture process), organic solvents are normally questioned when used in oral films.
Apart from problems related to environmental safety and health, there are several undesired
hazards inherent to the use of organic solvents. Consequently, all residual solvents should
be reduced as much as possible, or should be entirely eliminated, trying to reach the
specifications required (Hu et. al., 2011). Nevertheless, as many formulations rely on the use
of organic solvents, they should be selected from ICH Class 3 guideline: ‘impurities: guideline
for residual solvents’ (Morales et. al.,2011; Hoffmann et. al., 2011).
In order to achieve the complete dissolution and to improve the homogeneity, a controlled
heating process may be included during the mixing step. Air bubbles entrapped during the
solution preparation tend to produce uneven strips. Therefore, to obtain uniform thickness
and surfaces it is required a deaeration step, which is achieved by using specialized stirring
systems, and vacuum assisted machines (Hoffmann et. al., 2011). The continuous mixing
process is also important in order to keep the viscosity and solution concentration
unchanged.
Another important factor to take into consideration in manufacture process is the moisture
present in the solution. Therefore, it is required the use of appropriate humidity controls in
the manufacturing production area, because this parameter can affect mechanical properties
in final product (Dixit et. al., 2009).
The next step in manufacture of the films is the transfer of solution onto a moving inert
substrate (an intermediate liner) by suitable rollers, where the film casting process is
performed. These rollers can be adjusted to get the desired film thickness, which determine
the drug content of the final strip (Hoffmann et. al., 2011). The resulting wet strip is
subjected to a drying process, in order to removal solvents before being cut into strips
(Prajapati et. al., 2009). After this step, the intermediate liner is removed and the films are
packaged in multi-dose or single-dose packaging. In order to avoid accidental overdosing,
because films can stick together, single packages should be preferred. Some studies indicate a
roll dispenser as a new opportunity for personalized medicine, since films can be cut
individually into desired sizes (Hoffmann et. al., 2011; Allen et. al., 1987; Malke et. al., 2011).
Most challenges in production of orally dissolving strips occur when formulation is scaled up
from bench scale to production scale. Since speeds of coating and drying process directly
influence the production, they are critical steps at this stage. As a matter of fact,
physicochemical properties of the coating solution and wet strip’s thickness could affect

I. INTRODUCTION
8
scale-up process by limiting the drying speed and the thickness of the final product (Greb,
2009). Hence, optimization of these parameters is required for commercial scale throughput.
A proper selection of dryers and the number of online dryers should improve the processing
times and the scale-up process (Dixit et.al, 2009; Prajapati et. al., 2009; Greb, 2009).
1.2.3 Oral films market
Fast-dissolving drug delivery systems were first developed in the late 1970’s as an advanced
alternative to traditional tables, capsules and syrups. Oral films were initially introduced in
the market as breath fresheners and personal care products, such as soap strips, but were
quickly used by pharmaceutical companies for therapeutic benefits.
Nowadays, the most important pharmaceutical companies have recognized the great
potential inherent to oral films and the many possibilities for drugs delivery due to poor
acceptance of the patients. In fact, patients’ compliance is one of the major issues to the
healthcare industry and the costs inherent of noncompliance were estimated in $77 to
$300billion a year in United States, in 2009 (Rekhi, 2009).
On the other hand, oral films have gained more popularity recently due to the need of non-
invasive delivery systems. In fact, a market research report by IBISWorld (2012) refers an
annual growth in last five years (2007-2012) of 30.9% and revenue of one billion dollars. This
fact is easily explained for the clearness of changing market trends and the interest of
pharmaceutical companies in reformulating existing drugs into new dosage forms. Actually,
this strategy has many advantages: not only the cost inherent and time consuming in the
development of new chemical entities, but also the competitive and rewarding field of novel
drug delivery technologies.
Furthermore, instead of 10 years and $330 million invested in the development of new drugs,
the research and the development of a new formulation generally takes only 4 to 5years and
also involves considerable lower costs (Rekhi, 2009).
Oral thin films have been seen as an opportunity to pharmaceutical companies extend
product life cycles that are expiring and will soon be vulnerable to generic competition. Thus,
this delivery drug system shows a great potential in pharmaceutical business.

I. INTRODUCTION
9
1.3 Characterization of oral films
Since the performance of orodispersible films is directly affected by their properties, this
new technology has been requires a deep knowledge and an extensive study of such
properties. Hence, research has been directed to the characterization of oral films, which
can help in formulation and processing of these new oral dosage forms.
According to this, it will be described some chemical, thermal and mechanical
characterization techniques used on this work.
Fourier Transform Infrared Spectroscopy (FTIR)
Infrared (IR) spectroscopy is one of the oldest and well-established experimental techniques
used to characterize organic or inorganic compound (Kong et. al., 2007) Over the past
seventy years, this technique has been applied to the analysis of solids, liquids and gases, with
the main goal of determining the chemical functional groups in samples.
The principles of IR spectroscopy are based in continuously vibration and rotation of the
atoms of any molecule. When a sample is passed by an infrared radiation, its atoms acquire a
specific vibration. If the frequency of this vibration is equal to the frequency of the IR beam
on the molecule, the sample absorbs the incident radiation (Hsu, 1997). The resultant
spectrum represents the IR radiation transmitted or absorbed by a sample as a function of
wavenumber.
FTIR spectroscopy is the preferred method of IR spectroscopy once it allows rapid data
processing and conversion into a spectrum. Actually, FTIR spectroscopy has improved the
quality of IR spectra and minimized the time required to obtain data, since FTIR
spectrometers uses the well-established mathematical process of Fourier transformation to
collect and convert data (Lin et. al., 2012; Stuart, 2004). When accomplished with
Attenuated Total Reflectance (ATR) accessories, this technique improved the potential to
evaluate and quantify different types of samples.
In FTIR-ATR spectroscopy, the IR beam penetrates the surface of the sample pressed against
the ATR crystal. This penetration is called evanescent wave and IR beam’s intensity is
reduced in IR’s spectrum region where the sample absorbs (Hsu, 1997). The resultant
attenuated radiation is measured and plotted, resulting in an absorption spectrum
characteristic of the sample (Stuart, 2002).

I. INTRODUCTION
10
Each peak in an absorption spectrum corresponds to the frequency of a vibration of a part
of a molecule, or a chemical functional group. In fact, different functional groups absorb
characteristic frequencies of IR radiation, so they can be identified (Stuart, 2004).
Since each material is a unique combination of atoms, no two compounds produce the exact
same infrared spectrum. In fact, an IR spectrum is a fingerprint of a particular molecule
characterized by the number, shape and intensity of absorption bands (Kendall, 2006).
Therefore, IR spectroscopy can be use to positively and qualitatively identify different
materials (Lin et. al., 2012).
The peak intensity in resultant spectrum is a direct indication of the amount of the material,
i.e., absorbance is proportional to the concentration of the chemical species active (Lin et. al.,
2012). Therefore, FTIR spectroscopy allows a quantitative determination of compounds in
mixtures, even in small quantities (Hsu, 1997). Adding this to the fact that FTIR spectroscopy
is an extremely sensitive and accurate technique, contaminants can be detected and
identified, resulting in an invaluable tool for quality control.
During the development of oral films and other solid dosage forms, the incompatibilities
between the active pharmaceutical ingredient and other excipients play an important role in
formulation stage. FTIR spectroscopy is a powerful tool since it can be used to assess
possible drug-excipient interactions (Mahajan et. al., 2011).
Thermogravimetric Analysis (TGA)
Thermogravimetric analysis is a widely used thermal technique for characterization of a
variety of materials. Since this analysis involves the measurement of the weight of a sample
as a function of temperature or time, TGA can be used to quantify the weight loss
associated with degradation or transition processes in polymer analysis (Gabbott, 2008;
Stuart, 2002). Therefore, it is a useful tool to provide supplementary information to the
most commonly used thermal technique Differential Scanning Calorimetry (DSC).
In TGA, a sample is submitted to a programmed heating sequence and a sensitive balance
detects the mass change, in a controlled atmosphere. Different effects or degradation
processes can cause weight changes; as evaporation of volatile constituents, drying and
uptake or loss of water in humidity controlled experiment. These events originate a step in

I. INTRODUCTION
11
TGA curve or a peak in differential thermogravimetric (DTG) curve (alternative and
complementary presentation of data results) (Gabbott, 2008).
Once each polymer provides a unique and
characteristic TGA curve, it is expected that
different polymers can be distinguished from
each other’s. A typical TGA curve obtained for
different polymers can be observed in Figure 1,
illustrating how TGA data can be used for
qualitative analysis, looking to temperature range
and to activation energy of decomposition
(Stuart, 2002).
TGA measurements under controlled humidity
are useful to evaluate the interaction of water with polymers, since this factor can have a
significant impact on properties of the materials. Thereby, it is a useful test to evaluate the
phenomenon of adsorption and desorption of water (Gabbott, 2008). In this particular case,
it has proven to be an important factor since it allows evaluating the hygroscopicity of oral
strips.
Differential Scanning Calorimetry
Differential Scanning Calorimetry provides a fast and easy method for thermal analysis. This
technique is very useful for several types of materials and has become the most used thermo
analytical technique. From the single characterization of materials to the investigation of the
interaction between excipients, DSC has a wide range of pharmaceutical applications, since
most phase transitions are accompanied by a change in heat (Bond et al., 2002).
In this method, the sample and the reference material are subjected to identical temperature
conditions in a controlled inert atmosphere and the heat flow associated to thermal events
are measured as a function of temperature or time. Therefore, material can be analysed and
thermal characterized through the identification of different transitions, such as melting point
(Stuart, 2002). In addiction to thermal events, transitions also may be due to chemical
reactions such as polymerizations, oxidation or cross-linking (Gabbott, 2008).
Figure 1: Thermogravimetric profiles obtained for different polymers (Gabbott, 2008).
I. INTRODUCTION
12
These thermal events are represented in DSC plot as peaks associated to endo and
exothermic transitions. For example, melting temperature is represented as an endothermic
event since the sample absorbs energy in this thermal transition.
There are two different conventions for the display of the heat flow curve: according to the
first one, endotherms are represented in the downward direction since endothermic
transitions result in a negative temperature differential; on the other hand, endothermic
events can be represented upward once the endothermic transitions result in an increase in
power supplied to the sample (Gabbott, 2008). Throughout this work, the data is shown
with endotherms down.
In addiction to heat capacity, the enthalpy involved in polymer transitions can also be
measured. The peak area below the curve is proportional to the enthalpy change in the
sample.
Mechanical Properties
There are a number of fundamental techniques used to characterize polymers’ mechanical
properties. Along this work, tensile strength (σB), Young’s modulus (Et), and elongation (εB)
will be the main focus.
To measure these properties, a experiment is done by a strain-controlled instrument where
a test specimen is held between two clamps positioned at a fixed distance: one clamp is fixed
and the other one is subjected to a gradually increasing load until the sample breaks. The
change in strain is plotted as a function of stress resulting in a stress-strain curve. The area
under the curve is often integrated to obtain the energy needed to break the sample and can
be used as an indicator of the toughness of the material (Menard, 1999).
If stress and strain are proportional, a linear graph is produced and the corresponding
deformation is called elastic deformation. The slope of this region is Young’s modulus, which
can be seen as the stiffness of the sample in analysis (Stuart, 2002).

I. INTRODUCTION
13
In Figure 2, it can be observed a squeme of a stress-strain curve with representation of yield
point. Before this point the elongation is
reversible. After this, molecules untangled and
flow over eachother, and further elongation is
irreversible (Stevens, 1999). The Ultimate Tensile
Strength (UTS) corresponds to the maximum
stress than can be sustained by the material and,
if it is maintained, the sample will fracture (Stuart,
2002).
The stress-strain curves were determined at
constant temperature. However, as these properties are temperature dependent, there is a
motivation to relate the mechanical properties with changes in temperature.
Dynamic Mechanical Thermal Analysis (DMTA)
The successful development of polymers applications in drug delivery system and biomedical
devices nowadays have been requiring an extensive characterization and comprehensive
understanding of such materials. In fact, formulation and processing of pharmaceutical
products are directly affected by thermal-mechanical properties, which implicates an
accurately optimisation of the design and hence performance in the development of both
pharmaceutical and biomedical systems (Jones, 1999; Jones et.al., 2012). Therefore, DMTA
has gained increased attention in application for the characterization of pharmaceutical
formulations despite being widely employed in polymers and related industries.
Dynamic mechanical analyses generally involve subjecting samples of known dimension and
geometry to an oscillating force and assessing the relationship between that force and
subsequent deformation (Craig et.al., 1995). This method allows the measurement of
material modulus (stiffness) and its mechanical damping behaviour as a function of
temperature and frequency (Gabbott, 2008; Stuart, 2004). These parameters are reported as
modulus (Storage and Loss) and Tan δ, which are related by the formula:
Tan δ = !!!!!
(Equation 1)
Figure 2: Stress-strain curve with representation of yield point. (Adapted from Blaga, 1973)

I. INTRODUCTION
14
Thus, damping is defined as the ratio between dissipated energy (E’’ – viscous modulus) and
stored energy (E’ – elastic modulus) and allows the measurement of material’s capability of
store and release energy.
DMTA analysis provides the possibility of determining the glass transition temperature (Tg)
with very high accuracy. This transition is related with polymeric chain mobility and
determins the transition from a glass-like state to a rubber-like state (Jones, 1999). DMTA is
the most sensitive technique used for determination of Tg which is typically taken as the
maximum in the damping curve.
Besides Tg, DMTA also provide information about secondary transitions (β and γ). The β
transition is particularly interesting, being associated to the impact strength of the material,
since it contributes to the dissipation of energy.
Karl Fisher
Karl Fischer titration is an analytical method used to determine traces of water in samples.
The reagent used contains all the reactants essential to volumetric titration, which is based
in the reaction of iodine and sulphur dioxide in the presence of an alcohol, usually methanol,
as describe above:
SO2 + I2+2H2O 2HI + H2SO4 (Equation 2)
In volumetric titration method, water reacts with iodine until the water is consumed and the
endpoint is finally reached. Water determination is based on volumetric measurement of
reagent.
Since Karl Fischer titration is not affect by volatile compounds, it is a reliable moisture
determination when compared to TGA analyses until 100ºC.
CH3OH

I. INTRODUCTION
15
Contact Angle Measurement
Contact angle is a method that quantifies the wettability of a solid surface by a liquid. Since
surface tensions involve a solid phase, indirect approaches as contact angle are used to
estimate this parameter.
Establishing the tangent of the angle formed between a liquid and a solid surface easily
performs contact angle measurement. This is defined by the mechanical equilibrium of the
drop under the action of three interfacial tensions: solid-vapor, solid-liquid and liquid-vapor,
which is know as Young’s equilibrium (Kwoket. al., 1999). What is relevant to this work is
that, if the contact angle is elevated, larger than 90°, samples will be considered hydrophobic
and have less capability to retain water. On the other side, if a sample has a low initial
contact angle, smaller than 90°, it means that sample has the capability to retain water
showing that the solid surface is hydrophilic and film is hygroscopic.
Disintegration
It is critical to determine the time required for a film to be dissolved in the saliva.
Disintegration means that an oral film dissolves in a small amount of saliva. Once saliva
composition, pressure and temperature, and tongue movements cannot be mimicked, it is
difficult to adopt and choose an adequate method to determine disintegration time.
However, different methods have been described in literature (Garsuch, 2009a). To
determine disintegration time, oral films are placed on a Petri dish with a certain volume of
artificial saliva and the time at the disintegration begins is measured.
Although this procedure does not mimic the in-use conditions, it can be used to comparison
and reference when the analyses are carry on.

II. AIMS OF STUDY
16
II. AIMS OF STUDY
The main goal of this project is the chemical, thermal and mechanical characterization of
commercially available oral dosage forms. Although oral films have gained more popularity
recently, there are a small number of available studies in the literature. Furthermore, there is
no specification or guidance about the specific values or ranges that define the properties of
oral films. Due to this fact, it is extremely important to investigate the characteristics of
commercially available oral films in the market. With this study, it is possible to provide
essential information to the development of a new technology.
The characterization of the films was carried out using different techniques: chemical
characterization, by FTIR analysis; thermal characterization by TGA, DSC and DMTA;
mechanical properties, by tensile tests. Other important characteristics, such as
disintegration time and water content were also evaluated.
The second step of this project involves an attempt to reproduce two commercial available
oral films, Listerine and Gas-X, in order to understand de relationship between the
composition, preparation procedures and the final properties of these films.
III. MATERIAL AND METHODS
17
III. MATERIAL AND METHODS
1. Material
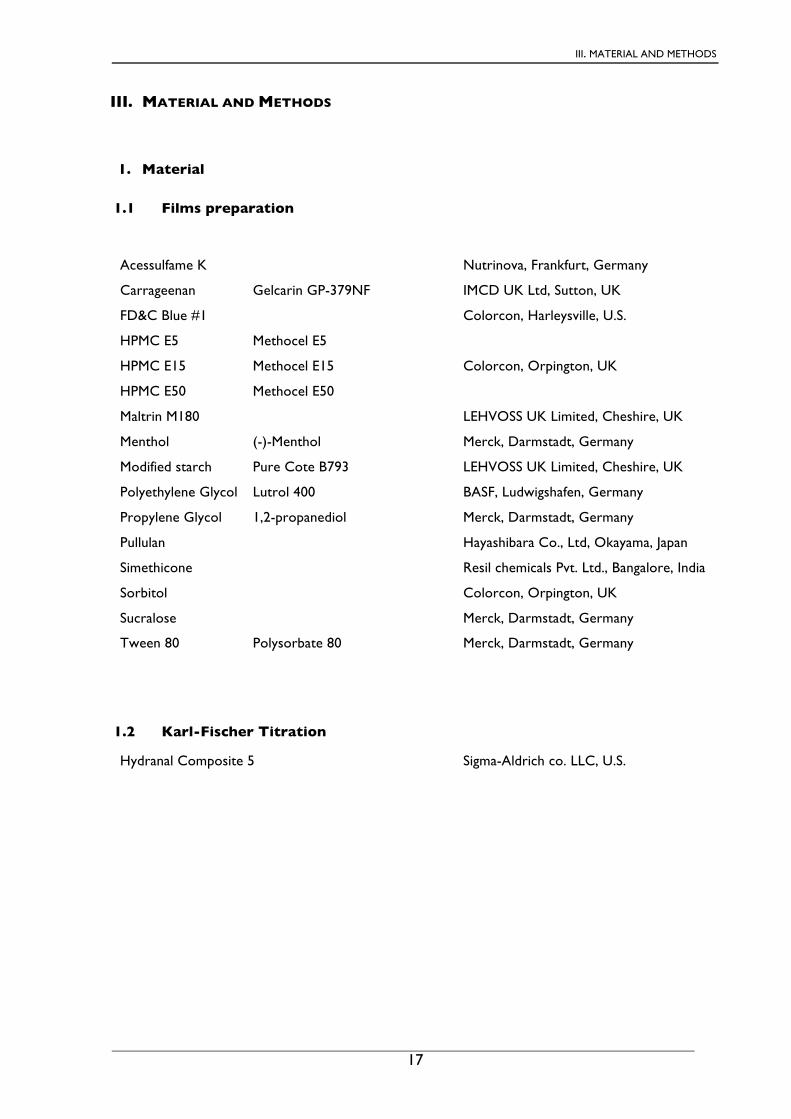
1.1 Films preparation
Acessulfame K Nutrinova, Frankfurt, Germany
Carrageenan Gelcarin GP-379NF IMCD UK Ltd, Sutton, UK
FD&C Blue #1 Colorcon, Harleysville, U.S.
HPMC E5 Methocel E5
Colorcon, Orpington, UK HPMC E15 Methocel E15
HPMC E50 Methocel E50
Maltrin M180 LEHVOSS UK Limited, Cheshire, UK
Menthol (-)-Menthol Merck, Darmstadt, Germany
Modified starch Pure Cote B793 LEHVOSS UK Limited, Cheshire, UK
Polyethylene Glycol Lutrol 400 BASF, Ludwigshafen, Germany
Propylene Glycol 1,2-propanediol Merck, Darmstadt, Germany
Pullulan Hayashibara Co., Ltd, Okayama, Japan
Simethicone Resil chemicals Pvt. Ltd., Bangalore, India
Sorbitol Colorcon, Orpington, UK
Sucralose Merck, Darmstadt, Germany
Tween 80 Polysorbate 80 Merck, Darmstadt, Germany
1.2 Karl-Fischer Titration
Hydranal Composite 5 Sigma-Aldrich co. LLC, U.S.
III. MATERIAL AND METHODS
18
2. Methods
2.1 Films preparation
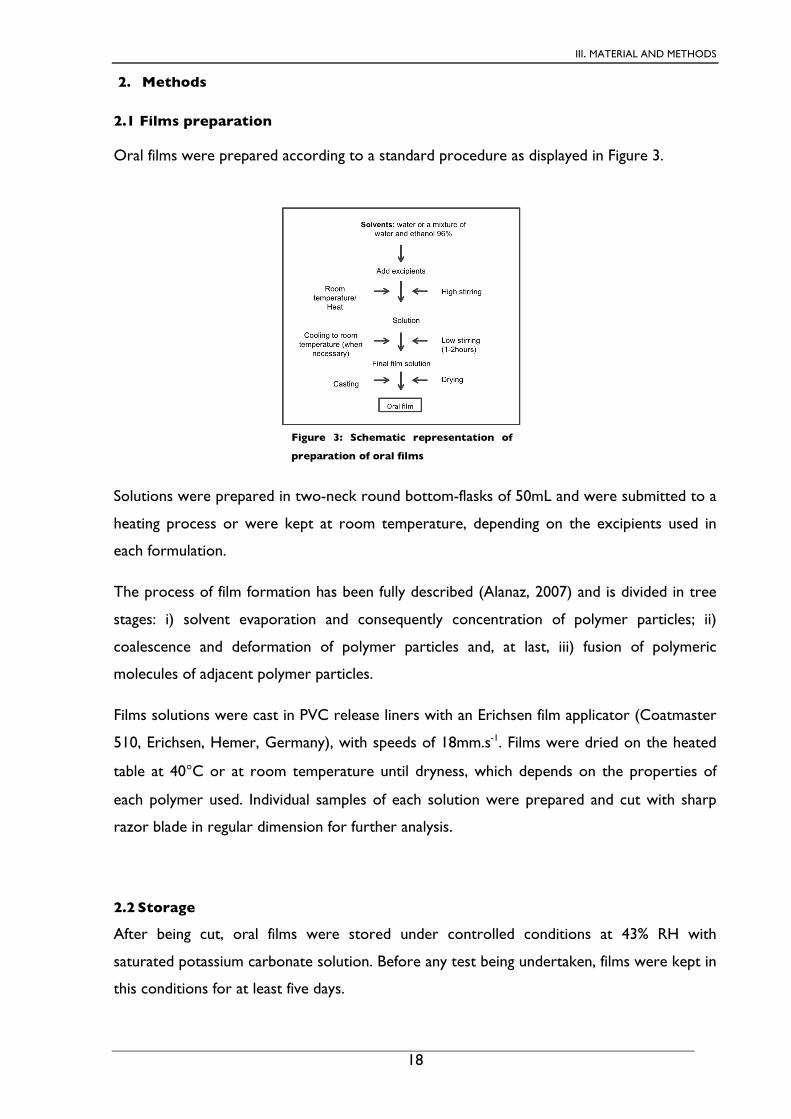
Oral films were prepared according to a standard procedure as displayed in Figure 3.
Solutions were prepared in two-neck round bottom-flasks of 50mL and were submitted to a
heating process or were kept at room temperature, depending on the excipients used in
each formulation.
The process of film formation has been fully described (Alanaz, 2007) and is divided in tree
stages: i) solvent evaporation and consequently concentration of polymer particles; ii)
coalescence and deformation of polymer particles and, at last, iii) fusion of polymeric
molecules of adjacent polymer particles.
Films solutions were cast in PVC release liners with an Erichsen film applicator (Coatmaster
510, Erichsen, Hemer, Germany), with speeds of 18mm.s-1. Films were dried on the heated
table at 40°C or at room temperature until dryness, which depends on the properties of
each polymer used. Individual samples of each solution were prepared and cut with sharp
razor blade in regular dimension for further analysis.
2.2 Storage
After being cut, oral films were stored under controlled conditions at 43% RH with
saturated potassium carbonate solution. Before any test being undertaken, films were kept in
this conditions for at least five days.
Figure 3: Schematic representation of
preparation of oral films

III. MATERIAL AND METHODS
19
2.3 Characterization
i. FTIR
Commercial films and correspondent excipients were analysed in a FTIR-4200
spectrophotometer by Jasco, using the attenuated total reflectance (ATR) technique. For
each sample, scans were collected over the wavenumber region 550 and 4000 cm-1 with a 4
cm-1 resolution.
ii. TGA
TGA analyses were recorded using TGA Q500 (TA instruments). Samples were scanned
using a heating rate of 10°C.min-1 to a maximum temperature of 500°C. Furthermore, films
were heated under a constant nitrogen flow (40 mL.min-1).
iii. DSC
DSC samples were accurately weighed at approximately 5mg and were sealed in aluminium
pans and heated with a nitrogen flux of 50mL.min-1. The reference was an empty pan. DSC
scans were recorded by using a DSC Q100 (TA instrument).
Films were scanned at 10°C.min-1 in two heating runs: first from 25°C to 100°C, in order to
eliminate all water content in the films and, after that, from -85°C to 100°C.
iv. Mechanical properties
The mechanical properties of the films were determined using a tensile testing universal
apparatus (Zwick, Germany) with a load cell of 100N. Films, free from physical visible
imperfections, were held between two clamps positioned at a distance of 50mm and were
pulled by the top clamp at a rate of 50mm.min-1. A preload (0.1 MPa) was performed in each
assay. The load applied to the film is gradually increased and the corresponding magnitude of
elongation is recorded.
Young’s modulus, Tensile Strength and Elongation parameters are retrieved from the
software TestXpert (TestXpert, Zwick, Germany).

III. MATERIAL AND METHODS
20
v. DMTA
DMTA analyses ware carried out using a DMA 242 E (Netzsch, Germany) under
compression mode. All samples (5.289×0.04×5,61 mm3 (average value)) were analysed over a
temperature range from -150°C to 150°C, at frequencies 1, 5 and 10 Hz, using a heating rate
of 3 °C/min.
vi. Karl Fischer Titration
In order to determine the residual water content in orodispersible films, Karl Fischer
method was performed in a Karl Fischer 787 KF Titrino (Metrohm AG, Herisau, Schweiz).
Each sample was added to the titration flask filled with methanol previously dehydrated with
a Karl Fischer reagent (Hydranal Composite 5), with a known determined titer (mgH2O.mL-
1). Water content of each film is determined based on the titration volume (mL).
vii. Contact angle measurement
Dynamic contact angle (DCA) measurements were undertaken by an optical contact angle
meter (OCA20 Dataphysics, Filderstadt, Germany), at room temperature. Films were fixed on a
slide with adhesive tape and a needle with 0.52mm diameter dropped about 10µL of distilled
water onto the film surface. The image of the droplet was obtained with an optical
microscope with the axis parallel to the sample surface and was sent to the software
(SCA20 Dataphysics software, Filderstadt, Germany), which preforms the contact angle
calculation.
viii. Disintegration test
In order to evaluate the time needed until the disintegration begins, a simple test was
undertaken. 4mL of phosphate buffer (pH=6,8 T=37ºC) were added to a Petri dish where
films samples were laid on. The time until the film started to disintegrate was recorded, and
the average time was determined.
III. MATERIAL AND METHODS
21
ix. Film thickness
Film thickness was determined using the micrometre screw (Mitutoyo Digimatic Capiler,
Mitutoyo Corporation, Japan). Each film sample was measured at five positions: central and
the four corners, and the average thickness were calculated.
x. Statistical analysis/ Design of Experiments
Statistical analyses were performed with GraphPadPrism version 6 (GraphPad Software, Inc,
San Diego California). Statistic comparisons were made using Analysis of Variance (ANOVA)
with Bonferroni test (95% confidence, *p<0.05). Results were considered to be significant
when p<0.05. Mean values are displayed as Meand+SD when repeats number is equal to 3.
Screening and optimization design were performed with JMP 10 (SAS Institute Inc., Cary,
NC).

IV. RESULTS
22
IV. RESULTS
The aim of this work was to understand the influence of formulation used in properties of
the films prepared. For this purpose, two commercially available oral films were chosen and
were characterized (Listerine PocketPaks from Pfizer and Gas-X from Novartis).
1. Characterization of commercial films
In Table 1 it is presented the main components used in both commercial films. This
information was collected from patents of Leung (2005) and Schobel (2007).
Table 1: Main components of commercial oral films evaluated.
Polymer Plasticizer Flavour Colour Sweetener Surfactant Thickening
agent Drug
Substance
Gas-X
Corn Starch Modified
PEG Menthol
FD&Blue#1 Sorbitol Sorbitol
Simethicone HPMC Titanium Dioxe
Sucralose Maltodextrin
Listerine Pocket Packs
Pullulan Propylene
Glycol
Menthol Green3 Sucralose Tween80 Chondruscrisp (Carrageeenan
Copper gluconate
Eucalyptol Yellow6 Acessulfame Potassium
Glyceryl Oleate
Ceratoniasiliqua gum
Thymol
Xantan gum Methyl-salicilate
Chemical structures from all excipients can be seen in appendix A.
i. FTIR analysis
FTIR spectra can be analysed in Figure 4.
The analysis of both obtained spectra (Figure 4) allows the identification of the absorption
band characteristic in the region of OH group (3600-2100 cm-1), represented by A letter.
Figure 4: FTIR spectra of commercial films: A - Listerine, B - Gas-X.
10002000300040000
20
40
60
80
100
Tran
smitt
ance
[%]
Wavenumber [cm-1]
A
BC
D
E
F
A
10002000300040000
20
40
60
80
100
Wavenumber [cm-1]
Tran
smitt
ance
[%]
A B
GH
I
EF
J
B

IV. RESULTS
23
Letter B and letter E present in both spectra, correspond to C⎯H bonds (2935-2915cm-1)
and ⎯O⎯ group (1150-1050 cm-1), respectively, which confirms the presence of
components with these bonds. Particularly, C⎯Cl bond, represented by F letter in 800-700
cm-1 region, is only present in Sucralose (Appendix A).
Letter C, only present in Listerine spectrum, indicates the absorption band characteristic of
C=C double bond (1680-1600cm-1) and it can be identified in some excipients, namely,
acessulfame potassium referred as a sweetener, polysorbate 80 and glyceryl oleate, both
referred as a surfactant. Letter D is characteristic of a particular bond only present in
acessulfame potassium, a sulfone group R2SO2 at 1340-1280cm-1.
Letter G and Letter H, present in Gas-X spectrum, correspond to aromatic compounds and
aromatic amine and indicate absorptions bands at 1600-1430cm-1 and 1340-1250cm-1,
respectively. These characteristics bonds are present in pigment FD&Blue#1. Once intensity
of the peaks is directly related with concentration, it is expected that these peaks would not
be very intense since concentration of dyes is relatively low when compare to other
excipients. According to this, Simethicone is present in higher amount in Gas-X films once
its characteristic bond Si⎯CH3 represented by I letter, has a considerable intensity when
compared to other absorption bands. Following this line, Titanium Dioxe (letter J) is present
in Gas-X in small amounts since intensity of absorption band is relatively low.
From the results obtained by FTIR, it is possible to assure the presence of some excipients
in both films: sucralose in Gas-X and Listerine, acessulfame potassium in Listerine, and
pigment FD&Blue#1 and simethicone in Gas-X.

IV. RESULTS
24
ii. TGA analyses
Due to the diversity of excipients used in Listerine and Gas-x films, different thermal profiles
were obtained, as it can be observe in Figure 5.
Figure 5: Thermogravimetric analysis of commercial films. A – thermograms, B – weight loss until 100°C.
Gas-X and Listerine start to lose mass approximately at same temperature (about 200°C),
despite the differences in their composition. From this temperature, there is a considerable
increase in weight loss.
Degradability profiles are related with main excipients. Differences between films can be
explained by degradation profiles of the different polymers, which are expected to be the
major components of both films.
Table 2 indicates the temperature at occurs a weight loss correspondent to 5% and 10% of
the weight, and the extrapolated temperature onset (determined by tangent intersection
between the initial degradation point and the slope of the TGA curve).
Table 2: Typical temperatures extracted from TGA curve.
Commercial Film
Weight Loss Tonset
5% 10%
Listerine 60,67 °C 216,79°C 216,21°C
Gas-x 211,03 °C 234,54°C 221,60 °C
From Table 2, it is possible to suggest that Gas-X it is relatively more stable than Listerine
since it has a higher Tonset. Although this difference it is not significant, Gas-X loses 5% of
initial weight at 211°C and Listerine at 60°C. This result indicates that Listerine has an initial
Temperature [ºC]
Wei
ght [
%]
0 200 400 6000
20
40
60
80
100 ListerineGas-x
40 60 80 10090
92
94
96
98
100
Temperature [ºC]
Wei
ght [
%]
ListerineGas-x
A
B

IV. RESULTS
25
weight loss more pronounced than Gas-X. This fact can be corroborated by Figure 5-B,
which represents the weight loss until 100°C. The weight decrease observed until this
temperature corresponds to the evaporation of volatile substances, as ethanol, flavours and
mainly water.
As it can be observed in Figure 5-B, the slope of Listerine’s curve is greater than that
observe in Gas-X’s curve. If we assume that the weight loss until 100°C it is essentially due
to water evaporation, it is possible to suggest that Listerine is more hygroscopic than Gas-X.
iii. DSC analysis
Figure 6 presents the DSC traces of Listerine and Gas-X.
The results present in Figure 6 are not very elucidative. Although some thermal events can
be observed in both films, it is very difficult to describe the specific thermal events, probably
due to overlapping and the complex formulations used to prepare the films.
-100 -50 0 50 100-2.0
-1.5
-1.0
-0.5
0.0
0.5
Temperature [ºC]
Heat
Flo
w [W
.g-1
]
Listerine
Temperature [ºC]
Heat
Flo
w [W
.g-1
]
-100 -50 0 50 100-1.5
-1.0
-0.5
0.0
0.5Gas-X
A B
Figure 6: DSC traces of commercial films. A - Listerine, B - Gas-X.

IV. RESULTS
26
iv. Mechanical Properties
Mechanical properties play a crucial role on the physical integrity of orodispersible films.
Therefore, elongation, tensile strength and elasticity modulus was determined (Table 3).
Stress-strain curves can be evaluated by observing Figure 7.
From Figure 7, it is possible to observe that Listerine presents high results variability when
compared to Gas-X. This observation may indicate that Gas-X presents a more
homogenous composition.
Table 3: Summary results of mechanical properties of commercial films.
Tensile Stress at break
(σB) [MPa] Elongation (εB)
[%] Young’s modulus (Et)
[MPa] Thickness [µm]
Listerine 35.46 4.35 1105.16 40
Gas-X 9.31 3.301 64.34 110
The results presented in Figure 7 and Table 3 demonstrate the wide variation of mechanical
properties of these commercial films. Besides being hard and tough (elevated Young’s
modulus), Listerine presents higher tensile stress at break. Although Listerine has the
smallest film thickness, it is surprising that it broke at the highest force.
On the other hand, Gas-X results in a less ductile film since it presents low tensile strength
and moderate elongation. Young’s modulus presents a moderate to low value, which means
that Gas-X can be described as soft and weak film.
Although the previously described mechanical properties are undoubtedly related with films
compositions, formulation and preparation, it is difficult to establish a relationship between
excipients and properties. However, considering the main components that theoretically are
present in higher concentration and probably contribute more to the mechanical properties,
more important information can be taken.
Figure 7: Stress-strain curves of commercial films. A-Listerine, B-Gas-X
A B
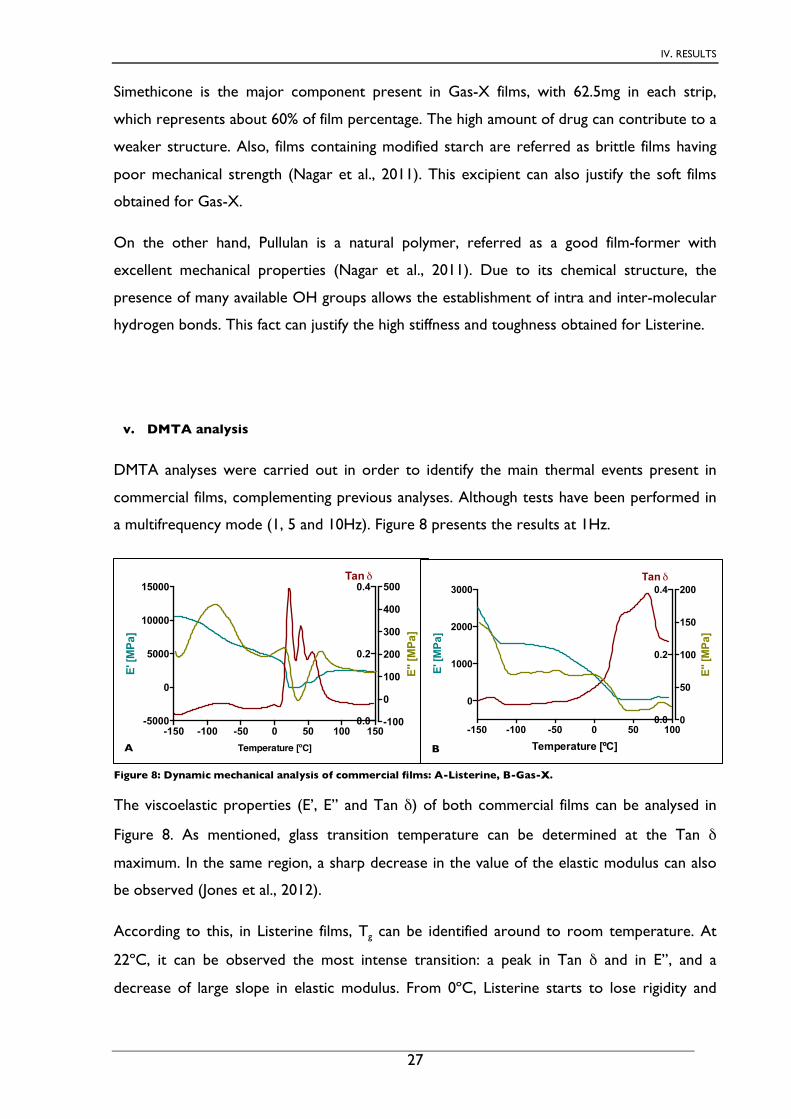
IV. RESULTS
27
Simethicone is the major component present in Gas-X films, with 62.5mg in each strip,
which represents about 60% of film percentage. The high amount of drug can contribute to a
weaker structure. Also, films containing modified starch are referred as brittle films having
poor mechanical strength (Nagar et al., 2011). This excipient can also justify the soft films
obtained for Gas-X.
On the other hand, Pullulan is a natural polymer, referred as a good film-former with
excellent mechanical properties (Nagar et al., 2011). Due to its chemical structure, the
presence of many available OH groups allows the establishment of intra and inter-molecular
hydrogen bonds. This fact can justify the high stiffness and toughness obtained for Listerine.
v. DMTA analysis
DMTA analyses were carried out in order to identify the main thermal events present in
commercial films, complementing previous analyses. Although tests have been performed in
a multifrequency mode (1, 5 and 10Hz). Figure 8 presents the results at 1Hz.
The viscoelastic properties (E’, E’’ and Tan δ) of both commercial films can be analysed in
Figure 8. As mentioned, glass transition temperature can be determined at the Tan δ
maximum. In the same region, a sharp decrease in the value of the elastic modulus can also
be observed (Jones et al., 2012).
According to this, in Listerine films, Tg can be identified around to room temperature. At
22ºC, it can be observed the most intense transition: a peak in Tan δ and in E’’, and a
decrease of large slope in elastic modulus. From 0ºC, Listerine starts to lose rigidity and
-150 -100 -50 0 50 100 150-5000
0
5000
10000
15000
0.0
0.2
0.4
Temperature [ºC]
E' [M
Pa]
Tan !
-100
0
100
200
300
400
500
E'' [
MPa
]
-150 -100 -50 0 50 100
0
1000
2000
3000
0.0
0.2
0.4
Temperature [ºC]
E' [M
Pa]
Tan !
0
50
100
150
200
E'' [
MPa
]
A B
Figure 8: Dynamic mechanical analysis of commercial films: A-Listerine, B-Gas-X.

IV. RESULTS
28
therefore increases relaxation, once it loses the restricted movement of the polymeric
chains.
At around -90ºC an evident peak can also be observed in E’’ and a poorly defined peak can
be identified in damping parameter. This peak most probably corresponds to secondary
transitions (β).
The same occurs in Gas-X films (Figure 8-B). At around -130ºC, a slight peak in Tan δ and a
sharp decline in modulus may indicate a movement in lateral chains (β transition). The
conversion from glass-like state to rubber-like state probably occurs between 0ºC and 50ºC.
Above this temperature, the viscoelastic behaviour is difficult to explain considering the
information available at the moment.
In both commercial films, glass transition occurs in the range of temperatures [0º-50ºC],
which can lead to modifications in films properties and appearance.
DMTA results can be related with DSC curves and glass transition temperature calculated in
both techniques can be compared. As it was said, endothermic steps in the baseline of the
DSC curve can be associated to glass transitions. In Listerine an endothermic event can be
observed at 10ºC (Figure 6-A) and in Gas-X, a slight endothermic slope can also be
observed around 10 ºC and 16ºC (Figure 6-B).
These results are consistent and coherent with Tg calculated by DMTA analysis, although
with slightly differences. According to Jones (2012), differences in both techniques can be
attributable to operating principles, sensitivity and sample preparation.
vi. Karl Fischer Titration
The residual water content it is an important factor for the performance of oral films. Films
with high residual water can be tacky and sticky whereas films with low water content tend
to be brittle (Roger, 2004; Garsuch, 2009a).
Figure 9 presents the residual water results for Listerine and Gas-X. Listerine was analysed
immediately after the box opening (t=0days) and after 15days, being kept under controlled
conditions, at 43% RH.

IV. RESULTS
29
After 15days, Listerine retains around 2% more water when compared to Listerine after
opening. This result could be mean that Listerine is produced and packaged under relative
humidity lower than 43%. Gas-X presents less residual water content when compared to
Listerine, around 3%.
vii. Contact Angle Measurement
Contact Angle measurement allows the
evaluation of the wettability of the films,
which can be a measure of hygroscopicity.
Contact Angle of commercial films can be
observed in Figure 10.
Initial contact angle presents different results
in both commercial films. Gas-X films have
an average angle of approximately 75º, while
Listerine has an initial angle of around 35ºC. After 5 seconds, Gas-X has a higher decrease in
contact angle, whereas Listerine show no notorious change. Lower initial contact angle
indicate that water molecules are more attracted to Listerine films since water drops spread
more on the surface, unlike Gas-X.
viii. Disintegration
As referred before, it is extremely difficult to mimic the in-use conditions. Therefore, the
disintegration test can be seen as a preliminary result. In Figure 11, the time at which the
films begin to break down can be evaluated and compared.
Listeri
ne (t=0
d)
Listeri
ne (t=1
5d)
Gas-x
0
2
4
6
H2O
[%]
Figure 9: Residual Water Content in commercial films.
Figure 10: Contact Angle Measurement of commercial films.
Lister
ine
Gas-X
0
20
40
60
80
Con
tact
Ang
le
CA (initial) CA after 5s

IV. RESULTS
30
Listerine starts the disintegration faster when
compared to Gas-X. While Listerine begins to
break down after 3,3 seconds, Gas-X begins 15
seconds after its contact with phosphate buffer.
Considering that Pullulan is the main component of
Listerine and Gas-X consists mainly of Simethicone,
it is possible to relate these results based on the
composition of the films.
Furthermore, Gas-X presents a higher thickness (110 µm) when compared to Listerine (40
µm). Thickness and disintegration are proportional parameters: as film thickness increased,
the disintegration time also increased (Chen et al, 2008). Thus, Gas-X disintegration time
relatively to Listerine can be explained by the use of Simethicone as main component and by
its thickness.
Figure 11: Disintegration time of commercial films
Dis
inte
grat
ion
[s]
Lister
ine
Gas-X
0
5
10
15
20

IV. RESULTS
31
2. Characterization of developed formulations
The second part of this project involved an attempt to reproduce both commercial films,
Listerine and Gas-X. The main objective was to achieve the characteristics of the
commercial films, in order to understand the relationship between the formulations used
and the performance of the films. For this purpose, several patents were consulted, resulting
in the establishment of standard formulations and in the preparation of the films. Several
formulations were developed based on this study, and were further characterized.
2.1 Listerine
Based on Listerine’s patent (Leung et al., 2005), the main components of this commercial
film were selected and their amount %(w/w) in film was changed. In Table 4 it is presented
the formulations studied that result from DoE analysis.
Table 4: Developed and characterized formulations based on DoE screening.
Film ID Pullulan Propylene
Glycol Menthol Carrageenan Acessulfame K Sucralose Tween80
List2 65,57% 13,36% 8,57% 1,78% 5,25% 5,30% 0,17%
List5 79,03% 15,08% 3,73% 1,99% - - 0,17%
List6 77,35% - 5,88% 4,99% 5,03% - 6,75%
List8 58,43% 15,68% 9,12% - 5,92% 5,94% 4,92%
List9 91,85% - 3,18% - - - 4,97%
List10 49,36% 15,50% 9,63% 5,46% 6,36% 6,34% 7,35%
List14 88,36% - 9,44% 2,07% - - 0,13%
List18 68,32% 16,11% - 2,11% - 6,25% 7,21%
List20 70,21% 16,22% - 2,10% 6,55% - 4,91%
List25 66,56% 15,66% 3,87% 1,08% 6,32% 6,38% 0,13%
List26 89,59% - 3,47% 0,93% 5,88% - 0,13%
List27 66,68% 15,98% 8,77% 2,05% - 6,35% 0,16%
List29 80,88% - - 2,08% 6,48% 3,87% 6,68%
Formulations presented in Table 4 were further characterised, according to commercial film
characterisation techniques (Section IV.1). A comparison between Listerine and List
formulations were made in order to understand how differences in formulation could affect
the final appearance and properties of the films.

IV. RESULTS
32
i. FTIR analysis
Figure 12 presents the FTIR spectra of the representative formulations studied. The
remaining spectra are presented in
Appendix B.
From Figure 12 it is possible to
observe that the spectra of the
different formulations are very similar.
Absorption peaks present in 2200-
2400 cm-1 region, which can be seen in
all spectra with different intensity, are
characteristic of CO2. Apart from this
band, all absorption peaks and
intensities look approximately similar,
indicating that the formulations used
should be close to Listerine.
According to Listerine FTIR analysis in
Section IV.I, Sucralose and acessulfame
potassium were identified in Listerine
films. Looking at List2 e List5
composition (Table 4) it can be
observe that List2 had both excipients, unlike List5.
Table 5: Developed formulations with and without Sucralose and acessulfame potassium (Adapted from Table 4).
Film ID Pullulan Propylene
Glycol Menthol Carrageenan Acessulfame K Sucralose Tween80
List2 65,57% 13,36% 8,57% 1,78% 5,25% 5,30% 0,17%
List5 79,03% 15,08% 3,73% 1,99% - - 0,17%
Therefore, it is expected that List2 spectrum had an absorption band in 800-700 cm-1 region
(corresponding to sucralose) and other at 1340-1280cm-1region, characteristic of
acessulfame potassium. Inversely, none of these peaks should be seen in List5. However, the
analysis of Figure 12 reveals no differences between these two spectra.
Figure12: FTIR analysis of representative formulations.
1000200030004000Wavenumber [cm-1]
Tran
smitt
ance
[%]
List2 List5List6List8List9
Listerine

IV. RESULTS
33
Once Pullulan is the main component in all developed
formulations, it can “mask” the other excipients and
this could be the reason behind the fact no other
excipients are detected. This conclusion can be
confirmed by Figure 13, which represents pullulan and
Listerine FTIR spectra.
ii. TGA analyses
In order to study thermal stability of developed formulations, TGA analyses were carried
out. Figure 14 shows examples of films with and without plasticizer. In appendix C, all curves
corresponded to developed formulations analysed could be observed.
According to Figure 14, films with plasticizer in their composition have a similar behaviour to
Listerine, until 200°C. Around this temperature, thermal degradation is initiated in
developed formulations and in commercial films. However, films with no propylene glycol
are thermally more stable than Listerine but behaviour until 200°C is different. This fact can
be justified by TGA profile of propylene glycol (Figure
15). In fact, propylene glycol stars the thermal
degradation at lower temperature than films.
Therefore, films with this excipient in its composition
have a higher initial weight loss.
Considering that the films with plasticizer have similar
behaviour to Listerine, the amount of propylene glycol
used in the commercial sample can be about 15%-16%.
0 200 400 6000
20
40
60
80
100
Temperature (ºC)
Wei
ght (
%)
ListerineList 5
Temperature [ºC]
Wei
ght [
%]
0 200 400 6000
20
40
60
80
100ListerineList26
A B
Figure 14: TGA profiles of representative formulations: A - with and B - without plasticizer.
50 100 1500
20
40
60
80
100
Temperature [ºC]
Wei
ght [
%]
Figure 15: TGA profile of propylene glycol.
1000200030004000
Wavenumber [cm-1]
Tran
smitt
ance
[%]
Listerinepullulan
Figure 13: Pullulan and Listerine FTIR spectra.

IV. RESULTS
34
Table 6 presents the thermogravimetric data obtained for the films.
Table 6: Temperatures extracted from TGA curve. Grey – higher values, Blue- lower values.
Film ID Temp. at Weight loss T
onset
5% 10%
List2 54,17°C 175,24°C 212,4°C
List5 48,57°C 184,96°C 233,52°C
List6 34,46°C 78,13°C 265,98°C
List8 62,8°C 190,89°C 215,04°C
List9 44,07°C 105,81°C 299,73°C
List14 39,15°C 96,43°C 253,92°C
List18 57,59°C 176,05°C 205,41°C
List20 64,74°C 164,81°C 278,01°C
List25 73,96°C 187,17°C 215,06°C
List26 61,64°C 237,6°C 283,14°C
List27 58,56°C 182,48°C 200,83°C
List29 64,11°C 226,74°C 227,58°C
Listerine 60,67°C 216,79°C 216,21°C
In order to disclose the results it is important to analyse compositions used for each film
(Table 7).
Table 7: Main formulations discussed in TGA analysis.
Film ID Pullulan Propylene
Glycol Menthol Carrageenan Acessulfame K Sucralose Tween80
List2 65,57% 13,36% 8,57% 1,78% 5,25% 5,30% 0,17%
List8 58,43% 15,68% 9,12% - 5,92% 5,94% 4,92%
List9 91,85% - 3,18% - - - 4,97%
List18 68,32% 16,11% - 2,11% - 6,25% 7,21%
List25 66,56% 15,66% 3,87% 1,08% 6,32% 6,38% 0,13%
List26 89,59% - 3,47% 0,93% 5,88% - 0,13%
List27 66,68% 15,98% 8,77% 2,05% - 6,35% 0,16%
List29 80,88% - - 2,08% 6,48% 3,87% 6,68%
Evaluating Tonset of all developed formulations, there is a wide range of values. The
combination of the information present in
Table 6 and Table 7 suggest that films with
higher Tonset (highlight in grey) tend to have
higher percentage of pullulan in its
composition.
Thermal degradation of pullulan starts at
approximately 300°C, unlike Listerine which
degradation temperature is around 200°C
0 200 400 6000
20
40
60
80
100
Temperature (ºC)
Wei
ght (
%)
PullulanListerine
Figure 16: TGA profiles of pullulan and Listerine.

IV. RESULTS
35
(Figure 16). Hence, it is logical that films with higher percentage of this polymer in its
composition have higher degradation temperature. However, this conclusion is not general
once films with lower pullulan percentage do not present the lowest Tonset.
Nevertheless, films that present lower Tonset
(highlight in blue) have a feature, the sucralose is
present in the formulation. Based on that and
corroborated by DoE software, sucralose
influences the Tonset parameter. This means that
films with higher percentage of sucralose have
lower degradation temperature. This conclusion
can be confirmed from Figure 17, showing that
sucralose starts to lose weight around 130°C.
Films highlight in grey colour (higher Tonset) do not have propylene glycol in their
composition. This result is consistent with the observation made before (Figure 14), where
films without plasticizer have tendency to degrade later than films with plasticizer. Although
List29 (highlight in dark blue) have no propylene glycol in its composition, it has a relatively
lower Tonset. This result may be due to the presence of sucralose in composition.
As oral films are strongly influenced by moisture, it is important to evaluate the weight loss
until 100°C. Until this temperature, weight loss is due to evaporation of volatile substances
as ethanol, flavours, but mainly water. Films with steeper slope have greater water retaining
capacity, which means, they are more hygroscopic. Weight loss until 100°C for all developed
formulations is presented in Figure 18.
Figure 18: Weight loss until 100ºC
List2
List5
List6
List8
List9
List14
List18
List20
List25
List26
List27
List29
Lister
ine
0
4
8
12
Wei
ght L
oss
(100
ºC) [
%]
0 200 400 6000
50
100
Wei
ght [
%]
Temperature [ºC]
Figure 17: TGA profile of sucralose.
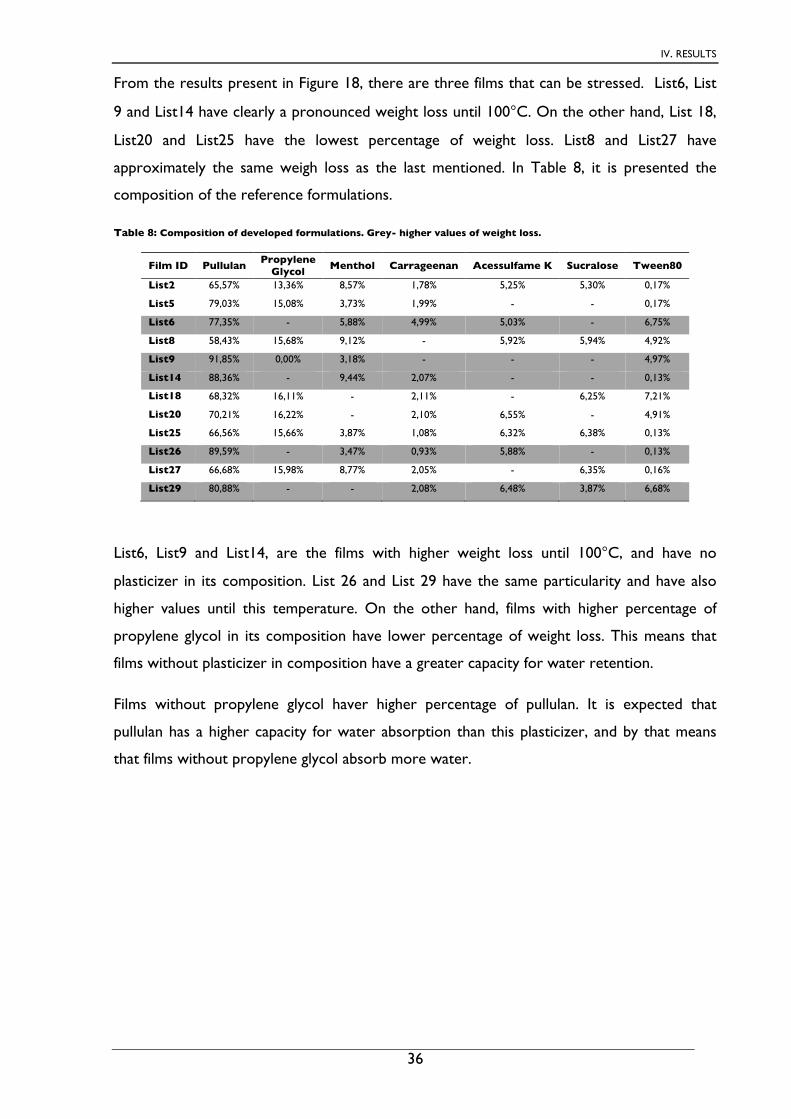
IV. RESULTS
36
From the results present in Figure 18, there are three films that can be stressed. List6, List
9 and List14 have clearly a pronounced weight loss until 100°C. On the other hand, List 18,
List20 and List25 have the lowest percentage of weight loss. List8 and List27 have
approximately the same weigh loss as the last mentioned. In Table 8, it is presented the
composition of the reference formulations.
Table 8: Composition of developed formulations. Grey- higher values of weight loss.
Film ID Pullulan Propylene Glycol Menthol Carrageenan Acessulfame K Sucralose Tween80
List2 65,57% 13,36% 8,57% 1,78% 5,25% 5,30% 0,17%
List5 79,03% 15,08% 3,73% 1,99% - - 0,17%
List6 77,35% - 5,88% 4,99% 5,03% - 6,75%
List8 58,43% 15,68% 9,12% - 5,92% 5,94% 4,92%
List9 91,85% 0,00% 3,18% - - - 4,97%
List14 88,36% - 9,44% 2,07% - - 0,13%
List18 68,32% 16,11% - 2,11% - 6,25% 7,21%
List20 70,21% 16,22% - 2,10% 6,55% - 4,91%
List25 66,56% 15,66% 3,87% 1,08% 6,32% 6,38% 0,13%
List26 89,59% - 3,47% 0,93% 5,88% - 0,13%
List27 66,68% 15,98% 8,77% 2,05% - 6,35% 0,16%
List29 80,88% - - 2,08% 6,48% 3,87% 6,68%
List6, List9 and List14, are the films with higher weight loss until 100°C, and have no
plasticizer in its composition. List 26 and List 29 have the same particularity and have also
higher values until this temperature. On the other hand, films with higher percentage of
propylene glycol in its composition have lower percentage of weight loss. This means that
films without plasticizer in composition have a greater capacity for water retention.
Films without propylene glycol haver higher percentage of pullulan. It is expected that
pullulan has a higher capacity for water absorption than this plasticizer, and by that means
that films without propylene glycol absorb more water.

IV. RESULTS
37
From Table 6, List8 and List25 have approximately the same degradation temperature as
Listerine. However, taking into account the TGA profiles of the different formulations, List5
and List18 are more similar to this commercial film. Figure 19 and Table 9 shows the TGA
curves and formulation of these films.
Table 9: Composition of films with TGA profile similar to Listerine.
Film ID Pullulan Propylene
Glycol Menthol Carrageenan Acessulfame K Sucralose Tween80
List5 79,03% 15,08% 3,73% 1,99% - - 0,17%
List18 68,32% 16,11% - 2,11% - 6,25% 7,21%
If films with sucralose start thermal degradation earlier than films without this excipient, it is
understandable that List18 have a lower Tonset when compared to List5, since the latter have
no sucralose in its composition (Table 6 and Table 9). However, Listerine has a degradation
temperature between these two films. This result may suggest that the amount of sucralose
in Listerine should be less than 6% (%w/w) in film.
From TGA analyses it is possible to set some concentration ranges for different excipients,
namely: sucralose between 0 and 6% and propylene glycol between 15 and 16%. As List5 and
List18 are similar to Listerine and the amount of menthol varies between 0 and 3,73%, this
interval can also be used as indicative. The amount of tween80 in formulation does not
influence TGA analysis since its degradation temperature it is much higher than films
analysed (Appendix C).
0 200 400 6000
20
40
60
80
100
Temperature (ºC)
Wei
ght (
%)
ListerineList 5
Temperature [ºC]
Wei
ght [
%]
0 200 400 6000
20
40
60
80
100ListerineList18
A B
Figure 19: TGA profiles similar to Listerine. A – List5, B – List18.

IV. RESULTS
38
iii. DSC analyses
Figure 20 present some DSC traces obtained for representative films. In Appendix D all
DSC results can be consulted.
From the results present in Figure 20, it is possible to observe a discrepancy between
developed formulations and Listerine film.
List14 is the only developed formulation that demonstrates some evident thermal events
near 50°C. However, and similarly to the commercial films, the DSC curves are not very
elucidative and thermal events are hard to disclose.
iv. Mechanical Properties
Mechanical properties were evaluated in developed formulations in order to understand
how differences in formulation can affect the film properties. It is known that these
differences result in a wide variation of mechanical properties. Additionally, there is no
specification or guidance available in literature about the specific values or ranges that define
the proper mechanical properties of oral films. In this section, developed formulations are
compared with commercial films.
In Figure 21, an average value of mechanical properties of developed films is presented and
these values are summarized in adjacent Table 10.
Figure 20: DSC traces of List formulations
-50 0 50 100 150
-4
-2
0
Temperature (ºC)
Hea
t Flo
w (m
W)
List14
List9
List8
List6
List5
List2
Listerine
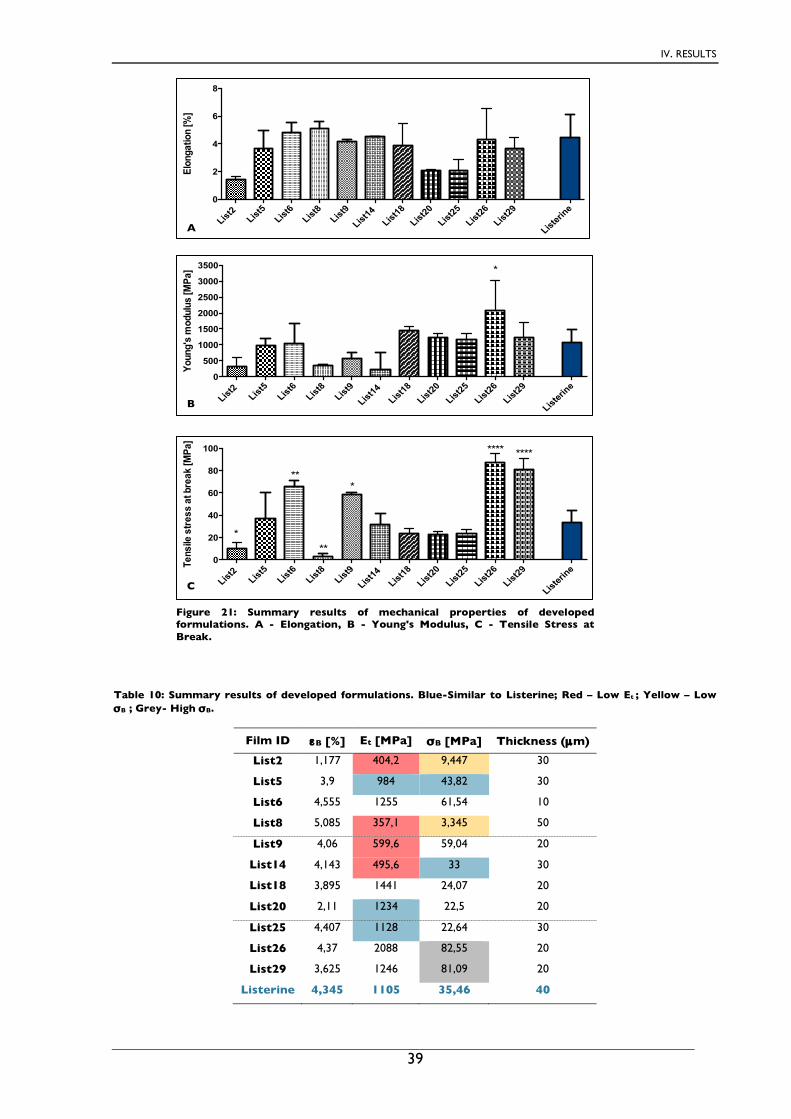
IV. RESULTS
39
Table 10: Summary results of developed formulations. Blue-Similar to Listerine; Red – Low Et ; Yellow – Low σB ; Grey- High σB.
Film ID εB [%] Et [MPa] σB [MPa] Thickness (µm)
List2 1,177 404,2 9,447 30
List5 3,9 984 43,82 30
List6 4,555 1255 61,54 10
List8 5,085 357,1 3,345 50
List9 4,06 599,6 59,04 20
List14 4,143 495,6 33 30
List18 3,895 1441 24,07 20
List20 2,11 1234 22,5 20
List25 4,407 1128 22,64 30
List26 4,37 2088 82,55 20
List29 3,625 1246 81,09 20
Listerine 4,345 1105 35,46 40
Figure 21: Summary results of mechanical properties of developed formulations. A - Elongation, B - Young's Modulus, C - Tensile Stress at Break.
List2
List5
List6
List8
List9
List14
List18
List20
List25
List26
List29
Lister
ine0
2
4
6
8
Elon
gatio
n [%
]
List2
List5
List6
List8
List9
List14
List18
List20
List25
List26
List29
Lister
ine0
500
1000
1500
2000
2500
3000
3500
Youn
g's
mod
ulus
[MPa
] *
List2
List5
List6
List8
List9
List14
List18
List20
List25
List26
List29
Listeri
ne0
20
40
60
80
100
Tens
ile s
tress
at b
reak
[MPa
]
*
****
**
**
*
****
A
B
C
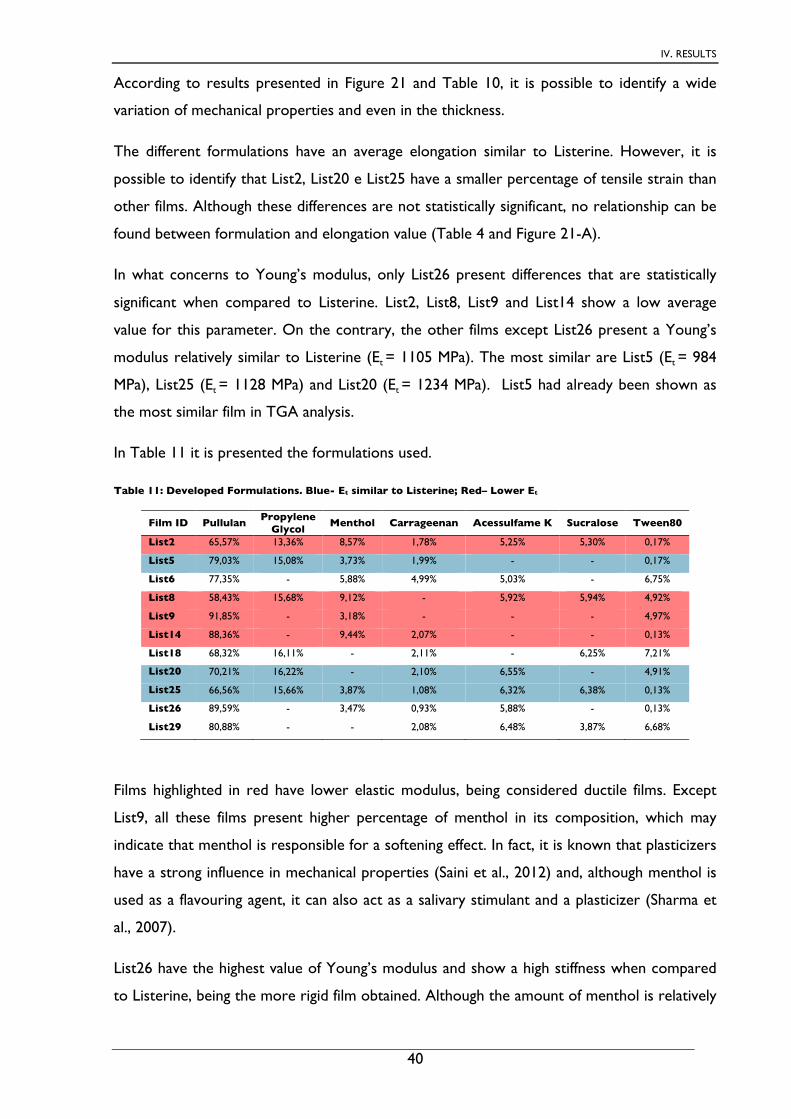
IV. RESULTS
40
According to results presented in Figure 21 and Table 10, it is possible to identify a wide
variation of mechanical properties and even in the thickness.
The different formulations have an average elongation similar to Listerine. However, it is
possible to identify that List2, List20 e List25 have a smaller percentage of tensile strain than
other films. Although these differences are not statistically significant, no relationship can be
found between formulation and elongation value (Table 4 and Figure 21-A).
In what concerns to Young’s modulus, only List26 present differences that are statistically
significant when compared to Listerine. List2, List8, List9 and List14 show a low average
value for this parameter. On the contrary, the other films except List26 present a Young’s
modulus relatively similar to Listerine (Et = 1105 MPa). The most similar are List5 (Et = 984
MPa), List25 (Et = 1128 MPa) and List20 (Et = 1234 MPa). List5 had already been shown as
the most similar film in TGA analysis.
In Table 11 it is presented the formulations used.
Table 11: Developed Formulations. Blue- Et similar to Listerine; Red– Lower Et
Film ID Pullulan Propylene Glycol
Menthol Carrageenan Acessulfame K Sucralose Tween80
List2 65,57% 13,36% 8,57% 1,78% 5,25% 5,30% 0,17%
List5 79,03% 15,08% 3,73% 1,99% - - 0,17%
List6 77,35% - 5,88% 4,99% 5,03% - 6,75%
List8 58,43% 15,68% 9,12% - 5,92% 5,94% 4,92%
List9 91,85% - 3,18% - - - 4,97%
List14 88,36% - 9,44% 2,07% - - 0,13%
List18 68,32% 16,11% - 2,11% - 6,25% 7,21%
List20 70,21% 16,22% - 2,10% 6,55% - 4,91%
List25 66,56% 15,66% 3,87% 1,08% 6,32% 6,38% 0,13%
List26 89,59% - 3,47% 0,93% 5,88% - 0,13%
List29 80,88% - - 2,08% 6,48% 3,87% 6,68%
Films highlighted in red have lower elastic modulus, being considered ductile films. Except
List9, all these films present higher percentage of menthol in its composition, which may
indicate that menthol is responsible for a softening effect. In fact, it is known that plasticizers
have a strong influence in mechanical properties (Saini et al., 2012) and, although menthol is
used as a flavouring agent, it can also act as a salivary stimulant and a plasticizer (Sharma et
al., 2007).
List26 have the highest value of Young’s modulus and show a high stiffness when compared
to Listerine, being the more rigid film obtained. Although the amount of menthol is relatively

IV. RESULTS
41
low, this formulation does not have propylene glycol in its composition. Therefore, it is
understandable that this formulation origins a rigid film.
The films that are more similar to Listerine are highlighted in blue. Considering that menthol
has an important role on stiffness, it is possible to suggest that the percentage of this
excipient in Listerine films should be in the interval [0-3,87%]. Following the same idea,
higher percentage of propylene glycol should also be considered: [15.08-16.22%]. Also, the
percentage of pullulan in similar films is in a limited range, between [67-80%].
As shown in Figure 21-C, analogously to Young’s modulus, List2 e List 8 present the lower
tensile stress at break. On the contrary, List26 e List29 show the highest value of this
parameter with a high level of significance. Once again, List5 show similar results to Listerine,
along with List14.
In Table 12, this reference films are highlighted in different colours to better understand the
influence of formulation.
Table 12: Developed Formulations. Blue- σB similar to Listerine; Yellow – Lower σB ; Grey- Higher σB.
Film ID Pullulan Propylene Glycol Menthol Carrageenan Acessulfame K Sucralose Tween80
List2 65,57% 13,36% 8,57% 1,78% 5,25% 5,30% 0,17%
List5 79,03% 15,08% 3,73% 1,99% - - 0,17%
List6 77,35% - 5,88% 4,99% 5,03% - 6,75%
List8 58,43% 15,68% 9,12% - 5,92% 5,94% 4,92%
List9 91,85% - 3,18% - - - 4,97%
List14 88,36% - 9,44% 2,07% - - 0,13%
List18 68,32% 16,11% - 2,11% - 6,25% 7,21%
List20 70,21% 16,22% - 2,10% 6,55% - 4,91%
List25 66,56% 15,66% 3,87% 1,08% 6,32% 6,38% 0,13%
List26 89,59% - 3,47% 0,93% 5,88% - 0,13%
List29 80,88% - - 2,08% 6,48% 3,87% 6,68%
Comparing Figure 21-C and Table 12 it is possible to identify that films with propylene glycol
in their formulation present lower tensile stress at break, having a value close to Listerine
(Table 10). Contrary, films without plasticizer show high values of this parameter.
According to Young’s modulus analysis, menthol should also act as a plasticizer, so it is
expected that its presence also influence tensile strength. Indeed, List2 and List8 (lower σB -
yellow) present higher percentage of menthol in their constitution. On the contrary, List26
and List29 (higher σB - grey) show lower percentage of this excipient.

IV. RESULTS
42
Although List14 also present higher percentage of menthol in constitution (9.44%), its tensile
strength it is not so small as List2 and List8. This fact can be justified by the absence of
propylene glycol, which allows obtaining films with high tensile break.
List5 (σB= 43.82 MPa) and List14 (σB= 33 MPa) present similar behaviour to Listerine (σB
=35.46 MPa). Assuming that films with lower percentage of menthol are more comparable
with Listerine, and that the percentage of this excipient in List14 is not considerable, the
quantity of menthol should be between 0 and 3.75% to reproduce a film similar to Listerine.
These range are consistent with those defined previously.
As List5 is similar to Listerine in TGA analysis and in mechanical properties, stress-strain
curve is only presented for this formulation (Figure 22). In Appendix E, all stress-strain
curves for all developed formulation can be consulted.
From the results present in Figure 22, it is possible to observe an high variability of the
results for List5 when compared to Listerine. However, both present values in the same
order of magnitude.
A B
Figure 22: Stress-strain curves of Listerine and most similar film. A- List5, B- Listerine

IV. RESULTS
43
v. DMTA
DMTA analyses were performed for List formulations and for Listerine films. Only films that
presented similarity with Listerine in other techniques were chosen to be analysed by
DMTA. The comparison between films can be analysed in Figure 23.
In general, all developed formulations
present similar behaviour to Listerine films.
In the glass transition region (0-25ºC), a
sharp decrease in the elastic modulus can
be identified in all formulations and
commercial film (Figure 23). When
comparing developed formulations and
Listerine, it is possible to see that the glass
transition occurs at lower temperatures in
developed films, once the decrease in E’ begins first in these films than in Listerine. However,
in List18 the decrease in E’ starts below 0ºC which indicates that the Tg is lower in this films
than in the remaining.
Another important aspect to stress is the elasticity of the films. At glass transition range,
developed films are less elastic than Listerine once, at this temperature, they all present
lower value of elastic modulus than commercial film.
vi. Karl Fischer Titration
In order to evaluate residual water content in developed oral films, some Karl Fischer tests
were carried out. Figure 24 presents the results obtained for the different films.
Figure 23: DMTA traces (1Hz) of List formulations and comparison with Listerine.
-150 -100 -50 0 50 100 1500
5000
10000
Temperature [ºC]
E' [M
Pa]
List20
List25List 29
Listerine
List18List5
List2
List5
List6
List8
List9
List14
List18
List20
List25
List26
List 27
List29
Lister
ine (
t=0d
)
Lister
ine (
t=15
d)0
2
4
6
8
10
Wat
er C
onte
nt [%
]
*
Figure 24: Residual water content determined by Karl Fischer Titration

IV. RESULTS
44
Listerine was analysed immediately after the box opening (t=0days) and after 15days
(t=15d), being kept under controlled conditions, at 43% HR. As both assays present
differences in water content, it is presumable that Listerine is produced and packaged under
different conditions from that used to store it. Therefore, the developed formulations
should be compared to Listerine t=15d, since they were kept under some condition.
Although all developed films and Listerine t=15d were preserved under the same conditions,
developed films have higher average in water content than Listerine.
The lowest average in water content was detected in List26 and List29, which are more
similar to Listerine t=0d. Inversely, the highest residual water content was identified in List5
(statistically significant) and List27. However, all developed formulations present similar
water content, except List26 and List29.
Although List5 have presented similar behaviour in the analyses above (TGA, Young’s
modulus and tensile strength), the List9, List18 and List20 are similar to Listerine in water
content.
Once Karl Fischer results and the differences in formulations are hard to relate, DoE was
used to help this interpretation. pullulan is the major component responsible for water
content although with low confidence interval. Films with higher percentage of pullulan have
less residual water than films with low percentage of this excipient.
Formulations with higher and lower average water content are presented in Table 13.
According to DoE, films with higher percentage of pullulan have lower residual water
content (List26 and List29). However, List5 have approximately the same percentage of
pullulan in film as List29 and it is the developed formulation with higher water content. This
means that this conclusion cannot be fully validate and should be considered carefully.
Film ID Pullulan Propylene Glycol Menthol Carrageenan Acessulfame K Sucralose Tween80
List5 79,03% 15,08% 3,73% 1,99% - - 0,17%
List27 66,68% 15,98% 8,77% 2,05% - 6,35% 0,16%
List26 89,59% - 3,47% 0,93% 5,88% - 0,13%
List29 80,88% - - 2,08% 6,48% 3,87% 6,68%
Table 13: Relevant formulations analysed by Karl-Fischer. Blue – Higher %, Grey – Lower %

IV. RESULTS
45
Something important to point out is the fact that films with low water content have no
propylene glycol in its composition, but present acessulfame K. On the contrary, films with
high water content have plasticizer in composition and not acessulfame K.
Karl-Fischer results can be compared to TGA curves until 100°C. In Figure 25 this
relationship can be evaluated and in Table 14 the formulations can be analysed.
From Figure 25 it is possible to highlight some particularities. List6, List9, List14, List26 and
List29 present some discrepancy between TGA and Karl Fischer results. In other films, no
significant differences between both methods can be observed. Only in List25 the average
solvent content is higher in Karl-Fischer method than in TGA. At 100°C, bound water is still
present within the film matrix, which justifies the reason for less water content in TGA than
in Karl-Fischer technique in these films.
Differences between these two methods could be expected since weight loss until 100°C in
TGA is not only due to water evaporation. Until this temperature, there are some other
excipients that can evaporate and be degraded. On the other side, since film matrices did
not completely dissolve within the solvent used in Karl-Fischer titration, some water may
not be available. However, since some films present consistent results in both methods, the
results can be considered reliable.
In Table 14 the formulations of all films analysed can be evaluated. Films highlight in blue
correspond to films that show some difference between TGA and Karl-Fischer.
List2
List5
List6
List8
List9
List14
List18
List20
List25
List26
List27
List29
Lister
ine
0.0
5.5
11.0
Solv
ent C
onte
nt [%
]
TGA Karl Fischer
Figure 25: Comparison of two methods for determination of residual solvent.

IV. RESULTS
46
Table 14: Developed formulations. Blue- Different results in Karl-Fischer and TGA.
Film ID Pullulan Propylene Glycol Menthol Carrageenan Acessulfame K Sucralose Tween80
List2 65,57% 13,36% 8,57% 1,78% 5,25% 5,30% 0,17%
List5 79,03% 15,08% 3,73% 1,99% - - 0,17%
List6 77,35% - 5,88% 4,99% 5,03% - 6,75%
List8 58,43% 15,68% 9,12% - 5,92% 5,94% 4,92%
List9 91,85% - 3,18% - - - 4,97%
List14 88,36% - 9,44% 2,07% - - 0,13%
List18 68,32% 16,11% - 2,11% - 6,25% 7,21%
List20 70,21% 16,22% - 2,10% 6,55% - 4,91%
List25 66,56% 15,66% 3,87% 1,08% 6,32% 6,38% 0,13%
List26 89,59% - 3,47% 0,93% 5,88% - 0,13%
List27 66,68% 15,98% 8,77% 2,05% - 6,35% 0,16%
List29 80,88% - - 2,08% 6,48% 3,87% 6,68%
According to Table 14, films highlight in blue colour show different results in both methods.
All these films have no propylene glycol in its composition. As this excipient starts its
thermal degradation below 100°C (Figure 15), it would make sense that films with this
excipient had different results in TGA and Karl-Fischer. However, the opposite was
observed. Films with propylene glycol present higher percentage of residual solvent by TGA
than by Karl-Fischer.
The TGA analyses results indicated that films without plasticizer have higher percentage of
pullulan. Due to its chemical structure, the presence of many available OH groups allows the
establishment of hydrogen bonds with water molecules. For this reason, films with higher
percentage of this excipient retain more water and, consequently, have more residual water
content, when compared to other films.
vii. Contact Angle Measurement
In the Figure 26, it is presented the contact angle results obtained for some developed
formulations.
List
5
List18
List20
List25
List26
List27
List29
Lister
ine
0
20
40
60
Con
tact
Ang
le
CA (initial) CA after 5s
Figure 26: Contact Angle of representative films.

IV. RESULTS
47
In general, studied formulations have higher initial contact angle than Listerine films, which
means that commercial film is more hygroscopic than the developed ones. List26 stands out
from the other films because it presents the highest average angle (51.60º), unlike List25 that
shows the lowest initial contact angle (41.31º).
No relation between films formulations and contact angle value was possible to establish.
viii. Disintegration
Figure 27 represents the disintegration time of developed films.
According to Figure 27, all developed formulations start to disintegrate in less than four
seconds. List6, List18 and List20 present the lowest disintegration time. In fact, the
difference between List6, List20 and Listerine was statistically significant. When compared to
other films, there are no significant differences. List18 and List20 also present a lower initial
contact angle when compared to other films, which means that they are more hygroscopic,
so they take less time to disintegrate.
List26, List27 and List 29 show an initial contact angle with higher average value. This mean
that they are less hygroscopic that other films. Therefore longer disintegration times were
expected. Disintegration results obtained are consistent with previous analyses.
Even so, it should be mentioned that the results of this test are too relative. The differences
between the developed formulations are too small and it is difficult to define the precise
time to be considered. Based on that, the results should be considered only for comparison
purposes.
Figure 27: Disintegration time of developed formulations.
List2
List5
List6
List8
List9
List14
List18
List20
List25
List26
List27
List29
Lister
ine
0
1
2
3
4
Dis
inte
grat
ion
[s]
* *
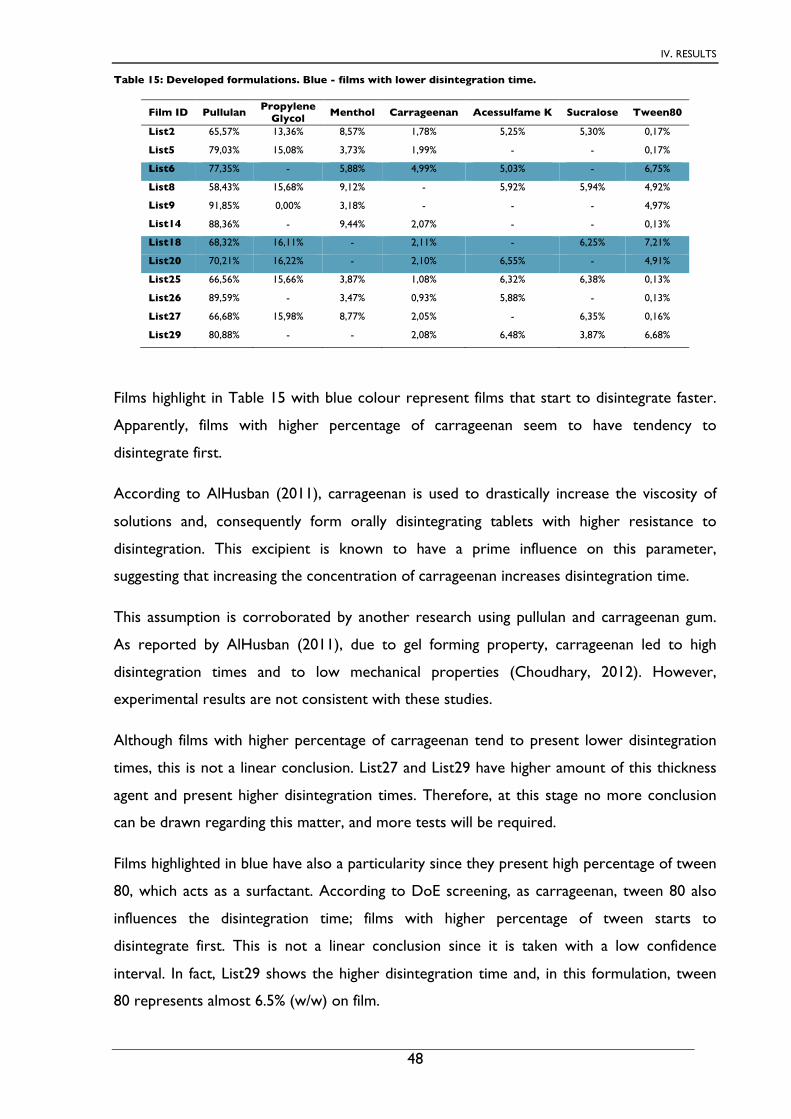
IV. RESULTS
48
Table 15: Developed formulations. Blue - films with lower disintegration time.
Film ID Pullulan Propylene Glycol Menthol Carrageenan Acessulfame K Sucralose Tween80
List2 65,57% 13,36% 8,57% 1,78% 5,25% 5,30% 0,17%
List5 79,03% 15,08% 3,73% 1,99% - - 0,17%
List6 77,35% - 5,88% 4,99% 5,03% - 6,75%
List8 58,43% 15,68% 9,12% - 5,92% 5,94% 4,92%
List9 91,85% 0,00% 3,18% - - - 4,97%
List14 88,36% - 9,44% 2,07% - - 0,13%
List18 68,32% 16,11% - 2,11% - 6,25% 7,21%
List20 70,21% 16,22% - 2,10% 6,55% - 4,91%
List25 66,56% 15,66% 3,87% 1,08% 6,32% 6,38% 0,13%
List26 89,59% - 3,47% 0,93% 5,88% - 0,13%
List27 66,68% 15,98% 8,77% 2,05% - 6,35% 0,16%
List29 80,88% - - 2,08% 6,48% 3,87% 6,68%
Films highlight in Table 15 with blue colour represent films that start to disintegrate faster.
Apparently, films with higher percentage of carrageenan seem to have tendency to
disintegrate first.
According to AlHusban (2011), carrageenan is used to drastically increase the viscosity of
solutions and, consequently form orally disintegrating tablets with higher resistance to
disintegration. This excipient is known to have a prime influence on this parameter,
suggesting that increasing the concentration of carrageenan increases disintegration time.
This assumption is corroborated by another research using pullulan and carrageenan gum.
As reported by AlHusban (2011), due to gel forming property, carrageenan led to high
disintegration times and to low mechanical properties (Choudhary, 2012). However,
experimental results are not consistent with these studies.
Although films with higher percentage of carrageenan tend to present lower disintegration
times, this is not a linear conclusion. List27 and List29 have higher amount of this thickness
agent and present higher disintegration times. Therefore, at this stage no more conclusion
can be drawn regarding this matter, and more tests will be required.
Films highlighted in blue have also a particularity since they present high percentage of tween
80, which acts as a surfactant. According to DoE screening, as carrageenan, tween 80 also
influences the disintegration time; films with higher percentage of tween starts to
disintegrate first. This is not a linear conclusion since it is taken with a low confidence
interval. In fact, List29 shows the higher disintegration time and, in this formulation, tween
80 represents almost 6.5% (w/w) on film.

IV. RESULTS
49
As referred by Poluri (2013), adding tween 80 to the formulations means a reduction in
disintegration time. However, Chantrainea (2006) refers surfactants should retard the
disintegration once this excipient creates weak inter-particle bonds with other excipients,
limiting water uptake responsible for disintegration. This observation is not in agreement
with the main experimental results, except for List29.
List2, List5, List8, List14, List25, List 26 and List 27 present similar disintegration time to
Listerine. Except List8, all referred formulations have lower percentage of tween. Therefore,
the results suggest that the percentage of this excipient in commercial film should be
between 0.13% and 0.17%.
In Table 16, similar formulations to Listerine can be analysed.
Table 16: Developed formulation with disintegration time similar to Listerine.
Film ID Pullulan Propylene Glycol Menthol Carrageenan Acessulfame K Sucralose Tween80
List2 65,57% 13,36% 8,57% 1,78% 5,25% 5,30% 0,17%
List5 79,03% 15,08% 3,73% 1,99% - - 0,17%
List14 88,36% - 9,44% 2,07% - - 0,13%
List25 66,56% 15,66% 3,87% 1,08% 6,32% 6,38% 0,13%
List27 66,68% 15,98% 8,77% 2,05% - 6,35% 0,16%
Following the same tendency, and as carrageenan also influences disintegration time, it is
possible to find indicative values for the range of concentration of this excipient in Listerine.
According to Table 16, it is possible to assume that the percentage of thickness agent should
be between 1.08% and 2.05%.
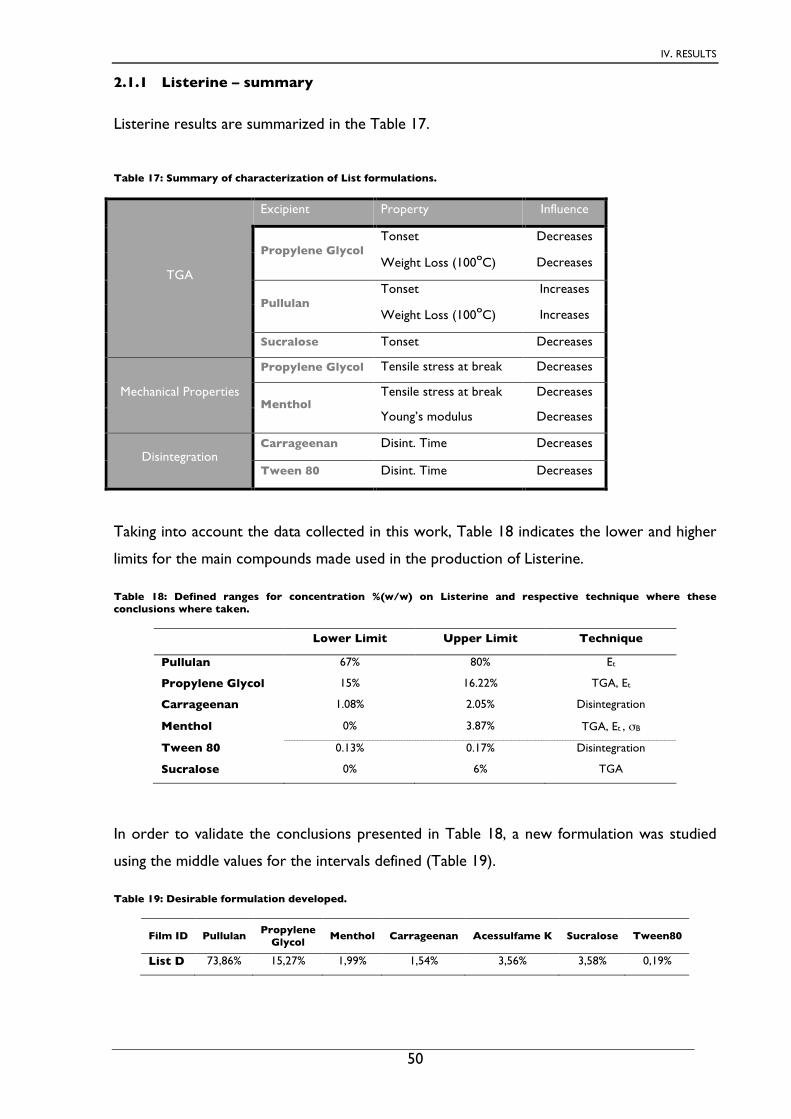
IV. RESULTS
50
2.1.1 Listerine – summary
Listerine results are summarized in the Table 17.
Table 17: Summary of characterization of List formulations.
TGA
Excipient Property Influence
Propylene Glycol Tonset Decreases
Weight Loss (100ºC) Decreases
Pullulan Tonset Increases
Weight Loss (100ºC) Increases
Sucralose Tonset Decreases
Mechanical Properties
Propylene Glycol Tensile stress at break Decreases
Menthol Tensile stress at break Decreases
Young’s modulus Decreases
Disintegration Carrageenan Disint. Time Decreases
Tween 80 Disint. Time Decreases
Taking into account the data collected in this work, Table 18 indicates the lower and higher
limits for the main compounds made used in the production of Listerine.
Table 18: Defined ranges for concentration %(w/w) on Listerine and respective technique where these conclusions where taken.
Lower Limit Upper Limit Technique
Pullulan 67% 80% Et
Propylene Glycol 15% 16.22% TGA, Et
Carrageenan 1.08% 2.05% Disintegration
Menthol 0% 3.87% TGA, Et , σB
Tween 80 0.13% 0.17% Disintegration
Sucralose 0% 6% TGA
In order to validate the conclusions presented in Table 18, a new formulation was studied
using the middle values for the intervals defined (Table 19).
Table 19: Desirable formulation developed.
Film ID Pullulan Propylene Glycol
Menthol Carrageenan Acessulfame K Sucralose Tween80
List D 73,86% 15,27% 1,99% 1,54% 3,56% 3,58% 0,19%

IV. RESULTS
51
Observing Table 19, we can see that the percentage of tween 80 doesn’t feet on defined
range. This is explained by the difficulty in pipetting such small quantities. However, we
assume that there is no big difference in results.
i. FTIR analysis
Considering that FTIR analysis did not show relevant results in previous Listerine
formulations (Section 2.2), no FTIR analysis was carried out to desired formulation.
ii. TGA analysis
TGA analysis of Listerine and List D is presented in Figure 28-A. List5 is also presented due
to its similarity in previous TGA results (Figure 28-B).
List D presents a thermal behaviour similar to Listerine until degradation temperature.
However, above this value the similarity is not maintained. Regarding List 5 (Figure 28-B), it
is possible to observe that the profile obtained for this film resembles more the Listerine.
Table 20: List D and List5 formulations.
Film ID Pullulan Propylene Glycol
Menthol Carrageenan Acessulfame K Sucralose Tween80
List D 73,86% 15,27% 1,99% 1,54% 3,56% 3,58% 0,19%
List5 79,03% 15,08% 3,73% 1,99% - - 0,17%
Based on data presented (Table 20) it is possible to identify sucralose and menthol as the
compounds that influence degradation before 200ºC (they degrade below this temperature).
Above this temperature, it is impossible at this stage to ascribe the compound(s) that define
the degradation profile obtained.
Temperature [ºC]
Wei
ght [
%]
0 200 400 6000
20
40
60
80
100
ListerineList D
0 200 400 6000
20
40
60
80
100
Temperature (ºC)
Wei
ght (
%)
ListerineList 5
Figure 28: TGA profile of List D (A) and List 5 (B) and its comparison with Listerine.
A B
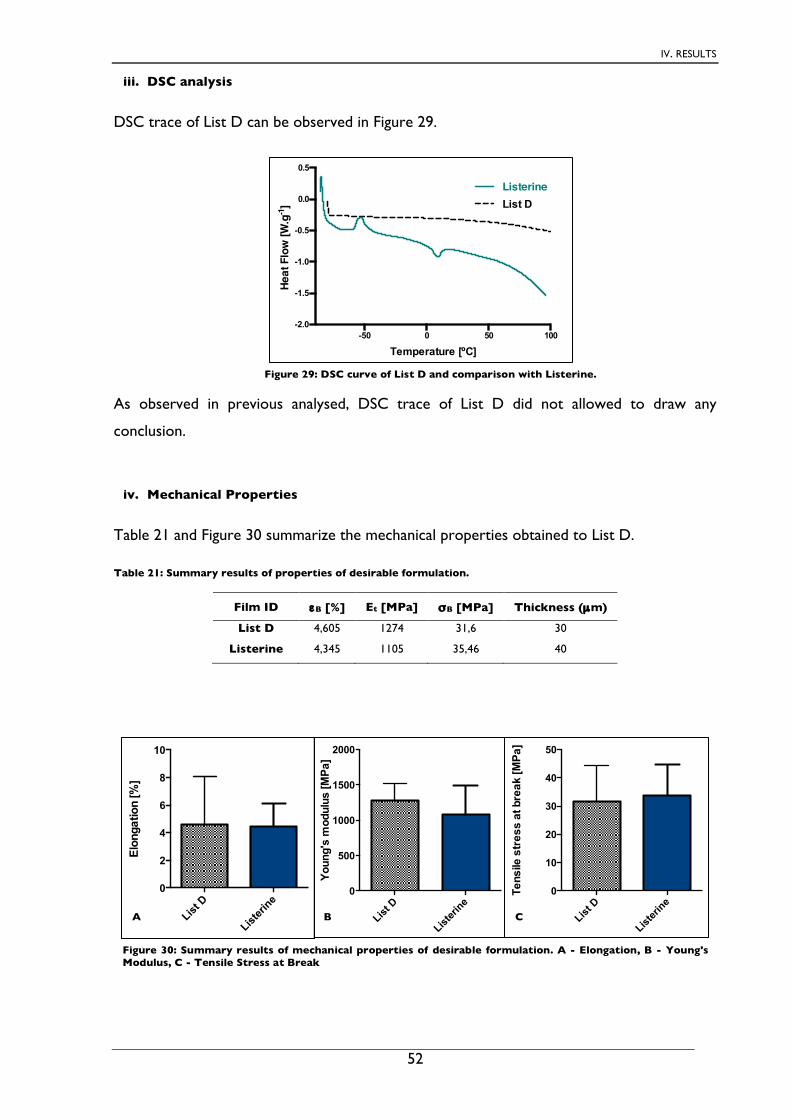
IV. RESULTS
52
iii. DSC analysis
DSC trace of List D can be observed in Figure 29.
As observed in previous analysed, DSC trace of List D did not allowed to draw any
conclusion.
iv. Mechanical Properties
Table 21 and Figure 30 summarize the mechanical properties obtained to List D.
Table 21: Summary results of properties of desirable formulation.
Film ID εB [%] Et [MPa] σB [MPa] Thickness (µm)
List D 4,605 1274 31,6 30
Listerine 4,345 1105 35,46 40
List D
Lister
ine
0
500
1000
1500
2000
You
ng's
mod
ulus
[MP
a]
List D
Lister
ine
0
2
4
6
8
10
Elo
ngat
ion
[%]
List D
Listeri
ne0
10
20
30
40
50
Tens
ile s
tres
s at
bre
ak [M
Pa]
A B C
Figure 30: Summary results of mechanical properties of desirable formulation. A - Elongation, B - Young's Modulus, C - Tensile Stress at Break
Temperature [ºC]
Heat
Flo
w [W
.g-1
]
-50 0 50 100-2.0
-1.5
-1.0
-0.5
0.0
0.5
ListerineList D
Figure 29: DSC curve of List D and comparison with Listerine.

IV. RESULTS
53
The present results show that the formulation leads to a film that has very similar
mechanical properties to Listerine. This result suggest that the formulation stand to be very
close to Listerine and that the defined ranges were valid. However, comparing stress-strain
curves, it is possible to identify some variability in results but in the same order of magnitude.
v. DMTA
DMTA analyses were performed for desired formulation and for Listerine. Once List5 also
present relevant similarity with this commercial film, it was analysed by DMTA and
compared with List D. The comparison between films can be analysed in Figure 32.
Developed formulations have a similar behaviour in E’ curves. When compared to Listerine,
the resemblance is not so obvious but it is possible to verify the same trend in E’ profile. List
D presents higher values in E’ trace than in List5 which suggests that the desired formulation
is closer to Listerine. Elastic modulus presents higher values in commercial film than in
developed formulations, which indicates that Listerine is more elastic than List5 and List D
(Figure 32).
Figure 31: Stress-strain curves for: A- Desirable formulation, B-Listerine
A B
-150 -100 -50 0 50 100 1500
5000
10000
Temperature [ºC]
E' [M
Pa]
ListerineList5
ListD
Figure 32: DMTA traces of List D, List5 and Listerine.

IV. RESULTS
54
Glass transition temperature occurs at lower temperatures in developed films and in
Listerine; the slope in elastic modulus begins around 0ºC, unlike Listerine that initiates the
decrease of this parameter near room temperature.
vi. Karl Fischer Titration
Karl Fischer results can be observed in Figure 33.
A small difference in List D and Listerine (t=15d) can be
observed, which can be due to handling during cut and storage.
In general, formulations analysed previously (Figure 27) also
have similar water content. Therefore, there is no significant
variability in results this difference is not significant.
vii. Contact Angle Measurement
Contact angle analysis was also performed to desired formulation (Figure 34).
As observed in developed formulations, List D
has higher average contact angle than Listerine
film. This result suggests that the developed
formulation has lower capacity to retain water.
The same behaviour can be observed after 5sec,
since both analysed films practically maintain
the initial contact angle.
This desired formulation presents the higher
average angle when compared to other developed formulations (52.95º), very close to List26
with an initial contact angle of 51.69º.
ListD
Lister
ine (t=
15d)
Lister
ine (t=
0d)
0
3
6
9
Wat
er C
onte
nt [%
]
Figure 33: Residual water in List D and Listerine.
Con
tact
Ang
le
List D
Lister
ine0
20
40
60 CA (initial)
CA after 5s
Figure 34: Contact angle of List D and Listerine.

IV. RESULTS
55
viii. Disintegration
Figure 35 indicates that List D starts its disintegration later than Listerine. In fact, this
formulation have the highest disintegration
time when compared to developed
formulations analysed previously.
These results are consistent with contact
angle analysis, where List D presents the
higher initial contact angle when compared to
other formulations. For this reason, it is
understandable that List D also presents the
highest disintegration time.
Figure 35: Disintegration time of List D and Listerine.
Dis
inte
grat
ion
[s]
List D
Lister
ine
0
2
4
6

IV. RESULTS
56
2.2 Gas-X I
The main components of this commercial film were selected from the patent (Schobel et al.,
2007).
Two different grades of HPMC were indicated: Methocel E5 and Methocel E50. Their
viscosity in 2%(w/v) aqueous solution at 20°C is 5 and 50 MPa.s-s, respectively. At this stage
of the work Methocel E50 was not available, therefore Methocel E15 was used for the
preliminary tests.
Table 22 presents the list of formulations defined using a DoE method.
Table 22: Developed and characterized formulations.
Film ID HPMC E5 HPMC E15 MDx Modified
Starch PEG 400 Sorbitol Sucralose Simethicone
Gas I.1. 43,3% 0,0% 0,0% 43,5% 0,0% 0,0% 0,0% 13,2%
Gas I.3. 43,5% 43,3% 0,0% 0,0% 0,0% 0,0% 0,0% 13,2%
Gas I.5. 56,0% 0,0% 33,7% 0,0% 0,0% 0,0% 0,0% 10,3%
Gas I.6 15,7% 15,7% 15,4% 15,4% 18,2% 9,9% 4,6% 5,1%
Gas I.7. 76,6% 0,0% 0,0% 0,0% 0,0% 0,0% 0,0% 23,4%
Gas I.10 0,0% 41,0% 0,0% 24,6% 18,1% 0,0% 0,0% 16,2%
Gas I.11. 0,0% 76,2% 0,0% 0,0% 0,0% 0,0% 0,0% 23,8%
Formulations presented in Table 22 were deeply characterized, according to commercial film
characterization techniques (Section IV.1). The comparison between Gas-X and Gas I.
formulations is presented in this section.

IV. RESULTS
57
i. FTIR analysis
FTIR analysis was carried out to try understanding films composition and the influence of
formulation in peaks absorption. The results of this analysis can be observed in Figure 36.
Although it should be possible identify
different compounds in FTIR spectra,
looking carefully to Figure 36 it is
possible to observe that all spectra are
very similar, which indicates that
regarding the main components the
formulation used is very close to Gas-
X.
However, once Gas-X has around
60% of simethicone in composition,
this component “masks” other
excipients present in lower amounts.
Figure 37 represents simethicone and
Gas-X FTIR spectra.
Simethicone present a similar
spectrum to Gas-X (Figure 37). This
result confirms that API mainly
composes this commercial film.
The analysis of obtained spectra allows the
identification of the absorption band
characteristic in the region of alcohol group (A)
(3600-2100 cm-1). In all developed formulations
this peak can be identified. However, in Gas I.11,
Gas I.7, Gas I.5 and Gas I.3 this peak is less
evident than in the remaining formulations. Once
intensity is also related with concentration, it can
be assumed that in these formulations there is
one excipient with OH groups in less
concentration than in the other formulations. Formulations can be analysed in Table 23.
Figure 36: FTIR analysis of Gas I developed formulations
1000200030004000
Wavenumber [cm-1]
Tran
smitt
ance
[%]
Gas I.11
Gas I.10
Gas I.7
Gas I.6
Gas I.5
Gas I.3
Gas I.1
Gas-x
A BG H
II
E F
J
1000200030004000
Wavenumber [cm-1]
Tran
smitt
ance
[%]
Gas-xSimethicone
Figure 37: FTIR analysis of Gas-X and simethicone
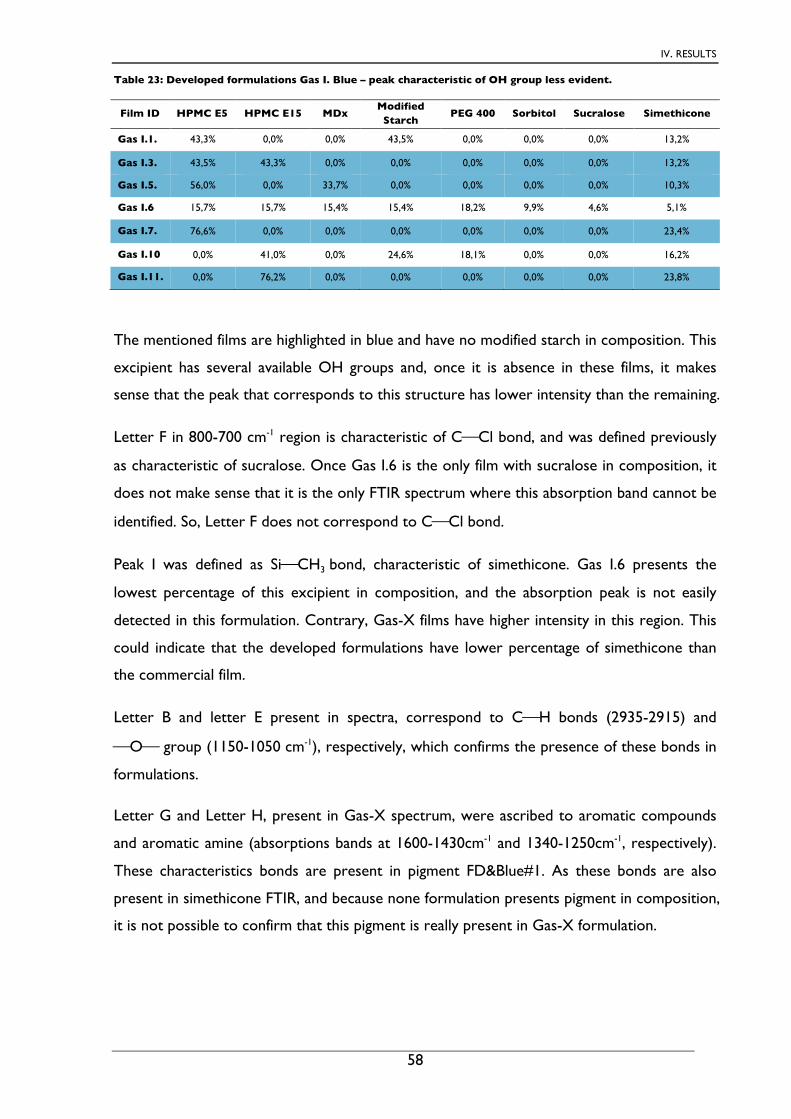
IV. RESULTS
58
Table 23: Developed formulations Gas I. Blue – peak characteristic of OH group less evident.
Film ID HPMC E5 HPMC E15 MDx Modified Starch
PEG 400 Sorbitol Sucralose Simethicone
Gas I.1. 43,3% 0,0% 0,0% 43,5% 0,0% 0,0% 0,0% 13,2%
Gas I.3. 43,5% 43,3% 0,0% 0,0% 0,0% 0,0% 0,0% 13,2%
Gas I.5. 56,0% 0,0% 33,7% 0,0% 0,0% 0,0% 0,0% 10,3%
Gas I.6 15,7% 15,7% 15,4% 15,4% 18,2% 9,9% 4,6% 5,1%
Gas I.7. 76,6% 0,0% 0,0% 0,0% 0,0% 0,0% 0,0% 23,4%
Gas I.10 0,0% 41,0% 0,0% 24,6% 18,1% 0,0% 0,0% 16,2%
Gas I.11. 0,0% 76,2% 0,0% 0,0% 0,0% 0,0% 0,0% 23,8%
The mentioned films are highlighted in blue and have no modified starch in composition. This
excipient has several available OH groups and, once it is absence in these films, it makes
sense that the peak that corresponds to this structure has lower intensity than the remaining.
Letter F in 800-700 cm-1 region is characteristic of C⎯Cl bond, and was defined previously
as characteristic of sucralose. Once Gas I.6 is the only film with sucralose in composition, it
does not make sense that it is the only FTIR spectrum where this absorption band cannot be
identified. So, Letter F does not correspond to C⎯Cl bond.
Peak I was defined as Si⎯CH3 bond, characteristic of simethicone. Gas I.6 presents the
lowest percentage of this excipient in composition, and the absorption peak is not easily
detected in this formulation. Contrary, Gas-X films have higher intensity in this region. This
could indicate that the developed formulations have lower percentage of simethicone than
the commercial film.
Letter B and letter E present in spectra, correspond to C⎯H bonds (2935-2915) and
⎯O⎯ group (1150-1050 cm-1), respectively, which confirms the presence of these bonds in
formulations.
Letter G and Letter H, present in Gas-X spectrum, were ascribed to aromatic compounds
and aromatic amine (absorptions bands at 1600-1430cm-1 and 1340-1250cm-1, respectively).
These characteristics bonds are present in pigment FD&Blue#1. As these bonds are also
present in simethicone FTIR, and because none formulation presents pigment in composition,
it is not possible to confirm that this pigment is really present in Gas-X formulation.

IV. RESULTS
59
ii. TGA analyses
Figure 38 present some representative results obtained for the formulations studied. In
Appendix C, TGA curves of all developed formulations can be observed. Gas I.12 was not
evaluated.
The thermograms obtained for Gas I and Gas-X are different result. This observation can be
due to the fact that HPMC E15 was used instead of HPMC E50. It is known that the viscosity
solution is altered and it has impact in films properties. Besides, this commercial film is
known by the percentage of API included in one thin strip: Gas-X has a loading of 62.5mg of
simethicone, which corresponds to approximately 60% of this excipient in film (Siddiqui, et al,
2011). However, the quantity used in the commercial film is also higher than the
formulations tested.
Temperature [ºC]
Wei
ght [
%]
0 200 400 6000
20
40
60
80
100Gas-xGas I.3
Temperature [ºC]
Wei
ght [
%]
0 200 400 6000
20
40
60
80
100Gas-xGas I.7
Temperature [ºC]
Wei
ght [
%]
0 200 400 6000
20
40
60
80
100Gas-xGas I.5
Temperature [ºC]
Wei
ght [
%]
0 200 400 6000
20
40
60
80
100Gas-xGas I.10
Figure 38: TGA profiles of representative formulations.
A B

IV. RESULTS
60
The temperatures at occur a weight loss of 5% and 10% are presented in Table 24.
Table 24: Temperatures extracted from TGA curve. Blue – similar to Gas-X. Grey – higher than Gas-X.
Film ID Temp. at Weight loss T
onset
5% 10% Gas I.1 62,86 267,95 279,19 Gas I.3 204,85 294,13 334,74 Gas I.5 60,77 217,69 261,69 Gas I.6 74,72 217,28 214,71 Gas I.7 228,15 294,85 333,87
Gas I.10 201,07 252,61 261,2 Gas I.11 257,48 312,16 339,19 Gas-X 211,03 234,54 221,6
Films represented in Figure 38-A have a higher thermal degradation temperature than Gas-X
(Table 24 – Grey). Contrary, films represented Figure 38-B have a Tonset similar to Gas-X
(Table 24 – Blue). Formulations can be analysed in Table 25.
Table 25: Developed formulations. Blue - Tonset similar to Gas-X, Grey- higher Tonset than Gas-X.
Film ID HPMC E5 HPMC E15 MDx Modified Starch
PEG 400 Sorbitol Sucralose Simethicone
Gas I.1. 43,3% 0,0% 0,0% 43,5% 0,0% 0,0% 0,0% 13,2%
Gas I.3. 43,5% 43,3% 0,0% 0,0% 0,0% 0,0% 0,0% 13,2%
Gas I.5. 56,0% 0,0% 33,7% 0,0% 0,0% 0,0% 0,0% 10,3%
Gas I.6 15,7% 15,7% 15,4% 15,4% 18,2% 9,9% 4,6% 5,1%
Gas I.7. 76,6% 0,0% 0,0% 0,0% 0,0% 0,0% 0,0% 23,4%
Gas I.10 0,0% 41,0% 0,0% 24,6% 18,1% 0,0% 0,0% 16,2%
Gas I.11. 0,0% 76,2% 0,0% 0,0% 0,0% 0,0% 0,0% 23,8%
Gas I.3, Gas I.7 and other formulations with
degradation temperature higher than Gas-X
are composed primarily of polymers. For
example, Gas I.3, Gas I.7 and Gas I.11 have
around 80% of HPMC in composition.
Figure 39 presents the TGA curve of
HPMC.
From Figure 39, it is possible to conclude
that HPMC starts its thermal degradation
process around 350°C. Once this polymer is the main component of the formulations, it is
understandable that they have a Tonset value around this temperature.
Temperature (ºC)
Wei
ght [
%]
0 200 400 6000
20
40
60
80
100
Figure 39: TGA curve of HPMC.
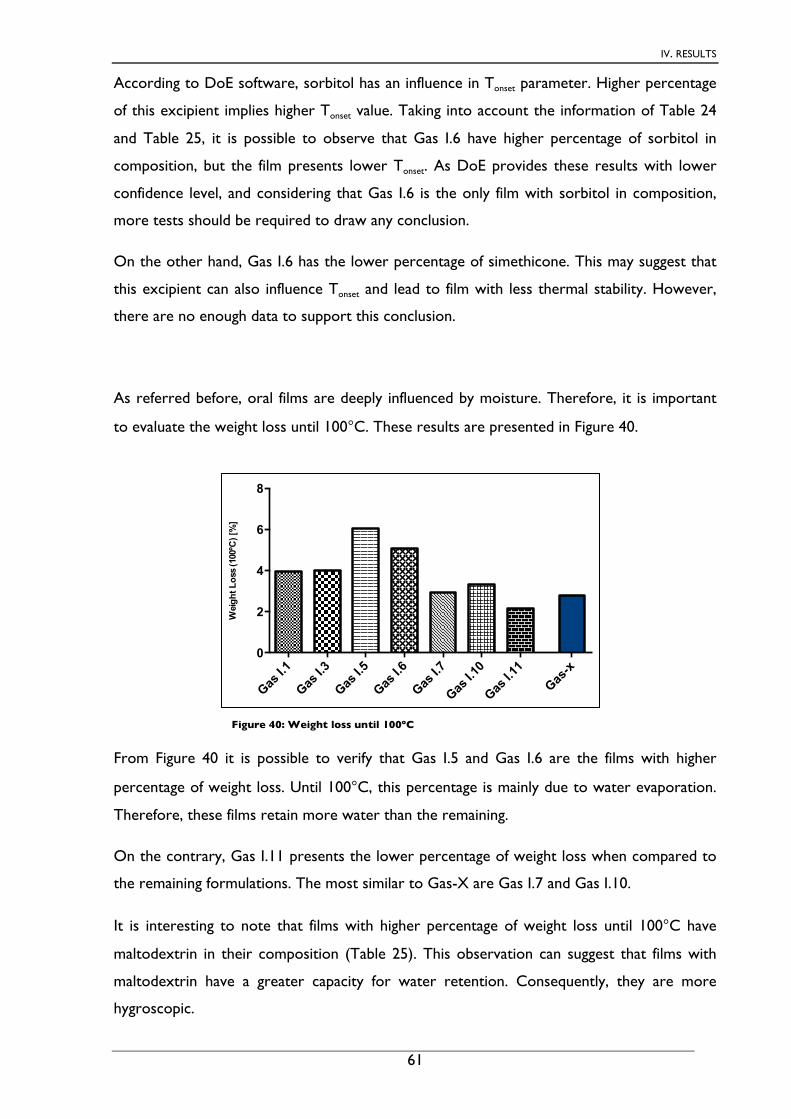
IV. RESULTS
61
According to DoE software, sorbitol has an influence in Tonset parameter. Higher percentage
of this excipient implies higher Tonset value. Taking into account the information of Table 24
and Table 25, it is possible to observe that Gas I.6 have higher percentage of sorbitol in
composition, but the film presents lower Tonset. As DoE provides these results with lower
confidence level, and considering that Gas I.6 is the only film with sorbitol in composition,
more tests should be required to draw any conclusion.
On the other hand, Gas I.6 has the lower percentage of simethicone. This may suggest that
this excipient can also influence Tonset and lead to film with less thermal stability. However,
there are no enough data to support this conclusion.
As referred before, oral films are deeply influenced by moisture. Therefore, it is important
to evaluate the weight loss until 100°C. These results are presented in Figure 40.
From Figure 40 it is possible to verify that Gas I.5 and Gas I.6 are the films with higher
percentage of weight loss. Until 100°C, this percentage is mainly due to water evaporation.
Therefore, these films retain more water than the remaining.
On the contrary, Gas I.11 presents the lower percentage of weight loss when compared to
the remaining formulations. The most similar to Gas-X are Gas I.7 and Gas I.10.
It is interesting to note that films with higher percentage of weight loss until 100°C have
maltodextrin in their composition (Table 25). This observation can suggest that films with
maltodextrin have a greater capacity for water retention. Consequently, they are more
hygroscopic.
Gas I.1
Gas I.3
Gas I.5
Gas I.6
Gas I.7
Gas I.1
0
Gas I.1
1
Gas-x
0
2
4
6
8
Wei
ght L
oss
(100
ºC) [
%]
Figure 40: Weight loss until 100ºC

IV. RESULTS
62
iii. DSC analyses
Figure 41 presents the DSC results for selected films that represent the different
formulations. In Appendix D, all DSC results can be analysed.
Although we have defined that Gas-X events are difficult to ascribed, it is possible to identify
in Figure 41-A that the formulations present the same thermal event around -50°C. This
endothermic event is common for the developed formulations, except in Gas I.6 and Gas
I.12 (Figure 41-B). In these formulations, there is a variation in heat flow around this
temperature, but not so pronounced as in the other ones.
Gas I.6 and Gas I.12 have lower percentage of
HPMC when compared to other formulations.
This result may suggest that the percentage of
HPMC in Gas-X is higher than 30%. These films
have also lower percentage of simethicone.
Comparing simethicone and Gas-X DSC curves
(Figure 42), it is possible to identify that
simethicone present the same thermal event
around -50ºC as Gas-X. This result confirms the present of this excipient in the formulation.
-50 0 50 100-2
-1
0
1
Temperature [ºC]
Heat
Flo
w [W
.g-1
]
Gas I.11Gas I.7
Gas I.1
Gas-X
-50 0 50 100-2
-1
0
1
Temperature [ºC]
Heat
Flo
w [W
.g-1
]
Gas-X
Gas I.12
Gas I.6
Figure 41: DSC curves of some Gas I. developed formulations. A – similar to Gas-X, B- some differences from Gas-X.
A B
-50 0 50 100-1.0
-0.5
0.0
0.5
Temperature [ºC]
Heat
Flo
w [W
.g-1
]
Figure 42: DSC curve of simethicone

IV. RESULTS
63
iv. Mechanical Properties
Figure 43 presents the average values of mechanical properties for developed films. It was
not possible to evaluate the mechanical properties of Gas I.6 due to its fragility.
Table 26 summarizes the mechanical properties obtained for the films.
Table 26: Summary results of mechanical properties of formulations. Red – Lower values; Grey- Higher values.
Film ID εB [%] Et [MPa] σB [MPa] Thickness (µm)
Gas I.1 1,12 273,5 3,65 90
Gas I.3 1,627 992,9 14,45 40
Gas I.5 0,99 1572 15,82 40
Gas I.7 2,193 987,1 18,87 40
Gas I.10 8,427 181,7 4,74 40
Gas I.11 2,833 1089 21,86 30
Gas I.12 2,92 168.1 4,345 45
Gas-X 9,311 64,34 3,301 110
According to results presented (Table 26), it is possible to identify a wide variation in the
mechanical properties and even in the thickness.
Gas I.1
Gas I.3
Gas I.5
Gas I.7
Gas I.1
0
Gas I.1
1
Gas I.1
2
Gas-x
0
500
1000
1500
2000
You
ng's
mod
ulus
[MP
a]
**** **** ****
****
*
Tens
ile s
tren
gth
[MP
a]
Gas I.1
Gas I.3
Gas I.5
Gas I.7
Gas I.1
0
Gas I.1
1
Gas I.1
2
Gas-x
0
5
10
15
20
25
**** ********
****
Elo
ngat
ion
[%]
Gas I.1
Gas I.3
Gas I.5
Gas I.7
Gas I.1
0
Gas I.1
1
Gas I.1
2
Gas-x
0
5
10
15
********
******** *******
Figure 43: Summary results of mechanical properties of developed formulations. A - Elongation, B Tensile Stress at Break, C - Young's Modulus.
A B
C

IV. RESULTS
64
From the results available in Figure 43-A, it is possible to identify Gas I.10 as the film with
more elongation, almost 3-fold the value of the remaining formulations. This is the one with
similar elongation to Gas-X.
Table 27: Developed formulations. Grey- similar elongation to Gas-X.
Film ID HPMC E5 HPMC E15 MDx Modified Starch
PEG 400 Sorbitol Sucralose Simethicone
Gas I.1. 43,3% 0,0% 0,0% 43,5% 0,0% 0,0% 0,0% 13,2%
Gas I.3. 43,5% 43,3% 0,0% 0,0% 0,0% 0,0% 0,0% 13,2%
Gas I.5. 56,0% 0,0% 33,7% 0,0% 0,0% 0,0% 0,0% 10,3%
Gas I.7. 76,6% 0,0% 0,0% 0,0% 0,0% 0,0% 0,0% 23,4%
Gas I.10 0,0% 41,0% 0,0% 24,6% 18,1% 0,0% 0,0% 16,2%
Gas I.11. 0,0% 76,2% 0,0% 0,0% 0,0% 0,0% 0,0% 23,8%
Gas I.12. 16,2% 16,0% 16,0% 16,0% 14,8% 11,2% 4,8% 5,1%
Taking into account the information of Table 27, it is possible to suggest that PEG400 is the
excipient that provides the elongation observed for Gas I.10. This film has highest
percentage of plasticizer, which should be responsible for the elongation represented.
Gas I.10 and Gas I.12 have the lower Young’s modulus value, which is also justified by the
amount of plasticizer in their composition. According to Dixit (2009), this excipient
improves the flexibility and reduces the brittleness of the strip, as observed in the presented
results.
Gas I.1, Gas I.10 and Gas I.12 have the lower tensile stress at break and the value is similar
to commercial film. These formulations differ from the remaining because they have
modified starch in formulation. DoE software supports this statement: this excipient
influences negatively this parameter. Higher percentage of modified starch leads to lower
tensile strength value.
The results extracted from software have lower confidence intervals, which means that to
take more reliable conclusions, more experiments should be done.

IV. RESULTS
65
As Gas I.10 is similar to Gas-X in the different mechanical properties, stress-strain curve is
only presented for this formulation (Figure 44). In Appendix E, stress-strain curves for all
developed formulation can be consulted.
From the results present in Figure 44 it is possible to identify that the stress-strain curves of
Gas I.10 and Gas-X are very similar. Even so, Gas I.10 has a higher tensile strength and
smaller elongation percentage. The results suggest a correspondence between Gas I.10
formulation as Gas-X film.
v. DMTA
Once Gas I.10 presented similar behaviour to Gas-X in mechanical properties, this was the
only film evaluated by DMTA analysis. The comparison between these both films will be
made in next Section, with Gas III formulations.
vi. Karl Fischer Titration
Figure 45 presents the Karl Fischer results obtained for the formulations.
A B
Figure 44: Stress-strain curves of Gas-x and most similar. A- Gas-X, B- Gas I.10
Gas I.1
Gas I.3
Gas I.5
Gas I.6
Gas I.7
Gas I.1
0
Gas I.1
1
Gas I.1
2Gas
-x0
2
4
6
H2O
[%]
*****
Figure 45: Residual water content determined by Karl Fischer Titration.
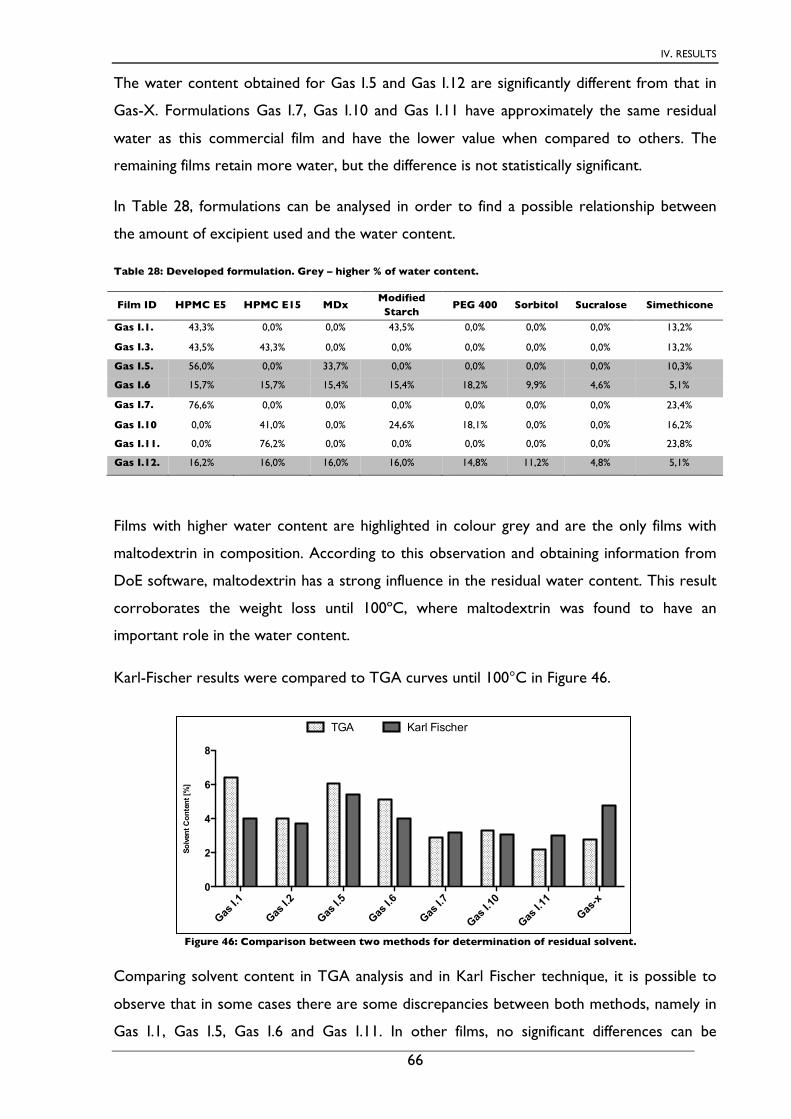
IV. RESULTS
66
The water content obtained for Gas I.5 and Gas I.12 are significantly different from that in
Gas-X. Formulations Gas I.7, Gas I.10 and Gas I.11 have approximately the same residual
water as this commercial film and have the lower value when compared to others. The
remaining films retain more water, but the difference is not statistically significant.
In Table 28, formulations can be analysed in order to find a possible relationship between
the amount of excipient used and the water content.
Table 28: Developed formulation. Grey – higher % of water content.
Film ID HPMC E5 HPMC E15 MDx Modified Starch
PEG 400 Sorbitol Sucralose Simethicone
Gas I.1. 43,3% 0,0% 0,0% 43,5% 0,0% 0,0% 0,0% 13,2%
Gas I.3. 43,5% 43,3% 0,0% 0,0% 0,0% 0,0% 0,0% 13,2%
Gas I.5. 56,0% 0,0% 33,7% 0,0% 0,0% 0,0% 0,0% 10,3%
Gas I.6 15,7% 15,7% 15,4% 15,4% 18,2% 9,9% 4,6% 5,1%
Gas I.7. 76,6% 0,0% 0,0% 0,0% 0,0% 0,0% 0,0% 23,4%
Gas I.10 0,0% 41,0% 0,0% 24,6% 18,1% 0,0% 0,0% 16,2%
Gas I.11. 0,0% 76,2% 0,0% 0,0% 0,0% 0,0% 0,0% 23,8%
Gas I.12. 16,2% 16,0% 16,0% 16,0% 14,8% 11,2% 4,8% 5,1%
Films with higher water content are highlighted in colour grey and are the only films with
maltodextrin in composition. According to this observation and obtaining information from
DoE software, maltodextrin has a strong influence in the residual water content. This result
corroborates the weight loss until 100ºC, where maltodextrin was found to have an
important role in the water content.
Karl-Fischer results were compared to TGA curves until 100°C in Figure 46.
Comparing solvent content in TGA analysis and in Karl Fischer technique, it is possible to
observe that in some cases there are some discrepancies between both methods, namely in
Gas I.1, Gas I.5, Gas I.6 and Gas I.11. In other films, no significant differences can be
Figure 46: Comparison between two methods for determination of residual solvent.
Solv
ent C
onte
nt [%
]
Gas I.1
Gas I.2
Gas I.5
Gas I.6
Gas I.7
Gas I.1
0
Gas I.1
1
Gas-x
0
2
4
6
8
TGA Karl Fischer
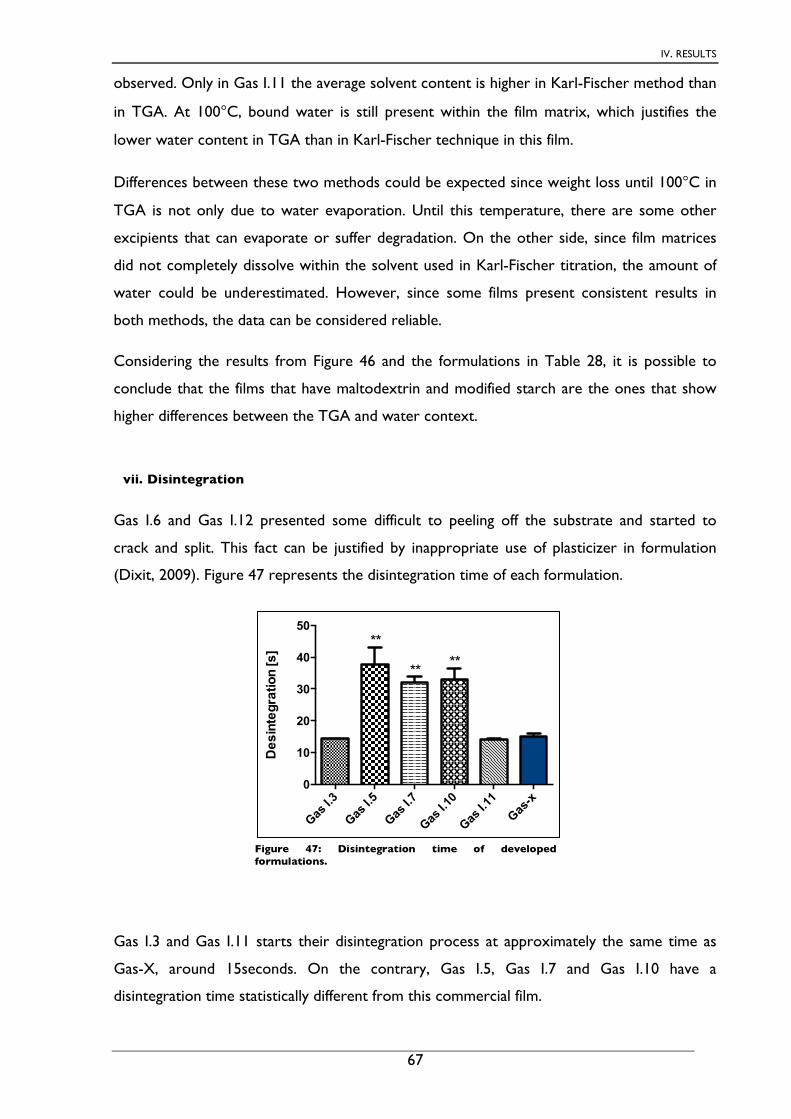
IV. RESULTS
67
observed. Only in Gas I.11 the average solvent content is higher in Karl-Fischer method than
in TGA. At 100°C, bound water is still present within the film matrix, which justifies the
lower water content in TGA than in Karl-Fischer technique in this film.
Differences between these two methods could be expected since weight loss until 100°C in
TGA is not only due to water evaporation. Until this temperature, there are some other
excipients that can evaporate or suffer degradation. On the other side, since film matrices
did not completely dissolve within the solvent used in Karl-Fischer titration, the amount of
water could be underestimated. However, since some films present consistent results in
both methods, the data can be considered reliable.
Considering the results from Figure 46 and the formulations in Table 28, it is possible to
conclude that the films that have maltodextrin and modified starch are the ones that show
higher differences between the TGA and water context.
vii. Disintegration
Gas I.6 and Gas I.12 presented some difficult to peeling off the substrate and started to
crack and split. This fact can be justified by inappropriate use of plasticizer in formulation
(Dixit, 2009). Figure 47 represents the disintegration time of each formulation.
Gas I.3 and Gas I.11 starts their disintegration process at approximately the same time as
Gas-X, around 15seconds. On the contrary, Gas I.5, Gas I.7 and Gas I.10 have a
disintegration time statistically different from this commercial film.
Figure 47: Disintegration time of developed formulations.
Des
inte
grat
ion
[s]
Gas I.3
Gas I.5
Gas I.7
Gas I.1
0
Gas I.1
1
Gas-x
0
10
20
30
40
50**
** **

IV. RESULTS
68
In Table 29 the formulations can be related with disintegration time.
Table 29: Developed formulations. Grey- higher disintegration time
Film ID HPMC E5 HPMC E15 MDx Modified Starch
PEG 400 Sorbitol Sucralose Simethicone
Gas I.3. 43,5% 43,3% 0,0% 0,0% 0,0% 0,0% 0,0% 13,2%
Gas I.5. 56,0% 0,0% 33,7% 0,0% 0,0% 0,0% 0,0% 10,3%
Gas I.7. 76,6% 0,0% 0,0% 0,0% 0,0% 0,0% 0,0% 23,4%
Gas I.10 0,0% 41,0% 0,0% 24,6% 18,1% 0,0% 0,0% 16,2%
Gas I.11. 0,0% 76,2% 0,0% 0,0% 0,0% 0,0% 0,0% 23,8%
Gas I.5 is the film having maltodextrin in its composition and present the higher
disintegration time. In previous analyses, this excipient was already pointed as having
influence in water absorption.
As referred by Chen, higher loading of API leads to lower disintegration time (Chen et
al.,2008). This can be confirmed by Gas I.11 which starts its disintegration process first than
other film analysed.

IV. 2.3 Gas-X II
69
2.3 Gas-X II
Formulations denominated Gas-X II were prepared using solutions of HPMC E5 10% (%w/w)
and HPMC E50 2% (%w/w). Some films became fragile, brittle and powdery, and others
crumbled into pieces. Consequently, it was impossible to fully characterize these films.
This phenomenon happens due to excess of water in films preparation, which leads to brittle
films. Formulation has a high influence in films final look and in films properties.

IV. RESULTS
70
2.4 Gas-X III.
Formulations denominated Gas III. were prepared using polymers in powder form.
In Table 30 it is presented the developed formulations resulting from a DoE screening.
Table 30: Developed and characterized Gas III. formulations.
Film ID HPMC E5 HPMC E15 MDx Modified Starch
PEG 400 Sorbitol Sucralose API
Gas III.4 41,1% 10,3% 13,7% 13,7% 0,0% 7,4% 0,0% 13,7%
Gas III.5 59,1% 14,8% 0,0% 0,0% 0,0% 11,2% 5,0% 10,0%
Gas III.6 59,8% 15,0% 20,1% 0,0% 0,0% 0,0% 0,0% 5,2%
Gas III.7 14,9% 15,0% 19,7% 0,0% 20,6% 10,4% 0,0% 19,5%
Gas III.10 13,7% 54,4% 0,0% 18,1% 0,0% 0,0% 0,0% 13,8%
Gas III.11 15,0% 14,9% 0,0% 0,0% 0,0% 10,6% 0,0% 59,4%
Gas III.12 12,4% 33,0% 16,5% 0,0% 0,0% 9,2% 4,2% 24,6%
Gas III.14 15,7% 47,1% 0,0% 0,0% 0,0% 8,8% 3,9% 24,4%
Gas III.15 50,7% 12,7% 0,0% 0,0% 17,5% 0,0% 0,0% 19,2%
Gas III.18 13,5% 49,6% 0,0% 18,0% 0,0% 0,0% 4,5% 14,3%
Gas III.19 14,8% 14,9% 0,0% 19,8% 0,0% 0,0% 0,0% 50,5%
Gas III.20 12,0% 47,5% 0,0% 0,0% 16,5% 0,0% 0,0% 24,0%
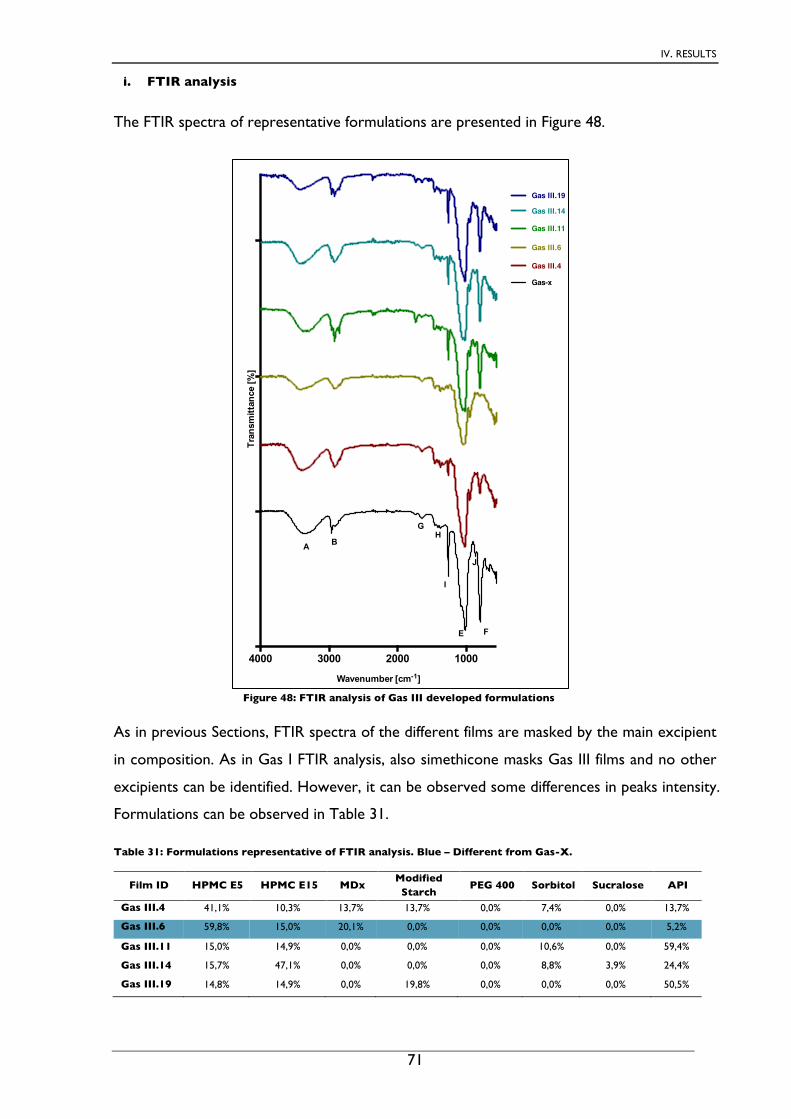
IV. RESULTS
71
i. FTIR analysis
The FTIR spectra of representative formulations are presented in Figure 48.
As in previous Sections, FTIR spectra of the different films are masked by the main excipient
in composition. As in Gas I FTIR analysis, also simethicone masks Gas III films and no other
excipients can be identified. However, it can be observed some differences in peaks intensity.
Formulations can be observed in Table 31.
Table 31: Formulations representative of FTIR analysis. Blue – Different from Gas-X.
Film ID HPMC E5 HPMC E15 MDx Modified Starch
PEG 400 Sorbitol Sucralose API
Gas III.4 41,1% 10,3% 13,7% 13,7% 0,0% 7,4% 0,0% 13,7%
Gas III.6 59,8% 15,0% 20,1% 0,0% 0,0% 0,0% 0,0% 5,2%
Gas III.11 15,0% 14,9% 0,0% 0,0% 0,0% 10,6% 0,0% 59,4%
Gas III.14 15,7% 47,1% 0,0% 0,0% 0,0% 8,8% 3,9% 24,4%
Gas III.19 14,8% 14,9% 0,0% 19,8% 0,0% 0,0% 0,0% 50,5%
Figure 48: FTIR analysis of Gas III developed formulations
1000200030004000
Wavenumber [cm-1]
Tran
smitt
ance
[%]
Gas III.14
Gas III.11
Gas III.6
Gas III.4
Gas-x
Gas III.19
A B
GH
I
E F
J
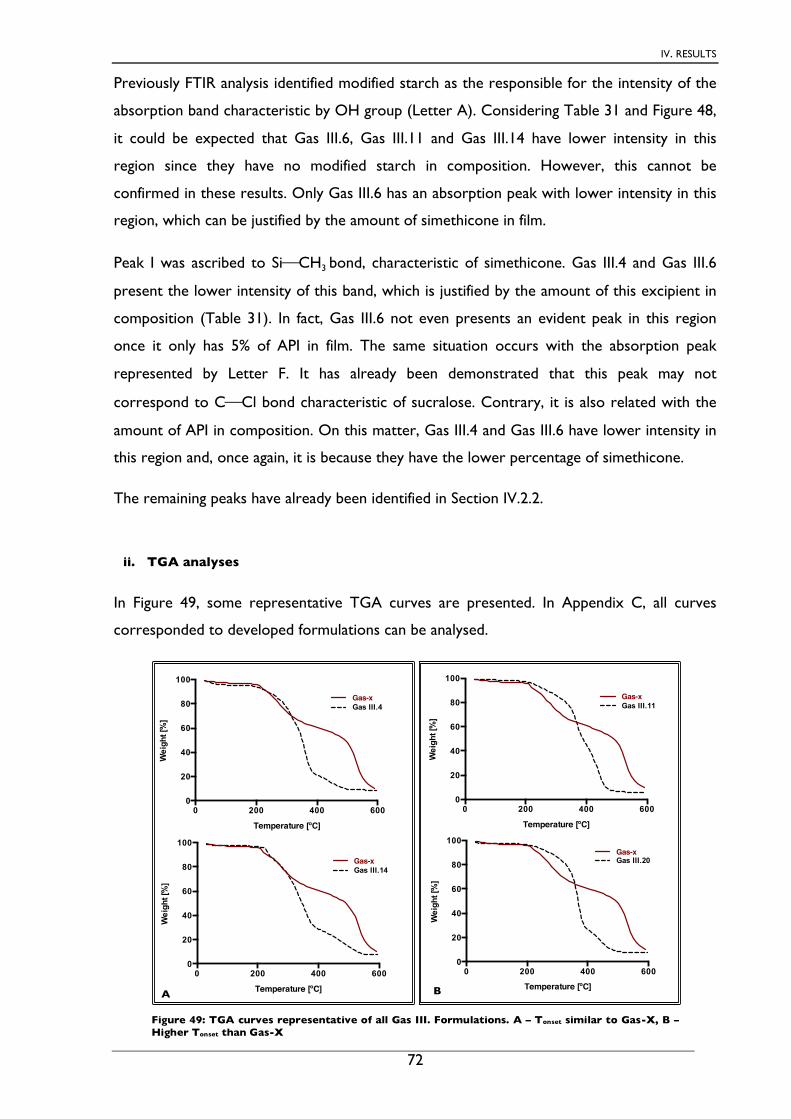
IV. RESULTS
72
Previously FTIR analysis identified modified starch as the responsible for the intensity of the
absorption band characteristic by OH group (Letter A). Considering Table 31 and Figure 48,
it could be expected that Gas III.6, Gas III.11 and Gas III.14 have lower intensity in this
region since they have no modified starch in composition. However, this cannot be
confirmed in these results. Only Gas III.6 has an absorption peak with lower intensity in this
region, which can be justified by the amount of simethicone in film.
Peak I was ascribed to Si⎯CH3 bond, characteristic of simethicone. Gas III.4 and Gas III.6
present the lower intensity of this band, which is justified by the amount of this excipient in
composition (Table 31). In fact, Gas III.6 not even presents an evident peak in this region
once it only has 5% of API in film. The same situation occurs with the absorption peak
represented by Letter F. It has already been demonstrated that this peak may not
correspond to C⎯Cl bond characteristic of sucralose. Contrary, it is also related with the
amount of API in composition. On this matter, Gas III.4 and Gas III.6 have lower intensity in
this region and, once again, it is because they have the lower percentage of simethicone.
The remaining peaks have already been identified in Section IV.2.2.
ii. TGA analyses
In Figure 49, some representative TGA curves are presented. In Appendix C, all curves
corresponded to developed formulations can be analysed.
Temperature [ºC]
Wei
ght [
%]
0 200 400 6000
20
40
60
80
100
Gas III.4Gas-x
0 200 400 6000
20
40
60
80
100
Temperature [ºC]
Wei
ght [
%]
Gas-xGas III.14
A
Temperature [ºC]
Wei
ght [
%]
0 200 400 6000
20
40
60
80
100
Gas III.11Gas-x
Temperature [ºC]
Wei
ght [
%]
0 200 400 6000
20
40
60
80
100Gas-xGas III.20
B
Figure 49: TGA curves representative of all Gas III. Formulations. A – Tonset similar to Gas-X, B – Higher Tonset than Gas-X

IV. RESULTS
73
Although none of these films have a similar behaviour to Gas-X, it is possible to identify
particular similarity in some of them. In films presented in Figure 49-A, thermal degradation
process starts at approximately the same temperature of the Gas-X film (around 200ºC).
Films represented by Gas III.11 and Gas III.20 begins they degradation process after Gas-X
(Figure 49-B).
To complete TGA analysis, temperatures at occur a weight loss of 5% and 10% and the Tonset
are presented in Table32.
Table 32: Temperatures extracted from TGA curve. Blue – similar to Gas-X; Grey – similar behaviour until 300ºC
Film ID Temp. at Weight loss T
onset
5% 10%
Gas III.4 179,16 236,89 271,26 Gas IIII.5 221,23 223,17 215,24 Gas III.6 190,7 240,6 326,17 Gas III.7 264,93 311,89 341,39 Gas III.10 212,97 289,07 329,2 Gas III.11 228,92 269,86 324,57 Gas III.12 193,36 224,86 223,86 Gas III.14 227,88 238,02 284,66 Gas III.15 224,75 274,67 333,61 Gas III.18 235,04 239,6 234,66 Gas III.19 240,32 286,3 320,03 Gas III.20 224,91 272,63 333,31 Gas-X 211,03 234,54 221,6
Formulations Gas III.5, Gas III.12 and Gas III.18 (highlighted in blue) have a similar Tonset to
Gas-X, and represent the lowest values of all developed formulations. Although formulations
represented in Figure 49-A do not have Tonset similar to Gas-X, their behaviour until 300ºC
are almost identical. Furthermore, their Tonset values are included at the lower of all
developed formulations (highlighted in grey).

IV. RESULTS
74
Table 33: Developed formulations. Blue- Tonset similar to Gas-X. Grey – similar behaviour until 300ºC.
Film ID HPMC E5 HPMC E15 MDx Modified Starch
PEG 400 Sorbitol Sucralose API
Gas III.4 41,1% 10,3% 13,7% 13,7% 0,0% 7,4% 0,0% 13,7%
Gas III.5 59,1% 14,8% 0,0% 0,0% 0,0% 11,2% 5,0% 10,0%
Gas III.6 59,8% 15,0% 20,1% 0,0% 0,0% 0,0% 0,0% 5,2%
Gas III.7 14,9% 15,0% 19,7% 0,0% 20,6% 10,4% 0,0% 19,5%
Gas III.10 13,7% 54,4% 0,0% 18,1% 0,0% 0,0% 0,0% 13,8%
Gas III.11 15,0% 14,9% 0,0% 0,0% 0,0% 10,6% 0,0% 59,4%
Gas III.12 12,4% 33,0% 16,5% 0,0% 0,0% 9,2% 4,2% 24,6%
Gas III.14 15,7% 47,1% 0,0% 0,0% 0,0% 8,8% 3,9% 24,4%
Gas III.15 50,7% 12,7% 0,0% 0,0% 17,5% 0,0% 0,0% 19,2%
Gas III.18 13,5% 49,6% 0,0% 18,0% 0,0% 0,0% 4,5% 14,3%
Gas III.19 14,8% 14,9% 0,0% 19,8% 0,0% 0,0% 0,0% 50,5%
Gas III.20 12,0% 47,5% 0,0% 0,0% 16,5% 0,0% 0,0% 24,0%
Formulations highlighted in blue and grey colours represent the films with lower thermal
degradation temperature. According to Table 33 and DoE software it is possible to identify
that sucralose is present in all formulations, except in Gas III.4. So, films with higher
percentage of sucralose in composition have a lower Tonset and, consequently, they are
thermally less stable than films without sucralose. This can be validated by Gas III.5 that has
the highest percentage of this excipient (5%) and have the lowest Tonset value (215,24ºC)
(Table 32).
Sucralose is an essential excipient in Gas-X films and it is possible to suggest that its
percentage in films should be between 0 and 5%.
The weight loss up to 100ºC is presented in Figure 50.
Gas III
.4
Gas III
.5
Gas III
.6
Gas III
.7
Gas III
.10
Gas III
.11
Gas III
.12
Gas III
.14
Gas III
.15
Gas III
.18
Gas III
.19
Gas III
.20
Gas-x
0
1
2
3
4
5
Wei
ght L
oss
(100
ºC) [
%]
Figure 50: Weight loss until 100ºC of Gas III. formulations

IV. RESULTS
75
Taking into account Figure 50 and the formulations (Table 33), it is possible to verify that
films with higher percentage of weight loss until 100ºC have lowest percentage of
simethicone. Except Gas III.12, all the others with higher solvent content have percentage of
API inferior to 15%. Contrary, all other films with lower percentage of weight loss have a
percentage of API higher than 20%. This result suggests that simethicone is responsible for
water retention.
According to DoE software, PEG 400 also influences this parameter. Films with plasticizer in
composition (Gas III.7, Gas III.15 and Gas III.20) have lower percentage of weight loss. This
means that PEG 400 is responsible for water retention, which is easily justified by the
hygroscopicity of this excipient.
Film with a similar weight loss until 100ºC to Gas-X is Gas III.19. This film presents a
percentage of API of 50.5% and no plasticizer in composition.
iii. DSC analyses
DSC curves of representative films can be observed in Figure 52. In Appendix D all DSC
results can be analysed.
The formulations were divided in two groups according the presence of a peak around -
50ºC. In Figure 51-A, films present no peak in this region. In opposition, films in Figure 51-B
have an evident peak at this temperature and also present a glass transition at higher
temperature. Differences between both groups are in the amount of simethicone in
formulation. Films with higher percentage of API have lower percentage of polymers in
composition. Gas III.11 and Gas III.19 have around 30% of HPMC and 50-60% of API.
-50 0 50 100-2.0
-1.5
-1.0
-0.5
0.0
0.5
Temperature [ºC]
Heat
Flo
w [W
.g-1
]
Gas III.14
Gas III.6Gas-X
-50 0 50 100-1.5
-1.0
-0.5
0.0
0.5
Temperature [ºC]
Heat
Flo
w [W
.g-1
]
Gas III.19Gas III.11
Gas-X
Figure 51: DSC curves for some Gas III. Formulations. A – discrete events, B – highlighted events.
A B

IV. RESULTS
76
Contrary, all other formulations have a percentage of HPMC above 50% and lower
percentages of simethicone. (Table 33)
In Section IV.1, Gas I was referred that films with lower percentage of simethicone does not
present evident thermal events (Figure 41-B). In this Section, results are consistent with
previous analyses: films with higher percentage of simethicone have clear and evident events.
iv. Mechanical Properties
In Figure 52 an average value of mechanical properties of developed films is presented and
these values are summarized in Table 34.
Figure 52: Summary results of mechanical properties of developed formulations. A-Elongation, B-Young’s Modulus, C – Tensile Stress at Break.
Gas III
.4
Gas III
.5
Gas III
.6
Gas III
.10
Gas III
.11
Gas III
.12
Gas III
.14
Gas III
.15
Gas III
.18
Gas III
.19
Gas-x
0
10
20
Elo
ngat
ion
[%]
Gas III
.4
Gas III
.5
Gas III
.10
Gas III
.6
Gas III
.11
Gas III
.12
Gas III
.14
Gas III
.15
Gas III
.18
Gas III
.19
Gas III
.20
Gas-x
0
500
1000
1500
2000
You
ng's
mod
ulus
[MP
a]
Gas III
.4
Gas III
.5
Gas III
.6
Gas III
.10
Gas III
.11
Gas III
.12
Gas III
.14
Gas III
.15
Gas III
.18
Gas III
.19
Gas III
.20
Gas-x
0
10
20
30
40
50
Tens
ile s
tren
gth
[MP
a]
A
B
C

IV. RESULTS
77
Table 34: Summary results of properties of developed formulations. Grey – Higher εB; Blue-Similar to Gas-X; Red – Higher Et Yellow – Higher σB.
Film ID εB [%] Et [MPa] σB [MPa] Thickness (µm)
Gas III.4 2.68 1159 19.5 70
Gas III.5 3.56 1252 39.43 30
Gas III.6 2.843 1900 38.31 50
Gas III.10 3.203 1165 24.85 40
Gas III.11 2.16 83.89 1.763 70
Gas III.12 4.21 779.3 20.53 50
Gas III.14 10.51 734.8 24.7 50
Gas III.15 7.467 373.2 11,39 50
Gas III.18 4.433 795.8 20.55 60
Gas III.19 2.16 130.7 2.54 70
Gas III.20 55.7 293.5 16.42 50
Gas-X 9.311 64,34 3,301 110
According to results summarized in Table 34, it is possible to observe a wide variation of
mechanical properties and thickness. Poluri (2013) referred that thickness of films increased
with the viscosity grade of the film-forming agent. This parameter influences these properties,
but this fact should not be considered in general evaluation.
Gas III.20 was not represented in Figure 52-A once its percentage of elongation is too high
(56%), which is much higher than the other films elongation.
Gas III.14 and Gas III.15 present high percentages of elongation, being significantly different
from the remaining films analysed. Gas-X elongation is set between these two films. In Table
35 formulations can be analysed in order to understand which excipients are affecting
elongation parameter. Films with higher percentage of elasticity are highlighted in grey.
Table 35: Developed Gas III formulations. Grey – Higher εB; Blue-Similar to Gas-X; Red – Higher Et Yellow – Higher σB.
Film ID HPMC E5 HPMC E50 MDx Modified Starch
PEG 400 Sorbitol Sucralose API
Gas III.4 41,1% 10,3% 13,7% 13,7% 0,0% 7,4% 0,0% 13,7%
Gas III.5 59,1% 14,8% 0,0% 0,0% 0,0% 11,2% 5,0% 10,0%
Gas III.6 59,8% 15,0% 20,1% 0,0% 0,0% 0,0% 0,0% 5,2%
Gas III.10 13,7% 54,4% 0,0% 18,1% 0,0% 0,0% 0,0% 13,8%
Gas III.11 15,0% 14,9% 0,0% 0,0% 0,0% 10,6% 0,0% 59,4%
Gas III.12 12,4% 33,0% 16,5% 0,0% 0,0% 9,2% 4,2% 24,6%
Gas III.14 15,7% 47,1% 0,0% 0,0% 0,0% 8,8% 3,9% 24,4%
Gas III.15 50,7% 12,7% 0,0% 0,0% 17,5% 0,0% 0,0% 19,2%
Gas III.18 13,5% 49,6% 0,0% 18,0% 0,0% 0,0% 4,5% 14,3%
Gas III.19 14,8% 14,9% 0,0% 19,8% 0,0% 0,0% 0,0% 50,5%
Gas III.20 12,0% 47,5% 0,0% 0,0% 16,5% 0,0% 0,0% 24,0%

IV. RESULTS
78
By analysing results presented in Table 35 as well as the DoE, some conclusion can be drawn.
Films with higher percentage of elongation have PEG 400 in composition and/or have higher
percentage of HPMC E50. Gas III.20, referred as the one with highest elongation, have
around 48% of HPMC and 16.5% of plasticizer. The combination of these two excipients and
both in large quantities leads to a film with a much higher elongation rate than the remaining
formulations.
Although Gas III.4 does not have plasticizer in composition, the percentage of HPMC E50 is
around 47% (w/w), which contribute for a film with higher elongation rate. All films with
amounts of this excipient around this value stand out from the others, although with lower
difference.
In what concerns to stiffness, Gas III.6 stands out from the other films presenting the highest
Young’s Modulus, followed by Gas III.4, III.5 and Gas III.10. Comparing this observation with
formulations in Table 35, it is possible to notice that these films, highlighted in red, have the
lowest percentage of API. Otherwise, as the amount of simethicone increases, the stiffness
of films decreases (Gas III.11and Gas III.19). Both films have 50-60% of this excipient and
their Young’s modulus is similar to Gas-X. This result could suggest that simethicone is
responsible for weaker structure, which lead to weak and soft films. This conclusion is
consistent with previous results analysed in other sections.
Gas III.5 and Gas III.6 present the higher values of tensile strength. Gas III.11 and Gas III.19
present similar tensile strength to Gas-X.
Films highlighted in blue in Table 35 present some similarity to Gas-X relatively to
mechanical properties. Except for elongation parameter, they show an analogous behaviour
that is important to point out. As referred, Gas-X is known by the amount of API in
composition. Since both developed formulation present high percentage of this excipient, it
would be expected to see some similarity in most characterization techniques. In this
particularly case, it could be understandable than they do not present elongation rates
equivalent to Gas-X. If we look carefully to formulations table (Table 35), it is possible to
confirm that none of them has plasticizer in composition. As this excipient is essential for
elongation behaviour, it would be expected that if Gas III.11 and Gas III.19 would have PEG
400 in composition, these films would show a higher elongation rate.
Figure 53 presents stress-strain curves for Gas III.11, Gas III.19 and Gas-X.

IV. RESULTS
79
As referred before, the similarity between developed formulations and commercial film is
quite evident, except in elongation parameter. It can be seen the same tendency in Figure
54–A and Figure 54-B for the tensile strength at break, but the maximum stress are different.
v. DMTA
Once only Gas III.11 and Gas III.19 presented similar behaviour to Gas-X in mechanical
properties, these were the only two films evaluated by DMTA analysis. Gas I.10 from
Section 2.2 will be analysed in this section. The comparison between these films is
represented in Figure 54.
Figure 53: Stress Strain curves of Gas-X and similar films. A- Gas III.11, B-Gas III.19 and C - Gas-X
A B
C
Figure 54: DMTA traces (1Hz) of Gas III formulations, Gas I.10 and Gas-X.
-150 -100 -50 0 50 1000.1
1
10
100
1000
10000
Temperature [ºC]
log
E'
Gas III.19
Gas III.11
Gas I.10Gas-X

IV. RESULTS
80
Similar profiles between developed formulations and Gas-X films can be observed in Figure
54. However, elastic modulus has different values in all analysed films. Glass transition is not
so evident in developed films, once the sharp decrease in this parameter starts around -50ºC
and extends until room temperature (Figure 54).
vi. Karl Fischer Titration
The Karl-Fischer results are presented in Figure 55.
Gas III.5, Gas III.6, Gas III.12 and Gas III.18 present some differences, statistically significant,
when compared to Gas-X. All the other films analysed have water content around 4 and 5%,
which is approximately the same value as Gas-X. Nevertheless, this commercial film still has
a residual water of about 3%. This small difference can be justified by different condition
used for packaging and storage of commercial films.
In order to understand differences in solvent content between Karl-Fischer Titration and
TGA analysis, both results are compared in Figure 56.
Gas III
.4
Gas III
.5
Gas III
.6
Gas III
.10
Gas III
.11
Gas III
.12
Gas III
.14
Gas III
.15
Gas III
.18
Gas III
.19
Gas III
.20Gas
-x0
2
4
6
8
H2O
[%]
*** ****
**
Figure 55: Percentage of water content determined by Karl-Fischer technique.

IV. RESULTS
81
The comparison between the different methods shows some differences in results. Only Gas
III.4 and Gas III.10 have approximately the same results in both methods. All the remaining
films present higher percentage of water content in Karl-Fischer than in TGA. In previous
Sections, TGA always presented a higher value than Karl-Fischer titration, which is justified
by the insolubility of films in methanol medium used in Karl-Fischer.
Since the amount of determined water in titration is higher than that in TGA, it is possible
to assume that at 100ºC bound water is still present within the film matrix and for that
reason is not detected during the analysis. Contrary to what happened in previous Sections,
the relationship between this fact and the formulation was shown fruitless.
vii. Contact Angle Measurement
Figure 57 present the contact angles obtained for the different films.
Gas III.4, Gas III.5, Gas III.6 and Gas III.20 present lower average contact angle than the
remaining films. Gas III.5 and Gas III.20 present the lowest angle, around 45º. The other films
have an initial contact angle a closer to Gas-X. However, commercial film still has the higher
Gas III
.4
Gas III
.5
Gas III
.6
Gas III
.10
Gas III
.11
Gas III
.12
Gas III
.14
Gas III
.15
Gas III
.18
Gas III
.19
Gas III
.20
Gas-X
0
2
4
6
8
Sol
vent
Con
tent
[%]
TGA Karl Fischer
Figure 56: Comparison between two methods for determination of residual solvent
Gas III
.4
Gas III
.5
Gas III
.6
Gas III
.10
Gas III
.11
Gas III
.12
Gas III
.14
Gas III
.18
Gas III
.19
Gas III
.20
Gas-X
0
20
40
60
80
Con
tact
Ang
le
CA (initial) CA after 5s
Figure 57: Contact angle of developed formulations.

IV. RESULTS
82
average contact angle (74.33º). This means that developed formulations are more
hygroscopic than correspondent commercial film.
No relation between contact angle and formulations can be made, using the available data.
viii. Disintegration
The time at they begin to break down was measured and represented in Figure 58.
Regarding disintegration time (Figure 58), Gas III.6 stands out from the remaining
formulations once it has higher disintegration times, around 100 seconds. Instead, Gas III.5
present similar disintegration time to Gas-X, and represent the lower value when compared
to others.
Formulations can be analysed in Table 36, in order to understand which excipients affect this
parameter. Films with higher disintegration times are highlighted in blue and films with lower
disintegration time are highlighted in grey.
Table 36: Developed formulations. Blue – higher disintegration time; Grey – lower disintegration time.
Film ID HPMC E5 HPMC E50 MDx Modified Starch
PEG 400 Sorbitol Sucralose API
Gas III.4 41,1% 10,3% 13,7% 13,7% 0,0% 7,4% 0,0% 13,7%
Gas III.5 59,1% 14,8% 0,0% 0,0% 0,0% 11,2% 5,0% 10,0%
Gas III.6 59,8% 15,0% 20,1% 0,0% 0,0% 0,0% 0,0% 5,2%
Gas III.10 13,7% 54,4% 0,0% 18,1% 0,0% 0,0% 0,0% 13,8%
Gas III.11 15,0% 14,9% 0,0% 0,0% 0,0% 10,6% 0,0% 59,4%
Gas III.12 12,4% 33,0% 16,5% 0,0% 0,0% 9,2% 4,2% 24,6%
Gas III.14 15,7% 47,1% 0,0% 0,0% 0,0% 8,8% 3,9% 24,4%
Gas III.15 50,7% 12,7% 0,0% 0,0% 17,5% 0,0% 0,0% 19,2%
Gas III.18 13,5% 49,6% 0,0% 18,0% 0,0% 0,0% 4,5% 14,3%
Gas III.19 14,8% 14,9% 0,0% 19,8% 0,0% 0,0% 0,0% 50,5%
Gas III.20 12,0% 47,5% 0,0% 0,0% 16,5% 0,0% 0,0% 24,0%
Gas III
.4
Gas III
.5
Gas III
.6
Gas III
.10
Gas III
.11
Gas III
.12
Gas III
.14
Gas III
.15
Gas III
.18
Gas III
.19
Gas III
.20
Gas-x
0
60
120
Des
inte
grat
ion
[s]
Figure 58: Disintegration time for Gas III. formulations

IV. RESULTS
83
Films that start they disintegration process earlier have sorbitol in composition. Sorbitol is
pointed as a surfactant in Gas-X composition. As in List formulations, also films with tween
80 (excipient with the same function) lead to films with lower disintegration time. The same
effect was represented by Poluri (2013)
Design of Experiments software also point out maltodextrin as responsible for disintegration
process. Films with higher percentage of this excipient (as Gas III.6), present higher
disintegration times. In previous Gas I. formulations, this excipient was also indicated as
increasing disintegration time. In Karl-Fischer titration, weight loss until 100ºC and in
disintegration process of Gas I formulation, maltodextrin showed its influence in having
greater capacity for water retention.

IV. RESULTS
84
2.4.1 Gas-x summary
Gas III results are summarized in the Table 37.
Table 37: Summary of Gas III characterization.
TGA
Excipient Property Influence
Sucralose Tonset Decrease
Simethicone Weight loss (100ºC) Decrease
PEG 400 Weight loss (100ºC) Decrease
Mechanical Properties
PEG 400 Elongation Increase
HPMC E50 Elongation Increase
Simethicone Young’s modulus Decrease
Tensile stress at break Decrease
Disintegration Sorbitol Disint. Time Decrease
Maltodextrin Disint. Time Increase

V. CONCLUSIONS
85
V. CONCLUSIONS
The overall analyses of Gas-X and Listerine films showed the impact of complexity of
formulations in films properties. Despite being commercially available, it is evident the wide
variation in both films properties which allows us to understand that is possible to obtain
acceptable films in a broad range of values.
The attempt to reproduce commercial films revealed the influence of some excipients in
films properties. In both films, sucralose showed an influence in thermal properties, namely
in the decrease of Tonset of the degradation. The main polymers in both films (pullulan and
HPMC) also showed an influence in this parameter. Films with plasticizer in composition
revealed a decrease in weight loss (until 100°C), which allows us to consider that plasticizers,
beside the mechanical properties, also affect the water retention.
Sorbitol and tween 80 act as surfactants in both films. With the addition of this excipient,
the disintegration time decreases: films start to disintegrate first with increasing of
concentration. Thickness agents, showed different results in this property: in Gas-X films,
maltodextrin increases disintegration time, whereas in Listerine, carrageenan leads to films,
which start to disintegrate earlier.
In Listerine films, plasticizer and menthol have an important influence in mechanical
properties. Once intermolecular bonds and mobility of the polymer chains are increased, the
stiffness and the tensile stress at break are reduced. Regarding Gas-X films, its mechanical
behaviour can be justified by the amount of drug substance in formulation (at least 60%
(w/w)). The high percentage of simethicone contributes to obtaining weak and soft films.
This study allowed us to establish the influence of main excipients in oral films properties.
Furthermore, as a relatively new pharmaceutical form, there is a lack of information
concerning this theme. Due to this, it was extremely important to deeply investigate the
characteristics of these two commercially available oral films. With a complete
characterization of the developed films, we establish methodologies for the characterization
of such materials, which will constitute to the development of new formulations and oral
technologies.

FUTURE WORK
86
FUTURE WORK
This project has created a basis for new studies aiming the development of new oral films.
Although some methodologies for characterization of such materials were established, some
other techniques could be carried out, such as: Nuclear Magnetic Resonance (NMR), Size
Exclusion Chromatography (SEC), Gas Chromatography (GC) and stability studies.
The formulations developed to Listerine and Gas-X should be optimized.
Further studies regarding the understanding of the molecular interactions between
excipients should be carried out in the future.

REFERENCES
87
REFERENCES
ABIAD, Mohamad G. et. al. - A novel method to mesure the glass and melting transitions of pharmaceutical powders. International Journal of Pharmaceutics, 2010: 23-29.
ALHUSBAN, F., PERRIE, Y., MOHAMMED, A.R. - Formulation of multiparticulate systems as lyophilised orally disintegrating tablets. European Journal of Pharmaceutics and Biopharmaceutics 79, 2011: 627-634.
ALLEN, Jimmy D. - Integrated drug dosage form and metering system. Patent 4,712,460. Dec 15, 1987.
ARYA, A. et. al. - Fast Dissolving Oral films: and innovative drug delivery system and dosage form. International Journal of ChemTech Research 2, no. 1 (Jan-Mar 2010): 576-583.
BLAGA, A. – Properties and behaviour of plastics in: National Research Council Canada, 1973 [Accessed 28 June 2013]: http://archive.nrc-cnrc.gc.ca/eng/ibp/irc/cbd/building-digest-157.html
BOND, L. et al. - Differential scanning calorimetry and scanning thermal microscopy analysis of pharmaceutical materials. International Journal of Pharmaceutics 243, 2002: 71-82.
BROWN, D. - Orally disintegrating tablets - taste over speed. Drug Delivery Technology 3, no. 6 (2003): 58-61.
CHANTRAINE, F. et al. - Parametric Study of Surfactant Effect on Mechanical and Dissolution Properties of Detergent Tablets. Journal of surfactants and detergents, 9, 2006.
CHEN, M. et al. - Castable edible pharmaceutical films. Drug Del Tech , 8 (6), 2008: 35-41.
CHOUDHARY, D.R. et al – Natural polysaccharides as film fomer: a feasibility study for development of rapid sissolving films of ondasentron hydrochloride. International Journal of Pharmacy and Pharmaceutical Sciences 4, 2012: 78-85.
CRAIG, Duncan Q.M.; JOHNSON, Fiona A. "- Pharmaceutical applications of dynamic mechanical thermal analysis. Thermochimica Acta, 1995: 97-115.
DIXIT, R. P.; PUTHLI, S. P. - Oral strip technology: Overview and future potential. Journal of Controlled Release 139 (2009): 94-107.
GABBOTT, Paul - Principles and Applications of Thermal Analysis. Oxford: Blackwell Publishing Ltd, 2008. ISBN-13: 978-1-4051-3171-1.
GARSUCH, Verena; BREITKREUTZ, Jörg - Novel analytical methods for the characterization of oral wafers. European Journal of Pharmaceutics and Biopharmaceutics 73 (2009): 195-201.
GARSUCH, Verena Ingeborg - Preparation and Characterization of fast-dissolving oral films for pediatric use. Düsseldorf: Heinrich Heine University, 2009. PhD thesis
GREB, Erik - Are Orally Dissolving Strips Easy for Manufacturers to Swallow? PharmTech. January 21, 2009. [Accessed April 18, 2013]. http://www.pharmtech.com/pharmtech/article/articleDetail.jsp?id=576124
HOFFMANN, Eva Maria; BREITENBACH, Armin; BREITKREUTZ, Jörg - Advances in orodispersible films for drug delivery. Expert Opinion Drug Delivery 8, no. 3 (2011): 299-316.
HSU, C.P. Sherman - Infrared Spectroscopy. In SETTLE, Frank A., Handbook of Instrumental Techniques for Analytical Chemistry, Arlington, Virginia: Prentice Hall PTR (ECS Professional), 1997. 247-283

VI. REFERENCES
88
HU, Changqin; LIU, Ying - Quality Control in Pharmaceuticals: Residual Solvents Testing and Analysis. In AKYAR, Isin, Wide Spectra of Quality Control. Beijing: Intech, 2011. ISBN 978-953-307-683-6,183-210.
IBISWorld - Thin Film Drug Manufacturing in the US: Market Research Report. 2012. [accessed April 3, 2013]. http://www.ibisworld.com/industry/thin-film-drug-manufacturing.html
JONES, David S. - Dynamic mechanical analysis of polymeric systems of pharmaceutical and biomedical significance. International journal of pharmaceutics, 1999: 167-178.
JONES, David S. et. al. - Pharmaceutical applications of dynamic mecanical thermal analysis. Advanced drug delivery reviews, 2012: 440-448.
KENDALL, Douglas S. Infrared Spectroscopy of Coatings. In Coatings Technology Handbook. Taylor & Francis Group, 2006.
KONG, Jilie; YU, Shanoning - Fourier Transform Infrared Spectroscopic Analysis of Protein Secondary Structures. Acta Biochimica et Biophysica Sinica, no. 39(8) (2007): 549-559.
KUMAR, Subash Vijaya - Overview on fact dissolving films. International Journal of Pharmacy and Pharmaceutical Sciences 2, no. 3 (2010).
KWOK, D.Y.; NEUMANN, A.W. - Contact angle measurement and contact angle interpretation. Advances in Colloid and Interface Science 81 (1999): 167-249.
LEUNG et al. Fast dissolving orally consumable films (2005), Patent No. US 6,923,981 B2.
LIN, Shan-Yang; WANG, Shung-Li - Advances in simultaneous DSC-FTIR microspectroscopy for rapid solid-state chemical stability studies: some dipeptide drugs as examples. Advanced Drug Delivery Reviews 64 (2012): 461-478.
MAHAJAN, Apoorva; CHHABRA, Neha; AGGWARWAL, Geeta - Formulation and Characterization of Fast Dissolving Buccal Films: a Review. Shcolars Research Library 3, no. 1 (2011): 152-165.
MALI, G.M., YAMASHITA, F. – Starch films: production, properties and potential of utilization (Review), Semina: Ciências Agrárias, (2010): 137-156.
MALKE, S.; SHIDHAYE, S.; DESAI, J. - Oral films - patient compliant dosage form for pediatrics. The Internet Journal of Pediatrics and Neonatology 11, no. 2 (2011).
MENARD, Kevin P. - Dynamic Mechanical Analysis: A practical introduction. Florida: CRC Press, 1999.
MISHRA, Renuka; AMIN, Avani - Formulation and Characterzation of Rapidly Dissolving Films of Cetirizine hydrochloride using Pullulan as a Film Forming Agent. Indian Journal of Pharmaceutical Education and Research 45, no. 1 (2011): 71-77.
MORALES, Javier O.; MCCONVILLE, Jason T. - Manufacture and Characterization of mucoadhesive buccal films. European Journal of Pharmaceutics and Biopharmaceutics 77 (2011): 187-199.
MUJORIYA, Rahesh - A Review on study of Buccal Drug Delivery System. Innovative Systems Design and Engineering 2, no. 3 (2011): 29-33.
NAGAR, Priyanka; CHAUHAN, Iti; YASIR, Mohd - Inghights into polymers: Film formers in mouth dissolving films. Drug Invention Today 3, no. 12 (2011): 280-289.
POLURI, K. – Formulation development and evaluation of novel oral soluble films of ziprasidone hydrochloride in the treatment of schizophrenia. International Journal of Pharmacy and Pharmaceutical Sciences , 5 (2), (2013): 619-627.
PRAJAPATI, Bhupendra G.; RATNAKAR, Nayan - A Review on Recent patents on Fast Dissolving Drug Delivery System. International Journal of PharmTech Research 1, no. 3 (July-Sept 2009): 790-798.

VI. REFERENCES
89
REKHI, G.S. - Novel technologies improve oral drug delivery performance, in: Formulation| The Leader of the Pack. June 2009. [accessed April 3, 2013]. http://www.pharmaquality.com/me2/Audiences/dirmod.asp?nm=Browse+Articles&type=Publishing&mod=Publications%3A%3AArticle&mid=D3E3C719D8D44216836DCA4F4144BEC4&tier=4&id=41C41043EA4C451DBC28743E31E04755&AudID=5648A5C28C97462DBBDB309539B820EF.
ROGER, B.S. - Physical and mechanical properties of alginate films containing calcium cations and ferrofluids. Fifth International Conderence Polymer-Solvent Complexes & Intercalates. Lorient, France, 2004.
RAVNEET, Kaur; BALA, Rajni; MALIK, Dhruv- A novel approach in oral fast dissolving drug delivery system - a review. American journal of pharmatech research, December 2012.
SAINI, P., KUMAR, A., & VISHT, S. - Fast Disintegrating Oral Films: A Recent Trend of Drug Delivery. International Journal of Drug Development & Research , 4 (4), 2012: 80-94.
SCHOBEL et al. - Solid dosage form containing a taste masked active agent (2007) Patent No. US 2007/0292515.
SHARMA R., et al. – Development of taste masked film of vasdecoxib for oral use. Indian J. Pharm Sci 2007; 69: 320-3
SIDDIQUI, M.D. Nehal; GARG, Garima; SHARMA, Pramod Kuma - A short review on "a novel approach in oral fast dissolving drug delivery system and their patents". Advances in Biological Research 5, no. 6 (2011): 291-303.
STEVENS, Malcom P. - Polymer Chemistry: An introduction. 3rd edition. NewYork: Oxford University Press, 1999.
STUART, Barbara H. - Infrared Spectroscopy: fundamentals and applications. Chichester: John Wiley & Sons Ltd, 2004. ISBN 0-470-85428-6.
STUART, Barbara - Polymer Analysis. Chichester: John Wiley & Sons, Ltd, 2002. ISBN 047 18 1363X.
APPENDIX
90
APPENDIX A

APPENDIX
91
1. CHEMICAL STRUCTURES OF EXCIPIENTS
Acessulfam K Carrageenan Hydropropyl Methylcellulose
Maltodextrin Menthol Modified Starch
Propylene Glycol
Polyethylene Glycol
Pullulan
Simethicone
Sucralose
Sorbitol
Tween 80

APPENDIX
92
APPENDIX B

APPENDIX
93
2. FTIR ANALYSES OF LIST FORMULATIONS
1000200030004000Wavenumber [cm-1]
Tran
smitt
ance
[%] List29
List26
List25
List29
List18
Listerine
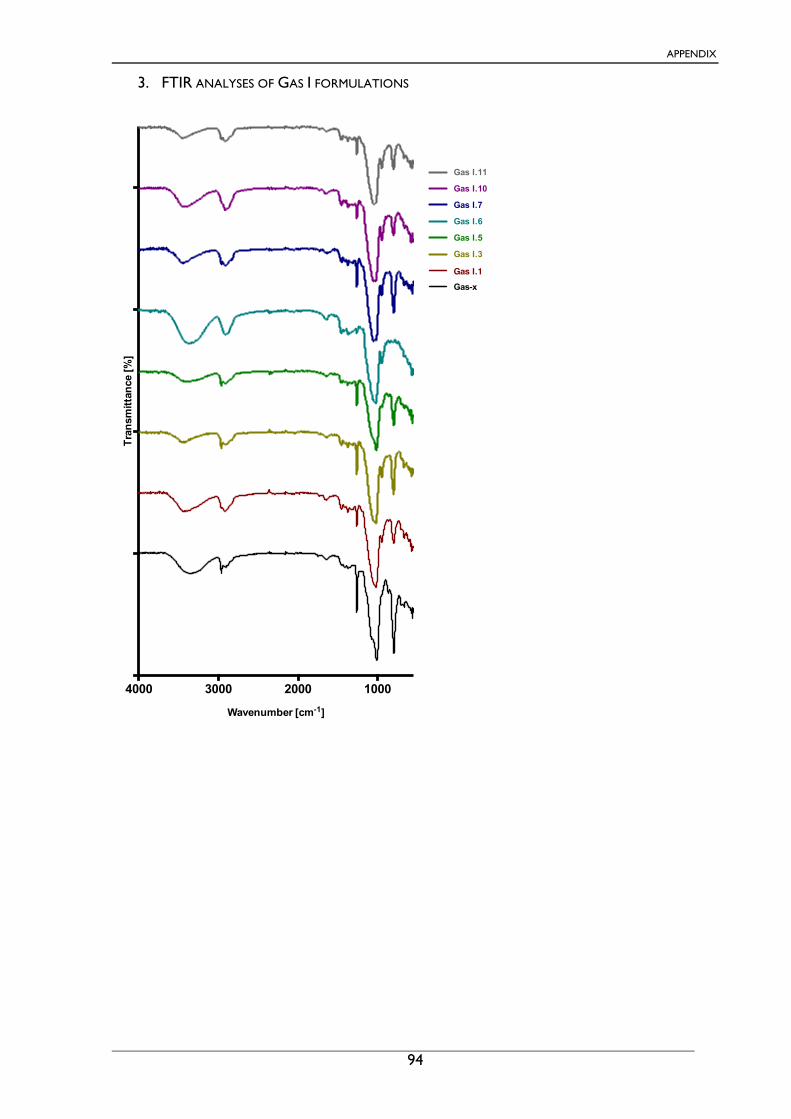
APPENDIX
94
3. FTIR ANALYSES OF GAS I FORMULATIONS
1000200030004000
Wavenumber [cm-1]
Tran
smitt
ance
[%]
Gas I.11
Gas I.10
Gas I.7
Gas I.6
Gas I.5
Gas I.3
Gas I.1
Gas-x

APPENDIX
95
4. FTIR ANALYSES OF GAS III FORMULATIONS
1000200030004000
Wavenumber [cm-1]
Tran
smitt
ance
[%] Gas-x
Gas III.20
Gas III.18
Gas III.12
Gas III.10
Gas III.5

APPENDIX
96
APPENDIX C

APPENDIX
97
1. TGA CURVES OF LIST FORMULATIONS
Temperature [ºC]
Wei
ght [
%]
0 200 400 6000
20
40
60
80
100ListerineList6
0 200 400 6000
20
40
60
80
100
Temperature [ºC]
Wei
ght [
%]
ListerineList 5
0 200 400 6000
20
40
60
80
100
Temperature [ºC]
Wei
ght [
%]
ListerineList2
Temperature [ºC]
Wei
ght [
%]
0 200 400 6000
20
40
60
80
100ListerineList14
Temperature [ºC]
Wei
ght [
%]
0 200 400 6000
20
40
60
80
100Listerine List9
Temperature [ºC]
Wei
ght [
%]
0 200 400 6000
20
40
60
80
100ListerineList8
Temperature [ºC]
Wei
ght [
%]
0 200 400 6000
20
40
60
80
100 ListerineList25
Temperature [ºC]
Wei
ght [
%]
0 200 400 6000
20
40
60
80
100ListerineList20
Temperature [ºC]
Wei
ght [
%]
0 200 400 6000
20
40
60
80
100ListerineList18
0 200 400 6000
20
40
60
80
100
Temperature (ºC)
Wei
ght [
%]
ListerineList29
Temperature [ºC]
Wei
ght [
%]
0 200 400 6000
20
40
60
80
100ListerineList27
Temperature [ºC]
Wei
ght [
%]
0 200 400 6000
20
40
60
80
100ListerineList26
40 60 80 100
92
94
96
98
100
Temperature [ºC]
Wei
ght [
%]
List29
List27
List26
List25
List20
List18
Listerine
40 60 80 100
90
95
100
Temperature (ºC)
Wei
ght (
%)
List15
List14
List9
List6
List8
List5
List2
Listerine

APPENDIX
98
2. TGA CURVES OF GAS I FORMULATIONS
Temperature [ºC]
Wei
ght [
%]
0 200 400 6000
20
40
60
80
100Gas-xGas I.5
Temperature [ºC]
Wei
ght [
%]
0 200 400 6000
20
40
60
80
100Gas-xGas I.3
Temperature [ºC]
Wei
ght [
%]
0 200 400 6000
20
40
60
80
100Gas-xGas I.1
Temperature [ºC]
Wei
ght [
%]
0 200 400 6000
20
40
60
80
100Gas-xGas I.10
Temperature [ºC]
Wei
ght [
%]
0 200 400 6000
20
40
60
80
100Gas-xGas I.7
Temperature [ºC]
Wei
ght [
%]
0 200 400 6000
20
40
60
80
100Gas-xGas I.6
Temperature [ºC]
Wei
ght [
%]
0 200 400 6000
20
40
60
80
100Gas-xGas I.11
40 60 80 100
94
96
98
100
Temperature [ºC]
Wei
ght [
%]
Gas-x
Gas I.1
Gas I.3
Gas I.5
Gas I.6
Gas I.7
Gas I.10
Gas I.11

APPENDIX
99
3. TGA CURVES OF GAS III FORMULATIONS
Temperature [ºC]
Wei
ght [
%]
0 200 400 6000
20
40
60
80
100Gas-xGas III.20
Temperature [ºC]
Wei
ght [
%]
0 200 400 6000
20
40
60
80
100
Gas III.19Gas-x
Temperature [ºC]
Wei
ght [
%]
0 200 400 6000
20
40
60
80
100Gas III.6Gas-x
Temperature [ºC]
Wei
ght [
%]
0 200 400 6000
20
40
60
80
100
Gas III.5Gas-x
Temperature [ºC]
Wei
ght [
%]
0 200 400 6000
20
40
60
80
100
Gas III.4Gas-x
Temperature [ºC]
Wei
ght [
%]
0 200 400 6000
20
40
60
80
100
Gas III.11Gas-x
Temperature [ºC]
Wei
ght [
%]
0 200 400 6000
20
40
60
80
100
Gas III.10Gas-x
Temperature [ºC]
Wei
ght [
%]
0 200 400 6000
20
40
60
80
100
Gas III.7Gas-x
0 200 400 6000
20
40
60
80
100
Temperature [ºC]
Wei
ght [
%]
Gas-xGas III.15
0 200 400 6000
20
40
60
80
100
Temperature [ºC]
Wei
ght [
%]
Gas-xGas III.14
Temperature [ºC]
Wei
ght [
%]
0 200 400 6000
20
40
60
80
100
Gas III.12Gas-x
Temperature [ºC]
Wei
ght [
%]
0 200 400 6000
20
40
60
80
100
Gas III.18Gas-X
40 60 80 10095
96
97
98
99
100
Temperature [ºC]
Wei
ght [
%]
Gas III.4Gas III.5Gas III.7Gas III.6Gas III.10Gas III.11Gas III.12
Gas-x
Gas III.14Gas III.15Gas III.18Gas III.19Gas III.20

APPENDIX
100
4. TGA CURVES OF EXCIPIENTS
Temperature (ºC)
Wei
ght [
%]
0 200 400 6000
20
40
60
80
100HPMC
Temperature [ºC]
Wei
ght [
%]
0 200 400 6000
20
40
60
80
100Maltodextrin
50 100 1500
20
40
60
80
100
Temperature [ºC]
Wei
ght [
%]
Menthol
50 100 1500
20
40
60
80
100
Temperature [ºC]
Wei
ght [
%]
Propylene Glycol
Temperature [ºC]
Wei
ght [
%]
0 200 400 6000
20
40
60
80
100Pullulan
Temperature [ºC]
Wei
ght [
%]
0 200 400 6000
20
40
60
80
100
Simethicone
Temperature [ºC]
Wei
ght [
%]
0 200 400 6000
20
40
60
80
100Tween 80
APPENDIX
101
APPENDIX D
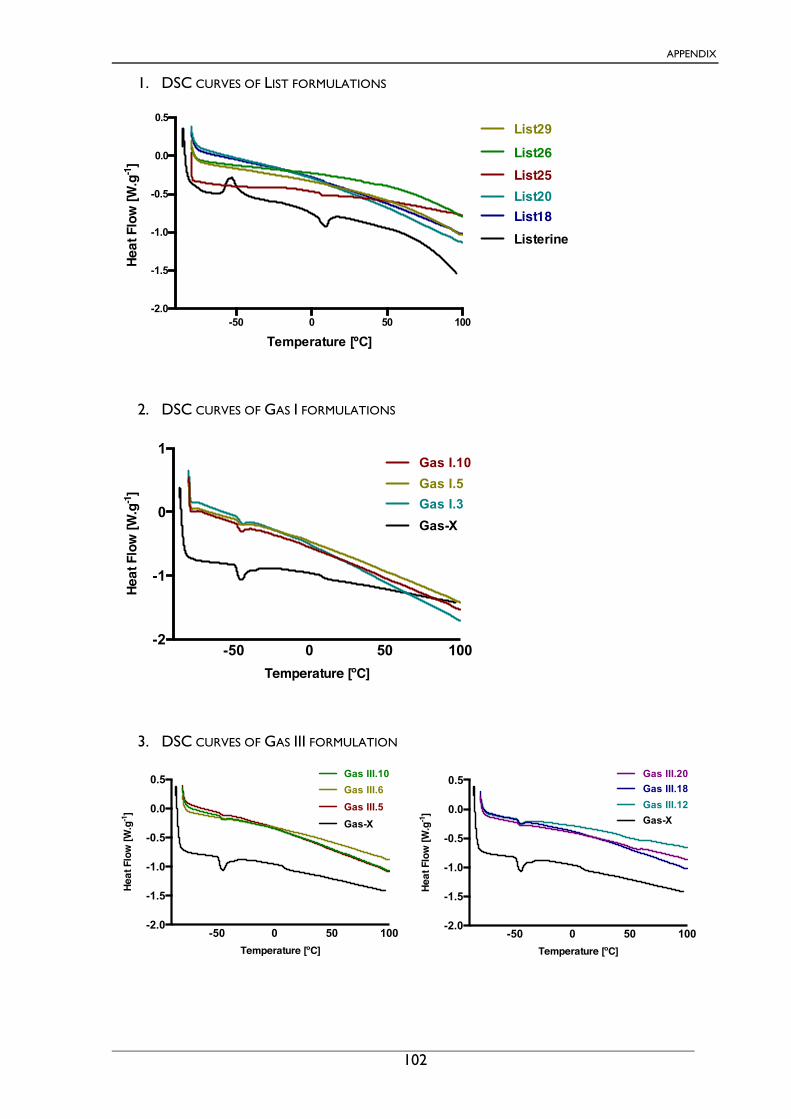
APPENDIX
102
1. DSC CURVES OF LIST FORMULATIONS
2. DSC CURVES OF GAS I FORMULATIONS
3. DSC CURVES OF GAS III FORMULATION
-50 0 50 100-2.0
-1.5
-1.0
-0.5
0.0
0.5
Temperature [ºC]
Heat
Flo
w [W
.g-1
]List29
List26List25List20
ListerineList18
-50 0 50 100-2
-1
0
1
Temperature [ºC]
Heat
Flo
w [W
.g-1
]
Gas I.10Gas I.5Gas I.3Gas-X
-50 0 50 100-2.0
-1.5
-1.0
-0.5
0.0
0.5
Temperature [ºC]
Heat
Flo
w [W
.g-1
]
Gas III.10Gas III.6Gas III.5Gas-X
-50 0 50 100-2.0
-1.5
-1.0
-0.5
0.0
0.5
Temperature [ºC]
Heat
Flo
w [W
.g-1
]
Gas-X
Gas III.20Gas III.18Gas III.12

APPENDIX
103
APPENDIX E

APPENDIX
104
1. STRESS-STRAIN CURVES OF LIST FORMULATIONS
LIST2
LIST5
LIST6
LIST8
LIST14
LIST18
LIST20
LIST25

APPENDIX
105
LIST26
LIST29
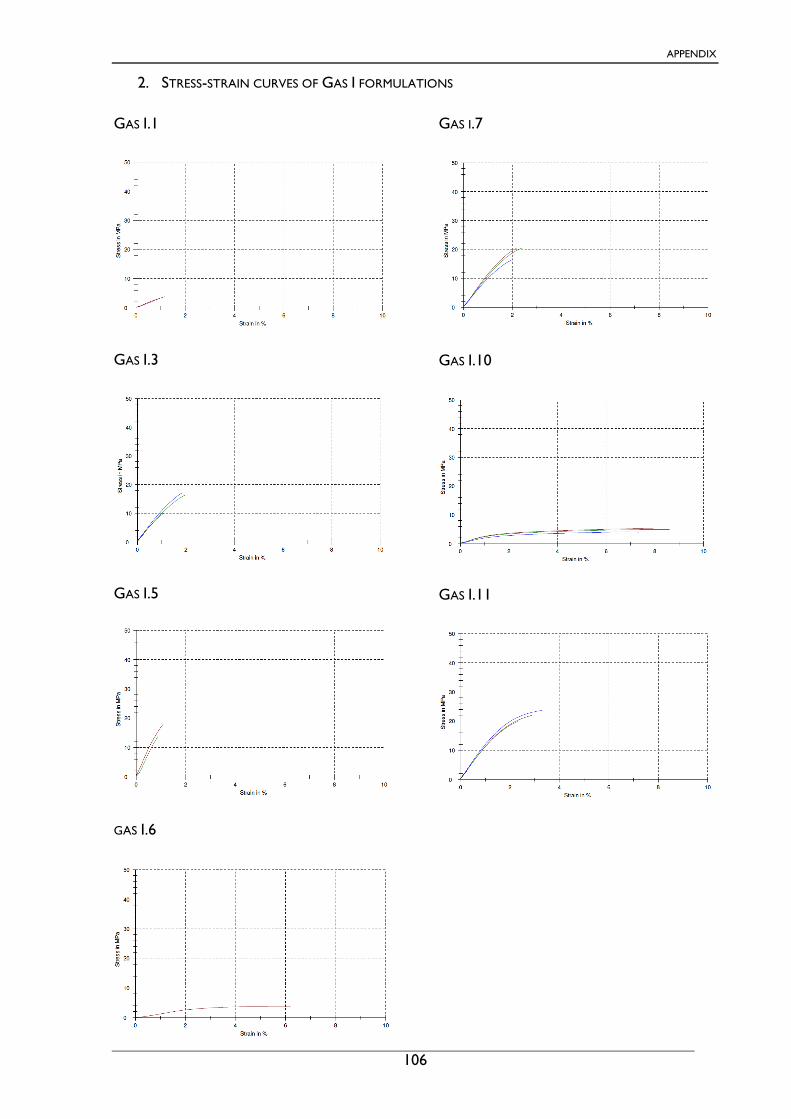
APPENDIX
106
2. STRESS-STRAIN CURVES OF GAS I FORMULATIONS
GAS I.1
GAS I.3
GAS I.5
GAS I.6
GAS I.7
GAS I.10
GAS I.11

APPENDIX
107
3. STRESS-STRAIN CURVES OF GAS III FORMULATIONS
Gas III.4
Gas III.5
Gas III.6
Gas III.10
Gas III.11
Gas III.12

APPENDIX
108
Gas III.14
Gas III.15
Gas III.18
Gas III.19
Gas III.20