File Handler - nrm.dfg.ca.gov
74
Designing Monitoring Programs in an Adaptive Management Context for Regional Multiple Species Conservation Plans U.S. DEPARTMENT OF THE INTERIOR CALFORNIA DEPARTMENT U. S. FISH AND U.S. GEOLOGICAL SURVEY OF FISH AND GAME WILDLIFE SERVICE WESTERN ECOLOGICAL RESEARCH CENTER
Transcript of File Handler - nrm.dfg.ca.gov

Designing Monitoring Programs in an Adaptive Management Context for Regional Multiple Species Conservation Plans
U.S. DEPARTMENT OF THE INTERIOR CALFORNIA DEPARTMENT U. S. FISH AND U.S. GEOLOGICAL SURVEY OF FISH AND GAME WILDLIFE SERVICE WESTERN ECOLOGICAL RESEARCH CENTER

ii
Designing Monitoring Programs in an Adaptive Management Context for Regional Multiple Species Conservation Plans By Andrea J. Atkinson1, Peter C. Trenham1, Robert N. Fisher1, Stacie A. Hathaway1, Brenda S. Johnson2, Steven G. Torres3, and Yvonne C. Moore4
U.S. GEOLOGICAL SURVEY WESTERN ECOLOGICAL RESEARCH CENTER In partnership with CALIFORNIA DEPARTMENT OF FISH AND GAME and U. S. FISH AND WILDLIFE SERVICE HABITAT CONSERVATION DIVISION CARLSBAD, CA 1San Diego Field Station U. S. Geological Survey, Western Ecological Research Center 5745 Kearny Villa Road, Suite M San Diego, CA 92123 2California Department of Fish and Game Habitat Conservation Planning Branch 1416 Ninth Street, 12th Floor Sacramento, CA 95814 3California Department of Fish and Game Resource Assessment Program 1416 Ninth Street, RM 1342-C Sacramento, CA 95814 4California Department of Fish and Game Resource Assessment Program 4500 Glenwood Drive, Bldg. C Riverside, CA 92501
Sacramento, California 2004

iii
U.S. DEPARTMENT OF THE INTERIOR GALE A. NORTON, SECRETARY U.S. GEOLOGICAL SURVEY Charles G. Groat, Director Front Cover Photographs (clockwise from upper left): Otay Tarplant, Hemizonia conjugens (© 2001 Coralie Cobb) Mountain lion, Felis concolor (courtesy of Adam Backlin, U.S. Geological Survey; used with permission from The
Nature Conservancy; photograph has been retouched to remove a branch in foreground) Pallid Bat, Antrozous pallidus (courtesy of Drew Stokes, U.S. Geological Survey) Coachella Valley sand dunes (© Gary Nafis) Coast horned lizard, Phrynosoma coronatum, (courtesy of Chris Brown, U.S. Geological Survey) Least Bell’s vireo, Vireo bellii pusillus (courtesy of Paul Zedler, University of Wisconsin) The use of firm, trade, or brand names in this report is for identification purposes only and does not constitute endorsement by the U.S. Geological Survey.
For additional information, contact: Center Director Western Ecological Research Center 3020 State University Dr., East Modoc Hall, Room 3006 Sacramento, CA 95819

iv
TABLE OF CONTENTS SUMMARY ………………………………………………………………………………… 1 1.0 INTRODUCTION ……………………………………………………………………… 2 2.0 MONITORING IN AN ADAPTIVE MANAGEMENT CONTEXT………………… 3 3.0 CHALLENGES IN CREATING REGIONAL CONSERVATION PLAN MONITORING PROGRAMS ………………………………………………………… 7 3.1 Addressing both covered species and ecosystem integrity …………………. 7 3.2 Coordinating and integrating monitoring from local to ecoregional scales … 7 3.3 Acknowledging a high degree of uncertainty …………………………………. 8 3.4 Phasing-in monitoring program development ……………………………..… 8 3.5 Accommodating staged development of a reserve system network …………. 9 4.0 STEPWISE APPROACH TO CREATING A MONITORING PROGRAM …….. 10
4.1 Step 1. Identify the goals and objectives of the regional conservation plan … 11 4.2 Step 2. Identify the scope of monitoring program …………………………… 11 4.3 Step 3. Compile information relevant to monitoring program design ………. 12 4.4 Step 4. Strategically divide the system and set priorities …………………….. 13 4.5 Step 5. Develop simple management-oriented conceptual models …………… 18 4.6 Step 6. Determine what to monitor and identify critical uncertainties ……. 28 4.7 Step 7. Determine strategy for implementing monitoring ……………………. 34 4.8 Step 8. Develop data quality assurance, data management, analysis, and
reporting strategies ……………………………………………………………… 39 4.9 Step 9. Complete the adaptive management loop by ensuring effective feedback to decision-making …………………………………………………… 40
5.0 ADDITIONAL CONSIDERATIONS FOR DESIGNING THE MONITORING
PROGRAM ………………………………………………………………………………..41 6.0 CONCLUSIONS ………………………………………………………………………… 42 7.0 ACKNOWLEDGEMENTS …………………………………………………………… 42 8.0 ACRONYMS …………………………………………………………………………. 43 9.0 GLOSSARY …………………………………………………………………………….. 44 APPENDIX A. Suggested components of natural community assemblage conceptual
models ……………………………………………………………………………….. 49 APPENDIX B. Suggested components of landscape-level conceptual models ……….…. 50 APPENDIX C. A strategy for linking monitoring of NCCP/HCP covered species with
ecosystem monitoring ………………………………………………………………… 51 APPENDIX D. Habitat monitoring as a surrogate for species monitoring …………….. 53
v
APPENDIX E. Characteristics of good monitoring variables …………………………… 54 APPENDIX F. Species-level monitoring variables ……………………………………….. 55 APPENDIX G. Natural community assemblage monitoring variables ………………… 56 APPENDIX H. Landscape-level monitoring variables ……………………………..…… 58 APPENDIX I. Sampling design approaches that are receiving increased attention …….. 59 APPENDIX J. Quality assurance plan ……………………………………………………. 60 REFERENCES ……………………………………………..………………………………. 61
LIST OF FIGURES
Figure 1. NCCP/HCP adaptive management feedback loop ……………………………… 6 Figure 2. Monitor at the appropriate geographic scale …………………………………. 8 Figure 3. Key components of management-oriented conceptual models ………………... 21 Figure 4. Hypothetical hierarchy of nested conceptual models …………………………. 23 Figure 5. Species-focused conceptual model for southwestern arroyo toad (Bufo
californicus) …………………………………………….……………………………. 24 Figure 6. Aeolian sand natural community assemblage conceptual model of pressures
on covered species ………………………………………………………..…………. 25 Figure 7. Aeolian community sand process model ………………………………….……. 26 Figure 8. Tasks to occur in planning phase and early implementation of an NCCP/HCP 35
LIST OF BOXES
Box 1. Comparison of two covered species requiring different levels of initial focus in an
NCCP/HCP monitoring program …………………………………………………. 15 Box 2. Dividing system into natural community assemblages …………………………. 17 Box 3. Typical landscape-level issues that involve multiple natural community
assemblages or otherwise require special attention ………………………………. 18 Box 4. Suggested components of covered species conceptual models …………………… 22 Box 5. Conservation strategy and management activities portion of the aeolian sands
natural community assemblage conceptual model ………………….…………….. 27 Box 6. Description of monitoring variables ………………………………………………. 31
This report should be cited as: Atkinson, A. J., P. C. Trenham, R. N. Fisher, S. A. Hathaway, B. S. Johnson, S. G. Torres, and Y. C. Moore. 2004. Designing monitoring programs in an adaptive management context for regional multiple species conservation plans. U.S. Geological Survey Technical Report. USGS Western Ecological Research Center, Sacramento, CA. 69 pages.
1
SUMMARY Increasing numbers of regional, multiple species conservation plans have been developed in California since the early 1990s. However, building effective monitoring and adaptive management programs to support these plans has remained a challenge. In addition to collecting data on the status of resources and the results of management actions, monitoring programs for these plans need to resolve critical uncertainties and channel information into effective decision-making. Because of the broad goals of many regional conservation plans, monitoring programs need to address ecosystem integrity and biodiversity while also tracking species “covered” by plan permits. In this document we provide a step-by-step procedure for developing effective monitoring programs in an adaptive management context. The guidance provided here has been gleaned from experience with large multiple species plans in southern California. The process begins with clearly defining program objectives, partitioning the program into manageable but meaningful pieces, and developing management-oriented conceptual models of system function. Then, based on the objectives and conceptual models, monitoring recommendations and critical uncertainties can be identified and a coordinated program designed. We include practical examples and insights from programs in southern California and discuss the evolution of monitoring and adaptive management programs through three successive stages: 1) inventorying resources and identifying relationships; 2) pilot testing of long-term monitoring and resolving critical management uncertainties; and 3) implementing long-term monitoring and adaptive management. Ultimately, the success of regional conservation planning depends on the ability of monitoring programs to confront the challenges of adaptively managing and monitoring complex ecosystems and diverse arrays of sensitive species.
2
1.0 INTRODUCTION Landscape-scale conservation planning is increasingly being used as a tool for resolving conflicts between urbanization and threatened and endangered species, particularly in biologically rich regions that are experiencing unprecedented human population growth. To address these challenges, wildlife agencies in California have been focusing on creating regional multiple species conservation plans that meet the requirements of both federal Habitat Conservation Plans (HCPs) (Endangered Species Act Section 10(a)(1)(B)) and state Natural Community Conservation Plans (NCCPs) (California Fish and Game Code Section 2800 et. seq.). These plans establish landscape-scale reserve networks and long-term programs designed to conserve and manage the species legally “covered” by the plan, allowing development to proceed in less ecologically sensitive areas. Unlike typical HCPs, these joint NCCP/HCPs go beyond the protection of federal and state listed species to also “cover” species that could become listed if not protected (O’Connell and Johnson, 1997; Pollak, 2001). NCCPs also include goals for maintaining native biodiversity, rare habitat types, and ecological processes. For such large plans to be successful, they need to integrate species conservation with ecosystem management. Several joint NCCP/HCPs have been approved in southern California, and more are being planned throughout the State. These plans each include large numbers of species and hundreds of square miles of land. For example, the San Diego Multiple Species Conservation Program (MSCP), one of 11 sub-regional plans intended to conserve the remaining coastal sage scrub ecosystem in southern California, encompasses 582,000 acres and seeks to establish a system of reserve lands that will protect viable populations of 85 different plant and animal species and dozens of habitat types. Some of the species covered under this plan are specialists in specific habitats, including marsh (light-footed clapper rail, Rallus longirostris levipes), riparian (southwestern arroyo toad, Bufo californicus) and coastal sage scrub (California gnatcatcher, Polioptila californica californica), while others range widely over large, contiguous landmasses (mountain lion, Felis concolor). The large number of covered species and habitats conserved by efforts such as the San Diego MSCP presents unique challenges to management, requiring an even more thoughtful and adaptive approach than typical single species HCPs. Like other ecosystem management programs, regional NCCP/HCPs are developed despite many uncertainties about the behavior of the extremely complex and ever-changing ecological systems that the plans are intended to conserve and manage (Christensen et al., 1996; Noss et al., 1997). In particular, it is uncertain how ecosystems will respond to perturbations, such as fire, floods, and even management actions, some of which are spatially extensive and more intense or frequent than the natural range of disturbance. In addition, uncertainties exist due to lack of ecological information, including knowledge about rare species life histories, upon which dependable models of ecological functioning can be built. Sampling bias, analytical errors, and questionable quality of data can all contribute to uncertainty about the conservation strategy and management decisions. In the face of limited knowledge and ability to make predictions, NCCP/HCPs should be designed to improve our understanding of the ecological systems the plans are designed to protect, by adjusting management and even the conservation strategy as necessary in an “adaptive management” framework. To be effective NCCP/HCPs should develop robust

3
monitoring programs to track progress toward their conservation and management objectives, and maximize their ability to meet those objectives in a scientifically defensible and cost-effective way while minimizing the risks to the ecosystem. The intent of this document is to provide background and recommendations for designing monitoring programs in an adaptive management context, based upon lessons learned from southern California NCCP/HCPs and other ecosystem monitoring programs around the world. This document should not be interpreted as an official agency directive, but rather as advice that can help new monitoring programs take advantage of and improve upon previous efforts. Section 2.0 in this document describes the role of monitoring in an adaptive management context. Section 3.0 presents five unique challenges of which designers of NCCP/HCP monitoring programs should be aware. In Section 4.0, we recommend nine steps that can be used sequentially to create an NCCP/HCP monitoring program. Section 5.0 summarizes the characteristics of good monitoring programs and gives some suggestions on how to achieve them, and Section 6.0 gives larger context to NCCP/HCP monitoring. Explanations, examples, and references can be found in the supplementary boxes, glossary, and appendices. 2.0 MONITORING IN AN ADAPTIVE MANAGEMENT
CONTEXT Strictly defined, “monitoring” is the systematic and usually repetitive collection of information, typically used to track the status of a variable or system. NCCP/HCPs use monitoring to track and evaluate many different variables, ranging from the number of acres purchased, to the number of species present in an area. NCCP/HCP monitoring programs include three main components: implementation (compliance) monitoring, effectiveness monitoring, and targeted studies. Definitions and some examples are provided below:
• Implementation (compliance) monitoring tracks the status of plan implementation, ensuring that planned actions are executed. Typical compliance monitoring documents: - Reserve land acquisition (e.g., tracking number of acres preserved versus lost, by
habitat types) - Management activities reporting (e.g., proportion of reserves fenced, status of
invasive species removal activities) - Monitoring activities reporting (e.g., what monitoring activities were implemented
and resulting reports received)
• Effectiveness monitoring evaluates the success of the plan in meeting its stated biological objectives (Noss and Cooperrider, 1994). Typical effectiveness monitoring measures: - Status and trends of resources (e.g., quantitative data on covered species,
biodiversity, vegetative structure) - Status and trends of known pressures (e.g., invasive species, contaminants,
disturbance) - Effects of management actions on resources and known pressures (e.g., density of
invasive plants measured before and then 1 to 5 years after herbicide treatment)

4
• Targeted studies is a special subset of effectiveness monitoring. Targeted studies increase the effectiveness of monitoring and management by improving knowledge about the ecological system and about management techniques. Targeted studies may be implemented as short-term studies rather than as long-term monitoring and typically include: - Resolving critical uncertainties and improving knowledge of natural systems under
management (e.g., plant succession and weed dynamics in response to fire; top-down predator effects on food webs; identification of stress-sensitive and stress-tolerant species)
- Applying experimental management treatments (e.g., does gradually increasing and decreasing flow releases from dams increase arroyo toad tadpole survivorship compared with sudden flow releases and stoppages? (Madden-Smith et al., 2003)
We focus the guidance in this document on effectiveness monitoring and targeted studies designed to remove critical uncertainties. While implementation (compliance) monitoring is a critical and legally-mandated part of NCCP/HCP implementation, it is not covered here. Monitoring and targeted studies for NCCP/HCPs should be designed in an adaptive management context if they are to assist decision-making. Adaptive management is an emerging approach to natural resource management that openly acknowledges our uncertainty about how ecological systems function and how they respond to management actions. Under this model, management moves forward in a scientifically-based way that involves monitoring, conducting targeted studies, and applying management activities as experimental treatments. The results feed back into decision-making, reducing uncertainty and improving the effectiveness of the program through time (Walters 1986; Noss et al., 1997; Nyberg, 1998; Wilhere, 2002). Adaptive management implies an ongoing scientific commitment to the plan in perpetuity (Noss et al., 1997). Under adaptive management, managers use the best available information to make decisions, but should always be questioning and seeking opportunities to learn how best to accomplish the goals of the plan. In recognition of a general concurrence among scientists that management of ecosystems should be adaptive, the federal Five-Point Policy addendum (USFWS, 2000) to the Endangered Species Act recommends that large HCPs be managed adaptively and the California NCCP Act (2003) mandates that all NCCPs take an adaptive management approach. Each set of NCCP/HCP documents is required to include a description of the plan’s comprehensive adaptive management program and monitoring program. As we use the term here, adaptive management includes all of the steps that may be involved in a long-term adaptive implementation program, including opportunistic learning, hypothesis testing, management, monitoring, and directing the results of analysis and assessment back into the program through decision makers. Figure 1 provides a flowchart of relationships among components of the NCCP/HCP adaptive management feedback loop. In the NCCP/HCP planning stage, foundational scientific principles and the best available empirical information are expected to inform both the conservation goals and the strategy for implementing them. Ideally, this process includes the following steps: identify the goals of the NCCP/HCP, create a simple conceptual model of how the ecosystem functions or of a species life history (models can also help to define goals), and use the

5
conceptual model(s) to identify a conservation strategy (including reserve design), followed by an implementation approach involving management activities and monitoring. Conceptual models summarize our current understanding of ecosystem or community function, or species life history, clarifying likely responses to management actions and pressures (i.e., stressors, causes of change). An important point is that the same goals and conceptual models that inform the conservation strategy should also drive development of the management and monitoring programs. Problem-focused conceptual models that link program objectives to causes of change and to management activities are particularly helpful to adaptive management and provide a key bridge from the conservation strategy to management and monitoring. Assumptions upon which the proposed conservation strategy and management program are based can be tested through 1) monitoring and 2) targeted studies and experimental management. Monitoring, which measures ecosystem condition and responses of the ecosystem to both intentional (management actions) and natural perturbations, is a critical piece of the adaptive management feedback loop. Ideally, monitoring can identify problems early so that corrective management action can be taken as soon as it is needed. In contrast, targeted studies (at small spatial scales or in pilot studies) may be more appropriately used to resolve critical questions regarding ecosystem functioning or management applications. While some management activities may have little uncertainty regarding application or outcomes (e.g., trash removal or sign posting), other management activities have much greater uncertainty (e.g., habitat restoration). Such activities should be designed as experiments to increase our understanding of the system and the effectiveness of management (e.g., determining the most effective way to control non-indigenous species or to restore river flows below a dam). The results from monitoring and targeted studies are evaluated and used to update goals and conceptual models, revise the conservation strategy and implementation (management) program, as well as the monitoring methodology and even foundational scientific knowledge. The remainder of this document will focus on the challenges and steps of designing monitoring programs in an adaptive management context. More detailed guidance on designing the management portion of adaptive management programs, including administrative structure, will be provided in a separate document.

6
Figure 1. NCCP/HCP adaptive management feedback loop.
NCCP/HCP Goals
Implement Management Plan and Reserve Network
Analyze and
Evaluate
Scientific Principles and Best Existing Information
Conceptual
Models
Conservation Strategy, including Reserve Design
Management Plan and Monitoring Approach
Adapt Models and
Components
Monitoring and Targeted Studies of Ecosystem
Response

7
3.0 CHALLENGES IN CREATING REGIONAL CONSERVATION PLAN MONITORING PROGRAMS
Due to the multiple scales involved and the legal requirements of NCCP/HCPs, monitoring programs for regional conservation plans face special challenges, some of which are discussed below. These issues include monitoring both covered species and ecosystem integrity, coordinating and integrating monitoring at multiple scales, developing programs while acknowledging high degrees of uncertainty, developing programs in phases, and accommodating gradual increases in the sizes of reserves. 3.1 Addressing both covered species and ecosystem integrity Although designing intensive monitoring for each covered species would technically satisfy USFWS assurance requirements, this approach would not satisfy the principles of California’s Natural Community Conservation Planning Act. Conversely, a monitoring program that tracks changes in general biological communities and processes, without specific attention to covered species, might not have sufficient power to assess individual species status and trends. This could limit the effectiveness of management for covered species. Thus, a significant challenge for NCCP/HCP monitoring programs is integrating monitoring of covered species with monitoring of ecosystem integrity in an effective and cost-efficient way.
3.2 Coordinating and integrating monitoring from local to ecoregional scales The monitoring program will need to measure and evaluate change in resources and threats across different scales, ranging from individual reserves, NCCP/HCP planning areas, and the ecoregion (see Figure 2). To be effective, monitoring should be designed at a scale that is relevant to the species and to the types of management responses required. This may necessitate coordination across several reserves or across an entire ecoregion. Otherwise, it will be difficult to interpret whether a species decline in an individual NCCP/HCP is a local phenomenon or is part of a regional trend—dictating different types and scales of management response. For wide-ranging species such as mountain lions and deer, data collection and evaluation should be coordinated across large scales. Data from any single reserve will tell us little about their regional status or trends, and less about potential causes of any observed change (Beier, 1993; Ernest et al., 2003). Some covered species, such as neotropical migratory birds, may not even be appropriately addressed within the confines of the entire coastal southern California ecoregion, while others, such as the status of annual plants, small mammals, and reptiles,may be appropriately assessed within single reserves. To assess trends across the ecoregion, monitoring design should be coordinated across the ecoregion. This requires standardizing of protocols, sampling design and training of personnel, and integrative data analyses. If monitoring data are to be used to assess change at multiple scales, e.g., individual reserves and the ecoregion, then the program will need to be designed to be scaleable, providing useful information at multiple scales. Creating such coordinated and scaleable programs requires identifying and planning for such needs early.

8
Figure 2. Monitor at the appropriate geographic scale. Progress toward meeting the objectives of regional conservation plans should be monitored at the appropriate geographic scale. The status of essentially immobile species can be addressed at the scale of a single reserve. Large-scale issues and wide-ranging species can only be appropriately assessed at larger scales, requiring coordinated sampling across multiple reserves and possibly non-reserve lands. In addition, if information needs to be interpreted at multiple scales, then the sampling design will need to be appropriately scaleable to address these needs. 3.3 Acknowledging a high degree of uncertainty Prior to implementation of a NCCP/HCP, documents describing the management and monitoring programs must be completed. Rarely at this point will there be sufficient information to confidently design a long-term management and monitoring program that encompasses all covered species and ecological systems. As a result, the documents produced should acknowledge the underlying uncertainty and include mechanisms to reduce critical knowledge gaps while still fulfilling monitoring requirements. These documents describing the monitoring and management programs are a starting point in the mission to understand and appropriately manage the underlying ecosystems. Thus, it is essential that the personnel ultimately responsible for managing and monitoring regional conservation plans have sufficient scientific capacity and resources to adapt the programs appropriately. The NCCP/HCP efforts in southern California provide several examples of how an initial monitoring program might be created. It is our hope that future monitoring programs will utilize the lessons learned in these efforts and improve upon them as appropriate. 3.4 Phasing-in monitoring program development Due to the large amount of uncertainty in managing and monitoring the ecosystem and covered species, monitoring program development and implementation typically proceeds in three phases: 1) inventorying resources and identifying relationships; 2) pilot testing of long-term monitoring and resolving critical management uncertainties; 3) implementing long-term monitoring and adaptive management. Different components of a monitoring program may be in different phases. Very little may be known about some covered species, whereas long-term monitoring programs may have already been established for other species and biological communities. The progression
USFS NPS
Reserve
Ecoregion
NCCP/HCP NCCP/HCP NCCP/HCP
CoordinationSc
alea
ble
Sub-area Sub-area
Reserve Reserve Reserve Reserve ReserveReserveReserve Reserve

9
from Phase 1 to Phase 2 to Phase 3 is driven by data collection, hypothesis testing, and the resulting increase in understanding of the system.
• Phase 1 – Inventorying resources and identifying relationships: The main goal of phase one is to determine the baseline condition of the system as a prelude to long-term monitoring program design. This generally involves an inventory of what species, habitats, and other resources are present, their locations and general conditions. Some management can be applied during this phase, but in general, this should be limited to actions of known-impact, such as hand-removal of weeds or fence construction to prevent vehicular access or maintaining existing habitat management, such as water distribution or grazing, until such management can be appropriately evaluated. This phase can also be used to develop or test hypothesized relationships between species, habitats, processes and other causes of variation, such as roads or invasive species. For example, inventories for reptiles in coastal sage scrub across San Diego, Orange, and Riverside Counties were used to assess relationships between species and vegetation, soils, habitat fragmentation, and presence of invasive Argentine ants (Case and Fisher, 2001; Fisher et al., 2002).
• Phase 2 - Pilot testing of long-term monitoring and resolving critical management uncertainties: Phase two is characterized by pilot testing of long-term monitoring protocols and sampling designs to select cost-effective designs with sufficient statistical power to detect biologically-relevant and management-relevant changes. The pilot phase often progresses through an iterative process, including revisions to protocols and comparisons of multiple methods. For example, USGS is currently pilot testing a monitoring protocol for arroyo toads (Bufo californicus). Because prior work showed estimates of adult population size to be insufficiently precise, a new protocol is being tested which tracks changes in the amount and quality of habitat and the proportion of available habitat with tadpoles present (Brehme et al., 2004). In addition, the pilot phase is an opportunity to conduct targeted studies to resolve critical management uncertainties and refine conceptual models based on emerging information.
• Phase 3 – Implementing long-term monitoring and adaptive management: Activities include implementation of long-term monitoring protocols and periodic evaluation and refinement of the monitoring program. The program continues to address uncertainties, principally by evaluating responses to management and extreme events. Emerging uncertainties are also addressed and prioritized, such as a new invasive species or pollution source. As an example, California least terns (Sterna antillarum browni ) have been monitored for decades by counting nesting pairs and measures of reproductive success, but attempts at refinement of the protocol continue (Keane, 1999).
3.5 Accommodating staged development of a reserve network The assembly of an NCCP/HCP reserve network may proceed in stages, with land gradually dedicated to the reserve system over a decade or longer. Because sampling private lands is usually not feasible, monitoring programs should allow for staged implementation as lands are acquired. Following acquisition and initial inventory, these lands can then be incorporated into the long-term monitoring program. The program can even use such staged implementation to its advantage by using these new lands to critically evaluate hypotheses regarding species-habitat relationships and regional distributions.

10
4.0 STEPWISE APPROACH TO CREATING A MONITORING PROGRAM
Up to this point, we have addressed monitoring broadly, considering some general philosophical guidelines, potential challenges and the need for an adaptive management approach. We now lay out more specific guidelines and recommendations for constructing a functional and scientifically-defensible monitoring program. There is no one best approach for managing and monitoring any system, however, following these steps will lead to the production of a monitoring program based on the best available science. Although we tailor this guidance to monitoring programs that fulfill specific requirements of NCCP/HCP regional conservation plans, the approach should be applicable to monitoring design for other programs. The approach we take integrates monitoring species “covered” by the plan with monitoring ecological integrity and incorporates an adaptive management approach. We have divided the design and creation of a monitoring program into a nine-step process.
Step 1. Identify the goals and objectives of the regional conservation plan Step 2. Identify scope of monitoring program Step 3. Compile information relevant to monitoring program design Step 4. Strategically divide the system and prioritize for monitoring program development Step 5. Develop simple management-oriented conceptual models Step 6. Identify monitoring recommendations and critical uncertainties Step 7. Determine strategy for implementing monitoring Step 8. Develop data quality assurance, data management, analysis, and reporting
strategies Step 9. Complete the adaptive management loop by ensuring effective feedback to
decision-making In practical application, the steps in this process may overlap. At each step it is likely that information or insights will surface that can inform and improve the products of earlier steps. In addition, Steps 1-5 could be coordinated and developed to simultaneously meet the needs of the conservation strategy, management program design and monitoring program design (e.g., Coachella Valley Multiple Species habitat Conservation Plan (CVMSHCP, 2004 draft)). However, if these three development efforts are occurring on different schedules, the monitoring program may have to complete Steps 1-5 independently. The program should clearly document its decisions and seek input and review from scientists, managers and stakeholders throughout the process. Developing high quality monitoring programs requires creativity as well as sufficient information on which to build a sound foundation. To keep the process as transparent as possible and for future reference, we recommend keeping detailed records of important decisions and the rationale behind them. Because science benefits from peer-review and an open and unbiased process, review should be sought early and regularly, and should include some scientists completely independent of the local program. For those seeking additional assistance, some excellent general references for designing monitoring in an adaptive management context have been published (National Research Council, 1990; Margoluis et al., 1998; Gibbs et al., 1999; Mulder et al., 1999; Elzinga et al., 2001; Morrison et al., 2001; Busch and Trexler, 2003; Fourqurean and Rutten, 2003; Noon, 2003).

11
4.1 Step 1. Identify the goals and objectives of the regional conservation plan To evaluate the success of any plan, clearly stated goals and objectives are essential. List the goals and objectives of the regional conservation plan. These should be defined in the plan documents; however, if explicit goals and objectives have not yet been established, this is the time to get them nailed down. For every item that the monitoring program needs to evaluate, there should be a specific stated goal and/or objective. There should be a stated goal for each covered species or habitat (USFWS, 2000). To assist monitoring program development, goals and objectives should ideally be:
• Easily understandable • Biologically meaningful • Measurable • Feasible, both financially and scientifically • Written with level of detail consistent with level of current knowledge • Compatible with goals and objectives for all covered species and habitats • Compatible with goals and objectives for neighboring conservation lands (e.g., other
NCCP/HCPs, state parks, ecological reserves, etc.) Specific goals and objectives make the design and implementation of the monitoring program easier. Vague goals and objectives consume staff time because monitoring program designers have to interpret the initial intention. Where program designers must interpret plan goals, the process followed and rationale used should be well documented. An example might be “we interpreted ‘maintain natural processes’ as ‘maintenance of natural processes such as sediment deposition, hydroperiod, and fire frequency within the natural range of variability as defined by data collected over the past 50 years.’” Another example could be “we interpreted ‘provide for conservation of the species in the plan area’ as ‘the extent and quality of habitat for this species will be maintained, species abundance will be maintained compared to abundance at initiation of the plan, or reproductive success rate will be sufficient to sustain the local population or cause it to increase.’ ” Because plan goals and objectives guide plan implementation, defining clear, measurable goals and objectives at this point is critical to assembling a monitoring program that can evaluate plan success over time. 4.2 Step 2. Identify the scope of the monitoring program The purpose of this step is to identify the scope and boundaries of what the monitoring program will be evaluating and identify any requirements, constraints, and opportunities that should be accommodated in the program’s design. Identification of the following will facilitate the program design in subsequent steps: geographic scope, land ownership and constraints, audiences/users of monitoring information, spatial scales of focus, relevant time scales, and available resources. For regional conservation plans, many of these issues are defined in the plan documents.
• Geographic scope: Monitoring generally seeks to draw inferences from sampled areas to unsampled areas. The way we do this is by randomly distributing monitoring across the area from which we seek to draw inferences. The geographic boundaries of the desired area of inference should be spatially defined, preferably via maps in a Geographic

12
Information System (GIS). Areas excluded from consideration should also be mapped and the reasons for exclusion articulated.
• Land ownership and constraints: The various jurisdictions and land management entities who own or manage the lands identified in the geographic scope, such as cities, counties, state lands, federal lands, non-profit organizations, and others, need to be identified. Any legal and programmatic constraints involved with such entities’ participation in the program should also be identified. For example, a park may be mandated to manage for recreational use or some federal lands may have existing monitoring programs that are being developed in coordination with a national program, e.g. NPS Vital Signs program..
• Audiences/users of monitoring program information: The program should identify the various audiences who need to receive and utilize monitoring and adaptive management information. Reserve managers, government agencies, stakeholders, lawmakers, scientists, and program reviewers are potential audiences. Each audience has different needs regarding the timing, frequency, level of technical detail, and preferred mode of communication.
• Spatial scales of focus: The program should identify the scale or scales of focus for data analysis and reporting. Likely scales of interest include an individual reserve, one NCCP/HCP program area, a watershed, or an entire ecoregion that spans multiple planning entities.
• Relevant time scales – biological and programmatic: Relevant time scales for reporting and decision-making should be identified. These will be determined by the expected duration of the program, the expected time scale for responses to management treatments, and any mandated reporting schedules.
• Available resources and opportunities: At least in a general sense, the availability of resources, such as funding, personnel and equipment, should be identified and coupled with any constraints on their use. For example, some monitoring partners may only be able to supply vehicles, equipment, or people during specific months of the year when their other duties are less demanding.
4.3 Step 3. Compile information relevant to monitoring program design Using the NCCP/HCP goals as a guideline, the next step is to assemble the information needed to guide the design of the monitoring program. In particular, the monitoring program designers should assemble information for developing conceptual models (see Step 5), information on existing monitoring programs in or near the plan area, and existing data on species, habitats, and other environmental factors. Relevant information may come from a wide variety of sources. In evaluating the usefulness of information sources, potential biases and limitations should be noted. For example, museum records provide some information on regional distribution and habitat associations, but sampling is usually biased towards the most accessible sites and large areas may have been completely unsampled. Listed below are examples of common existing information sources that are often useful, most of which should have been identified in the regional conservation plan.
• Programmatic documents: If an approved regional conservation plan exists, that document should be reviewed first. Other resources that may hold additional useful information include USFWS biological opinions, USFS plans, Department of Defense Integrated Resource Management Plans (IRMP), California State Parks management plans, reserve management plans, and environmental impact studies focused on species

13
and systems within the plan area. • Spatial data: Vast amounts of information can be extracted from maps. Map resources are
increasingly available as GIS datasets, making them even more useful. Valuable, if not essential, spatial data include topography, vegetation, land use, reserve boundaries, projected urban boundaries, species ranges, geology, and distributions of factors influencing native systems (e.g., weeds, rainfall).
• Technical information: Relevant technical information sources include books, scientific articles, technical reports, and museum records. Because rarely is sufficient technical information available for any given species or system, information from outside the plan area should also be considered.
• Existing monitoring programs and data sources: Descriptions of existing monitoring programs and data sources within and near the plan area should be compiled. Some existing monitoring programs for covered species may already meet the regional conservation plan’s needs with little or no adjustment. Monitoring programs in neighboring areas may provide monitoring protocols and assistance with sampling design. Historical data sets can sometimes provide baseline information and help resolve uncertainties. Useful information that can be compiled from existing programs includes: program objectives, geographic scope, protocols used, funding sources, duration of program, constraints on data use, as well as the actual data.
Although existing information should be used to the extent possible, in some cases new data will need to be collected. After existing information has been gathered, data gaps will be apparent. It will be tempting at this point to begin gathering field data to remedy this situation. However, to plan new data collection more efficiently, the next four steps should be completed first. 4.4 Step 4. Strategically divide the system and set priorities Designing effective monitoring and adaptive management programs requires a clear strategy for identifying the most important elements of the system to monitor and the critical uncertainties to address. This strategy should realistically meet the need for tracking individual “covered” species while taking a systems approach, as is increasingly recommended by scientists (e.g., Ives and Cardinale, 2004). However, no program can afford to monitor everything or to succumb to “datakleptomania” – the uncontrolled desire to collect more data (Vos et al., 2000). In this step we suggest methods for dividing the system into practical pieces to facilitate program design. Whatever strategy the program chooses should be relevant to the management program and to the accomplishment of subsequent monitoring steps. 4.4.1 Divide the system into pieces for monitoring program development. There is an infinite number of ways to conceptually divide any ecological system into pieces for monitoring. Although any attempt to partition a system will not be perfectly satisfactory, the following approach has been useful:
• Group covered species according to intensity level required for model development, management, and monitoring
• Group natural communities into natural community assemblages • Identify landscape level issues that involve multiple natural community assemblages or
for other reasons do not fit neatly into the natural community assemblages stratification

14
Below we provide examples and suggestions for completing these steps. Once the program has identified its overall strategy for dividing the system into manageable pieces and prioritizing them, it can proceed with developing conceptual models in Step 5. 4.4.2 Group covered species according to intensity level required for model development, management, and monitoring Regional NCCP/HCPs in California typically cover large numbers of species. Covered species are listed in the planning documents and typically include federally listed species, state listed species, and species of local concern. The Coachella Valley Multiple Species Habitat Conservation Plan (CVMSHCP, 2004 draft ) covers 27 species, the San Diego Multiple Habitat Conservation Program (MHCP, 2003) covers 59 species, and the Western Riverside Multiple Species Habitat Conservation Program covers 146 species (MSHCP, 2003). Dividing these long species lists into groups with similar types and intensity levels of expected management and monitoring can be useful during the development phase of a monitoring program. All covered species do not need to be monitored with the same intensity. However, the approach for tracking the status of each species and the corresponding underlying assumptions should be well-reasoned and clearly documented. Some covered species will require intensive conceptual model development that goes well beyond the information provided in the NCCP/HCP documents, for example, those species already suspected to be in decline or for which management is challenging. On the other hand, it may be possible to lump species that use similar habitats, require similar management, or are detectable using a single method (such as reptiles or neotropical riparian migratory birds). Some basic criteria that can be used to group and rank species include:
• Goals and objectives for the species, e.g., “maintain” versus “increase” • Range, distribution, and rarity of the species, i.e., rare species existing in a few
populations may need a different approach from widely distributed populations • Degree of threat to the species, i.e., whether a decline is occurring or is anticipated to
occur in the future; the potential for extinction, plus potential for recovery • Degree of management conflict or challenge, e.g., species status or uncertainty affects
decision-making such as dam operations, reserve design, land use, or management for other species
• Added informational value, i.e., whether intensively monitoring a covered species also provides added value as an indicator of ecosystem quality, as a measure of the level of biodiversity present in a specific taxonomic group, or as an early warning indicator of change in the system
Other methods of grouping are possible such as grouping by habitat or functional group (Elzinga et al., 2001). Lambeck (1997) presents a process in which species at risk are grouped by threats, such as fragmentation, and those species which are most sensitive to the threat are used to guide conservation planning. Theoretically this method could also be applied to identifying which species are most sensitive to pressures in the system for investigation as early warning indicators of stress.
15
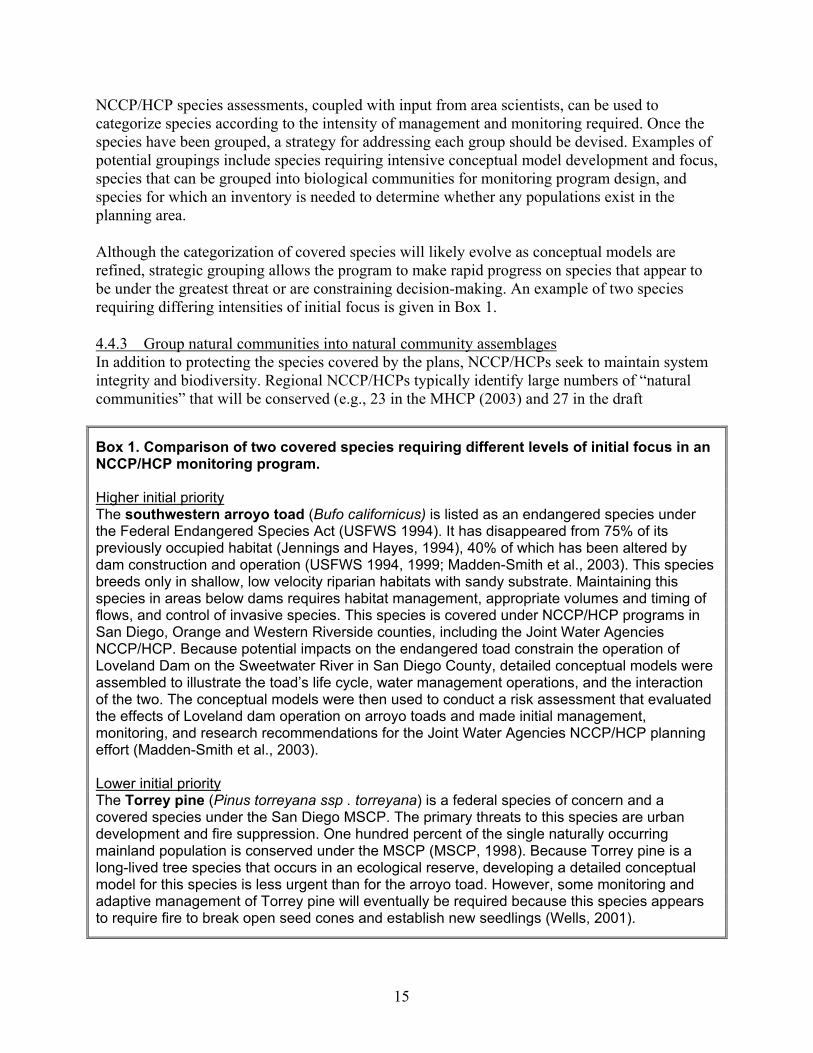
NCCP/HCP species assessments, coupled with input from area scientists, can be used to categorize species according to the intensity of management and monitoring required. Once the species have been grouped, a strategy for addressing each group should be devised. Examples of potential groupings include species requiring intensive conceptual model development and focus,
species that can be grouped into biological communities for monitoring program design, and species for which an inventory is needed to determine whether any populations exist in the planning area. Although the categorization of covered species will likely evolve as conceptual models are refined, strategic grouping allows the program to make rapid progress on species that appear to be under the greatest threat or are constraining decision-making. An example of two species requiring differing intensities of initial focus is given in Box 1. 4.4.3 Group natural communities into natural community assemblages In addition to protecting the species covered by the plans, NCCP/HCPs seek to maintain system integrity and biodiversity. Regional NCCP/HCPs typically identify large numbers of “natural communities” that will be conserved (e.g., 23 in the MHCP (2003) and 27 in the draft
Box 1. Comparison of two covered species requiring different levels of initial focus in an NCCP/HCP monitoring program. Higher initial priority The southwestern arroyo toad (Bufo californicus) is listed as an endangered species under the Federal Endangered Species Act (USFWS 1994). It has disappeared from 75% of its previously occupied habitat (Jennings and Hayes, 1994), 40% of which has been altered by dam construction and operation (USFWS 1994, 1999; Madden-Smith et al., 2003). This species breeds only in shallow, low velocity riparian habitats with sandy substrate. Maintaining this species in areas below dams requires habitat management, appropriate volumes and timing of flows, and control of invasive species. This species is covered under NCCP/HCP programs in San Diego, Orange and Western Riverside counties, including the Joint Water Agencies NCCP/HCP. Because potential impacts on the endangered toad constrain the operation of Loveland Dam on the Sweetwater River in San Diego County, detailed conceptual models were assembled to illustrate the toad’s life cycle, water management operations, and the interaction of the two. The conceptual models were then used to conduct a risk assessment that evaluated the effects of Loveland dam operation on arroyo toads and made initial management, monitoring, and research recommendations for the Joint Water Agencies NCCP/HCP planning effort (Madden-Smith et al., 2003). Lower initial priority The Torrey pine (Pinus torreyana ssp . torreyana) is a federal species of concern and a covered species under the San Diego MSCP. The primary threats to this species are urban development and fire suppression. One hundred percent of the single naturally occurring mainland population is conserved under the MSCP (MSCP, 1998). Because Torrey pine is a long-lived tree species that occurs in an ecological reserve, developing a detailed conceptual model for this species is less urgent than for the arroyo toad. However, some monitoring and adaptive management of Torrey pine will eventually be required because this species appears to require fire to break open seed cones and establish new seedlings (Wells, 2001).

16
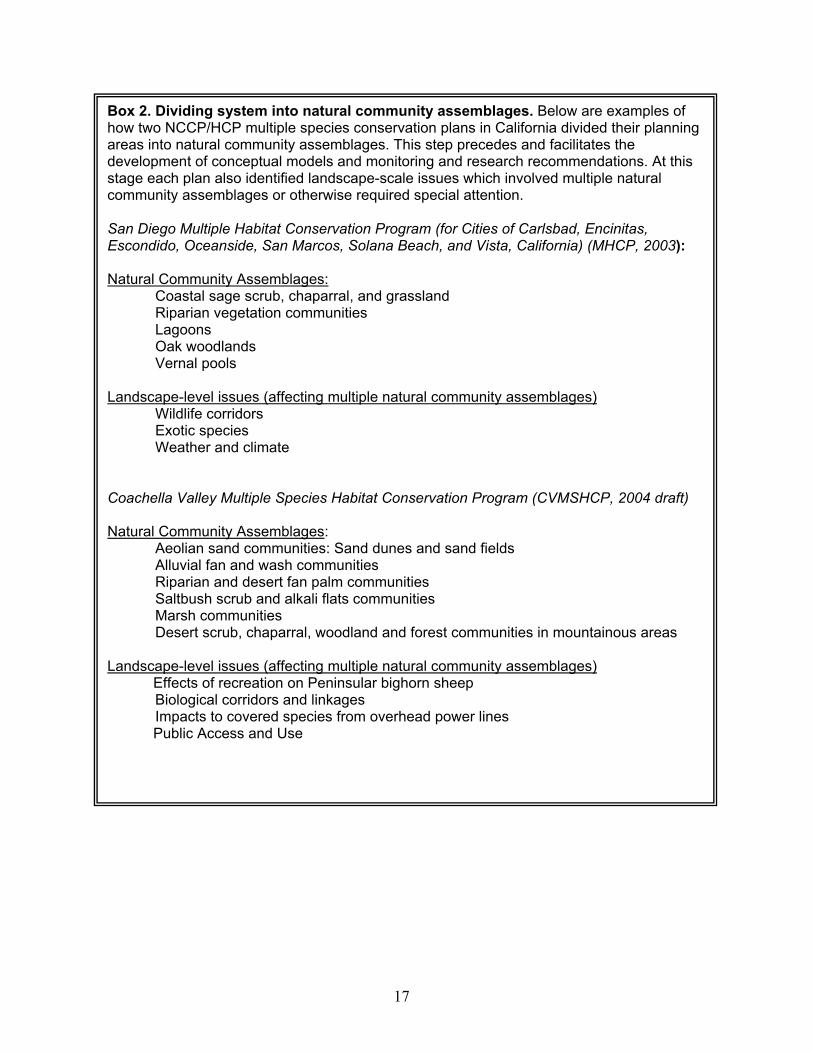
CVMSHCP (2004)). These can often be combined into a smaller number of “natural community assemblages.” Examples include “floodplain and riparian habitat”, “chaparral/coastal sage scrub/grassland community”, and “lagoons and tidal wetlands.” Communities grouped together in an assemblage are assumed to be affected by the same physical and biological processes and the same general set of pressures. These assemblages partition the landscape into fewer categories than natural communities, yet are relevant biologically, practical to management, and facilitate subsequent design steps. Box 2 lists the complete sets of natural community assemblages chosen for the MHCP and the draft CVMSHCP. Two instructive examples of how multiple natural communities can be combined into natural community assemblages are given by: 1) the chaparral/coastal sage scrub/grassland natural community assemblage specified in the MHCP and 2) the aeolian sands natural community assemblage identified in the draft CVMSHCP. First, coastal sage scrub, chaparral, and grassland are each classified as separate natural communities in the MHCP (2003). However, these three natural communities sometimes occur in mixed stands, and fire, land management, invasive grasses, aerial deposition of nitrogen and natural plant succession all contribute to transitions among these three natural community types at a given site. While some covered species are specific to one natural community or another, others may be found throughout all three natural communities. Because many of the processes and pressures affecting these communities are common to all three and because one of the main management challenges will be to maintain an appropriate balance of these community types, identifying a “chaparral/coastal sage scrub/grassland” natural community assemblage was appropriate for the MHCP (2003). Similarly the draft CVMSHCP (2004) identified the “aeolian sand” natural community assemblage. This natural community assemblage combines “active desert dunes,” “active desert sand fields,” “ephemeral desert sand fields,” “stabilized shielded desert sand,” and “mesquite hummocks.” Again, the processes and pressures that affect these natural communities are similar and the communities are dynamically linked. For example, unstabilized sand can transition through time to stabilized dunes. The aeolian sand natural community assemblage will need to be managed to maintain a balance of the component natural communities due to different habitat requirements of the covered species. Also influencing decisions about grouping into natural community assemblages is the number and types of covered species found in each natural community. For example, in the draft CVMSHCP (2004) only two covered species, gray vireo (Vireo vicinior) and Peninsular bighorn sheep (Ovis canadensis), inhabit the “desert scrub, chaparral, woodland, and forest communities in mountainous areas.” This large, diverse array of natural communities was lumped into a single natural community assemblage in the draft CVMSHCP due to the small number of covered species present, the similar nature and low intensity of the pressures affecting these natural communities, and the similarity of the management challenges across these areas (i.e., managing recreation, fire, and invasive species). Because the natural communities in an assemblage are affected by the same suite of processes, pressures and management actions, this method of partitioning resources provides a natural transition to the subsequent steps of conceptual model development and specification of monitoring and adaptive management actions.
17
Box 2. Dividing system into natural community assemblages. Below are examples of how two NCCP/HCP multiple species conservation plans in California divided their planning areas into natural community assemblages. This step precedes and facilitates the development of conceptual models and monitoring and research recommendations. At this stage each plan also identified landscape-scale issues which involved multiple natural community assemblages or otherwise required special attention. San Diego Multiple Habitat Conservation Program (for Cities of Carlsbad, Encinitas, Escondido, Oceanside, San Marcos, Solana Beach, and Vista, California) (MHCP, 2003): Natural Community Assemblages:
Coastal sage scrub, chaparral, and grassland Riparian vegetation communities Lagoons Oak woodlands Vernal pools
Landscape-level issues (affecting multiple natural community assemblages)
Wildlife corridors Exotic species Weather and climate
Coachella Valley Multiple Species Habitat Conservation Program (CVMSHCP, 2004 draft) Natural Community Assemblages:
Aeolian sand communities: Sand dunes and sand fields Alluvial fan and wash communities Riparian and desert fan palm communities Saltbush scrub and alkali flats communities Marsh communities Desert scrub, chaparral, woodland and forest communities in mountainous areas
Landscape-level issues (affecting multiple natural community assemblages)
Effects of recreation on Peninsular bighorn sheep Biological corridors and linkages Impacts to covered species from overhead power lines Public Access and Use
18
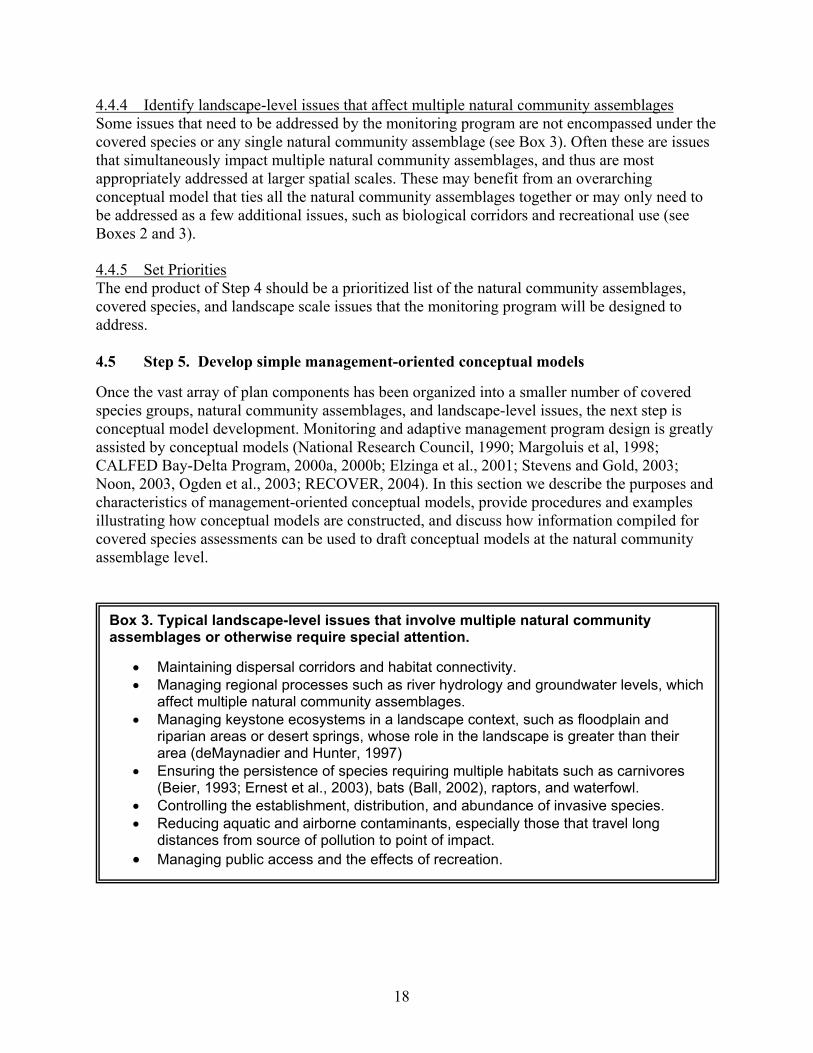
4.4.4 Identify landscape-level issues that affect multiple natural community assemblages Some issues that need to be addressed by the monitoring program are not encompassed under the covered species or any single natural community assemblage (see Box 3). Often these are issues that simultaneously impact multiple natural community assemblages, and thus are most appropriately addressed at larger spatial scales. These may benefit from an overarching conceptual model that ties all the natural community assemblages together or may only need to be addressed as a few additional issues, such as biological corridors and recreational use (see Boxes 2 and 3). 4.4.5 Set Priorities The end product of Step 4 should be a prioritized list of the natural community assemblages, covered species, and landscape scale issues that the monitoring program will be designed to address. 4.5 Step 5. Develop simple management-oriented conceptual models Once the vast array of plan components has been organized into a smaller number of covered species groups, natural community assemblages, and landscape-level issues, the next step is conceptual model development. Monitoring and adaptive management program design is greatly assisted by conceptual models (National Research Council, 1990; Margoluis et al, 1998; CALFED Bay-Delta Program, 2000a, 2000b; Elzinga et al., 2001; Stevens and Gold, 2003; Noon, 2003, Ogden et al., 2003; RECOVER, 2004). In this section we describe the purposes and characteristics of management-oriented conceptual models, provide procedures and examples illustrating how conceptual models are constructed, and discuss how information compiled for covered species assessments can be used to draft conceptual models at the natural community assemblage level.
Box 3. Typical landscape-level issues that involve multiple natural community assemblages or otherwise require special attention.
• Maintaining dispersal corridors and habitat connectivity. • Managing regional processes such as river hydrology and groundwater levels, which
affect multiple natural community assemblages. • Managing keystone ecosystems in a landscape context, such as floodplain and
riparian areas or desert springs, whose role in the landscape is greater than their area (deMaynadier and Hunter, 1997)
• Ensuring the persistence of species requiring multiple habitats such as carnivores (Beier, 1993; Ernest et al., 2003), bats (Ball, 2002), raptors, and waterfowl.
• Controlling the establishment, distribution, and abundance of invasive species. • Reducing aquatic and airborne contaminants, especially those that travel long
distances from source of pollution to point of impact. • Managing public access and the effects of recreation.

19
4.5.1 Purposes of conceptual models Although conceptual models are not an official requirement of NCCP/HCPs, programs that do not use management-oriented conceptual models frequently experience difficulty in the steps that follow. Conceptual models are qualitative or quantitative models used to clearly describe a system. In developing monitoring programs in an adaptive management context, conceptual models help program designers:
• summarize existing knowledge and hypotheses about a system • select and prioritize important components of the system to monitor • identify and prioritize critical uncertainties that require research
In addition, conceptual models:
• communicate understanding of the system to all program participants and encourage interdisciplinary dialog
• facilitate review of the program by outside experts by summarizing system complexities in a digestible form
There are many different types of conceptual models in use. Sometimes confusion results because the term “conceptual model” means different things to different people. Model form and details differ depending on the purposes, scales of focus, and system complexity. An important point is that a conceptual model is usually designed for a specific purpose; the level of detail and complexity of the model should reflect that purpose. The program may choose to create very basic conceptual models for some parts of the system, while creating very specific and detailed conceptual models for other aspects of the system. The level of focus and detail depends on which aspects of the program have the greatest uncertainty and anticipated difficulty in meeting program objectives. Models can be narrative (e.g., MHCP, 2003) or can be diagrams supplemented by narratives (e.g., CVMSHCP, 2004 draft). Diagrams can summarize the “big picture” by showing the hypothesized relationships between the key components of the model. Narrative models explain the hypothesized relationships in detail, provide an estimate of their level of certainty, and identify alternative hypotheses and gaps in knowledge. Based on the outcomes of monitoring and research, conceptual models should evolve through time, a consideration discussed in more detail below. 4.5.2 Characteristics of management-oriented conceptual models NCCP/HCP conceptual models should be management–oriented tools that assist the design of the conservation strategy and adaptive management. This is achieved by linking the conservation plan objectives to causes of change and to management activities. Management-oriented conceptual models make identifying and prioritizing monitoring variables and critical uncertainties much easier (Step 6) and greatly assist sampling design (Step 7). In our discussion of conceptual models, we use the term “pressure” to refer to agents that either promote or inhibit change in the state of the environment. These are called stressors, threats, or drivers in other programs. Because such agents may have a negative effect on some species while having a positive effect on others, we use pressure as a more neutral term. Pressures can be

20
anthropogenic (e.g., barriers to movement, disturbance, contaminants) or natural (e.g., climate variability, 100-year flood events). Pressures can also include natural constraints such as limited seed dispersal. A management-oriented conceptual model links pressures on the state of the environment to hypothesized effects of those pressures. This requires a sufficient understanding of the inter-relationships among species, habitats and ecological processes, to speculate on how pressures are affecting the state of the environment, and to make hypotheses about appropriate program actions (conservation strategy and management activities) that should be implemented in response (see Figure 3, page 21). More detailed models of food webs or ecological processes are developed as needed to assist understanding of the effects of pressures and program actions on system dynamics. Both the San Diego Multiple Habitat Conservation Plan (MHCP, 2003) and the Coachella Valley Multiple Species Habitat Conservation Plan (CVMSHCP, 2004 draft) used this general management-oriented approach. Similar approaches have been applied in other ecosystem management programs, although the terminology varies (New Zealand Ministry for the Environment, 1997; Bertram and Stadler-Salt, 2000; Atkinson et al., 2002; California Resources Agency, 2002; Noon, 2003; RECOVER, 2004). A similar method uses web envirograms (Andrewartha and Birch, 1986; Longcore et al., 2003). 4.5.3 Details and examples of conceptual models Models can be created in different formats to best meet the planning needs of the program. However, the components of the conceptual models will be the same regardless of format. Box 4 (page 22) lists the suggested components of a covered species conceptual model. Appendices A and B list the components of natural community assemblage models and landscape-level issue models, respectively. The program will likely develop a series of nested conceptual models (see Figure 4, page 23). The number and complexity of the models depend on the needs of the program. Three conceptual model examples are discussed below: 1) an arroyo toad species-focused conceptual model (Figure 5, page 24), 2) an aeolian sand natural community assemblage model that links pressures to covered species (Figure 6, page 25), and 3) a more detailed sub-model of the aeolian sand natural community assemblage detailing relationships among geomorphic processes and species (Figure 7, page 26). Only brief descriptions are provided here. More details for each of these models are provided in the source documents (Atkinson et al., 2003b; CVMSHCP, 2004 draft). All three of these examples highlight the pressures that affect the systems and possible program actions in response. The arroyo toad is very sensitive to a diverse array of pressures affecting its different life stages, including lack of connectivity between upland areas and breeding habitat, degradation of breeding habitat quality due to altered river hydrology and geomorphology, and invasive predators such as bullfrogs. The conceptual model in Figure 5 (page 24) is designed to emphasize life stage-specific pressures on the toad. The model also highlights important relationships while omitting many details already summarized in the species recovery plan (USFWS, 1999).

21
Program Actions
Conservation
Strategy & Management
Activities
State of Environment
Processes Species Habitats
MANAGEMENT-ORIENTED CONCEPTUAL MODEL
Effects
Pressures
Figure 3. Key components of management-oriented conceptual models. Conceptual models facilitate adaptive management by showing how pressures and program actions are hypothesized to affect key components of the environment and their interactions. The components of conceptual models include:
• State of Environment: the condition of ecological processes, habitats, and species (and their inter-relationships), which are directly or indirectly addressed by program objectives.
• Pressures: these are agents that either promote or inhibit change, also called stressors, threats, or drivers. Because such agents may have opposite effects for two species, we use pressure as a more neutral term. Pressures can be anthropogenic (e.g., barriers to movement, disturbance, contaminants) or natural (e.g., climate variability, 100-year flood events). Pressures can also include natural constraints such as limited seed dispersal.
• Program Actions: these include the conservation strategy of the NCCP/HCP and ongoing management activities expected to impact the State of Environment or Pressures.
• Effects: these are changes resulting from either Pressures or Program Actions.

22
Box 4. Suggested components of covered species conceptual models. Each covered species should be represented by one or more conceptual models. Often key model components can be derived from the initial species assessments for the NCCP/HCP, but gaps in knowledge will undoubtedly exist. For each species, an attempt should be made to assemble the information below. Program objectives
• List program objectives for the covered species. Species background and description
• Life history: - For plants, describe life history, life expectancy (annual-biennial-perennial),
reproductive ecology (pollinators, flowering period, annual variability in flowering, seed production, seed viability), seedling ecology (regularity of establishment, germination requirements, establishment requirements), dispersal patterns (Elzinga et al., 2001).
- For animals, describe life history, life expectancy, food habits, predators, competitors, breeding season, age at maturity, number of offspring produced annually, frequency of breeding, home range, migratory patterns (Elzinga et al., 2001).
• Describe current and historical species distribution; provide maps of known or hypothesized distribution and species occurrences.
• Describe species-habitat associations including vegetation community associations, characteristics of good and poor quality habitat, and any other factors such as soil type, climate, slope, aspect, and moisture that are known to or hypothesized to influence the distribution of species across the landscape.
• Describe species relationships to ecological processes (e.g., post-fire colonizing species).Species status and trend
• Identify relevant existing monitoring programs and historical data repositories. • Describe current known or hypothesized status and trends: estimate current population
sizes, annual variation, number and distribution of populations, productivity of different populations, and condition of different populations.
Pressures, program actions and their anticipated effects • Describe anthropogenic and natural pressures (i.e., threats, causes of change) and their
hypothesized effects on the species, plus constraints such as limited seed dispersal or limited seed longevity. The hypothesized relationships between the pressures, the state of the species or habitat, and management actions should be explained. Some pressures may occur extremely rarely, such as extreme flood events that may be responsible for current species distributions.
• Identify planned or potential management actions and their hypothesized effects on covered species.
Special issues and critical assumptions • Describe any special issues and critical assumptions that should be included in the
model. Examples might include: issues of scale, special assumptions made during reserve planning that require early testing, alternative hypotheses and alternative models, tradeoffs between managing habitat for different species, and public recreation access requirements. For example, the MHCP (2003) assumes that California gnatcatchers will use the small reserves in the MHCP as “stepping stones” to move between lands in southern San Diego County and Marine Corps Base Camp Pendleton in northern San Diego County.
Diagram • Provide a simplified diagram of the conceptual model showing relationships between the
covered species’ status and pressures and management actions.

Coastal sage scrub/chaparral/ grassland model
Hydrological/ geomorphic/ vegetation interaction
Neotropical migratory bird
model
Fire & vegetation succession
model
Southwestern pond turtle
model
Connectivity across
landscape
Reptile community
model
Fringe-toed lizard model
Round-tailed ground
squirrel model
Flat-tailed horned lizard
model Jerusalem
cricket model
Least Bell’s vireo model
Food web model
Resident birds model
California gnatcatcher
model
Reptile & small
mammal community
model
Coastal horned lizard
model
Figure 4. Hypothetical hierarchy of nested conceptual models. This hierarchy includes overarching multiple habitat model, natural community assemblages models, various sub-models such as processes-vegetation models and food-web models, and specific covered species models. Examples of three of these conceptual models are given in Figures 5 through 7.
Riparian & associated floodplain
model
Geomorphic model of dune mobilization & stabilization
(Figure 7)
Aeolian sands: sand dunes and fields
(Figure 6)
Arroyo toad model
(Figure 5)
Multiple natural community assemblages model
& special issues
23

ADULTS Uplands
BREEDING Jan – Early July**
JUVENILES Uplands
EGGS Feb-Early July**
TADPOLES March-July**
METAMORPHS (10-17mm)
May-August**
Breeding Adult Stage Characteristics Breeding is nocturnal in spring after water temperatures reach at least 14 oC and water levels (<30 cm deep) and speed (<5 cm/sec) are appropriate for breeding • Females assumed to lay only one egg mass • Males may mate with multiple females • Prefer darker nights Habitat Conditions Clear still to slow-moving water with shallow, exposed clean, sandy bottom and open canopy [see influencing factors] Pressures (Stressors/Risk Factors) Breeding habitat loss due to urbanization • Lack of flushing flows and sediment supply causes habitat loss due to natural plant succession • Breeding habitat quality degradation and loss due to exotic plants (arundo, tamarisk) or to native plants (water cress) • Lack of water in pools due to low annual rainfall, excessive water diversions and/or groundwater pumping • Roadkill / crushing by vehicles, people, livestock • Predation by raccoons, crows, bullfrogs, bass, crayfish, fire ants, Argentine ants? • Light pollution • Noise pollution does not appear to affect calling males but may have an effect on female response • Aquatic contaminants (sewage effluent, pesticides) • Aerial contaminants? fire retardant? • Disease? Influencing Factors Episodic flushing flows and floods are needed to naturally disturb riparian habitat, clear vegetation on sandy terraces and maintain toad habitat • Variability in climate, amount of rainfall, and timing of rainfall strongly affect available habitat and breeding. Breeding is limited or may not occur at all in drier years • Water diversions, and groundwater pumping can reduce flows • Dams alter the amount and timing of flushing flows and sediment supply • Beaver dams block sediment supply and alter river and stream hydrology • Excessive urban runoff can increase peak flows and contain contaminants • Weeds like arundo can slow flows and increase siltation • Ephemeral water habitats that are occasionally dry have lower concentrations of non-native fish and bullfrogs and perennial habitats have higher concentration • Erosion after fires can cause siltation of breeding habitat
Adult Life Stage Characteristics (limited knowledge) Lifespan about 5 years (???) • Favor nights for activity, burrow in sand during day • Typically do not go more than 0.5-0.75 miles from breeding pools but may travel over 1 mile, distance influenced by topography and microclimate • Very dispersed • Feed on native ants and other invertebrates Habitat Conditions Coastal sage scrub, chaparral, oak woodland, but not grasslands (may travel thru grasslands). Require friable soils and permeable plant understory for burrowing. Pressures (Stressors/Risk Factors) Habitat loss • Lack of connectivity between breeding habitat and uplands • Roadkill / crushing by vehicles • Non-native ants (Argentine & fire ants) • Predation-native and house cats • Fire • Pesticides • Drought (starvation)
Juvenile Life Stage Characteristics (limited knowledge) Assume moving into upland but may remain by pools for up to 6 months • More dispersed than metamorphs • Nocturnal • Assume eat native ants and beetles • Upland movement is close and parallel to stream and influenced by topography and availability of suitable microhabitat Habitat Conditions & Pressures Similar to adults
Metamorph Life Stage Characteristics Active during day on sandy benches • Still fairly clustered together • Feed on native ants and possibly other invertebrates Habitat Conditions Soft, exposed, sand and moist sandy benches with partial shading adjacent to pools Pressures (Stressors/Risk Factors) Crushing from vehicles and humans (when still clustered they are especially vulnerable) • Fire ants and Argentina ants displacing native ants • Predation from garter snakes, bullfrogs, birds (killdeer, herons) • Contaminants: pesticides, heavy metals, urban runoff, etc. • Habitat loss (arundo) • Compaction of sand prevents metamorph burrowing
Tadpole Life Stage Characteristics (65-85 days) Active during day • Very cryptic • Can disperse downstream Habitat Conditions Similar to breeding habitat, also need detritus, moss, periphyton Pressures (Stressors/Risk Factors) Predation: exotic fishes, garter snakes, birds, bullfrogs, etc. • Crushing, disturbance, and siltation from humans vehicles, livestock (bison) • Poorly timed flushing events can wash tadpoles downstream into poor habitats • Desiccation due to lack of rainfall, ground water pumping, and water diversions • Disease? • Contaminants: pesticides, heavy metals, treated effluent, urban runoff, etc.
Egg Life Stage Characteristics Strings of 2,000-10,000 eggs on sand, gravel, cobble or mud along pool margins away from vegetation Habitat Conditions Same as breeding habitat; require lack of sediment/turbidity (but can tolerate it for a few days) Pressures (stressors/risk factors) Desiccation due to lack of rainfall, ground water pumping, and water diversions • Disturbance/siltation due to humans, vehicles, livestock, floods, run-off, fires • Unseasonal flooding can wash eggs downstream • Predation: exotic fishes, crayfish, invertebrates • Disease? • Contaminants: pesticides, heavy metals, treated effluent
Females mature: 2-3 years Males: 1-2 years
* For details see arroyo toad recovery plan (USFWS, 1999) ** These dates may shift in some years depending on rainfall. Dates also shift in montane or inland desert areas.
Possible Management Actions • Protect and maintain breeding habitat and connectivity with upland
habitats. Maintain sandy soil next to rivers. • Manage natural hydrology and sediment supply to extent possible to
allow natural creation and maintenance of toad habitat. Maintain flushing flows during winter and avoid unseasonal floods during spring
• Control invasive predators such as bullfrogs, African clawed frogs, non-native fish in and around breeding areas. Control invasive plants in and around breeding areas (arundo, tamarisk, watercress). Control beavers.
• Avoid disturbance, crushing, and siltation of breeding areas by vehicles/humans/livestock during breeding season
• Minimize contaminants
12-20 days
65-85 days
Figure 5. Species-focused conceptual model for southwestern
arroyo toad (Bufo californicus) * (taken from Atkinson et al., 2003b)
24

25
Figure 6. Aeolian sand natural community assemblage conceptual model of pressures on covered species. This example comes from the draft Coachella Valley Multiple Species Habitat Conservation Plan (Figure 8-7, CVMSHCP, 2004). The figure summarizes the main pressures, their relationships and their hypothesized effects on covered species in the aeolian sand natural community assemblage. In any management-oriented conceptual model, making the link to potential management activities is critical. Box 5 (page 27) shows the related conservation strategy and management activities.
Urbanization adjacent to
conserved areas
Off-road vehicle trespass
Prolonged drought
Exotic plant infestations
Blocked sand/wind corridor
Prolonged above average rainfall
Habitat fragmentation -
roads
Increased feral animal predation
Exotic ant infestation
Collapsed burrows
Reduction in native plant abundance
Stabilization of aeolian sand
habitat
Road mortality – edge effects
Reduced round-tailed ground
squirrels
Reduced Palm Springs pocket
mice
Reduced CV Jerusalem crickets
Reduced flat-tailed horned
lizards
Reduced CV fringe-toed lizards
Reduced CV giant sand-treader
crickets
Reduced CV milk-vetch
The shaded
part of this model is
expanded upon in
the sand process
sub-model in Figure 7
Human-induced and natural pressures
Effects on covered species

26
Figure 7. Aeolian community sand process model. This sub-model of Figure 6 summarizes the geomorphic processes of sand dune stabilization and destabilization and their relationships to weather, non-indigenous plants, and sand movement blockage. The figure is from the draft Coachella Valley Multiple Species Habitat Conservation Plan (Figure 8-6, CVMSHCP, 2004; See also Barrows, 1996) and is explained in greater detail in the text of that document.
Rare, intense storm event (ranging in periodicity from decades to centuries) delivering sand to the valley floor
Tree rows and buildings block downwind sand movement
Strong winds sort sands, with those particles from 1.0 to 0.1 mm accreting downwind into dunes and hummocks
Reduced water table reduces mesquite & other shrubs that promote dune development
Aeolian sand dune animals expand distribution with increased sand mobility. Food web depends on perennial plants, detritus
Dunes and hummocks increase mobility and expand coverage of Aeolian habitat downwind
“Average” Rainfall
Dunes and hummocks reduce mobility; high number of annual plants on dunes
Higher organic content of dunes favors exotic weed establishment, increasing stabilization and favoring exotic plant establishment
Multi-year drought
Weather
Multi-year above average rainfall
Mortality and reproduction roughly equal for stabilized and de-stabilized dune lizards, and other species
Increased dune stabilization favors stabilized dune species. Species favoring active dunes reduced.
Flood control and alluvial fan development eliminates sand transport onto the valley floor [aeolian transport zone]
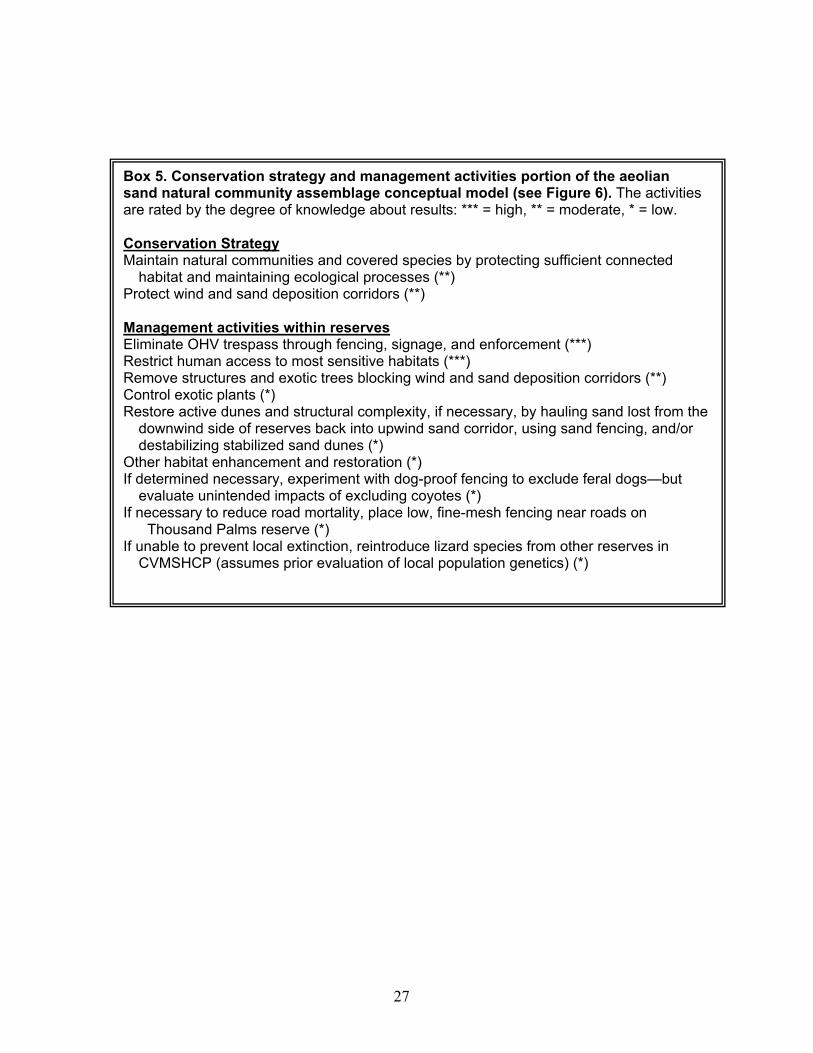
27
Box 5. Conservation strategy and management activities portion of the aeolian sand natural community assemblage conceptual model (see Figure 6). The activities are rated by the degree of knowledge about results: *** = high, ** = moderate, * = low. Conservation Strategy Maintain natural communities and covered species by protecting sufficient connected
habitat and maintaining ecological processes (**) Protect wind and sand deposition corridors (**) Management activities within reserves Eliminate OHV trespass through fencing, signage, and enforcement (***) Restrict human access to most sensitive habitats (***) Remove structures and exotic trees blocking wind and sand deposition corridors (**) Control exotic plants (*) Restore active dunes and structural complexity, if necessary, by hauling sand lost from the
downwind side of reserves back into upwind sand corridor, using sand fencing, and/or destabilizing stabilized sand dunes (*)
Other habitat enhancement and restoration (*) If determined necessary, experiment with dog-proof fencing to exclude feral dogs—but
evaluate unintended impacts of excluding coyotes (*) If necessary to reduce road mortality, place low, fine-mesh fencing near roads on
Thousand Palms reserve (*) If unable to prevent local extinction, reintroduce lizard species from other reserves in
CVMSHCP (assumes prior evaluation of local population genetics) (*)

28
The conceptual model for the CVMSHCP aeolian sand natural community assemblage is shown in Figures 6 and 7 and in Box 5 (pages 25-27). Figure 6 summarizes hypothesized relationships between pressures and the effects on covered species. Figure 7 is a sub-model of Figure 6 that shows in greater detail the relationships between sand deposition, stabilization, and destabilization processes, annual rainfall, exotic plants, and stabilized and destabilized sand species. Box 5 summarizes the conservation strategy and proposed management activities that were determined by analyzing of the aeolian sand natural community assemblage conceptual model. For proposed management activities we have also assigned levels of certainty about how to implement them and the expected response; actions involving a high degree of uncertainty should be initially designed as experiments. 4.5.4 Utilizing species assessments to create models of natural community assemblages Building a conceptual model for a natural community assemblage can be daunting. One way to create one is to utilize the large amount of information gathered for the covered species assessments. Many covered species are affected by similar pressures, as is shown in Figure 6. For plans with large numbers of covered species, draft natural community assemblage models can be assembled by summarizing all the pressures identified for the covered species and using that list to identify 1) the main pressures on the assemblage components and 2) key management issues. Once this initial model is drafted, additional areas of the model that need further development can be identified, such as the detailed aeolian sand process sub-model in Figure 7. Models developed in this way make clear the link between management at the natural community assemblage level and the status of covered species, and take advantage of the considerable information assembled in the NCCP/HCP planning process. A step-by-step description of building from covered species models to natural community assemblage models and landscape-level models is given in Appendix C. 4.6 Step 6. Determine what to monitor and identify critical uncertainties Once draft conceptual models have been assembled, the program can select which attributes of the system to monitor, determine the specific monitoring objectives and appropriate monitoring variables for each attribute, and identify critical uncertainties requiring targeted study. The program should also assess the suite of monitoring and research opportunities from a program-wide viewpoint, identifying any remaining gaps and eliminating unnecessary redundancies. Although outside review of the conceptual models is helpful, the program need not wait to receive such review before moving forward with Step 6. 4.6.1 Select the attributes to monitor Using the conceptual models developed in Step 5, the appropriate attributes of the system to monitor can be selected. An attribute is any component or condition of the system that can be quantifiably measured, for example, forest cover, precipitation or arthropod species diversity. Different attributes are monitored for different purposes. Some are resources described by program goals, such as covered species. Others provide early warnings of subtle changes that might be of concern, such as the appearance of exotic ants. Still others function as covariates, assisting interpretation of other attributes such as annual precipitation.

29
For example, inspection of the aeolian sand conceptual models (Figs. 6 and 7) might suggest monitoring some of the following general attributes in addition to covered species population trends and distribution: weather, areal extent of each natural community, off-highway vehicle activity, vegetation, reptile community, arthropod community, and feral and domestic animal activity. Choosing attributes that show sensitivity to pressures and sources of change can increase the effectiveness of the program. In this example, monitoring the extent and distribution of the different types of natural communities, especially stabilized and destabilized sand, will provide a warning of when the system is trending towards having too little habitat for either stabilized sand or destabilized sand species. Similarly, changes in the arthropod community, especially detection of invasive argentine ants, could be an early warning of food-web shifts with potentially serious consequences for higher trophic levels (CVMSHCP, 2004 draft). Another example of an early warning attribute is monitoring a benthic invertebrate community to detect contaminants effects. This approach allows earlier detection than monitoring higher taxonomic groups, such as bird populations, and thus may allow remedial action before substantial harm has been done. In addition, sometimes monitoring the direct input of a pressure itself, such as the quality of water discharged into rivers, may be more effective in improving management than monitoring the endpoint such as cumulative changes in water quality at a distant point in a watershed or the effect on a sensitive fish species (MacDonald and Smart, 1992). We pause here to interject a note of caution. Using habitat extent and condition as a surrogate for species population monitoring is an appealing but controversial issue. In general, we simply know too little about species relationships to habitat to monitor reliably most covered species by habitat-only monitoring (e.g., Lawler and Schumaker, 2004). Instead, we recommend monitoring both habitat and species at some level. Appendix D discusses this issue further. 4.6.2 Specify monitoring objectives Once the general attributes to monitor have been selected, the specific testable “questions” or objectives that the monitoring program will address should be clearly articulated. Then the monitoring variables and the exact scope of the monitoring should be specified. Monitoring objectives should be directly derived from the overarching goals and objectives of the NCCP/HCP conservation strategy. The specific monitoring objectives should be articulated as clearly as possible, leading directly to how data will be collected, interpreted and put to practical use. The clearer these objectives, the easier it is to design the rest of the monitoring program (MacDonald and Smart, 1992; Olsen et al., 1999; Yoccoz et al., 2001). For example, the MHCP conservation goals for least Bell’s vireo (Vireo bellii pusillus) are: “Ensure species persistence in the plan area and contribute to species recovery. Improve habitat quality and increase species abundance to contribute to regional population viability.” (MHCP, 2003). How the monitoring program will specifically measure progress towards these goals needs to be clear when they are restated as monitoring objectives. Objectives can be formatted as questions or as statements.
30
In the least Bell’s vireo example above, the MHCP monitoring objectives during Phase 1 (inventorying resources and identifying relationships) are fairly straightforward:
• What is the distribution and status of least Bell’s vireo populations in the planning area? • With what specific habitats is least Bell’s vireo associated? • What are the extent, distribution, and condition (e.g., level of obvious pressures) of those
habitats? • To what pressures is least Bell’s vireo sensitive?
For monitoring in Phase 2 (pilot testing of long-term monitoring and resolving critical management uncertainties) or in Phase 3 (implementing long-term monitoring and adaptive management) the questions will be more specific. Long-term monitoring questions (objectives) for least Bell’s vireo will likely fall into the following categories:
• “Status and trends” questions: Is the estimated abundance of least Bell’s vireo in the plan area within the bounds of the baseline range of variation? If not, is it increasing or decreasing?
• “Early warning of problem” questions: Is the areal extent of least Bell’s vireo habitat changing? What is the abundance or proportion of area occupied by cowbirds (Molothrus ater), a nest parasite, in least Bell’s vireo nesting areas?
• “Targeted study” questions: At what rate does cowbird nest parasitism have a measurable impact on reproductive success of least Bell’s vireo? Which habitat restoration techniques result in a least Bell’s vireo reproductive success rate at or above a level sufficient to sustain populations?
A monitoring strategy should attempt to accommodate the different scales of analysis identified in Step 2. These include individual reserve scale, NCCP/HCP scale, and ecoregional scale. Both the goals for an individual reserve plus the reserve’s regional role will influence the approach to monitoring at individual reserves. For example, putative breeding habitat for California gnatcatchers (Polioptila californica californica) might be surveyed differently than dispersal habitat (MHCP, 2003). The monitoring focus might also be different at different scales. For example, wide-ranging species like mountain lions (Felis concolor) might be monitored throughout an ecoregion, in an individual NCCP/HCP as part of a targeted study to determine whether biological corridors are functioning as intended, and in local reserves as part of medium and large carnivore inventories. It might be possible to address these different scales concurrently with a single monitoring design (e.g., radio-tracking studies), or different approaches may be required. Because funding is limited, the monitoring program should focus on the level that is most relevant to management of the resources. At this point the program also needs to consider how exactly the monitoring data will be analyzed and interpreted so that collected data will be applicable to all scales. 4.6.3 Select monitoring variables Once the monitoring objectives have been articulated, the monitoring variables can be selected. Frequently these variables are fairly obvious based upon the objectives. A good monitoring variable should be relevant to management, have strong scientific underpinnings, be measurable and feasible, statistically rigorous, and easily understood and interpreted. Appendix E lists and

31
describes characteristics of good monitoring variables in greater detail. Obviously not all monitoring variables will meet all criteria, but they should meet as many as possible. Based upon the monitoring objectives for least Bell’s vireo, a possible monitoring variable would be an estimate of seasonal least Bell’s vireo relative abundance based upon point-distance surveys in vireo habitat and using double-observer methods to create confidence intervals that account for observer bias. Another alternative is to monitor the proportion of area occupied by vireos, dividing potential habitat into sampling units which are visited two or more times for presence rather than abundance. Additional monitoring variables based on the objectives could include the relative abundance of brown-headed cowbirds seen during transect counts, locations of invasive riparian vegetation (e.g., Arundo donax) and other measures that reflect vireo habitat quality. Once candidate monitoring variables have been identified, a description of each monitoring variable and its characteristics should be made (see Box 6). The intensity of monitoring for species or biological communities may vary considerably depending on the attribute monitored, the ultimate goal, and the priority of the issue or species. In Appendix F we provide examples of species-level monitoring variables of increasing intensity of effort. In Appendices G and H, we provide examples of variables used to monitor natural community assemblages and landscape-level issues. While selecting the monitoring variables, program designers should visualize how the monitoring data will be analyzed and interpreted. Sometimes what seems like a good variable to monitor becomes less desirable when one actually visualizes using the information. For example, trends in bird abundance might seem like useful information to have. However, they might be difficult to interpret without other simultaneous monitoring of habitat extent and condition, or without comparison with trends in neighboring areas. Realizing these limitations up front allows these considerations to be built into the program, or may dictate the selection of different monitoring variables. Program designers should imagine a range of possible future scenarios
Box 6. Description of monitoring variables. Supporting documentation should accompany the selection of each monitoring variable, to improve clarity and understanding among all program managers in the present as well as in the future. A description of each monitoring variable should include the following details:
• “What” will be monitored • “Why” tracking this variable is useful and the specific question the data will be used
to address • The conceptual model that underlies the monitoring variable • The geographical area where it will be monitored • The specific protocol that will be used to collect data • The range of values the data can take and what the values mean • The expected response of the monitoring variable to pressures or to management
(i.e., increase, decrease, or remain stable) and the magnitude of change expected • The temporal and spatial scales over which change is expected to be manifested • Whether the needed data are already being gathered, and, if so, by whom
(Adapted from Gibbs et al., 1999; National Research Council, 2000)

32
to determine if the monitoring variables selected will be sensitive to anticipated and unanticipated sources of change, and to determine how the data should be analyzed and interpreted. For example, a program might initially choose “relative abundance estimated by number of pairs of California gnatcatchers observed on reserves” as its monitoring variable. Program designers might then visualize the following scenario using this sampling design:
Observers conduct complete censuses of the numbers of gnatcatcher pairs on each reserve. The number of gnatcatcher pairs initially counted across all reserves is 563. In subsequent years, counts of 595, 420, and 457 pairs occurred. Observers varied among reserves and among years.
One can anticipate that it will be difficult to interpret these data, because annual changes in the number of gnatcatcher pairs observed could be due either to a trend in gnatcatcher abundance or to different levels of expertise of the different observers. To reliably estimate the number of gnatcatcher pairs, some estimate of observer variability is needed. Correct interpretation of the data, in this case, might require a double-observer technique (Nichols et al., 2000). However, because the effort involved in implementing this design in a statistically sound manner is very high, an alternate monitoring variable such as a proportion of area occupied approach might be more desirable. This method is more easily standardizable across observers than counts, allowing program-wide estimates of occupancy to be made with statistically robust confidence limits (MacKenzie et al., 2002; Winchell, 2004). This design can be linked to management by also assessing covariates such as the dominant plant species at sampling points. By making the link to the type of habitat gnatcatchers inhabit, and monitoring the extent of this habitat in the reserve system, an effective link to vegetation management activities can be made. 4.6.4 Identify critical uncertainties and targeted study questions Resolving critical uncertainties is a key feature of the adaptive management process. Because NCCP/HCP monitoring and adaptive management programs start with very little knowledge, they should work proactively to learn about the ecosystem before problems arise. Effective adaptive management goes beyond simply monitoring an ecosystem until an adverse condition occurs and then responding with an appropriate correction. Given the high variability in abundance of some species and the high level of uncertainty about causes and appropriate management actions, a species could go extinct by the time that 1) a negative trend is statistically discernable, 2) the cause of the trend is discovered, 3) an action to correct the problem is identified, and 4) the action is implemented. In adaptive management, monitoring is used not only to detect changes but also to discern potential causes of change. The program may also employ short-term targeted studies or establish adaptive management experiments to more effectively resolve critical uncertainties. Typical uncertainties that NCCP/HCPs confront include:
• Critical gaps in knowledge of range and distribution of covered species, their specific habitat requirements and the pressures that affect them.
• Uncertainties about the relationships between the various NCCP vegetation communities and the ecological processes and pressures that drive system dynamics.
• Critical assumptions behind the conservation strategy that are important to the long-term success of the program – for example, the San Diego Multiple Habitat Conservation

33
Program (MHCP, 2003) assumes that corridors and linkages between reserves will maintain access for top-down predators such as coyotes that control feral cat populations, which in turn prey upon covered species.
• Uncertainties about the most appropriate and cost-effective management strategies to employ.
Conceptual models should be used to identify critical uncertainties and assumptions. These uncertainties should be evaluated to determine their likely influence on decision-making and the level of effort needed to resolve them. Uncertainties that constrain decision-making should be prioritized. Some of these can be resolved quickly while other decision-making is moving forward. Others may take longer to answer, but should be clearly identified in program design if they potentially impact decision-making. Not all uncertainties must be resolved before the program moves forward, but the possible consequences should be understood. Some questions that surface during conceptual model development may be more effectively addressed by targeted studies than by long-term monitoring. For example, the relationships among Coachella Valley ground squirrels (Spermophilus tereticaudus chlorus), vegetation and substrate were hypothesized but untested. A subsequent study suggested modifications to the conceptual model based on where the squirrel was found during surveys (L. Ball and P. Doherty, unpublished data). In a second example, development of the Coachella Valley aeolian sand conceptual model highlighted a critical uncertainty about how far urban development edge effects extended into the reserves and how this would change as urbanization progressed. This uncertainty could affect estimates of how much active core (non-edge) dune habitat remained in the reserves. As a result, the pilot phase of the monitoring program was designed in part to resolve uncertainties regarding edge effects (Barrows, 2003). Similarly, because the lifespan of the southwestern arroyo toad (Bufo californicus) is not known, predictions about how the combination of Loveland Dam water operations and multiple-year drought might affect the toad cannot yet be made with confidence (Madden-Smith et al., 2003). Monitoring programs should approach conventional wisdom with skepticism. Sometimes, ideas are repeated so often that they appear “true.” Conceptual models should be revised and tested by investigating critical assumptions and replacing correlations between variables with more mechanistic understandings of cause-and-effect relationships. Critical relationships in the model that have some degree of uncertainty should be represented as a set of competing hypotheses that, once tested, reduce the uncertainty in that relationship (Nichols, 2001). For example, the disappearance of southwestern pond turtle populations in San Diego County has been suggested to be a response to diseases from introduced pet turtles, competition with introduced pet turtles, degradation of water quality, and loss of upland breeding habitat (Meyer et al., 2003). These should be viewed as competing but not mutually exclusive hypotheses. Methods such as Akaike’s Information Criterion (AIC) can be used to evaluate the relative fit of these different hypotheses to the data (Burnham and Anderson, 2002). 4.6.5 Assess the suite of monitoring variables and any critical uncertainties When the program has identified its monitoring variables and critical uncertainties, it is good to step back and assess the suite of variables and targeted studies from a “big picture” viewpoint, filling in any gaps and eliminating unnecessary redundancies. All program goals should be
34
addressed. Ideally the suite of monitoring and research recommendations should each be clearly linked to conceptual models and be necessary, sufficient, and feasible for meeting their objectives while avoiding unnecessary redundancy. At the conclusion of Step 6, the program should have lists of monitoring variables that will be tracked and critical uncertainties that need to be resolved. The rationale for each should be clear, based on an inspection of the conceptual models for covered species, natural community assemblages, and landscape-level issues. This is a good point to solicit additional review of the conceptual models, as well as the monitoring and targeted study recommendations. 4.7 Step 7. Determine strategy for implementing monitoring Once the monitoring variables and critical uncertainties have been identified, they should be prioritized and organized into a work plan. Good monitoring protocols will need to be identified or developed and statistically robust sampling designs implemented.
Monitoring and research questions should be at least loosely prioritized (e.g., identified as “critical,” “important but not immediately critical,” and “interesting but not high priority” or on some similar continuum). Monitoring and research should also be categorized by the level of effort required. Some uncertainties can be opportunistically resolved as part of other projects. For example, during a species inventory, basic habitat information can also be collected with little increase in effort. One way to create a prioritized list is to have the scientists and managers involved in developing the recommendations individually rank each monitoring and research question according to a priority level between 1 and 5 based upon their opinions. The average rankings can then be used to guide development of a workplan. 4.7.1 Develop a workplan The workplan creates a blueprint for how the program will progress towards its objectives and what the monitoring program will have accomplished at the end of 1, 5, 10 years and beyond. The program should decide which program elements to implement immediately versus 5 years from now, determine the immediate next steps, and identify costs. Examples of workplan tasks include: conducting a basic inventory for various taxa coupled with gathering habitat and pressures information; designing long-term monitoring protocols for species whose distribution, basic life history, and spatial and temporal variation are already understood; collaborating with existing monitoring programs and working to fill gaps in the sampling efforts; and standardizing monitoring protocols across multiple agencies. Staged implementation of the program may be needed to make the best use of funding. Anticipated monitoring and adaptive management tasks and timelines for an NCCP/HCP are shown in Figure 8. This example is general and hypothetical, but it shows how the program needs to be able to evolve through time and how the emphasis on certain tasks will change. 4.7.2 Coordinate with existing programs Once the high priority monitoring variables have been identified, the program should determine where already existing monitoring programs might meet its needs. Existing programs should be assessed based upon: the monitoring objectives of the existing program; appropriateness and

Planning Plan 5 10 15+ Initiated Approved years years years Identify overarching scientific principles (early Steps 1 & 5) Define NCCP/HCP goals and identify scope (Steps 1 & 2) Compile and assess existing background information and data (Step 3) Partition system, create (and revise) conceptual models (Steps 4 & 5) Design conservation strategy (Steps 1 & 5, further defined) Design (and revise) monitoring program and management program (Steps 6-9, revisit Steps 1-5 as necessary) Phase 1: Inventorying resources and identifying relationships (Steps 7-9) Phase 2: Pilot testing of long-term monitoring and resolving critical management uncertainties (Steps 7-9) Phase 3: Implementing long-term monitoring and adaptive management (Steps 7-9) Programmatic review of monitoring and management (Step 9)
Figure 8. Tasks to occur in planning phase and early implementation of an NCCP/HCP. The steps in this document that each task relates to are identified in parentheses. Note that the steps are revisited and increasingly defined as more information becomes available and also to meet the specific needs of the monitoring program. Increasing thickness and density of the dots and line indicates increasing intensity of work by the program.
Plan Development
Plan Implementation
…
35

36
statistical rigor of the sampling design and protocols; timing and frequency of sampling; level of quality assurance in data collection and data management; reporting cycles and access to the data; expected duration of the program; and potential institutional barriers. If no relevant monitoring programs intersect the planning area, the program should still investigate neighboring areas for monitoring programs. Wherever possible, the NCCP/HCP program should consider coordinating with other programs to ensure data compatibility and to allow regional analyses that add value to each of the monitoring programs. If existing monitoring programs are not available, then the program will need to develop its own protocols and sampling designs. 4.7.3 Develop good monitoring protocols A good monitoring protocol should be appropriate for the task and be accurate, reliable, feasible, and cost-effective (Margoluis et al., 1998). Monitoring protocols should be well documented, easily standardized across observers, and either minimize observer bias or allow estimation of bias. A common problem with interpreting monitoring data is uncertainty regarding whether changes in the data reflect actual changes in the population or changes in the observer (Sauer et al., 1994). The program should plan for the protocol to be applied by multiple people and by different people through time. Training to standardize application of the protocol for multiple observers is one way to reduce bias. The National Park Service Inventory and Monitoring Program provides a good description of the elements of a good monitoring protocol (Oakley et al., 2003). Because ecosystem elements such as riverine hydrology, water quality and harvested species such as waterfowl and fisheries have received a great deal of attention, standardized protocols for monitoring them are more widely available. More recently, monitoring protocols for terrestrial biota have been developed and tested. Programs seeking to monitor terrestrial biota might consult the following documents: Ralph et al. (1993), Heyer et al. (1994), Sutherland (1996), Wilson et al. (1996), Elzinga et al. (2001), Krebs (1999), Nur et al. (1999), and Bibby et al. (2000). Other sources for protocols include U.S. Geological Survey, Point Reyes Bird Observatory (www.prbo.org), California State Parks Inventory Monitoring and Assessment Program (http://www.parks.ca.gov/default.asp?page_id=836), National Park Service Inventory and Monitoring Program (http://science.nature.nps.gov/im/monitor/index.htm), and California Department of Fish and Game (http://www.dfg.ca.gov). 4.7.4 Avoid common statistical pitfalls in the development of sampling designs Many authors provide excellent detailed advice on sampling design (Thompson and Seber, 1996; Margoluis et al., 1998; Thompson et al., 1998; Elzinga et al. 2001; Morrison et al., 2001; Thompson, 2002). The following are critical issues and principles: Exploratory vs. hypothesis-testing studies During Phase 1, when very little is known about a system, correlative investigations assessing associations among species, pressures, and habitat characteristics can be very useful. However, it is important that the program move on from these exploratory studies to develop and test a priori hypotheses about the system (Yoccoz et al., 2001). This is because: 1) simple associations and correlation are not sufficient to prove causation— independent hypothesis testing through experiments is needed to confirm patterns found in exploratory studies and 2) given enough time and enough variables, retrospective analyses of a data set may find correlations that are statistically significant but have no biological meaning. In addition, monitoring variables that do

37
not add meaningful information should be dropped and the protocol simplified. Thus the program should avoid the trap of assuming that retrospective analysis will provide conclusive answers – in other words, that the cause of a trend will be discernable from the covariates simultaneously measured (Nichols, 2000; Yoccoz et al., 2001). For example, arroyo toad tadpoles are negatively associated with pools containing crayfish (Procambarus clarkia) at Marine Corps Base Camp Pendleton, but it is unclear if crayfish survive better in pools with characteristics avoided by breeding toads, or if the crayfish eat the tadpoles (Brehme et al., 2004). The answer to this question has very different implications for management and could be resolved with an experiment. Randomization, stratification, and probability-based sampling An approach to data analysis should be determined before a final sampling design is selected and data are collected, preferably in consultation with a statistician. This step hopefully ensures implementation of a sampling design that will allow the data to be used to the maximum extent possible. Non-random selection of sites, use of opportunistic sampling, not accounting for imperfect detection, vague questions and hypotheses, and failure to evaluate statistical power can all lead to a costly reduction in the information extractable from collected data (Morrison et al., 2001). Monitoring costs money and consulting with a statistician before entering the field will improve the return on monitoring resources invested. Balancing a statistically robust sampling design with logistical constraints can be challenging. However, as a basic principle, sampling units should be randomly selected from the target population such that each member of the target population has a non-zero probability of being selected (Olsen et al., 1999; Yoccoz et al., 2001). For example, if the purpose is to measure trends in abundance of California gnatcatchers (Polioptila californica californica) throughout coastal sage scrub habitat in San Diego County, no suitable habitat should be excluded during the sampling unit selection process. If the purpose is instead to measure trends in gnatcatcher populations on publicly owned lands within the county, then the sampling units need only be selected from this subset of the available habitat. Some common biases that occur in sampling unit selection and that should be avoided are:
• Judgment sampling: If sampling only occurs in what are judged “best sites”, then inference can only be made about changes in those “best sites”. This assumes that the researcher knows what the “best sites” are, and can define them in such a way that it is standardizable and reproducible across observers.
• Temporary hotspots: Selecting sampling units in what is “good” habitat today is almost guaranteed to produce a negative trend in a fluctuating environment as the habitat shifts from good to sub-optimal and nearby areas shift from sub-optimal to good. In addition, sites selected in this way cannot be used to infer changes in other areas that were not included in the random sampling process (Anderson, 2001).
• Convenience sampling: If lands are excluded from the random selection of sampling units, then one can only make (at best) weak inferences about them, e.g., if sampling is only done along roads and trails, then one can only draw conclusions about areas along roads and trails. The sampling does not allow for inferences about areas that are distant from roads and trails.

38
One way to help optimize the sampling design is to stratify the randomization process by habitat type or by priority level. For example, if we expect more change and impacts of concern near human developments, we might select fewer units in hard to reach areas of a reserve system. Using this approach, because each area of the reserve has a non-zero probability of being sampled, inferences can be made across the entire reserve system (Olsen et al., 1999). Stratification can also be based upon habitat. For example, if Species B only uses a specific type of oak woodland, then sampling units for that species need only be placed in that type of habitat. Because of their obvious role in sampling design, we recommend that the program develop habitat-species relationships and habitat maps before finalizing long-term sampling schemes. Sampling designs and techniques for analyzing monitoring are continually being developed. Some approaches receiving increased attention are listed in Appendix I. Supplement systematic sampling with opportunistic sampling Opportunistic sampling can add information about species distributions, but should complement, rather than replace, systematic sampling efforts (Gibbs et al., 1999). Examples of opportunistic sampling include miscellaneous road-kill data or species observed during hiking or management activities. When observations are verified as coming from a reliable source and the location is accurately recorded, these data may confirm the continued presence of a species that was not detected during more systematic sampling efforts. Opportunistic sampling can also include data collected during short-term scientific studies (Gibbs et al., 1999). Detection probability of the protocol Rarely are species 100% detectable, even when they are known to be present. Thus, most protocols and analyses should include some estimate of detection probability and/or observer bias (Nichols, 2000; Yoccoz et al., 2001), using methods such as the proportion of area occupied (MacKenzie et al., 2002) or double observer methodologies (Nichols et al., 2000). This is essential if we hope to differentiate trends in species abundance from changes in the detection probability. Replication: Use power analysis to optimize sampling design Before shifting from Phase 2 (pilot monitoring) to Phase 3 (long-term monitoring), a power analysis should be conducted to determine the minimum number of sampling units required to detect a specific decline at acceptable levels of power. Sampling designs with insufficient power will be unable to distinguish true change from the inherent natural variability of the system and thus consume resources without providing useful information. Elzinga et al. (2001) and Anderson (1998) provide a good discussion of power analysis. Thresholds and trigger points Management frequently requests a “threshold” or “trigger” point that will trigger a management response if the monitoring variable (e.g., species abundance or distribution) falls below that level. Such concepts should be used with extreme caution because 1) a great deal of uncertainty exists in establishing appropriate thresholds, 2) managers may assume that no management is required unless this threshold is exceeded, 3) managers may over-react if a threshold is exceeded in times of drought or other natural variation, and 4) managers may be tempted to manage to the threshold, working to maintain abundances at the threshold rather than more biologically-valid goals. Terms such as “confidence limits” or “control limits” are slightly less misleading.

39
However, even if 95% confidence limits for variables are calculated from a baseline data set, the managers must understand that there is nothing “magical” about these numbers. They only tell when current data are different from data collected in the baseline years, not why, or even if this is a concern. These control limits or statistical confidence levels are guides to assist management but do not replace common sense (Atkinson et al., 2003a). For example if new problems emerge, such as the appearance of new non-native plants or predators, managers should not wait until a threshold is exceeded before acting. Take advantage of extreme events as experiments The program should plan to take advantage of extreme circumstances to learn more about system function. Opportunities may be presented by extreme fires, extreme droughts, 500-year flood events, high contaminant levels during first season rains, and accidental breakdown of water pumping facilities. To the extent possible, the program should identify such uncertainties ahead of time, as well as any warning indicators for when such an extreme event might occur, to give management time to prepare personnel, equipment, permits, and funding in advance. 4.8 Step 8. Develop data quality assurance, data management, analysis, and reporting
strategies A new monitoring program must not underestimate the importance and cost of data handling, analysis and reporting. Monitoring information is “wasted if it is not analyzed correctly, archived well, reported timely, or communicated appropriately” (Gibbs et al., 1999). The program should invest in a good data management program. The National Park Service Inventory and Monitoring Program recommends that at least 30% of monitoring funds go to data management and reporting (National Park Service Inventory and Monitoring Program, 2004). Good data management maximizes the utility of the data, making it available for queries by managers and scientists addressing new issues and research questions, while also providing information for the long-term monitoring program. Data generated by regional conservation plan monitoring programs has vast potential value beyond its initial intended uses. Maintaining access to raw data, coupled with metadata describing data collection methods, greatly increases data value and utility. A well-designed data management system also improves the level of quality assurance in the program and provides strong incentives to all program participants to standardize and coordinate protocols. The state of California is developing a multi-taxa, multi-level integrated data management system for monitoring data collected throughout the state that will allow powerful queries by species, study type, habitat or geography. With increasing sophistication in technology, it is possible for data collection entities to maintain a copy of the database and mirror those data in near real-time to a state database while maintaining local control over data entry and corrections. Quality assurance is a critical feature of a long-term monitoring program, if long-term trends are to be reliably assessed. Some elements of quality assurance are listed in Appendix J. Transparent and timely reporting is another feature of an effective adaptive management program. Results from monitoring, adaptive management experiments, and research all need to be reviewed for quality and effectively shared. Information must reach the appropriate audiences in a timely fashion and at an appropriate level of detail. Results that alter conceptual models

40
should be made known to all involved parties, especially results that impact management, show critical assumptions are incorrect, indicate new problems are developing, or suggest historical relationships or correlations are changing. Communication of monitoring and adaptive management results may be accomplished by an effective web interface including a web-accessible database, a regular newsletter or bulletin, technical reports on results of monitoring and targeted studies, progress reports, and scientific publications. Communication can also consist of workshops and field days to share new management techniques and developments, science conferences to discuss what new information has been learned about both the natural resources involved and the success of various management and restoration techniques, and regular meetings for monitoring staff and management staff within and across NCCP/HCP programs. 4.9 Step 9. Complete the adaptive management loop by ensuring effective feedback to
decision-making. An efficient decision support system that feeds information efficiently back into decision-making requires initial planning and adjustment as time goes on. Ensuring that the monitoring results appropriately influence management requires consistent effort from an assigned staff, with adequate funding, and a consistent attitude of getting quality information out to be evaluated, peer-reviewed, and into the hands of decision-makers in a timely fashion. Such a decision support system serves the entire conservation program. Major responsibilities of the decision support system include the following.
• Manage plan implementation including monitoring, management, targeted studies, and the conservation strategy
• Evaluate implementation of monitoring and management projects and targeted studies and the quality and scientific rigor of the results and information gained
• Summarize results into formats useful to decision-makers • Assess how well the program is meeting its objectives; if it is not, then determine why not
and what actions should be taken • Identify emerging issues of concern and appropriate responses • Revise conceptual models based on new data and make recommendations for changes to
conservation strategy, management plans and monitoring program design • Determine when the program should progress from Phase 1 to 2 to 3 (see glossary for
definitions) • Prioritize actions that need to be taken by the monitoring program • Determine when external scientific input will assist the program • Coordinate and integrate external scientific review of the program • Maintain program momentum and progress
An effective decision support system not only improves management within and across reserves but also can improve public and scientific outreach and increase coordination and potential funding opportunities. A well-organized program can attract scientists with external funding as well as contributions and bequests from an interested public.

41
5.0 ADDITIONAL CONSIDERATIONS FOR DESIGNING THE MONITORING PROGRAM
The steps in monitoring program design are generally the same for all regional conservation plans, but the creation of a complete program for entire suites of natural community assemblages, species, and landscape-level issues can occur in several ways. Depending on the resources available, all parts of the program could be developed at once, or designers could prioritize different parts of the program and proceed with developing different elements piece by piece. Regardless, a good monitoring program, in addition to being able to assess progress towards conservation goals, should be:
• Committed to scientific quality, incorporating scientific input and peer review at various levels (programmatic, conceptual models, selection of monitoring variables, protocols, sampling design, analysis, and reports).
• Responsive to management needs. • Inclusive, allowing permittees and stakeholders to have input into the process. • Provided sufficient time and funding to develop the program. Scientists should not be
expected to develop quality monitoring programs in their “spare” time. • Committed to communication and creating an effective information feedback loop.
Some basic suggestions include:
• Have clear program goals and objectives. • Have a specific person (or small group) who is in charge of making the program happen. • Incorporate a diversity of perspectives during design of the monitoring program, e.g., from
scientists in a variety of disciplines, agency personnel, and land managers with applied experience.
• Make sure some “big picture” thinkers are included in the process. • Scientists should be involved in every level of the program. • People are key. Be willing to pay the right people to get the job done. • Dedicated core staff help move the process forward more quickly. • Using trained facilitators or providing facilitation training for some staff can expedite
reaching consensus in workshops and working meetings among technical experts. • Clearly document the decision-making and conceptual models. • Geographic information systems (GIS) and opportunities for computer modeling are
essential. • Identify early targeted research to assist critical decision-making • Rigorous scientific review gives a program credibility and validation.

42
6.0 CONCLUSIONS Regional conservation plans endeavor, through strategic land acquisition and management, to maintain populations of covered species and certain desired ecological conditions, such as biodiversity or natural fire frequency. Well-designed monitoring is needed to assess the success of these programs in meeting their objectives and to provide the information needed to effectively manage them. However, building effective monitoring and adaptive management programs for large-scale multiple species conservation plans is both a science and an art that is still in its infancy. The NCCP/HCPs in southern California are all less than a decade old, with most parts of their monitoring programs now in Phase 1 and only a relative few in Phase 2. Other large-scale resource management programs such as the Comprehensive Everglades Restoration Program, Chesapeake Bay Program, National Park Service Inventory and Monitoring Program, and the Galapagos Islands monitoring program, are all still early in their development, as well. Thus, no one best example exists and monitoring programs should be prepared to learn and evolve through time. This requires an institutional structure and process that remains flexible, but that is committed to scientific rigor and quality results. The success of regional conservation plans depends on their ability to confront the challenges of adaptively managing and monitoring complex ecosystems, including diverse arrays of sensitive species. Developing monitoring and adaptive management programs takes work, funding, dedicated people, and continued scientific input. Although the needs and challenges of each NCCP/HCP are unique, the guidance provided in this document, developed from lessons learned in southern California, should assist in developing strong and defensible monitoring programs that support decision-making. 7.0 ACKNOWLEDGEMENTS We wish to thank Lianne Ball of USFWS, Jerre-Ann Stallcup and Mike White of the Conservation Biology Institute and Cameron Barrows of the Center for Natural Lands Management for their review and comments on various versions of this document. We also wish to thank Clark Winchell, Mark Pavelka, and Will Miller of USFWS, and former USFWS personnel Paul Doherty, for their insights regarding the development of multiple species NCCP/HCP monitoring programs in southern California, many of which were incorporated into the document. We also thank Mary Ann Showers of CDFG for her help with the cover design and photos and Carolyn Marn of the U.S. Geological Survey for her assistance in developing some of the early ideas upon which this document is based.

43
8.0 ACRONYMS BLM U. S. Bureau of Land Management CDFG California Department of Fish and Game CVAG Coachella Valley Association of Governments CVMSHCP Coachella Valley Multiple Species Habitat Conservation Plan GIS Geographic Information System HCP Habitat Conservation Plan MHCP San Diego Multiple Habitat Conservation Program MSCP San Diego Multiple Species Conservation Program MSHCP Western Riverside Multiple Species Habitat Conservation Plan NCCP Natural Community Conservation Plan/Planning NPS U. S. National Park Service SANDAG San Diego Association of Governments USFS U. S. Forest Service USFWS U. S. Fish and Wildlife Service USGS U. S. Geological Survey

44
9.0 GLOSSARY Adaptive management – A scientific approach to resource management that rigorously combines management, monitoring and research to effectively manage complex ecosystems in the face of uncertainty. Adaptive management tackles uncertainty about the system head-on by identifying clear objectives, developing conceptual models of the system, identifying areas of uncertainty and alternative hypotheses, testing critical assumptions, monitoring to provide feedback about the system and actions, learning from the system as actions are taken to manage it, and incorporating what is learned into future actions. Attribute – A generally-stated biological or physical feature of the ecosystem, e.g., precipitation, status of least Bell’s vireo, or extent of least Bell’s vireo habitat. Baseline – Condition of system or variable of interest that provides a standard against which future change of the system is measured. Typically in NCCP/HCP monitoring programs, the baseline is defined by the mean and variability in the system during the first several years after the plan is implemented. However it could also refer to conditions at some point prior to plan implementation. Compliance monitoring – see Implementation monitoring Conceptual model – (1) "Explicit statements of the hypothesized functional relationships underlying management decisions regarding environmental resources." [A Proposal for the Development of a Comprehensive Monitoring Assessment and Research Program, April 24, 1998, page 30]; (2) "A simple non-quantitative model, developed for the purpose of building a consensus regarding the most important ecological elements and linkages that characterize a stressed ecosystem." [Nick Aumen, Conceptual Modeling Workshop, UC Davis, June 17-18, 1998] Conservation strategy – The plan laid out in the NCCP/HCP documents for achieving conservation goals. This includes the number and distribution of acres that will be protected, the design of the reserves, the species “covered” by the plan, the goals for individual covered species, and recommended management activities. Covariate – A variable such as precipitation or air temperature that is used in analyses to explain some of the variance in a variable of interest. For example, if animal detectability is temperature dependent, measuring temperature as a covariate will make it easier to detect population trends or experimental treatment effects. Covered species – Listed and non-listed species that are being conserved and managed under an approved natural community conservation plan and that may be authorized for “take” under the provisions of the plan. Effectiveness monitoring – The measurement of variables that allow the program to assess the success of the HCP/NCCP in meeting its stated biological objectives. This type of monitoring is the focus of this document.

45
Habitats – Areas that provide specific conditions (e.g., temperature, moisture, soils, vegetation, and cover) necessary to support a community of organisms adapted to life under those conditions. Implementation (compliance) monitoring – Tracks the status of plan implementation, ensuring that planned actions are executed, including reserve creation and design, implementation of management activities, and implementation of monitoring activities. Invasive species – A species that is non-native to the ecosystem under consideration and whose introduction causes or is likely to cause economic or environmental harm or harm to human health (Executive Order 13112; http://www.invasivespecies.gov/laws/execorder.shtml). Invasive species can be plants, animals, and other organisms (e.g., microbes). Human actions are the primary means of invasive species introductions. Monitoring – The systematic and usually repetitive collection of information, typically used to track the status of a variable or system. Monitoring variable – Any living or non-living element of the system or human activity that can be measured or estimated that will provide some insight into accomplishment of NCCP/HCP goals and objectives, the functioning of the ecosystem, and/or the effectiveness of management actions (e.g., relative abundance of least Bell’s vireo in riparian areas on NCCP/HCP lands). Natural community – Broad habitat categories or biological communities (e.g., anadromous fish) that are defined in each NCCP/HCP and are provided some level of protection under the plan. These categories typically have some level of acceptance of habitat nomenclature within the scientific community, are consistent with existing electronically mapped habitat data, and have the potential for being affected by the program’s conservation strategy (CALFED Bay-Delta Program, 2000c). Natural community assemblage – Group of one or more natural communities that can be addressed as a unit in the monitoring program design. These communities are typically affected by the same physical and biological process and same general set of pressures. Examples include “floodplain and riparian habitat,” “chaparral, coastal sage scrub and grassland community,” and “lagoons and tidal wetlands.” Non-indigenous species – Also called exotic, invasive, introduced, or non-native species. Plants and animals that originate from geographic regions other than the ones that they are found in and typically from outside of California. They may dominate the local species or have other negative impacts on the environment. They are typically spread to new areas through human activities, either accidentally (Norway rats (Rattus norvegicus) hitched rides aboard ships) or deliberately (Eucalyptus was originally introduced as an ornamental). The principle difference between an “invasive” species and a “non-indigenous” species is invasive species are defined as causing harm. Peer review – External scientific review including at least some review that can be considered independent of the program. Such review is needed for the program’s conceptual models,

46
monitoring recommendations, protocols, sampling design, analysis and reports. A programmatic level of review is also needed that periodically assesses the functioning of the program in meeting its objectives and its level of scientific quality. Phase 1 – First of three phases of monitoring program design and implementation involving inventorying resources and identifying relationships. The main goal of phase one is to determine the baseline condition of the ecological system as a prelude to long-term monitoring program design. This generally involves an inventory of what species, habitats, and other resources are present, their locations and general conditions. Some management can be applied during this phase, but in general this should be limited to actions of known-impact, such as hand-removal of weeds and fence construction to prevent vehicular access. This phase can also be used to develop or test hypothesized relationships between species, habitats, processes and other causes of variation, such as roads or invasive species. Phase 2 – Second of three phases of monitoring program design and implementation involving pilot testing of long-term monitoring and resolving critical management uncertainties. Phase two is characterized by pilot testing long-term monitoring protocols and sampling designs to select cost-effective designs with sufficient statistical power to detect biologically-relevant and management-relevant changes. The pilot phase often progresses through an iterative process, including revisions to protocols and comparisons of multiple methods. In addition, the pilot phase is an opportunity to conduct targeted studies to resolve critical management uncertainties and to refine conceptual models based on emerging information. Phase 3 – Third of three phases of monitoring program design and implementation involving implementing long-term monitoring and adaptive management. Activities include implementation of long-term monitoring protocols and periodic evaluation and refinement of the monitoring program. The program continues to address uncertainties, principally by evaluating responses to management and extreme events. Emerging uncertainties are also addressed and prioritized, such as a new invasive species or identification of a pollution source. Power analysis – A power analysis is conducted to determine the minimum number of sampling units required to detect a specific degree of change at an acceptable level of power (1- β) and significance level (α). “α” is the probability of making a Type I error, i.e., when one concludes that a change (e.g., decline) has occurred when in fact the results are nothing more than randomly occurring variation and no change has occurred. “β” is the probability of making a Type II error, i.e., when one concludes that no change has occurred when in fact a decline is actually happening. A sampling design has greater “power” to detect change when the probability of making a Type II error is low. An α of 0.05 and β of 4*α =0.20 are often used in determining the number of sampling units for environmental studies, but these can be changed depending on the objectives of the study. In management of sensitive species, it may be better to err on the side of giving a false alert of a problem (Type I error) than to fail to detect a negative change (Type II error). Elzinga et al. (2001) and Anderson (1998) provide a good discussion of these tradeoffs. Typically one can increase the power of a sampling design by increasing the number of replicates, by reducing sources of error in the protocol, and by altering the design to better account for known sources of variability in the environment.

47
Pressure – Agents that either promote or inhibit change in the state of the environment. These are also called stressors, threats, or drivers in other programs. Because such agents may have a negative effect on some species while having a positive effect on others, we use pressure as a more neutral term. Pressures can be anthropogenic (e.g., barriers to movement, disturbance, contaminants) or natural (e.g., climate variability, disease outbreaks). Pressures can also include natural constraints such as limited seed dispersal. Regional conservation plan – A large-scale multiple species conservation plan that meets the definition of both a Federal Habitat Conservation Plan under the Endangered Species Act and a state NCCP under the California Natural Community Conservation Planning Act. Examples include the San Diego Multiple Species Conservation Program, the San Diego Multiple Habitat Conservation Program, and the Coachella Valley Multiple Species Habitat Conservation Plan. Riparian – Strip of woodland vegetation adjacent to a natural water course such as a river or stream. State of the environment – The integrated manifestation of ecological processes, biological composition, ecological function, and rates of change that results in the condition of the system at any given time. Stressor – Pressure, threat or a negative source of change to a species, community or system. Targeted study – Also called validation monitoring, cause-and-effect monitoring, and applied research, targeted studies increase effectiveness of management by removing or reducing critical uncertainties, improving knowledge of natural systems under management and applying experimental management treatments.

48
APPENDICES A – J
49
Appendix A. Suggested components of natural community assemblage conceptual models. The suggested components of natural community assemblage models are listed below. These are similar to the components listed for covered species in Box 4, but some of the details differ. The MHCP (2003) and draft CVMSHCP (2004) provide practical examples. NCCP/HCP Objectives
• List NCCP/HCP objectives specific to the natural communities in this assemblage. Natural community assemblage description and background
• Describe each component community within the natural community assemblage. • List covered species found partially or entirely within the natural community assemblage. • Plot the locations of the vegetation communities in this habitat assemblage including other useful
information, e.g., protected land boundaries and land ownership. • Describe vegetation associations and ecological processes specific to this natural community
assemblage. In addition to basic features, such as soil type, climate, slope, aspect, and moisture, to the extent possible describe natural pressures and their return rate. For example, fire and drought influence plant succession and thus the relative distribution of coastal sage scrub, grasslands, and chaparral dominated communities.
• For portions of the model needing greater specificity and detail, consider creating sub-models. The Coachella Valley aeolian sand community process model (Figure 7) can be considered a sub-model of the aeolian sand community model (Figure 6). Other examples of sub-models that might be useful are a food-web models describing the impacts of large carnivores, or models that detail specific threats.
Status and trends
• Identify monitoring programs and historical data relevant to each natural community assemblage. • Describe current status of the natural community assemblage and any known or hypothesized
directional change in the system state, e.g., due to a lack of channel-resetting floods, early successional riparian habitat is decreasing in extent, causing a shift in the composition of riparian bird and small mammal communities.
Pressures, program actions, and their anticipated effects (similar to Box 4)
• Describe anthropogenic and natural pressures (i.e., threats, causes of change) and their hypothesized effects on the natural community assemblage. The hypothesized relationships between the pressures, the state of the species or habitat, and management actions should be explained. Some pressures may occur extremely rarely, such as extreme flood events that may be responsible for current natural community distributions.
• Identify planned or potential management actions and their hypothesized effects. Special issues and critical assumptions (see also Box 4)
• Describe any special issues and critical assumptions that should be included in the model. An example of a critical assumption at the natural community assemblage level is the assumption that the appropriate sand sources and sand movement corridors have been protected to maintain aeolian sands on preserves in Coachella Valley (CVMSHCP, 2004 draft).
Diagram
• Provide a simplified diagram of relationships among natural community assemblage elements and processes (see Figures 6 and 7).

50
Appendix B. Suggested components of landscape-level conceptual models. Models at this level facilitate the consideration of issues that extend beyond any single natural community assemblage or species-specific conceptual model. The components for an overarching landscape-level model will be similar to the natural community assemblage conceptual models. Programs may decide to create separate models for key landscape level issues. Examples of large-scale and special issues that extend beyond any single natural community include:
• Biological corridors, linkages, and maintaining connectivity across the landscape • Comprehensive planning to control non-indigenous plants and animals • Aerial and aquatic contaminants • Public access and recreation • Species that require multiple natural community assemblages (e.g., raptors, bats, large
carnivores) Models for landscape-level issues will vary considerably. For each landscape-level issue:
• Identify the relevant program objectives. • Describe the landscape level issue and relevant background information. • Plot, to the degree possible, the distribution of each special issue on a map that also
includes the natural communities. • Describe the known or hypothesized effect of the issue and estimate the potential
magnitude of the effect in the plan area and the weight of evidence supporting the regional importance of each issue. Because there are so many potential large-scale issues, it is critical to focus resources on issues with greater impacts.
• Estimate the status and trends in these issues. • Evaluate how pressures and program actions will likely influence these issues. • Describe any special assumptions or considerations. Examples of special issues and
critical assumptions at this level include: the assumptions regarding the minimum sizes of reserves needed to maintain native biodiversity and covered species; the need to provide some level of recreational access that precludes removal of all roads and trails; the minimum corridor width needed to maintain movement of different types of species.
• Provide diagrams where helpful.

51
Appendix C. A strategy for linking monitoring of NCCP/HCP covered species with ecosystem monitoring. Below is one of many possible strategies for building conceptual models that link the monitoring of covered species to monitoring of system integrity. The strategy takes advantage of information gathered during the NCCP/HCP plan development process. This strategy uses the species assessments performed as part of the NCCP/HCP planning process, recognizing that some information contained therein is based upon scientific opinion rather than scientific studies and the quality of the information is highly variable. The species assessments are used here to develop draft conceptual models for covered species. The conceptual models for the individual covered species can then be used to develop conceptual models and monitoring recommendations at the natural community assemblage level. The program is then scaled up further to identify models and recommendations at the landscape level. The covered species can then be assessed to determine which are effectively monitored by the monitoring variables identified for the natural community assemblages, and which species require additional focused attention. We assume in using this strategy that covered species assessments collectively provide an initial evaluation of the key pressures affecting the system (e.g., see Figure 6). While covered species are not necessarily the best “indicator” species or the most sensitive species to pressures in the system (Chase et al., 1998, 2000), when programs include large numbers of species, they provide a reasonable starting point for designing natural community assemblage conceptual models. This approach ties the natural community assemblage conceptual models and resulting monitoring and management approach to covered species within that assemblage. Steps C.1-C.12 below are a combination of Steps 5 and 6 in the main document. Complete the models for the covered species Step C.1. Complete the conceptual model descriptions for covered species as necessary (see
Box 4). For some species, the species assessments written as part of the NCCP/HCP provide a reasonable initial conceptual model. Examples include slow-growing species such as Torrey Pine for which the key management action is hypothesized to be protection from development. Species with more complicated relationships with hydrological, geomorphological and ecological processes, such as arroyo toads or salmonids will require more detailed conceptual models.
Step C.2 Identify critical uncertainties for covered species that require targeted studies.
(Wait to develop covered species monitoring recommendations until Step C.10) Build up to models of natural community assemblages Step C.3 Based on habitat affinities identified in Step C.1, group covered species by natural
community assemblages.

52
Step C.4 Identify pressures for natural community assemblages by a) Listing the pressures known or hypothesized to affect covered species in each
natural community assemblage. b) Classifying the pressures as
i) species-specific pressures (e.g., invasive beetle is eating flower heads), ii) general but local pressures (e.g., disturbance, night lighting), and iii) large-scale pressures or off-site pressures (e.g., habitat fragmentation, altered hydrology, altered fire frequency).
c) Identifying additional pressures on this natural community that the covered species evaluation did not reveal.
Note: A similar process should be followed for identifying potential management activities.
Step C.5 Develop a basic conceptual model for each natural community assemblage (see list of model components in Appendix A).
Step C.6 Identify where additional detail will assist the program, and develop additional sub-
models (e.g., vegetation-processes models, food webs, etc.). Step C.7 Based on the natural community assemblage conceptual models, select monitoring
variables, as described in Step 6, and identify and prioritize targeted study recommendations.
Expand to cover landscape-level issues (e.g. affecting multiple natural community assemblages) Step C.8 Determine if an overarching model that encompasses all the natural community
assemblages is needed. If so, develop model of program from a landscape viewpoint, complete with landscape-level pressures and management activities. If only a few additional issues that cut across multiple natural community assemblages exist and a larger model is not helpful, then develop models for these issues (See list of model components in Appendix B).
Step C.9 Identify monitoring attributes and variables, etc., and targeted studies for landscape-
level issues. Identify additional monitoring needs for covered species Step C.10 Determine which covered species are encompassed by monitoring proposed in Steps
C.7 and C.9. Step C.11 If appropriate, adjust monitoring identified in Steps C.7 and C.9 to better meet the
needs of monitoring covered species. Step C.12 Identify additional species-specific monitoring needs for species that are not
adequately monitored by the monitoring identified in C.7. and C.8. For example reptile community monitoring may be sufficient for species like orange-throated whiptails, whereas direct population monitoring is likely needed for rare species like the arroyo toad).

53
Appendix D. Habitat monitoring as a surrogate for species monitoring Monitoring individual species is expensive, while monitoring habitats is relatively inexpensive. Thus, it is tempting for programs to substitute habitat monitoring for species-specific approaches. This type of substitution is especially attractive when the primary threat to a species is thought to be human conversion of habitat to an unsuitable condition. However, using habitat as a surrogate for monitoring a target species requires that: • a relationship between the species and measurable habitat characteristics must be
documented. • the limiting habitat requirements must be known with a high degree of certainty, and habitat
(extent, configuration, structure, and composition) must be the primary factor limiting the species distribution and abundance.
• the target species must be sufficiently abundant and widespread - habitat monitoring is not sufficient for highly vulnerable species with small populations and declining numbers.
• the quantity and condition of its habitat must be quantifiable by mapping or other methods. • the habitat-species relationship must be revalidated occasionally, because conditions may
change and species-habitat relationships are typically based on correlation. Recognizing how difficult it is to fulfill the above requirements for any species, extreme caution should be exercised when using habitat monitoring as a surrogate. Some papers that discuss the challenges of using species-habitat models to predict species presence and population dynamics include Gu and Swihart (2003) and Lawler and Schumaker (2004). Considerable research is needed to document species-habitat associations and under what conditions they are reliably predictable. Because some species are absent from large areas of what appears to be suitable habitat, species-habitat relationships should not be applied beyond the areas where they were developed. In addition, habitat use by species ranging over large areas may be scale-dependent and influenced by landscape characteristics rather than a linear response to habitat area. If there is any suspicion that factors other than habitat availability are threatening populations, habitat should not be used as the sole surrogate. For example, monitoring habitat as a surrogate for the status of western spadefoot toad (Spea hammondii) assumes that factors such as invasive species, contaminants, and disease do not strongly influence populations. Such assumptions must be supported by data and periodically be reevaluated. In urbanizing landscapes where remaining habitats are likely to be subjected to new pressures, habitat area will be a less reliable surrogate. Instead, we recommend monitoring that addresses both habitat and the target species in concert.

54
Appendix E. Characteristics of good monitoring variables (Adapted from Margoluis et al., 1998; Gibbs et al., 1999; Pawley, 2000; Bisbal, 2001; Carolyn Marn, personal communication). Relevant to Management * Relevant to program goals and objectives; can assess program performance * Relevant to adaptive management process * Appropriate spatial scale * Appropriate temporal scale
Scientifically Defensible * Biologically pertinent, reflects status and dynamics of system under management * Sufficient scientific basis, supported by published scientific findings or conceptual models
Statistically Powerful and Interpretable * Directly related to the ecosystem component it is intended to represent or is an acceptable
surrogate * Sensitive to changes in the ecosystem component it represents * Indicates cause of change as well as existence of change * Timely, relevant to management timeframe * Anticipatory, serves as an early warning of change * Responsive across necessary range of stress, i.e., provides continuous assessment over wide
range of stress (does not “level off”) or complements other monitoring variables to achieve necessary range
* Known statistical properties, with baseline data, reference or benchmark available Measurable and Feasible * Technically feasible; measurable using standard methodologies * Accurate and precise, with low observer variability and bias * Cost effective * Low impact to system being monitored * Low risk to field personnel
Coordinated with Existing Programs and Data Sets * Compatible with already existing monitoring programs’ data collection, or could be modified
to be so * If data exist, they are obtainable, preferably as long-term data sets
Easily Understood * Simple, direct * Communicable, easily interpreted and explained * Documented; methodology supported by complete standard operating procedures

55
Appendix F. Species-level monitoring variables. Variables are listed in order of increasing level of investment and data resolution (adapted from Sierra Nevada Framework (USFS, 2001)).
Monitoring Variable Definition Presence in study area Some species may be hypothesized to have been extirpated from part or all of a study
area. The first priority for these species will be detection. Habitat as surrogate Depending on the priority level of a species and the expected pressures, habitat extent
distribution, and condition may be used as a surrogate for monitoring the species directly. However, a great deal of uncertainty exists in doing so and the assumptions involved should be clearly documented and reassessed periodically. Typically there are insufficient data to allow confident monitoring of populations via habitat (see Appendix D).
Number of populations Number and location of populations can be a useful metric for rare plants and animals, especially when the coefficient of variation in the number of individuals per population is very high.
Distribution (Range) Distribution data consist of changes in locations of species occurrence across a region. Changes can occur around edges of species range, in association with pressures, or with appearance or disappearance of populations. Boundary mapping is sometimes used to measure change.
Occupancy Target value is typically the proportion of sampling units occupied by the species. A species may maintain the same distribution, while the proportion of occupied habitat changes. When the detection probability of a protocol is less than one, better estimates are achieved using proportion of area occupied (PAO) statistics that use repeat visits to estimate the detection probability.
Relative Abundance Relative abundance is an index of abundance derived using a specific protocol. Catch per unit effort, timed surveys, timed bird point counts, transect surveys are all different indices of relative abundance. Results derived using different protocols are not directly comparable.
Population Size or Absolute Abundance
Population size is a direct estimate of the number of individuals. For very rare species, an absolute count (census) of the population size is possible. Where a complete census is not possible, methods such as mark/recapture and line-distance sampling provide estimates of absolute abundance.
Apparent Recruitment “A qualitative or semi-quantitative measure of key stage classes for plants, often including an assessment of the proportion of the population appearing to be composed of juveniles.” (USFS, 2001)
Reproductive Success “Reproductive success can be measured a variety of ways, depending on the species and sampling method. Reproductive success is most often pursued for bird species, where the number of eggs and fledglings can be readily enumerated to calculate number of young produced per adult. It is also described for some taxa in terms of the proportion of females reproducing. However, an index of the number of young produced per adult or breeding pair can be derived for most species.” (USFS, 2001)
Population Structure and Dynamics
“Many measures of population growth and structure are available for use in monitoring. They range from individual attributes of a population (e.g., age ratios, sex ratio) to derived rates of change (e.g., mortality rates, fecundity rates, growth rates)” (USFS, 2001) to population genetic structure.
Population condition (in association with other monitoring)
A sample of individuals is captured or otherwise inspected and their condition determined relative to issues, e.g., tissue contamination index, parasite loads, symptoms of disease. The proportion showing signs of impaired condition is then used to monitor population condition.

56
Appendix G. Natural community assemblage monitoring variables. Below are examples of the types of monitoring variables often suggested as indicators of natural community assemblage condition. Such examples are for illustration purposes only and are not what would necessarily be chosen to monitor for a specific program. Programs should not skip the steps of model development and identifying testable questions. Some monitoring variables require research, such as identifying which species are “stress-sensitive species” vs. “stress-tolerant species.” In general, prior to adopting any indicator, field verification and fine-tuning in the system of interest is required. Definitions are not provided for each suggested measure, but key references have been cited where possible. Community composition variables : Where protection of biological diversity is a goal, community-level monitoring is needed to evaluate success. This topic has been addressed in detail in the scientific literature, but ultimately the approach taken will depend on the goals of the conservation program.
• Native species richness – estimate of the number of species in an area (Krebs, 1999). • Measures of similarity and association based on species presence or abundance can be
used to compare community composition with a baseline condition or reference site (Krebs, 1999; Morrison et al., 2001).
• Presence, abundance, biomass, capture rate, or proportional capture rate of - guilds or functional groups (e.g., in songbirds: ground gleaners, foliage gleaners,
aerial hawkers; in planktonic communities: phytoplankton, microzooplankton, mesozooplankton).
- key species, for example focal species (keystone, umbrella, and/or engineer species (Noon, 2003)), at-risk species (legally protected species and otherwise sensitive species (Noon, 2003)), community indicator species, habitat indicator species, economic species, pest species (Goals Project, 1999).
- stress-sensitive versus tolerant species, e.g., urban-phobic versus urban-philic species, disturbance tolerant versus disturbance-sensitive species.
- native versus non-native species. • Index of Biotic Integrity (IBI): Using reference systems of known-condition or integrity,
a diversity-based index of biotic integrity is developed. This IBI can then used to assess the condition of other systems based on a diversity-based score (Noss et al., 1997; National Research Council, 2000).
Vegetation structure and function variables In many systems wildlife and plants of interest depend critically on local vegetation structure. Monitoring vegetation may provide early indication of changes that are known or hypothesized to be detrimental, e.g., weeds or community succession.
• Estimation of absolute and relative abundance (or cover) of native and non-native species using standard vegetation survey methods. This is the most time and labor-intensive approach to vegetation monitoring.
• Shrubland vegetation structure metrics (percent cover, canopy height, percent shrub cover, percent tree cover, percent grass and forb cover, percent of specific vegetation series species, patchiness of vegetation cover, soil type, litter depth).

57
• Forest vegetation structure metrics: frequency distribution of seral stages (age classes) for each community type and across all types; woody stem density in various size (dbh) classes; average, range and diversity of tree ages or sizes in stand; tree species diversity; productivity; canopy density and size and dispersion of canopy openings; foliage-height profiles; abundance and density of key structural features, e.g., snags and downed logs; crown condition; physical damage to trees (Noss et al., 1997; National Research Council, 2000).
• Photo plots: Photos taken from fixed reference points can provide a qualitative and sometimes a quantitative assessment of changes in the environment (MacDonald and Smart, 1992). Photos should be recorded at the same time of year, in the same direction, etc.
Ecological function Although conceptually attractive, monitoring general ecological function is rare unless there is an obvious connection to issues of value to humans.
Terrestrial • Energetics/productivity – biomass, carbon storage, net primary production, productivity
(National Research Council, 2000). Productivity is more clearly of interest in extraction systems such as working forests.
• Fires and other disturbances – frequency, return interval or rotation period of fires or other disturbances, location and areal extent, will influence the diversity, abundance and distribution of vegetative communities and associated wildlife (Noss et al., 1997).
• Soil stability and erosive resistance, slumping – early successional species may require landslides.
• Weather (precipitation, high-low-average temperature, humidity, evapotranspiration index).
Aquatic • Streams/rivers - Stream flow and stage (height), stream flow hydrographs, frequency and
extent of floodplain inundation • Channel migration, bank and channel stability and erosive resistance, stream cross-
sectional area • Water quality – water clarity/turbidity, conductivity, temperature, pH, dissolved oxygen,
organic carbon, nutrients, contaminants • Biological Oxygen Demand (BOD) • Sediment quality – composition and grain size, total organic carbon, nitrogen, sulfides,
pH, contaminants

58
Appendix H. Landscape-level monitoring variables. Below are examples of variables that might be used to monitor landscape-level issues that affect multiple natural community assemblages or otherwise cross-cutting issues. Such examples are for illustration purposes only and are not what would necessarily be chosen to monitor for a specific program. Programs should not skip the steps of model development and identifying testable questions. Extent and distribution of habitats across landscape
• Extent, distribution and location of protected lands and land uses (natural, agricultural, disturbed, urban, military, etc.).
• Extent and distribution of natural communities and natural community assemblages. • Extent of core habitat (e.g., >500 m from roads or development), because many species of
concern do not survive or reproduce well when subject to disturbance or other edge effects (Noss et al., 1997; Rutledge, 2003).
Fragmentation, connectivity, measures of patch characteristics and dispersion • Patch characteristics and dispersion measures – inter-patch distance (mean, median,
range) for various natural community assemblages; patch density; number of patches; patch size frequency distribution; nearest neighbor (Noss et al., 1997; Rutledge, 2003).
• Road density inside reserves and in total planning area (Noss et al., 1997). • Studies to assess animal movement across barriers or through hypothesized corridors. Use
radio-tracking or marked animals, or possibly develop genetic markers to assess gene flow indirectly.
Invasive species
• Range, rate of spread, distribution and size of populations of key non-indigenous plant species, (e.g., Arundo donax, Tamarisk spp., perennial pepperweed, purple loosestrife, water hyacinth, ice-plant, yellow star-thistle, pampas grass, non-native annual grasses) and non-native fauna (e.g. fire ants, Argentine ants, bull-frogs, African clawed frogs, crayfish, non-native fish, non-native foxes, non-native turtles, feral cats and dogs ).
• Detection of new species at common introduction points, e.g., plant nurseries for fire ants, trails for yellow-star thistle, international shipyards for aquatic organisms in estuaries.
• Maintain information clearinghouse to report new invasive species established in region and provide information on invasive species status, ecology, and control methods.
Large-scale or widely-distributed pressures • Fires and other disturbances – frequency, return interval or rotation period of fires or
other disturbances, location and areal extent (Noss et al., 1997). • Location and severity of potential pressures on system, e.g., dams and impoundments,
water diversions, sources and distribution of contaminants, etc. • Intensity of human recreation use or other land uses, e.g., livestock stocking rates.

59
Appendix I. Sampling design approaches that are receiving increased attention Sampling designs and analysis techniques for monitoring species are continually being developed. Some approaches receiving increased attention include: Mark-Recapture: Use of mark-recapture methods allows estimation of true population abundance, detection probabilities, mortality rates, and confidence limits on these parameters. User-friendly software allowing sophisticated analysis of mark-recapture data is available free of charge. Program MARK, available from Colorado State University at http://www.cnr.colostate.edu/~gwhite/software.html, is the current industry standard (White and Burnham, 1999). Other useful biological analysis statistical software is available at the USGS Patuxent website at http://www.mbr-pwrc.usgs.gov/software/. Proportion of area occupied (PAO): Useful for species where population size cannot be reliably estimated or is highly variable, but detection is possible. For species with detection probability of less than one, this method involves repeat visits to sites to estimate the detection probability of the protocol and the true proportion of occupied sampling units with estimates of error that can be used in statistical calculations. The method is being utilized by the U.S. Geological Survey’s Amphibian Research and Monitoring Initiative (http://armi.usgs.gov/monitoring.asp) (MacKenzie et al., 2002). Adaptive cluster sampling: This method utilizes randomized sampling to locate a population, but once a population is located an estimate of population size is made. This technique is especially useful for aggregated species such as schooling fish and many rare plants (Thompson and Seber, 1996). Model selection approaches: Multiple competing hypotheses or models are ranked according to how well they fit the available data (Anderson et al., 2001; Burnham and Anderson, 2002; Johnson and Omland, 2004). Adaptive monitoring: When an apparent decline is detected, monitoring intensity increases and then intensity decreases when a population returns to the range of naturally occurring variation (Smit, 2003).

60
Appendix J. Quality assurance plan Maintaining the quality of data collection, data management, and data interpretation is challenging, yet essential for the success of a long-term program. Some elements of quality assurance include:
• Develop and use protocols that allow easier standardization across observers and through time (i.e., minimize observer bias or provide an estimate of observer bias such as through double-observer methods).
• Standardize units and nomenclature so that everyone uses the same names to mean the same thing (for example Point Loma could be recorded as “Point Loma”, “Loma”, Pt. Loma, or “Cabrillo National Monument” by different observers). A good database design that limits naming options can greatly reduce this problem.
• Field test protocols, data recording and record-keeping techniques before expanding use to a large project.
• Maintain and distribute current written descriptions of the objectives of the monitoring program, protocols, units used, recording and QA/QC procedures, and answers to commonly asked questions. Field personnel should understand the “why” of the protocol as well as “what” they need to do.
• When dealing with multiple observers, hold regular training sessions to standardize methods across observers and through time.
• Develop good data recording techniques that minimize errors and forgotten fields. • Have field observers double-check their data, preferably the same day. • If data are recorded on paper and then entered into a computer, all entries should be
double-checked. • Have a supervisor or data manager check the data regularly for obvious errors (the data
management system can also be designed to flag obvious outliers for checking, like an observation that was entered in centimeters rather than millimeters). Data should be reviewed daily when observers are new and regularly after that. Review of data should not be left to the end of the field season.
• Maintain information on who collected the data, entered the data in the database, etc. (chain of custody).
• If data are being maintained in multiple places, e.g., a local database and a regional database, steps must be taken to ensure that only one version of the data is kept in existence and that updates that are made locally are quickly transferred to the regional database.
• Maintain adequate metadata along with the database. • Develop security measures for the database so that the appropriate people have access to
and the ability to change the appropriate level of data. • Track the level of QA/QC associated with a given set of data and make sure that end
users are aware of the QA/QC status. • Maintain connection between those people who analyze and interpret the data and the
people who collect the data in the field. • Regularly backup data and maintain backups at off-site location.
61
REFERENCES
Anderson, D. R. 2001. The need to get the basics right in wildlife field studies. Wildlife Society Bulletin. 29:1294-1297.
Anderson, D. R., K. P. Burnham, and G. C. White. 2001. Kullback-Leibler information in
resolving natural resource conflicts when definitive data exist. Wildlife Society Bulletin. 29:1260-1270.
Anderson, J. L. 1998. Errors of inference. In: Statistical Methods for Adaptive Management
Studies by V. Sit and B. Taylor (editors). Res. Br.,B.C. Min. For., Res. Br., Victoria, BC, Land Management Handbook. No. 42. pp. 69-88.
Andrewartha, G., and L. C. Birch. 1986. The Ecological Web: More on the Distribution of
Animals. University of Chicago Press, Chicago. Atkinson, A. J., R. N. Fisher, C. J. Rochester, and C. W. Brown. 2003a. Sampling design
optimization and establishment of baselines for herpetofauna arrays at the Point Loma Ecological Reserve. Technical report produced by U.S. Geological Survey- Western Ecological Research Center for National Park Service Cabrillo National Monument. 39 pages.
Atkinson, A. J., C. M. Marn, and B. Fong. 2002. Terrestrial and Amphibious Monitoring Plan for
the CALFED Bay-Delta Program. Technical Report produced by the U.S. Geological Survey Western Ecological Research Center for the CALFED Bay-Delta Program. 432 pages. URL: http://www.werc.usgs.gov/sandiego/tamp2002.html
Atkinson, A. J., B. S. Yang, R. N. Fisher, E. L. Ervin, T. J. Case, N. J. Scott, and H. B. Shaffer.
2003b. MCB Camp Pendleton arroyo toad monitoring protocol: 1. Summary of results from a workshop on August 26, 2002, 2. Monitoring protocol and targeted studies. Technical report produced by U.S. Geological Survey- Western Ecological Research Center for Marine Corp Base Camp Pendleton. 42 pages. URL: http://www.werc.usgs.gov/sandiego/pdfs/MCB-protocol-3-2003.pdf
Ball, L. C. 2002. A strategy for describing and monitoring bat habitat. Journal of Wildlife
Management. 66:1148-1153. Barrows, C. W. 1996. An ecological model for the protection of a dune ecosystem. Conservation
Biology. 10:888-891. Barrows, C. W. 2003. Sand Community Monitoring, 2003. Power point presentation given at the
meeting of the Biological Monitoring Project of the Coachella Valley Multiple Species Habitat Conservation Plan/Natural Community Conservation Plan in Palm Desert, CA on November 6, 2003.

62
Beier, P. 1993. Determining minimum habitat areas and habitat corridors for cougars. Conservation Biology. 7:94-108.
Bertram, P., and N. Stadler-Salt. 2000. Selection of indicators for Great Lakes Basin ecosystem
health, version 4. Report prepared for the State of the Lakes Ecosystem Conference. March 2000. 31 pages. URL: http://www.on.ec.gc.ca/solec/indicators2000-e.html
Bibby, C. J., N. D. Burgess, D. A. Hill, and S. Mustoe. 2000. Bird Census Techniques, 2nd
edition. Academic Press, London, England. 302 pages. Bisbal, G. A. 2001. Conceptual design of monitoring and evaluation plans for fish and wildlife in
the Columbia River ecosystem. Environmental Management. 28:433-453 Brehme, C. S., A. J. Atkinson, and R. N. Fisher. 2004. MCB Camp Pendleton arroyo toad
monitoring results, 2003. Technical report produced by U.S. Geological Survey- Western Ecological Research Center for Marine Corp Base Camp Pendleton. 95 pages.
Burnham, K. P., and D. R. Anderson. 2002. Model Selection and Multimodel Inference: A
Practical Information-theoretic Approach, 2nd edition. Springer-Verlag, New York. 488 pages.
Busch, D. E. and J. C. Trexler (editors). 2003. Monitoring Ecosystems: Interdisciplinary
Approaches for Evaluating Ecoregional Initiatives. Island Press. Washington, D.C. 447 pages.
CALFED Bay-Delta Program. 2000a. Ecosystem Restoration Program Plan Strategic Plan for
Ecosystem Restoration. Final Programmatic EIS/EIR Technical Appendix. July 2000. URL:http://calwater.ca.gov/Programs/EcosystemRestoration/EcosystemVol3RestorationPlan.shtml
CALFED Bay-Delta Program. 2000b. Recommendations for the implementation and continued
refinement of a comprehensive monitoring, assessment, and research program. Final Programmatic EIS/EIR Technical Appendix. July 2000. URL: http://calwater.ca.gov/CALFEDDocuments/Final_EIS_EIR.shtml
CALFED Bay-Delta Program. 2000c. Multi-Species Conservation Strategy. Final Programmatic EIS/EIR Technical Appendix. July 2000. URL:http://calwater.ca.gov/Programs/EcosystemRestoration/EcosystemMultiSpeciesConservationStrategy.shtml
California Resources Agency. 2002. Environmental protection indicators for California.
281 pages. URL: http://www.oehha.ca.gov/multimedia/epic/Epicreport.html Case, T. J., and R. N. Fisher. 2001. Measuring and predicting species presence: coastal sage
scrub study. In: Spatial Uncertainty in Ecology. Editors: C. Hunsaker. M. Goodchild, M. Friedl, and T. Case. Springer-Verlag, New York. pp 47-71.

63
Chase, M. K., W. B. Kristan III, A. J. Lynam, M. V. Price, and J. T. Rotenberry. 2000. Single
species as indicators of species richness and composition in California Coastal Sage Scrub birds and small mammals. Conservation Biology. 14:474-487.
Chase, M. K., J. T. Rotenberry, and M. D. Misenhelter. 1998. Is the California gnatcatcher an
indicator of bird-species richness in coastal sage scrub? Western Birds. 29:468-474. Christensen, N. L, A. Bartuska, J.H. Brown, S. Carpenter, C. D’Antonio, R. Francis, J. F.
Franklin, J. A. Mac Mahon, R. F. Noss, D. J. Parsons, C. H. Peterson, M. G. Turner, and R. G. Woodmansee. 1996. The Report of the Ecological Society of America Committee on the Scientific Basis for Ecosystem Management. URL: http://www.fs.fed.us/eco/ecmtext.htm
CVMSHCP. 2004. Public Review Draft. Coachella Valley Multiple Species Habitat
Conservation Plan/Natural Community Conservation Plan (CVMSHCP/NCCP). Administered by Coachella Valley Association of Governments (CVAG). Available from URL: http://www.cvmshcp.org/
DeMaynadier, P., and M. Hunter, Jr. 1997. The role of key ecosystems in landscapes. In:
Ecosystem Management: Applications for Sustainable Forest and Wildlife Resources. Editors: M. S. Boyce and A. Haney. Yale University Press, New Haven, CT. 361 pages.
Elzinga, C. L., D. W. Salzer, J. W. Willoughby, and J. P. Gibbs. 2001. Monitoring Plant and
Animal Populations. Blackwell Science, Inc., Malden, Massachussetts. 360 pages. Ernest, H. B., W. M. Boyce, V. C. Bleich, B. May, S. J. Stiver, and S. G. Torres. 2003. Genetic
structure of mountain lion (Puma concolor) populations in California. Conservation Genetics. 4:353-366.
Fisher, R. N., A. V. Suarez, and T. J. Case. 2002. Spatial patterns in the abundance of the coastal
horned lizard. Conservation Biology. 16:205-215. Fourqurean, J. W., and L. M. Rutten. 2003. Competing goals of spatial and temporal resolution
monitoring seagrass communities on a regional scale. In: Monitoring Ecosystems: Interdisciplinary Approaches for Evaluating Ecoregional Initiatives. Edited by D. E. Busch and J. C. Trexler. Island Press, Washington, D.C. pp. 257-288.
Gibbs, J. P., H. L. Snell, and C. E. Causton. 1999. Effective monitoring for adaptive wildlife
management: Lessons from the Galapagos Islands. Journal of Wildlife Management 63:1055-1065.
Goals Project. 1999. Baylands ecosystem habitat goals. A report of habitat recommendations
prepared by the San Francisco Bay Area Wetlands Ecosystem Goals Project. U. S. Environmental protection Agency, San Francisco, CA and S. F. Bay Regional Water Quality Control Board, Oakland, CA. 294 pages.
64
Gu, W., and R. K. Swihart. 2003. Absent or undetected? Effects of non-detection of species
occurrence on wildlife–habitat models. Biological Conservation. 116:195-203. Heyer, W. R., M. A. Donnelly, R. W. McDiarmid, L. C. Hayek, and M. S. Foster. 1994.
Measuring and Monitoring Biological Diversity: Standard Methods for Amphibians. Smithsonian Institution Press, Washington, D.C. 359 pages.
Ives, A. R., and B. J. Cardinale. 2004. Food-web interactions govern the resistance of
communities after non-random extinctions. Nature. 429:174-177. Jennings, M. R., and M. P. Hayes. 1994. Amphibian and reptile species of special concern in
California. Technical report. Prepared for California Department of Fish and Game, Inland Fisheries Division, Rancho Cordova, California.
Johnson, J. B., and K. S. Omland. 2004. Model selection in ecology and evolution. Trends in
Ecology and Evolution. 19:101-108. Keane, K. 1999. California least tern breeding survey, 1998 season. Technical report prepared
for the California Department of Fish and Game. Habitat Conservation and Planning Branch report 2000-01. 46 pages. URL: http://www.dfg.ca.gov/hcpb/info/bm_research/bm_pdfrpts/2000_01.pdf
Krebs, C. J. 1999. Ecological Methodology, 2nd Edition. Addison-Welsey Educational
Publishers, Inc., Menlo Park, California. 620 pages. Lambeck, R. J. 1997. Focal species: a multi-species umbrella for nature conservation.
Conservation Biology. 11:849-856. Lawler, J. J., and N. H. Schumaker. 2004. Evaluating habitat as a surrogate for population
viability using a spatially explicit population model. Environmental Monitoring and Assessment. 94:85-100.
Longcore, T., D. D. Murphy, D. H. Deutschman, R. Redak, and R. N. Fisher. 2003. A
management and monitoring plan for quino checkerspot butterfly (Euphydryas editha quino) and its habitats in San Diego County. Advisory report to the County of San Diego. Dec. 30, 2003. 51 pages.
MacDonald, L. H., and A. Smart. 1992. Beyond the guidelines: practical lessons for monitoring.
Invited paper presented at the Workshop on Improving Natural Resource Management through Monitoring, Oregon State University, Corvallis, Oregon, March 10-11, 1992. 17 pages.
MacKenzie, D. I., J. D. Nichols, G. B. Lachman, S. Droege, J. A. Royle and C. A. Langtimm.
2002. Estimating site occupancy when detection probabilities are less than one. Ecology. 83: 2248-2255.

65
Madden-Smith, M. C., A. J. Atkinson, R. N. Fisher, W. R. Danskin, and G. O. Mendez. 2003.
Assessing the risk of Loveland Dam operations to the arroyo toad (Bufo californicus) in the Sweetwater River channel, San Diego County, California. Technical report produced by U.S. Geological Survey- Western Ecological Research Center for Sweetwater Authority. 58 pages.
Margoluis, R., N. Salafsky, and A. Balla. 1998. Measures of Success: Designing, Managing, and
Monitoring Conservation and Development Projects. Island Press. 362 pages. Meyer, K., E. L. Ervin, M. C. Madden-Smith, S. A. Hathaway, and R. N. Fisher. 2003. Arroyo
toad and western pond turtle in the San Diego Multiple Species Conservation Program area, 2002. Technical report produced by U.S. Geological Survey- Western Ecological Research Center for the County of San Diego and California Department of Fish and Game. 34 pages.
MHCP. 2003. Final Multiple Habitat Conservation Plan, Vol. III: MHCP Biological Monitoring
and Management Plan. Prepared by California Department of Fish and Game, U. S. Fish and Wildlife Service, and Conservation Biology Institute for the Multiple Habitat Conservation Program. Administered by SANDAG. March 2003.
URL: http://www.sandag.org/index.asp?projectid=97&fuseaction=projects.detail Morrison, M. L., W. M. Block, M. D. Strickland, and W. L. Kendall. 2001. Wildlife Study
Design. Springer-Verlag New York, Inc. New York, New York. 210 pages. MSCP. 1998. Multiple Species Conservation Program. Final version. Prepared for the San Diego
County Board of Supervisors. 278 pages. URL: http://cosda102.co.san-diego.ca.us//2_bmo/2FinalMSCPProgramPlan.pdf MSHCP. 2003. Western Riverside County Multiple Species Conservation Plan, Volume 1.
Prepared for the County of Riverside, California. URL: http://www.rcip.org/conservation.htm#libraries
Mulder, B. S., B. R. Noon, T. A. Spies, M. G. Raphael, C. J. Palmer, A. R. Olsen, G. H. Reeves,
and H. H. Welsh. 1999. The strategy and design of the effectiveness monitoring program for the Northwest Forest Plan. U.S. Department of Agriculture, Pacific Northwest Research Station, Portland, OR. General Technical Report PNW-GTR-437. URL: http://www.fs.fed.us/pnw/pubs/gtr_437.pdf
National Park Service Inventory and Monitoring Program. Guidance for Designing an Integrated
Monitoring Program. URL: http:// http://science.nature.nps.gov/im/monitor/vsmTG.htm Accessed on May 6, 2004.
National Research Council. 2000. Ecological Indicators for the Nation. National Academy Press,
Washington, D.C. 180 pages.

66
National Research Council. 1990. Managing Troubled Waters: The Role of Marine Environmental Monitoring. National Academic Press. Washington D.C. 125 pages.
New Zealand Ministry for the Environment. 1997. The State of New Zealand’s Environment
1997. URL: http://www.environment.govt.nz/reports/ser.html Nichols, J. D. 2000. Monitoring is not enough: on the need for a model-based approach to
migratory bird management. Pages 121-123 in R. Bonney, D.N. Pashley, R. Cooper, and L. Niles, editors. Strategies for Bird Conservation: The Partners in Flight Planning Process. Proceedings of the 3rd Partners in Flight Workshop, Cape May, New Jersey, October 1-5, 1995. U.S. Forest Service, Rocky Mountain Research Station, Ogden, Utah.
Nichols, J. D. 2001. Using models in the conduct of science and management of natural
resources. pp. 11-34. In: Modeling in natural resource management. (Editors) T. M. Shenk, and A. B Franklin. Island Press. 223 pages.
Nichols, J. D., J. E. Hines, J. R. Sauer, F. W. Fallon, J. E. Fallon, and P. J. Heglund. 2000. A
double-observer approach for estimating detection probability and abundance from point counts. The Auk 117:393-408.
Noon, B. R. 2003. Conceptual issues in monitoring ecological resources. In: Monitoring
Ecosystems: Interdisciplinary Approaches for Evaluating Ecoregional Initiatives. Edited by D. E. Busch and J. C. Trexler. Island Press, Washington, D.C. pp.27-72.
Noss, R. F., M. A. O’Connell, and D. D. Murphy. 1997. The Science of Conservation Planning:
Habitat Conservation under the Endangered Species Act. Island Press, Washington, D.C. 246 pages.
Noss, R. F., and A. Y. Cooperrider. 1994. Saving Nature’s Legacy: Protecting and Restoring
Biodiversity. Island Press, Washington, D.C. 416 pages. Nur, N., S. L. Jones, and G. R. Geupel. 1999. A statistical guide to data analysis of avian
monitoring programs. U. S. Department of the Interior, Fish and Wildlife Service, BTP-R6001-1999, Washington, D.C. 54 pages.
Nyberg, J. B. 1998. Statistics and the practice of adaptive management. In: Statistical Methods
for Adaptive Management Studies by V. Sit. and B. Taylor (editors). Res. Br.,B.C. Min. For., Res. Br., Victoria, BC, Land Management Handbook. No. 42. pp. 1-8.
O’Connell, M. A., and S. P. Johnson. 1997. Improving habitat conservation planning: the
California natural community conservation model. Endangered Species UPDATE. 14:1-3,14.
Oakley, K. L., L. P. Thomas, and S. G. Fancy. 2003. Guidelines for long-term monitoring
protocols. Wildlife Society Bulletin. 31:1000-1003. URL: http://science.nature.nps.gov/im/monitor/protocols/protocolguidelines.pdf

67
Ogden, J. C., S. M. Davis, and L. A. Brandt. 2003. Science strategy for a regional ecosystem
monitoring and assessment program: The Florida Everglades example. In: Monitoring Ecosystems: Interdisciplinary Approaches for Evaluating Ecoregional Initiatives. Edited by D. E. Busch and J. C. Trexler. Island Press, Washington, D.C. pp. 135-163.
Olsen, A. R., J. Sedransk, D. Edwards, C. A. Gotway, W. Liggett, S. Rathbun, K. H. Reckhow,
and L. J. Young. 1999. Statistical issues for monitoring ecological and natural resources in the United States. Environmental Monitoring and Assessment. 54:1-45.
Pawley, A. 2000. Program performance indicators for the CALFED Bay-Delta Ecosystem
Restoration Program. Technical report prepared by The Bay Institute of San Francisco for the CALFED Science Program. 120 pages.
URL: http://www.bay.org/science/Indrpt02.pdf Pollak, D. 2001. The future of habitat conservation? The NCCP experience in southern
California, Part 2 of a series. Prepared by California Research Bureau at the request of Senator Byron D. Sher. June 2001. CRB-01-009. 99 pages. URL:http://www.library.ca.gov/crb/01/09/01-009.pdf
Ralph, J. C., G. R. Geupel, P. Pyle, T. E. Martin, and D. F. DeSante. 1993. Handbook of field
methods for monitoring landbirds. General Technical Report PSW-GTR-144. Albany, CA: Pacific Southwest Research Station, Forest Service, U.S. Department of Agriculture. 41 pages.
RECOVER. 2004. CERP Monitoring and Assessment Plan, Part 1: Monitoring and Supporting
Research. Technical report available from U.S. Army Corps of Engineers, Jacksonville District, Jacksonville, FL and South Florida Water Management District, West Palm Beach FL.
URL: http://www.evergladesplan.org/pm/recover/recover_map_2004.cfm#2004 Rutledge, D. 2003. Landscape indices as measures of the effects of fragmentation: can pattern
reflect process? DOC Science Internal Series 98. Department of Conservation, P.O. Box 10-420, Wellington, New Zealand. 27 pages. Available from http://www.doc.govt.nz
Sauer, J. R., B. G. Peterjohn, and W. A. Link. 1994. Observer differences in the North American
Breeding Bird Survey. Auk. 111:50-62. Smit, A. 2003. Adaptive monitoring: an overview. DOC Science Internal Series 138. Department
of Conservation, P.O. Box 10-420, Wellington, New Zealand. 16 pages. Available from http://www.doc.govt.nz
Stevens, L. E., and B. D. Gold. 2003. Monitoring for adaptive management of the Colorado
River ecosystem in Glen and Grand Canyons. In: Monitoring Ecosystems: Interdisciplinary Approaches for Evaluating Ecoregional Initiatives. Edited by D. E. Busch and J. C. Trexler. Island Press, Washington, D.C. pp. 101-134.

68
Sutherland, W. J. 1996. Ecological Census Techniques: A Handbook. Cambridge University
Press. Cambridge, England. 336 pages. Thompson, S. K. 2002. Sampling, 2nd edition. John Wiley & Sons, Inc. New York, New York.
367 pages. Thompson, S. K., and G. A. F. Seber. 1996. Adaptive Sampling. John Wiley & Sons, Inc. New
York, New York. 265 pages. Thompson, W. L., G. C. White, and C. Gowan. 1998. Monitoring Vertebrate Populations.
Academic Press, Inc. San Diego, CA. 365 pp. USFS. 2001. Sierra Nevada Forest Plan Amendment Final Environmental Impact Statement.
Volume 4, Appendix E. Monitoring and Adaptive Management Plan. URL: http://www.r5.fs.fed.us/sncf/eis/feis/start_here.pdf
U.S. Fish and Wildlife Service. 1994. Endangered and threatened wildlife and plants;
determination of endangered status for the arroyo toad; final rule. Federal Register. 59(241): 64859-64867.
U.S. Fish and Wildlife Service. 1999. Arroyo Southwestern Toad (Bufo microscaphus
californicus) Recovery Plan. U. S. Fish and Wildlife Service. 2000. Availability of a final addendum to the Handbook for
Habitat Conservation Planning and Incidental Take Permitting Process; Notices. Federal Register. 65(106):35242-35257. URL: http://endangered.fws.gov/hcp/final_notice.pdf
Vos, P., E. Meelis, and W. J. Ter Keurs. 2000. A framework for the design of ecological
monitoring programs as a tool for environmental and nature management. Environmental Monititoring and Assessment. 61:317-344.
Walters, C. 1986. Adaptive management of renewable resources. Blackburn press, Caldwell, NJ.
374 pages. Wells, M. L. 2001. Human-altered fire regimes and the development of stand structure in
macrocarpae pines. Ph.D. Dissertation. University of California, Santa Barbara. 149 pages.
White, G. C., and K. P. Burnham. 1999. Program MARK: survival estimation from populations
of marked animals. Bird Study. 46(suppl.):S120-S138. Wilhere, G. F. 2002. Adaptive management in habitat conservation plans. Conservation Biology
16:20-29.

69
Wilson, D. E., F. R. Cole, J. D. Nichols, R. Rudran, and M. S. Foster. 1996. Measuring and Monitoring Biological Diversity: Standard Methods for Mammals. Smithsonian Institution Press, Washington, D.C. 409 pages.
Winchell, C. 2004. A reserve wide survey of local California gnatcatcher populations maintained
by the San Diego Multi-Species Conservation Plan with rapid response to the 2003 fires. A proposal submitted by USFWS, Carlsbad office, California. 20 pages.
Yoccoz, N. G., J. D. Nichols, and T. Boulinier. 2001. Monitoring of biological diversity in space
and time. Trends in Ecology & Evolution. 16:446-453.