Figures reproduced from: Cohen, J., Cohen, P., West, S.G...
11
Transcript of Figures reproduced from: Cohen, J., Cohen, P., West, S.G...
g3jn
Typewritten Text
Figures reproduced from: Cohen, J., Cohen, P., West, S.G., & Aiken, L.S. (2003). Applied multiple regression/correlation analysis in the behavioral sciences (Third Edition). Mahwah, NJ: Erlbaum. Fox, J. (1997). Applied regression analysis, linear models, and related methods. Thousand Oaks, CA: Sage.
_ . __ •• _ ...................""nll 1
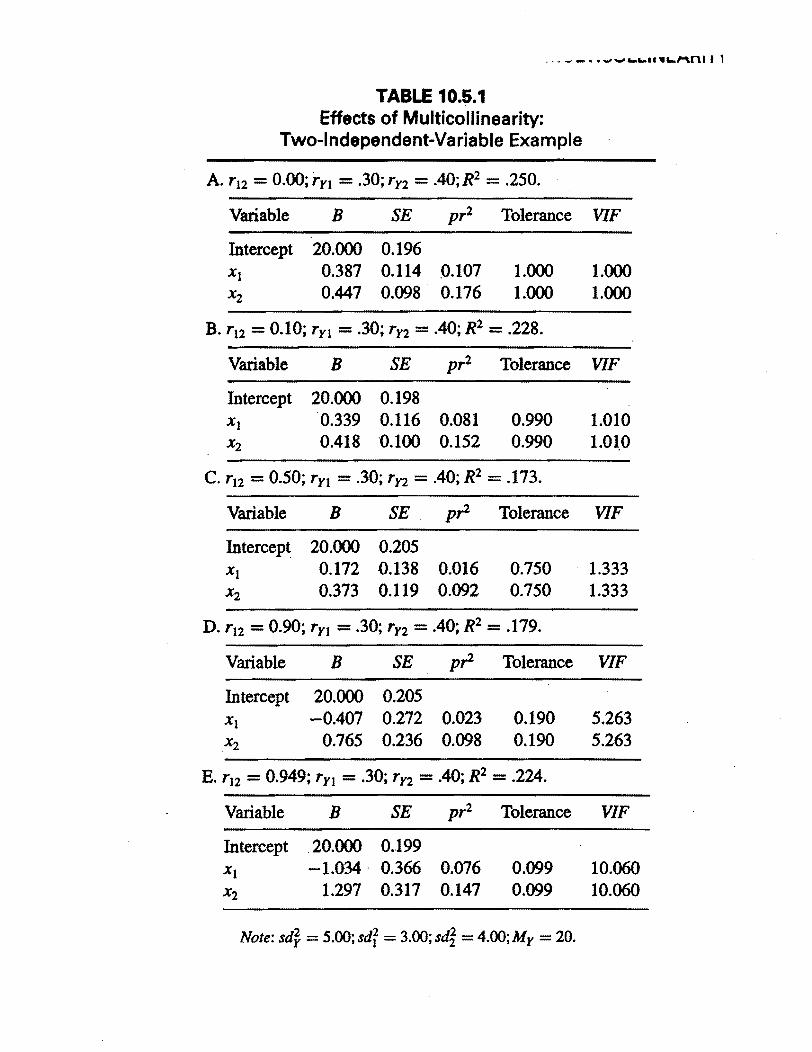
TABLE 10.5.1 Effects of Multicollinearity:
Two-Independent-Variable Example
A. '12 =O.OO;,Yl = .30; 'Y2 =.40; R2 = .250.
Variable B SE p,2 Tolerance VIF
Intercept 20.000 0.196 Xl 0.387 0.114 .0.107 1.000 1.000 X2 0.447 0.098 0.176 1.000 1.000
B. '12 =0.10;,Yl = .30;,Y2 =.40; R2 =.228.
Variable B SE pr2 Tolerance VIF
Intercept 20.000 0.198 Xl 0.339 0.116 0.081 0.990 1.010 X2 0.418 '0.100 0.152 0.990 1.01,0
C"12 =0.50; 'Yl = .30;,Y2 =.40; R2 =.173.
Variable B SE . pr2 Tolerance VIF
Intercept 20.000 0.205 Xl . 0.172 0.138 0.016 0.750 1.333 X2 0.373 0.119 0.092 0.750 1.333
D. '12 =0.90; 'Yl =.30; 'Y2 =.40; R2 = .179.
Variable B SE pr2 Tolerance VIF
Intercept 20.000 0.205 Xl -0.407 0.272 0.023 0.190 5.263 X2 0.765 0.236 0.098 0.190 5.263
E. '12 =0.949; 'Yl = .30; 'Y2 = .40; R2 =.224.
Variable B SE p,2 Tolerance VIF
Intercept .20.000 0.199 Xl -1.034 0.366 0.076 0.099 10.060 X2 1.297 0.317 0.147 0.099 10.060
Note: sd; =5.00; sdr =3.00; sdi =4.00; My =20.