Figures of Catalonia 2015
5
www.idescat.cat Figures of Catalonia Generalitat de Catalunya Government of Catalonia
-
Upload
miqui-mel -
Category
News & Politics
-
view
48 -
download
2
Transcript of Figures of Catalonia 2015
www.idescat.cat
Figures of Catalonia
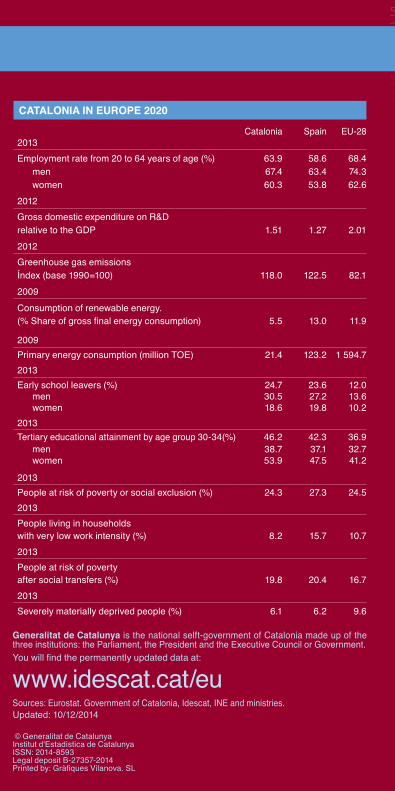
CATALONIA IN EUROPE 2020
Catalonia Spain EU-282013Employment rate from 20 to 64 years of age (%) 63.9 58.6 68.4
men 67.4 63.4 74.3women 60.3 53.8 62.6
2012Gross domestic expenditure on R&D relative to the GDP 1.51 1.27 2.012012Greenhouse gas emissionsÍndex (base 1990=100) 118.0 122.5 82.12009Consumption of renewable energy.(% Share of gross final energy consumption) 5.5 13.0 11.9
2009Primary energy consumption (million TOE) 21.4 123.2 1 594.72013Early school leavers (%) 24.7 23.6 12.0
men 30.5 27.2 13.6women 18.6 19.8 10.2
2013Tertiary educational attainment by age group 30-34(%) 46.2 42.3 36.9
men 38.7 37.1 32.7women 53.9 47.5 41.2
2013People at risk of poverty or social exclusion (%) 24.3 27.3 24.52013People living in households with very low work intensity (%) 8.2 15.7 10.72013People at risk of poverty after social transfers (%) 19.8 20.4 16.72013Severely materially deprived people (%) 6.1 6.2 9.6
Generalitat de Catalunya is the national selft-government of Catalonia made up of the three institutions: the Parliament, the President and the Executive Council or Government. You will find the permanently updated data at: www.idescat.cat/euSources: Eurostat. Government of Catalonia, Idescat, INE and ministries.Updated: 10/12/2014
© Generalitat de CatalunyaInstitut d'Estadística de CatalunyaISSN: 2014-8712Legal deposit B-27356-2014Printed by: Gràfiques Vilanova. SL
Generalitat de CatalunyaGovernment of Catalonia
Belgium
Slovakia
France
Spain Catalonia
Portugal
Ireland
Poland
Lithuania
Latvia
Estonia
Finland
Sweden
Denmark
Czech Rep.
Austria Hungary
SloveniaRomania
Greece
Bulgaria
Luxembourg
Cyprus
Italy
Malta
UnitedKingdom
Netherlands
Croatia
Germany
% %5 4 3 2 1 0 0 1 2 3 4 5
0 - 4
5 - 9
10 - 14
15 - 19
20 - 24
25 - 29
30 - 34
35 - 39
40 - 44
45 - 49
50 - 54
55 - 59
60 - 64
65 - 69
70 - 74
75 - 79
80 - 84
85 and over
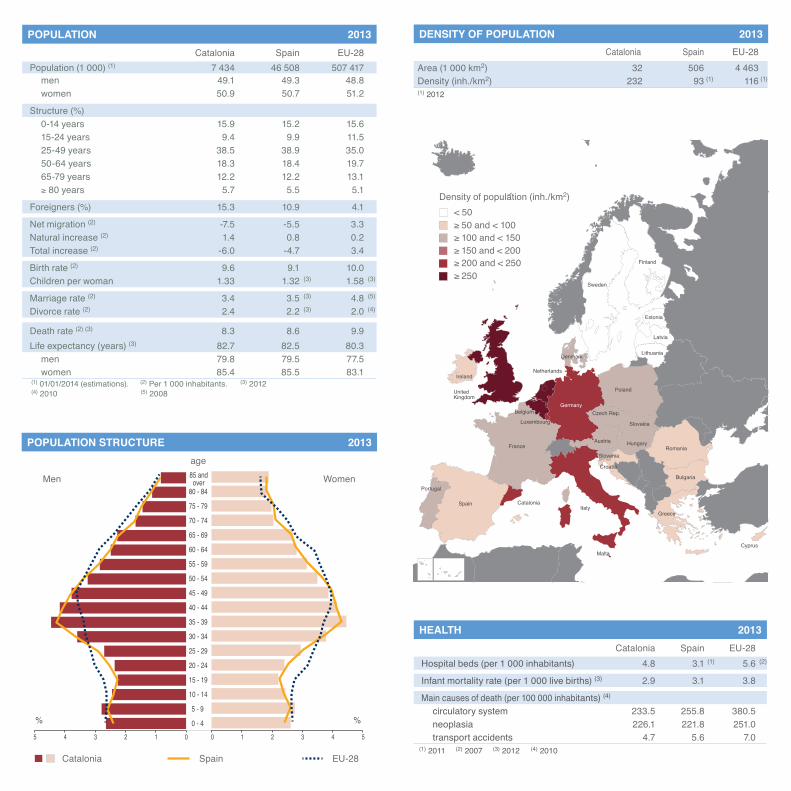
DENSITY OF POPULATION 2013
POPULATION STRUCTURE 2013
Catalonia EU-28Spain
POPULATION 2013Catalonia Spain EU-28
Population (1 000) (1) 7 434 46 508 507 417men 49.1 49.3 48.8women 50.9 50.7 51.2
Structure (%)0-14 years 15.9 15.2 15.615-24 years 9.4 9.9 11.525-49 years 38.5 38.9 35.050-64 years 18.3 18.4 19.765-79 years 12.2 12.2 13.1≥ 80 years 5.7 5.5 5.1
Foreigners (%) 15.3 10.9 4.1
Net migration (2) -7.5 -5.5 3.3Natural increase (2) 1.4 0.8 0.2Total increase (2) -6.0 -4.7 3.4
Birth rate (2) 9.6 9.1 10.0Children per woman 1.33 1.32 (3) 1.58 (3)
Marriage rate (2) 3.4 3.5 (3) 4.8 (5)
Divorce rate (2) 2.4 2.2 (3) 2.0 (4)
Death rate (2) (3) 8.3 8.6 9.9Life expectancy (years) (3) 82.7 82.5 80.3
men 79.8 79.5 77.5women 85.4 85.5 83.1
(1) 01/01/2014 (estimations). (2) Per 1 000 inhabitants. (3) 2012(4) 2010 (5) 2008
Catalonia Spain EU-28Area (1 000 km2) 32 506 4 463Density (inh./km2) 232 93 (1) 116 (1)
(1) 2012
Men Women
HEALTH 2013Catalonia Spain EU-28
Hospital beds (per 1 000 inhabitants) 4.8 3.1 (1) 5.6 (2)
Infant mortality rate (per 1 000 live births) (3) 2.9 3.1 3.8
Main causes of death (per 100 000 inhabitants) (4)
circulatory system 233.5 255.8 380.5neoplasia 226.1 221.8 251.0transport accidents 4.7 5.6 7.0
(1) 2011 (2) 2007 (3) 2012 (4) 2010
age
Density of population (inh./km2)< 50≥ 50 and < 100≥ 100 and < 150≥ 150 and < 200≥ 200 and < 250≥ 250

0
5
10
15
20
25
30
35
40
45
50 %
80
100
120
140
20132009 2010 2011 2012
EmPLOYED PERSONS BY SECTORS 2013GDP PER INHABITANT (Purchasing power parity)
Catalonia EU-28Spain
EU-28=100
114
95,2
SpainCatalonia
ECONOmY 2013Catalonia Spain EU-28
Gross domestic product (million €) 203 615 1 022 988 13 068 601GDP. Growth rate (%) -0.5 -1.2 0.1GDP per inhabitant (€) 27 298 22 300 25 700
Gross value added (million €) 186 519 933 173 11 671 327agriculture (%) 1.3 2.6 1.7industry (%) 20.6 17.5 19.1construction (%) 7.4 7.8 5.7services (%) 70.7 72.1 73.6
External trade (million €)imports 67 860 255 153 1 682 390exports 58 981 238 146 1 737 022
ICP. Annual variation (%) 1.7 1.5 1.5
LABOUR mARKET 2013Catalonia Spain EU-28
Active population (1 000) 3 863 23 190 244 288
Activity rate (%) (1) 63.1 59.4 57.6men 69.0 65.6 64.5women 57.6 53.4 51.2
Employment (1 000) 2 970 17 139 217 292agriculture (%) 1.8 4.3 5.1industry and construction (%) 24.6 18.3 22.4services (%) 73.6 77.4 72.5
Unemployment rate (%) 23.1 26.1 10.8men 23.8 25.6 10.8women 22.4 26.7 10.9< 25 year old 50.2 55.5 23.5
(1) This rate has been calculated for the population 15 year old and over.
LIVING CONDITIONS 2013Catalonia Spain EU-28
People at risk of poverty or social exclusion (%) 24.3 27.3 24.5after social transfers (%) 19.8 20.4 16.7
People living in households with very low work intensity (%) 8,2 15.7 10.7
Gender pay gap (%) (1) 19.8 17.8 16.4
Inequality of income distribution (2) 5.7 6.3 5.0
At-risk-of-poverty rate before social transfers (%) 29.1 30.0 25.8 men 29.8 30.7 25.1women 28.4 29.3 26.5
(1) 2011(2) Income inequality among the highest and lowest quintiles.
AGRICULTURE 2013Catalonia Spain EU-28
Agricultural holdings (1 000)(1) 61 (1) 990 (1) 13 700 (2)
Agricultural final output (milion €) 4 508 42 856 404 506crop (%) 39.0 61.5 53.5animal (%) 58.4 37.4 41.6
Gross value added (million €) 2 396 24 109 197 256(1) 2009 (2) 2007
INDUSTRY AND R&D 2013Catalonia Spain EU-28
Industrial production index. Annual variation (%) (1) 0.6 -1.7 -0.5R&D expenditure/GDP (%) (2) 1.51 1.27 2.01
R&D expenditure (million €) (2) 2 991 13 392 269 548business enterprises (%) 56.2 53.2 64.3higher education sector (%) 23.2 27.7 23.4government sector (%) 20.5 19.1 12.2
R&D researchers (2) (3) 25 520 126 778 1 677 404women (%) 39.3 38.5 :
(1) Data adjusted by working days. (2) 2012 (3) Full time equivalent.
marketservices
non-marketservices
industryagriculture
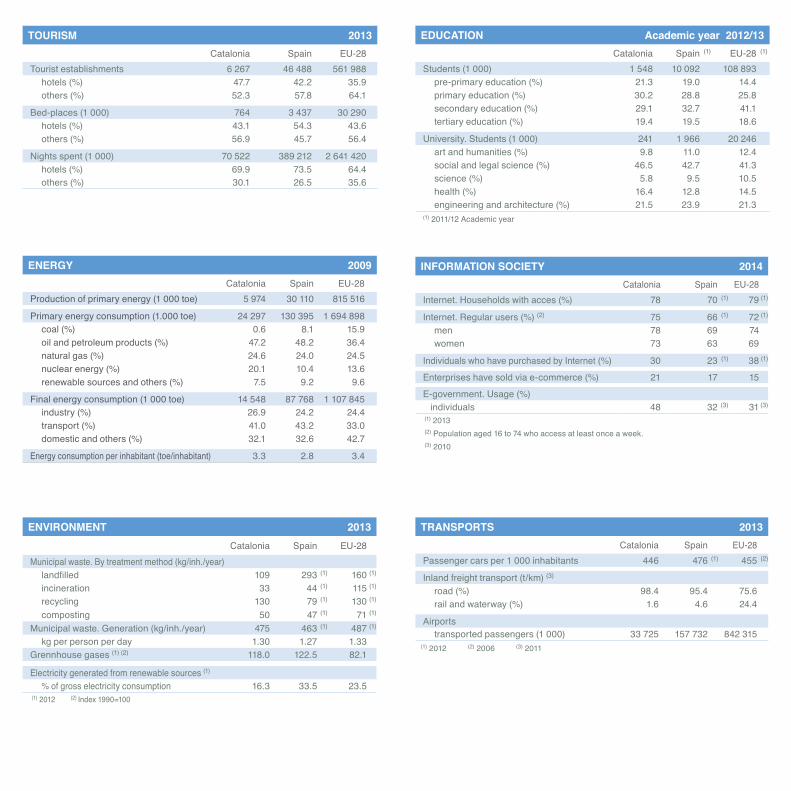
ENERGY 2009Catalonia Spain EU-28
Production of primary energy (1 000 toe) 5 974 30 110 815 516
Primary energy consumption (1.000 toe) 24 297 130 395 1 694 898coal (%) 0.6 8.1 15.9oil and petroleum products (%) 47.2 48.2 36.4natural gas (%) 24.6 24.0 24.5nuclear energy (%) 20.1 10.4 13.6renewable sources and others (%) 7.5 9.2 9.6
Final energy consumption (1 000 toe) 14 548 87 768 1 107 845industry (%) 26.9 24.2 24.4transport (%) 41.0 43.2 33.0domestic and others (%) 32.1 32.6 42.7
Energy consumption per inhabitant (toe/inhabitant) 3.3 2.8 3.4
ENVIRONmENT 2013Catalonia Spain EU-28
Municipal waste. By treatment method (kg/inh./year)landfilled 109 293 (1) 160 (1)
incineration 33 44 (1) 115 (1)
recycling 130 79 (1) 130 (1)
composting 50 47 (1) 71 (1)
Municipal waste. Generation (kg/inh./year) 475 463 (1) 487 (1)
kg per person per day 1.30 1.27 1.33Grennhouse gases (1) (2) 118.0 122.5 82.1
Electricity generated from renewable sources (1)
% of gross electricity consumption 16.3 33.5 23.5(1) 2012 (2) Index 1990=100
TOURISm 2013Catalonia Spain EU-28
Tourist establishments 6 267 46 488 561 988hotels (%) 47.7 42.2 35.9others (%) 52.3 57.8 64.1
Bed-places (1 000) 764 3 437 30 290hotels (%) 43.1 54.3 43.6others (%) 56.9 45.7 56.4
Nights spent (1 000) 70 522 389 212 2 641 420hotels (%) 69.9 73.5 64.4others (%) 30.1 26.5 35.6
INFORmATION SOCIETY 2014Catalonia Spain EU-28
Internet. Households with acces (%) 78 70 (1) 79 (1)
Internet. Regular users (%) (2) 75 66 (1) 72 (1)
men 78 69 74women 73 63 69
Individuals who have purchased by Internet (%) 30 23 (1) 38 (1)
Enterprises have sold via e-commerce (%) 21 17 15E-government. Usage (%)
individuals 48 32 (3) 31 (3)
(1) 2013(2) Population aged 16 to 74 who access at least once a week. (3) 2010
TRANSPORTS 2013Catalonia Spain EU-28
Passenger cars per 1 000 inhabitants 446 476 (1) 455 (2)
Inland freight transport (t/km) (3)
road (%) 98.4 95.4 75.6rail and waterway (%) 1.6 4.6 24.4
Airportstransported passengers (1 000) 33 725 157 732 842 315
(1) 2012 (2) 2006 (3) 2011
EDUCATION Academic year 2012/13Catalonia Spain (1) EU-28 (1)
Students (1 000) 1 548 10 092 108 893pre-primary education (%) 21.3 19.0 14.4primary education (%) 30.2 28.8 25.8secondary education (%) 29.1 32.7 41.1tertiary education (%) 19.4 19.5 18.6
University. Students (1 000) 241 1 966 20 246art and humanities (%) 9.8 11.0 12.4social and legal science (%) 46.5 42.7 41.3science (%) 5.8 9.5 10.5health (%) 16.4 12.8 14.5engineering and architecture (%) 21.5 23.9 21.3
(1) 2011/12 Academic year
www.idescat.cat
Figures of Catalonia
CATALONIA IN EUROPE 2020
Catalonia Spain EU-282013Employment rate from 20 to 64 years of age (%) 63.9 58.6 68.4
men 67.4 63.4 74.3women 60.3 53.8 62.6
2012Gross domestic expenditure on R&D relative to the GDP 1.51 1.27 2.012012Greenhouse gas emissionsÍndex (base 1990=100) 118.0 122.5 82.12009Consumption of renewable energy.(% Share of gross final energy consumption) 5.5 13.0 11.9
2009Primary energy consumption (million TOE) 21.4 123.2 1 594.72013Early school leavers (%) 24.7 23.6 12.0
men 30.5 27.2 13.6women 18.6 19.8 10.2
2013Tertiary educational attainment by age group 30-34(%) 46.2 42.3 36.9
men 38.7 37.1 32.7women 53.9 47.5 41.2
2013People at risk of poverty or social exclusion (%) 24.3 27.3 24.52013People living in households with very low work intensity (%) 8.2 15.7 10.72013People at risk of poverty after social transfers (%) 19.8 20.4 16.72013Severely materially deprived people (%) 6.1 6.2 9.6
Generalitat de Catalunya is the national selft-government of Catalonia made up of the three institutions: the Parliament, the President and the Executive Council or Government. You will find the permanently updated data at: www.idescat.cat/euSources: Eurostat. Government of Catalonia, Idescat, INE and ministries.Updated: 10/12/2014
© Generalitat de CatalunyaInstitut d'Estadística de CatalunyaISSN: 2014-8593Legal deposit B-27357-2014Printed by: Gràfiques Vilanova. SL
Generalitat de CatalunyaGovernment of Catalonia