Figure 100.—A, Index map of the St. Elias Mountains of Alaska and ...
75
Figure 100.—A, Index map of the St. Elias Mountains of Alaska and Canada showing the glacierized areas (index map modi- fied from Field, 1975a). B, Enlargement of NOAA Advanced Very High Resolution Radiometer (AVHRR) image mosaic of the St. Elias Mountains in summer 1995. National Oceanic and Atmospheric Administration image from Mike Fleming, USGS, EROS Data Center, Alaska Science Center, Anchorage, Alaska. K122 SATELLITE IMAGE ATLAS OF GLACIERS OF THE WORLD
Transcript of Figure 100.—A, Index map of the St. Elias Mountains of Alaska and ...

Figure 100.—A, Index map of the St. Elias Mountains of Alaska and Canada showing the glacierized areas (index map modi-fied from Field, 1975a). B, Enlargement of NOAA Advanced Very High Resolution Radiometer (AVHRR) image mosaic of the St. Elias Mountains in summer 1995. National Oceanic and Atmospheric Administration image from Mike Fleming, USGS, EROS Data Center, Alaska Science Center, Anchorage, Alaska.
K122 SATELLITE IMAGE ATLAS OF GLACIERS OF THE WORLD

St. Elias MountainsIntroduction
Much of the St. Elias Mountains, a 750×180-km mountain system, strad-dles the Alaskan-Canadian border, paralleling the coastline of the northern Gulf of Alaska; about two-thirds of the mountain system is located within Alaska (figs. 1, 100). In both Alaska and Canada, this complex system of mountain ranges along their common border is sometimes referred to as the Icefield Ranges. In Canada, the Icefield Ranges extend from the Province of British Columbia into the Yukon Territory. The Alaskan St. Elias Mountains extend northwest from Lynn Canal, Chilkat Inlet, and Chilkat River on the east; to Cross Sound and Icy Strait on the southeast; to the divide between Waxell Ridge and Barkley Ridge and the western end of the Robinson Moun-tains on the southwest; to Juniper Island, the central Bagley Icefield, the eastern wall of the valley of Tana Glacier, and Tana River on the west; and to Chitistone River and White River on the north and northwest. The boundar-ies presented here are different from Orth’s (1967) description. Several of Orth’s descriptions of the limits of adjacent features and the descriptions of the St. Elias Mountains and the Chugach Mountains are contradictory. For instance, he places the Granite Range in the Chugach Mountains yet has its eastern and western sides bounded by St. Elias Mountains features. In this description, the Granite Range is included in the St. Elias Mountains.
The highest peak in the Alaskan St. Elias Mountains is Mount St. Elias (fig. 101). Its 5,489-m-high summit, which lies on the U.S.-Canadian border, is located only about 12 km from sea level as of 2004, measured from the now-stable terminus of the tidewater Tyndall Glacier. During most of the 20th century, as Tyndall Glacier retreated, the distance from the summit to sea level has decreased from nearly 60 km to the present 12 km. This ongoing retreat has produced one of the steepest topographic gradients anywhere on Earth. Elsewhere in the Alaskan St. Elias Mountains, Mount Bona (5,005 m), Mount Vancouver (4,785 m), Mount Fairweather (4,663 m), and Mount Hub-bard (4,557 m) all exceed 4,500 m. More than two dozen other peaks have
GLACIERS OF ALASKA K123

elevations greater than 3,300 m. The highest peak, Mount Logan (6,050 m) is located entirely within Canada (see Ommanney, 2002a, fig. 20).
Glaciers cover about 11,800 km2 of the Alaskan part of the St. Elias Moun-tains (Post and Meier, 1980, p. 45). Included are parts of the three largest temperate glaciers in North America: two piedmont outlet glaciers (Ber-ing and Malaspina Glaciers) and one tidewater glacier (Hubbard Glacier). More than 50 glaciers in the St. Elias Mountains have lengths greater than 8 km. Many mountainous areas and ranges of the Alaskan St. Elias Mountains have been given unique names (from east to west): Chilkat Range, Takhin-sha Mountains, Fairweather Range, Brabazon Range, Granite Range, Rob-inson Mountains, and Icefield Ranges. For ease of description, the St. Elias Mountains are divided into segments: (1) southeastern St. Elias Mountains (from the Lynn Canal and Chilkat Inlet and River to the eastern side of the Alsek River); (2) the south-central St. Elias Mountains (from the western side of the Alsek River to the western side of Yakutat Bay); (3) southwestern St. Elias Mountains (from the western side of Yakutat Bay to the western Bagley Ice Valley, the western Robinson Mountains, and the Bering Lobe); and (4) the northwestern St. Elias Mountains (from the Canadian border at long 141°W. to White River, Chitistone River, Tana River, the eastern wall of the valley of Tana Glacier, and the southern side of the Bagley Ice Valley).
Southeastern St. Elias Mountains Segment: From the Lynn Canal and Chilkat Inlet and River to the Eastern Side of the Alsek River
Landsat MSS images that cover the southeastern St. Elias Mountain region from Lynn Canal and Chilkat Inlet and River to the eastern side of the Alsek River have the following Path/Row coordinates: 63/19, 64/18, 64/19, 65/19, and 66/18 (fig. 102). These areas are mapped on the USGS Juneau (Alaska-Can-ada), Skagway (Alaska-Canada), Mount Fairweather (Alaska-Canada), and Yakutat (Alaska-Canada) 1:250,000-scale topographic maps (appendix A).
East of the Glacier Bay drainage, the area between the Chilkat River and the Canadian border supports more than 100 small glaciers and several larger ones, some with lengths approaching 15 km. The largest glacier in this region is the 20-km-long Davidson Glacier, located in the Chilkat Range, which has an area of 115 km2 (Field and Collins, 1975, p. 251). Many of these glaciers were photographed by the IBC early in the 20th century (IBC, 1952) and revisited by an AGS expedition led by Field in 1967 (Field and Collins, 1975). Except for subsequent coverage provided by aerial photography and satel-lite imagery, these investigations were the last detailed documentation for
Figure 101.—Aerial photograph of the sum-mit of Mount St. Elias and environs on 28 July 2001. At 5,489 m, Mount St. Elias is the highest peak in Alaska’s St. Elias Mountains. Photograph by Bruce F. Molnia, U.S. Geological Survey.
GLACIER BAY NATIONAL PARKand PRESERVE
La Perouse Glacier
Ly
nn
Ca
na l
Eag
le G
l.
ADMIRALTY ISLAND
LeBlondeauGlacier
TakhinGlacier
Ch
i l ka
t R i v e r
Davidson Gl.
Ferebee Gl.
Chilkoot River Meade Glacier
Brady Glacier
La Perouse Glacier
Litu
ya B
ay
FingerGlacier
Lituya Gl.
Casem
ent G
l.
Mc B
rid
e G
l.
Muir Gl.
Burroughs Gl.
Carroll Glacier
Desolation Valley
Desolation Valley
Johns Hopkin
s G
l.
Grand Pacific Glacier
Fairw
eather Gl.
Gra
nd P
late
au Gl.
Glacier Bay
Ferebee River
Mar
geri
e G
l.
10 0 10 20 30 KILOMETERS
APPROXIMATE SCALE
CANADAUNITED STATES
Alsek River
Alsek Gl.
DryBay
137°W
59°N
K124 SATELLITE IMAGE ATLAS OF GLACIERS OF THE WORLD
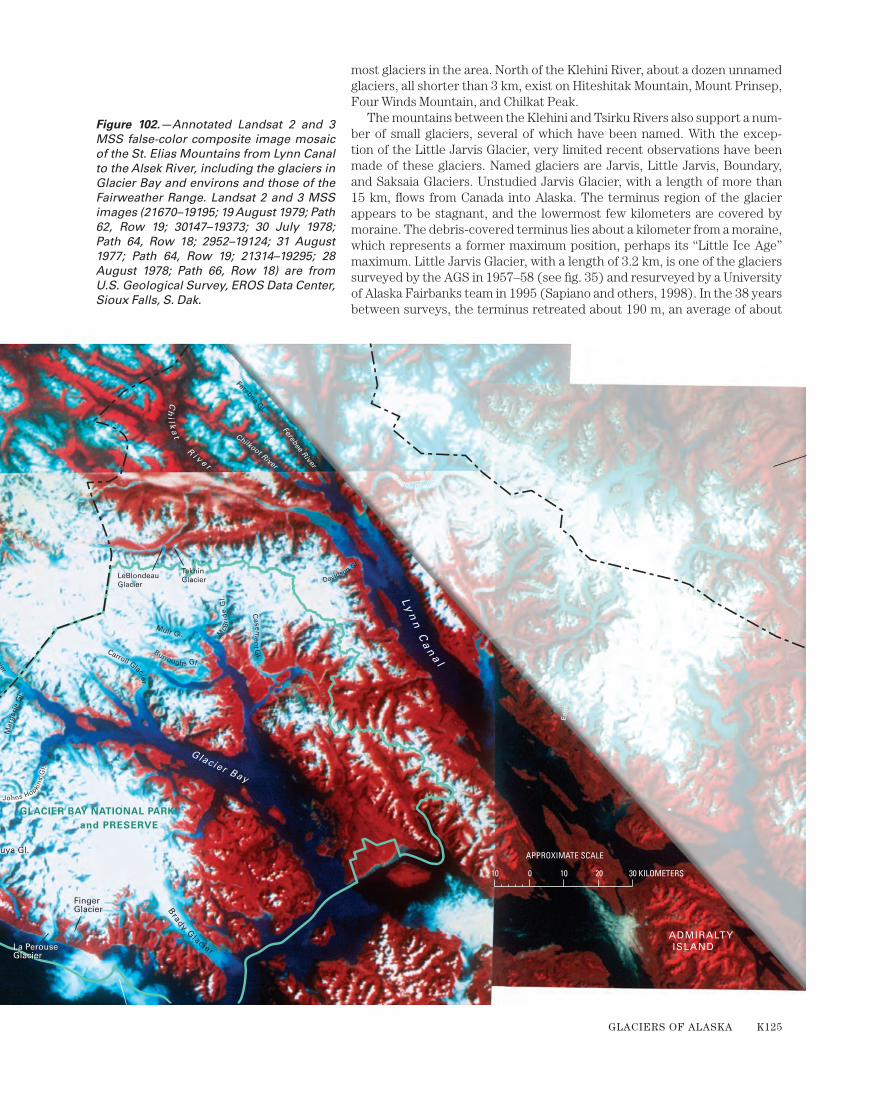
Figure 102.—Annotated Landsat 2 and 3 MSS false-color composite image mosaic of the St. Elias Mountains from Lynn Canal to the Alsek River, including the glaciers in Glacier Bay and environs and those of the Fairweather Range. Landsat 2 and 3 MSS images (21670–19195; 19 August 1979; Path 62, Row 19; 30147–19373; 30 July 1978; Path 64, Row 18; 2952–19124; 31 August 1977; Path 64, Row 19; 21314–19295; 28 August 1978; Path 66, Row 18) are from U.S. Geological Survey, EROS Data Center, Sioux Falls, S. Dak.
most glaciers in the area. North of the Klehini River, about a dozen unnamed glaciers, all shorter than 3 km, exist on Hiteshitak Mountain, Mount Prinsep, Four Winds Mountain, and Chilkat Peak.
The mountains between the Klehini and Tsirku Rivers also support a num-ber of small glaciers, several of which have been named. With the excep-tion of the Little Jarvis Glacier, very limited recent observations have been made of these glaciers. Named glaciers are Jarvis, Little Jarvis, Boundary, and Saksaia Glaciers. Unstudied Jarvis Glacier, with a length of more than 15 km, flows from Canada into Alaska. The terminus region of the glacier appears to be stagnant, and the lowermost few kilometers are covered by moraine. The debris-covered terminus lies about a kilometer from a moraine, which represents a former maximum position, perhaps its “Little Ice Age” maximum. Little Jarvis Glacier, with a length of 3.2 km, is one of the glaciers surveyed by the AGS in 1957–58 (see fig. 35) and resurveyed by a University of Alaska Fairbanks team in 1995 (Sapiano and others, 1998). In the 38 years between surveys, the terminus retreated about 190 m, an average of about
GLACIER BAY NATIONAL PARKand PRESERVE
La Perouse Glacier
Ly
nn
Ca
na l
Eag
le G
l.
ADMIRALTY ISLAND
LeBlondeauGlacier
TakhinGlacier
Ch
i l ka
t R i v e r
Davidson Gl.
Ferebee Gl.
Chilkoot River Meade Glacier
Brady Glacier
La Perouse Glacier
Litu
ya B
ay
FingerGlacier
Lituya Gl.
Casem
ent G
l.
Mc B
rid
e G
l.
Muir Gl.
Burroughs Gl.
Carroll Glacier
Desolation Valley
Desolation Valley
Johns Hopkin
s G
l.
Grand Pacific Glacier
Fairw
eather Gl.
Gra
nd P
late
au Gl.
Glacier Bay
Ferebee River
Mar
geri
e G
l.
10 0 10 20 30 KILOMETERS
APPROXIMATE SCALE
CANADAUNITED STATES
Alsek River
Alsek Gl.
DryBay
137°W
59°N
GLACIERS OF ALASKA K125
5 m a–1. During the 38-year interval, Little Jarvis Glacier experienced a small loss in area (2.45 km2 in 1995 as opposed to 2.5 km2 in 1958) but no apparent change in volume.
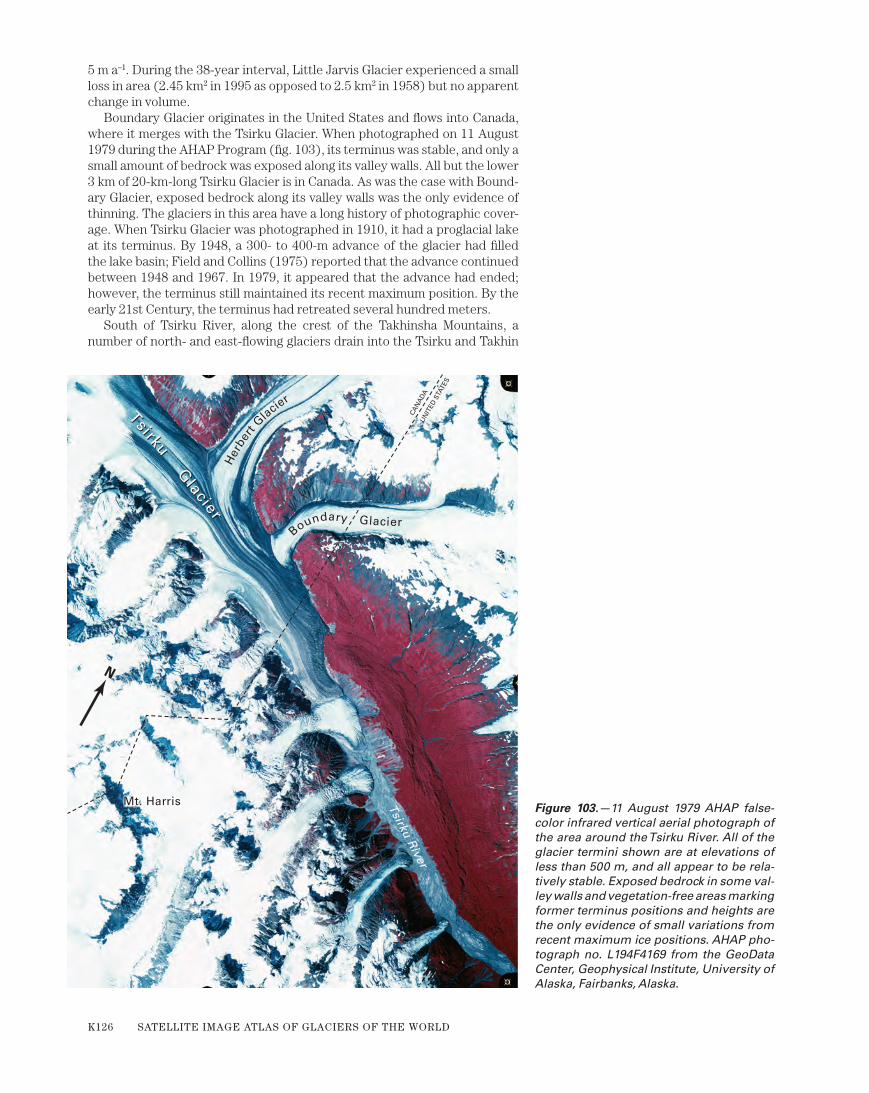
Boundary Glacier originates in the United States and flows into Canada, where it merges with the Tsirku Glacier. When photographed on 11 August 1979 during the AHAP Program (fig. 103), its terminus was stable, and only a small amount of bedrock was exposed along its valley walls. All but the lower 3 km of 20-km-long Tsirku Glacier is in Canada. As was the case with Bound-ary Glacier, exposed bedrock along its valley walls was the only evidence of thinning. The glaciers in this area have a long history of photographic cover-age. When Tsirku Glacier was photographed in 1910, it had a proglacial lake at its terminus. By 1948, a 300- to 400-m advance of the glacier had filled the lake basin; Field and Collins (1975) reported that the advance continued between 1948 and 1967. In 1979, it appeared that the advance had ended; however, the terminus still maintained its recent maximum position. By the early 21st Century, the terminus had retreated several hundred meters.
South of Tsirku River, along the crest of the Takhinsha Mountains, a number of north- and east-flowing glaciers drain into the Tsirku and Takhin
Her
bert
Glacier
Tsirku Glacier
Tsirku Glacier
Tsirku River
Boundary Glacier
Mt. HarrisMt. Harris
N
CAN
AD
A
UN
ITED
STA
TES
Figure 103.—11 August 1979 AHAP false-color infrared vertical aerial photograph of the area around the Tsirku River. All of the glacier termini shown are at elevations of less than 500 m, and all appear to be rela-tively stable. Exposed bedrock in some val-ley walls and vegetation-free areas marking former terminus positions and heights are the only evidence of small variations from recent maximum ice positions. AHAP pho-tograph no. L194F4169 from the GeoData Center, Geophysical Institute, University of Alaska, Fairbanks, Alaska.
K126 SATELLITE IMAGE ATLAS OF GLACIERS OF THE WORLD

Rivers. These glaciers include Le Blondeau, Takhin, Dickinson, Willard, Ber-tha, and Garrison Glaciers, many of which were described by Arthur and Au-ral Krause in 1881–82 (Krause, 1883) and photographed by the IBC between 1894 and 1910. Takhin Glacier had retreated several hundred meters from its “Little Ice Age” maximum position when it was first photographed in 1910. Between 1910 and 1967, Le Blondeau Glacier retreated more than 1 km. All were retreating when observed in 2004.
When the Krauses first observed it in 1881, the terminus of Bertha Gla-cier had advanced into an evergreen forest and was shedding rocks into the trees. According to them, this advance was in marked contrast to all of the other glaciers in the area, which were then in significant retreat. By 1894, the advance had ended. Through 1967, the retreat of the terminus amounted to about 300 m.
Because of its location along the western side of Lynn Canal, Davidson Glacier has been seen by many travelers. In spite of this prominent position, it suffers from a lack of detailed observations. One of its earliest visitors was I.C. Russell in 1889, who observed several signs of recent continuing retreat. He described the terminus as being surrounded by a “mile-and-one half-wide accumulation of ice-marginal sediment deposits, so as to form an encircling girdle now covered on its outer margin with a dense spruce forest.” The in-ner half-mile he described as “a barren, desolate tract of boulders and gravel of fresh appearance, and evidently but recently abandoned by the glacier” (Russell, 1897, p. 103). A series of arcuate recessional moraines encircles the terminus of Davidson Glacier and documents an advance between the 12th and 14th centuries, a retreat during the 15th century, and a significant readvance in the middle 18th century (Egan and others, 1968), followed by the retreat observed by Russell in 1889. By the time it was photographed 57 years later, in August 1946 (fig. 104 A), the terminus of Davidson Glacier had retreated more than 1.5 km from its “Little Ice Age” maximum position and about 0.4 km from the 1889 position observed by Russell. A proglacial lake had also developed. When it was photographed 32 years later on 31 August 1978 (fig. 104B), the lake had expanded in size, encircling two-thirds of the terminus, and the glacier had retreated another 0.7 km. Twenty-six years later, when observed by the author on 18 June 2004, the terminus had re-treated an additional 0.7 km.
Figure 104.—A, August 1946 black-and-white vertical aerial photograph of Davidson Glacier showing the series of arcuate recessional moraines that en-circles the terminus of Davidson Glacier and documents its “Little Ice Age” his-tory and post-“Little Ice Age” retreat. Photograph SEA–140–100 from the U.S. Army Air Force, Southeast Alaska Project. B, 31 August 1978 photograph showing a lake significantly larger than the one that existed in 1946. During the 32 years between the date of this photograph and figure 104A, Davidson Glacier retreated about 0.7 km. Iceberg calving into the ice-marginal lake is contributing to the gla-cier’s retreat. USGS photograph 78–V2–25 by Austin Post, U.S. Geological Survey.
GLACIERS OF ALASKA K127
Glacier Bay National Park and Preserve
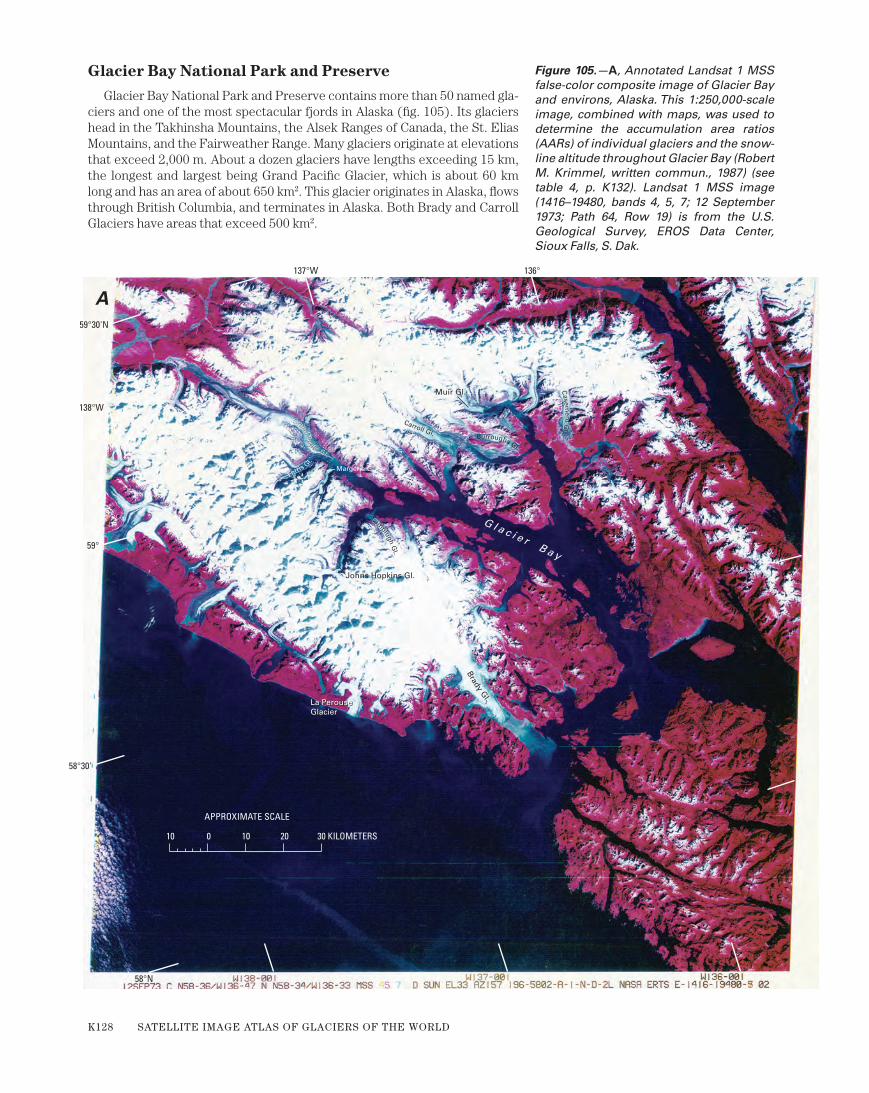
Glacier Bay National Park and Preserve contains more than 50 named gla-ciers and one of the most spectacular fjords in Alaska (fig. 105). Its glaciers head in the Takhinsha Mountains, the Alsek Ranges of Canada, the St. Elias Mountains, and the Fairweather Range. Many glaciers originate at elevations that exceed 2,000 m. About a dozen glaciers have lengths exceeding 15 km, the longest and largest being Grand Pacific Glacier, which is about 60 km long and has an area of about 650 km2. This glacier originates in Alaska, flows through British Columbia, and terminates in Alaska. Both Brady and Carroll Glaciers have areas that exceed 500 km2.
G l a c i e r B a y
A
Lamplugh G
l.
Lamplugh G
l.
Casem
ent G
l..
Grand Pacific Gl.
Brady Gl. La Perouse
GlacierLa Perouse Glacier
Johns Hopkins Gl.
Muir Gl.
Margerie Gl.Ferris
G
l.
Grand Pacific Gl.
Carroll Gl. Burroughs Gl.
Casem
ent G
l..
137°W
138°W
136°
59°30'N
59°
58°30'
58°N
10 0 10 20 30 KILOMETERS
APPROXIMATE SCALE
Figure 105.—A, Annotated Landsat 1 MSS false-color composite image of Glacier Bay and environs, Alaska. This 1:250,000-scale image, combined with maps, was used to determine the accumulation area ratios (AARs) of individual glaciers and the snow-line altitude throughout Glacier Bay (Robert M. Krimmel, written commun., 1987) (see table 4, p. K132). Landsat 1 MSS image (1416–19480, bands 4, 5, 7; 12 September 1973; Path 64, Row 19) is from the U.S. Geological Survey, EROS Data Center, Sioux Falls, S. Dak.
K128 SATELLITE IMAGE ATLAS OF GLACIERS OF THE WORLD
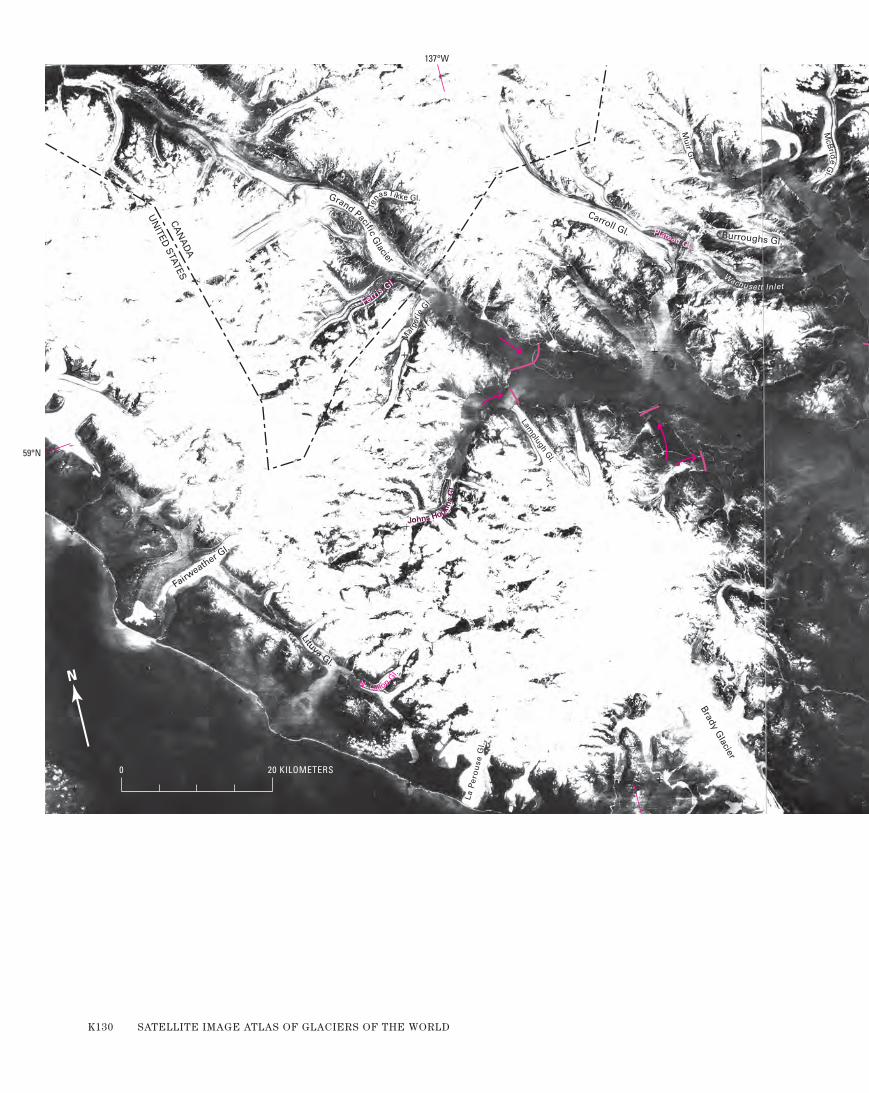
Many of the glaciers of this area can be seen on two Landsat images ac-quired on 12 September 1973 (fig. 105A) and on 12 August 1979 (fig. 106); the two images provide clear views of the majority of glaciers within Glacier Bay National Park and Preserve. Table 4, which is based on the work of Rob-ert M. Krimmel (USGS), provides data on AARs of glaciers in Glacier Bay and environs. He based his analysis on a 30 September 1973 Landsat 1 MSS image (1434–19473) of the area. Glacier Bay extends for more than 100 km from its mouth at Icy Strait to the termini of both Grand Pacific Glacier at the head of Tarr Inlet and Johns Hopkins Glacier at the head of John Hopkins Inlet. About 250 years ago, Glacier Bay did not exist. Its basin was filled by a single large ice mass that reached into Icy Strait. The terminus position that
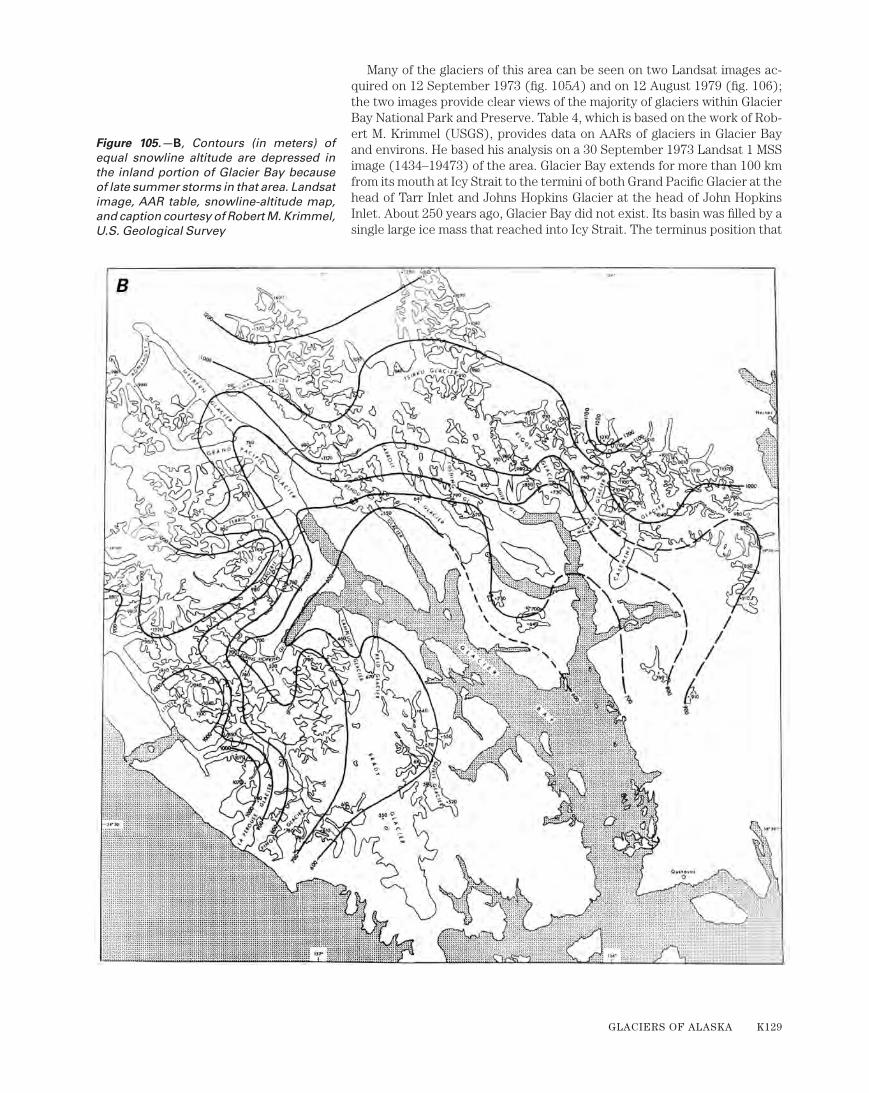
Figure 105.—B, Contours (in meters) of equal snowline altitude are depressed in the inland portion of Glacier Bay because of late summer storms in that area. Landsat image, AAR table, snowline-altitude map, and caption courtesy of Robert M. Krimmel, U.S. Geological Survey
GLACIERS OF ALASKA K129
Plateau Gl.
Johns Hopkins
Gl.
Ferris Gl.
Lamplugh G
l.
Wachusett Inlet
Carroll Gl.
Muir G
l.
McB
ride G
l.
Casem
ent G
l.
Burroughs Gl.
Tenas Tikke Gl.
Ferris Gl.
Brady Glacier
La P
ero
use
Gl.
Lituya Gl.
N. Crillon G
l.
Fairweather G
l.
Grand Pacific Glacier
Mar
geri
e Gl.
N. Crillon G
l.
N
0 20 KILOMETERS
Bartlett Cove
CAN
AD
A
UN
ITED STATES
59°N
137°W
K130 SATELLITE IMAGE ATLAS OF GLACIERS OF THE WORLD
Plateau Gl.
Johns Hopkins
Gl.
Ferris Gl.
Lamplugh G
l.
Wachusett Inlet
Carroll Gl.
Muir G
l.
McB
ride G
l.
Casem
ent G
l.
Burroughs Gl.
Tenas Tikke Gl.
Ferris Gl.
Brady Glacier
La P
ero
use
Gl.
Lituya Gl.
N. Crillon G
l.
Fairweather G
l.
Grand Pacific Glacier
Mar
geri
e Gl.
N. Crillon G
l.
N
0 20 KILOMETERS
Bartlett Cove
CAN
AD
A
UN
ITED STATES
59°N
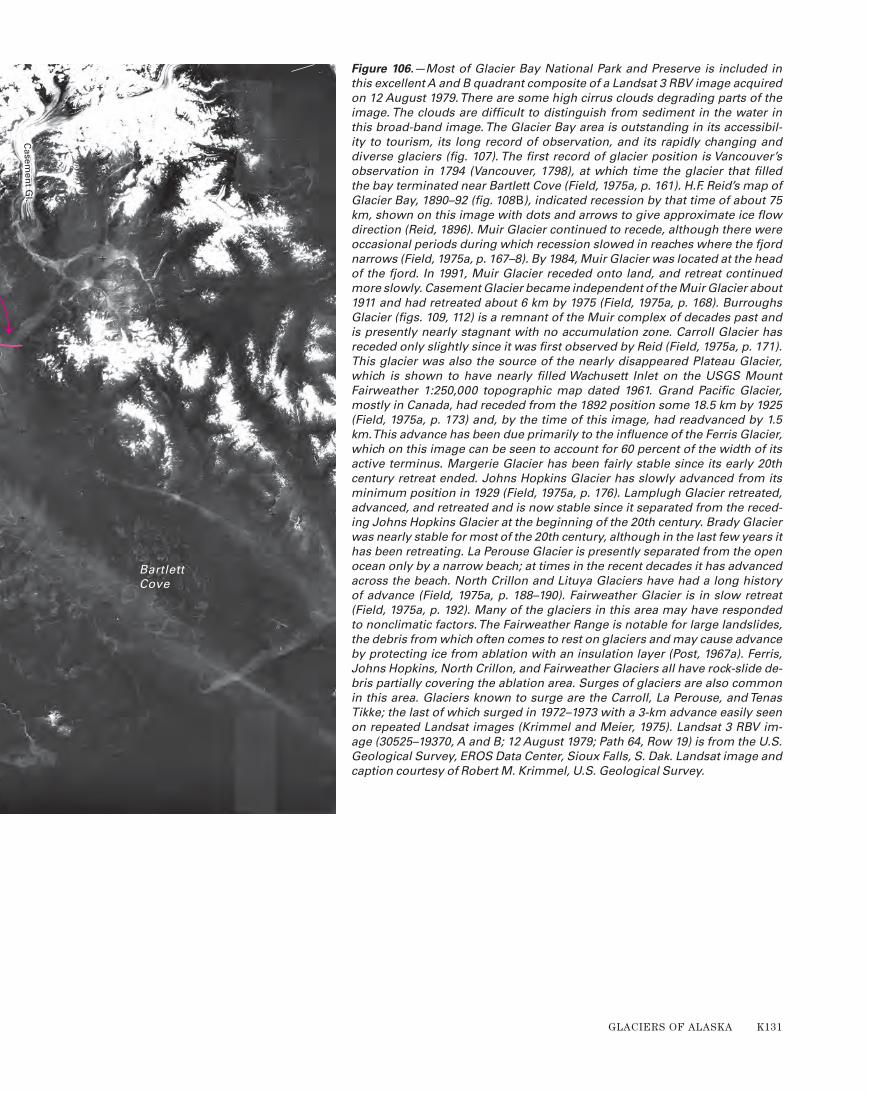
137°WFigure 106.—Most of Glacier Bay National Park and Preserve is included in this excellent A and B quadrant composite of a Landsat 3 RBV image acquired on 12 August 1979. There are some high cirrus clouds degrading parts of the image. The clouds are difficult to distinguish from sediment in the water in this broad-band image. The Glacier Bay area is outstanding in its accessibil-ity to tourism, its long record of observation, and its rapidly changing and diverse glaciers (fig. 107). The first record of glacier position is Vancouver’s observation in 1794 (Vancouver, 1798), at which time the glacier that filled the bay terminated near Bartlett Cove (Field, 1975a, p. 161). H.F. Reid’s map of Glacier Bay, 1890–92 (fig. 108 B), indicated recession by that time of about 75 km, shown on this image with dots and arrows to give approximate ice flow direction (Reid, 1896). Muir Glacier continued to recede, although there were occasional periods during which recession slowed in reaches where the fjord narrows (Field, 1975a, p. 167–8). By 1984, Muir Glacier was located at the head of the fjord. In 1991, Muir Glacier receded onto land, and retreat continued more slowly. Casement Glacier became independent of the Muir Glacier about 1911 and had retreated about 6 km by 1975 (Field, 1975a, p. 168). Burroughs Glacier (figs. 109, 112) is a remnant of the Muir complex of decades past and is presently nearly stagnant with no accumulation zone. Carroll Glacier has receded only slightly since it was first observed by Reid (Field, 1975a, p. 171). This glacier was also the source of the nearly disappeared Plateau Glacier, which is shown to have nearly filled Wachusett Inlet on the USGS Mount Fairweather 1:250,000 topographic map dated 1961. Grand Pacific Glacier, mostly in Canada, had receded from the 1892 position some 18.5 km by 1925 (Field, 1975a, p. 173) and, by the time of this image, had readvanced by 1.5 km. This advance has been due primarily to the influence of the Ferris Glacier, which on this image can be seen to account for 60 percent of the width of its active terminus. Margerie Glacier has been fairly stable since its early 20th century retreat ended. Johns Hopkins Glacier has slowly advanced from its minimum position in 1929 (Field, 1975a, p. 176). Lamplugh Glacier retreated, advanced, and retreated and is now stable since it separated from the reced-ing Johns Hopkins Glacier at the beginning of the 20th century. Brady Glacier was nearly stable for most of the 20th century, although in the last few years it has been retreating. La Perouse Glacier is presently separated from the open ocean only by a narrow beach; at times in the recent decades it has advanced across the beach. North Crillon and Lituya Glaciers have had a long history of advance (Field, 1975a, p. 188–190). Fairweather Glacier is in slow retreat (Field, 1975a, p. 192). Many of the glaciers in this area may have responded to nonclimatic factors. The Fairweather Range is notable for large landslides, the debris from which often comes to rest on glaciers and may cause advance by protecting ice from ablation with an insulation layer (Post, 1967a). Ferris, Johns Hopkins, North Crillon, and Fairweather Glaciers all have rock-slide de-bris partially covering the ablation area. Surges of glaciers are also common in this area. Glaciers known to surge are the Carroll, La Perouse, and Tenas Tikke; the last of which surged in 1972–1973 with a 3-km advance easily seen on repeated Landsat images (Krimmel and Meier, 1975). Landsat 3 RBV im-age (30525–19370, A and B; 12 August 1979; Path 64, Row 19) is from the U.S. Geological Survey, EROS Data Center, Sioux Falls, S. Dak. Landsat image and caption courtesy of Robert M. Krimmel, U.S. Geological Survey.
GLACIERS OF ALASKA K131
the ice occupied from about 1750 to 1780 (fig. 107) marks the maximum ar-eal extent of the ice mass in Glacier Bay during the “Little Ice Age.” By l794, when Joseph Whidbey and William LeMesurier, two of George Vancouver’s lieutenants, explored Icy Strait, the ice had retreated about 8 km and a small bay had formed. At the time of their observations (Vancouver, 1798), the retreating glacier terminated near Bartlett Cove. By the time the bay was entered by Lt. C.E.S. Wood in 1877 and explored by John Muir in 1879, the ice retreat exceeded 60 km.
Much of the retreat may have been owing to iceberg calving. When Carl-son and others (2001) profiled lower Glacier Bay between Sitakaday Nar-rows and the fjord entrance with a multibeam imaging system, they found an extensive area covered by complex iceberg gouge patterns in the glacial marine sediment of the fjord’s floor in water depths ranging from 50 to100 m. Individual gouges were as much as 5 km long and a few tens of meters wide and had several meters of relief. They concluded that these gouges were likely formed by massive icebergs with drafts up to 100 m no more than 160 years ago. The large icebergs calved as the glacier retreated up the bay. They reported that the dominant gouge orientation, roughly parallel to the fjord axis, suggests that the strong tidal currents of up to 7 knots through Sitaka-day Narrows were responsible for driving the iceberg keels across the sea-bed. Even though the glaciers have retreated more than 80 km up fjord from Sitakaday Narrows, the gouges remain unburied in this environment of high sedimentation because sediment presently reaching the ice gouges is largely restricted to local runoff and plankton debris. In addition, the strong tidal currents through Sitakaday Narrows effectively keep the ice-gouged fjord floor scoured clean of fine sediment.
By the end of the 19th century, as the ice mass continued to thin and re-treat, individual inlets began to become ice free, each with its own unique retreating glacier. Each inlet has its own history and timing of ice movement. For instance, Muir Glacier, located in the eastern arm of the bay, separated from the main ice mass in the early 1860s.
Reid (1892, 1895, 1896) carried out important scientific work on Muir Gla-cier and other glaciers in Glacier Bay. The scientific significance of his work has been discussed previously in the “Early Observations of Alaska and Its Glaciers” section earlier in this chapter.
Israel C. Russell visited Glacier Bay in 1890 (Russell, 1897, p. 82). He de-scribed the massive Muir Glacier as follows:
On nearing the head of Glacier Bay and approaching Muir inlet, one beholds a pali-sade of ice nearly two miles long and from 130 to 210 feet high, rising from the water and uniting the mountain with mountain and forming a wall across the head of the inlet so as to hold back the waters of the ocean. This wall of ice is the extremity of the justly famed Muir Glacier. As one draws near, the surface of the glacier can be seen above and beyond the line of precipices in which it terminates. ... Soundings made in the central portion of the inlet as near to the ice front as vessels can safely venture, by estimate a thousand yards from the base of the cliffs, give a depth of 720 feet. The glacier extended south of the present limit a few years since and occupied the site where this sounding was taken, and was then certainly fully one thousand feet thick.
John Burroughs (1902, p. 35–36) participated in the Harriman Expedi-tion’s visit to Glacier Bay. He described their arrival at Muir Glacier in June 1899, as follows:
At five o’clock we drop anchor about two miles from its front. In eighty fathoms of water (480 feet), abreast of the little cabin on the east shore built by John Muir some years ago. Not til after repeated soundings did we find bottom within reach of our an-chor cables. Could the inlet have been emptied of its water for a moment we should have seen before us a palisade of ice nearly 1,000 feet higher and over two miles long.... Could we have been here many centuries ago, we should have seen, much further down the valley, a palisade of ice two or three thousand feet high. Many of these Alas-ka glaciers are rapidly melting and are now but the fragments of their former selves. From observations made here twenty years ago by John Muir, it is known that the position of the front of Muir Glacier at that time was about two miles below its pres-ent position, which would indicate a rate of recession of about one mile in ten years.
TAbLE 4.— Accumulation area ratios (AARs) for glaciers in Glacier Bay and environs
[Data courtesy of Robert M. Krimmel, U.S. Geological Survey]
Glacier name AAR
AAR Analysis from Landsat 1399–19540; 26 August 1973; Path 65, Row 19
Grand Pacific 0.59
Konamoxt .55
AAR Analysis from Landsat image 1434–19473; 30 September 1973; Path 64, Row 19
Sea Otter 0.64
Fairweather .52
Lituya .64
Crillon .70
La Perouse .65
Finger .66
Brady .64
Geikie .62
Reid-Lamplugh .87
Johns Hopkins .91
Margerie .83
Ferris .79
Grand Pacific .72
Konamoxt .61
Tenas Tikke .76
Rendu .85
Carroll .87
Cushing .80
Riggs .83
McBride .63
Casement .68
Davidson .87
Tikke .72
K132 SATELLITE IMAGE ATLAS OF GLACIERS OF THE WORLD

GLACIER BAY
NATIONAL PARK
and PRESERVE
GLACIER BAYNATIONALPRESERVE
1966 1948
1892
1919
1907
1879
1879
1879
1879
1880
1907 18
80
1892
1892
1907
1892
1794
1961
1845
1857
1860
1892
1860
1794
1750-1780
1907
1966 1941
19661929
1892
1966
1966
1966
1949
1929
1907
1929
1929
1966
19481960
19721976
1966
1907
18921907
1907
1916
18921892
1892
19 25
1966
1912
1966
NorthCrillo
nGlac
ier
B R A D Y
I C E F I E L D
Lamplugh
Glacier
Johns Hopkins Glacier
Mc Bri
de
Gla
cier
RiggsGlacier
MUIRGLACIER
CARROLL
GLACIER
RenduGlacier
GRANDPACIFIC
GLAC
IER
MELBURN
GLACIER
Mar
gerie
Gla
cier
FerrisGlacier
ALS
EKG
LAC
IER
GRANDPLATEAU
GLACIER
FAIRWEATHER GLACIER
Lituya Glacier
Reid
Glacier
Cas
emen
tG
laci
er
CushingG
lacier
LAPE
ROU
SE
GLACIER
BR
AD
YG
LAC
IER
TSIRKUGLACIER
CrillonLake
G U L F O F A L A S K A
P A C I F I C O C E A NrobraHsevarG
yaB
hcroT
ICY STRAITNorth
Passage
South Passage
CROSSS
OU
ND
BartlettCove
BartlettLake
BeartrackCove
North SandyCove
Hugh MillerInlet
Blue MouseCove
Bart
lett
Riv
er
Beartrack
River
ExcursionRiver
EndicottRiver
Excursion
Inlet
DundasBay
TaylorBay
DundasRiver
LakeSeclusion
AbyssLake
WoodLake
GeikieInlet
Berg Bay
FingersBay
G L AC I E R
B
AY
Tidal Inlet
RenduInlet
Queen
Inlet
Wachusett Inlet
Muir
Inlet Adams Inlet
Tarr
Inlet
John
sHop
kins
Inlet
LYN
NC
AN
AL
Taiy
aIn
let
iy
Chilkoot
River
Chilkat
River
Klehini River
Takhin River
Tsirku River
Ninetyeighter
Creek
Alsek
River
River at
LituyaBay
PalmaBay
Dixo
nHar
bo
r
Dry Bay
East A
lsek
R
AlsekRiver
BRITISH COLUMBIA
ALASKA
CANADA
UNITED STATES
BR
ITIS
H C
OLU
MB
IA
ALA
SK
A
Mt. LaPerouse10728ft3270m
WILLOUGHBYISLAND
BEARDSLEEISLANDS
INIANISLANDS
FRANCISISLANDInterglacial
ForestStumps
DRAKEISLAND
NORTHMARBLEISLAND
SOUTHMARBLEISLAND
RUSSELLISLAND
TLINGITPOINT
MUIRPOINT
Wolf Point
Mt. Crillon12726ft3879m
Mt. Bertha10204ft3110m
Mt. Cooper6780ft2066m
Mt. Abbe8750ft2667m
Mt. Salisbury12000ft3658m
Lituya Mountain11750ft3582m
Mt. Quincy Adams13650ft4161m
Mt. Root12860ft3920m
Mt. Lodge10530ft3210m
Mt. Fairweather15320ft4669m
Mt. Wright5139ft1566m
Endicott Gap900ft274m
AL S
EK
RA
NG
E
CH
I LK
AT
RA
NG
E
TA K H I N S H A M O U N TA I N S
B
Haines
Klukwan
CAPESPENCER
ICY POINT
CAPEFAIRWEATHER
Skagway
Elfin Cove
Gustavus
CHICHAGOF ISLAND
PLEASANTISLAND
LEMESURIERISLAND
Airport
InterglacialForest Stumps
h
Mt. McDonnell5481ft1671m
S AI N
T
EL I A
S
MO
UN
TAI N
SFA
I RW
E ATHE R
R ANGE
EX
CU
RS
ION
RID
GE
BE
AR
TR
AC
KM
OU
NT
AIN
S
Dry Bay Ranger StationAirstrip
Glacier BayNational Park
Glacier BayNational Preserve
Historic extent ofglaciation
DECEPTIONHILLS
TA
T S H E N S H I N I - A L S E KP R O V I N C I A L P A R K
T O N G A S SN AT I O N A L
F O R E S T
North
0
0
15 Miles105
15 Kilometers105
A
Figure 107.—A, Map of the Glacier Bay re-gion showing the chronology of the retreat of the Glacier Bay ice cover between 1750 and the end of the 20th century and the dates of the opening of the individual in-lets. Modified from 1997 U.S. National Park Service map. B, Oblique orbital view of Glacier Bay and environs based on Landsat 7 ETM+ image combined with digital el-evation model from the USGS National Elevation Dataset (NED). Landsat 7 ETM+ image (7059019009921350, 1 August 1999; Path 59, Row 19) is from the National Aeronautics and Space Administration. [http://earthobservatory.nasa.gov]
GLACIERS OF ALASKA K133

John Muir also participated in the Harriman Expedition, returning to Gla-cier Bay after an absence of about a decade. This was his seventh and last trip to Alaska. He commented on the differences he observed and presented a description of the changes that occurred in the bay between 1879 and 1899:
In Glacier Bay we remained nearly a week, so that we were able to note the changes which had taken place since my first visit in the fall of 1879. I then sailed around the bay, exploring all its branches and sketching the glaciers which occu-pied them, sailing up to their discharging fronts and landing on those which were not rendered inaccessible by the freezing together of their crowded bergs. Then (1879) there were only six berg-discharging glaciers in the bay; now (1899) there are nine...the three new ones being formed by one of the tributaries of the Hugh Miller and two of the Grand Pacific, separated from the main glacier and rendered independent by the recession of the trunks beyond their points of confluence. The Hugh Miller and Muir have receded about two miles in the last twenty years, the Grand Pacific about four and the Geike, Rendu, and Carroll perhaps from seven to ten miles. By the recession of the Grand Pacific and corresponding extension of Reid Inlet an island two and a half or three miles long, and over a thousand feet high, has been added to the landscape. Only the end of this island was visible in 1879. New islands have been born in some of the other fiords also, and some still enveloped in the glaciers show only their heads as they bide their time to take their place in the young landscape. Here, then, we have the work of glacial earth-sculpture going on before our eyes, teaching lessons so plain that he who runs may read. Evidently, all the glaciers hereabouts were no great time ago united, and with the multitude of glaciers which loaded the mountains to the south, once formed a grand continuous ice-sheet that flowed over all the island region of the coast and extended at least as far down as the Strait of Juan de Fuca (Muir, 1902, p. 127–128).
Muir also described the glacial origin of the submerged lands in southeast-ern Alaska that he explored:
The network of so called canals, passages, straits, channels, fiords, and so on, be-tween the islands manifest in their forms and trends and general characteristics the same subordination to the grinding action of a continuous ice-sheet, being simply the margins of the continent eroded below the sea level and therefore covered with the ocean waters which flowed into them as the ice was melted out. And as we have seen, this action is still going on and new islands and new channels are being added to the famous archipelago. The steamer trip to the fronts of the glaciers of Glacier Bay is now from two to eight miles longer than it was only twenty years ago. That the domain of the sea is being extended over the land by the wearing away of its shores is well known, but in this region the coast rocks have been so short a time exposed to wave action that the most resistant of them are scarcely at all wasted. Even as far south as Victoria (British Columbia) the superficial glacial scoring and polish may still be seen on the hardest of the harbor rocks below the tideline. The extension hereabouts of the sea by its own action in post-glacial time is probably less than a mil-lionth part as much as that effected by recent glacial action (Muir, 1902, p. 128–129).
[Editors’ note: According to Mark F. Meier (written commun., 2004), 20th and 21st century research addresses the importance of changes in relative sea level caused by uplift of the region, the result of isostatic adjustment of the Earth’s crust to loss of glacier ice (glacial rebound) and tectonic processes.]
Grand Pacific Glacier and Johns Hopkins Glacier, located in the western part of the bay, separated from each other about 1890. Each glacier indepen-dently continued to retreat for the next 35 to 40 years, and each has since fluctuated around the head of its respective inlet. Muir Inlet, Queen Inlet, Rendu Inlet, Reid Inlet, and Geikie Inlet are all side branches of the main bay. In a similar fashion, Adams Inlet, Wachusett Inlet, and the inlets in front of McBride and Riggs Glaciers are branches of Muir Inlet. Figure 107 shows the position of Glacier Bay’s glaciers near the end of the 20th century. Fig-ure 108A is a Landsat 1 MSS image of most of Glacier Bay on 12 September 1973.
Annual field observations made by the author during 1974–82, includ-ing much of the Landsat baseline period, indicate that 13 tidewater glaciers (McBride, Riggs, Muir, Carroll, Grand Pacific, Margerie, Toyatte, Johns Hop-kins, Gilman, Hoonah, Kashoto, Lamplugh, and Reid Glaciers) were actively calving icebergs into Glacier Bay. Since then, the termini of several, such as Muir, Toyatte, Hoonah, and Kashoto Glaciers, have retreated above sea level. About 90 years earlier (fig. 108B), when Glacier Bay was mapped by Reid in
K134 SATELLITE IMAGE ATLAS OF GLACIERS OF THE WORLD

1890 and 1892 (Reid, 1896), it had only 10 tidewater calving termini (Muir, Carroll, Rendu, Grand Pacific, Johns Hopkins, Reid, Hugh Miller, Charpen-tier, Geikie, and Wood Glaciers); many of today’s glaciers were still part of the much larger late-19th century ice mass.
Figure 108.—A, Part of a 1973 Landsat 1 MSS image of the Glacier Bay region that covers approximately the same area as B (see following page).
GLACIERS OF ALASKA K135
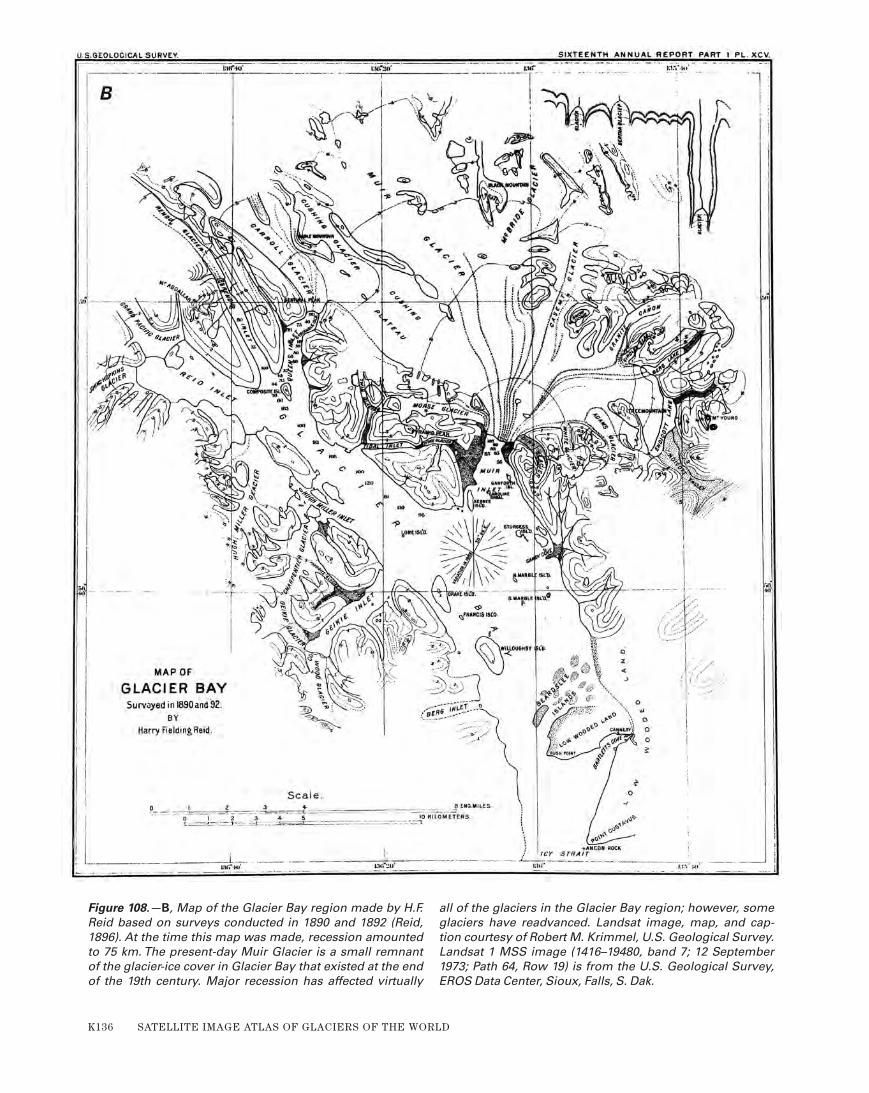
Figure 108.—B, Map of the Glacier Bay region made by H.F. Reid based on surveys conducted in 1890 and 1892 (Reid, 1896). At the time this map was made, recession amounted to 75 km. The present-day Muir Glacier is a small remnant of the glacier-ice cover in Glacier Bay that existed at the end of the 19th century. Major recession has affected virtually
all of the glaciers in the Glacier Bay region; however, some glaciers have readvanced. Landsat image, map, and cap-tion courtesy of Robert M. Krimmel, U.S. Geological Survey. Landsat 1 MSS image (1416–19480, band 7; 12 September 1973; Path 64, Row 19) is from the U.S. Geological Survey, EROS Data Center, Sioux, Falls, S. Dak.
K136 SATELLITE IMAGE ATLAS OF GLACIERS OF THE WORLD
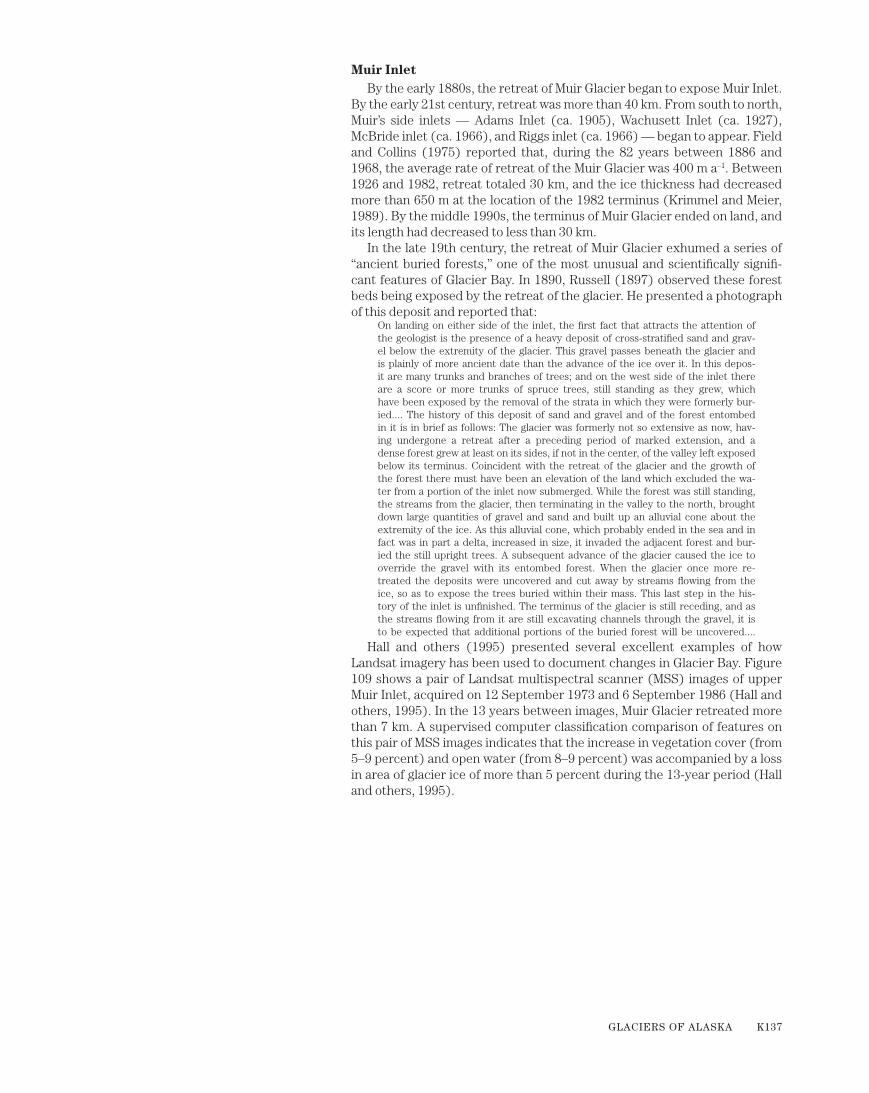
Muir InletBy the early 1880s, the retreat of Muir Glacier began to expose Muir Inlet.
By the early 21st century, retreat was more than 40 km. From south to north, Muir’s side inlets — Adams Inlet (ca. 1905), Wachusett Inlet (ca. 1927), McBride inlet (ca. 1966), and Riggs inlet (ca. 1966) — began to appear. Field and Collins (1975) reported that, during the 82 years between 1886 and 1968, the average rate of retreat of the Muir Glacier was 400 m a–1. Between 1926 and 1982, retreat totaled 30 km, and the ice thickness had decreased more than 650 m at the location of the 1982 terminus (Krimmel and Meier, 1989). By the middle 1990s, the terminus of Muir Glacier ended on land, and its length had decreased to less than 30 km.
In the late 19th century, the retreat of Muir Glacier exhumed a series of “ancient buried forests,” one of the most unusual and scientifically signifi-cant features of Glacier Bay. In 1890, Russell (1897) observed these forest beds being exposed by the retreat of the glacier. He presented a photograph of this deposit and reported that:
On landing on either side of the inlet, the first fact that attracts the attention of the geologist is the presence of a heavy deposit of cross-stratified sand and grav-el below the extremity of the glacier. This gravel passes beneath the glacier and is plainly of more ancient date than the advance of the ice over it. In this depos-it are many trunks and branches of trees; and on the west side of the inlet there are a score or more trunks of spruce trees, still standing as they grew, which have been exposed by the removal of the strata in which they were formerly bur-ied.... The history of this deposit of sand and gravel and of the forest entombed in it is in brief as follows: The glacier was formerly not so extensive as now, hav-ing undergone a retreat after a preceding period of marked extension, and adense forest grew at least on its sides, if not in the center, of the valley left exposed below its terminus. Coincident with the retreat of the glacier and the growth of the forest there must have been an elevation of the land which excluded the wa-ter from a portion of the inlet now submerged. While the forest was still standing, the streams from the glacier, then terminating in the valley to the north, brought down large quantities of gravel and sand and built up an alluvial cone about the extremity of the ice. As this alluvial cone, which probably ended in the sea and in fact was in part a delta, increased in size, it invaded the adjacent forest and bur-ied the still upright trees. A subsequent advance of the glacier caused the ice to override the gravel with its entombed forest. When the glacier once more re-treated the deposits were uncovered and cut away by streams flowing from the ice, so as to expose the trees buried within their mass. This last step in the his-tory of the inlet is unfinished. The terminus of the glacier is still receding, and as the streams flowing from it are still excavating channels through the gravel, it is to be expected that additional portions of the buried forest will be uncovered....
Hall and others (1995) presented several excellent examples of how Landsat imagery has been used to document changes in Glacier Bay. Figure 109 shows a pair of Landsat multispectral scanner (MSS) images of upper Muir Inlet, acquired on 12 September 1973 and 6 September 1986 (Hall and others, 1995). In the 13 years between images, Muir Glacier retreated more than 7 km. A supervised computer classification comparison of features on this pair of MSS images indicates that the increase in vegetation cover (from 5–9 percent) and open water (from 8–9 percent) was accompanied by a loss in area of glacier ice of more than 5 percent during the 13-year period (Hall and others, 1995).
GLACIERS OF ALASKA K137

Figure 109.— The reduction in glacierized area and volume is documented by these two annotated Landsat MSS false-color composite images of upper Muir Inlet acquired on 12 September 1973 and 6 September 1986. In the 13 years between images, the terminus of Muir Glacier (marked by the arrows) retreated more than 7 km. Burroughs Glacier (A) also suffered a significant loss in area. The increase in both the density and the quantity of red surfaces (color of vegetation in false-color infrared) is another line of evidence that documents the decrease in glacier cover. Figure from Hall and others (1995). Landsat 1 MSS image (1416–19480, bands 4, 5, 7; 12 September 1973; Path 64, Row 19) and Landsat 5 MSS image (5059019008624990, bands 4, 5, 7; 6 September 1986; Path 59, Row 19) are from the U.S. Geological Survey, EROS Data Center, Sioux Falls, S. Dak.
Adams Inlet Adams Glacier was named by Reid (1896) for a member of his 1892 field
party; the Southeast Tributary to Muir Glacier was also a name applied by Reid to the southeastern part of Muir Glacier. By the middle 1890s, the re-treat of Adams Glacier had begun to open an inlet to the southeast of the newly forming Muir Inlet. By 1962, the inlet was more than 10 km long, and the terminus of Adams Glacier was in a side valley, about 3 km from the inlet. By 1979, Adams Glacier had retreated another 4 km, leaving a large ice-cored moraine along its former western margin (AHAP photograph L194F4179 ac-quired on 11 August 1979). Stagnation and retreat have continued into the 21st century.
Casement Glacier (fig. 110), which has a terminus located on the northern side of the inlet, began to separate from the retreating Muir Glacier early in the 20th century. By 1911, it had become completely separated and had re-treated onto land (Field and Collins, 1975). By the middle 1960s, retreat had approached 3 km, and the terminus was surrounded by a large, pitted, ice-cored moraine. Stagnation and retreat have continued into the 21st century, with sediment-free ice occurring more than 5 km from the shore of Adams Inlet (fig. 107). Since the 1960s, Casement Glacier has received substantial attention from the glacial geology community as a natural laboratory for un-derstanding the dynamics of ice retreat and stagnation. More than a dozen
Case
men
t Glacie
r
Adams Inlet
Mui
r In
let
N
Figure 110.—11 August 1979 AHAP false-color infrared vertical aerial photograph of central Adams Inlet, Glacier Bay, St. Elias Mountains, and the area to the north. The terminus of Casement Glacier is surround-ed by a large pitted ice-cored moraine and a number of other ice retreat and stagnation features, including eskers, an ice-marginal lake, and a pitted outwash plain. AHAP pho-tograph no. L194F4177 from the GeoData Center, Geophysical Institute, University of Alaska, Fairbanks, Alaska. A larger version of this figure is available online.
K138 SATELLITE IMAGE ATLAS OF GLACIERS OF THE WORLD
journal articles have documented various aspects of esker formation (Price, 1966), lake dynamics (Lindsay, 1966; Moravek, 1973), and the evolution of collapsed glacial topography (McKenzie and Goodwin, 1987).
Wachusett InletVarious names have been used to describe the land area located on the
western side of Muir Inlet, about 20 km north of its mouth. Reid (1896) named the area the Cushing Plateau after Henry Cushing, a professor of geol-ogy at Western Reserve University and a member of Reid’s 1890 expedition. Reid called the glacier, which drained the plateau, the Northwest Tributary of Muir Glacier (Reid, 1892). After the visit of the Harriman Expedition in 1899, Reid’s Cushing Plateau was renamed Burroughs Glacier, after John Burroughs, a naturalist who was part of the Harriman Expedition. Accord-ing to Field and Collins (1975), the name Burroughs Glacier was assigned to the higher part of the Plateau Glacier in 1941. As this large ice mass has thinned and parts of it have become better defined, other names have been proposed. Reid’s Northwest Tributary was renamed Cushing Glacier by the IBC in 1923 (IBC, 1951), and Cooper named the ice covering the Cushing Plateau as Plateau Glacier in 1937 (Cooper, 1937).
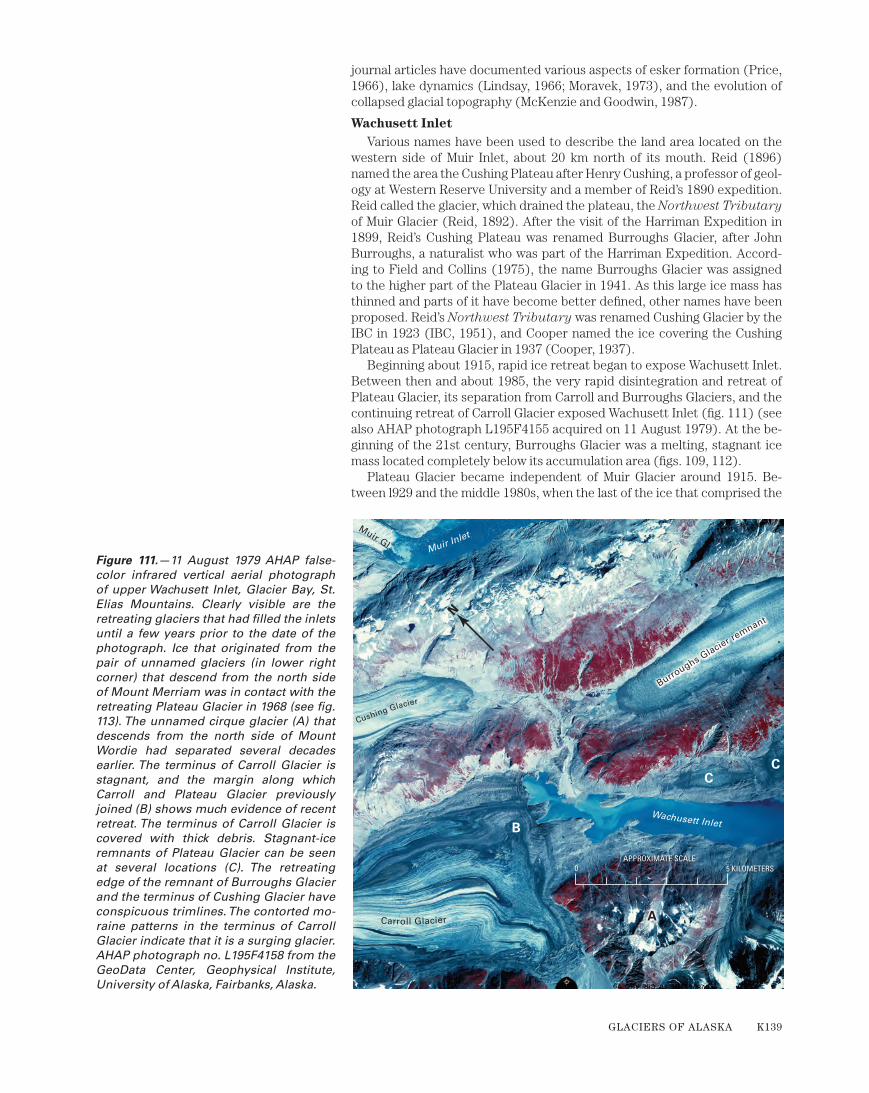
Beginning about 1915, rapid ice retreat began to expose Wachusett Inlet. Between then and about 1985, the very rapid disintegration and retreat of Plateau Glacier, its separation from Carroll and Burroughs Glaciers, and the continuing retreat of Carroll Glacier exposed Wachusett Inlet (fig. 111) (see also AHAP photograph L195F4155 acquired on 11 August 1979). At the be-ginning of the 21st century, Burroughs Glacier was a melting, stagnant ice mass located completely below its accumulation area (figs. 109, 112).
Plateau Glacier became independent of Muir Glacier around 1915. Be-tween l929 and the middle 1980s, when the last of the ice that comprised the
Carroll Glacier
Cushing Glacier
Burroughs Glacier re
mnant
Wachusett Inlet
A
B
CC
N
Muir Gl. Muir Inlet
5 KILOMETERS0APPROXIMATE SCALE
Figure 111.—11 August 1979 AHAP false-color infrared vertical aerial photograph of upper Wachusett Inlet, Glacier Bay, St. Elias Mountains. Clearly visible are the retreating glaciers that had filled the inlets until a few years prior to the date of the photograph. Ice that originated from the pair of unnamed glaciers (in lower right corner) that descend from the north side of Mount Merriam was in contact with the retreating Plateau Glacier in 1968 (see fig. 113). The unnamed cirque glacier (A) that descends from the north side of Mount Wordie had separated several decades earlier. The terminus of Carroll Glacier is stagnant, and the margin along which Carroll and Plateau Glacier previously joined (B) shows much evidence of recent retreat. The terminus of Carroll Glacier is covered with thick debris. Stagnant-ice remnants of Plateau Glacier can be seen at several locations (C). The retreating edge of the remnant of Burroughs Glacier and the terminus of Cushing Glacier have conspicuous trimlines. The contorted mo-raine patterns in the terminus of Carroll Glacier indicate that it is a surging glacier. AHAP photograph no. L195F4158 from the GeoData Center, Geophysical Institute, University of Alaska, Fairbanks, Alaska.
GLACIERS OF ALASKA K139

northwestern margin of Plateau Glacier melted away from the stagnant and downwasting terminus of Carroll Glacier, Wachusett Inlet increased in length to more than 20 km. AGS Glacier Studies Map No. 64–2–G9 (Field, 1965) doc-uments the rapid disappearance of Plateau Glacier and the exposure of Wa-chusett Inlet between 1916 and 1964. Figure 113, a 25 August 1968 oblique aerial photograph shows the continued retreat and location of the terminus of Plateau Glacier and the increase in open water in Wachusett Inlet between 1964 and 1988. It is based on an analysis of four aerial photographs: 29 August 1964, 25 August 1968, 5 September 1972, and 25 August 1988.
1968
1972
1988
1964
Figure 113.—Oblique aerial photograph of the rapidly retreating Plateau Glacier and the developing Wachusett Inlet, Glacier Bay, St. Elias Mountains acquired on 25 August 1968. Approximate positions of the terminus on 29 August 1964 (USGS photo no. K647–100), 5 September 1972 (USGS photo no. 72–R5–088) and 25 August 1988 (USGS photo no. 88–R1–198) are indicated. During the interval 1964 to 1988, Plateau Glacier retreated more than 5 km. USGS photograph no. 68–R2–238 by Austin Post, U.S. Geological Survey.
Figure 112.—Oblique aerial photograph of the Burroughs Glacier (fig. 109) on 12 September 1986. The stagnant ice mass is a remnant of the Muir Glacier complex of past decades which is now left with no accumu-lation area. The Burroughs Glacier Remnant is ablating at the rate of 5–10 m a–1. With the exception of the peaks, ridge crests, and distant ranges, all of the area in this pho-tograph was covered by ice in 1892 when H.F. Reid (1896) mapped Glacier Bay (fig. 108B). USGS photograph no. 86–R1–253 and figure caption by Robert M. Krimmel, U.S. Geological Survey.
K140 SATELLITE IMAGE ATLAS OF GLACIERS OF THE WORLD

Upper Muir Inlet
According to Field and Collins (1975), the location of the terminus of Muir Glacier (fig. 114) in 1968 corresponded to the location where the surface of the glacier extended 840 m above sea level in 1890. Seismic profiles showing the configuration of the walls and floor of the fjord between Muir Glacier and Riggs Glacier have been presented by Molnia (1983b, 1989b) who showed that the Muir Glacier had been grounded at 250 m below sea level, for a total thickness of about 1,100 m.
As Muir Glacier retreated, McBride Glacier became separated in 1945–46. By 28 June 1980, McBride Glacier had retreated more than 1 km from the mouth of its inlet (fig. 115). Near the beginning of the 1990s, the retreating
Figure 114.—11 August 1979 AHAP false-color infrared verti-cal aerial photographic mosaic of upper Muir Inlet, Glacier Bay, St. Elias Mountains. The tidewater termini of McBride, Riggs, and Muir Glaciers are clearly seen. When this area was photographed, a few icebergs and very little sediment were being discharged into the inlet. The stagnant Muir Remnant (A) was detached from the retreating Muir Glacier prior to the 1960s. The north arm of McBride Glacier provided
significant quantities of ice to Riggs Glacier prior to losing contact in the early 1970s. Large lateral and medial moraines mark its recent former extent. The unnamed hanging glacier (just east of Muir Glacier) separated from the retreating Muir Glacier about 1973. AHAP photograph nos. L194F4173 and L194F4174 from the GeoData Center, Geophysical Institute, University of Alaska, Fairbanks, Alaska.
Mui
r Gla
cier
A
Riggs Glacier
McBride Glacier
Muir Inlet
N
GLACIERS OF ALASKA K141

McBride Glacier had a length of about 24 km, a width at its face of 1.2 km, an area of 143 km2, and an AAR of 0.59 (table 2) (Viens, 1995). By 2004, McBride had retreated more than 2 km from the mouth of its inlet but continued to be an active tidewater glacier (fig. 115). The retreating Muir Glacier became independent of Riggs Glacier in 1961. During the first half of the 1960s, Muir retreated from Riggs at the rate of ~1 km a–1.
Riggs Glacier also thinned and continued to retreat into the 21st century (fig. 116). In the early 1990s, Riggs had a length of about 25 km, a width at its face of 1.5 km, an area of 126 km2, and an AAR of 0.72 (table 2) (Viens, 1995). By 2004, Riggs Glacier was about 1.3 km from the mouth of its inlet and had thinned more than 75 m, and its retreat had exposed bedrock along much of its northern margin. Sedimentation had built a delta in front of its eastern terminus.
As Muir Glacier thinned and retreated, upland ice was stranded in bedrock basins. Muir Remnant (fig. 117), located on the western side of Muir Inlet, is all that remained by 24 August 1963 to indicate the former majestic thickness of Muir Glacier. During the middle 1970s, the retreat rate of Muir Glacier was more than 1 km a–1. Near the beginning of the 1990s (fig. 118), Muir Glacier had decreased in length to 26.5 km. Its area was about 148 km2, the width at its face was 0.9 km, and its AAR was 0.75 (table 2) (Viens, 1995).
Muir Glacier retreated onto land in 1991. In 2004, it was continuing to thin and retreat and was more than 15 km from its former confluence with
Figure 115.—28 June 1980 east-looking oblique aerial photograph of the retreating terminus of McBride Glacier. Its terminus displayed two semicircular calving embay-ments. A falling tide was drawing the bergs into Muir Inlet through a channel in a recent recessional moraine. Both sides of the gla-cier show significant trimlines. Photograph by Bruce F. Molnia, U.S. Geological Survey.
Figure 116.—3 October 1979 east-looking oblique aerial photograph of the terminus of Riggs Glacier. In the five years between 1974 and 1979 aerial photographs, the two northern embayments have enlarged, and a bedrock outcrop has begun to be ex-posed between them. The loss of stagnant ice on the south side of Riggs Glacier has led to the development of a third embay-ment. Photograph by Bruce F. Molnia, U.S. Geological Survey.
K142 SATELLITE IMAGE ATLAS OF GLACIERS OF THE WORLD
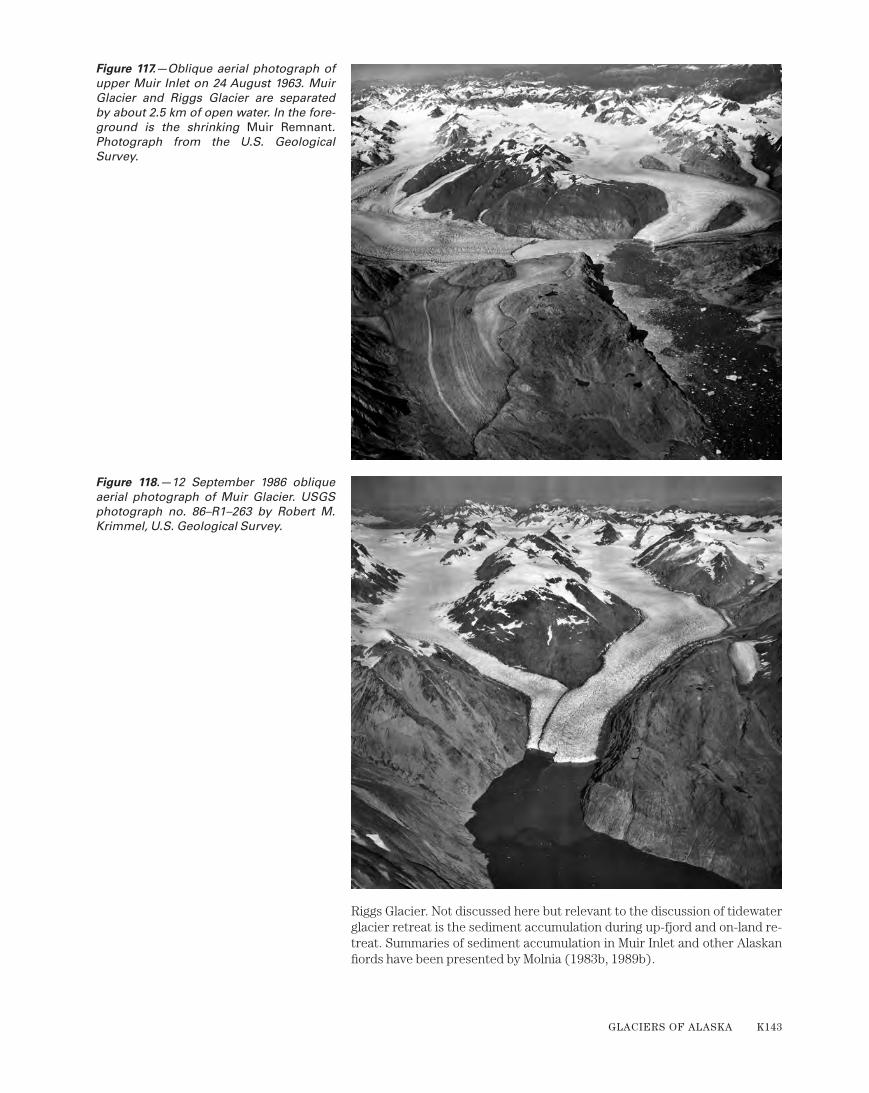
Riggs Glacier. Not discussed here but relevant to the discussion of tidewater glacier retreat is the sediment accumulation during up-fjord and on-land re-treat. Summaries of sediment accumulation in Muir Inlet and other Alaskan fiords have been presented by Molnia (1983b, 1989b).
Figure 117.—Oblique aerial photograph of upper Muir Inlet on 24 August 1963. Muir Glacier and Riggs Glacier are separated by about 2.5 km of open water. In the fore-ground is the shrinking Muir Remnant. Photograph from the U.S. Geological Survey.
Figure 118.—12 September 1986 oblique aerial photograph of Muir Glacier. USGS photograph no. 86–R1–263 by Robert M. Krimmel, U.S. Geological Survey.
GLACIERS OF ALASKA K143
Queen InletCarroll Glacier (fig. 111) was a tidewater glacier at the head of 11-km-long
Queen Inlet when it was first observed by Reid in 1892 (Reid, 1896). At that time, water depths exceeded 185 m at its terminus. It remained a tidewater glacier until about 1920, by which time an outwash plain had developed in front of its terminus. Surges occurred in 1919 and 1943 (Field, 1964) and from 1966 to 1968 (Field, 1969). The last surge resulted in several hundred meters of terminus advance. The surge pushed ice into part of the area previ-ously occupied by Plateau Glacier. By the mid-1970s, Carroll Glacier was only about 0.5 km from its 1890s position (AGS Glacier Studies Map No. 64–2–G4) (Field, 1965). Stagnation and very slow retreat have characterized the glacier into the 21st century (U.S. Bureau of Land Management [BLM] false-color in-frared vertical aerial photograph acquired on 26 May 1997). When the author visited Carroll Glacier in both 2003 and 2004, the lower 1.5 km was covered by thick debris; its terminus had thinned by more than 100 m from its early 20th century thickness, and, where depths had previously exceeded 185 m, sedimentation had filled the upper fjord to above sea level.
Rendu InletRendu Glacier was a tidewater glacier at the head of 16-km-long Rendu In-
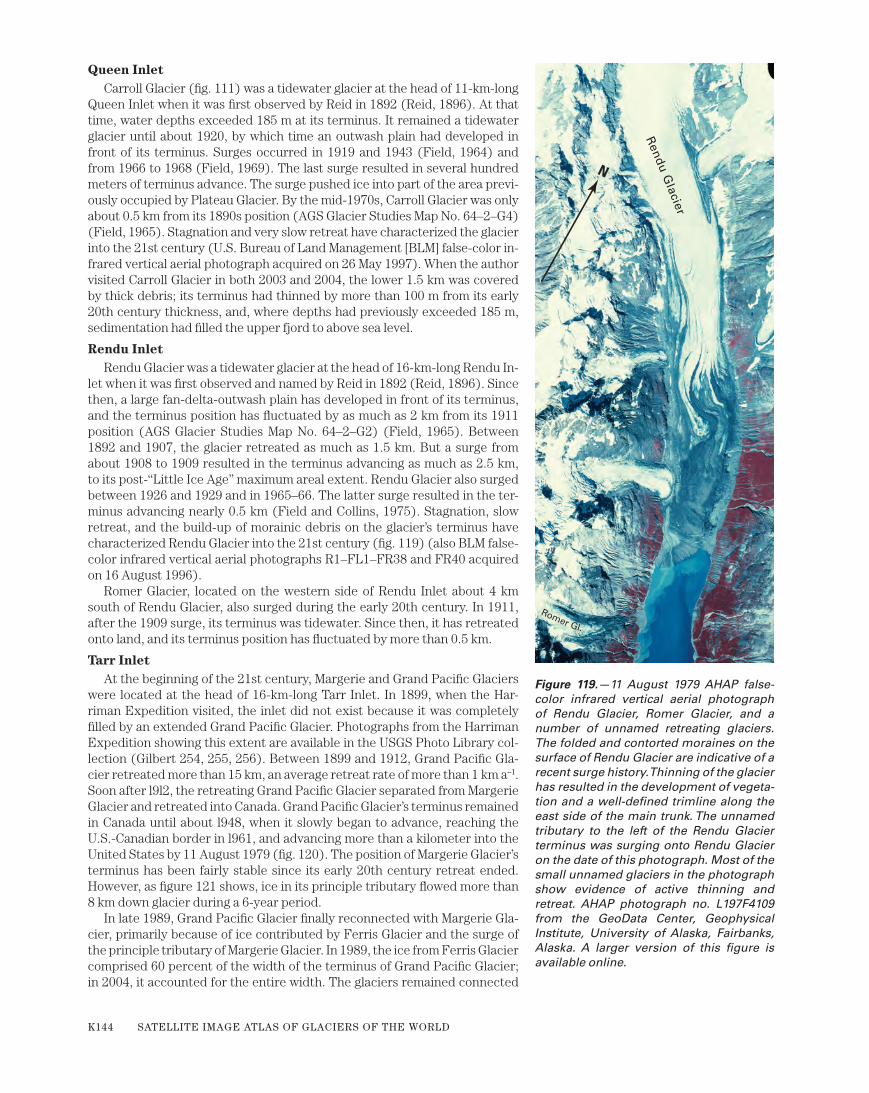
let when it was first observed and named by Reid in 1892 (Reid, 1896). Since then, a large fan-delta-outwash plain has developed in front of its terminus, and the terminus position has fluctuated by as much as 2 km from its 1911 position (AGS Glacier Studies Map No. 64–2–G2) (Field, 1965). Between 1892 and 1907, the glacier retreated as much as 1.5 km. But a surge from about 1908 to 1909 resulted in the terminus advancing as much as 2.5 km, to its post-“Little Ice Age” maximum areal extent. Rendu Glacier also surged between 1926 and 1929 and in 1965–66. The latter surge resulted in the ter-minus advancing nearly 0.5 km (Field and Collins, 1975). Stagnation, slow retreat, and the build-up of morainic debris on the glacier’s terminus have characterized Rendu Glacier into the 21st century (fig. 119) (also BLM false-color infrared vertical aerial photographs R1–FL1–FR38 and FR40 acquired on 16 August 1996).
Romer Glacier, located on the western side of Rendu Inlet about 4 km south of Rendu Glacier, also surged during the early 20th century. In 1911, after the 1909 surge, its terminus was tidewater. Since then, it has retreated onto land, and its terminus position has fluctuated by more than 0.5 km.
Tarr InletAt the beginning of the 21st century, Margerie and Grand Pacific Glaciers
were located at the head of 16-km-long Tarr Inlet. In 1899, when the Har-riman Expedition visited, the inlet did not exist because it was completely filled by an extended Grand Pacific Glacier. Photographs from the Harriman Expedition showing this extent are available in the USGS Photo Library col-lection (Gilbert 254, 255, 256). Between 1899 and 1912, Grand Pacific Gla-cier retreated more than 15 km, an average retreat rate of more than 1 km a–1. Soon after l9l2, the retreating Grand Pacific Glacier separated from Margerie Glacier and retreated into Canada. Grand Pacific Glacier’s terminus remained in Canada until about l948, when it slowly began to advance, reaching the U.S.-Canadian border in l961, and advancing more than a kilometer into the United States by 11 August 1979 (fig. 120). The position of Margerie Glacier’s terminus has been fairly stable since its early 20th century retreat ended. However, as figure 121 shows, ice in its principle tributary flowed more than 8 km down glacier during a 6-year period.
In late 1989, Grand Pacific Glacier finally reconnected with Margerie Gla-cier, primarily because of ice contributed by Ferris Glacier and the surge of the principle tributary of Margerie Glacier. In 1989, the ice from Ferris Glacier comprised 60 percent of the width of the terminus of Grand Pacific Glacier; in 2004, it accounted for the entire width. The glaciers remained connected
Rendu G
lacier
Romer Gl.
N
Figure 119.—11 August 1979 AHAP false-color infrared vertical aerial photograph of Rendu Glacier, Romer Glacier, and a number of unnamed retreating glaciers. The folded and contorted moraines on the surface of Rendu Glacier are indicative of a recent surge history. Thinning of the glacier has resulted in the development of vegeta-tion and a well-defined trimline along the east side of the main trunk. The unnamed tributary to the left of the Rendu Glacier terminus was surging onto Rendu Glacier on the date of this photograph. Most of the small unnamed glaciers in the photograph show evidence of active thinning and retreat. AHAP photograph no. L197F4109 from the GeoData Center, Geophysical Institute, University of Alaska, Fairbanks, Alaska. A larger version of this figure is available online.
K144 SATELLITE IMAGE ATLAS OF GLACIERS OF THE WORLD

(BLM false-color infrared vertical aerial photograph R3–FL6–FR57 acquired on 26 May 1997) until the winter of 1997–98, when the melting of stagnant ice left by the retreat of the terminus of Grand Pacific Glacier resulted in the separation of the two glaciers. When the author visited Grand Pacific Gla-cier in 2003 and 2004, its terminus was debris covered and retreating and was located several hundred meters north of the point where the two had rejoined.
Near the beginning of the 1990s, Grand Pacific Glacier had a length of about 60 km, a width at its face of 2.7 km, an area of 654 km2, and an AAR of 0.70; Margerie Glacier had a length of about 34 km, a width at its face of 1.9 km, an area of 174 km2, and an AAR of 0.82 (table 2) (Viens, 1995). Grand Pacific Glacier had an accumulation area of 459 km2 and an ablation area of
Eli
za G
laci
er
Gra
nd P
acifi
c G
laci
er
Margerie Glacier
Ferris Glacier
Tarr Inlet
N
CANADAUNITED STATES
Figure 120.—Annotated 11 August 1979 AHAP false-color infrared vertical aerial photograph of the head of Tarr Inlet show-ing the position of the nearly connected termini of Margerie and Grand Pacific Glaciers. Ferris Glacier provided much of the ice to the then advancing terminus of Grand Pacific Glacier. In 1931, in com-parison, Ferris Glacier had only contrib-uted 10 percent of the ice of the terminus. AHAP photograph no. L198F4014 from the GeoData Center, Geophysical Institute, University of Alaska, Fairbanks, Alaska.
GLACIERS OF ALASKA K145

195 km2, whereas Margerie Glacier had an accumulation area of 143 km2 and an ablation area of 31 km2 (table 2) (Viens, 1995).
Johns Hopkins InletAt the time of Reid’s 1892 visit, Johns Hopkins Inlet was completely filled
with glacier ice that extended more than 10 km beyond its late 20th century position (fig. 107). This ice had been a tributary to the massive Grand Pacific Glacier, which, in 1892, covered the northern end of Russell Island and en-circled it to the west. Reid applied the name Reid Inlet to the upper end of Glacier Bay southeast of Russell Island and adjacent to Grand Pacific Glacier. This name was adopted by the American Association for the Advancement of Science (AAAS) in 1893 (Orth, 1967, 1971). By 1910, as Grand Pacific Glacier continued to retreat and separate into individual glaciers, an inlet north of Russell Island began to emerge. It was named Tarr Inlet by Lawrence Martin in 1912 for Ralph Tarr, who visited the inlet in 1911. However, the name Reid Inlet continued to be applied to the inlet at the terminus of Johns Hopkins Glacier. In 1931, Cooper proposed the name Johns Hopkins Inlet for this inlet. The name was formally adopted by the BGN in 1954. The name Reid Inlet was then restricted to the inlet formed at the terminus of Reid Glacier.
Between l892 and 1929, Johns Hopkins Glacier retreated more than l8 km and separated into several dozen individual glaciers (fig. 107). Since then, the terminus position of Johns Hopkins Glacier has experienced numerous fluc-tuations, but the trend has been dominated by a readvance, which continues into the early 21st century (AGS Glacier Studies Map No. 64–2–G1) (Field, 1965). Near the beginning of the 1990s, Johns Hopkins Glacier (fig. 122) had a length of about 60 km, an area of 654 km2, a width at its face of 1.7 km, and an AAR of 0.70 (table 2) (Viens, 1995). In the middle 1990s, the advance of Johns Hopkins Glacier resulted in its briefly joining with Gilman Glacier. At the beginning of the 21st century, Johns Hopkins Glacier was separated from Gilman Glacier and was located about 0.3 km up-fjord. They had rejoined
Figure 121.—Segments of four Landsat MSS images of Margerie Glacier, ac-quired between 12 September 1973 and 6 September 1986, show how a post-Sep-tember 1980 surge in the principal tributary affected the terminus. Between 1973 and 1980, little change occurred. However, the unnamed tributary advanced more than 3 km between 20 September 1980 and 6 September 1983. It flowed another 5 km downglacier between 6 September 1983 and 6 September 1986. Figure from Hall and others (1995).
K146 SATELLITE IMAGE ATLAS OF GLACIERS OF THE WORLD

when the author observed them in late July 2002. In September 2004, the two glaciers were still in contact, although Johns Hopkins Glacier had re-treated approximately 200 m from its 2002 position.
During the period of the Landsat baseline, six glaciers in Johns Hopkins Inlet reached tidewater and produced icebergs (fig. 123): Johns Hopkins, Toyatte, Kashoto, Hoonah, Gilman, and Lamplugh Glaciers. Hoonah, Kasho-to, and Gilman Glaciers are hanging glaciers that descend to tidewater and are significantly smaller than the other tidewater glaciers in the inlet. Near the beginning of the 1990s, Hoonah Glacier had a length of 7 km, an area of 12 km2, a width at its face of 0.2 km, and an AAR of 0.70 (table 2) (Viens, 1995). Kashoto Glacier had a length of 5 km, an area of 5 km2, a width at its face of 0.1 km, and an AAR of 0.94 (table 2) (Viens, 1995). Gilman Glacier, the largest of the three, had a length of 12 km, an area of 35 km2, a width at its face of 0.45 km, and an AAR of 0.88 (table 2) (Viens, 1995).
Lamplugh Glacier is located just inside the mouth of Johns Hopkins Inlet on its southern side. It separated from the receding Johns Hopkins Glacier sometime before 1906 and has remained a tidewater glacier. Since 1929, its terminus has fluctuated as much as 1.5 km (AGS Glacier Studies Map No. 64–2–G5) (Field, 1965). Field and Collins (1975) reported that Lamplugh Glacier retreated 800 m between 1935 and 1941. Near the beginning of the 1990s, Lamplugh Glacier had a length of about 32 km, an area of 170 km2, a width at its face of 0.85 km, and an AAR of 0.85; its accumulation area was 145 km2, and its ablation area was 25 km2 (table 2) (Viens, 1995). When the author observed its terminus in 2003 and 2004, it was more than 0.5 km for-ward of its 1941 position. However, fresh till located about 200 m forward of the terminus documented an even greater post-1941 advance that occurred in the late 1970s and early 1980s.
Figure 122.—Oblique aerial photograph of Johns Hopkins Glacier on 12 September 1986. Another terminus of a tidewater glacier, Gilman Glacier, is in the left fore-ground. USGS photograph no. 86–R2–292 by Robert M. Krimmel, U.S. Geological Survey.
Kad
acha
n G
l.
Johns Hopkins Glacier Johns Hopkins Inlet
Gilm
an G
lacier
Tyeen Glacier
Ho
on
ah
Gla
cier
Clark G
lacier
Kash
oto
Glacier
Kad
ach
an G
l.
Toyatte G
lacier
N
Figure 123.—Annotated 14 August 1978 AHAP false-color infrared vertical photo-graph of the head of Johns Hopkins Inlet showing the position of Johns Hopkins, Toyatte, Kashoto, Hoonah, and Gilman Glaciers and a number of named and un-named glaciers that descend the inlet’s valley walls but did not extend into tidewa-ter, including Clark, Tyeen, and Kadachan Glaciers. The fjord depth in front of Gilman Glacier is 350 m. AHAP photograph no. LXXXF4983 from the GeoData Center, Geophysical Institute, University of Alaska, Fairbanks, Alaska. A larger version of this figure is available online.
GLACIERS OF ALASKA K147

Figure 124, an 11 August 1979 AHAP photograph of the northwestern end of Glacier Bay, shows the relationship of Lamplugh Glacier, Reid Glacier and Inlet, and Johns Hopkins Inlet. A BLM photograph (no. R3–FL7–FR75) taken on 26 May 1997 shows the late-20th century location of Lamplugh Glacier.
Many other glaciers descend adjacent mountain slopes, some existing only at higher elevations (fig. 125). Some reach the inlet’s walls but remain above tidewater. Named glaciers include Clark, Tyeen, Kadachan, John, Charley, and Topeka Glaciers. John and Charley Glaciers were named for Tlingit guides who helped Muir in l879. [Editors’ note: According to Mark F. Meier (written commun., 2004), some of the glaciers that flow into Johns Hopkins Inlet include some unusual surge-type glaciers noted by Field. For example, the Tyeen Glacier becomes a tidewater glacier during a surge; the surge of a tributary glacier apparently causes a surge of the main stem (see figure in Meier and Post, 1969).]
Reid InletReid Glacier, which has a length of about 17 km, an area of 49 km2, a width
at its face of 0.85 km, and an AAR of 0.64 (table 2) (Viens, 1995), sits at the head of 3-km-long Reid Inlet (fig. 124). A large terminal moraine located at the mouth of the inlet was formed during the first three decades of the 20th century. Between 1929 and 1941, the glacier retreated about 2.5 km (AGS Glacier Studies Map No. 64–2–G3) (Field, 1965). Since then, the ter-minus has thinned but remained nearly stationary, fluctuating within several hundred meters of its 1941 position. The growth of outwash fans along both margins of the glacier has helped to stabilize the terminus. At the end of the 20th century, a BLM photograph (no. R3–FL6–FR70), taken on 26 May 1997, shows that Reid Glacier was slowly retreating. Retreat continued in 2004.
Hugh Miller, Charpentier, and Geikie InletsLocated on the southwestern side of Glacier Bay, the glaciers that filled
Hugh Miller, Charpentier, and Geikie Inlets separated from the receding Gla-cier Bay ice trunk between 1860 and 1880. Muir named the glacier and the inlet in front of it for Scottish geologist Hugh Miller in 1879. By 1892, contin-ued retreat of Hugh Miller Glacier resulted in the formation of two separate ice masses. Reid (1896) called these Hugh Miller Glacier and Charpentier Glacier. By the time Muir revisited Hugh Miller Fiord in June 1899 (fig. 126), it had become an open inlet, as had Queen, Rendu, and Reid Inlets. Between 1892 and 1968, Hugh Miller Glacier retreated about 7 km, an average rate of nearly 100 m a–1. As it retreated, it separated from Scidmore Glacier to its north and several unnamed ice masses. By 11 August 1979, it had retreated nearly another kilometer (fig. 127). At the end of the 20th century, Hugh Miller Glacier was continuing to retreat.
Charpentier Glacier has continued to retreat since separating from Hugh Miller Glacier. By the end of the 20th century, it had retreated nearly 10 km. Favorite and Maynard Glaciers separated early in the 20th century; Favorite Glacier disappeared between 1919 and 1926.
Similarly, in 1879, Muir named Geikie Glacier for Scottish geologist James Geikie, author of The Great Ice Age, a book that provided Muir with some of his knowledge of glacier processes. By 1892, continued retreat of Geikie Glacier resulted in two separate ice masses. Reid (1896) called these Gei-kie and Wood Glaciers. Wood Glacier completely disappeared by the early 1940s. Except for a small advance around 1920 (Field and Collins, 1975), Geikie Glacier has continued to retreat since Reid observed it. It retreated above tidewater and onto land about 1911 (AGS Glacier Studies Map No. 64–2–G7) (Field, 1965). By 1968, it had retreated nearly 5 km. By 11 August 1979, it had developed an ice-marginal lake and a large lateral ice-cored stag-nant moraine (fig. 127). Retreat and stagnation have continued into the 21st century.
Reid
Inle
t
Lam
plu
gh
Gla
cier
Russell Island
Tarr InletJohns Hopkins Inlet
Reid
Gla
cier
N
Figure 124.—11 August 1979 AHAP false-color infrared vertical aerial photographic mosaic of the lower reaches of Lamplugh and Reid Glaciers. Exposed vegetation-free bedrock along the lateral margins of both glaciers suggests a recent thinning of both glaciers. At the time of the photograph, Lamplugh Glacier was advancing, and Reid Glacier was retreating. AHAP photograph nos. L198F4018 and L198F4019 from the GeoData Center, Geophysical Institute, University of Alaska, Fairbanks, Alaska. A larger version of this figure is available online.
Figure 125.—27 July 1980 southeast-look-ing photograph of the summit of 2,500-m-high Mount Abbe, located adjacent to Johns Hopkins Inlet. Numerous small alpine glaciers are located on its summit and flanks, forming wherever topography permits the accumulation of snow. Most glaciers show evidence of recent thinning and retreat. Photograph by Bruce F. Molnia, U.S. Geological Survey. A larger version of this figure is available online.
K148 SATELLITE IMAGE ATLAS OF GLACIERS OF THE WORLD

Glaciers of the Glacier Bay National Park and Preserve Region from West of Glacier Bay to the Alsek River
The Fairweather Range stretches more than 120 km along the Gulf of Alaska from Cross Sound to the Alsek River. Eight summits reach elevations exceeding 3,000 m: Mount Fairweather (4,664 m), Mount Quincy Adams (4,134 m), Mount Root (3,920 m), Mount Crillon (3,879 m), Mount Watson (3,815 m), Mount Salisbury (3,710 m), Lituya Mountain (3,635 m) and Mount La Perouse (3,270 m). A dozen large named glaciers flow from the heights of the Fairweather Range to near sea level. One, La Perouse Glacier, frequently fluctuates at the shoreline of the Pacific Ocean, and at times is the only calv-ing glacier in Alaska that discharges icebergs directly into the Pacific Ocean.
Named Fairweather Range glaciers include Brady, Finger, La Perouse, South and North Crillon, Cascade, Lituya, Desolation, Fairweather, Sea Ot-ter, Grand Plateau, and Alsek Glaciers. Several are small piedmont glaciers that almost reach the Pacific Ocean. From the perspective of plate tectonics, several named glaciers and a number of unnamed glaciers flow from a source area on the North American Plate into the Fairweather Fault, a trench that formed along the boundary with the Pacific Plate. Several, including La Per-ouse, Fairweather, and Grand Plateau Glaciers, flow across the fault and ter-minate on the Pacific Plate (fig. 128).
Hug
h M
iller
Gla
cier
Mayn
ard G
l.
Gei
kie
Gla
cier
Charpentier Glacier
Au
rora G
lacier
Charpentie
r Inlet
Geikie Inlet
N
Figure 126.—June 1899 photograph by USGS geologist Grove Karl Gilbert of part of the West Arm of Glacier Bay, taken from Hugh Miller Inlet. John Muir stands at the lower left. The main West Arm glacier ter-minus is located nearly 30 km to the north. Carroll Glacier, also nearly 30 km distant, is located at the head of Queen Inlet, located to the left of the photograph. USGS Photo Library photograph Gilbert 284. A larger version of this figure is available online.
Figure 127.—11 August 1979 AHAP false-color infrared vertical aerial photographic mosaic of the southwest side of Glacier Bay. The mosaic covers the area from Geikie Inlet to Scidmore Bay. The principal glaciers present are Geikie, Charpentier, Hugh Miller, and Aurora Glaciers. The smaller Maynard Glacier is also visible. At the beginning of the 20th century, this en-tire area was covered by a large ice mass, with several tidewater termini. All of the glaciers are thinning and retreating. AHAP photograph nos. L198F4022 and L198F4023 are from the GeoData Center, Geophysical Institute, University of Alaska, Fairbanks, Alaska. A larger version of this figure is available online.
Figure 128.—24 August 1987 photograph of glaciers flowing into the trench of the Fairweather Fault, looking northwest at the advancing termini of Lituya and North Crillon Glaciers. Both glaciers are building large outwash plain fan deltas in front of their termini. Compare with figures 136 and 137. USGS pho-tograph no. 87–R2–101(B) by Robert M. Krimmel, U.S. Geological Survey.
GLACIERS OF ALASKA K149

Brady GlacierBrady Glacier, the largest glacier in the Fairweather Range, has a length of
51 km and an area of 590 km2 (table 2) (Viens, 1995); it heads in the same accu-mulation area as Reid and Lamplugh Glaciers. It flows southward, ending just above sea level at the head of a 6-km-long outwash-plain–tidal-delta complex (fig. 129). [Editors’ note: According to Mark F. Meier (written commun., 2004), the history of the Brady Glacier represents a classic example of the termination of the slow advance phase of a tidewater glacier's instability as described by Post (1975) (see fig. 42).] When Vancouver observed Brady Glacier in 1794, it was a tidewater glacier with its terminus calving icebergs directly into the wa-ters of Taylor Bay. During the 19th century, its terminus advanced as much as 8 km (Klotz, 1899). [Editors’ note: According to Austin Post (written commun., 2004), Klotz was mistaken; a close perusal of Vancouver’s report (1798) proves that the tidal terminus of Brady Glacier was near where the present-day land-ending terminus is located.] Brady Glacier began building the outwash plain that fronts and separates it from the waters of Taylor Bay in the last quarter of the 19th century (Muir, 1915). Between 1926 and 1977, the sediment plain ex-panded in length by more than 4 km and increased in area by more than 20 km2 (Molnia, 1979) (fig. 130). In the early and middle 1970s, its terminus was stable or slowly advancing. However, by the early 1980s, it was thinning and retreating at the terminus and at many locations along its sides, resulting in the formation of many ice-marginal lakes (USGS oblique aerial photograph no. 84–R3–103 acquired on 31 August 1984). This lateral retreat was observed by Bengtson as early as 1950 (Bengtson, 1962). When the author observed the glacier in August 1999, June 2003, and June 2004, its terminus was slowly retreating. In 1999, continued lateral retreat and thinning of the ice margin resulted in the connection of previously separated North and South Trick Lakes into a single Trick Lake, located on the western margin of the glacier about 3 km from the terminus (BLM false-color infrared vertical aerial photograph nos. R7–FL13–FR207–FR209 acquired on 2 August 1999). Near the beginning of the 1990s, Brady Glacier had an AAR of 0.65, along with an accumulation area of 382 km2 and an ablation area of 208 km2 (table 2) (Viens, 1995).
Several distributary lobes flow from the main trunk of Brady Glacier to both the east and the west. Three west-side debris-covered lobes supply much of the flow of the Dixon River. During the Landsat baseline period, all three lobes showed significant evidence of retreat and thinning. The terminus of the southernmost of the three is surrounded by North Deception Lake, an ice-marginal lake. Retreat continued into the 21st century (BLM false-color infra-red vertical aerial photograph no. R4–FR34 acquired on 26 May 1997).
Brady Glacier has received considerable attention because the Freemont Mining Company discovered abundant massive and disseminated nickel-cop-per sulfides in three nunataks located near the western edge of the glacier in 1958. This location, at an elevation of about 1,000 m, is about 20 km from the closest Pacific Ocean coastline at Palma Bay. Along the centerline of the gla-cier, the nunataks are about 30 km from the terminus. The maximum glacier thickness and the ice thickness in the area of the nunataks are not known. There are no immediate plans for mining this deposit.
A number of other unnamed glaciers originate in the mountains north of Palma Bay adjacent to the westernmost Brady Glacier lobe. Several glacier termini (fig. 129) were calving large numbers of icebergs into adjacent ice-
Taylor Bay
BradyGlacier
Graves Harbor
Dixon River
Dixon River
N. Deception Lake
S. Deception Lake
N. Trick Lake
S. Trick Lake
A
N
Figure 129.—Annotated 12 August 1979 AHAP false-color infrared vertical aerial photographic mosaic of the Brady Glacier, its outwash plain, and Taylor Bay. Although the terminus of Brady Glacier was advancing, numerous lateral margin lakes, such as the Trick Lakes and North Deception Lake, indicate that the glacier was thinning on its sides. Adjacent glaciers, such as the unnamed glacier (A), also showed evidence of thinning and retreat. AHAP photograph nos. L200F4575, L200F4577, and L200F4579 are from the GeoData Center, Geophysical Institute, University of Alaska, Fairbanks, Alaska.
K150 SATELLITE IMAGE ATLAS OF GLACIERS OF THE WORLD

marginal lakes when the author photographed them on 12 August 1979 and in 1997, 2003, and 2004. One of the unnamed glaciers (fig. 131) showed a conspicuous trimline. All of the glaciers show multiple signs of recent re-treat. [Editors’ note: According to Austin Post (written commun., 2004), the unofficially named Palma Glacier formed a 4-km-long proglacial lake during the period between 1970 and 2000.]
Figure 130.—16 September 1966 oblique aerial photograph of the advancing termi-nus of Brady Glacier and the developing outwash plain delta. USGS photograph no. 6610–7 by Austin Post, U.S. Geological Survey.
Figure 131.—12 September 1973 oblique aerial photograph of the retreating and thinning unnamed glacier located north of Palma Bay. Iceberg calving into its ice-mar-ginal lake is a significant factor in its rapid retreat. Note the conspicuous trimline. USGS photograph no. 73–L2–120 by Austin Post, U.S. Geological Survey.
GLACIERS OF ALASKA K151
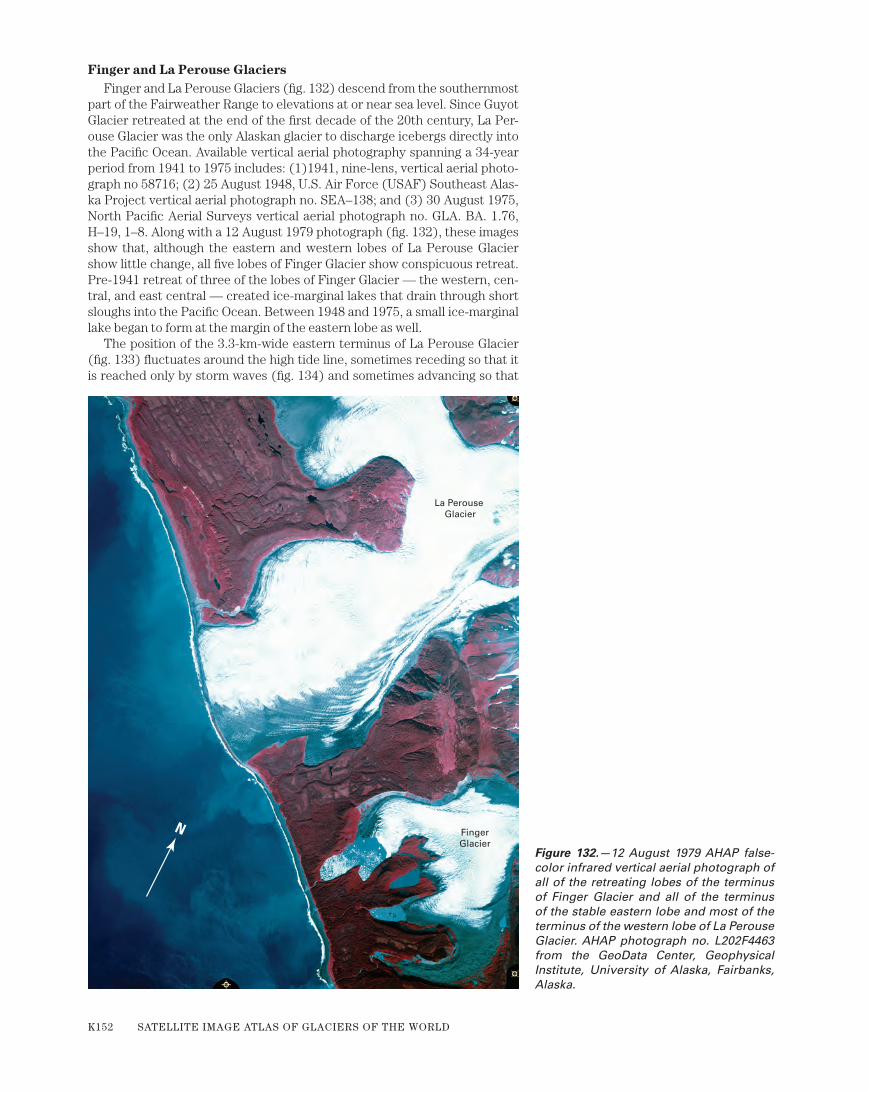
Finger and La Perouse Glaciers Finger and La Perouse Glaciers (fig. 132) descend from the southernmost
part of the Fairweather Range to elevations at or near sea level. Since Guyot Glacier retreated at the end of the first decade of the 20th century, La Per-ouse Glacier was the only Alaskan glacier to discharge icebergs directly into the Pacific Ocean. Available vertical aerial photography spanning a 34-year period from 1941 to 1975 includes: (1)1941, nine-lens, vertical aerial photo-graph no 58716; (2) 25 August 1948, U.S. Air Force (USAF) Southeast Alas-ka Project vertical aerial photograph no. SEA–138; and (3) 30 August 1975, North Pacific Aerial Surveys vertical aerial photograph no. GLA. BA. 1.76, H–19, 1–8. Along with a 12 August 1979 photograph (fig. 132), these images show that, although the eastern and western lobes of La Perouse Glacier show little change, all five lobes of Finger Glacier show conspicuous retreat. Pre-1941 retreat of three of the lobes of Finger Glacier — the western, cen-tral, and east central — created ice-marginal lakes that drain through short sloughs into the Pacific Ocean. Between 1948 and 1975, a small ice-marginal lake began to form at the margin of the eastern lobe as well.
The position of the 3.3-km-wide eastern terminus of La Perouse Glacier (fig. 133) fluctuates around the high tide line, sometimes receding so that it is reached only by storm waves (fig. 134) and sometimes advancing so that
N
La Perouse Glacier
FingerGlacier
Figure 132.—12 August 1979 AHAP false-color infrared vertical aerial photograph of all of the retreating lobes of the terminus of Finger Glacier and all of the terminus of the stable eastern lobe and most of the terminus of the western lobe of La Perouse Glacier. AHAP photograph no. L202F4463 from the GeoData Center, Geophysical Institute, University of Alaska, Fairbanks, Alaska.
K152 SATELLITE IMAGE ATLAS OF GLACIERS OF THE WORLD

it extends beyond the surf zone into the Pacific Ocean. Photographs taken by Gilbert (fig. 66) during the Harriman expedition in 1899 show that its ter-minus was in the surf zone and that its northwestern margin had recently advanced into the adjacent forest. Sixty-seven years later, when it was pho-tographed on 16 September 1966, the eastern lobe terminus extended be-yond the surf zone, with a face that was more than 50 m high (fig. 135A). At that time, its small eastern distributary lobe showed evidence of significant thinning and retreat (fig. 135B). At the start of the 1990s, La Perouse Glacier had a length of about 25 km, an area of 147 km2, a width at its face of 3.3 km,
Figure 133.—12 September 1986 oblique aerial photograph of the 3.3-km-wide east-ern terminus of La Perouse Glacier. The glacier originates in the Fairweather Range and is the only Alaskan glacier to occasion-ally discharge icebergs directly into the Pacific Ocean. Photograph no. 86–R2–022 from Robert M. Krimmel, U.S. Geological Survey.
Figure 135.—Two 16 September 1966 oblique aerial photo-graphs of the eastern lobe terminus of La Perouse Glacier. A, View of the eastern terminus extending beyond the surf zone, with an ice face that was more than 50 m high. USGS photograph no. 6610–65 by Austin Post, U.S. Geological Survey.
Figure 135.—B, View of the eastern edge of the extended ter-minus and a small eastern distributary of the lobe showing evidence of significant thinning and retreat. USGS photo-graph no. 6610–68 by Austin Post, U.S. Geological Survey.
Figure 134.—18 June 1978 northwest-look-ing oblique aerial photograph of part of the eastern terminus of La Perouse Glacier. The terminus is located approximately 30 m behind the high-tide line. Photograph by Bruce F. Molnia, U.S. Geological Survey.
GLACIERS OF ALASKA K153

and an AAR of 0.67 (table 2) (Viens, 1995). When it was observed by the author on 2 August 1999 and 18 June 2004, the terminus was located at the shoreline (BLM false-color infrared vertical aerial photograph no. 7–165).
West of La Perouse Glacier, South and North Crillon Glaciers descend from the southern flank of the Fairweather Range into the plate boundary fault trench, where their adjacent margins have coalesced (fig. 27; see also fig. 128). North Crillon Glacier flows only to the northwest, terminating in Lituya Bay. However, ice from South Crillon Glacier flows in opposite direc-tions; one part of South Crillon Glacier flows to the southeast into Crillon Lake, and one part flows to the southwest, merging with and nearly reaching the terminus of North Crillon Glacier at Lituya Bay. Between 1929 and 1961, South Crillon Glacier advanced more than 300 m into Crillon Lake. Since then, its terminus has fluctuated. When it was observed on 25 June 1998, South Crillon Glacier terminated in the lake but showed no evidence of re-cent iceberg calving (BLM false-color infrared vertical aerial photograph no. R6–FL19–FR184). In 2003 and 2004, it was advancing and displacing trees along its margins. Goldthwait and others (1963) presented a summary of the Holocene and Pleistocene histories of the Crillon Glaciers.
Glaciers of Lituya BayLituya Bay, a 15-km-long T-shaped fjord, contains three named glaciers—
North Crillon Glacier, Cascade Glacier, and Lituya Glacier—all of which were tidewater at various times during the 20th century (fig. 136). A large terminal moraine at the mouth of the bay and tree-covered stagnant glacier ice locat-ed on the western side of the bay are evidence that an expanded glacier filled the fjord during the “Little Ice Age” (Goldthwait and others, 1963). In l786, when the bay was first mapped by La Pérouse (fig. 9A), it was T shaped, and five glaciers were present. Each glacier in the approximately 10 km-long top of the T, (a segment of the Fairweather Fault) terminated at or near tidewa-ter, a pair in each of the upper ends of the T and one at the head of the fjord. Lituya Glacier, named by J.B. Mertie in 1917 (Orth, 1967, 1971, p. 589), is the westernmost of the five glaciers and descends from the Fairweather Range into Desolation Valley, flowing in both directions; the southeastward-flowing
N
Figure 136.—12 August 1979 AHAP false-color infrared vertical aerial photograph of most of Lituya Bay, showing the positions of the then advancing tidewater North Crillon (right) and Lituya Glaciers (left) and the relatively stable terminus of the smaller Cascade Glacier (center). AHAP photo-graph no. L202F4459 from the GeoData Center, Geophysical Institute, University of Alaska, Fairbanks, Alaska.
K154 SATELLITE IMAGE ATLAS OF GLACIERS OF THE WORLD
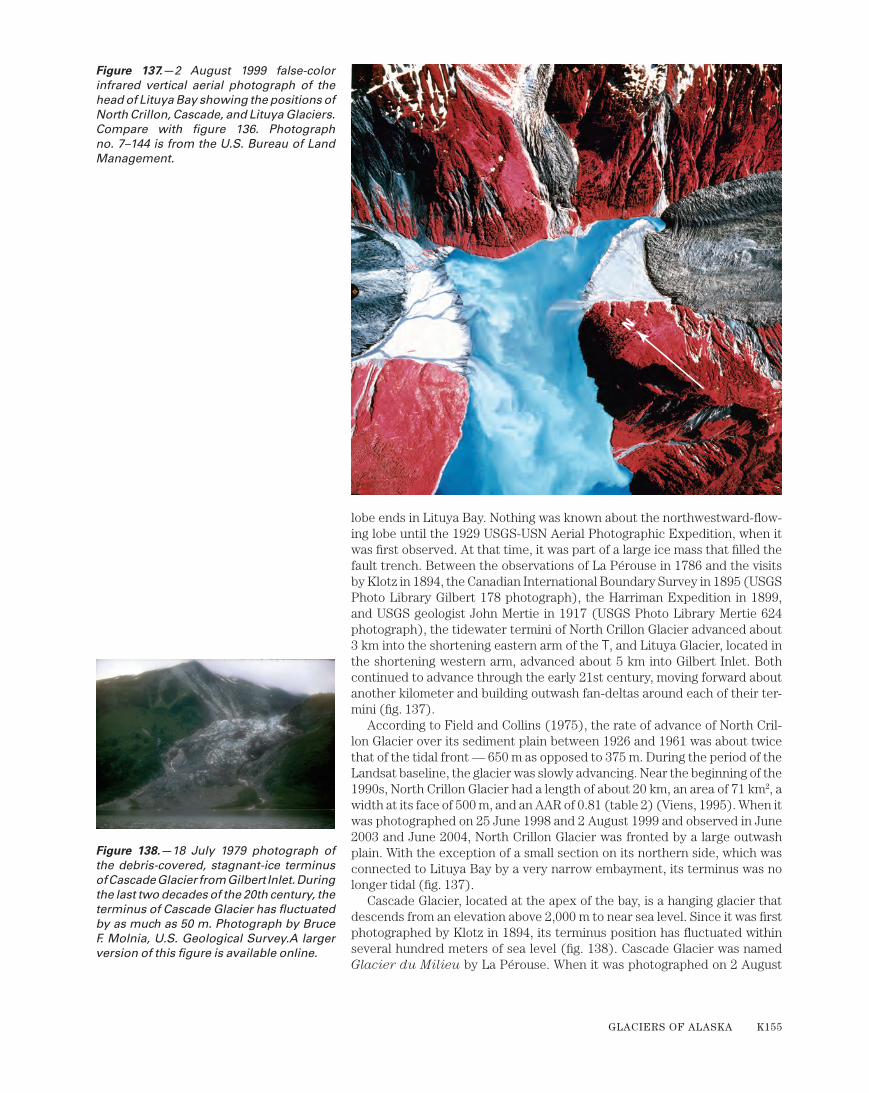
lobe ends in Lituya Bay. Nothing was known about the northwestward-flow-ing lobe until the 1929 USGS-USN Aerial Photographic Expedition, when it was first observed. At that time, it was part of a large ice mass that filled the fault trench. Between the observations of La Pérouse in 1786 and the visits by Klotz in 1894, the Canadian International Boundary Survey in 1895 (USGS Photo Library Gilbert 178 photograph), the Harriman Expedition in 1899, and USGS geologist John Mertie in 1917 (USGS Photo Library Mertie 624 photograph), the tidewater termini of North Crillon Glacier advanced about 3 km into the shortening eastern arm of the T, and Lituya Glacier, located in the shortening western arm, advanced about 5 km into Gilbert Inlet. Both continued to advance through the early 21st century, moving forward about another kilometer and building outwash fan-deltas around each of their ter-mini (fig. 137).
According to Field and Collins (1975), the rate of advance of North Cril-lon Glacier over its sediment plain between 1926 and 1961 was about twice that of the tidal front — 650 m as opposed to 375 m. During the period of the Landsat baseline, the glacier was slowly advancing. Near the beginning of the 1990s, North Crillon Glacier had a length of about 20 km, an area of 71 km2, a width at its face of 500 m, and an AAR of 0.81 (table 2) (Viens, 1995). When it was photographed on 25 June 1998 and 2 August 1999 and observed in June 2003 and June 2004, North Crillon Glacier was fronted by a large outwash plain. With the exception of a small section on its northern side, which was connected to Lituya Bay by a very narrow embayment, its terminus was no longer tidal (fig. 137).
Cascade Glacier, located at the apex of the bay, is a hanging glacier that descends from an elevation above 2,000 m to near sea level. Since it was first photographed by Klotz in 1894, its terminus position has fluctuated within several hundred meters of sea level (fig. 138). Cascade Glacier was named Glacier du Milieu by La Pérouse. When it was photographed on 2 August
N
Figure 138.—18 July 1979 photograph of the debris-covered, stagnant-ice terminus of Cascade Glacier from Gilbert Inlet. During the last two decades of the 20th century, the terminus of Cascade Glacier has fluctuated by as much as 50 m. Photograph by Bruce F. Molnia, U.S. Geological Survey.A larger version of this figure is available online.
Figure 137.—2 August 1999 false-color infrared vertical aerial photograph of the head of Lituya Bay showing the positions of North Crillon, Cascade, and Lituya Glaciers. Compare with figure 136. Photograph no. 7–144 is from the U.S. Bureau of Land Management.
GLACIERS OF ALASKA K155
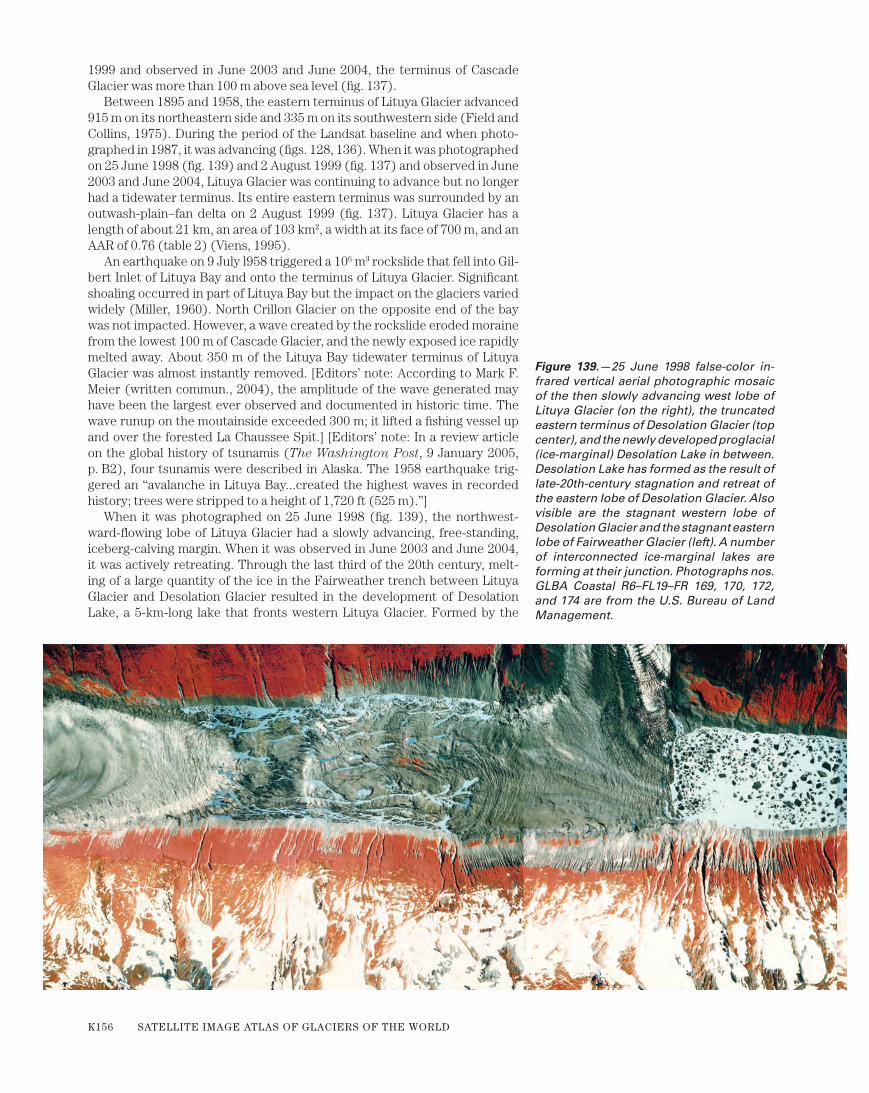
1999 and observed in June 2003 and June 2004, the terminus of Cascade Glacier was more than 100 m above sea level (fig. 137).
Between 1895 and 1958, the eastern terminus of Lituya Glacier advanced 915 m on its northeastern side and 335 m on its southwestern side (Field and Collins, 1975). During the period of the Landsat baseline and when photo-graphed in 1987, it was advancing (figs. 128, 136). When it was photographed on 25 June 1998 (fig. 139) and 2 August 1999 (fig. 137) and observed in June 2003 and June 2004, Lituya Glacier was continuing to advance but no longer had a tidewater terminus. Its entire eastern terminus was surrounded by an outwash-plain–fan delta on 2 August 1999 (fig. 137). Lituya Glacier has a length of about 21 km, an area of 103 km2, a width at its face of 700 m, and an AAR of 0.76 (table 2) (Viens, 1995).
An earthquake on 9 July l958 triggered a 106 m3 rockslide that fell into Gil-bert Inlet of Lituya Bay and onto the terminus of Lituya Glacier. Significant shoaling occurred in part of Lituya Bay but the impact on the glaciers varied widely (Miller, 1960). North Crillon Glacier on the opposite end of the bay was not impacted. However, a wave created by the rockslide eroded moraine from the lowest 100 m of Cascade Glacier, and the newly exposed ice rapidly melted away. About 350 m of the Lituya Bay tidewater terminus of Lituya Glacier was almost instantly removed. [Editors’ note: According to Mark F. Meier (written commun., 2004), the amplitude of the wave generated may have been the largest ever observed and documented in historic time. The wave runup on the moutainside exceeded 300 m; it lifted a fishing vessel up and over the forested La Chaussee Spit.] [Editors’ note: In a review article on the global history of tsunamis (The Washington Post, 9 January 2005, p. B2), four tsunamis were described in Alaska. The 1958 earthquake trig-gered an “avalanche in Lituya Bay...created the highest waves in recorded history; trees were stripped to a height of 1,720 ft (525 m).”]
When it was photographed on 25 June 1998 (fig. 139), the northwest-ward-flowing lobe of Lituya Glacier had a slowly advancing, free-standing, iceberg-calving margin. When it was observed in June 2003 and June 2004, it was actively retreating. Through the last third of the 20th century, melt-ing of a large quantity of the ice in the Fairweather trench between Lituya Glacier and Desolation Glacier resulted in the development of Desolation Lake, a 5-km-long lake that fronts western Lituya Glacier. Formed by the
Figure 139.—25 June 1998 false-color in-frared vertical aerial photographic mosaic of the then slowly advancing west lobe of Lituya Glacier (on the right), the truncated eastern terminus of Desolation Glacier (top center), and the newly developed proglacial (ice-marginal) Desolation Lake in between. Desolation Lake has formed as the result of late-20th-century stagnation and retreat of the eastern lobe of Desolation Glacier. Also visible are the stagnant western lobe of Desolation Glacier and the stagnant eastern lobe of Fairweather Glacier (left). A number of interconnected ice-marginal lakes are forming at their junction. Photographs nos. GLBA Coastal R6–FL19–FR 169, 170, 172, and 174 are from the U.S. Bureau of Land Management.
K156 SATELLITE IMAGE ATLAS OF GLACIERS OF THE WORLD
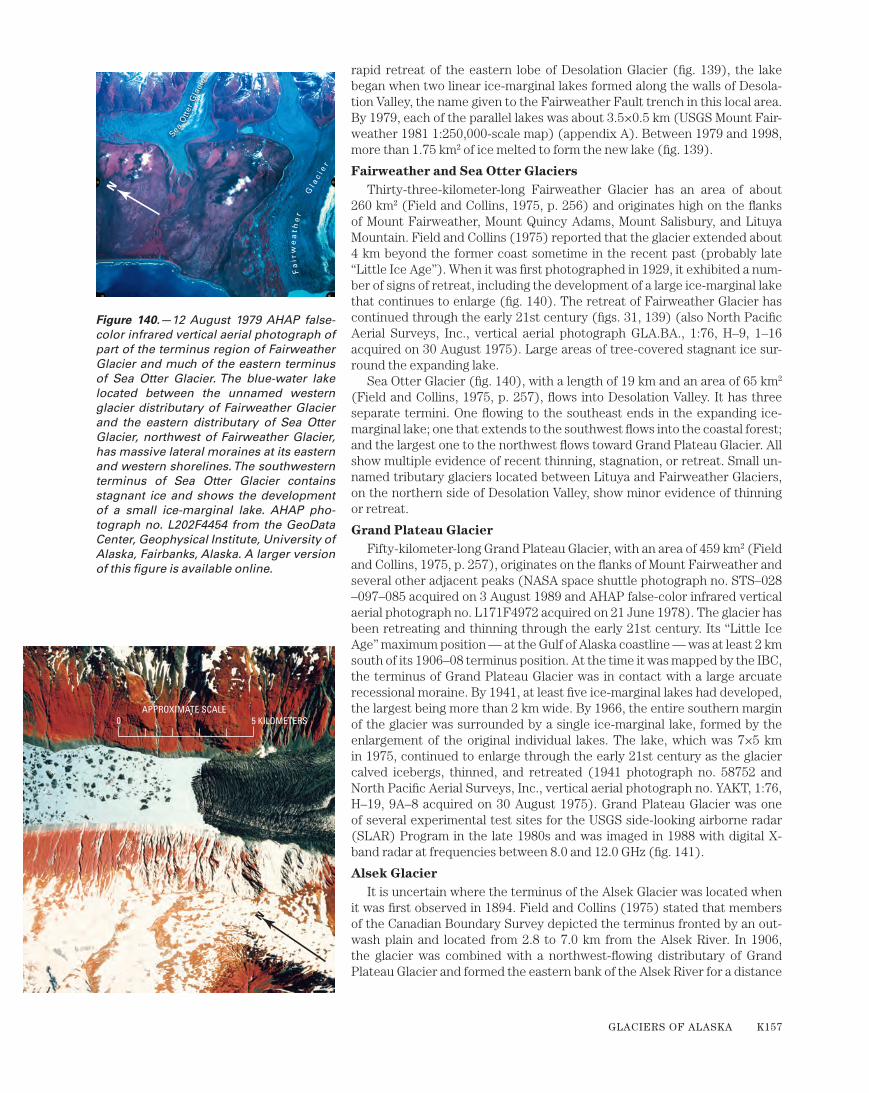
rapid retreat of the eastern lobe of Desolation Glacier (fig. 139), the lake began when two linear ice-marginal lakes formed along the walls of Desola-tion Valley, the name given to the Fairweather Fault trench in this local area. By 1979, each of the parallel lakes was about 3.5×0.5 km (USGS Mount Fair-weather 1981 1:250,000-scale map) (appendix A). Between 1979 and 1998, more than 1.75 km2 of ice melted to form the new lake (fig. 139).
Fairweather and Sea Otter GlaciersThirty-three-kilometer-long Fairweather Glacier has an area of about
260 km2 (Field and Collins, 1975, p. 256) and originates high on the flanks of Mount Fairweather, Mount Quincy Adams, Mount Salisbury, and Lituya Mountain. Field and Collins (1975) reported that the glacier extended about 4 km beyond the former coast sometime in the recent past (probably late “Little Ice Age”). When it was first photographed in 1929, it exhibited a num-ber of signs of retreat, including the development of a large ice-marginal lake that continues to enlarge (fig. 140). The retreat of Fairweather Glacier has continued through the early 21st century (figs. 31, 139) (also North Pacific Aerial Surveys, Inc., vertical aerial photograph GLA.BA., 1:76, H–9, 1–16 acquired on 30 August 1975). Large areas of tree-covered stagnant ice sur-round the expanding lake.
Sea Otter Glacier (fig. 140), with a length of 19 km and an area of 65 km2
(Field and Collins, 1975, p. 257), flows into Desolation Valley. It has three separate termini. One flowing to the southeast ends in the expanding ice-marginal lake; one that extends to the southwest flows into the coastal forest; and the largest one to the northwest flows toward Grand Plateau Glacier. All show multiple evidence of recent thinning, stagnation, or retreat. Small un-named tributary glaciers located between Lituya and Fairweather Glaciers, on the northern side of Desolation Valley, show minor evidence of thinning or retreat.
Grand Plateau GlacierFifty-kilometer-long Grand Plateau Glacier, with an area of 459 km2 (Field
and Collins, 1975, p. 257), originates on the flanks of Mount Fairweather and several other adjacent peaks (NASA space shuttle photograph no. STS–028–097–085 acquired on 3 August 1989 and AHAP false-color infrared vertical aerial photograph no. L171F4972 acquired on 21 June 1978). The glacier has been retreating and thinning through the early 21st century. Its “Little Ice Age” maximum position — at the Gulf of Alaska coastline — was at least 2 km south of its 1906–08 terminus position. At the time it was mapped by the IBC, the terminus of Grand Plateau Glacier was in contact with a large arcuate recessional moraine. By 1941, at least five ice-marginal lakes had developed, the largest being more than 2 km wide. By 1966, the entire southern margin of the glacier was surrounded by a single ice-marginal lake, formed by the enlargement of the original individual lakes. The lake, which was 7×5 km in 1975, continued to enlarge through the early 21st century as the glacier calved icebergs, thinned, and retreated (1941 photograph no. 58752 and North Pacific Aerial Surveys, Inc., vertical aerial photograph no. YAKT, 1:76, H–19, 9A–8 acquired on 30 August 1975). Grand Plateau Glacier was one of several experimental test sites for the USGS side-looking airborne radar (SLAR) Program in the late 1980s and was imaged in 1988 with digital X-band radar at frequencies between 8.0 and 12.0 GHz (fig. 141).
Alsek GlacierIt is uncertain where the terminus of the Alsek Glacier was located when
it was first observed in 1894. Field and Collins (1975) stated that members of the Canadian Boundary Survey depicted the terminus fronted by an out-wash plain and located from 2.8 to 7.0 km from the Alsek River. In 1906, the glacier was combined with a northwest-flowing distributary of Grand Plateau Glacier and formed the eastern bank of the Alsek River for a distance
Sea O
tter
Gla
cier
Fa
irw
ea
t he
r
G
l ac i
er
N
Figure 140.—12 August 1979 AHAP false-color infrared vertical aerial photograph of part of the terminus region of Fairweather Glacier and much of the eastern terminus of Sea Otter Glacier. The blue-water lake located between the unnamed western glacier distributary of Fairweather Glacier and the eastern distributary of Sea Otter Glacier, northwest of Fairweather Glacier, has massive lateral moraines at its eastern and western shorelines. The southwestern terminus of Sea Otter Glacier contains stagnant ice and shows the development of a small ice-marginal lake. AHAP pho-tograph no. L202F4454 from the GeoData Center, Geophysical Institute, University of Alaska, Fairbanks, Alaska. A larger version of this figure is available online.
5 KILOMETERS0APPROXIMATE SCALE
N
GLACIERS OF ALASKA K157

of about 6 km (Blackwelder, 1907). The glacier was anchored to a nunatak (Gateway Knob) and had an iceface that was as much as 50 m high. The 320-m-wide river flowed on the western side of Gateway Knob. By 1948, the glacier had retreated 1.5 to 2.5 km. By 25 August 1960 (fig. 142), retreat was as much as 5 km. By 12 August 1978, the retreating and thinning glacier was about to separate into two ice tongues (fig. 143). In the late 1990s, as interpreted on BLM vertical aerial photographs, maximum retreat exceeded 8 km; the retreating terminus, which was separated from the northwest-
Figure 141.—1988 digital X-band (8.0–12.0 GHz) radar image of the terminus of Grand Plateau Glacier. The radar image, which has a picture element (pixel) resolu-tion of about 10 m, documents 1 to 3 km of retreat in comparison with a 21 June 1978 AHAP false-color infrared, vertical aerial photograph no. L171F4972 (not shown; ar-chived at the GeoData Center, Geophysical Institute, University of Alaska, Fairbanks, Alaska).
Figure 142.—25 August 1960 east-looking oblique aerial photograph of the retreating, thinning terminus of Alsek Glacier. Note the conspicuous elevated lateral moraine and trimline. USGS photograph no. 60–12 by Austin Post, U.S. Geological Survey.
K158 SATELLITE IMAGE ATLAS OF GLACIERS OF THE WORLD

flowing distributary of Grand Plateau Glacier, had separated into two distinct ice tongues. By 2003, the terminus separated into three distinct ice tongues. At the beginning of the 21st century, Gateway Knob was an isolated rock outlier, with the river flowing to its east. The closest part of Alsek Glacier was more than 6 km to the east.
All of the other unnamed glaciers on the eastern side of the Alsek River, north of Alsek Glacier, are also retreating. Several have developed nested ice-marginal lakes.
South-central St. Elias Mountains Segment: From the Western Side of the Alsek River to the Western Side of Yakutat Bay
Landsat MSS images that cover the south-central St. Elias Mountains, from the western side of the Alsek River to the western side of Yakutat Bay, have the following Path/Row coordinates: 64/19, 65/18, 66/18, and 67/18 (fig. 144). These areas are mapped on the USGS Yakutat, Alaska-Canada and Mount St. Elias, Alaska-Canada 1:250,000-scale topographic maps (appendix A). Glaciers of this region are located in a 55- to 100-km-wide band bounded on the south by the Gulf of Alaska and on the north by the U.S.-Canadian border. Many of these glaciers originate in Canada and flow into Alaska, including the largest, Hubbard Glacier.
At the start of the 20th century, most of the glaciers in this region were re-treating. In 1906, Blackwelder (1907) examined the glaciers on the Alaskan coast between the Alsek River and Yakutat Bay. He concluded that “The fact that each of the glaciers examined is bordered at its end by a terminal mo-raine, which is separated from the ice itself by a barren space indicates that the lobes have recently retreated through distances varying from one quar-ter of a mile to one mile.... It is obvious at least that none of these glaciers is now actively forwarding its lower end. In no case did we find glaciers plow-ing up forested moraines and showing other unmistakable signs of advance” (Blackwelder, 1907, p. 433).
Novatak Glacier and a large unnamed south-flowing glacier to the east were connected when they were mapped in 1906 and 1908 by the IBC (1952). By 1934, when they were photographed by Washburn, the two glaciers were minimally in contact. By the 1950s, they were nearly a kilometer apart (Field and Collins, 1975). In August 1999, they were separated by more than 5 km.
Numerous retreating glaciers descend from the ridge line of the Brabazon Range. Fassett Glacier, with a length of about 16 km and an area of about 58 km2 (Field and Collins, 1975, p. 265) forms the northern side of Tanis Lake. The 1894–95 Alaska Boundary Tribunal Survey (IBC, 1952) shows no lake. By the 1906 survey, a small lake was developing between the late 19th century end moraine and the ice margin. By 1948, the date of a 1:63,360-scale USGS topographic map (Yakutat B2), the lake was 1.5 km long. A 1968 USGS photograph shows that the lake had lengthened to about 3 km.
In the late 19th century, Rodman and Chamberlain Glaciers were two sep-arate distributary tongues of the same glacier. At the end of the 19th century, Chamberlain Glacier had a terminus that descended more than 300 m from its source plateau to reach the level of the Yakutat Foreland. By 1906, con-tinuing retreat had begun to expose an ice-marginal lake, Akwe Lake. Before 1950, the retreating and thinning terminus of Chamberlain Glacier was well above the 3-km-long lake basin and back up to the level of the plateau. This significant shrinkage has continued into the 21st century. Like Chamberlain Glacier, the retreat of the terminus of Rodman Glacier created Ustay Lake, an ice-marginal lake in the early 20th century. In the early 21st century, the glacier was still in contact with the lake (Ustay Lake), which had a length of more than 3 km.
Yakutat Glacier has a length of 29 km (Field and Collins, 1975, p. 265), an area estimated by the author at 150 km2, and a width at its face of 6 km.
N
Figure 143.—12 August 1978 AHAP false-color infrared vertical aerial photograph of the retreating, thinning terminus of Alsek Glacier. The stagnating margin is on the verge of separating into two ice tongues. AHAP photograph no. L186F4898 is from the GeoData Center, Geophysical Institute, University of Alaska, Fairbanks, Alaska. A larger version of this figure is available online.
GLACIERS OF ALASKA K159
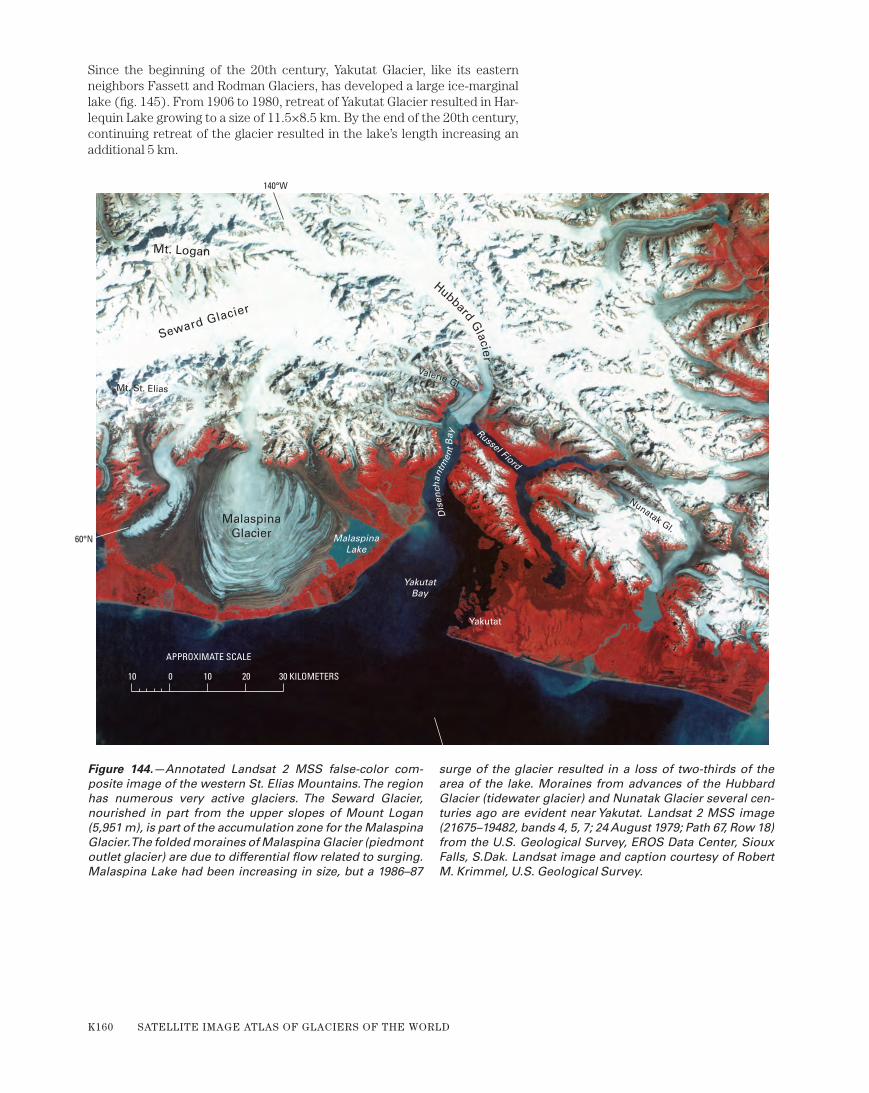
Since the beginning of the 20th century, Yakutat Glacier, like its eastern neighbors Fassett and Rodman Glaciers, has developed a large ice-marginal lake (fig. 145). From 1906 to 1980, retreat of Yakutat Glacier resulted in Har-lequin Lake growing to a size of 11.5×8.5 km. By the end of the 20th century, continuing retreat of the glacier resulted in the lake’s length increasing an additional 5 km.
Figure 144.—Annotated Landsat 2 MSS false-color com-posite image of the western St. Elias Mountains. The region has numerous very active glaciers. The Seward Glacier, nourished in part from the upper slopes of Mount Logan (5,951 m), is part of the accumulation zone for the Malaspina Glacier. The folded moraines of Malaspina Glacier (piedmont outlet glacier) are due to differential flow related to surging. Malaspina Lake had been increasing in size, but a 1986–87
surge of the glacier resulted in a loss of two-thirds of the area of the lake. Moraines from advances of the Hubbard Glacier (tidewater glacier) and Nunatak Glacier several cen-turies ago are evident near Yakutat. Landsat 2 MSS image (21675–19482, bands 4, 5, 7; 24 August 1979; Path 67, Row 18) from the U.S. Geological Survey, EROS Data Center, Sioux Falls, S.Dak. Landsat image and caption courtesy of Robert M. Krimmel, U.S. Geological Survey.
Mt. St. Elias
Nunatak Gl.
YakutatBay
MalaspinaLake
MalaspinaGlacier
Seward Glacier
Mt. Logan
Hubbard Glacier
Valerie Gl.
Dis
ench
antm
ent
Bay
Russel Fiord
Yakutat
10 0 10 20 30 KILOMETERS
APPROXIMATE SCALE
140°W
60°N
K160 SATELLITE IMAGE ATLAS OF GLACIERS OF THE WORLD
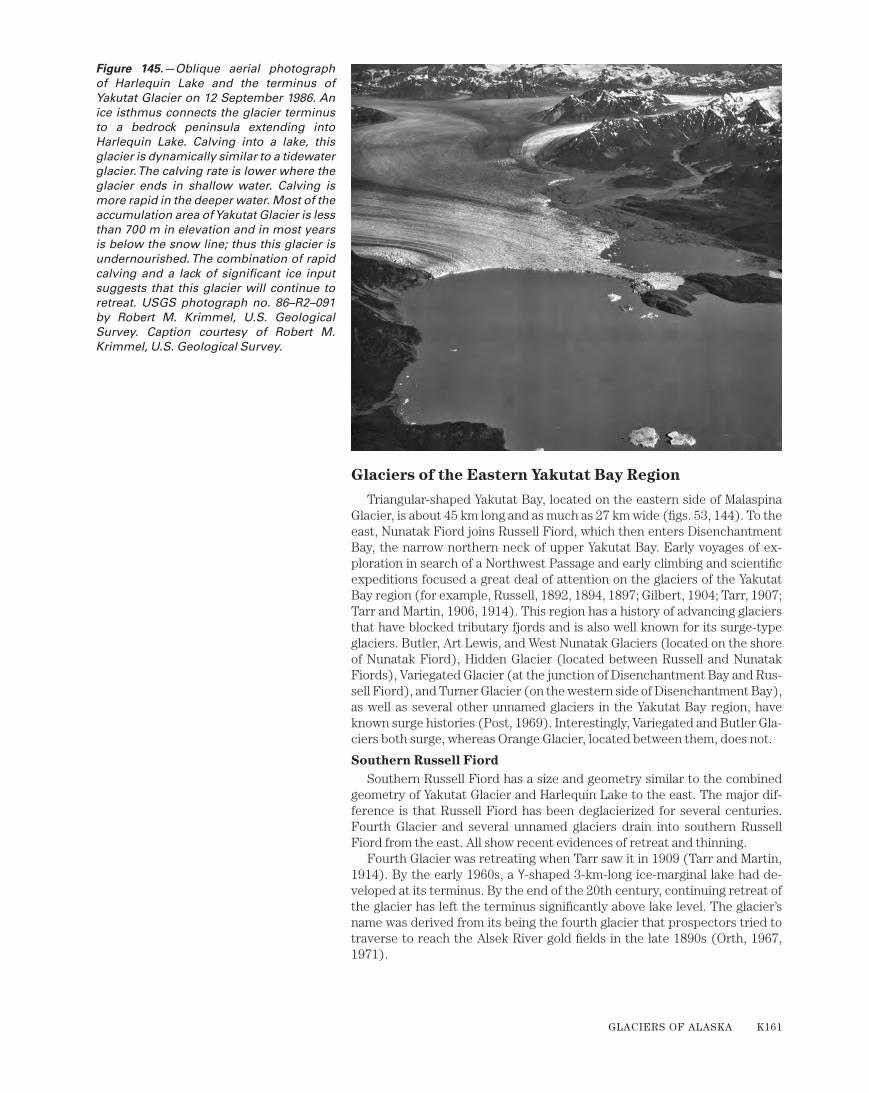
Glaciers of the Eastern Yakutat Bay Region
Triangular-shaped Yakutat Bay, located on the eastern side of Malaspina Glacier, is about 45 km long and as much as 27 km wide (figs. 53, 144). To the east, Nunatak Fiord joins Russell Fiord, which then enters Disenchantment Bay, the narrow northern neck of upper Yakutat Bay. Early voyages of ex-ploration in search of a Northwest Passage and early climbing and scientific expeditions focused a great deal of attention on the glaciers of the Yakutat Bay region (for example, Russell, 1892, 1894, 1897; Gilbert, 1904; Tarr, 1907; Tarr and Martin, 1906, 1914). This region has a history of advancing glaciers that have blocked tributary fjords and is also well known for its surge-type glaciers. Butler, Art Lewis, and West Nunatak Glaciers (located on the shore of Nunatak Fiord), Hidden Glacier (located between Russell and Nunatak Fiords), Variegated Glacier (at the junction of Disenchantment Bay and Rus-sell Fiord), and Turner Glacier (on the western side of Disenchantment Bay), as well as several other unnamed glaciers in the Yakutat Bay region, have known surge histories (Post, 1969). Interestingly, Variegated and Butler Gla-ciers both surge, whereas Orange Glacier, located between them, does not.
Southern Russell FiordSouthern Russell Fiord has a size and geometry similar to the combined
geometry of Yakutat Glacier and Harlequin Lake to the east. The major dif-ference is that Russell Fiord has been deglacierized for several centuries. Fourth Glacier and several unnamed glaciers drain into southern Russell Fiord from the east. All show recent evidences of retreat and thinning.
Fourth Glacier was retreating when Tarr saw it in 1909 (Tarr and Martin, 1914). By the early 1960s, a Y-shaped 3-km-long ice-marginal lake had de-veloped at its terminus. By the end of the 20th century, continuing retreat of the glacier has left the terminus significantly above lake level. The glacier’s name was derived from its being the fourth glacier that prospectors tried to traverse to reach the Alsek River gold fields in the late 1890s (Orth, 1967, 1971).
Figure 145.—Oblique aerial photograph of Harlequin Lake and the terminus of Yakutat Glacier on 12 September 1986. An ice isthmus connects the glacier terminus to a bedrock peninsula extending into Harlequin Lake. Calving into a lake, this glacier is dynamically similar to a tidewater glacier. The calving rate is lower where the glacier ends in shallow water. Calving is more rapid in the deeper water. Most of the accumulation area of Yakutat Glacier is less than 700 m in elevation and in most years is below the snow line; thus this glacier is undernourished. The combination of rapid calving and a lack of significant ice input suggests that this glacier will continue to retreat. USGS photograph no. 86–R2–091 by Robert M. Krimmel, U.S. Geological Survey. Caption courtesy of Robert M. Krimmel, U.S. Geological Survey.
GLACIERS OF ALASKA K161
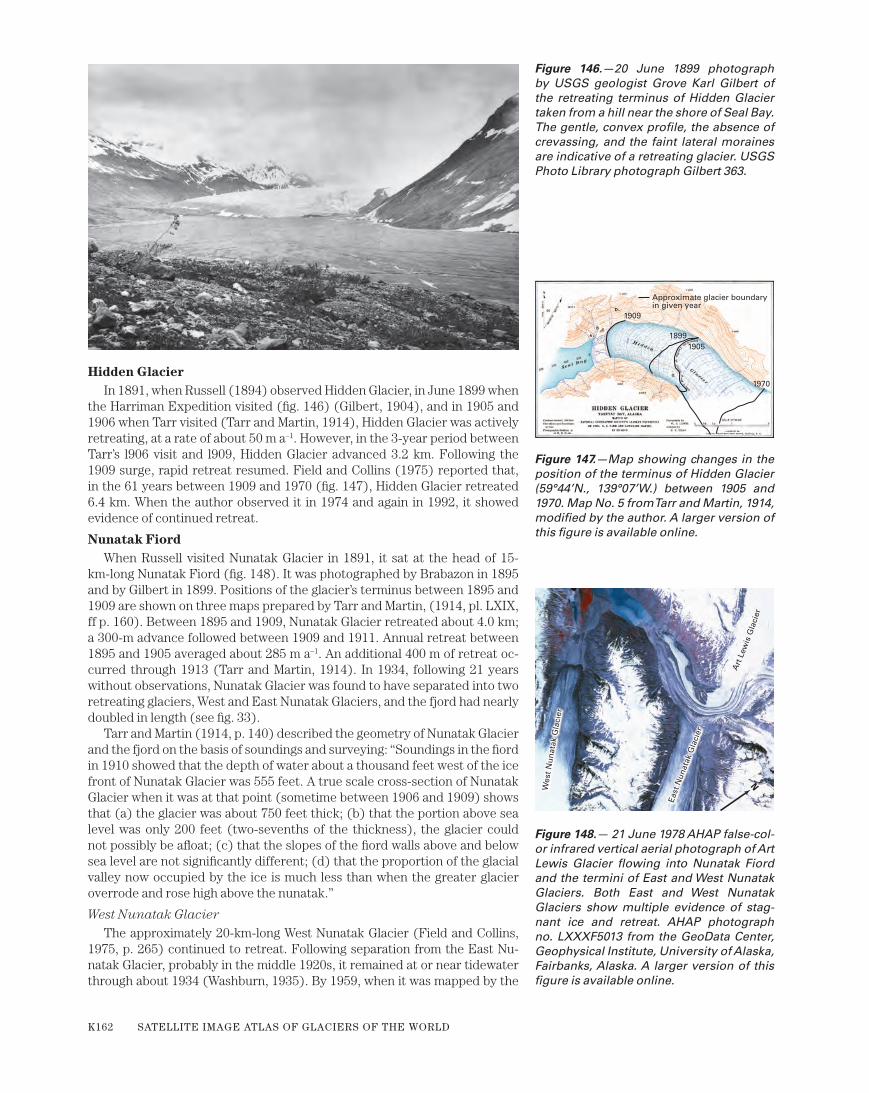
Hidden GlacierIn 1891, when Russell (1894) observed Hidden Glacier, in June 1899 when
the Harriman Expedition visited (fig. 146) (Gilbert, 1904), and in 1905 and 1906 when Tarr visited (Tarr and Martin, 1914), Hidden Glacier was actively retreating, at a rate of about 50 m a–1. However, in the 3-year period between Tarr’s l906 visit and l909, Hidden Glacier advanced 3.2 km. Following the 1909 surge, rapid retreat resumed. Field and Collins (1975) reported that, in the 61 years between 1909 and 1970 (fig. 147), Hidden Glacier retreated 6.4 km. When the author observed it in 1974 and again in 1992, it showed evidence of continued retreat.
Nunatak FiordWhen Russell visited Nunatak Glacier in 1891, it sat at the head of 15-
km-long Nunatak Fiord (fig. 148). It was photographed by Brabazon in 1895 and by Gilbert in 1899. Positions of the glacier’s terminus between 1895 and 1909 are shown on three maps prepared by Tarr and Martin, (1914, pl. LXIX, ff p. 160). Between 1895 and 1909, Nunatak Glacier retreated about 4.0 km; a 300-m advance followed between 1909 and 1911. Annual retreat between 1895 and 1905 averaged about 285 m a–1. An additional 400 m of retreat oc-curred through 1913 (Tarr and Martin, 1914). In 1934, following 21 years without observations, Nunatak Glacier was found to have separated into two retreating glaciers, West and East Nunatak Glaciers, and the fjord had nearly doubled in length (see fig. 33).
Tarr and Martin (1914, p. 140) described the geometry of Nunatak Glacier and the fjord on the basis of soundings and surveying: “Soundings in the fiord in 1910 showed that the depth of water about a thousand feet west of the ice front of Nunatak Glacier was 555 feet. A true scale cross-section of Nunatak Glacier when it was at that point (sometime between 1906 and 1909) shows that (a) the glacier was about 750 feet thick; (b) that the portion above sea level was only 200 feet (two-sevenths of the thickness), the glacier could not possibly be afloat; (c) that the slopes of the fiord walls above and below sea level are not significantly different; (d) that the proportion of the glacial valley now occupied by the ice is much less than when the greater glacier overrode and rose high above the nunatak.”
West Nunatak GlacierThe approximately 20-km-long West Nunatak Glacier (Field and Collins,
1975, p. 265) continued to retreat. Following separation from the East Nu-natak Glacier, probably in the middle 1920s, it remained at or near tidewater through about 1934 (Washburn, 1935). By 1959, when it was mapped by the
Figure 146.—20 June 1899 photograph by USGS geologist Grove Karl Gilbert of the retreating terminus of Hidden Glacier taken from a hill near the shore of Seal Bay. The gentle, convex profile, the absence of crevassing, and the faint lateral moraines are indicative of a retreating glacier. USGS Photo Library photograph Gilbert 363.
19051899
1909
1970
Approximate glacier boundary in given year
Eas
t N
un
atak
Gla
cier
Art
Lew
is G
laci
er
East
Nun
atak
Gla
cier
Wes
t N
un
atak
Gla
cier
N
Figure 147.—Map showing changes in the position of the terminus of Hidden Glacier (59°44’N., 139°07’W.) between 1905 and 1970. Map No. 5 from Tarr and Martin, 1914, modified by the author. A larger version of this figure is available online.
Figure 148.— 21 June 1978 AHAP false-col-or infrared vertical aerial photograph of Art Lewis Glacier flowing into Nunatak Fiord and the termini of East and West Nunatak Glaciers. Both East and West Nunatak Glaciers show multiple evidence of stag-nant ice and retreat. AHAP photograph no. LXXXF5013 from the GeoData Center, Geophysical Institute, University of Alaska, Fairbanks, Alaska. A larger version of this figure is available online.
K162 SATELLITE IMAGE ATLAS OF GLACIERS OF THE WORLD

USGS (Yakutak, 1:250,000-scale map) (appendix A), it had retreated about 2.5 km. By 1993, when the author observed it, it had retreated at least another 1.5 km. It was still retreating when the author observed it on 18 June 2004.
East Nunatak GlacierBetween the late 1890s and 1948, East Nunatak Glacier retreated more
than 11.5 km. By 1934, it was about 3.5 km up-fjord from the terminus of West Nunatak Glacier. Maynard Miller reported that it had retreated another 2 km by 1948 (Miller, 1948a, b). However, Field’s 1964 (AGS Glacier Studies Map No. 64–2–G8) map (fig. 33) shows only about half that distance. Be-tween 1948 and 1958, an outwash plain began developing in front of the gla-cier’s tidewater terminus; by 1958, the terminus had advanced several hun-dred meters onto the plain. Since then, continuing slow retreat has occurred (fig. 148). Three ice streams coalesce to make up the face of East Nunatak Glacier. The northern part is supplied by Art Lewis Glacier. A surge of Art Lewis Glacier in the middle 1960s resulted in a temporary advance of the terminus of East Nunatak to tidewater during 1966. Since then, the terminus has retreated more than 300 m.
Hanging, Butler, and Cascading Glaciers are three other former tributary glaciers to Nunatak Glacier. All were studied extensively at the end of the 19th century and the first decade of the 20th. All were probably in contact with an expanded late “Little Ice Age” Nunatak Glacier but separated long before 1890. Each is actively retreating (AHAP false-color infrared vertical aerial photograph no. L121F5094 acquired on 20 June 1978). When it was photographed in 1899, the terminus of Cascading Glacier nearly reached the terminus of Nunatak Glacier (fig. 33; USGS Photo Library Gilbert 302 photo-graph). Forty-nine years later, when the USGS mapped it, it had retreated more than 1 km. Field evidence suggests that Butler Glacier may have surged several times during the 20th century
Glaciers of Disenchantment BayIn 1792, Malaspina gave the name Puerto del Desengano (Bay of Disen-
chantment) to the 5-km-wide neck at the northern end of Yakutat Bay (figs. 149, 150, 151) (Orth, 1967, 1971). Malaspina, like many early explorers, en-tered Yakutat Bay seeking a passage to the Atlantic Ocean. Instead, he en-countered a sea of floating ice in front of a retreating Hubbard Glacier. Since then, the size of Disenchantment Bay has fluctuated as much as 6 to 8 km as the terminus of the Hubbard Glacier has advanced and retreated (see Tarr and Martin’s 1906 map of Disenchantment Bay showing a retracted terminus of the Hubbard Glacier) (Tarr and Martin, 1914, pl. XXXVI, ff p. 112). Hub-bard Glacier, the largest glacier in the bay, has steadily shown net advance (fig. 54) through the late 20th century and early 21st century.
Many of the glaciers in the Disenchantment Bay area were the subject of almost annual observations during the last decade of the 19th century and the first decade of the 20th century (1890–1913) by some of the leading names in American glacier science: Israel C. Russell (USGS geologist), Grove Karl Gilbert (USGS geologist), Ralph Stockman Tarr (Professor of Physical Geography, Cornell University), and Lawrence Martin (Professor of Physi-ography and Geography, University of Wisconsin). Tarr and Martin (1914) summarized their findings on a glacier by glacier basis.
Gilbert (1904, p. 49) described submarine moraines and the bathymetry of the floor of Disenchantment Bay. He related these submarine features in Yakutat Bay to the past advances and retreats of Hubbard Glacier: “the U.S. Coast and Geodetic Survey has published a new chart of Yakutat Bay, giv-ing soundings from the ocean to Point Latouche, six miles below Haenke Is-land. These soundings give no indication of a moraine in the vicinity of Point Latouche. Not far from this point there is a depth of 1,000 feet and thence southward the channel is shown for five miles. Here, at a distance of twelve miles from Haenke Island, is a submerged bar with a depth of about 300 feet,
GLACIERS OF ALASKA K163

and this is probably the last-formed important moraine in the bay. There ap-pears to be another opposite Knight Island, seventeen miles from Haenke Island, the intervening hollow having an extreme depth of about 600 feet.” Haenke Island is located approximately 2 km south of the summer 2004 posi-tion of the terminus of Hubbard Glacier.
Variegated GlacierVariegated Glacier, located adjacent to but independent of Hubbard Gla-
cier, is the most intensively studied surge-type glacier on Earth (figs. 149, 150). Some surges have resulted in more than 6 km of ice advance and chaot-ic displacement. Twenty-kilometer-long Variegated Glacier has experienced at least six recorded surges during the 20th century: l906, before l933, before l948, 1964–65, 1982–83, and 1995–96. Neither of its tributaries appear to surge. Tarr’s (1907) and Tarr and Martin’s (1914) documentation of the rapid advance in 1906 of Variegated Glacier are the first scientific descriptions of a modern glacier “surge” in the United States, although the term “surge” was not used by glaciologists until 1969 (Post, 1969). Descriptions of the surge history of Variegated Glacier have been presented by Post (1969), Bindscha-dler and others (1977), and Lawson (1997). The l964–65 surge produced an advance of almost 6 km (fig. 152), whereas the 1995–96 surge did not affect the lower part of the glacier.
The 1982–83 surge, which had maximum ice velocities reaching 50 m d–1, is one of the best documented glacier events. This approximately 20-year surge cycle allowed a group of scientists from the University of Washington, the University of Alaska at Fairbanks, and the California Institute of Technol-ogy and a number of international collaborators to begin a program to deter-mine the dynamics of the surge and investigate factors responsible for surge initiation during the winter of 1982–early summer of 1983 event. Kamb and others (1985) described the sequence of events as follows: surging motion began with a compression front in January 1982 that then extended down the glacier. In the spring of 1983, the lower part of the glacier experienced rapid movement. By July 1983, the surge motion had ended, and the glacier had begun to return to pre-surge state. They concluded that the 1982–83 surge resulted from increased basal pore-water pressure and the development of a temporary, stable, linked-cavity system at the interface of the glacier and the underlying terrain. Jacobel and Anderson (1987) used both 4- and 8-MHz ra-dioechosounding as a means of determining the size and location of cavities in the top 200 m of the glacier.
VariegatedGlacier
Hubbard Glacier
VariegatedGlacier
TurnerGlacier
Disenchantment Bay
N
Figure 149.—18 August 1978 AHAP false-color infrared vertical aerial photographic mosaic of Disenchantment Bay and the termini of Hubbard, Turner, and Variegated Glaciers. AHAP photograph nos. L120F6012 and L120F6013 from the GeoData Center, Geophysical Institute, University of Alaska, Fairbanks, Alaska.
K164 SATELLITE IMAGE ATLAS OF GLACIERS OF THE WORLD
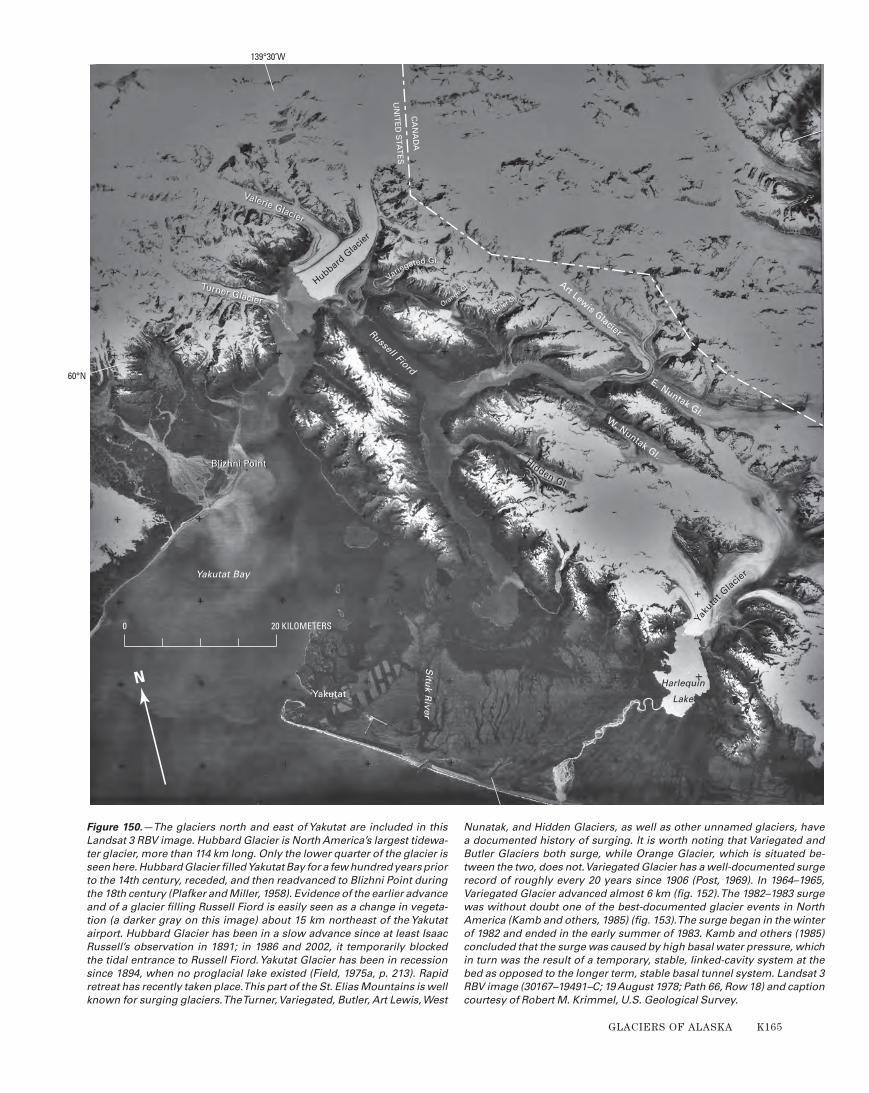
Varie
gated Gl.
Blizhni Point
Turner Glacier
Yaku
ta
t Glacie
r
Harlequin
Lake
Yakutat Bay
Russell Fiord
Hubbard G
lacier
Yakutat
Hidden Gl.
W. Nuntak Gl.
E. Nuntak Gl.
Art Lewis Glacier
Situ
k River
Valerie Glacier
Orange Gl.
Blizhni Point
N
0 20 KILOMETERS
UN
ITE
D S
TAT
ES
CA
NA
DA
Butler G
l.
139°30’W
60°N
Figure 150.—The glaciers north and east of Yakutat are included in this Landsat 3 RBV image. Hubbard Glacier is North America’s largest tidewa-ter glacier, more than 114 km long. Only the lower quarter of the glacier is seen here. Hubbard Glacier filled Yakutat Bay for a few hundred years prior to the 14th century, receded, and then readvanced to Blizhni Point during the 18th century (Plafker and Miller, 1958). Evidence of the earlier advance and of a glacier filling Russell Fiord is easily seen as a change in vegeta-tion (a darker gray on this image) about 15 km northeast of the Yakutat airport. Hubbard Glacier has been in a slow advance since at least Isaac Russell’s observation in 1891; in 1986 and 2002, it temporarily blocked the tidal entrance to Russell Fiord. Yakutat Glacier has been in recession since 1894, when no proglacial lake existed (Field, 1975a, p. 213). Rapid retreat has recently taken place. This part of the St. Elias Mountains is well known for surging glaciers. The Turner, Variegated, Butler, Art Lewis, West
Nunatak, and Hidden Glaciers, as well as other unnamed glaciers, have a documented history of surging. It is worth noting that Variegated and Butler Glaciers both surge, while Orange Glacier, which is situated be-tween the two, does not. Variegated Glacier has a well-documented surge record of roughly every 20 years since 1906 (Post, 1969). In 1964–1965, Variegated Glacier advanced almost 6 km (fig. 152). The 1982–1983 surge was without doubt one of the best-documented glacier events in North America (Kamb and others, 1985) (fig. 153). The surge began in the winter of 1982 and ended in the early summer of 1983. Kamb and others (1985) concluded that the surge was caused by high basal water pressure, which in turn was the result of a temporary, stable, linked-cavity system at the bed as opposed to the longer term, stable basal tunnel system. Landsat 3 RBV image (30167–19491–C; 19 August 1978; Path 66, Row 18) and caption courtesy of Robert M. Krimmel, U.S. Geological Survey.
GLACIERS OF ALASKA K165

Bindschadler (1978) and Raymond and Harrison (1988) provided exten-sive details about the evolution of progressive changes in geometry and ve-locity in Variegated Glacier during the decade before the surge. The glacier thickened in its upper 12 km and thinned in its lower 8 km. Changes were as much as 20 percent of total thickness. Pre-surge velocity increased by as much as 500 percent, reaching a maximum of 0.7 m d–1 in 1981. By 1978, the amplitude of seasonal velocity variation increased as much as 0.3 m d–1. Little change occurred in subsequent years. Raymond and Harrison (1988, p. 154) concluded that “a drop in effective normal stress in a zone of decreas-ing surface slope up-glacier from the largest thickness increase may have been significant in the initiation of surge motion in 1982.”
Humphrey and Raymond (1994) provided significant details about the hydrology, erosion, and sediment produced by the 1982–83 surge (fig. 153). They determined that the surging region of the glacier was underlain by a basal hydrologic zone characterized by low water velocity and high water storage. They postulated that flow in this region was distributed and that the volume of water stored in the basal hydrologic zone is the major hydraulic factor that drove the surge. Down-glacier of the surge propagation front, the ice is underlain by a zone of high water velocity and low water storage. They assumed that flow in this region was through a system of conduits. During the surge, basal bedrock erosion was significantly greater than it was at any other time and was “extreme” compared with that of non-surge-type glaciers. Sediment output was directly proportional to the rate of basal sliding. Dur-ing the 20-year surge cycle, about 0.3 m of bedrock was eroded. About two-thirds of this erosion occurred during the 2-year peak (1982–83) in surge activity. Humphrey and Raymond (1994) concluded that most of this ero-sion occurred during the 2-month period of peak surge activity. Previously, Humphrey and others (1986) had looked at discharge of turbid water during periods of mini-surges in 1980 and 1981. [Editors’ note: According to Mark F. Meier (written commun., 2004), the relationship of discharge of water be-fore, during, and after surge events was a major scientific finding. Another major finding was the outburst that ended the 1983 surge and the contrast
Figure 151.—Sketch map of Disenchant-ment Bay showing Malaspina’s 1791 sur-vey of an advanced Hubbard Glacier from Davidson (1904). A larger version of this figure is available online.
K166 SATELLITE IMAGE ATLAS OF GLACIERS OF THE WORLD
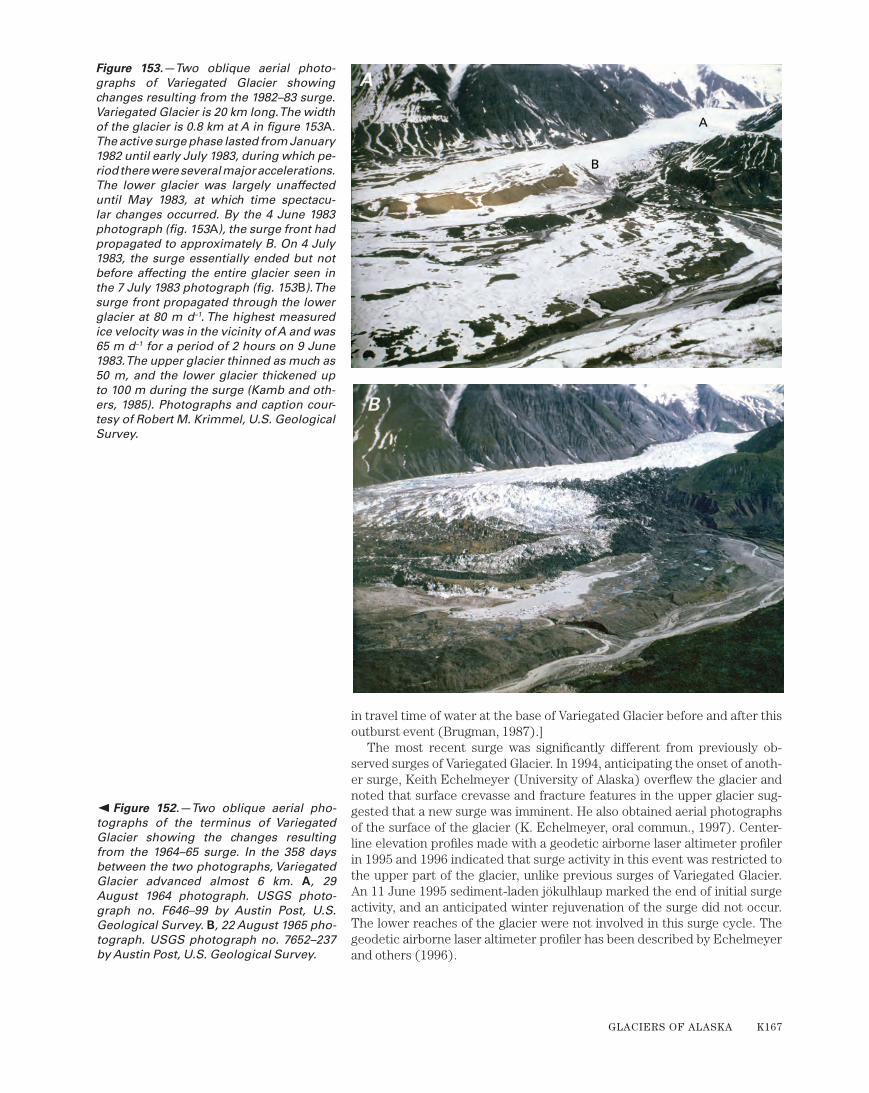
in travel time of water at the base of Variegated Glacier before and after this outburst event (Brugman, 1987).]
The most recent surge was significantly different from previously ob-served surges of Variegated Glacier. In 1994, anticipating the onset of anoth-er surge, Keith Echelmeyer (University of Alaska) overflew the glacier and noted that surface crevasse and fracture features in the upper glacier sug-gested that a new surge was imminent. He also obtained aerial photographs of the surface of the glacier (K. Echelmeyer, oral commun., 1997). Center-line elevation profiles made with a geodetic airborne laser altimeter profiler in 1995 and 1996 indicated that surge activity in this event was restricted to the upper part of the glacier, unlike previous surges of Variegated Glacier. An 11 June 1995 sediment-laden jökulhlaup marked the end of initial surge activity, and an anticipated winter rejuvenation of the surge did not occur. The lower reaches of the glacier were not involved in this surge cycle. The geodetic airborne laser altimeter profiler has been described by Echelmeyer and others (1996).
Figure 153.—Two oblique aerial photo-graphs of Variegated Glacier showing changes resulting from the 1982–83 surge.Variegated Glacier is 20 km long. The width of the glacier is 0.8 km at A in figure 153A. The active surge phase lasted from January 1982 until early July 1983, during which pe-riod there were several major accelerations. The lower glacier was largely unaffected until May 1983, at which time spectacu-lar changes occurred. By the 4 June 1983 photograph (fig. 153A), the surge front had propagated to approximately B. On 4 July 1983, the surge essentially ended but not before affecting the entire glacier seen in the 7 July 1983 photograph (fig. 153 B). The surge front propagated through the lower glacier at 80 m d–1. The highest measured ice velocity was in the vicinity of A and was 65 m d–1 for a period of 2 hours on 9 June 1983. The upper glacier thinned as much as 50 m, and the lower glacier thickened up to 100 m during the surge (Kamb and oth-ers, 1985). Photographs and caption cour-tesy of Robert M. Krimmel, U.S. Geological Survey.
Figure 152.—Two oblique aerial pho-tographs of the terminus of Variegated Glacier showing the changes resulting from the 1964–65 surge. In the 358 days between the two photographs, Variegated Glacier advanced almost 6 km. A, 29 August 1964 photograph. USGS photo-graph no. F646–99 by Austin Post, U.S. Geological Survey. B, 22 August 1965 pho-tograph. USGS photograph no. 7652–237 by Austin Post, U.S. Geological Survey.
GLACIERS OF ALASKA K167

Variegated Glacier has an extensive photographic history (Lawson, 1996), including 12 sets of vertical aerial photographs taken between 1948 and 1983. It was also photographed as early as 1890 by Israel C. Russell of the USGS (fig. 154), by Bradford Washburn in the 1930s, and by Austin Post repeatedly between 1960 and 1983. Analysis of sequential vertical aerial photographic sets by Lawson (1990) revealed that successive surges and surge cycles pro-duce similar sets and patterns of glacier crevasses and other structures ir-respective of the duration and intensity of the individual surges.
Hubbard GlacierHubbard Glacier has an area of about 3,900 km2 and a length more than
114 km (table 2) (Viens, 1995). If it were entirely in Alaska, it would be the third largest glacier in the State (figs. 1, 2). However, more than half of the glacier is in Canada; only the lower part is in Alaska. With the exception of the calving margin of the Bering Lobe, which is located at the head of Vitus Lake (a tidal basin separated from the open ocean by a 5-km-long narrow chan-nel), Hubbard Glacier, which has a 10.5-km-wide calving face, is also Alaska’s largest tidewater glacier directly accessible to the Pacific Ocean (through Disenchantment and Yakutat Bays) (figs. 53, 55, 56, 149, 150, 151). Hub-bard Glacier has an AAR of 0.96 (table 2) (Viens, 1995). D.C. Trabant (oral commun., August 1990) estimated that 95 percent of the ice lost by Hubbard Glacier is by calving and the remaining 5 percent by melting.
On the basis of a radiocarbon-dated sample, Plafker and Miller (1958) re-ported that Hubbard Glacier filled Yakutat Bay and extended into the Pacific Ocean 1130±160 yr B.P. Arcuate ridges at Monti Bay and near the city of Ya-kutat are the terminal and recessional moraines that mark this maximum ice advance. Beginning in the 14th century, Hubbard Glacier underwent a sig-nificant retreat of more than 25 km. During the 18th century, it readvanced more than 10 km to Blizhni Point (Plafker and Miller, 1958). A submarine moraine at the lower end of Disenchantment Bay resulted from this advance, which culminated after l700 A.D. and before Malaspina’s visit in 1791. Re-treat of more than 5 km occurred in the late 18th century and early 19th cen-tury. Before 1890, the glacier again began to advance. Hubbard Glacier was observed to be advancing by Russell in 1890 (fig. 154) and 1891, by Gilbert from 1897 to1899, by Tarr and Martin several times in the early 1900s (Tarr and Martin, 1914, pl. XLVIII, ff p. 112), by Post on 29 August 1984 (fig. 55) and 12 September 1986 (fig. 56), and by the author on 13 June 2002 and 18 June 2004. Figure 54 compares the positions of Hubbard Glacier’s terminus between 1965 and 1997. The continuous advance of Hubbard Glacier during
Figure 154.—1890 photograph by USGS geologist Israel C. Russell of the terminus of Hubbard Glacier from near Gilbert Point. USGS Photo Library photograph Russell 390.
K168 SATELLITE IMAGE ATLAS OF GLACIERS OF THE WORLD
the 20th century is in accordance with the theory of tidewater glacier stabil-ity and cyclicity (fig. 42).
Trabant and others (2003) compared NOAA’s 1978 and 1999 bathymetric surveys of Disenchantment Bay to evaluate the displacement of the subma-rine terminal moraine adjacent to Hubbard Glacier. They integrated the aver-age advance rate of a 2.1-km width of the seaward face of the moraine between the 120- and 170-m isobaths and determined that growth was approximately 32 m a–1. This figure is in close agreement with the average rate of terminus advance. For the entire profile area, which spanned depths from about 60 to about 230 m, the average advance rate was approximately 10 m a–1.
Trabant and others (2003) also analyzed seven longitudinal profiles col-lected on the terminal lobe of Hubbard Glacier in 1948, 1959, 1978, 1988, 1992, 1999, and 2000. They determined that the glacier thickened and lengthened in the interval between data sets. Between 1948 and 2000, the glacier thickened by more than 100 m at the location of the 1948 terminus.
Early in the 20th century, a debate existed about the morphology of fjords and about whether glaciers were floating or grounded. Tarr and Martin (1914, p. 224) observed that
The soundings made in 1910 also establish the fact that, deep as the water is, it is practically impossible that any of the glacier fronts of Disenchantment Bay and Russell Fiord are floating now and they do not seem to have been afloat at any stage of their expansion, judging by the depths of water. This means that there was al-ways active glacial grinding on the fiord bottom and the problem arises as to where this eroded material is now. In Russell Fiord the volume, merely from the part of the fiord below sea level would be many cubic miles, and the soundings show that more material was eroded above sea level than below. Some of the material makes up the great moraine south of Russell Fiord, some is in the submerged moraines, and a great deal has gone out to sea. Some, however, doubtless remains in the fiord bottoms, making it impossible to tell how near a given sounding goes to the rock bottom of the fiord. The measures of glacial erosion are, therefore, all minima.
As they do at other large tidewater glaciers, the seasonal development and filling of calving embayments at Hubbard Glacier cause the position of parts of the terminus to undergo fluctuations of up to several hundred meters. Consequently, many historic reports of the position of the terminus of Hubbard Glacier mention that parts of the 10.5-km-long terminus have retreated. In spite of these seasonal fluctuations, the glacier has advanced about 3 km or nearly 30 m a–1 since the early 1890s, as tidewater glacier the-ory has predicted. One reason why these types of fluctuations are described here and not at other glaciers is the degree of scrutiny that Hubbard Glacier has received. Similar annual variations are observed at Bering and Columbia Glaciers.
GLACIERS OF ALASKA K169
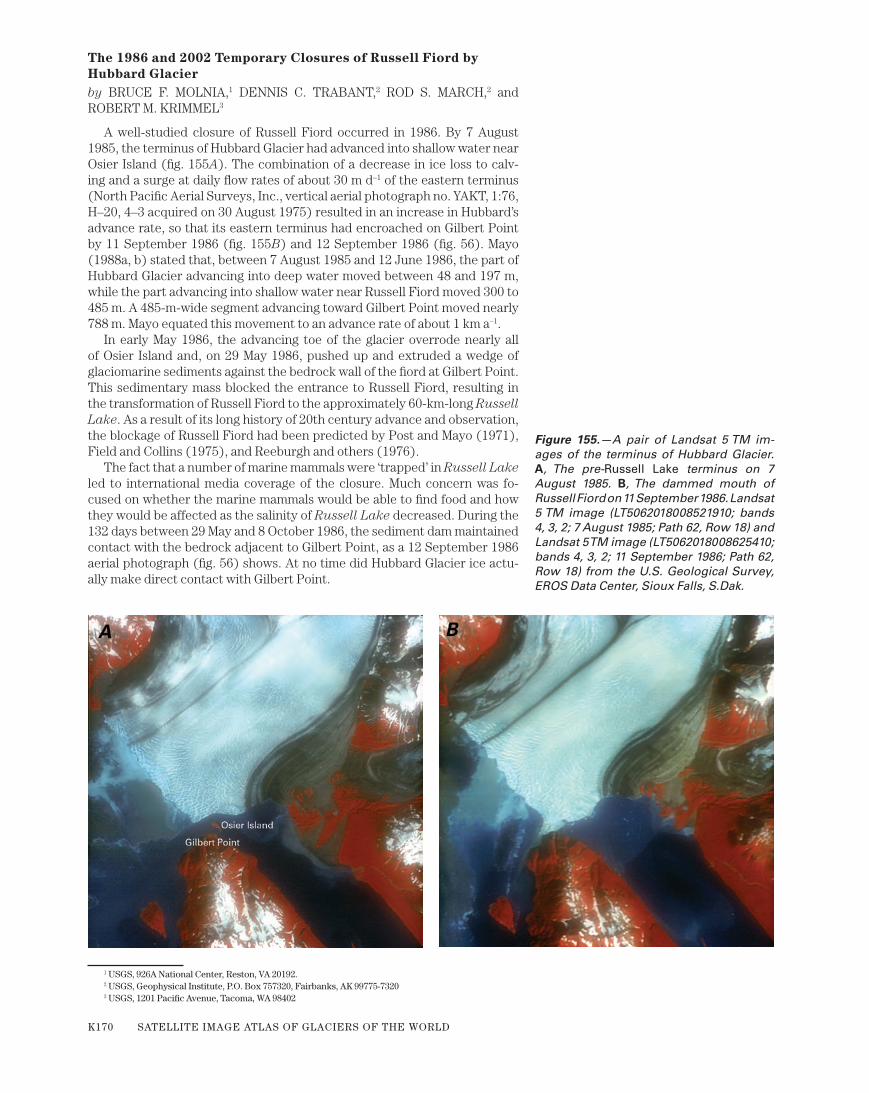
The 1986 and 2002 Temporary Closures of Russell Fiord by Hubbard Glacierby BRUCE F. MOLNIA,1 DENNIS C. TRABANT,2 ROD S. MARCH,2 and ROBERT M. KRIMMEL3
A well-studied closure of Russell Fiord occurred in 1986. By 7 August 1985, the terminus of Hubbard Glacier had advanced into shallow water near Osier Island (fig. 155 A). The combination of a decrease in ice loss to calv-ing and a surge at daily flow rates of about 30 m d–1 of the eastern terminus (North Pacific Aerial Surveys, Inc., vertical aerial photograph no. YAKT, 1:76, H–20, 4–3 acquired on 30 August 1975) resulted in an increase in Hubbard’s advance rate, so that its eastern terminus had encroached on Gilbert Point by 11 September 1986 (fig. 155 B) and 12 September 1986 (fig. 56). Mayo (1988a, b) stated that, between 7 August 1985 and 12 June 1986, the part of Hubbard Glacier advancing into deep water moved between 48 and 197 m, while the part advancing into shallow water near Russell Fiord moved 300 to 485 m. A 485-m-wide segment advancing toward Gilbert Point moved nearly 788 m. Mayo equated this movement to an advance rate of about 1 km a–1.
In early May 1986, the advancing toe of the glacier overrode nearly all of Osier Island and, on 29 May 1986, pushed up and extruded a wedge of glaciomarine sediments against the bedrock wall of the fiord at Gilbert Point. This sedimentary mass blocked the entrance to Russell Fiord, resulting in the transformation of Russell Fiord to the approximately 60-km-long Russell Lake. As a result of its long history of 20th century advance and observation, the blockage of Russell Fiord had been predicted by Post and Mayo (1971), Field and Collins (1975), and Reeburgh and others (1976).
The fact that a number of marine mammals were ‘trapped’ in Russell Lake led to international media coverage of the closure. Much concern was fo-cused on whether the marine mammals would be able to find food and how they would be affected as the salinity of Russell Lake decreased. During the 132 days between 29 May and 8 October 1986, the sediment dam maintained contact with the bedrock adjacent to Gilbert Point, as a 12 September 1986 aerial photograph (fig. 56) shows. At no time did Hubbard Glacier ice actu-ally make direct contact with Gilbert Point.
1 USGS, 926A National Center, Reston, VA 20192.2 USGS, Geophysical Institute, P.O. Box 757320, Fairbanks, AK 99775-73203 USGS, 1201 Pacific Avenue, Tacoma, WA 98402
Figure 155.—A pair of Landsat 5 TM im-ages of the terminus of Hubbard Glacier. A, The pre-Russell Lake terminus on 7 August 1985. B, The dammed mouth of Russell Fiord on 11 September 1986. Landsat 5 TM image (LT5062018008521910; bands 4, 3, 2; 7 August 1985; Path 62, Row 18) and Landsat 5 TM image (LT5062018008625410; bands 4, 3, 2; 11 September 1986; Path 62, Row 18) from the U.S. Geological Survey, EROS Data Center, Sioux Falls, S.Dak.
K170 SATELLITE IMAGE ATLAS OF GLACIERS OF THE WORLD

As runoff from an approximately 1,800 km2 drainage area entered the lake, the water level in the lake began to rise quickly. Filling was at times rapid, up to nearly 0.25 m d–1 following heavy precipitation events. Soon after closure, the USGS began to manually measure the height of the rising water in Russell Lake. Twelve stage measurements were made before the installation of an automated stage gage in early August. The volume of water introduced into the lake at its maximum stage was about 5.5 km3, an average influx of about 467 m3 s–1 (Seitz and others, 1986). Maximum inflow was about 1,200 m3 s–1 on 13 August 1986 (figs.156 A, B). The water level in Russell Lake rose to a maximum of 25.8 m. Filling of the lake to a height of approximately 40 m above mean sea level would have resulted in water flowing out the back (southeastern) end of the lake basin into the Situk River drainage.
Calving of icebergs from both sides of the 400-m-wide ice dam, into both Russell Lake and Disenchantment Bay, reduced the width of the ice dam. This narrowing of the ice dam and the increased hydrostatic pressure against
Figure 156.—A, Filling and emptying of Russell Lake during the 1986 and 2002 closure events. B, Russell Lake filling rates in 1986 and 2002 and 2002 precipitation at Yakutat, Alaska. C, Hydrographs showing the 1986 and 2002 draining of Russell Lake.
GLACIERS OF ALASKA K171

and under the dam further weakened it. Close to midnight on 7 October 1986, the ice dam began to fail. Peak discharge was reached 6 hours after the inception of a jökulhlaup. Within 24 hours, the water level in Russell Lake dropped more than 25 m, returning to equilibrium with adjacent Disenchant-ment Bay (fig. 156C). Emery and Seitz (1987) reported that, between 0200 and 0600 local time on 8 October 1986, the level of the lake decreased as much as 1.6 m h–1. Mayo (1988a, b) cited the average discharge from the lake into Disenchantment Bay as about 1.1×10⁵ m3 s–1 and the total volume of water discharged into Disenchantment Bay as 5.42 km3. The peak discharge was 1.04×10⁶ m3 s–1. Interesting legacies from Russell Lake were the pres-ence of ice-rafted dropstones left in the crowns of many trees that had been submerged by the rapidly rising waters; drift logs resting on limbs of other trees, deposited during the rapid draining of the lake; and, years later, a ring of dead trees surrounding the margin of Russell Fiord. [Editors’ note: A simi-lar ring of dead trees surrounds the shoreline of Canal de los Tempanos and Brazo Sur, arms of Lago Argentino that are subject to water-level fluctuations caused by the advance and retreat of Glacier Perito Moreno, an outlet glacier from the Southern Patagonia Ice Field, Argentina (see Lliboutry, 1998).]
Ice-velocity measurements made in June 1986 showed that the speed of the ice at the terminus of Hubbard Glacier was 14 m d–1. By August 1986, the speed of the ice was 8 m d–1, about the same as was measured in August 1978 (Krimmel and Sikonia, 1986). As a result of the jökulhlaup, the erosion of the sediment plug and the adjacent ice dam left the position of the central part of the terminus of Hubbard Glacier nearly 0.5 km north of Osier Island.
Tlingit oral history describes a previous damming of Russell Fiord (de Laguna, 1972), probably early in the 19th century. However, the dam-ming of this lake may have been the result of an ice dam formed by an ad-vance of the terminus of Nunatak Glacier rather than by a Hubbard Glacier ice dam. Whatever the cause, Russell (1893) observed a combination of young vegetation and recent shoreline features in upper Russell Fiord in 1891 that confirmed the recent existence of a 19th century lake.
Through the late 1980s, the 1990s, and into the early 21st century, Hub-bard Glacier continued its steady advance south toward Gilbert Point. A comparison of the glacier’s terminus position on 7 August 1986 with that on 11 August 2001 showed average advances of 560 m in Disenchantment Bay and 390 m in Russell Fiord.
Trabant and Krimmel (2001) took a close look at annual changes of the terminus of Hubbard Glacier, specifically at when the advance of Hubbard Glacier might next close the entrance of Russell Fiord. By comparing periods of approximately 50 years, they found that the average rate of advance had accelerated from about 16 m a–1 between 1895 and 1948 to about 26 m a–1 be-tween 1948 and 1998. During shorter periods, the advance was spatially and temporally erratic. For example, an average advance of 32 m along the 6-km-wide terminus facing Disenchantment Bay between August 1988 and July 1990 contrasts with an advance of 111 m along the 2.8-km-wide terminus of Hubbard Glacier in Russell Fiord during the same period. The terminus of Hubbard Glacier that faced Disenchantment Bay exhibited an extreme temporal rate change during the decade of the 1990s; the rate of advance changed from an average of about 4 m a–1 between July 1990 and July 1998 to 149 m a–1 between late July 1998 and early August 1999. The 100-year average advance rate was about 22 m a–1 for most of the terminus and around 19 m a–1 toward the closure point.
On 2 August 1999, Hubbard’s terminus was about 350 m from Gilbert Point. By the spring of 2002, Hubbard Glacier’s advancing terminus had reduced the width of open water between it and Gilbert Point by more than half. On 20 May 2002, a U.S. Forest Service photograph by Bill Lucey showed that the advancing terminus was pushing up and extruding a mass of glaciomarine sediments between it and the bedrock wall of the fiord about 400 m west of
K172 SATELLITE IMAGE ATLAS OF GLACIERS OF THE WORLD

Gilbert Point. No change was noted in the water level of Russell Fiord versus Disenchantment Bay, and tidal exchange between Disenchantment Bay and Russell Fiord appeared to be unimpeded.
The exposed part of this push-moraine sedimentary mass continued to ex-pand and, before 13 June 2002, it made contact with the bedrock wall of Rus-sell Fiord (fig. 157). The surface of the push moraine had four distinct ridges. The areal extent of the 2002 moraine was significantly larger than that of the 1986 moraine, and the location of closure was approximately 500 m west of the 1986 closure. Throughout June 2002, water continuously flowed out of Russell Lake through an approximately 90×20-m shallow channel. By early July 2002, the height of the push moraine eliminated the tidal exchange of water with Yakutat Bay (Molnia and others, 2002).
During the ensuing 10 weeks, the area and height of the push moraine continued to increase, again resulting in the transformation of Russell Fiord into Russell Lake. Unlike 1986, there was little international media atten-tion, and minimal attention was paid to the presence of marine mammals in Russell Lake. By mid-June, the growing push moraine effectively closed the entrance to Russell Fiord. By late-June, the water in Russell Lake was more than 7 m above mean sea level. Nearly a kilometer of the terminus was fronted by extruded glacial and glaciomarine sediments as they emerged from the fjord. By mid-July, the sediment mass reached a height of more than 25 m above mean sea level. At Gilbert Point, extruded sediment and moraine were pushed against approximately 250 m of the fjord wall.
By early August, a delicate balance existed between the height of the growing moraine and the volume and height of water in Russell Lake. Drain-age continued through a narrow channel cut into the top of the push mo-raine. By 10 August 2002, the maximum height of the growing moraine ex-ceeded 30 m, and the stage of Russell Lake reached 12 m above mean sea level (fig. 156A). Part of the terminus of the glacier had advanced to within 15 m of the southern wall of Russell Fiord. At all times, moraine was the only material that made contact with the wall of the fjord.
Within 2 weeks of closure, the USGS had installed an automated stage gage. As was the case in 1986, the water level in the lake had begun to rise immediately. Filling was rapid, averaging 0.22 m d–1 (fig. 156B). The volume of water introduced into the lake at its maximum stage was about 3.1 km3, an average influx of about 530 m3 sec-1. Maximum inflow was about 2,600 m3 sec-1 on 12 August 2002.
Figure 157.—Northeast-looking oblique aer-ial photograph of the advancing terminus of Hubbard Glacier on 13 June 2002 taken from over Disenchantment Bay looking across Gilbert Point into Russell Fiord at the push moraine that temporarily blocked the mouth of Russell Fiord. This push mo-raine is composed of sediment bulldozed from the floor of Russell Fiord by the ad-vancing ice. Part of the Hubbard Glacier that is advancing into Disenchantment Bay can be seen in the center of the photo-graph. Photograph by Bruce F. Molnia, U.S. Geological Survey.
GLACIERS OF ALASKA K173
During the 66 days between 10 June and 14 August 2002, the sediment dam maintained contact with the bedrock wall of Russell Fiord west of Gil-bert Point, and the water level in Russell Lake rose 15.1 m. At 0300 local time on 14 August 2002, Russell Lake began to drain. As much as 15 cm of precipitation had fallen at Yakutat during the two previous days, resulting in an inflow into the lake that was approximately half an order of magnitude greater than the average influx for the previous 60 days (fig. 156B). Unlike the 1986 flood, which resulted from abrupt ice-dam failure, the 2002 flood was the result of prolonged erosion of a deepening and widening channel cut into the push moraine. At noon local time on 14 August 2002, about 9 hours after the onset of the flood, the lake stage had fallen only 0.68 m, and the discharge was approximately 8,600 m3 s–1, with super-critical flow and 14-m-high hydraulic jumps. Six hours later, at approximately 1800, and about 15 hours after onset, the lake stage had fallen 2.56 m and the discharge was approximately 33,000 m3 s–1. Peak discharge, approximately 52,000 m3 s–1, was reached approximately 21 hours into the flood. The flood lasted about 33 hours (fig. 156C). When observed on 15 August 2002, around 12 hours after peak discharge, open exchange was again taking place, and the height of the surface of Russell Fiord had returned to sea level. The newly exposed former lake bed contained numerous trees covered by glacial flour.
As was the case in 1986, the flood removed both the sediment dam and a significant amount of ice from the terminus of the glacier. Following the flood, the width of the channel between Hubbard’s terminus and Gilbert Point had widened to approximately 500 m. When observed in early February 2003 and again in June 2004, the terminus again appeared to be advancing and clos-ing the channel. Glacier ice has yet to make contact with the bedrock wall of Russell Fiord at Gilbert Point.
Southwestern St. Elias Mountains Segment: From the Western Side of Yakutat Bay to the Western Bagley Ice Valley, the Western Robinson Mountains, and the Bering Lobe
Landsat MSS images that cover the southwestern St. Elias Mountain re-gion from the western side of Yakutat Bay to the Bering Lobe have the fol-lowing Path/Row coordinates: 66/18, 67/18, 68/18, 69/18, and 70/18 (fig. 3, table 1). These areas are mapped on the USGS Yakutat, Alaska-Canada; Mount St. Elias, Alaska-Canada; and Bering Glacier, Alaska, 1:250,000-scale topographic maps (appendix A). Even though the eastern Bagley Ice Valley (including Quintino Sella, Columbus, and Jefferies Glaciers) is located in the St. Elias Mountains, it is part of the Bering Glacier System. The Bagley Ice Valley will be described in the Chugach Mountains section, so that the Bering Glacier System can be described as a single entity.
Between the southwestern margin of Hubbard Glacier and the northeast-ern side of the piedmont lobe of Malaspina Glacier, nine east- and south-flowing glaciers descend from the flanks of the St. Elias Mountains to near sea level: Miller, Haenke, Turner, Fallen, Black, Galiano, Atrevida, Lucia, and Hayden Glaciers. In 2000, Haenke and Turner Glaciers reached tidewater. Since then, Haenke's terminus has been stationary.
Miller Glacier is the 5-km-long valley glacier immediately west of Hubbard Glacier. For most of the 20th century, it stagnated in its valley; its 1959 ter-minus about 1.5 km from shore. Post (1967b) reported that it underwent a small surge in 1966. Since then, its debris-covered terminus has been stag-nating and retreating. On 2 August 1999, its terminus was about 2.1 km from the coastline of Disenchantment Bay.
K174 SATELLITE IMAGE ATLAS OF GLACIERS OF THE WORLD

Haenke Glacier, which is 14 km long (Field and Collins, 1975, p. 266), is another surge-type glacier. Between 1891 and 1905, its terminus was stag-nant, downwasting, and located more than a kilometer from Yakutat Bay. Tarr and Martin (1914) reported that it underwent a rapid advance, thickened, became crevassed, and advanced nearly 1.4 km between 1905 and 1906. Re-treat followed through 1913. A 1933 Washburn photograph showed that its terminus was located at tidewater. Another period of retreat followed; by 1948, it was again stagnant, with active ice about 3 km from shore (Field and Collins, 1975). By 1959, active ice was about 2 km from shore. By 25 August 1969, after another decade of stagnation, active ice was now more than 3 km from shore (fig. 158A). In 1978, vegetation was growing on the stagnant ter-minus, and a delta separated the stagnant margin from the adjacent Turner Glacier (AHAP false-color infrared vertical aerial photograph no. L120F6011 acquired on 18 August 1978). At the end of the 20th century, Haenke Glacier had again become a tidewater glacier, with a large bulbous terminus of stag-nant ice extending nearly a kilometer into Yakutat Bay (fig. 158B).
When the central part of the terminus of Turner Glacier was observed in August 1891 by Israel C. Russell (fig. 159) and in 1899 by Gilbert (1904), it extended more than 1 km into Disenchantment Bay. Its land-based northern and southern margins, however, were frequently reported as showing signs of minor retreat (Tarr and Martin, 1914). Turner Glacier fluctuated around this position for nearly 60 years until it underwent a catastrophic calving as the result of the 9 July l958 earthquake, whose epicenter was located near Lituya Bay. As much as 700 m of the terminus calved in a series of seemingly end-less events described by Davis and Sanders (1960). Field and Collins (1975)
Figure 158.—Aerial photographs of the termini of Haenke and Turner Glaciers. A, 25 August 1969 oblique aerial photo-graph shows stagnant ice and downwast-ing in the terminus area of Haenke Glacier (right) and the tidewater terminus of Turner Glacier (left). The spit on the left (south) side of Turner Glacier marks the position of its recent terminal moraine. The terminus of Turner Glacier appears to have retreated several hundred meters from its recent maximum position. The folded moraines on the left (south) side of Turner Glacier indicate recent surge activity. USGS pho-tograph no. F692–124 by Austin Post, U.S. Geological Survey. B, 2 August 1999 black-and-white vertical aerial photograph of the tidewater termini of Turner Glacier (left), and Haenke Glacier (right). The termini of both Turner and Haenke Glaciers extend into tidewater as if both had experienced re-cent surges. Haenke Glacier has advanced approximately 2 km beyond its 1979 termi-nus position. Photograph no. 3–6 is from the U.S. Bureau of Land Management.
GLACIERS OF ALASKA K175

suggested that the massive calving may have resulted from the slumping of unconsolidated sediment beneath the ice mass, which would reduce support and create a very unstable condition. Its 25 August 1969 position (fig. 158A) is as retracted as it has been at any time since it was first observed. By 1978, much of the area lost since 1958 was regained, possibly by a surge-induced advance. By 2 August 1999 (fig. 158B) and through June 2004, the terminus was located at approximately the same location as it was in 1890–99 (fig. 159). Turner Glacier has an area of approximately 186 km2, an accumulation area of approximately 150 km2, an ablation area of approximately 35 km2, and an AAR of 0.81 (table 2) (Viens, 1995). The width of Turner’s calving face is about 3.1 km.
All of the glaciers southwest of Turner Glacier and east of the Malaspina Glacier have significantly retreated from the positions that they held when they were mapped in 1909 by the NGS. All are either actively retreating or have stagnant, debris-covered termini. Lucia Glacier, however, is a surge-type glacier and experienced a surge in 1966.
Malaspina Glacier SystemMalaspina Glacier (fig. 160), which has a length of 113 km (Field and Col-
lins, 1975, p. 267) and an area of about 5,000 km2 (table 3) (Viens, 1995), is the second largest and one of the longest glaciers in Alaska and in continental North America (Hubbard Glacier and Bering Glacier are also among the lon-gest). It includes the largest piedmont lobe of any glacier in continental North America. The entire piedmont lobe, which is located between Yakutat Bay and Icy Bay, lies at elevations below 600 m. Alone, it has an area of approxi-mately 2,150 km2 and a perimeter of about 90 km. Its entire surface is located within the ablation zone. The accumulation area of Malaspina Glacier is only slightly larger than its ablation area (2,575 km2 as opposed to 2,433 km2); con-sequently, Malaspina Glacier has an AAR of 0.51 (table 2) (Viens, 1995), one of the lowest of any studied glacier in the St. Elias Mountains. Seward and Agassiz Glaciers are the largest of Malaspina Glacier’s tributaries. Other large tributaries include Hayden, Marvine, and Libbey Glaciers. Sharp (1951) esti-mated that Seward and Malaspina Glaciers contain 1,750.6 km3 of ice jointly. Malaspina Glacier has an extensive photographic record dating from 1890.
Morphologically, the piedmont lobe of Malaspina Glacier consists of three primary components: (1) the eastern Seward Lobe, which encompasses about two-thirds of the piedmont lobe, (2) a debris-covered interlobate area, which extends from the Samovar Hills to the glacier’s southern margin, and (3) the western Agassiz Lobe. The eastern margin of the piedmont lobe abuts the western margin of Marvine Glacier. Similarly, Libbey Glacier flanks the western margin of the lobe. Much of the remaining perimeter of the pied-mont lobe is fronted by outwash plains and vegetation-covered stagnant ice,
Figure 159.—August 1891 photograph by USGS geologist Israel C. Russell of the tidewater terminus of Turner Glacier, which extended about 1 km into Disenchantment Bay. USGS Photo Library photograph Russell 362.
K176 SATELLITE IMAGE ATLAS OF GLACIERS OF THE WORLD
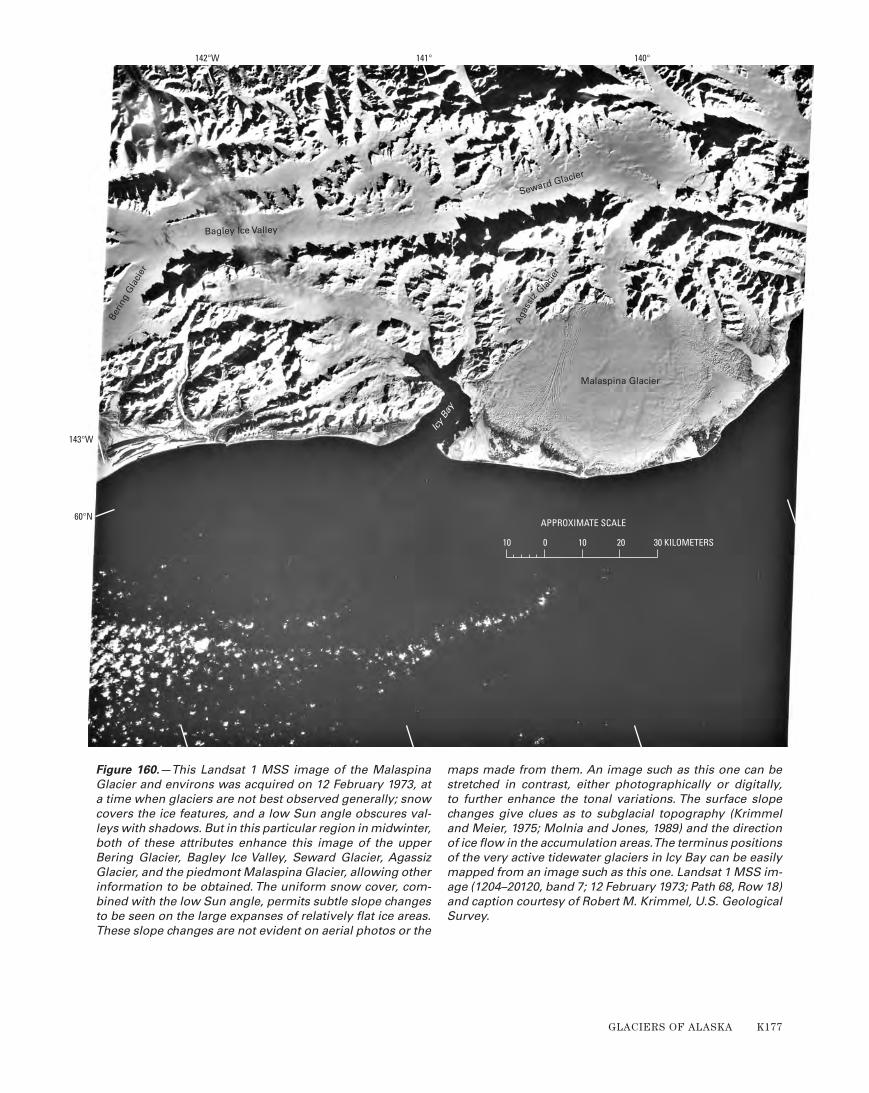
Bagley Ice Valley
Seward Glacier
Malaspina Glacier
Aga
ssiz
Glaci
er
Berin
g G
laci
er
Icy
Bay
142°W
143°W
141° 140°
60°N
10 0 10 20 30 KILOMETERS
APPROXIMATE SCALE
Figure 160.—This Landsat 1 MSS image of the Malaspina Glacier and environs was acquired on 12 February 1973, at a time when glaciers are not best observed generally; snow covers the ice features, and a low Sun angle obscures val-leys with shadows. But in this particular region in midwinter, both of these attributes enhance this image of the upper Bering Glacier, Bagley Ice Valley, Seward Glacier, Agassiz Glacier, and the piedmont Malaspina Glacier, allowing other information to be obtained. The uniform snow cover, com-bined with the low Sun angle, permits subtle slope changes to be seen on the large expanses of relatively flat ice areas. These slope changes are not evident on aerial photos or the
maps made from them. An image such as this one can be stretched in contrast, either photographically or digitally, to further enhance the tonal variations. The surface slope changes give clues as to subglacial topography (Krimmel and Meier, 1975; Molnia and Jones, 1989) and the direction of ice flow in the accumulation areas. The terminus positions of the very active tidewater glaciers in Icy Bay can be easily mapped from an image such as this one. Landsat 1 MSS im-age (1204–20120, band 7; 12 February 1973; Path 68, Row 18) and caption courtesy of Robert M. Krimmel, U.S. Geological Survey.
GLACIERS OF ALASKA K177
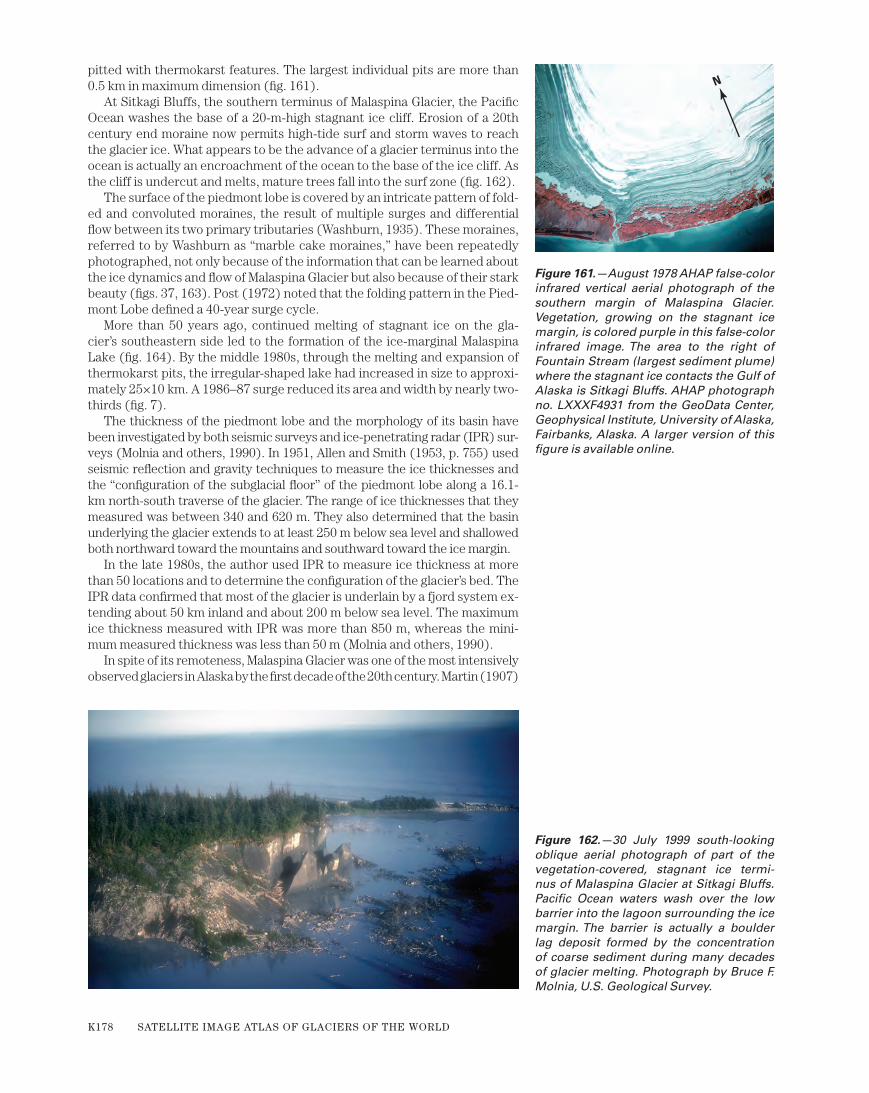
pitted with thermokarst features. The largest individual pits are more than 0.5 km in maximum dimension (fig. 161).
At Sitkagi Bluffs, the southern terminus of Malaspina Glacier, the Pacific Ocean washes the base of a 20-m-high stagnant ice cliff. Erosion of a 20th century end moraine now permits high-tide surf and storm waves to reach the glacier ice. What appears to be the advance of a glacier terminus into the ocean is actually an encroachment of the ocean to the base of the ice cliff. As the cliff is undercut and melts, mature trees fall into the surf zone (fig. 162).
The surface of the piedmont lobe is covered by an intricate pattern of fold-ed and convoluted moraines, the result of multiple surges and differential flow between its two primary tributaries (Washburn, 1935). These moraines, referred to by Washburn as “marble cake moraines,” have been repeatedly photographed, not only because of the information that can be learned about the ice dynamics and flow of Malaspina Glacier but also because of their stark beauty (figs. 37, 163). Post (1972) noted that the folding pattern in the Pied-mont Lobe defined a 40-year surge cycle.
More than 50 years ago, continued melting of stagnant ice on the gla-cier’s southeastern side led to the formation of the ice-marginal Malaspina Lake (fig. 164). By the middle 1980s, through the melting and expansion of thermokarst pits, the irregular-shaped lake had increased in size to approxi-mately 25×10 km. A 1986–87 surge reduced its area and width by nearly two-thirds (fig. 7).
The thickness of the piedmont lobe and the morphology of its basin have been investigated by both seismic surveys and ice-penetrating radar (IPR) sur-veys (Molnia and others, 1990). In 1951, Allen and Smith (1953, p. 755) used seismic reflection and gravity techniques to measure the ice thicknesses and the “configuration of the subglacial floor” of the piedmont lobe along a 16.1-km north-south traverse of the glacier. The range of ice thicknesses that they measured was between 340 and 620 m. They also determined that the basin underlying the glacier extends to at least 250 m below sea level and shallowed both northward toward the mountains and southward toward the ice margin.
In the late 1980s, the author used IPR to measure ice thickness at more than 50 locations and to determine the configuration of the glacier’s bed. The IPR data confirmed that most of the glacier is underlain by a fjord system ex-tending about 50 km inland and about 200 m below sea level. The maximum ice thickness measured with IPR was more than 850 m, whereas the mini-mum measured thickness was less than 50 m (Molnia and others, 1990).
In spite of its remoteness, Malaspina Glacier was one of the most intensively observed glaciers in Alaska by the first decade of the 20th century. Martin (1907)
N
Figure 161.—August 1978 AHAP false-color infrared vertical aerial photograph of the southern margin of Malaspina Glacier. Vegetation, growing on the stagnant ice margin, is colored purple in this false-color infrared image. The area to the right of Fountain Stream (largest sediment plume) where the stagnant ice contacts the Gulf of Alaska is Sitkagi Bluffs. AHAP photograph no. LXXXF4931 from the GeoData Center, Geophysical Institute, University of Alaska, Fairbanks, Alaska. A larger version of this figure is available online.
Figure 162.—30 July 1999 south-looking oblique aerial photograph of part of the vegetation-covered, stagnant ice termi-nus of Malaspina Glacier at Sitkagi Bluffs. Pacific Ocean waters wash over the low barrier into the lagoon surrounding the ice margin. The barrier is actually a boulder lag deposit formed by the concentration of coarse sediment during many decades of glacier melting. Photograph by Bruce F. Molnia, U.S. Geological Survey.
K178 SATELLITE IMAGE ATLAS OF GLACIERS OF THE WORLD
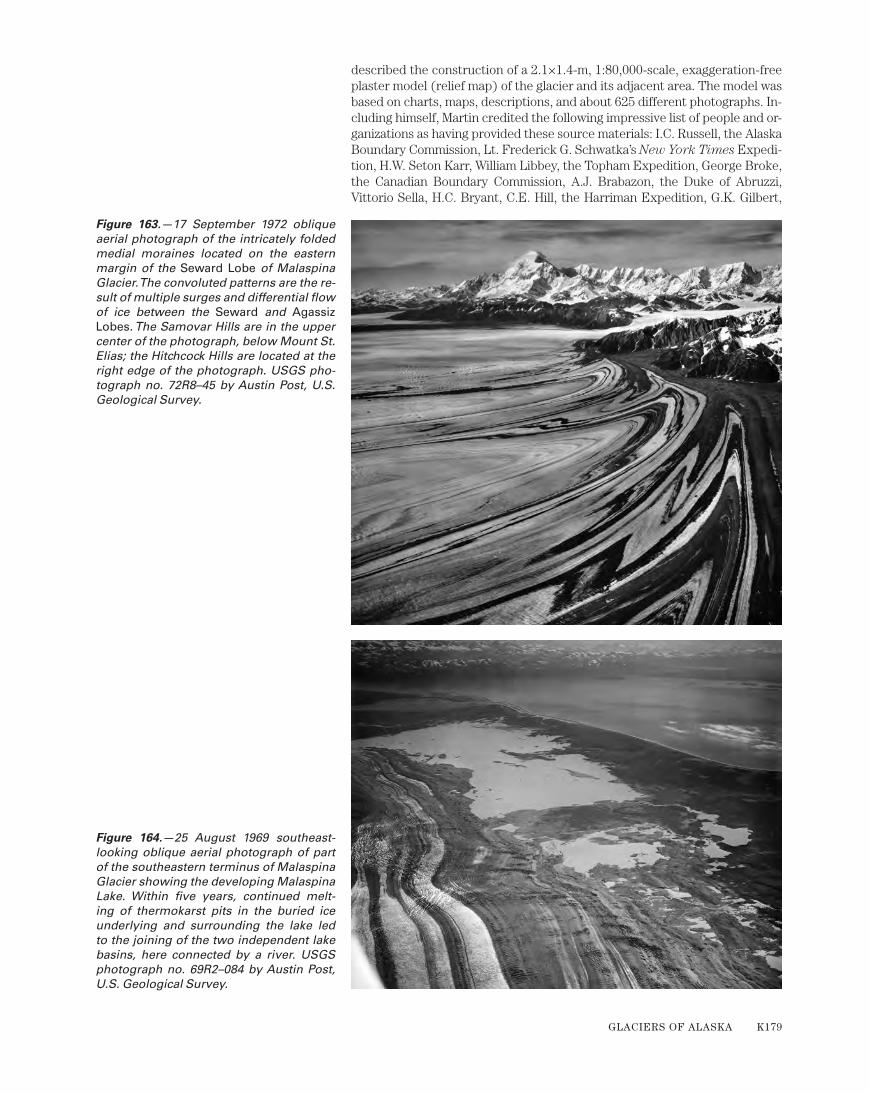
described the construction of a 2.1×1.4-m, 1:80,000-scale, exaggeration-free plaster model (relief map) of the glacier and its adjacent area. The model was based on charts, maps, descriptions, and about 625 different photographs. In-cluding himself, Martin credited the following impressive list of people and or-ganizations as having provided these source materials: I.C. Russell, the Alaska Boundary Commission, Lt. Frederick G. Schwatka’s New York Times Expedi-tion, H.W. Seton Karr, William Libbey, the Topham Expedition, George Broke, the Canadian Boundary Commission, A.J. Brabazon, the Duke of Abruzzi, Vittorio Sella, H.C. Bryant, C.E. Hill, the Harriman Expedition, G.K. Gilbert,
Figure 163.—17 September 1972 oblique aerial photograph of the intricately folded medial moraines located on the eastern margin of the Seward Lobe of Malaspina Glacier. The convoluted patterns are the re-sult of multiple surges and differential flow of ice between the Seward and Agassiz Lobes. The Samovar Hills are in the upper center of the photograph, below Mount St. Elias; the Hitchcock Hills are located at the right edge of the photograph. USGS pho-tograph no. 72R8–45 by Austin Post, U.S. Geological Survey.
Figure 164.—25 August 1969 southeast-looking oblique aerial photograph of part of the southeastern terminus of Malaspina Glacier showing the developing Malaspina Lake. Within five years, continued melt-ing of thermokarst pits in the buried ice underlying and surrounding the lake led to the joining of the two independent lake basins, here connected by a river. USGS photograph no. 69R2–084 by Austin Post, U.S. Geological Survey.
GLACIERS OF ALASKA K179

Henry Gannett, the U.S. Fish Commission, the U.S. Coast and Geodetic Survey, the U.S. Boundary Commission, Fremont Morse, the U.S. Geological Survey, A.G. Maddren, E. Blackwelder, R.S. Tarr, and others.
Sharp (1958a) stated that the latest major advance of Malaspina Glacier culminated 200±50 years ago (A.D. 1708–1808). However, in 1891, Russell photographed part of the eastern terminus of the margin of the Malaspina Glacier advancing into an adjacent forest (USGS Photo Library Russell 396 photograph). During most of the 20th century, the margin of the Malaspina Glacier has been stagnating, downwasting, and retreating. A very thick debris-covered zone 0.75– to 6-km wide surrounds the glacier’s margin. In places, the debris is several meters thick and supports mature spruce and hemlock trees, some more than 150 years old. Plafker and Miller (1958) pro-vided a comprehensive summary of the glacial history of the region and a detailed map of the piedmont lobe of Malaspina Glacier. A 1999 survey by the author documented continuing stagnation around the entire margin of the piedmont lobe, including tree- and sediment-covered areas. Unlike the case with a typical valley glacier — where terminus retreat is easily seen and generally characterized by newly exposed lateral moraines, trimlines, and fluted ground moraines — retreat of the terminus of the Malaspina Glacier is generally much harder to document. It is characterized by a decrease in the magnitude of relief of the margin’s debris-covered surface and the develop-ment of additional vegetation.
Within the Malaspina Glacier system, the eastern two-thirds of Malaspina Glacier, Seward Glacier, Hayden Glacier, Marvine Glacier, and Newton Gla-cier (a tributary of the Agassiz Glacier) all surge (Post, 1969). The earliest reported surge occurred in 1906 and involved Marvine Glacier and the east-ern piedmont lobe (Tarr, 1907). The glacier surged again between 1954 and 1956 (Sharp, 1958b) and again between 1986 and 1987.
Ablation studies conducted in the late 1940s (Sharp, 1951) and again in the late 1990s (Lingle and others, 1999) indicate that the piedmont lobe of Malaspina Glacier is rapidly thinning. Sharp (1951) reported that the annual surplus in the accumulation area was 175 cm of water in 1948–49, 66 cm of water in 1947–48, 43 cm of water in 1946–47, and 76 cm of water in 1945–46. On a daily basis, midsummer gross ablation of firn on upper Seward Glacier ranged from a mean of 7.6 mm to a maximum of 2.2 cm. Variation from year to year was significant; 1948 ablation was 75 percent greater than 1949 ablation. On Malaspina Glacier, daily gross ablation of clean ice in 1949 averaged 5.9 cm, a rate 900 percent greater than on upper Seward Glacier. With respect to mass balance, the glacier in l947–48 had a negative mass balance of 3.5 km3 (2.l5×1014 in3) of ice (3.19 km3 water equivalent). In l948–49, it had a positive mass balance of 1.48 km3 (0.91×10¹⁴ in3 ) of ice (1.35 km3 water equivalent), the result of heavy precipitation and reduced ablation. Sharp concluded that, under existing climatological conditions, a ‘‘normal” year produces a deficit of about 3.28 km3 (2.0×10¹⁴ in3 ) of ice (2.98 km3 water equivalent) and results in “a poor state of health.” Elsewhere, Sharp (1958b) reported that the glacier had experienced marked mass balance deficits in six of the nine budget years studied between 1945 and 1954. Of the other three years, one had a “good surplus,” and the other two were about balanced.
Lingle and others’ (1999) numbers are based on laser altimeter profiles of both Seward and Malaspina Glaciers that were obtained by Keith Echelmeyer on 5 June 1995. These profiles were compared with a USGS digital elevation model (DEM) of Alaska at a nominal resolution of 15 m. They concluded that ablation of the Alaskan part of Seward Glacier resulted in a loss of 3.0±1.5 km3 of water between the early-to-middle-1970s and 1995. The Seward Glacier lobe lost 48.5±5 km3 of water, and the entire Seward Glacier-Malaspina Gla-cier system lost 63.0±13 km3 of water. These amounts are equivalent to an average annual mass balance of −0.97±0.20 m and an annual volume loss of 2.52±0.52 km3 of water.
K180 SATELLITE IMAGE ATLAS OF GLACIERS OF THE WORLD
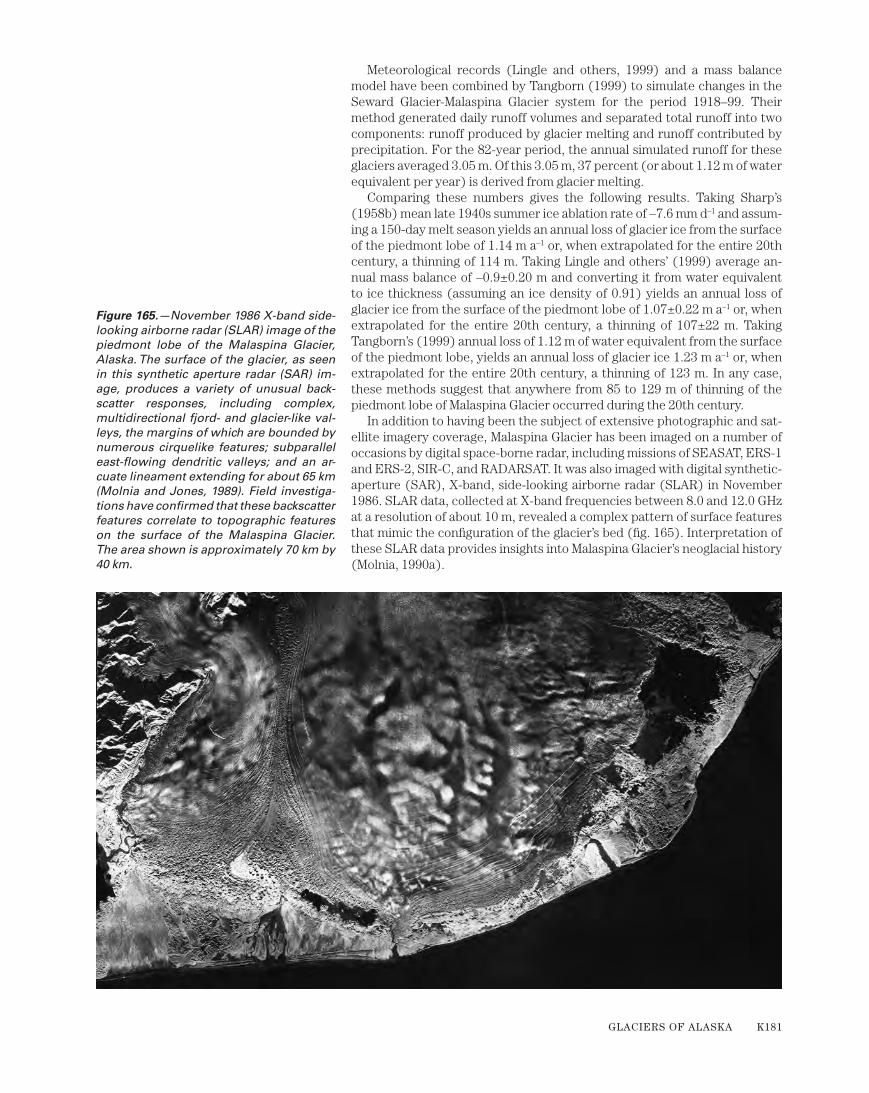
Meteorological records (Lingle and others, 1999) and a mass balance model have been combined by Tangborn (1999) to simulate changes in the Seward Glacier-Malaspina Glacier system for the period 1918–99. Their method generated daily runoff volumes and separated total runoff into two components: runoff produced by glacier melting and runoff contributed by precipitation. For the 82-year period, the annual simulated runoff for these glaciers averaged 3.05 m. Of this 3.05 m, 37 percent (or about 1.12 m of water equivalent per year) is derived from glacier melting.
Comparing these numbers gives the following results. Taking Sharp’s (1958b) mean late 1940s summer ice ablation rate of –7.6 mm d–1 and assum-ing a 150-day melt season yields an annual loss of glacier ice from the surface of the piedmont lobe of 1.14 m a–1 or, when extrapolated for the entire 20th century, a thinning of 114 m. Taking Lingle and others’ (1999) average an-nual mass balance of –0.9±0.20 m and converting it from water equivalent to ice thickness (assuming an ice density of 0.91) yields an annual loss of glacier ice from the surface of the piedmont lobe of 1.07±0.22 m a–1 or, when extrapolated for the entire 20th century, a thinning of 107±22 m. Taking Tangborn’s (1999) annual loss of 1.12 m of water equivalent from the surface of the piedmont lobe, yields an annual loss of glacier ice 1.23 m a–1 or, when extrapolated for the entire 20th century, a thinning of 123 m. In any case, these methods suggest that anywhere from 85 to 129 m of thinning of the piedmont lobe of Malaspina Glacier occurred during the 20th century.
In addition to having been the subject of extensive photographic and sat-ellite imagery coverage, Malaspina Glacier has been imaged on a number of occasions by digital space-borne radar, including missions of SEASAT, ERS-1 and ERS-2, SIR-C, and RADARSAT. It was also imaged with digital synthetic-aperture (SAR), X-band, side-looking airborne radar (SLAR) in November 1986. SLAR data, collected at X-band frequencies between 8.0 and 12.0 GHz at a resolution of about 10 m, revealed a complex pattern of surface features that mimic the configuration of the glacier’s bed (fig. 165). Interpretation of these SLAR data provides insights into Malaspina Glacier’s neoglacial history (Molnia, 1990a).
Figure 165.—November 1986 X-band side-looking airborne radar (SLAR) image of the piedmont lobe of the Malaspina Glacier, Alaska. The surface of the glacier, as seen in this synthetic aperture radar (SAR) im-age, produces a variety of unusual back-scatter responses, including complex, multidirectional fjord- and glacier-like val-leys, the margins of which are bounded by numerous cirquelike features; subparallel east-flowing dendritic valleys; and an ar-cuate lineament extending for about 65 km (Molnia and Jones, 1989). Field investiga-tions have confirmed that these backscatter features correlate to topographic features on the surface of the Malaspina Glacier. The area shown is approximately 70 km by 40 km.
GLACIERS OF ALASKA K181
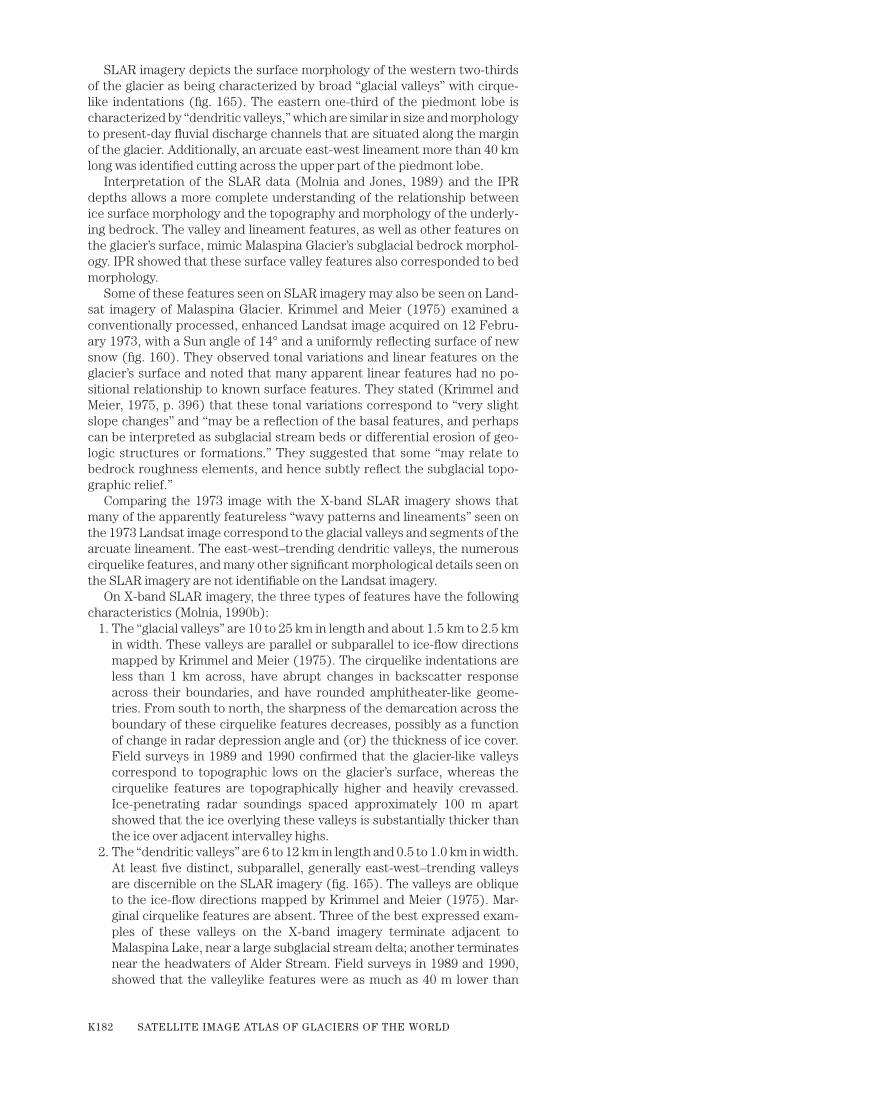
SLAR imagery depicts the surface morphology of the western two-thirds of the glacier as being characterized by broad “glacial valleys” with cirque-like indentations (fig. 165). The eastern one-third of the piedmont lobe is characterized by “dendritic valleys,” which are similar in size and morphology to present-day fluvial discharge channels that are situated along the margin of the glacier. Additionally, an arcuate east-west lineament more than 40 km long was identified cutting across the upper part of the piedmont lobe.
Interpretation of the SLAR data (Molnia and Jones, 1989) and the IPR depths allows a more complete understanding of the relationship between ice surface morphology and the topography and morphology of the underly-ing bedrock. The valley and lineament features, as well as other features on the glacier’s surface, mimic Malaspina Glacier’s subglacial bedrock morphol-ogy. IPR showed that these surface valley features also corresponded to bed morphology.
Some of these features seen on SLAR imagery may also be seen on Land-sat imagery of Malaspina Glacier. Krimmel and Meier (1975) examined a conventionally processed, enhanced Landsat image acquired on 12 Febru-ary 1973, with a Sun angle of 14° and a uniformly reflecting surface of new snow (fig. 160). They observed tonal variations and linear features on the glacier’s surface and noted that many apparent linear features had no po-sitional relationship to known surface features. They stated (Krimmel and Meier, 1975, p. 396) that these tonal variations correspond to “very slight slope changes” and “may be a reflection of the basal features, and perhaps can be interpreted as subglacial stream beds or differential erosion of geo-logic structures or formations.” They suggested that some “may relate to bedrock roughness elements, and hence subtly reflect the subglacial topo-graphic relief.”
Comparing the 1973 image with the X-band SLAR imagery shows that many of the apparently featureless “wavy patterns and lineaments” seen on the 1973 Landsat image correspond to the glacial valleys and segments of the arcuate lineament. The east-west–trending dendritic valleys, the numerous cirquelike features, and many other significant morphological details seen on the SLAR imagery are not identifiable on the Landsat imagery.
On X-band SLAR imagery, the three types of features have the following characteristics (Molnia, 1990b):
1. The “glacial valleys” are 10 to 25 km in length and about 1.5 km to 2.5 km in width. These valleys are parallel or subparallel to ice-flow directions mapped by Krimmel and Meier (1975). The cirquelike indentations are less than 1 km across, have abrupt changes in backscatter response across their boundaries, and have rounded amphitheater-like geome-tries. From south to north, the sharpness of the demarcation across the boundary of these cirquelike features decreases, possibly as a function of change in radar depression angle and (or) the thickness of ice cover. Field surveys in 1989 and 1990 confirmed that the glacier-like valleys correspond to topographic lows on the glacier’s surface, whereas the cirquelike features are topographically higher and heavily crevassed. Ice-penetrating radar soundings spaced approximately 100 m apart showed that the ice overlying these valleys is substantially thicker than the ice over adjacent intervalley highs.
2. The “dendritic valleys” are 6 to 12 km in length and 0.5 to 1.0 km in width. At least five distinct, subparallel, generally east-west–trending valleys are discernible on the SLAR imagery (fig. 165). The valleys are oblique to the ice-flow directions mapped by Krimmel and Meier (1975). Mar-ginal cirquelike features are absent. Three of the best expressed exam-ples of these valleys on the X-band imagery terminate adjacent to Malaspina Lake, near a large subglacial stream delta; another terminates near the headwaters of Alder Stream. Field surveys in 1989 and 1990, showed that the valleylike features were as much as 40 m lower than
K182 SATELLITE IMAGE ATLAS OF GLACIERS OF THE WORLD

adjacent highs and were characterized by fewer crevasses, minimal sur-face relief, a sediment veneer, and both standing and running water.
3. The arcuate lineament is a gently curving linear feature that extends in an east-west direction for more than 40 km. This arcuate lineament may be a trace of one of the boundary faults separating the North American Plate from the Pacific Plate, as is the case with the Fairweather Fault trench located approximately 120 km to the southeast. From west to east, it can be followed from the shoreline of Icy Bay, across outwash sediments and the upper part of Malaspina Glacier, to Malaspina Lake. The lineament crosses a large medial moraine complex characterized by thermokarst features (fig. 165). The trace of the lineament corresponds to the northern shoreline of Malaspina Lake.
The location of the transition between the two types of SLAR valley fea-tures corresponds to the inferred location of Hubbard Glacier’s neoglacial maximum-advance terminal moraine complex position. Because both Hub-bard Glacier and Malaspina Glacier could not have occupied the same space, the piedmont lobe of Malaspina Glacier must have been much smaller or, perhaps, even nonexistent at the time of the Hubbard Glacier maximum. A retracted Malaspina Glacier would open several deepwater embayments, each as much as approximately 50 km inland of the present shoreline. Fol-lowing the retreat of Hubbard Glacier, expansion of Malaspina Glacier filled the embayments and overtopped the Hubbard Glacier moraine. Subglacial dendritic channels were ice proximal drainages that were overtopped by the advancing glacier. The retreat of Hubbard Glacier is dated at around 600 yr B.P. (Plafker and Miller, 1958); hence, as Sharp (1958a) suggested, the ex-pansion of Malaspina Glacier to its present position could have occurred only during the past few hundred years.
Many of the higher elevation tributaries to Aggasiz and Seward Glaciers head in cirques, passes, and valleys on the southern flanks of Mount Owen, Mount Eaton, Mount Augusta, Mount Baird, Mount Malaspina, Mount Ber-ing, Mount Jeannette, Mount Newton, and Mount St. Elias. Dome Pass, at an elevation of approximately 1,300 m, is the divide between Agassiz and Seward Glaciers. Most years, the previous year’s snow cover remains through the melt season. With the exception of several cirque glaciers, generally be-low 1,500 m elevation, no evidence of glacier thinning or retreat could be seen in this region.
Glaciers of Icy BayGlaciers have existed in the vicinity of Icy Bay for at least several million
years (Armentrout,1983). The present-day Icy Bay is the result of 20th cen-tury retreat of the most recent ice mass to fill the basin (Alpha, 1975; Molnia, 1977, 1979; Porter, 1989). As recently as the middle of the first decade of the 20th century, there was no Icy Bay because the entire basin was filled by an expanded and combined Guyot-Yahtse-Tyndall Glacier System, which ex-tended several kilometers beyond the basin into the Pacific Ocean. Retreat began before 1910 and, in most areas, has continued into the 21st century.
About 200 years earlier, when Vancouver explored the Alaskan coast in l794, the Icy Bay basin was also filled by an expanded Guyot Glacier. Then, too, Guyot Glacier was connected to the Malaspina Glacier system and ex-tended to the Gulf of Alaska. About 8 km to the east, a small bay, which Van-couver named Icy Bay, was open to the ocean. It had a compound spit on its eastern side, which Vancouver named Point Rioux. In 1852, Teben’kof published an atlas of maps prepared from soundings and topography com-piled by Russian trappers, naval officers, and explorers between 1788 and 1807. The late 18th century Icy Bay mapped by Teben’kov (fig. 10A) closely resembles the bay described by Vancouver (AHAP false-color infrared verti-cal aerial photograph no. L171F4950 acquired on 21 June 1978). As mapped by Teben'kov, the bay is triangular in shape with a length of about 12 km, a
GLACIERS OF ALASKA K183

width of about 8 km at its mouth, and a maximum depth of about 27 m. By l837, when Sir Edward Belcher (1843) sailed along the Gulf of Alaska coast, this second bay had been filled with sediment from the north and had disap-peared. Molnia (1977) calculated that about 0.5 km3 of glacially derived sedi-ment was necessary to fill the bay to sea level. Even after the bay had been filled, its morphology was such that its former location could be discerned easily. The author visited this location several times during the 1970s. The position of the compound spit was easily recognized because of differences in vegetation and elevation.
By 1837, Guyot Glacier had retreated as much as 6 km, resulting in the formation of a small embayment at the mouth of the present Icy Bay. Less than 50 years later, when Seton Karr (1887) visited the area and Topham (1889) mapped it, Guyot Glacier had readvanced and again ended in the Pa-cific Ocean, seaward of the present coastline (Topham’s map is fig. 2 of Tarr and Martin, 1914, p. 50). A large terminal moraine marks this maximum ad-vance (fig. 166). Following the retreat of Guyot Glacier, melting of relict ice in the terminal moraine complex resulted in as much as 30 m of deepening at the mouth of the bay between 1922 and 1976 (Molnia, 1977).
The glaciers of Icy Bay still continue to produce large quantities of sedi-ment. During the summer of 1995, rates of accumulation at the head of the bay, adjacent to Guyot Glacier, averaged 0.3 cm d–1 and 0.02 cm d–1 in mid-fjord (Jaeger and Nittrouer, 1999b).
At the beginning of the 20th century, when it was observed by Gilbert (USGS Photo Library Gilbert 332 photograph), the terminus of Guyot Glacier still extended into the Pacific Ocean. Retreat began before 1910, probably as early as 1904; by 1913, the retreating glacier had developed a 12-km-long calving face (USGS Photo Library Maddren 216 and 218–221 photographs). Retreat has continued into the 21st century. By the late 1930s, the glacier had retreated as much as 30 km to a location where its terminus was anchored at the narrow neck of the bay in the general location of present-day Kichyatt and Kageet Points. The terminus stayed close to this position for the next 15 years (USAF for U.S. Army Map Service vertical aerial photograph no. 51–AM–1, AST4, M–233, Roll 66, Frame 8860 acquired on 30 July 1957). Between 1957 and 1963, the terminus retreated another 5 km and separated into three calving termini by 24 August 1963 (fig. 167). In 1965, when the westernmost terminus separated into two distinct termini, Icy Bay was an approximately 40-km-long fjord with four separate fjord arms at its head. Porter (1989) cal-culated that the mean rate of retreat in Icy Bay was about 1 km a–1 for the
Figure 166.— Physiographic diagram modified from Alpha (1975) showing the position of the large terminal moraine that marks the maximum advance of the Guyot Glacier into the Gulf of Alaska prior to 1910 and the location of the glacier termini as they were at the end of 1974. The moraine can be seen at the mouth and following along part of the eastern shore of Icy Bay. A larger version of this figure is available online.
Figure 167.—24 August 1963 oblique aerial photograph showing the retreating gla-ciers at the head of Icy Bay. In the six years between 1957 [see U.S. Air Force (for U.S. Army Map Service) vertical aerial photo-graph no. 51–AM–1, AST4, M–233, Roll 66, Frame 8860 acquired on 30 July 1957] and 1963, Tyndall and Yahtse Glaciers have sep-arated from the retreating margin of Guyot Glacier and retreated approximately 5 km. USGS photograph no. K633-52 by Austin Post, U.S. Geological Survey.
K184 SATELLITE IMAGE ATLAS OF GLACIERS OF THE WORLD

period 1904 to 1926 and about 0.4 km a–1 for the period 1926 to 1989. When the glaciers were observed in 1998, 1999, 2003, and 2004, all were actively calving icebergs, and all of the fjords appeared to be lengthening except for Taan Fiord. Water depths in upper Icy Bay exceed 185 m (Post, 1983).
Tyndall Glacier (fig. 168), which has an accumulation area of around 130 km2 and an ablation area of around 20 km2, has a total area of approximately 150 km2. Its length is about 20 km, its AAR is about 0.85 and its calving face is about 1.1-km-long (table 2) (Viens, 1995). By 1960, Tyndall Glacier was separated from Yahtse Glacier and was retreating. Between 1960 and 1999, Tyndall Glacier retreated approximately 17 km. The position of its terminus stabilized after 1990 at the head of its fjord. Between 1981 and 1999, Tyndall Glacier thinned by more than 350 m at the location of the 1999 terminus. As
Figure 168.—Three oblique aerial photo-graphs documenting the retreat of Tyndall Glacier from 1963 to 1998. During the 35-year period, Tyndall Glacier retreated more than 14 km. The point labeled A is common to all three photographs. A, 24 August 1963 photograph showing the retreating margin of Tyndall Glacier. USGS photo-graph no. K633–56 by Austin Post, U.S. Geological Survey. B, 12 September 1986 photograph showing the retreating margin of Tyndall Glacier. In the 23 years between 1963 and 1986, Tyndall Glacier retreated approximately 12 km. USGS photograph no. 86–R2–168 by Robert M. Krimmel, U.S. Geological Survey. C, 13 August 1998 pho-tograph of the retreating margin of Tyndall Glacier. In the 12 years between 1986 and 1998, Tyndall Glacier retreated approxi-mately 3 km, most of its retreat taking place before 1990. Since 1990, the position of the terminus has shown only slight change. The margin of Tyndall Glacier at sea level at this time is located only about 12 km from the summit of Mount St. Elias at an eleva-tion of 5,489 m. This 46-percent gradient is one of the steepest on Earth. Photograph by Bruce F. Molnia, U.S. Geological Survey.
GLACIERS OF ALASKA K185
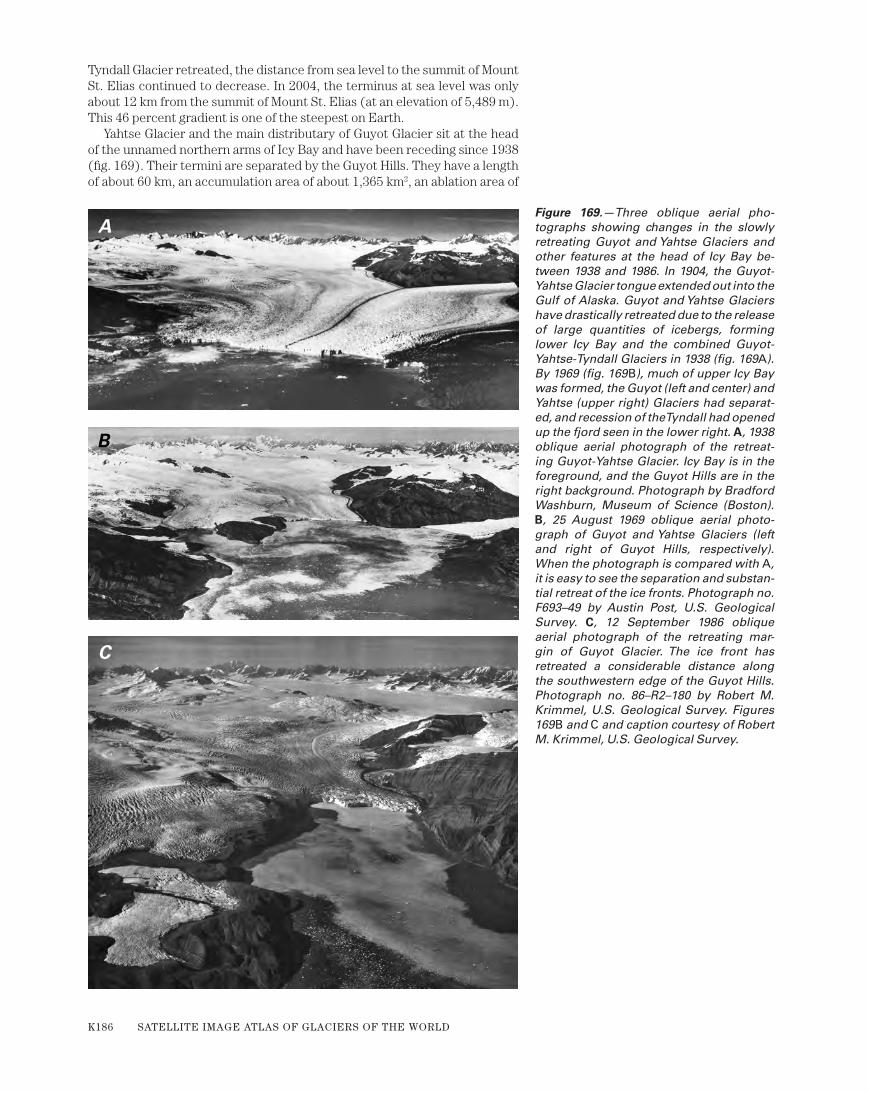
Tyndall Glacier retreated, the distance from sea level to the summit of Mount St. Elias continued to decrease. In 2004, the terminus at sea level was only about 12 km from the summit of Mount St. Elias (at an elevation of 5,489 m). This 46 percent gradient is one of the steepest on Earth.
Yahtse Glacier and the main distributary of Guyot Glacier sit at the head of the unnamed northern arms of Icy Bay and have been receding since 1938 (fig. 169). Their termini are separated by the Guyot Hills. They have a length of about 60 km, an accumulation area of about 1,365 km2, an ablation area of
Figure 169.—Three oblique aerial pho-tographs showing changes in the slowly retreating Guyot and Yahtse Glaciers and other features at the head of Icy Bay be-tween 1938 and 1986. In 1904, the Guyot-Yahtse Glacier tongue extended out into the Gulf of Alaska. Guyot and Yahtse Glaciers have drastically retreated due to the release of large quantities of icebergs, forming lower Icy Bay and the combined Guyot-Yahtse-Tyndall Glaciers in 1938 (fig. 169A). By 1969 (fig. 169 B), much of upper Icy Bay was formed, the Guyot (left and center) and Yahtse (upper right) Glaciers had separat-ed, and recession of the Tyndall had opened up the fjord seen in the lower right. A, 1938 oblique aerial photograph of the retreat-ing Guyot-Yahtse Glacier. Icy Bay is in the foreground, and the Guyot Hills are in the right background. Photograph by Bradford Washburn, Museum of Science (Boston). B, 25 August 1969 oblique aerial photo-graph of Guyot and Yahtse Glaciers (left and right of Guyot Hills, respectively). When the photograph is compared with A, it is easy to see the separation and substan-tial retreat of the ice fronts. Photograph no. F693–49 by Austin Post, U.S. Geological Survey. C, 12 September 1986 oblique aerial photograph of the retreating mar-gin of Guyot Glacier. The ice front has retreated a considerable distance along the southwestern edge of the Guyot Hills. Photograph no. 86–R2–180 by Robert M. Krimmel, U.S. Geological Survey. Figures 169 B and C and caption courtesy of Robert M. Krimmel, U.S. Geological Survey.
K186 SATELLITE IMAGE ATLAS OF GLACIERS OF THE WORLD

about 65 km2, and a total area of about 1,430 km2. Their AAR is around 0.96; together, their calving face is approximately 5 km long (tables 2, 3) (Viens, 1995). When they were observed in 1998, 1999, 2003, and 2004, both were actively calving icebergs and retreating.
Guyot Glacier and Tsaa Fiord are separated by a peninsula of land named the Kahsteen Hills. A 0.4×0.3-km mass of stranded ice, here called the Guyot Remnant, was located on a large plateau on the peninsula. The remnant sep-arated from the retreating Guyot Glacier after 1978. When the remnant was visited in 1998 and on 28 July 1999 (fig. 170), it was melting in situ, and an abandoned subglacial stream channel was found to have passed completely through the remnant. The remnant had completely melted by 2004.
Tsaa Glacier (fig. 171) is the name that Post (1983) applied to the glacier at the head of Tsaa Fiord. It has a length of about 20 km, an accumulation area of about 145 km2, an ablation area of about 6 km2, and a total area of about 150 km2. Its AAR is about 0.96, and its calving face is approximately 0.6 km long (tables 2, 3) (Viens, 1995). When the glacier was observed in 1998, 2001, 2003, and 2004, a large subglacial stream discharged substantial quantities of sediment-laden turbid water at its face. This water, in turn, cut a large gorge into the surface of the ice. No evidence of the stream was found
Figure 170.—28 July 1999 photograph of a part of 0.3-km-long subglacial channel under the Guyot Remnant. The remnant was probably separated from the retreat-ing Guyot Glacier between 1978 and 1986. The location of Guyot Remnant can be seen in the lower left corner of figure 169 C. Photograph by Bruce F. Molnia, U.S. Geological Survey.
Figure 171.—22 July 1980 oblique aerial photograph of the retreating four distrib-utary-glacier margins at the head of Tsaa Fiord. During the 18-year-period from 1980 to 1998, the margin of Guyot Glacier in Tsaa Fiord retreated less than 1 km. Tsaa Glacier is the name Post (1983) applied to the dis-tributary glacier at the head of the fjord. It is shown as a part of Guyot Glacier on many maps. Photograph by Bruce F. Molnia, U.S. Geological Survey.
GLACIERS OF ALASKA K187

in 1999. Several smaller glaciers, including Grotto Glacier are located on the western wall of the fjord. In 1999, Grotto Glacier was calving icebergs. All of the smaller glaciers showed evidence of thinning and recent retreat. In 2002, an unnamed glacier adjacent to Grotto Glacier advanced several hundred meters; it was retreating when observed in June 2003.
A recent study of rates of erosion by tidewater glaciers was conducted by Koppes and others (2001), who examined glaciomarine sediments deposited in fjords. They determined that glacier-erosion rates are recognized to be up to an order of magnitude higher than the highest rates found anywhere else on Earth and that these rates are representative of Alaskan tidewater glaciers during their extensive retreat over the past century. They examined Icy Bay to determine the influence of retreat rate on sediment yields by re-constructing the history of the amount of sediment output from retreating tidewater glaciers that would be necessary to produce the sediment pack-ages observed in seismic profiles of the fjord. Using a numerical model of proglacial sedimentation, seismic profiles of glaciomarine sediments, and a history of terminus retreat, they calculated sediment flux as a function of time for Tyndall Glacier for the period 1961–99. They found that the average sediment flux during the 1961–99 period was 5.32×10⁸ m3 a–1, corresponding to a basinwide erosion rate of 35 mm a–1. During periods of rapid retreat, the erosion rate is up to three times higher, exceeding reported glacial-intergla-cial rates by more than an order of magnitude.
Glaciers West of Icy BayLocated west of Icy Bay, the Robinson Mountains are the southwestern-
most extension of the St. Elias Mountains. In August 1913, A.G. Maddren vis-ited the Robinson Mountains area and photographed many of the glaciers. In 1920, Taliaferro (1932, p. 764) also visited the region and commented “There is evidence in both the Yakataga and Katalla Districts that there has been a very recent retreat of the glaciers.” He also mentioned that about 30 m of re-treat occurred at the unnamed glacier located at the head of Munday Creek during the period from 1910 to 1920.
In addition to Guyot Glacier, which originates in the eastern Robinson Mountains and flows into Icy Bay, several generally south- and southwest-flowing outlet glaciers descend from its central and western sides. From east to west, named glaciers include: (1) Beare Glacier (AHAP false-color infrared vertical aerial photograph no. L120F5992 acquired on 18 August 1978); (2) Lare Glacier; (3) White River Glacier (fig. 172); (4) Yakataga Glacier (fig. 172) and its three primary tributaries (Eberly, Yaga, and Wat-son Glaciers); (5) Leeper Glacier; and (6) Miller Glacier (fig. 173). Many unnamed cirque and small hanging glaciers also descend from the Robinson Mountains. Regardless of size, all show significant evidence of stagnation or retreat and thinning.
Yakataga Glacier is 21 km long and varies in width from 0.8 to 3.6 km. Located 9 km from the Gulf of Alaska, the stagnant terminus sits at an el-evation of approximately 150 m. Miller (1957, p. 126) described the lower 3 km of Yakataga Glacier as being “largely covered by scattered low bushes to dense brush and a spruce forest near the terminus. On the inner face of the terminal moraine and adjacent part of the glacier are 30-cm diameter spruce trees, indicating that the lower end of the glacier has been inactive for at least the past fifty years.” At the end of the 20th century, the glacier margin continued to be characterized by ice stagnation and a cover of vegetation. Using photogrammetric techniques, Miller also determined that the surface velocity of Yakataga Glacier averaged 114 m a–1 or about 30 cm d–1 during the 16-year-period between 1938 and 1954. No movement could be detected in the lower 2.3 km of the glacier.
Figure 172.—18 August 1978 AHAP false-color infrared vertical aerial photograph of the southeastern Robinson Mountains with White River, Eberly, and Yakataga Glaciers. All of the valley glaciers show evidence of retreat and stagnant ice. Numerous small north-flowing retreating cirque glaciers de-scend from the crest of the ridge between Eberly and White River Glaciers. All of the south-facing cirques on this ridge are ice free. Yakataga Glacier has vegetation grow-ing on its debris-covered terminus. Ice from the Eberly Glacier no longer reaches Yakataga Glacier. AHAP photograph no. L119F6051 from the GeoData Center, Geophysical Institute, University of Alaska, Fairbanks, Alaska. A larger version of this figure is available online.
K188 SATELLITE IMAGE ATLAS OF GLACIERS OF THE WORLD

Northwestern St. Elias Mountains Segment: From the Canadian Border (long 141° W.) to White River, Chitistone River, Tana River, the Eastern Wall of the Valley of Tana Glacier, and the Southern Side of the Bagley Ice Valley
Landsat MSS images that cover the northwestern St. Elias Mountains region have the following Path/Row coordinates: 68/17, 68/18, 69/17, 69/18, and 70/17. These areas are mapped on the USGS Bering Glacier, Alaska, and McCarthy, Alaska, 1:250,000-scale topographic maps (appendix A). Even though the easternmost Bering Glacier (including its tributaries Quintino Sella Glacier, Columbus Glacier, and Jefferies Glaciers) is located in the St. Elias Mountains, it will be described in the Chugach Mountains section. The adjacent Granite Range, southwest of the Chitina Glacier and River and placed in the Chugach Mountains by Orth (1967), will be discussed here with the St. Elias Mountains.
Several significant glaciers feed the Chitina River drainage system. North of the eastern Bagley Ice Valley and southeast of the Chitina River, the pri-mary glacier is Logan Glacier; its tributaries include the Fraser, Baldwin, and Walsh Glaciers and an unnamed 23-km-long glacier. The Chitina River emanates from Chitina Glacier (about 70 km long and about 2 km wide), the named tributaries of which include Anderson (about 40 km long and about 2.5 km wide) and Tittmann Glaciers, and Ram Glacier with its tributaries Lamb and Ewe Glaciers. Barnard and Hawkins Glaciers drain into the north-ern side of the Chitina River.
Northwest-flowing Logan Glacier, which originates in Canada, is about 70 km long (Clarke and Holdsworth, 2002b). About 20 km west of the Ca-nadian Border, it is joined by Walsh Glacier (fig. 174). Another 15 km to the west, Logan Glacier joins Chitina Glacier (fig. 175, 176). All are debris-covered, low-gradient glaciers. All also show significant evidence of recent and long-term stagnation. Before 1920, Moffit (1918) studied the region and documented much evidence of recent glacier retreat and thinning (USGS Photo Library Moffit 618 photograph). Folded moraines on Walsh and Logan
Figure 173.—12 September 1986 oblique aerial photograph showing Mount Miller and the numerous thinning and retreat-ing glaciers on its south side. The largest, Miller Glacier, shows multiple evidence of past surges. USGS photograph no. 86–R2-200 by Robert M. Krimmel, U.S. Geological Survey.
GLACIERS OF ALASKA K189

Glaciers and on Baldwin Glacier (a tributary to Logan Glacier) indicate past surge history. Between 1961 and 1966, Walsh Glacier, with an accumula-tion area of approximately 545 km2, underwent a surge (Paige, 1965; Post, 1966,1967b) that resulted in ice displacement of approximately 11.5 km. In the 13 months between August l965 and September l966, displacement in the terminus area totaled 4.0 km, an average daily advance rate of about 10 m d–1. This activity rejuvenated the adjacent stagnant terminus of Logan Glacier, causing it to advance about 1.5 km. Post (1967b, p. 765) stated that this surge was the largest for Walsh Glacier “in the past 100 years or more.” A surge of Anderson Glacier in the late 1960s (Horvath and Field, 1969) im-pacted the central Chitina Glacier in the early 1970s.
Logan, Walsh, and Chitina Glaciers were observed from the air by the au-thor on 10 August 2001. No evidence of current surge activity was noted. All three showed significant evidence of ongoing thinning and stagnation and displayed elevated moraines and trimlines. Logan Glacier was the only one of the three to display white ice within a few kilometers of its terminus. All showed significant numbers of thermokarst pits and downwasting in their terminus regions.
Located west of Logan Glacier, the Granite Range comprises the north-western part of the St. Elias Mountains. The only published information about the glaciers in this region is a brief series of observations made by D.J. Miller during 1958–59 field studies (Brabb and Miller, 1962). Granite Range glaciers with lengths greater than 6 km and located on the southern side or at the head of Granite Creek include (from west to east): (1) an unnamed glacier adjacent to Ross Green Lake, with a length of approximately 6 km and an area of approximately 8 km2 (about 142°30'W.); (2) an unnamed glacier with a length of approximately 9 km and an area of approximately 9 km2; (3) an unnamed glacier, a distributary of Jefferies Glacier, with a length of ap-proximately 9 km and an area of approximately 9 km2; and (4) an unnamed glacier located at the head of Granite Creek, with a length of approximately 21 km and an area of approximately 30 km2.
Granite Range glaciers with lengths greater than 6 km located on the northern side of Granite Creek include (from west to east): (1) an unnamed glacier with a length of approximately 10 km and an area of approximately 8 km2 at the head of the Kiagna River; (2) an unnamed glacier with a length
Figure 174.—Oblique aerial photograph looking east-southeast at the confluence of the Walsh and Logan Glaciers on 31 August 1984. Their combined flow merges with the terminus of the Chitina Glacier about 10 km to the northwest. USGS photograph no. 84–R3–058 by Robert M. Krimmel, U.S. Geological Survey.
K190 SATELLITE IMAGE ATLAS OF GLACIERS OF THE WORLD

Logan Glacier
Walsh Glacier
Chitina Glacier
An
der
son
Gla
cier
Haw
kin
s G
laci
er
Barna
rd G
laci
er
CA
NA
DA
UN
ITED S
TATES
Logan Glacier
Klutlan Glacier
10 0 10 20 30 KILOMETERS
APPROXIMATE SCALE
Russell Glacier
141°30’W
61°15’N
Figure 175.—Most of the major glaciers on this annotated Landsat 3 RBV im-age are known to surge. The Barnard Glacier, with parallel medial moraines delineating the contribution of each of the numerous tributaries, is an excep-tion and does not surge. Walsh Glacier (fig. 174) had a several-year period of surge activity from 1961 to 1966, during which it had ice displacement of more than 10 km (Post, 1966, 1967a). The Chitina, Russell, and Klutlan Glaciers all have contorted medial moraines characteristic of surging glaciers. The Klutlan and Russell Glaciers both began another surge cycle in 1986. Landsat image (30853–19510–C; 5 July 1980; Path 68, Row 17) and caption courtesy of Robert M. Krimmel, U.S. Geological Survey.
GLACIERS OF ALASKA K191

of approximately 13 km and an area of approximately 20 km2 at the head of the East Fork Kiagna River (fig. 177); (3) a 7-km-long unnamed glacier, located north of the previous unnamed glacier, (4) an unnamed glacier lo-cated at the head of Goat Creek with a length of approximately 26 km and an area of approximately 35 km2; (5) an unnamed glacier forming the western branch of Marble Creek with a length of approximately 6 km and an area of approximately 6 km2; (6) an unnamed glacier at the head of Marble Creek with a length of approximately 8 km and an area of approximately 8 km2; and (7) an unnamed glacier forming the eastern branch of Marble Creek with a length of approximately 8 km and an area of approximately 9 km2.
Miller (Brabb and Miller, 1962) reported on the outermost vegetated mo-raines of nine glaciers less than 5 miles [8.3 km] in length and located on the northern side of Granite Creek that he believed were formed between A.D. 600 and A.D. 1310. He thought that the moraines represent a greater length of these glaciers (14 to more than 120 percent, with an average of 60 per-cent) compared to their late 1950s positions. He (Brabb and Miller, 1962) also noted that “a minor glacial advance culminating within the past 300 years, and followed by recession continuing to the present, is recorded by bare or sparsely vegetated moraines bordering nearly all of the glaciers with-in the map area.” These moraines represent a greater length of the glaciers (6 to 33 percent, with an average of 24 percent) compared to their late 1950s positions. Many of these glaciers were observed by the author on 10 August 2001 (fig. 178). All showed significant evidence of recent thinning and re-treat. Many were small remnants confined within parabolic lateral and end moraine complexes that towered above the ice. All were significantly smaller than their 1957 size as depicted on the Bering Glacier, Alaska, 1:250,000- scale topographic map (appendix A) and their size as shown on 1978 AHAP false-color infrared vertical aerial photography.
On the southern side of Granite Creek, on the northern side of Thomp-son Ridge, numerous valley glaciers have receded from their “Little Ice Age” maximum extent. Virtually all have deposited well-preserved lateral and ter-minal moraines (fig. 179).
Chitina Glacier
LoganGlacier
Ram
Gla
cier
N
Figure 176.—9 July 1978 AHAP false-color infrared vertical aerial photograph of the terminus of Chitina Glacier and the conflu-ence of Logan and Chitina Glaciers. Both glaciers are debris covered and possess numerous water-filled thermokarst pits. The terminus of Logan Glacier does not reach the terminus of Chitina Glacier. The two lakes adjacent to the terminal mo-raine of Logan Glacier are significantly larger on this photograph than they were when they were mapped by the USGS in 1959. There is no evidence of recent surge activity. Trimlines and ice-marginal lakes are additional evidence of glacier thinning and retreat. Abundant vegetation growing on the terminus of Chitina Glacier is addi-tional evidence that the terminus is com-prised of stagnant ice. AHAP photograph no. L110F6252 is from the GeoData Center, Geophysical Institute, University of Alaska, Fairbanks, Alaska. A larger version of this figure is available online.
Figure 177.—27 July 1982 AHAP false-color infrared vertical aerial photograph of the northern part of the Granite Range showing many of the glaciers near the headwaters of the East Fork of the Kiagna River. All of the glaciers shown are unnamed, retreat-ing, and thinning. The largest has recently lost contact with its western tributary, which is also rapidly thinning and retreat-ing. AHAP photograph no. L111F9504 from the GeoData Center, Geophysical Institute, University of Alaska, Fairbanks, Alaska.
K192 SATELLITE IMAGE ATLAS OF GLACIERS OF THE WORLD

Granite Creek
Granite Creek
N
Figure 179.—18 August 1978 AHAP false-color infrared verti-cal aerial photographic mosaic of numerous unnamed val-ley glaciers descending from Thompson Ridge toward the east-to-west-flowing Granite Creek, a tributary to the north-flowing Tana River. Virtually all of the glaciers have receded from their “Little Ice Age” maximum extent. Prominent
lateral and terminal moraines are evidence of this recession. Note the well-developed ogives on the valley glacier in the middle of the mosaic. AHAP photograph nos. L112F5840 and L112F5842 from the GeoData Center, Geophysical Institute, University of Alaska, Fairbanks, Alaska.
Figure 178.—Two 10 August 2001 oblique aerial photographs showing significant retreat and thinning of small unnamed valley glaciers in the Granite Creek drainage of the Granite Range. Each of these glaciers is confined within a lateral/
terminal moraine complex that marks each glacier’s “Little Ice Age” maximum position. A, Unnamed retreating glacier ter-minus located on the north side of Granite Creek, the longest of the glaciers draining south into Granite Creek. The retreat of this glacier started long enough ago that its lower valley is vegetated and its terminal moraine has been eroded away. USGS photograph no. 01–08–3AK–083 by Bruce F. Molnia, U.S. Geological Survey. B, Unnamed retreating glacier ter-minus located on the north side of Granite Creek. The glacier drains south into Granite Creek. In 1957, this glacier was in contact with its encircling moraine. USGS photograph no. 01–08–3AK–086 by Bruce F. Molnia, U.S. Geological Survey.
GLACIERS OF ALASKA K193
An unnamed glacier in the Goat Creek drainage on the southern side of the Chitina River, opposite Barnard Glacier, was observed surging by Robert M. Krimmel (USGS) in 1986 (written commun., 1987). The surge, which oc-curred sometime after midwinter, stranded avalanche cones, some 100 m above the glacier. Displaced ice produced a thick, bulging terminus. The up-per glacier was largely unaffected by the surge (fig. 180).
Barnard Glacier, nearly 50-km-long, a non-surge-type glacier, drains into the Chitina River about 20 km west of Chitina Glacier. Located on the south-ern side of Mount Bona, its 30-km-long main trunk flows in a southwestly direction with only a gentle bend to the west. When Bradford Washburn first photographed it in l938 (fig. 37), the upper part of the glacier displayed more than 25 subparallel medial moraines, which were clearly visible on its sur-face. When Robert M. Krimmel (USGS) photographed it 46 years later on 31 August 1984 (fig. 181), an elevated lateral moraine on its western side and an increased sediment accumulation on its eastern margin (both signs of glacier thinning) were the only signs of change. The debris-covered terminus contains many thermokarst pits and is stagnating in place. In 2004, 20 years later, a continuation of this trend was observed by the author.
Hawkins Glacier is approximately 30 km long and averages about 1.5 km-wide. Minimally observed, the glacier has a debris-covered stagnant termi-nus and shows no evidence of surge-type activity. Many subparallel moraines are exposed near its head. It drains into the Chitina River approximately 5 km west of Barnard Glacier.
North of the Chitina River and west of Hawkins Glacier, Twaharpies and Chitistone Glaciers and other glaciers of the University Range drain west-ward into the Chitistone River. Russell Glacier with its numerous unnamed tributaries, Giffin Glacier with its tributary Gooseneck Glacier, and Guerin Glacier all drain north into the White River. The massive Klutlan Glacier, with more than a dozen unnamed tributaries, and the smaller Natazhat Glacier both originate in the United States and cross the border into Canada, where their discharge enters the White River. Because of their remote location, these glaciers have received little recent attention.
Denton and Karlén (1977) examined many of the glaciers in the White River drainage and Skolai Pass area. Specifically, they described the charac-teristics of Natazhat, Guerin, Giffin, Sheep, Russell, and Moraine Creek Gla-ciers and an unnamed glacier between Guerin and Giffin Glaciers. Generally, all have a similar history characterized by “Little Ice Age” advances culminat-ing between the 15th century and the early 20th century. All have vegetated and debris-covered termini and are fronted by older ice-cored moraines. For example, the non-surge-type Guerin Glacier heads on 4,031-m-high Mount Natazhat and terminates in a debris-covered margin at an elevation of 1,500 m. Its firn limit is situated at 2,286 m. Fronting the glacier is a 750-m-wide belt consisting of three nested bands of older hummocky, kettled, ice-cored moraine. The outer moraine terminates at an elevation of 1,173 m. Lichenometry indicates that the outer moraine dates from around A.D. 340 (1,650 lichen yr B.P.). The middle moraine dates between about A.D. 1270 and about 740 (1,230 14C yr B.P. and 800 lichen yr B.P.) and the inner moraine between A.D. 1500 and the 20th century.
Giffin Glacier, a surge-type glacier, is fed by eight tributary glaciers. All head on a ridge that includes 3,330-m-high Mount Sulzer. A ninth tributary, now separated, joined the terminus of an expanded early 20th century Gif-fin Glacier. In 1970, the glacier terminated in a debris-covered margin at an elevation of 1,250 m. Firn limits of its tributaries are situated between 2,225 and 2,286 m. Like Guerin Glacier, Giffin Glacier is fronted by a ring of several nested bands of ice-cored moraines.
K194 SATELLITE IMAGE ATLAS OF GLACIERS OF THE WORLD

Figure 180.—A small, actively surging glacier in Goat Creek drainage south of Barnard Glacier on 14 September 1986. The unnamed glacier is about 6 km long in this view. Previous to this surge, it was separat-ed from the foreground glacier by at least 1 km. The surge occurred sometime after midwinter, because the stranded avalanche cones, some 100 m above the glacier, were formed in the winter while the glacier was still thick in its midglacier section. Ice was transferred from the midglacier section to the now-bulging terminus. The upper gla-cier was largely unaffected by the surge. USGS photograph no. 86–R3–228 and cap-tion by Robert M. Krimmel, U.S. Geological Survey.
Figure 181.—Oblique aerial photograph of Barnard Glacier (figs. 38, 175) on 31 August 1984. It is a major nonsurging glacier in the midst of several major surging glaciers; Walsh and Russell Glaciers are both nearby. The medial moraines are clearly formed at the juncture of the glacier’s branches; they are carried downglacier and remain nearly parallel. If there is a disruption in normal flow, as in a surge, the regular pattern of these medial moraines would be altered. Compare the moraines of the Barnard to those of the Muldrow Glacier (figs. 405, 407) and Black Rapids Glacier (fig. 388). It is this difference in moraine patterns that allows sequential images, such as those from Landsat, to distinguish surging from nonsurging glaciers. USGS photograph no. 84–R3–051 and caption by Robert M. Krimmel, U.S. Geological Survey.
GLACIERS OF ALASKA K195

Sheep Glacier (Denton and Karlén, 1977), a surge-type glacier, also heads on the flank of 3,330-m-high Mount Sulzer and terminates in a debris-covered margin at an elevation of 1,585 m. Fronted by a belt of ice-cored moraine, the upper glacier surged in 1966.
Russell Glacier, a surge-type glacier with a length of 37 km, drains 4,766-m-high Mount Churchill, 5,005 m-high Mount Bona, and many of the higher peaks east of the University Range. Its firn limit is at approximately 2,286 m. Its width ranges from more than 1.5 to approximately 5.5 km. The terminus is a massive ice-cored moraine complex that plugs the head of the White River valley and extends downvalley to an elevation of about 1,219 m (USGS Photo Library Capps 80–83 photographs taken in ca. 1909). Field and Collins (1975) stated that the glacier changed very little through the first half of the 20th century. They describe “progressive wastage” through the 1970s. Denton and Karlén (1977, p. 92) stated that “In the lower region of the gla-cier, medial moraines become bent and then compressed, until they form a nearly continuous mantle of surficial debris covering the glacier ice and grad-ing into the Holocene moraines.” Robert M. Krimmel (USGS) (oral commun., 1992) stated that the Russell Glacier was beginning to surge in 1986. Some early photographs depict a Skolai Glacier, perhaps the westward-flowing distributary from Russell Glacier, that flowed through Skolai Pass into the Skolai Creek drainage.
Denton and Karlén’s (1977) Moraine Creek Glacier, a former tributary to the Russell Glacier, is located in the next drainage south of Wiley Creek. Before separating in the early 20th century, it was the ninth tributary to Rus-sell Glacier. It surged just before August 1957. Like all of the other nearby gla-ciers, its debris-covered terminus grades into a series of Holocene moraines.
Klutlan Glacier also has contorted medial moraines characteristic of a surge-type glacier. Like the Russell Glacier, Robert M. Krimmel (USGS) (oral commun., 1992) observed the Klutlan Glacier beginning to surge in 1986. A previous surge between 1961 and 1963 produced 4 km of ice displacement. Nearly 45 km of Klutlan Glacier are in Alaska. With a length of more than 80 km, it is the longest glacier in the northern St. Elias Mountains. Several of its unnamed tributaries are more than 15 km in length. Like most of the other glaciers in the region, its vegetation-covered, debris-laden terminus is suggestive of ongoing stagnation. Like Klutlan Glacier, the much smaller Natazhat Glacier flows from Alaska into Canada, where it too terminates in a debris-covered margin fronted by several older moraines.
Summary
During the period of the Landsat baseline, 1972–81, Johns Hopkins, Grand Pacific, Margerie, Brady, North Crillon, Lituya, Hubbard, and Turner Glaciers were advancing. La Perouse and South Crillon Glacier were stable, with the position of their termini fluctuating from year to year. Available evidence suggests that all other valley and outlet glaciers in the St. Elias Mountains were thinning and retreating.
At the beginning of the 21st century, North Crillon, Lituya, Hubbard, and Turner Glaciers were advancing. Johns Hopkins, La Perouse and South Cril-lon Glacier were stable, with the position of their termini fluctuating from year to year. All other valley and outlet glaciers in the St. Elias Mountains continued to thin and retreat.
K196 SATELLITE IMAGE ATLAS OF GLACIERS OF THE WORLD