
FieldFresh_final--Yale Site Feb 2011
34
yale case 10-036 december 10, 2010 FieldFresh Foods Could Baby Corn Be the Platform to Link Indian Farmers to the World? Mukesh Pandey K Sudhir Raman Ahuja Deepali Tewari
-
Upload
mukesh-pandey -
Category
Documents
-
view
215 -
download
0
Transcript of FieldFresh_final--Yale Site Feb 2011

8/3/2019 FieldFresh_final--Yale Site Feb 2011
http://slidepdf.com/reader/full/fieldfreshfinal-yale-site-feb-2011 1/34
yale case 10-036 december 10, 2010
FieldFresh Foods
Could Baby Corn Be the Platform to Link Indian Farmers to the World?
Mukesh Pandey
K Sudhir
Raman Ahuja
Deepali Tewari
8/3/2019 FieldFresh_final--Yale Site Feb 2011
http://slidepdf.com/reader/full/fieldfreshfinal-yale-site-feb-2011 2/34
2 fieldfresh
A Second Green Revolution?

8/3/2019 FieldFresh_final--Yale Site Feb 2011
http://slidepdf.com/reader/full/fieldfreshfinal-yale-site-feb-2011 3/34
3 fieldfresh
Regulatory hurdles to horticulture
→ → → →

8/3/2019 FieldFresh_final--Yale Site Feb 2011
http://slidepdf.com/reader/full/fieldfreshfinal-yale-site-feb-2011 4/34
4 fieldfresh
FieldFresh
FieldFresh’s mission
8/3/2019 FieldFresh_final--Yale Site Feb 2011
http://slidepdf.com/reader/full/fieldfreshfinal-yale-site-feb-2011 5/34
5 fieldfresh
Sourcing models

8/3/2019 FieldFresh_final--Yale Site Feb 2011
http://slidepdf.com/reader/full/fieldfreshfinal-yale-site-feb-2011 6/34
6 fieldfresh
Logistics
Product experimentation

8/3/2019 FieldFresh_final--Yale Site Feb 2011
http://slidepdf.com/reader/full/fieldfreshfinal-yale-site-feb-2011 7/34
7 fieldfresh
Baby corn
8/3/2019 FieldFresh_final--Yale Site Feb 2011
http://slidepdf.com/reader/full/fieldfreshfinal-yale-site-feb-2011 8/34
8 fieldfresh
Markets
European markets
!”
8/3/2019 FieldFresh_final--Yale Site Feb 2011
http://slidepdf.com/reader/full/fieldfreshfinal-yale-site-feb-2011 9/34
9 fieldfresh
Indian consumers
8/3/2019 FieldFresh_final--Yale Site Feb 2011
http://slidepdf.com/reader/full/fieldfreshfinal-yale-site-feb-2011 10/34
10 fieldfresh
New Indian agri-business players
8/3/2019 FieldFresh_final--Yale Site Feb 2011
http://slidepdf.com/reader/full/fieldfreshfinal-yale-site-feb-2011 11/34
11 fieldfresh
Growing FieldFresh
8/3/2019 FieldFresh_final--Yale Site Feb 2011
http://slidepdf.com/reader/full/fieldfreshfinal-yale-site-feb-2011 12/34
12 fieldfresh
Endnotes
8/3/2019 FieldFresh_final--Yale Site Feb 2011
http://slidepdf.com/reader/full/fieldfreshfinal-yale-site-feb-2011 13/34
13 fieldfresh
8/3/2019 FieldFresh_final--Yale Site Feb 2011
http://slidepdf.com/reader/full/fieldfreshfinal-yale-site-feb-2011 14/34
14 fieldfresh
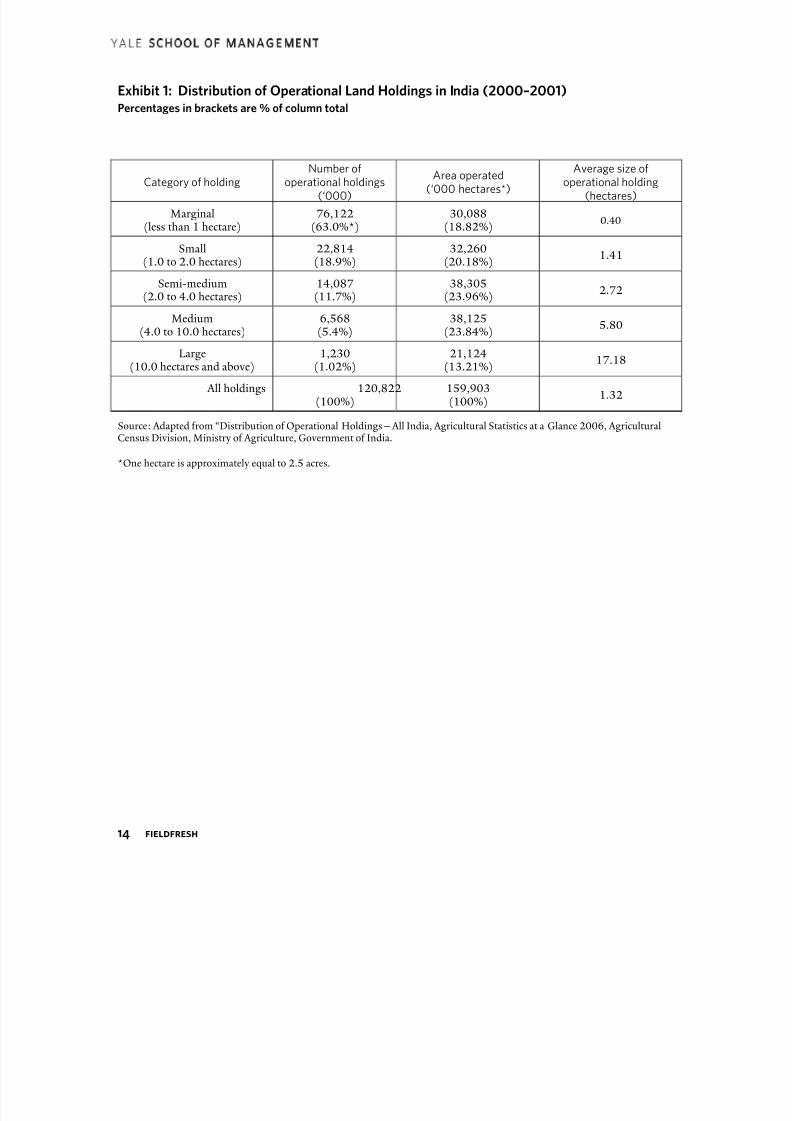
Exhibit 1: Distribution of Operational Land Holdings in India (2000–2001)
Percentages in brackets are % of column total
Category of holding
Number of
operational holdings(‘000)
Area operated
(‘000 hectares*)
Average size of
operational holding(hectares)
Marginal(less than 1 hectare)
76,122(63.0%*)
30,088(18.82%)
0.40
Small(1.0 to 2.0 hectares)
22,814(18.9%)
32,260(20.18%)
1.41
Semi-medium(2.0 to 4.0 hectares)
14,087(11.7%)
38,305(23.96%)
2.72
Medium(4.0 to 10.0 hectares)
6,568(5.4%)
38,125(23.84%)
5.80
Large
(10.0 hectares and above)
1,230
(1.02%)
21,124
(13.21%) 17.18
All holdings 120,822(100%)
159,903(100%)
1.32
Source: Adapted from “Distribution of Operational Holdings—All India, Agricultural Statistics at a Glance 2006, AgriculturalCensus Division, Ministry of Agriculture, Government of India.
*One hectare is approximately equal to 2.5 acres.
8/3/2019 FieldFresh_final--Yale Site Feb 2011
http://slidepdf.com/reader/full/fieldfreshfinal-yale-site-feb-2011 15/34
15 fieldfresh
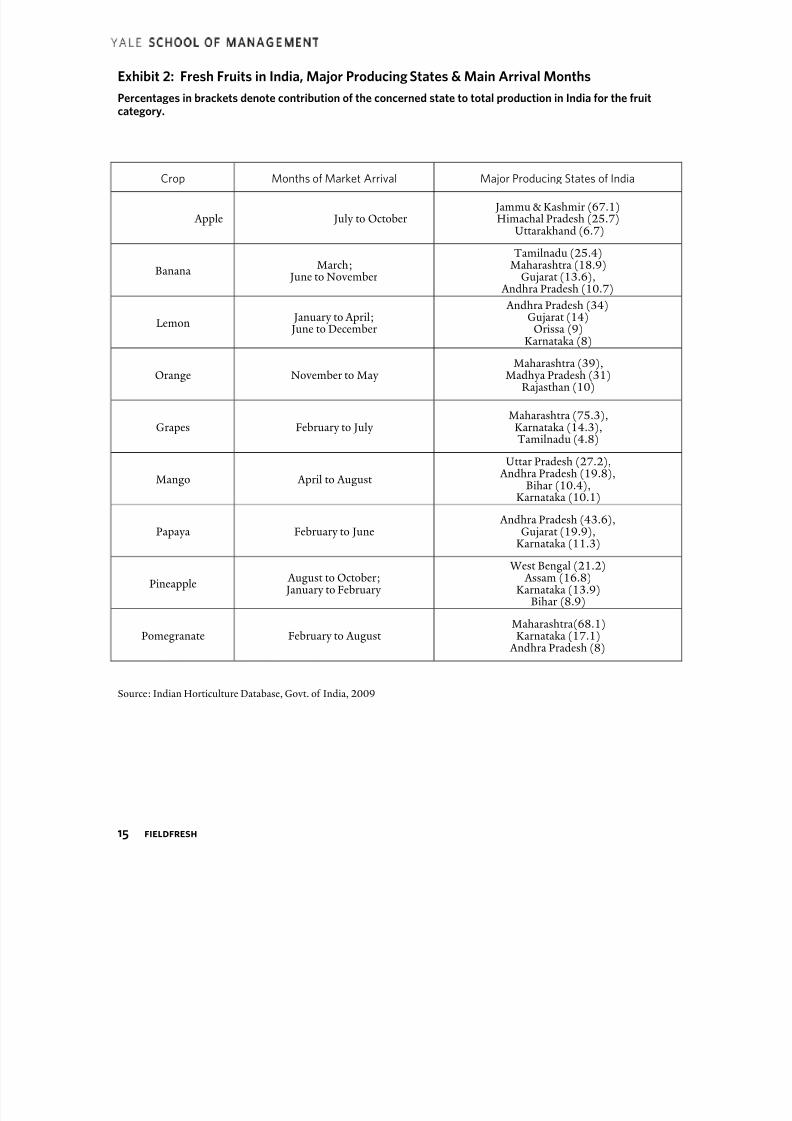
Exhibit 2: Fresh Fruits in India, Major Producing States & Main Arrival Months
Percentages in brackets denote contribution of the concerned state to total production in India for the fruitcategory.
Crop Months of Market Arrival Major Producing States of India
Apple July to October Jammu & Kashmir (67.1)Himachal Pradesh (25.7)
Uttarakhand (6.7)
BananaMarch;
June to November
Tamilnadu (25.4)Maharashtra (18.9)
Gujarat (13.6), Andhra Pradesh (10.7)
Lemon January to April; June to December
Andhra Pradesh (34)Gujarat (14)
Orissa (9)Karnataka (8)
Orange November to MayMaharashtra (39),
Madhya Pradesh (31)Rajasthan (10)
Grapes February to JulyMaharashtra (75.3),
Karnataka (14.3),Tamilnadu (4.8)
Mango April to August
Uttar Pradesh (27.2), Andhra Pradesh (19.8),
Bihar (10.4),Karnataka (10.1)
Papaya February to June Andhra Pradesh (43.6),
Gujarat (19.9),
Karnataka (11.3)
Pineapple August to October; January to February
West Bengal (21.2) Assam (16.8)
Karnataka (13.9)Bihar (8.9)
Pomegranate February to AugustMaharashtra(68.1)Karnataka (17.1)
Andhra Pradesh (8)
Source: Indian Horticulture Database, Govt. of India, 2009
8/3/2019 FieldFresh_final--Yale Site Feb 2011
http://slidepdf.com/reader/full/fieldfreshfinal-yale-site-feb-2011 16/34
16 fieldfresh
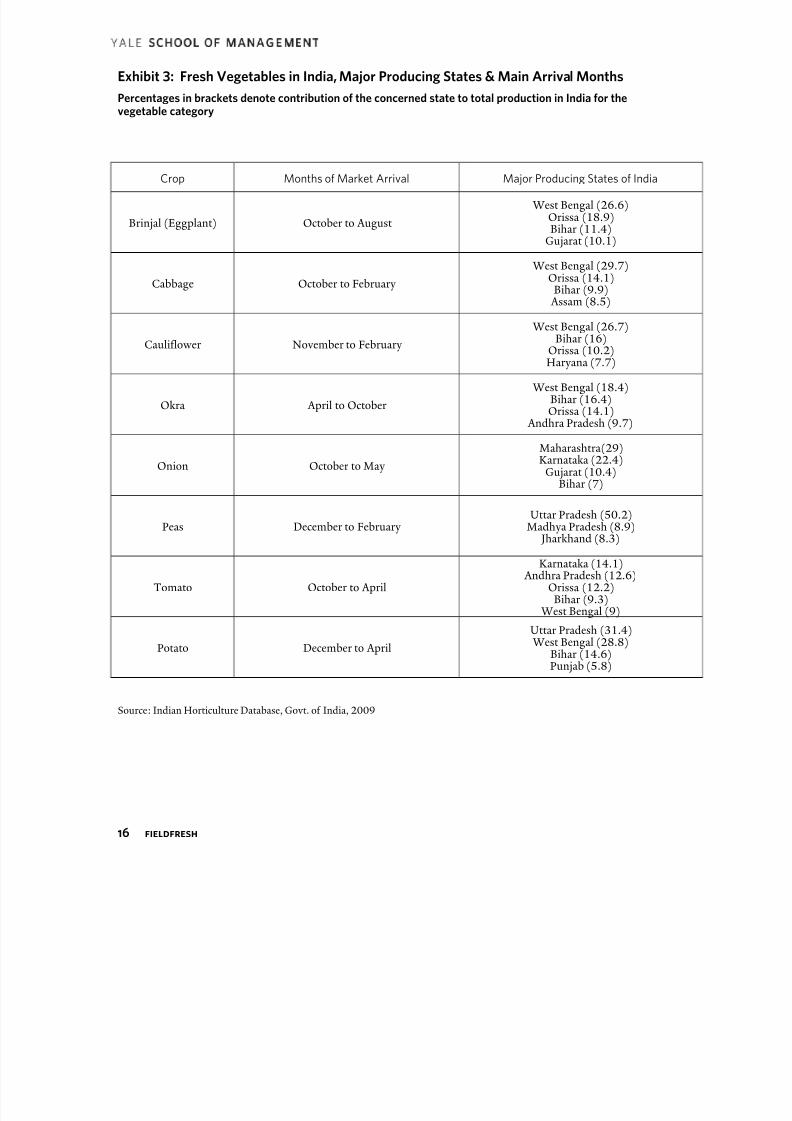
Exhibit 3: Fresh Vegetables in India, Major Producing States & Main Arrival Months
Percentages in brackets denote contribution of the concerned state to total production in India for thevegetable category
Crop Months of Market Arrival Major Producing States of India
Brinjal (Eggplant) October to August
West Bengal (26.6)Orissa (18.9)Bihar (11.4)
Gujarat (10.1)
Cabbage October to February
West Bengal (29.7)Orissa (14.1)
Bihar (9.9) Assam (8.5)
Cauliflower November to February
West Bengal (26.7)Bihar (16)
Orissa (10.2)
Haryana (7.7)
Okra April to October
West Bengal (18.4)Bihar (16.4)Orissa (14.1)
Andhra Pradesh (9.7)
Onion October to May
Maharashtra(29)Karnataka (22.4)
Gujarat (10.4)Bihar (7)
Peas December to FebruaryUttar Pradesh (50.2)
Madhya Pradesh (8.9) Jharkhand (8.3)
Tomato October to April
Karnataka (14.1) Andhra Pradesh (12.6)
Orissa (12.2)Bihar (9.3)
West Bengal (9)
Potato December to April
Uttar Pradesh (31.4) West Bengal (28.8)
Bihar (14.6)Punjab (5.8)
Source: Indian Horticulture Database, Govt. of India, 2009

8/3/2019 FieldFresh_final--Yale Site Feb 2011
http://slidepdf.com/reader/full/fieldfreshfinal-yale-site-feb-2011 17/34
17 fieldfresh
Exhibit 4: Production of Fresh Fruits in India
2006-07 2007-08 2008-09
FruitsArea
000' HA
Production
000'MT
Area
000' HA
Production
000'MT
Area
000' HA
Production
000'MT
Mango 2,154 13,734 2,201 13,997 2,309 12,750
Apple 252 16,240 264 2,001 274 1,985
Banana 604 20,998 658 23,823 709 26,217
Citrus 798 7,145 867 8,015 923 8,608
Guava 176 1,831 179 1,981 204 2,270
Grapes 65 1,685 68 1,735 80 1,878
Litchi 65 403 69 418 72 423
Papaya 72 2,482 83 2,909 98 3,629
Pineapple 87 1,362 80 1,245 84 1,341
Pomegranate 117 840 124 884 109 807
Sapota 149 1,216 152 1,258 156 1,308
Others 1,016 6,244 1,112 7,321 1,083 7,249
Total 5,554 59,563 5,857 65,587 6,101 68,466
Source: I Indian Horticulture Database, Govt. of India, 2009
Mango
19%
Apple
3%
Banana
38%
Citrus
12%
Guava
3%
Grapes
3%
Litchi
1%
Papaya
5%
Pineapple
2%
Pomegranate
1% Sapota
2%Others
11%
Production Share of Fresh Fruits in India(2008-09)
Source: Indian Horticulture Database, Govt. of India, 2009
8/3/2019 FieldFresh_final--Yale Site Feb 2011
http://slidepdf.com/reader/full/fieldfreshfinal-yale-site-feb-2011 18/34
18 fieldfresh
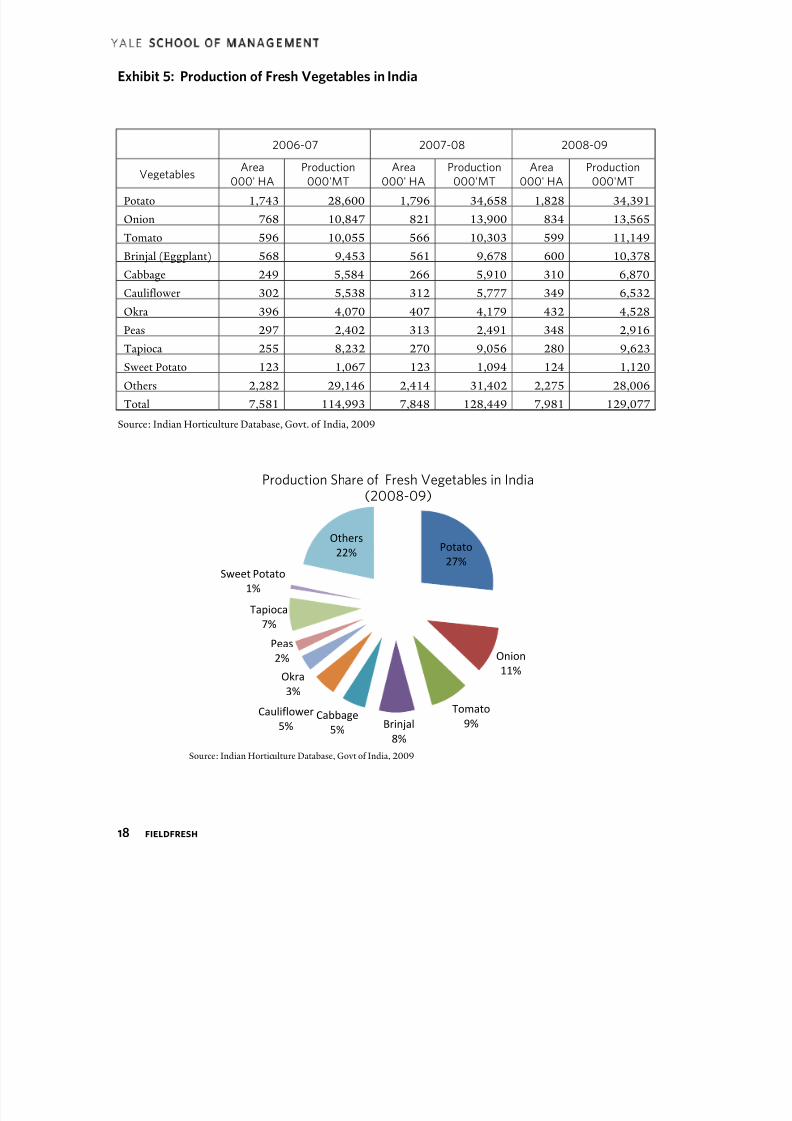
Exhibit 5: Production of Fresh Vegetables in India
2006-07 2007-08 2008-09
VegetablesArea
000' HA
Production
000'MT
Area
000' HA
Production
000'MT
Area
000' HA
Production
000'MT
Potato 1,743 28,600 1,796 34,658 1,828 34,391
Onion 768 10,847 821 13,900 834 13,565
Tomato 596 10,055 566 10,303 599 11,149
Brinjal (Eggplant) 568 9,453 561 9,678 600 10,378
Cabbage 249 5,584 266 5,910 310 6,870
Cauliflower 302 5,538 312 5,777 349 6,532
Okra 396 4,070 407 4,179 432 4,528
Peas 297 2,402 313 2,491 348 2,916
Tapioca 255 8,232 270 9,056 280 9,623
Sweet Potato 123 1,067 123 1,094 124 1,120
Others 2,282 29,146 2,414 31,402 2,275 28,006
Total 7,581 114,993 7,848 128,449 7,981 129,077
Source: Indian Horticulture Database, Govt. of India, 2009
Potato27%
Onion
11%
Tomato
9%Brinjal8%
Cabbage
5%
Cauliflower
5%
Okra
3%
Peas
2%
Tapioca
7%
Sweet Potato
1%
Others
22%
Production Share of Fresh Vegetables in India(2008-09)
Source: Indian Horticulture Database, Govt of India, 2009
8/3/2019 FieldFresh_final--Yale Site Feb 2011
http://slidepdf.com/reader/full/fieldfreshfinal-yale-site-feb-2011 19/34
19 fieldfresh
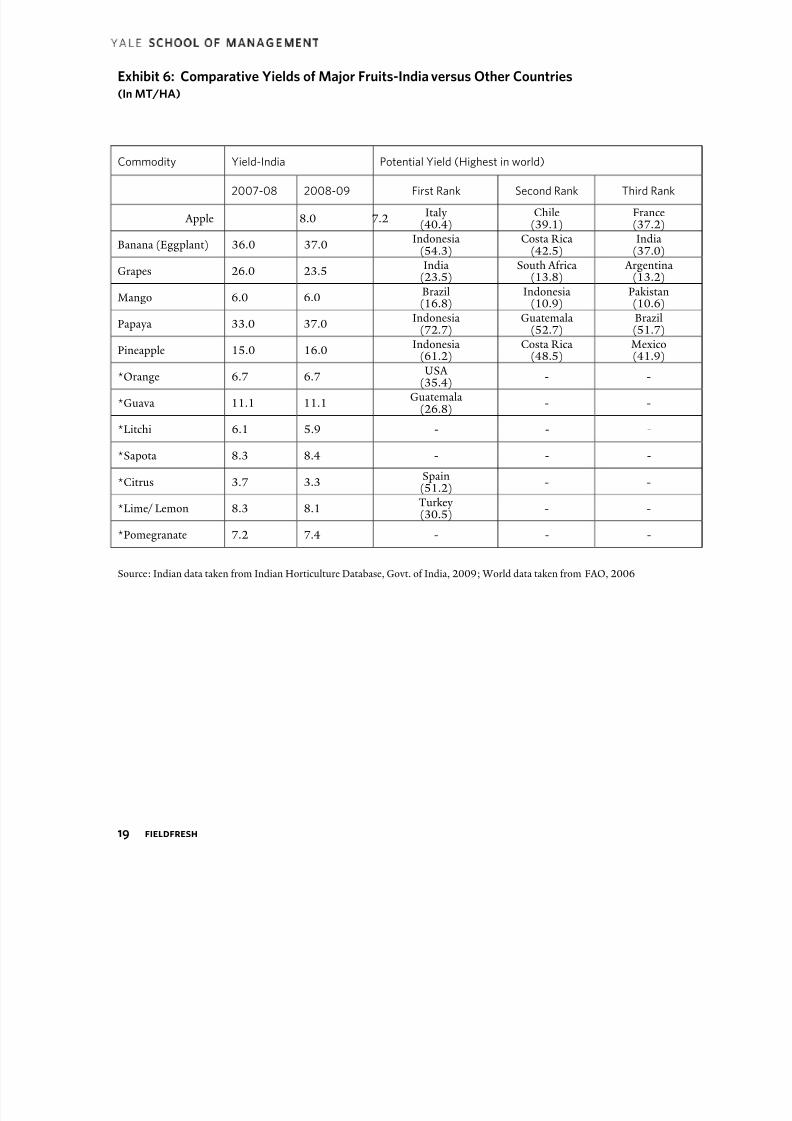
Exhibit 6: Comparative Yields of Major Fruits-India versus Other Countries
(In MT/HA)
Commodity Yield-India Potential Yield (Highest in world)
2007-08 2008-09 First Rank Second Rank Third Rank
Apple 8.0 7.2Italy
(40.4)Chile
(39.1)France(37.2)
Banana (Eggplant) 36.0 37.0Indonesia
(54.3)Costa Rica
(42.5)India
(37.0)
Grapes 26.0 23.5India
(23.5)South Africa
(13.8) Argentina
(13.2)
Mango 6.0 6.0Brazil(16.8)
Indonesia(10.9)
Pakistan(10.6)
Papaya 33.0 37.0Indonesia
(72.7)Guatemala
(52.7)Brazil(51.7)
Pineapple 15.0 16.0Indonesia
(61.2)Costa Rica
(48.5)Mexico(41.9)
*Orange 6.7 6.7USA
(35.4)- -
*Guava 11.1 11.1Guatemala
(26.8)- -
*Litchi 6.1 5.9 - - -
*Sapota 8.3 8.4 - - -
*Citrus 3.7 3.3Spain(51.2)
- -
*Lime/ Lemon 8.3 8.1Turkey(30.5)
- -
*Pomegranate 7.2 7.4 - - -
Source: Indian data taken from Indian Horticulture Database, Govt. of India, 2009; World data taken from FAO, 2006

8/3/2019 FieldFresh_final--Yale Site Feb 2011
http://slidepdf.com/reader/full/fieldfreshfinal-yale-site-feb-2011 20/34
20 fieldfresh
Exhibit 7: Comparative Yields of Major Vegetables - India versus Other Countries
(in MT/HA)
Commodity 2007-08 2008-09 Potential Yield (Highest in world)
First Rank Second Rank Third Rank
Brinjal (eggplant) 17.0 17.3 Japan(34.4)
Italy(29.6)
Turkey(26.2)
Cabbage 22.0 22.2Korea(67.3)
Japan(44.3)
Poland(37.7)
Cauliflower 18.0 18.7Italy
(22.3)Germany (22.2)
Turkey(21.5)
Okra 10.3 10.5 Egypt(15.7)
Saudi Arabia(11.5)
India(10.5)
Onion 15.0 16.3USA
(53.9)Spain(52.1)
Japan(47.6)
Peas 8.0 8.4France(11.5)
USA (11.0)
China(10.3)
Potato 19.0 18.8Netherlands
(45.6)Germany (43.8)
USA (44.2)
Tomato 18.2 18.6USA
(77.4)Spain(69.6)
Brazil(63.3)
Sweet Potato 8.9 9.0 Japan
(275.2)
Tapioca 33.57 34.35 -
Source: Indian data from Indian Horticulture Database, Govt. of India, 2009; World Data taken from FAO, 2006

8/3/2019 FieldFresh_final--Yale Site Feb 2011
http://slidepdf.com/reader/full/fieldfreshfinal-yale-site-feb-2011 21/34
21 fieldfresh
Exhibit 8: Exports of Fresh Fruits to various countries from India- Ranks and Share (%)
Commodity Country 1 Country 2 Country 3 Country 4 Country 5
Apple
Bangladesh
83.70
Nepal
12.43
BananaU Arab Emts44.6
Saudi Arabia19.6
Bahrain8.0
Kuwait6.9
OrangeBangladesh90.56
Nepal6.95
GrapesNetherlands37.32
UK18.21
Bangladesh17.11
U Arab Emts11.52
GuavaSaudi Arabia24.8
U Arab Emts18.7
Sudan13.4
Oman7.7
Nepal6.5
LitchiBangladesh66.3
Nepal33.7
MangoU Arab Emts45.8
Bangladesh23.9
UK8.2
Saudi Arabia4.9
PapayaU Arab Emts33.4
Saudi Arabia18.2
Netherland13.7
Bahrain7.9
Kuwait7.4
PineappleNepal32.0
Maldives20.2
U Arab Emts14.5
Saudi Arabia12.1
Kazakhstan3.3
SapotaU Arab Emts48.5
Bahrain16.9
UK15.1
Canada5.4
Source: Indian Horticulture Database, Govt. of India, 2009
8/3/2019 FieldFresh_final--Yale Site Feb 2011
http://slidepdf.com/reader/full/fieldfreshfinal-yale-site-feb-2011 22/34
22 fieldfresh
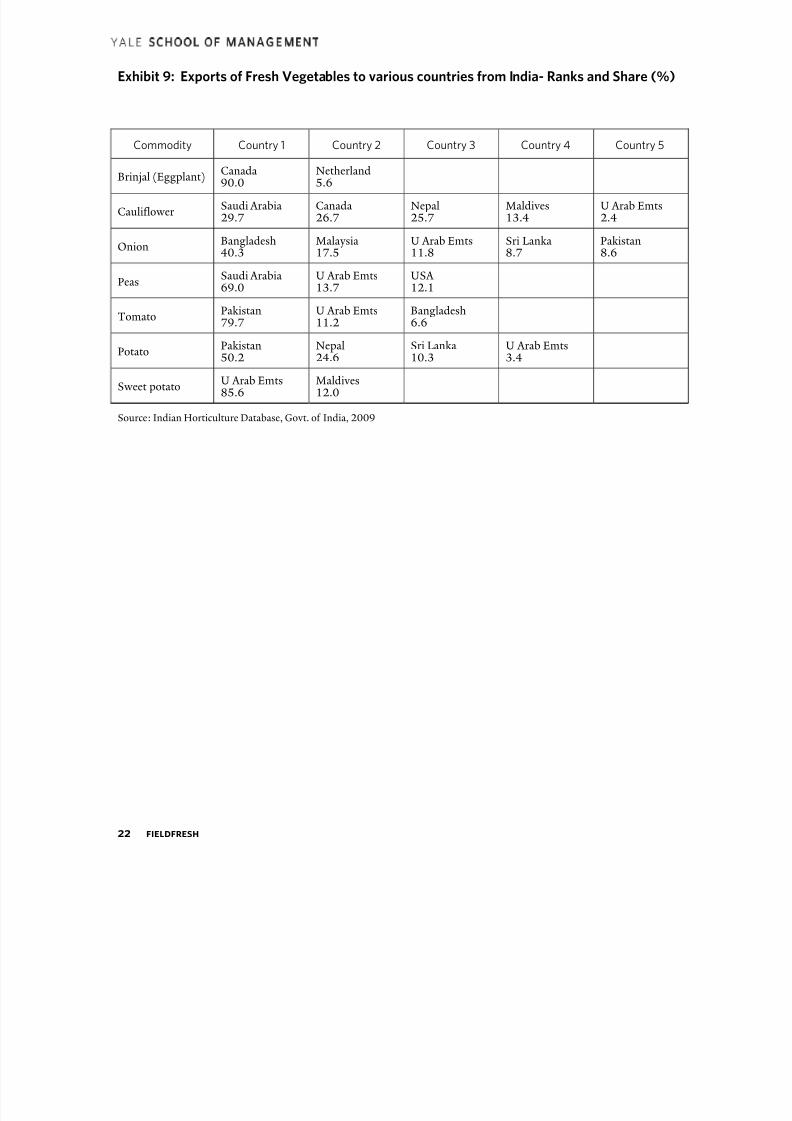
Exhibit 9: Exports of Fresh Vegetables to various countries from India- Ranks and Share (%)
Commodity Country 1 Country 2 Country 3 Country 4 Country 5
Brinjal (Eggplant)
Canada
90.0
Netherland
5.6
CauliflowerSaudi Arabia29.7
Canada26.7
Nepal25.7
Maldives13.4
U Arab Emts2.4
OnionBangladesh40.3
Malaysia17.5
U Arab Emts11.8
Sri Lanka8.7
Pakistan8.6
PeasSaudi Arabia69.0
U Arab Emts13.7
USA 12.1
TomatoPakistan79.7
U Arab Emts11.2
Bangladesh6.6
PotatoPakistan50.2
Nepal24.6
Sri Lanka10.3
U Arab Emts3.4
Sweet potatoU Arab Emts85.6
Maldives12.0
Source: Indian Horticulture Database, Govt. of India, 2009

8/3/2019 FieldFresh_final--Yale Site Feb 2011
http://slidepdf.com/reader/full/fieldfreshfinal-yale-site-feb-2011 23/34
23 fieldfresh
Exhibit 10: Export of Fresh Fruits from India
Fruits Quantity( '000 Kgs) Value (in Million Rupees)
2007-08 2008-09 2007-08 2008-09
Man o 54,350. 80 83,703.18 127.42 170.71
Apple 32,655.27 44,540.57 33.31
Banana 16,662.54 30,401.46 33.31 52.17
Orange 29,261.30 25,329.57 27.27 23.20
Grapes 96,723.21 118,132.93 317.07 367.06
Litchi 161.52 1,546.50 0.06 1.56
Pa a a 10,879.73 13,833.77 11.23 18.10
Pineapple 4,194.99 3,893.44 3.40 3.68
Sapota 2,150.84 4,112.28 5.04 6.08
Source: Indian Horticulture Database, Govt of India, 2009
Exhibit 11: Export of Fresh Vegetables from India
Vegetables Quantity(000' Kgs) Value (in Million Rupees)
2007-08 2008-09 2007-08 2008-09
Potato 78,450.77 184,960.99 41.43 115.04
Onion 1,008,606.48 1,670,186.29 1,035.78 1,827.52
Tomato 134,845.15 124,617.22 152.91 127.66
Brinjal (Eggplant) 338.10 29.34 1.92 0.12
Cauliflower 70.85 284.60 0.02 0.16
Peas 814.64 2,519.41 2.71 7.95
Sweet Potato 346.81 879.15 0.35 0.81
Source: Indian Horticulture Database, Govt of India 2009

8/3/2019 FieldFresh_final--Yale Site Feb 2011
http://slidepdf.com/reader/full/fieldfreshfinal-yale-site-feb-2011 24/34
24 fieldfresh
Exhibit 12: Fresh Fruit Exporters by Rank, 2005
Commodities Rank 1 Rank 2 Rank 3 Rank 4 Rank 5India
Ranks
Apple China Chile France Italy USA
Banana Ecuador Costa Rica Philippines Belgium Colombia 44
Lemon Spain Mexico Argentina Turkey S. Africa 17
Other CitrusFruits/Mosambi
China India Israel Thailand Netherlands 2
Orange Spain S.Africa USA Egypt Morocco 21
Grapes Chile Italy USA S. Africa Turkey 17
Guava and Mango Mexico India Brazil Pakistan Peru 2
Papaya Mexico Malaysia Brazil Belize USA 9
Pineapple Costa Rica Philippines Belgium Cote d’Ivoire France 29
Source: Working Paper no 197, ICRIER, ‘Can Horticulture be a Success Story for India?’, Surbhi Mittal, 2007
Exhibit 13: Fresh Vegetables Exporters by Rank, 2005
Commodities Rank 1 Rank 2 Rank 3 Rank 4 Rank 5India
Ranks
Brinjal (Eggplant) Spain Jordan Mexico Netherlands China 24
Cabbage USA China Netherlands Spain Poland 48
Cauliflower Spain France China USA Mexico 42
Onion India Netherlands China USA Egypt 1
Peas Guatemala China Belgium Russia Netherlands 17
Tomato Spain Mexico Netherlands Syrian Arab Jordan 27
Potato Netherlands France Germany Belgium Canada 17
Sweet Potato USA China Israel Indonesia Egypt 35
Lettuce Spain New Zealand Mexico France Netherlands 74
Pumpkins and Gourd Spain New Zealand Mexico France Netherlands 74
Beans France USA Kenya Netherlands Spain 24
Source: Working Paper no 197, ICRIER, ‘Can Horticulture be a Success Story for India?’, Surbhi Mittal, 2007
8/3/2019 FieldFresh_final--Yale Site Feb 2011
http://slidepdf.com/reader/full/fieldfreshfinal-yale-site-feb-2011 25/34
25 fieldfresh
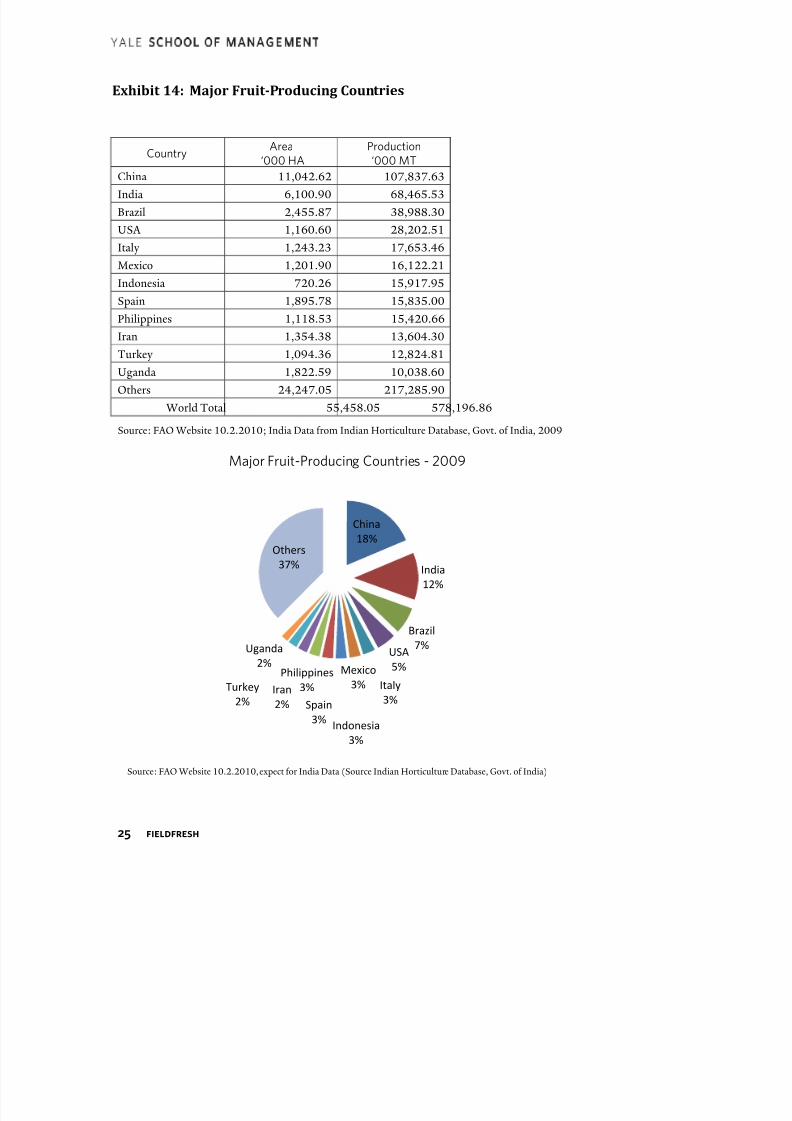
Exhibit 14: Major Fruit-Producing Countries
CountryArea
‘000 HA
Production
‘000 MT
China 11,042.62 107,837.63India 6,100.90 68,465.53
Brazil 2,455.87 38,988.30
USA 1,160.60 28,202.51
Italy 1,243.23 17,653.46
Mexico 1,201.90 16,122.21
Indonesia 720.26 15,917.95
Spain 1,895.78 15,835.00
Philippines 1,118.53 15,420.66
Iran 1,354.38 13,604.30
Turkey 1,094.36 12,824.81
Uganda 1,822.59 10,038.60
Others 24,247.05 217,285.90
World Total 55,458.05 578,196.86
Source: FAO Website 10.2.2010; India Data from Indian Horticulture Database, Govt. of India, 2009
China
18%
India
12%
Brazil
7%USA
5%
Italy
3%
Mexico
3%
Indonesia3%
Spain
3%
Philippines
3%Iran
2%
Turkey
2%
Uganda
2%
Others
37%
Major Fruit-Producing Countries - 2009
Source: FAO Website 10.2.2010, expect for India Data (Source Indian Horticulture Database, Govt. of India)
8/3/2019 FieldFresh_final--Yale Site Feb 2011
http://slidepdf.com/reader/full/fieldfreshfinal-yale-site-feb-2011 26/34
26 fieldfresh
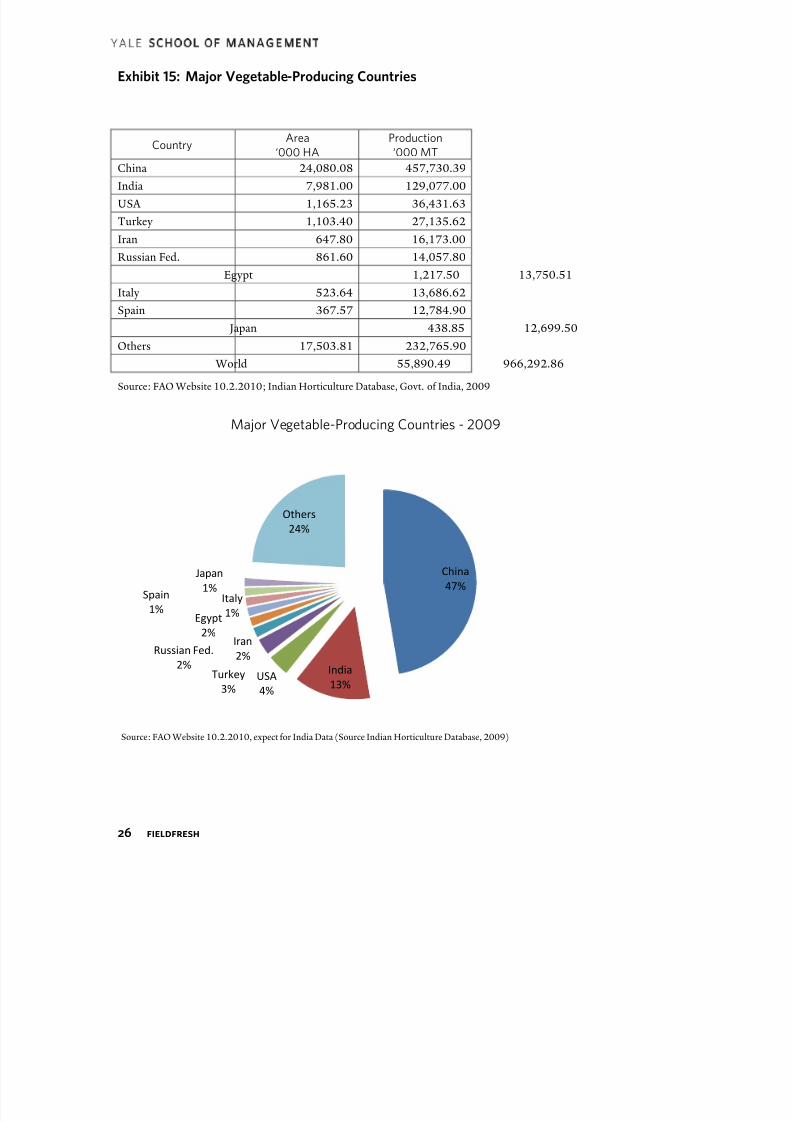
Exhibit 15: Major Vegetable-Producing Countries
CountryArea
‘000 HA
Production
‘000 MT
China 24,080.08 457,730.39
India 7,981.00 129,077.00
USA 1,165.23 36,431.63
Turkey 1,103.40 27,135.62
Iran 647.80 16,173.00
Russian Fed. 861.60 14,057.80
Egypt 1,217.50 13,750.51
Italy 523.64 13,686.62
Spain 367.57 12,784.90
Japan 438.85 12,699.50
Others 17,503.81 232,765.90
World 55,890.49 966,292.86
Source: FAO Website 10.2.2010; Indian Horticulture Database, Govt. of India, 2009
China
47%
India
13%USA
4%
Turkey
3%
Iran
2%Russian Fed.
2%
Egypt
2%
Italy
1%
Spain
1%
Japan
1%
Others
24%
Major Vegetable-Producing Countries - 2009
Source: FAO Website 10.2.2010, expect for India Data (Source Indian Horticulture Database, 2009)
8/3/2019 FieldFresh_final--Yale Site Feb 2011
http://slidepdf.com/reader/full/fieldfreshfinal-yale-site-feb-2011 27/34
8/3/2019 FieldFresh_final--Yale Site Feb 2011
http://slidepdf.com/reader/full/fieldfreshfinal-yale-site-feb-2011 28/34
28 fieldfresh
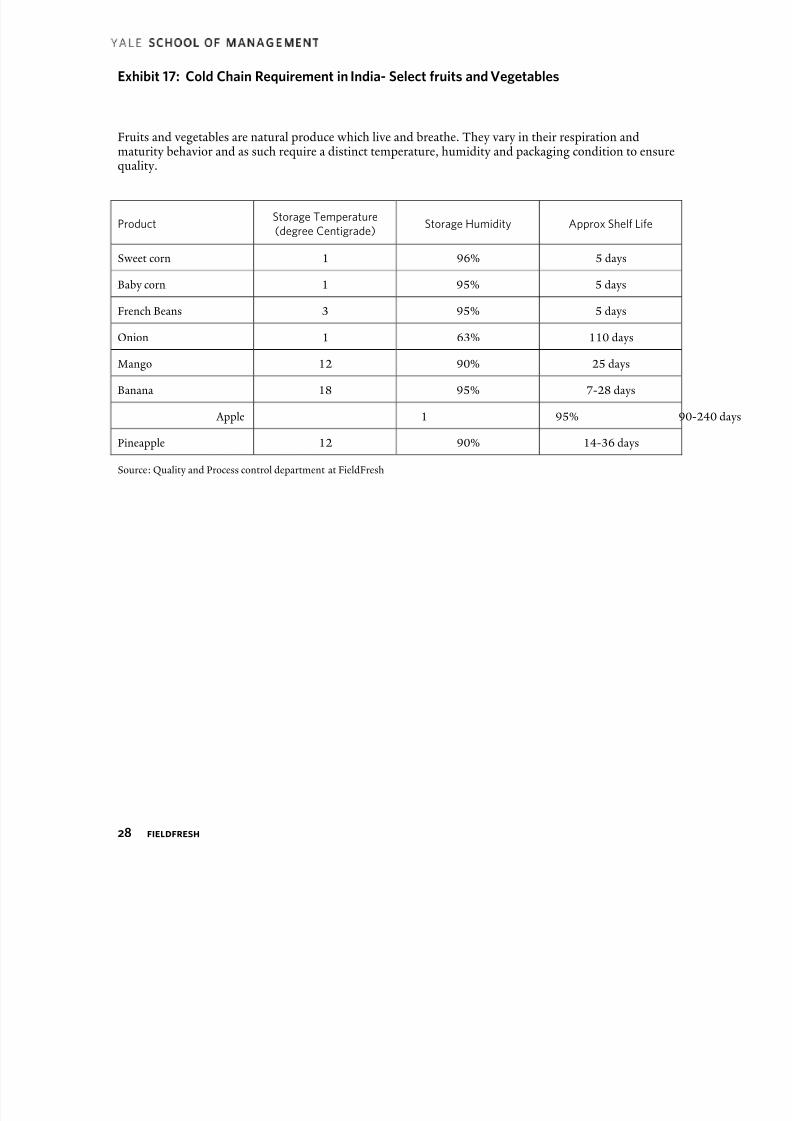
Exhibit 17: Cold Chain Requirement in India- Select fruits and Vegetables
Fruits and vegetables are natural produce which live and breathe. They vary in their respiration andmaturity behavior and as such require a distinct temperature, humidity and packaging condition to ensurequality.
ProductStorage Temperature
(degree Centigrade)Storage Humidity Approx Shelf Life
Sweet corn 1 96% 5 days
Baby corn 1 95% 5 days
French Beans 3 95% 5 days
Onion 1 63% 110 days
Mango 12 90% 25 days
Banana 18 95% 7-28 days
Apple 1 95% 90-240
Pineapple 12 90% 14-36 days
Source: Quality and Process control department at FieldFresh
8/3/2019 FieldFresh_final--Yale Site Feb 2011
http://slidepdf.com/reader/full/fieldfreshfinal-yale-site-feb-2011 29/34
29 fieldfresh
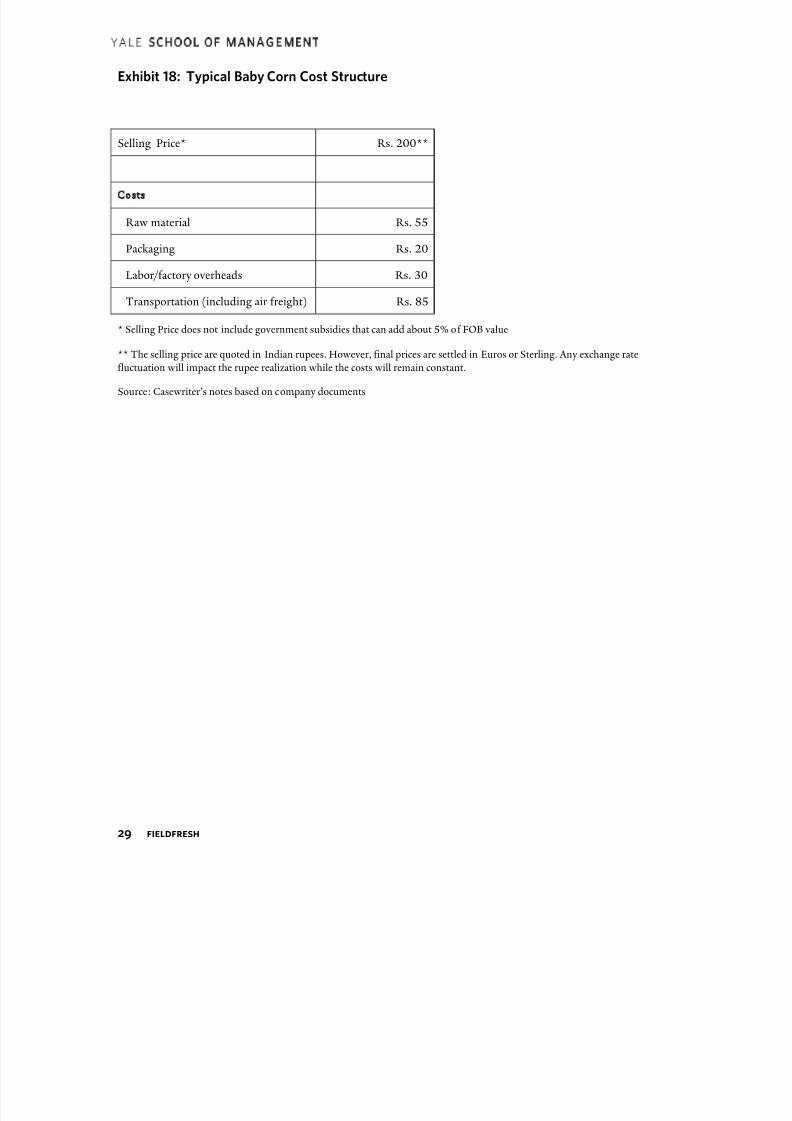
Exhibit 18: Typical Baby Corn Cost Structure
Selling Price* Rs. 200**
Costs
Raw material Rs. 55
Packaging Rs. 20
Labor/factory overheads Rs. 30
Transportation (including air freight) Rs. 85
* Selling Price does not include government subsidies that can add about 5% of FOB value
** The selling price are quoted in Indian rupees. However, final prices are settled in Euros or Sterling. Any exchange rate
fluctuation will impact the rupee realization while the costs will remain constant.
Source: Casewriter’s notes based on company documents

8/3/2019 FieldFresh_final--Yale Site Feb 2011
http://slidepdf.com/reader/full/fieldfreshfinal-yale-site-feb-2011 30/34
30 fieldfresh
Exhibit 19: Consumer Criteria for Choosing a Fresh Food Store
Source: The Fresh Imperative: Creating Excellence in Asian Fresh Food Retailing, Coca-Cola Retailing Research Council, Asia & Accenture report
8/3/2019 FieldFresh_final--Yale Site Feb 2011
http://slidepdf.com/reader/full/fieldfreshfinal-yale-site-feb-2011 31/34
31 fieldfresh
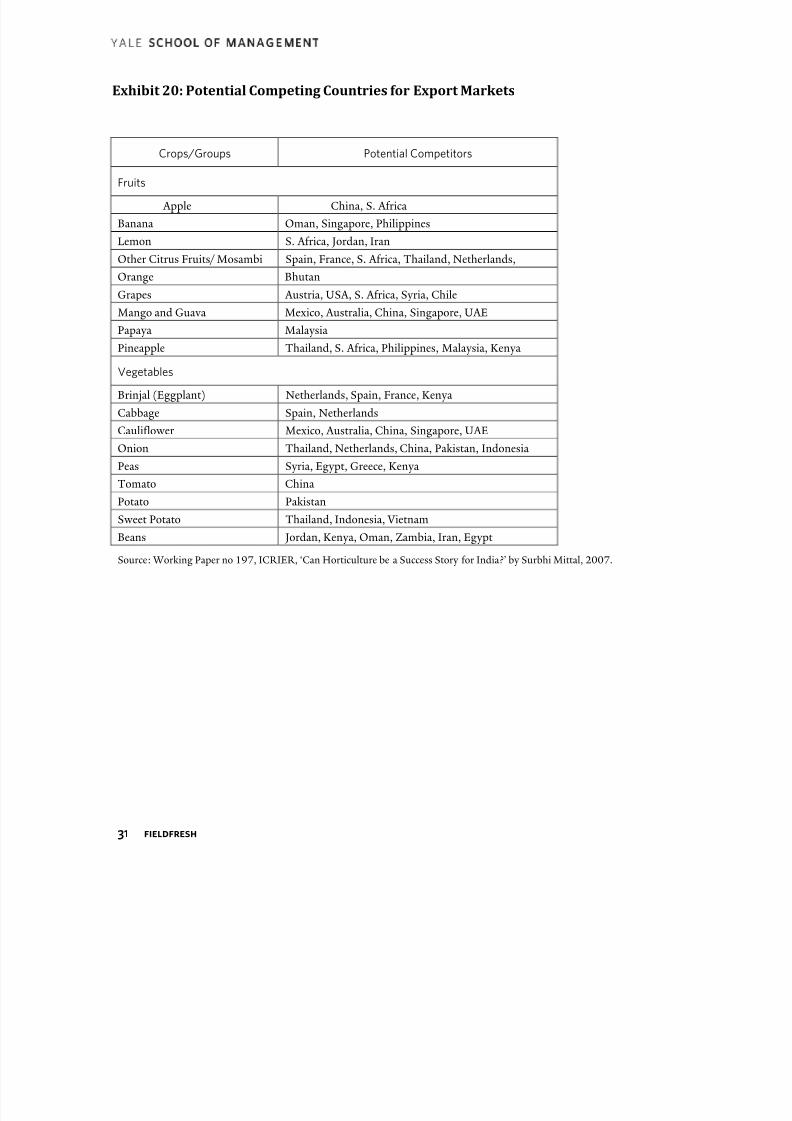
Exhibit 20: Potential Competing Countries for Export Markets
Crops/Groups Potential Competitors
Fruits
Apple China, S. Africa
Banana Oman, Singapore, Philippines
Lemon S. Africa, Jordan, Iran
Other Citrus Fruits/ Mosambi Spain, France, S. Africa, Thailand, Netherlands,
Orange Bhutan
Grapes Austria, USA, S. Africa, Syria, Chile
Mango and Guava Mexico, Australia, China, Singapore, UAE
Papaya Malaysia
Pineapple Thailand, S. Africa, Philippines, Malaysia, Kenya
Vegetables
Brinjal (Eggplant) Netherlands, Spain, France, Kenya
Cabbage Spain, Netherlands
Cauliflower Mexico, Australia, China, Singapore, UAE
Onion Thailand, Netherlands, China, Pakistan, Indonesia
Peas Syria, Egypt, Greece, Kenya
Tomato China
Potato Pakistan
Sweet Potato Thailand, Indonesia, Vietnam
Beans Jordan, Kenya, Oman, Zambia, Iran, Egypt
Source: Working Paper no 197, ICRIER, ‘Can Horticulture be a Success Story for India?’ by Surbhi Mittal, 2007.
8/3/2019 FieldFresh_final--Yale Site Feb 2011
http://slidepdf.com/reader/full/fieldfreshfinal-yale-site-feb-2011 32/34
32 fieldfresh
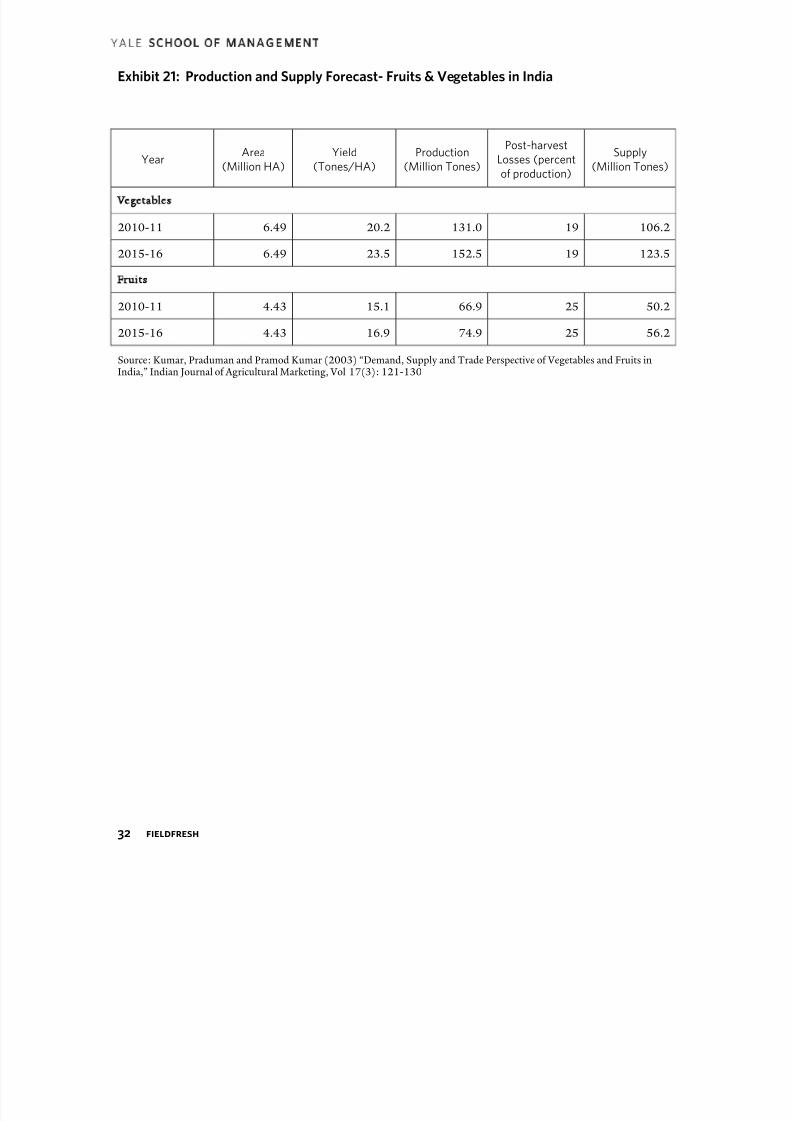
Exhibit 21: Production and Supply Forecast- Fruits & Vegetables in India
YearArea
(Million HA)
Yield
(Tones/HA)
Production
(Million Tones)
Post-harvest
Losses (percent
of production)
Supply
(Million Tones)
Vegetables
2010-11 6.49 20.2 131.0 19 106.2
2015-16 6.49 23.5 152.5 19 123.5
Fruits
2010-11 4.43 15.1 66.9 25 50.2
2015-16 4.43 16.9 74.9 25 56.2
Source: Kumar, Praduman and Pramod Kumar (2003) “Demand, Supply and Trade Perspective of Vegetables and Fruits inIndia,” Indian Journal of Agricultural Marketing, Vol 17(3): 121-130
8/3/2019 FieldFresh_final--Yale Site Feb 2011
http://slidepdf.com/reader/full/fieldfreshfinal-yale-site-feb-2011 33/34
33 fieldfresh
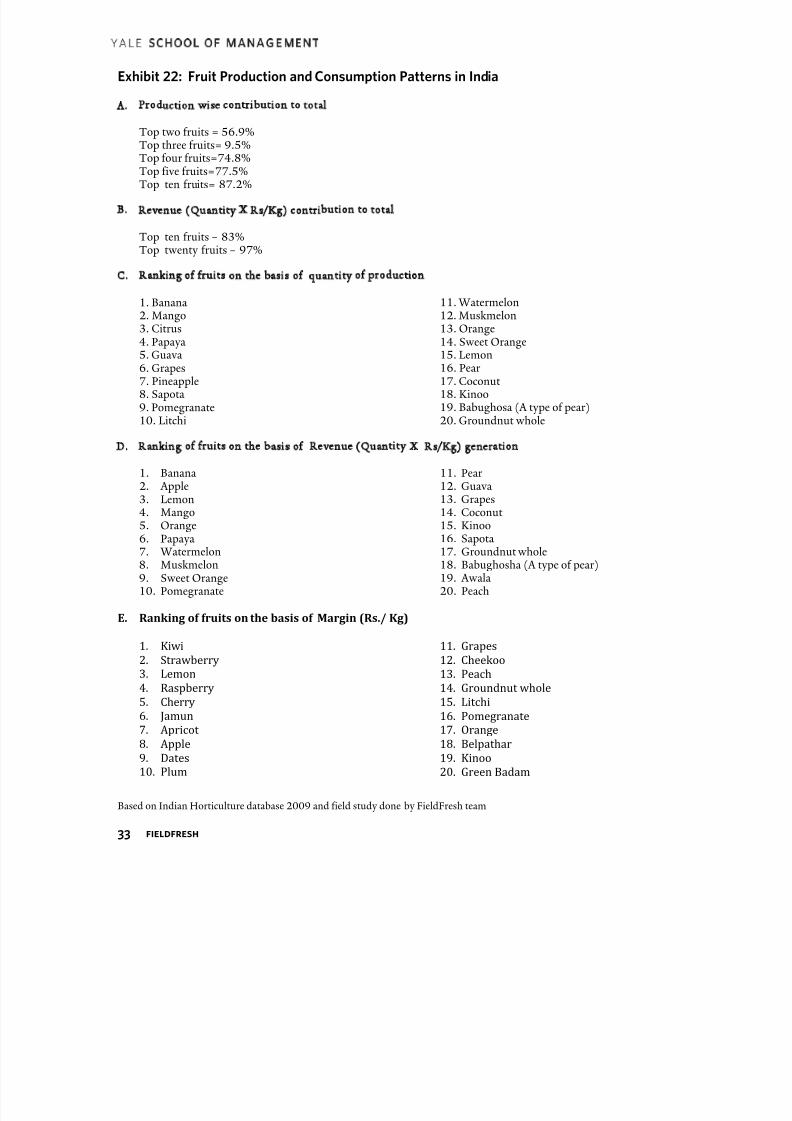
Exhibit 22: Fruit Production and Consumption Patterns in India
A. Production wise contribution to total
Top two fruits = 56.9%Top three fruits= 9.5%Top four fruits=74.8%Top five fruits=77.5%
Top ten fruits= 87.2%
B. Revenue (Quantity X Rs/Kg) contribution to total
Top ten fruits – 83%Top twenty fruits – 97%
C. Ranking of fruits on the basis of quantity of production
1. Banana2. Mango3. Citrus4. Papaya5. Guava6. Grapes7. Pineapple8. Sapota9. Pomegranate10. Litchi
11. Watermelon12. Muskmelon13. Orange14. Sweet Orange15. Lemon16. Pear17. Coconut18. Kinoo19. Babughosa (A type of pear)20. Groundnut whole
D. Ranking of fruits on the basis of Revenue (Quantity X Rs/Kg) generation
1. Banana2. Apple3. Lemon4. Mango5. Orange6. Papaya7. Watermelon8. Muskmelon9. Sweet Orange10. Pomegranate
11. Pear12. Guava13. Grapes14. Coconut15. Kinoo16. Sapota17. Groundnut whole18. Babughosha (A type of pear)19. Awala20. Peach
E. Ranking of fruits on the basis of Margin (Rs./ Kg)
1. Kiwi
2. Strawberry
3. Lemon
4. Raspberry
5. Cherry
6. Jamun
7. Apricot 8. Apple
9. Dates
10. Plum
11. Grapes
12. Cheekoo
13. Peach
14. Groundnut whole
15. Litchi
16. Pomegranate
17. Orange18. Belpathar
19. Kinoo
20. Green Badam
Based on Indian Horticulture database 2009 and field study done by FieldFresh team

8/3/2019 FieldFresh_final--Yale Site Feb 2011
http://slidepdf.com/reader/full/fieldfreshfinal-yale-site-feb-2011 34/34
34 fieldfresh
Exhibit 23: Vegetables Production and Consumption pattern in India
A. Production wise contribution to total
Top two vegetables- 37.1Top three vegetables -45.7Top four vegetables -53.7
Top five vegetables -59.0Top ten vegetables – 78.3
B. Revenue (Quantity X Rs/Kg) contribution to total
Top ten fruits – 83%Top twenty fruits – 97%
C. Ranking of vegetables on the basis of quantity of production
1. Potato2. Onion3. Tomato4. Brinjal5. Tapioca6. Cabbage7. Cauliflower8. Okra9. Peas10. Sweet Potato
11. Cucumber12. Bottle gourd13. Coriander14. Capsicum15. Tori (Smooth gourd)16. Carrot17. Ginger18. Palak 19. Garlic20. Radish
D. Ranking of vegetables on the basis of Revenue (Quantity X Rs/Kg) generation
1. Potato2. Tomato3. Onion4. Cauliflower5. Cucumber6. Brinjal7. Bootle gourd8. Coriander
9. Capsicum10. Bhindi
11. Carrot12. Ginger13. Brinjal14. Palak 15. Garlic16. Radish17. Peas18. Smooth gourd
19. F. Beans20. Arvi
E. Ranking of vegetables on the basis of Margin (Rs./ Kg)
1. Coriander2. Garlic3. Babycorn4. Mint5. Green gram peeled6. Broccoli7. Ginger8. Green Chilli9. Sprouted gram10. Sprouted moong
11. Capsicum12. Kari Leaves13. Lettuce14. Baby Pumpkin15. Beetroot16. Brinjal17. Chappan Tinda18. Ribbed gourd19. Green Onion
20. Parwal (Pointed gourd
Based on Indian Horticulture database 2009 and field study done by FieldFresh team