Field and Theoretical Aspects of Explosive Volcanic ...
232
LA-11441-T Thesis 63 ● CIC-74 REPORT COlleCtiOn ReprOdUCtiOn COPY Field and Theoretical Aspects of Explosive Volcanic Transport Processes LosAklmlm Los Alavzos National Laborafoy is operated by the University of California for fhe United Stafes Department of Energy under contract W-74M-ENG-M.
Transcript of Field and Theoretical Aspects of Explosive Volcanic ...

LA-11441-TThesis
63●
CIC-74 REPORTCOlleCtiOn
ReprOdUCtiOnCOPY
Field and Theoretical Aspects of
Explosive Volcanic Transport Processes
LosAklmlmLos Alavzos National Laborafoy is operated by the University of California for fhe United Stafes Department of Energy under contract W-74M-ENG-M.

This thesis was accepted by the Department of Geological Sciences,University of California, Santa Barbara, California, in partialfulfillment of the requirements for the degree of Doctor ofPhilosophy in Geology. It is the independent work of the authorand has not been edited by the 1S-11 Writing and Editing staff.
IThis work was supported by the Los Alamos National Laboratoyand the National Science Foundation.
An Affirmative Action/Equal Opportunity Employer
This report was prepared as an account of work sponsored by an agency of theUnited States Guvernmenl. Neither the United States Government nor any agency thewoj,nor any of their employees, makes any warranty, express or implied, or assumes any legalliability or responsibility for the accuracy, completeness, or usefulness of any information,apparatus, product, or process disclosed, or represents that its use would not infringeprivately owned rights. Reference herein to any specific commercial product, process, orservice by trade name, trademark, manufacturer, or otherwise, does not necessarily constituteor imply its endorsement, recommendation, or favoring by the United States Governmentor any agency thereof. The views and opinions of authors expressed herein do not necessarilystate or re/?’ectthose of the United States Government or any agencssthereof.
LA-11441-TThesis
UC-702Issued: December 1988
Field and Theoretical Aspects of
Explosive Volcanic Transport Processes
Gregory Allen Valentine
LosADam@sLosAlamosNationalLaboratoryLosAlamos,NewMexico87545
ABOUT THIS REPORT
This official electronic version was created by scanning the best available paper or microfiche copy of the original report at a 300 dpi resolution. Original color illustrations appear as black and white images. For additional information or comments, contact: Library Without Walls Project Los Alamos National Laboratory Research Library Los Alamos, NM 87544 Phone: (505)667-4448 E-mail: [email protected]

TABLE OF CONTENTS
INTRODUCTION. . . . . . . . . . . . . . . .
CHAPTER 1: LAYER 1 DEPOSITS OF THE PEACH SPRINGSTUFF IGNIMBRITE ...0
IntroductionGeologic Settin~ I 1 I I 1 I 1 1 I 1 1 1 1Facies and Terminology . . . . . . . . . . .Stratigraphy
KingmanAr~a” “ “ “ “ “ “ “ “ “ “ “ “LayerlaFine ash layer (FA1)Layer lbLayer IC
Regional VariationsLaboratoryData . . . . . . , . . . . . .
GranulometryComponentAnalysis
Interpretation: Initial Phases of the PeachSprings Tuff Eruption
Lower Fine Ash Layer (FAO)..0.
Layer laFine Ash Layer (FA1)Layer lbLayer ICLateral Extent of the PyroclasticSurges
Discussion . . . . . . . . . .eeo
CHAPTER 2: STRATIFIED FLOW IN PYROCLASTICSURGES . . .
Introduction . . . . . . . . . ..OOStratified Flow Parameters . . . . . . . . .Conditions for TurbulentTransport . . . . . . .Surge Bed Forms
Wavelength Va~ia~io~s “ “ “ “ “ “ “ “ “ “Migration Direction
PyroclastlcSurge Facies . . . . . . . . . .Proximal to Distal Facies ChangesFacies VariationsDue to TopographyThe Low-Aspect-RatioIgnimbriteProblem
Summary ● 0.. . . . . . .
Appendix 2A: Defi;it;on”ofNotation for Chapter 2 . .
1
5
581218181929293435383839
4853535960616162
65
6567798788909191
;;106109
v
CHAPTER 3: NUMERICALMODELS OF PLINIAN ERUPTIONCOLUMNS AND PYROCLASTICFLOWS ●
Introduction . . . . ● .Previous Modeiin~ “ “
TheoreticalApproach . . . . . . . .Governing EquationsDimensionlessParameters
General Featuresof the Numerical ExperimentsEruption Column CollapseEvolutionof Modeled EruptionColumns
Non-collapsing(plinian)Collapsingcolumn (fountain)
Implicationsfor Pyroclastic-FlowTransportand IgnimbriteFacies
PyroclasticFlowsPyroclasticflows produced by briefdischarge
●
✎
●
✎
✎
Pyroclast~cflows produced by coarse-grained eruption
Pyroclasticflows produced by lowTgm-Rim-Kperuption -
Ground Surae
Cone
Ash Cloud -Proximal Co-IgnimbriteBreccias and theDeflation Zone
PreviousworkModeling Approach and Results
usions . . . . . . . . . . . .
● 0 112
. . 112113
. . 116116127
● 0 131.140143143152
. . 155155
162
163
164165167
169169171
.0 177Appendix 3A: Definitionof Notation for Chapter 3 . .Appendix 3B: Material Propertiesand Values of
Physical ParametersUsed in Numerical Experiments. .Appendix 3C: Exit Conditionsof Model Eruptions . .Appendix 3D: Numerical Formulationand Accuracy . .Appendix 3E: Scaling of Viscous Forces andHeat Conduction . . . . . . . . . . .
Scaling of Visco;s ForcesScaling of IntraphaseHeat Conduction
183
186187189
197197199
REFERENCES
vi
201
ILIST OF FIGURESAND TABLES
Figure l-l:
Figure 1-2:
Figure 1-3:
Figure 1-4:
Figure 1-5:
Figure 1-6:
Figure 1-7:
Figure 1-8:
Figure 1-9:
Regional distributionof Peach Springs Tuffand possible correlativeunits.
Map of Peach Springs Tuff in the study area.
Generalizedvolcanic stratigraphyat Kingman.
Exposure of open-valleyfacies PeachSprings Tuff near Kingman.
Stratigraphiccolumns of Peach Springs Tuffopen-valleyand edge facies.
Stratigraphyof layer 1 and correlationwithin study area.
Photographsof layer 1 deposits near Kingman.(a) Layers la and lb(b) layer lb(c) layer IC
Wavy bed form types found in layer 1 deposits.
Undulation bed forms in layer la.
Figure 1-10: Granulometricdata from layer 1 near Kingman.
Figure 1-11: Scanning electron microphotograph of shards.
Figure 1-12: Component analysis of layer 1 near Kingman.
Figure 1-13: Relative importanceof magmatic andhydroclasticfragmentationin layer 1.
Figure 1-14: Interpretedevents at beginning of PeachSprings Tuff eruption.
Figure 2-1: Particle concentrationprofiles in turbulentpyroclasticsurges.
Figure 2-2: Brunt-Vaisalafrequencyprofiles in pyro-clastic surges.
Figure 2-3: Particle Rouse numbers for the Mount St.Helens blast.
vii
Page
7
11
15
17
21
23
252627
31
33
41
45
47
51
55
73
77
85

Figure 2-4:
Figure 2-5:
Figure 3-1:
Figure 3-2:
Figure 3-3:
Figure 3-4:
Figure 3-5:
Figure 3-6:
F
F
gure 3-7:
gure 3-8:
Figure 3-9:
Blocking in a density-stratifiedpyro-clastic surge.
Turbulenttransportmodel for depositionof low-aspect-ratioIgnimbrites.
Computationaldomain for numericalmodels.
Terminologyfor featuresof Plinian eruptions.
Numerical eruptionproducinga Plinianeruption column.
Numericaleruption producing a pyroclasticfountain and pyroclasticflows.
Criteria for collapse of eruption columnsbased upon three dimensionlessparameters.
Detailed structureof overpressurederuptioncolumn (samemodel as Figure 3-3).
Particle concentration- velocity plot forbrief discharge eruption.
Particleconcentration- velocity plot forcoarse-grainederuption.
Particle concentration- velocity plot forlow energy eruption.
-.
Figure 3-10: Particleconcentration- velocityplot foreruptionswith varying particle size.
Figure 3-11: Particle concentrationalong the ground asa functionof distance from vent for eruptionswith varying particle size.
Table l-l: Regional characteristics of layer 1 of the PeachSprings Tuff.
Table 2-1: Characteristicsof the Taupo ignimbriteandMount St. Helens blast deposit.
97
105
121
135
137
139
145
151
157
159
161
175
179
36
101
viii

ACKNOWLEDGEMENTS
Several people have provided insight and help along the way
during my graduate studies and preparationof this dissertation,but
two researchershave had the most profound influenceon my work.
The first of these is Richard V. Fisher, my main advisor, and the
other is Kenneth H. Wohletz. The influenceof these two goes deeper
than the usual “mechanical”aspects of the student-tutor
relationship. Their most important Influencehas been by setting
the example of confidence in one’s contribut~onsand of open-
mindedness. These aspects play a role in research at least as
important as methodologyand ability to communicate;they take away
much of the anxiety of scientificcompetitionand allow the
researcher to truly enjoy science. Professor Fisher has been
supportingof all of my work, both intellectuallyand In terms of
funding. Indeed, if he had not pushed for my acceptance into the
graduate program at Santa Barbara I probably would not have been
able to pursue this degree. He supportedme in questioningmany of
the current dogmas of pyroclasticgeology, and by having me as a
field assistant allowed me to learn about descriptivegeology from
one of the foremost field volcanologists. Dr. Wohletz provided me
with the environmentand tools to do some of the most sophisticated
volcanologicalmodeling that has been carried out to date. He
assisted
perspect
me with interpretationof my field work, and has kept my
ve in line during some of the inevitabletense times that
ix
graduate students experienceas fmpendinggraduationalso seems like
impending unemployment. Both of these men have treated me as an
equal and have allowed me to go where I please with my work, and,
more importantly,have become my good friends.
I also thank Fraser Goff and Steve Self for Introducingme to
volcanologywhen I was still an undergraduate. Steve McLean and
Scott Hickman of the Mechanical EngineeringDepartmentat Santa
Barbara are responsiblefor teaching fluid dynamics to me. Cathy
Busby-Speraand Frank Spera have provided suggestionsalong the way
and carefully read this dissertation. Grant Heiken helped with
scanning electron microscopework and gave assistancewith preparing
Chapter 1. Rod Whitaker and Frank Harlow have provided insight into
physical problems of high-speedfluid dynamics. Susan Kieffer and
Brad Sturtevantvisited my field area and provided insight into
fluid-dynamicalinterpretationsof pyroclasticflows. David Buesch
has been a good friend and co-workeron the studies of the Peach
Springs Tuff that are partially reported in Chapter 1. We shared so
many ideas in the field that, as he once said, it is difficult to
remember from whom the ideas originated.
My wife Mary and (duringthe last year) son Jeremy have been
sources of loving support throughoutmy graduate work. Without Mary
my perspectiveon the relationshipbetween life and career would
have been horribly out of balance. During times of faltering
confidence she has kept me on my feet. Unwinding at the end of a
hard day’s work has been greatly facilitatedby chasing Jeremy
around the house (my knees will always have carpet burns).
The work presented in Chapter 1 was partially,and that in
Chapter 3 was completely,supportedby InstitutionalSupported
Research and Developmentfunds at Los Alamos National Laboratory
(Departmentof Energy). Additional sources of funding for the work
in Chapters 1 and 2 were provided by the GeologicalSociety of
America, Sigma Xi, UCSB Graduate Division,UCSB Academic Senate
(Patent Funds), the UCSB Departmentof GeologicalSciences, and
National Science Foundationgrant EAR-16582to Fisher. Chapters 1
and 3 comprise Los Alamos UnclassifiedReports LA-UR 88-1047 and LA-
UR 88-1314, respectively.
xi

VITA
18 April 1962 -- Born -- Alva, Oklahoma
1980-1984 -- NewMexico Instituteof Mining and TechnologyB.S. - Geological Engineeringand Geology
1984 -- Graduate ResearchAssistantGeology/GeochemistryGroup, Los Alamos National Laboratory
1984-1986 -- Research AssistantDepartmentof GeologicalSciences, UniversityofCalifornia,Santa Barbara
1986-1987 -- Teaching AssistantDepartmentof GeologicalSciences, UniversityofCalifornia,Santa Barbara
1987-1988 -- Staff Research AssistantGeoanalysisGroup, Los Alamos National Laboratory
PUBLICATIONS
Valentine GA (1987)Stratified flow in pyroclasticsurges. Bulletinof Volcanology49: 616-630
Valentine GA, Fisher RV (1986)Origin of layer 1 deposits inignimbrites. Geology 14: 146-148
Buesch DC, Valentine GA (1986) Peach Springs Tuff and volcanicstratigraphyof the southern Cerbat Mountains, Kingman, Arizona.In Nielson JE, Glazner AL (eds) Cenozoic stratigraphy,structure,and mineralizationin the Mojave Desert. Geological Society ofAmerica Guidebook and Volume, Los Angeles, pp 7-14
Bower NW, Valentine GA (1986)Critical comparisonof samplepreparationmethods for major and trace element determinationsusing x-ray fluorescence. X-Ray Spectrometry15: 73-78
Valentine G (1983) Proceduresfor analysis of silicate rocks andminerals at Los Alamos National Laboratory by x-ray fluorescence.Los Alamos National LaboratoryReport LA-9663-MS
PRESENTATIONS
Valentine GA (1988) Physics of caldera eruptions. Invited seminar,Departmentof Earth Sciences, New Mexico State University,LasCruces, New Mexico
xiii

Valentine GA (1988) Bed forms in layer 1 of the Peach Springs Tuff:Transport processes during the blast phase of the eruption.Spring GeologicalSociety of American Meeting, CordilleranSection, Las Vegas
Valentine GA, Wohletz KH (1988)Significanceof exit pressure Inplinian eruptions. EOS Transactions,American GeophysicalUnion68: 1535, San Francisco
Valentine GA (1987) Layer 1 deposits in the Peach Springs Tuff,Arizona: Initial stages of a large-volumeeruption.InternationalUnion of Geodesy and Geophysics,Vancouver,Canada
Fisher RV, ValentlneGA (1987)Fractal deposits from turbulenttransport: Mount St. Helens. InternationalUnion of Geodesy andGeophysics,Vancouver,Canada
Valentine GA (1986)Turbulentboundary layers in pyroclastic flows:A possible origin of layer 1 in ignimbrites. InternationalVolcanologicalCongress,New Zealand
Fisher RV, Valentine GA (1986) Pyroclasticflows, surges, andfluidization. InternationalVolcanologicalCongress, NewZealand.
Buesch DC, Valentine GA (1986)Peach Springs Tuff and volcanicstratigraphyof the southern Cerbat Mountains, Kingman, Arizona.Spring Geological Society of America Meeting, CordilleranSection, Los Angeles
FIELDS OF STUDY
Major Field: Volcanology
Studies in TheoreticalVolcanology:Numerical Models of Plinian EruptionColumns and PyroclasticFlows. Dr. Kenneth H. Wohletz.
Stratified Flow In PyroclasticSurges.
Studies in Applicationof NonlinearDynamics:Fractal Facies and Sedimentologyof the Mount St. Helens Blast.Prof. Richard V. Fisher.
Studies in Field Volcanology:Volcanologyof the Peach Springs Tuff, Arizona. Prof. Richard V.Fisher and David C. Buesch.
Volcanologyof the 18 May 1980 Mount St. Helens Blast. Prof.Richard V. Fisher.
xiv
ABSTRACT
Field and TheoreticalAspects of Explosive VolcanicTransport Processes
by
Gregory Allen Valentine
Three separate but related studies, each utilizing a different
approach to study aspects of explosive volcanism, are presented.
Chapter 1 presents results of a study of deposits at the base of the
large-volumePeach Springs Tuff ignimbrite (referredto as layer 1).
The layer 1 deposits are interpretedto record initial blasting and
pyroclasticsurge events at the beginning of the eruption. Changes
in bedding structureswith increasingflow distance are related to
the decreasing sediment load of the surges and possibly to shocks in
the surges. Component analyses support a hydrovolcanicorigin for
some of the blasting and subsequentpyroclastic surges. The
stratigraphicsequence indicates that powerful hydrovolcanic
blasting rapidly widened the vent, thus bypassing a Plinian phase
and causing rapid evolution to a pyroclastic-flowproducing column
collapse (fountaining).
In Chapter 2 stratified flow theory is applied to pyroclastic
surges. Particle transport is assumed to be by turbulent
suspension. The discussion centers on the Rouse, Froude, and
Richardsonnumbers, and the Brunt-Vaisalafrequency. Commonly
observed variations in bed-form wavelength and surge facies are
xv
functionsof variationsof the above parameterswith distance from
vent. Blocking in stratifiedflows plays a role in producing thick,
massive deposits in topographiclows.
Chapter 3 presents results of simulationsPlinian eruption
columns based upon numerical solution of the time-dependent,two-
phase, compressibleNavier-Stokesequations. Considerationof
dimensionlessgroups defines conditionsleading to column collapse.
Collapsingfountains form pyroclasticflows that consist of low-
concentrationfronts, relativelythick heads, vortex development
along the top surfaces,and rising
presence of coarse-grainedproxima”
tephra sorting within the eruption
clouds of buoyant ash. The
deposits primarily ref’ects
column before collapse. Modeling
indicatesthat flow within a few kilometersof a vent will be at its
highest particle concentrationrelative to other parts of the flow
field.
xvi
-1-
Field and TheoreticalAspects of ExplosiveVolcanicTransport Processes
by
Gregory Allen Valentine
INTRODUCTION
Recent years have witnessed rapid advances in our knowledgeof
transport processes associatedwith explosive volcanic eruptions.
The advantagesof combining field and experimental (both laboratory
and numerical)’approacheshave been widely recognized. Deposits of
explosive eruptions representthe end product of large-scale,
natural “experiments”with poorly constrainedinitial and boundary
conditions. When studying a deposit, the goal is to constrain the
initial and boundary conditionsin terms of the known outcome (the
deposit). On the other hand, numericaland laboratoryexperiments
have very precisely known initial and boundary conditions,allowing
interpretationof transportphenomena in terms of the known
conditions. By studying both approachessimultaneously,using
insights gained from each approach to improve the physical
foundationof the other, it is hoped that an eventual common ground
will be reached and that a physically rigorous understandingof
explosive eruptions, rooted in observationsof natural systems, can
be attained.

-2-
There are many perspectivesthat make the study of explosive
volcanism worthwhile,and it is appropriateto briefly mention
these. The first perspectiveis that of magma transport theory.
Explosive eruptionsmark the final stage of transport processes that
probably begin within the earth’s mantle. These processes then
affect the crust and result in accumulationof magma reservoirsat
relatively shallow depths. Magmas within reservoirsundergo complex
dynamical processes during their residencewithin the crust, and the
geologic record preserves these processes in the form of cooled
plutonic bodies and as rapid sampling events from eruptions. The
significanceof petrologicand geochemicalvariations in pyroclastic
deposits for interpretationof magmatic processes has receivedmuch
attention. Full interpretationof these variationswill depend upon
our understandingof the fluid dynamics of eruption and deposition
of magma as well as subsurfaceprocesses. This is one of the goals
of this thesis, although the surface has only begun to be scratched.
A second perspectiveis that of basic fluid dynamics.
Explosive eruptions fall into a very complex class of fluid flows.
The flows are often turbulent. They are compressibleand can range
from far subsonic to supersonic. The flows are multiphase,with
several gas and solid species in varying concentrationsand varying
states (e.g.,water can be present as a gas and as a liquid).
Because of the multiphasenature of the flows, they are affected by
density stratification. Finally,the flows can have an extreme
range of theologicalbehaviors. The study of these eruptions

-3-
promises to advance the knowledgeof complex fluid dynamics in
importantways.
Three other importantaspects of explosive eruptions include:
(1) their role in the coupling between the solid earth and the
atmosphere, (2) their associationwith geothermal and mineral
resources, (3) volcanic hazards evaluation.
This thesis reports upon three independentbut related studies
that pertain to explosive volcanic transportprocesses. Chapter 1
describes field studies on the Peach Springs Tuff ignimbritein
western Arizona that have been carried out in conjunctionwith
related studies by David C. Buesch (U.C. Santa Barbara). The field
study centers upon the distribution,stratigraphy,and origin of
pyroclastic surge deposits at the base of the ignimbrite,and
naturally raises some questions about the transport and deposition
of pyroclastic surges. Chapter 2 addressesmany of these questions
in light of stratifiedflow theory and turbulent transport. While
the questions were initiallyraised during the Peach Springs Tuff
study, the results of Chapter 2 are applicableto pyroclastic surges
in general.
One aspect that was recognizedearly in the Peach Springs Tuff
study is the applicabilityof blast phenomena for understandingthe
beginning phases of an eruption. It is thought that initial
blasting and unsteady flow eventuallygives way to steady flow that
can produce a high-standingeruption column (leadingto a fallout
deposit) or a collapsingeruption column (leadingto pyroclastic
-4-
f10WS)O Although the Peach Springs Tuff appears to record the
initial blasting phase of the eruption and a sustainedperiod of
pyroclasticflow, it displays no evidence of ever having gone
through a fallout-producingphase. This raised the question: What
determinesthe large-scalebehaviorof an eruption during steady
discharge? Chapter 3 addressesthis broad question from the
standpointof numericalexperiments,and also deals with pyroclastic
flow facies.
Each chapter stands alone, but it is best to consider the
chapters together as a step toward the goal of having a “unified”
picture of explosive volcanicprocesses. Appendices are given at
the ends of Chapters 2 and 3, instead of together at the end of the
thesis, so that each chapter can be read separately.

i
-5-
CHAPTER 1: LAYER 1 DEPOSITS OF THE PEACH SPRINGS TUFF IGNIMBRITE
INTRODUCTION
This chapter focuses upon vertical and lateral variationsof
the basal deposits of the Miocene Peach Springs Tuff, a large-
volume, rhyolitic,welded ignirnbritethat crops out in western
Arizona and southeasternCalifornia,USA (Figure l-l). The purpose
is to provide a physical framework for theoreticalstudies (Chapters
2, 3) and to understandhow a large-volumeQ 100 km3, Smith 1979)
ignimbriteeruption evolves from initiationto sustained
pyroclastic-flowforming discharge.
The Peach Springs Tuff (PST)was or”
(1966) and Young and Brennan (1974),who
margin of the Colorado Plateau in Arizoni
outcrops to the west in the Kingman area
ginally described by Young
mapped PST on the western
and correlated it with
(Figure l-l) . Recent work
in the Mojave Desert by Glazner et al. (1986) indicatesthat
ignimbritedeposits in isolatedmountain ranges as far west as
Barstow, California,may correlatewith Peach Springs Tuff described
by Young and Brennan (1974). The areal distributionshown in Figure
1-1 was proposed by Glazner et al. (1986)on the basis of similarity
of petrographiccharacteristics,stratigraphicposition, mineral
phase chemistry, and paleomagneticpole directions. Additional
correlationwork based upon heavy mineral suites by Gusa et al.
(1987) supports the areal distributionshown in Figure 1-1.
Radiometricage dates of possible PST correlativerocks are
-6-
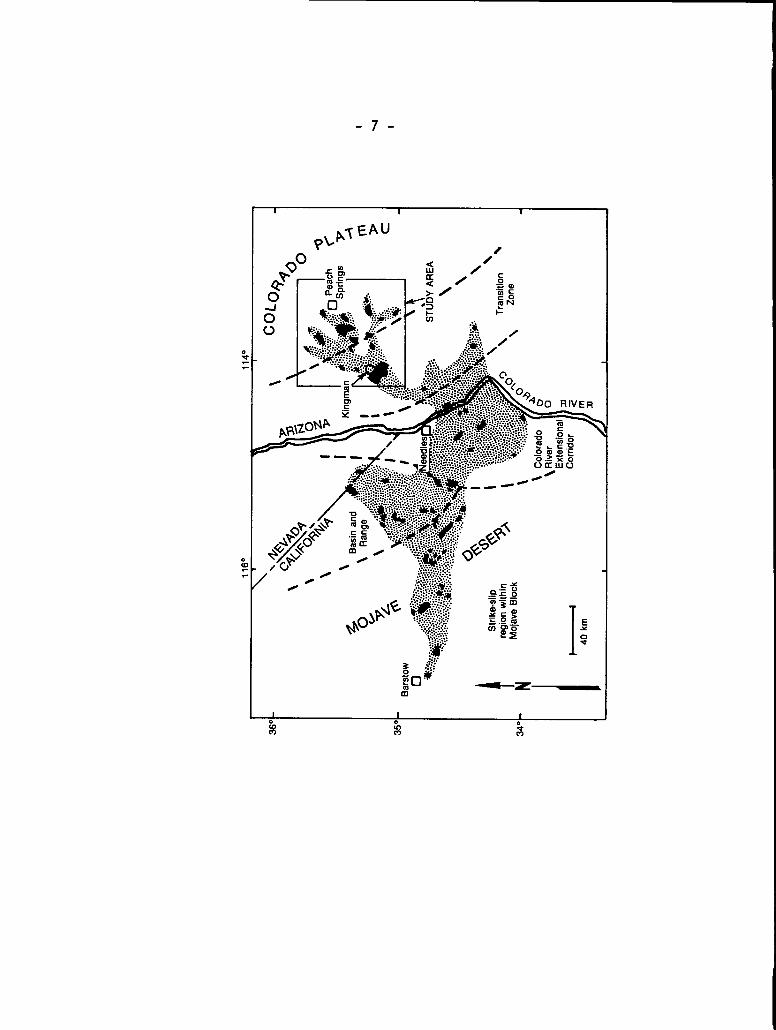
Figure l-l: Regional distributionof Peach Springs Tuff and
possible correlativeunits (modifiedfrom Glazner et al. 1986).
Present-dayexposuresare shown by the solid pattern, minimum
original extent (assumingall exposuresare Peach Springs Tuff)
is shown with stippledpatl
province boundaries,compi”
John (1987),and Young and
em. Dashed lines are tectonic
ed from Dokka (1983, 1986), Howard and
Brennan (1974). The present study
area has been focused on in order to develop a type section and
to constrain facies patterns, since this is the area where PST
was originallydescribed and where correlationis not a problem.
-7-
0,..
0u..
-8-
problematic and the scatter in ages (16-20Ma) is not currently
understood. The most likely age is about 18 million years (Glazner
et al. 1986). The volume of the ignimbriteis poorly constrained
but must have been several hundredsof cubic kilometers (Glazneret
al. 1986). A source for the tuff has not yet been determined,and
it is probably at least partiallymasked by post-eruptiontectonism
and sedimentation.
My research has been carried out in concert with other efforts
directed at studying the source locationproblem and testing
previous regional correlations. Although uncertaintiesin the
source location and age of the tuff limit a full understandingof
the eruption, its excellentexposure from top to bottom over large
distances provides an excellentopportunityto study large-volume
ignimbriteprocesses.
GEOLOGIC SETTING
The Peach Springs Tuff and its proposed correlativeexposures
extend from southeasternCaliforniaInto northwesternArizona,
covering an area of about 35,000 km2 and overlappingseveral
tectonic environments (Figurel-l). The eastern part of the PST
extent is on the tectonicallystable Colorado Plateau. The western
margin of the Colorado Plateau is bounded by a zone of normal
faulting called the TransitionZone (Youngand Brennan 1974). To
the west of the TransitionZone, rocks become highly faulted and
rotated within the Colorado River ExtensionalCorridor (Howardand

-9-
John 1987). They are only slightlytilted in the southern end of
the Basin and Range Province. Farthestwest, in the Mojave Desert,
the PST occurs in a dominantlystrike-slipregion (Dokka 1983,
1986). I limit discussion here to deposits in the TransitionZone
and the Colorado Plateau,where structuralcomplicationsand
correlationproblems are minimal, and exposure is most continuous.
Within the study area (Figures1-1 and 1-2) flow direction
indicators,welding variations,and thicknessdistributionindicate
an overall flow direction from west to east, as was also suggested
by Young and Brennan (1974). The original extent of the ignimbrite
in the study area (Figure 1-2) indicatesthat the pyroclastic surges
and flows of the Peach Springs Tuff moved through a large
paleovalleybetween the Cerbat and Hualapai Mountains (hereafter
referred to as the Kingman paleovalley),then fanned out over a
gently east-slopingterrain characterizedby broad valleys of low
relief (Young and Brennan, 1974). The valley-fillingnature of the
ignimbrite is clearly shown in Figure 1-2, with each “finger”of
ignimbrite representinga paleovalley. While most of the mountain
ranges shown in Figure 1-2 appear to have been present at eruption
time, the large amount of relief at the margin of the Colorado
Plateau was absent. The original extent within the study region
covered an area of about 1800 km2 with a minimum volume of 40 km3,
of which the layer 1 deposits comprise about one percent. The
Kingman area, in the western part of the study area, contains the
thickest and most proximal exposuresof the study area. The
- 10 -
Figure 1-2: Detailed map of Peach Springs Tuff and minimum original
extent in the study area using U.S. GeologicalSurvey 1:200,000
topographicsheets as base maps. Distributionis compiled from
Young (1966),Goff et al. (1983), and my own work. Overall flow
directionwas from west to east. The most proximal part of the
study area (near Kingman) is at least 30 km from the unknown
source of the ignimbrite.

- 11 -
3
1
3s00
30’
15.
35.
- 12 -
stratigraphic successionused in this report was developed
Kingman outcrop area, which will be used for reference.
At the time of the Peach Springs Tuff eruption, the
in the
paleovalleyswere typicallybounded by granitic and metamorphic
basement highs and, locally,Cenozoic volcanic rocks filled the
valleys. The Kingman paleovalleyfloor containedhills of granitic
basement rocks, along with basaltic cinder cones and lava flows.
These were covered by a section of silicic fallout tuffs from a
distant unknown source, an ignimbrite,and horizons of epiclastic
sandstone and soil interbeddedwith reworked tephra. The Peach
Springs Tuff lies on top of all these, and is separated from the
older tuffs by a 1-2 m thick soil horizon. Volcanic stratigraphyof
the Kingman paleovalleyis shown in Figure 1-3.
Although the exact source
located, the nearest possible
the Black Mountains (Youngand
vent for the PST has not been
source is 30 km west of Kingman in
Brennan 1974), where a possible
caldera has been identified (Thorson1971). Work in progress
suggests that another possible source area is about 90 km west of
Kingman. However, because neither of these has yet been confirmed,
I use 30 km west of Kingman as the most conservativeestimate of
distance from vent.
FACIES AND TERMINOLOGY
The Peach Springs Tuff ignimbriteis stratigraphicallydivided
into layers 1 and 2, followingthe nomenclaturalscheme of Sparks et
- 13 -
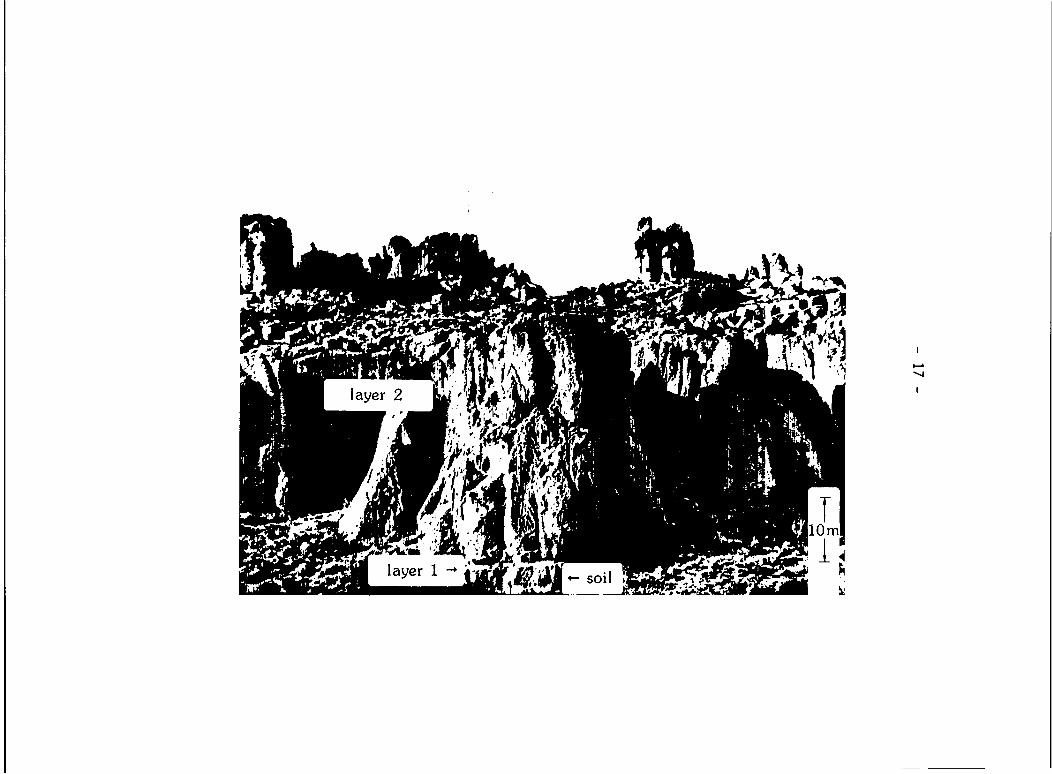
al. (1973). A typical outcrop displayingthe two main layers is
shown in Figure 1-4. Most of the layer 1 deposits represent a
series of pyroclasticsurges that immediatelypreceded the main
layer 2-producingpyroclasticflow. Layer 2 appears to be a single
pyroclastic-flowunit (Sparkset al. 1973) up to 90 m thick in the
Kingman area that forms a simple cooling unit (Smith 1960). It
thins gradually eastward in the study area to 5-10 m thickness at
the distal eastern margins.
Lateral variations in layers 1 and 2 of the ignimbriteare
divided into two facies types similar to those recognizedby Freundt
and Schmincke (1986). The first type of variation is termed
“regional,” and refers to changes due to proximal-to-distalflow
processes. The second type is termed “local” variation, and refers
to changes due to topography. Local variationsare superimposed
upon regional variations. Local variationsare further subdivided
into “open-valley”and “edge” facies. Open-valleyfacies occurs
where the ignimbritewas deposited in broad, relatively smooth-
bottomed valleys, and is the dominant facies type both areally and
volumetrically. Edge facies occurs where the tuff thins against
topographic highs on the order of 100
Layers 1 and 2 both display sign
open-valley and edge facies locations
only open-valley layer 1 deposits are
m and at valley edges.
ficant differencesbetween
(Figure 1-5). In this chapter
discussed because they seem to
represent separate eruptive phases from layer 2. Locally exposed
relicts of open-valley layer 1 at edge facies locations suggest that

- 14 -
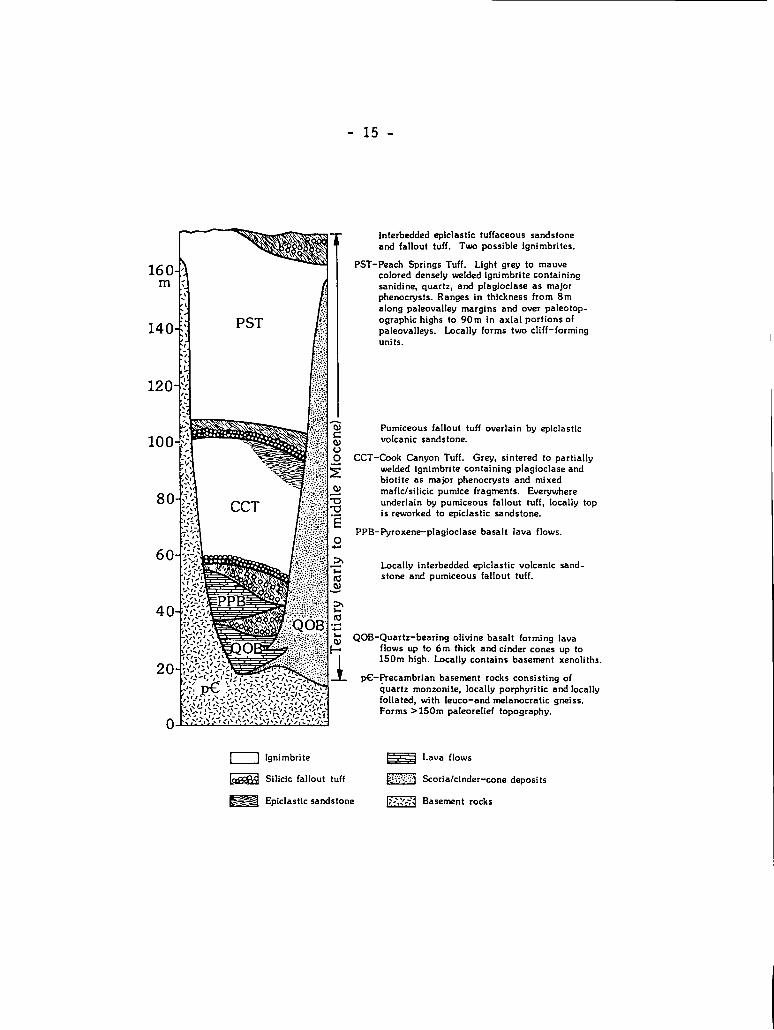
Figure 1-3: Generalizedstratigraphyof volcanic rocks in the
Kingman,Arizona, area (modifiedfrom Buesch and Valentine 1986).
For detailed stratigraphiccolumn of Peach Springs Tuff see
Figure 1-5.
- 15 -
160 THm:.’
I140 ‘;
-/\
120 :
PST
11,.:.
Interbedded epiclastic tuffaceous sandstoneand fallout tuff. Two possible ignimbrites.
PST-Peach Springs Tuff. Light grey to mauvecolored densely welded ignimbrite containingeanidine, quartz, and plagioclase as majorphenocysts. Ranga in thickness from 8malong paleovalley margins and over paleotop-ographic highs to 90m in axial portionsofpaleovalleys. locally forms two cliff-formingunits.
Pumiceous fallout tuff overlain by epiclasticvolcanic sandstone.
CCT-Cook Canyon Tuff. Grey, sintered to partiallywelded ignimbrite containing plagioclase andbiotite as major phenocrysts and mixedmafic/silicic pumice fragments. Everywhereunderlain by pumiceous fallout tuff, locally topis reworked to epiclastic aandstone.
PPB-Pyroxene-pIagioclase basalt lava flows.
Locally interbedded epiclastic volcanic sand-stone and pumiceous fallout tuff.
QOB-Quart-bearing olivine basalt forming lavaflows up to 6m thick and cinder cones up to150m high. Locally contains basement xenoliths.
p&-~ecambrian basement rocks consisting ofquartz monzonite, locally porphyritic and locallyfoliated, with leuco-and melanocratic gneiss.Forms >150m paleorelief topography.
lgnimbrite
Silicic fallout tuff WZl
Epiclastlc sandstone m
Lava flows
Scoria/cinder-cone deposits
Basement rocks

-16-
Figure 1-4: Exposure of open-valley-facies PST in the Kingman area.
Layer 1 deposits form a white layer near the base of the outcrop,
and are overlain by relativelymassive layer 2 deposits.
-17-
-18-
open-valley layer 1 deposits originallymantled the landscape,at
least within the large paleovalleys. However, the subsequent
pyroclasticflow was highly erosive at edge locationsand in most
cases completelyremoved the previous layer 1 deposits, replacing
them with edge facies layer 1 deposits. Edge facies layer 1
deposits are very similar to ground layer deposits of the Taupo
ignimbritedescribed by Walker et al. (1981a) (Figure 1-5) and are
interpretedto have formed from processesat the head of the
pyroclastic flow (Wilsonand Walker 1982) or within the main body of
the pyroclasticflow (Freundtand Schmincke 1985; Valentine and
Fisher 1986), reflectingchanges in pyroclasticflow behavior due to
topography.
No precursor Plinian fallout deposits have been found at the
base of the Peach Springs Tuff, either in the present study area or
in the Mojave Desert region. It is possible that this is due to
lack of pro;
such a wide
eruption co’
STRATIGRAPHY
Kinqman Area
imal exposure!, but the absence of Plinian fallout over
area leads me to believe that a sustained,high-standing
umn did not p“ay a significantrole in the eruption.
Generalizedstratigraphyof layer 1 deposits (open-valley
facies) in the Kingman area is illustratedin the left-hand
stratigraphiccolumn in Figure 1-6 and photographicallyin Figure
- 19 -
1-7. Layer 1 is subdividedinto three layers, la, lb, and Ic, each
of which is physicallydistinct.
Mu
Layer la near Kingman is 40-80 cm thick, most commonly close to
60 cm, and is laterallycontinuous. It is composed mainly of
pumiceous material, giving it an overall white color. In most
places, the lower half of layer la (hereinreferred to as Ial)
consists of coarse ash to fine lapilli (Figure l-10a) in very-thin
parallel beds (al1 bed-thicknessnomenclaturefollows Ingram 1954),
each bed being 1-3 cm thick. The internal structureof very-thin
beds in lal are of three basic types: normally graded, normally
graded with internal laminae, and symmetrically(reverseto normal)
graded. The basal contact of layer lal is typically planar, and
displays evidence of being slightly erosive (e.g.,chips of
underlyingpaleosoil within lowermostvery-thinbeds). Bedding is
commonly parallel to the substrate in the lowest few very-thin beds,
with small undulationsbecoming progressivelyamplified upward in
the section, both in wavelength and amplitude. Some cross bedding
occurs within the undulations,but in the Kingman area the beds are
more commonly parallel. In bed forms that do display cross bedding,
both upstream and downstreammigration of crests occur. Undulations
within the continuousbeds are produced by subtle upward-repeating
pinching or swelling and typically have rounded crests. These
features are here referred to as “undulationbed forms,” and are
shown diagrammaticallyin Figure 1-8 along with typical cross bedded
- 20 -
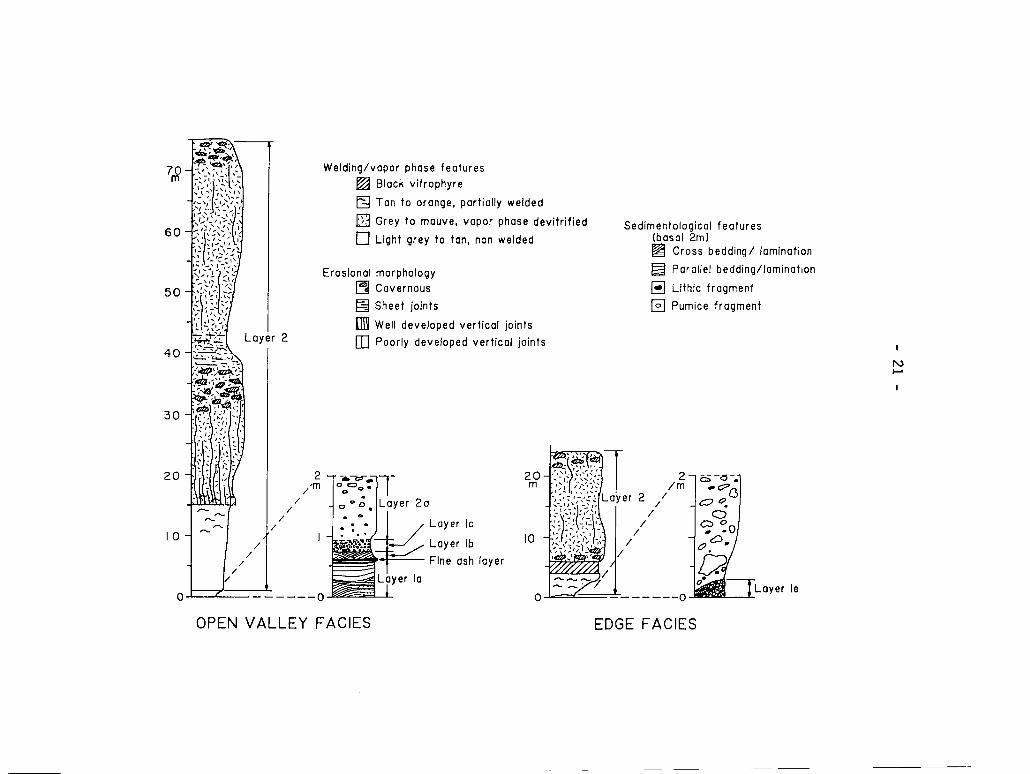
Figure 1-5: Stratigraphiccolumns of Peach Springs Tuff in the
Kingman area for open-valleyand edge facies. Features shown
layer 2 are those due to cooling and weathering effects.
Sedimentologicaldetails of the lower 2 m of the sequence are
shown for both facies types. Open-valleylayer 1 deposits are
bedded and cross bedded and consist of coarse ash to small
lapilli; they are the focus of this report. Layer le (edge
facies) occurs
discontinuous,
substrate)and
layer deposits
only in a few locations. It is a laterally
massive bed of mixed lithic (derivedfrom the
pumice lapilli that is very similar to ground
describedby Walker et al. (1981a).
for
-21
-I
:IEl❑
ElE
l-G0Ii
cd
mm
OE
L-v
o—o
NE—
o‘\
\\
/\
Lw\
%i
o\
>6Cl_
oo(D
ou-l
od-0m
0N0
0
- 22 -
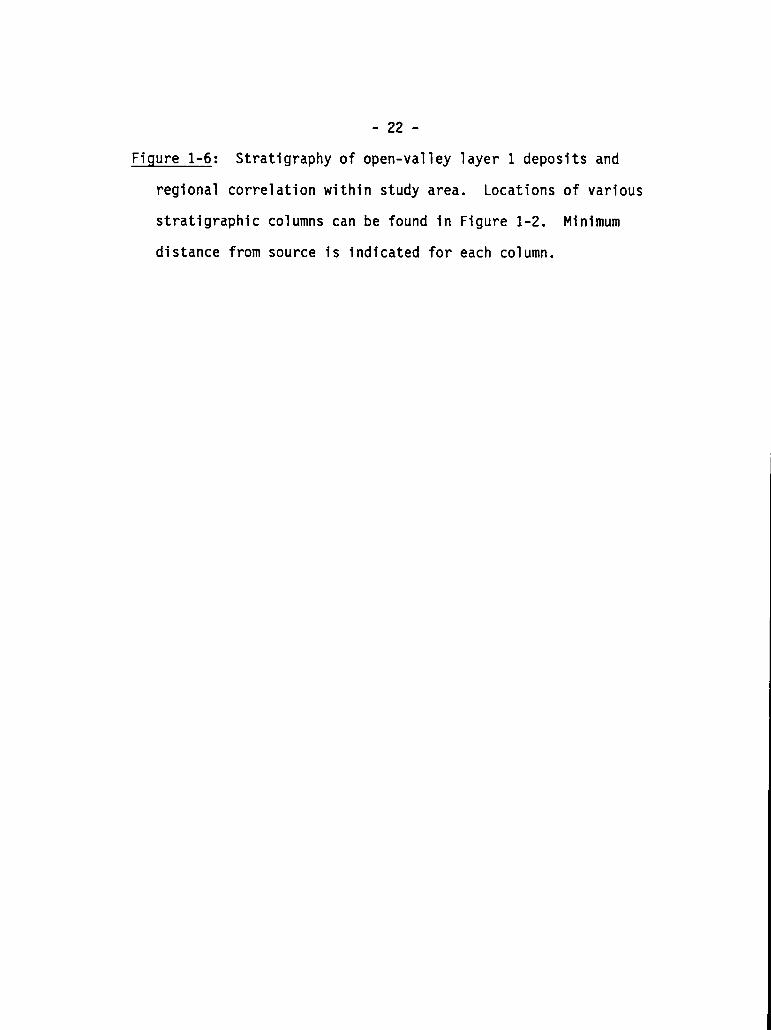
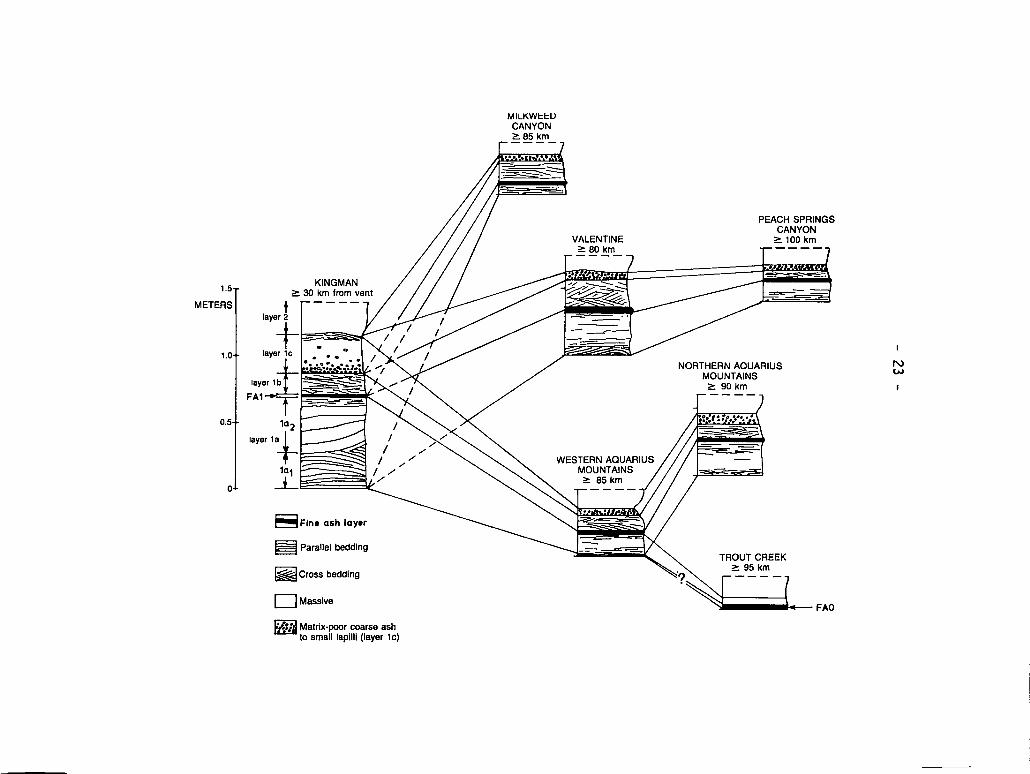
Figure 1-6: Stratigraphyof open-valleylayer 1 deposits and
regional correlationwithin study area. Locationsof various
stratigraphiccolumns can be found in Figure 1-2. Minimum
distance from source is indicatedfor each column.
-23
-

- 24 -
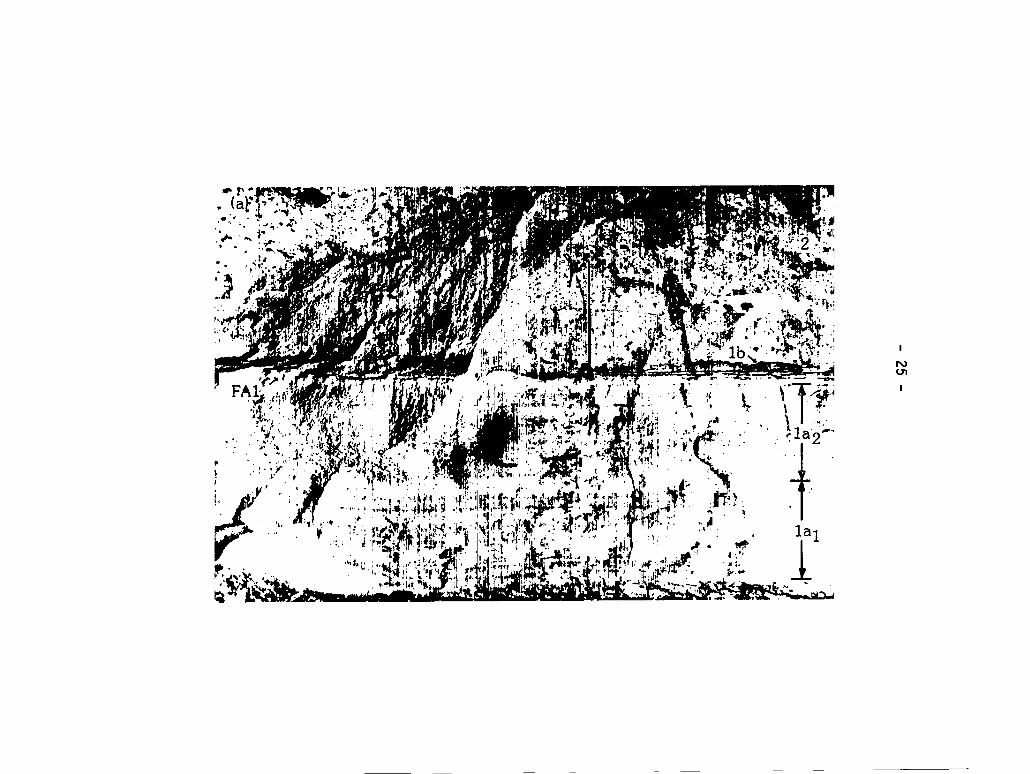
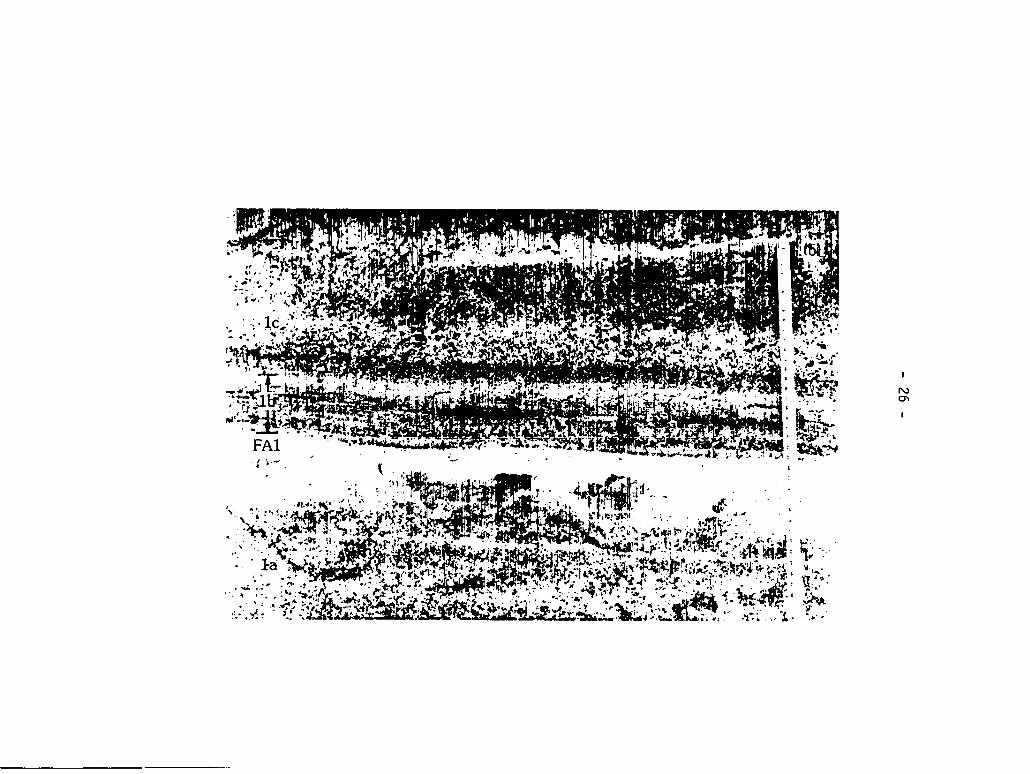
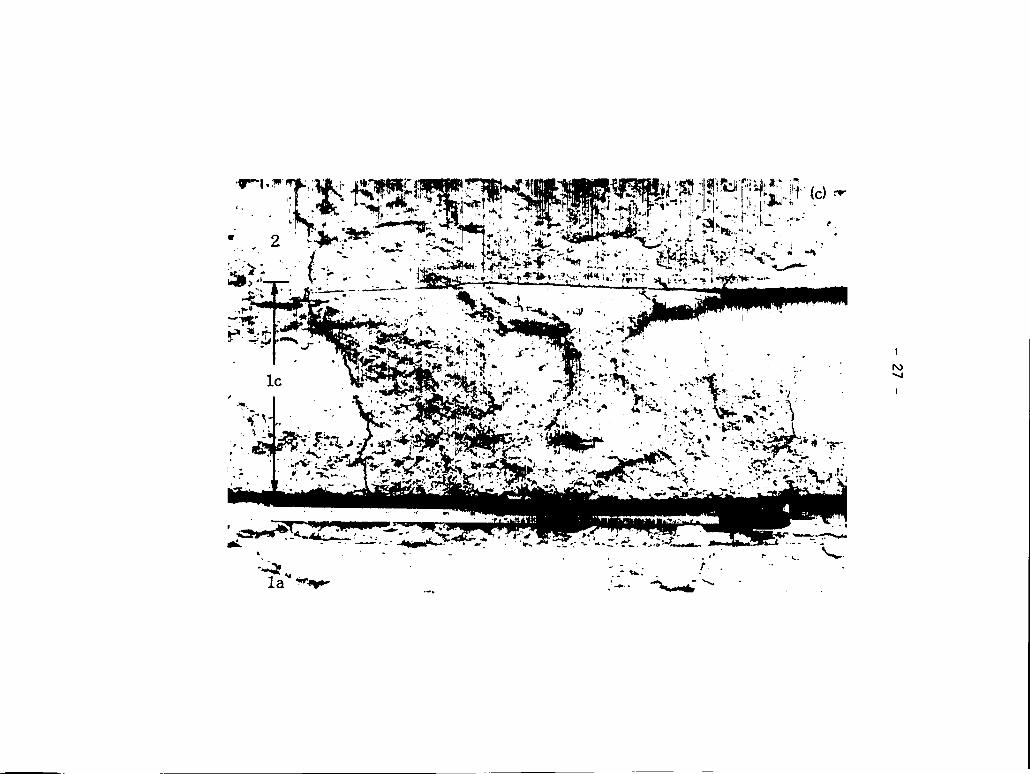
Figure 1-7: Photographsof exposuresof layer 1 deposits
Kingman area. (a) Layers la and lb, separated by the f
n the
ne ash
layer (white layer just below bottom of measuring tape). Layer
la is mainly planar-beddedhere, and its upper half is coarser
both in grain size and bedding than the lower half. Note flame
structures in the fine ash layer on the left side of the
photograph. Layer lb is only a few centimetersthick in this
exposure, and is representedby the laminatedmaterial
immediatelyabove the fine ash layer. Layer IC is absent here,
so that lb is overlain by the inverselygraded base of layer 2.
(b) Detail of layer lb. (c) Layer IC with massive, coarser-
grained base and fine-grained,bedded top.
-25
-
-26
-
-27
-
.,“!i,’).,.
t?A
.
R’
;
“,,
,>”
.,1

- 28 -
features referred to as dunes and ripples,depending upon
dimensions. Examplesof undulationbed forms in the Peach Springs
Tuff are shown in Figure 1-9. Unlike “sinusoidalripple lamination”
(Jopling and Walker 1968) these undulations are commonly isolated,
or adjacent to other undulationswith quite different dimensions.
Wavelengthsof these features are typically0.5-2.0 m.
The top half of layer la (la2) is coarser,with a higher
concentrationof lapilli compared to Ial (Figure l-10a). Bedding is
thicker than in Ial, ranging from 4-8 cm in thickness (thin beds of
Ingram 1954). These thin beds are generallymassive, but some are
reverselygraded within their lower 1 cm. ‘
thin bedding in lal to thin bedding in la2 ~
erosional surface,with the upper thin beds
he transition from very-
s commonly marked by an
cutting into the lower
very-thinbeds. This erosionalsurface does not seem to representa
time break in deposition,due to a lack of associatedfallout or
locally reworked deposits. This transitionis also characterizedby
coarseningof the deposit. In some instances,the undulationbed
forms that were progressivelyamplifiedupward in lal continue to be
amplified in la2. In other cases, bed forms within la2 bear no
obvious relationshipto those in lal. The uppermostpart of layer
la2 is characterizedby 5-8 cm thick normally graded bed containing
internal laminae and cross-laminaeat its top.
Maximum lithic (ML) and pumice (MP) diameters in layer la range
from 1.6-0.3 cm and 3.8-0.7 cm, respectively;at all layer la
exposuresMP and ML are found in the upper part of the layer (la2).

Larger values
Kingman area.
- 29 -
of ML and MP tend to occur in the western part of the
Two anomalouslylarge values of ML (5.6 and 2.7 cm)
on the leeward sides of a pre-existingcinder cone and a granitic
basement high were measured, the fragments in these cases being
locally derived from the associatedtopographichigh. There is a
gap in exposure between Kingman and the Colorado Plateau of about 30
km (Figure 1-2). To the east of this gap in exposure, layer la is
mainly coarse ash and thus is too fine-grainedfor ML and MP
measurements. Isoplethsof maximum clast diameter were not
constructeddue to lack of continuous lateral exposure, but it is
clear that the layer la deposits become finer grained
Fine Ash Layer (FAl~— —
Layer la is capped by a 1-2 cm thick layer of wh
(FA1)which forms a key horizon for regional correlat
eastward.
te fine ash
on of
stratigraphy. In the Kingman area the upper few millimetersof this
fine ash layer contain dispersed coarse-ashsized crystals and
lithic fragments. In many places FA1 forms flame structures a few
centimeters in height (Figure1-7a). These flame structuresmay
bend in many directions at a given outcrop and seem to represent
deformationdue to loading by the later-erupted,layer 2-producing
pyroclastic flow. Layer lb, directly above the fine ash layer, is
both cross-cut and deformed by the flames.
Ml!?
Layer lb overlies layer la and the fine ash layer (Figures1-6
and l-7b). It is a laterallydiscontinuouslayer up to 15 cm thick,
- 30 -
Figure 1-8: Wavy bed form types common in layer 1 of the Peach
Springs Tuff. (a) Undulationbed form, (b) low-angledune/ripple
with coarser lee-side lenses, and (c) dune/ripplewith foreset
bedding (b and c modified from Wohletz and Sheridan 1979). In
layer la undulationbed forms, which bear no obvious relationship
to substrate roughness,are common in the Kingman area. Westward
these are replaced by bed forms shown in (b) and (c), which
commonly are associatedwith substrateroughness. In layer lb
the cross bedded forms (b,c) are commonthroughout the extent.

-31-
(a)
si\isii\~\\’\\\JN\\\\\\\\\\\\\\\\\\\\\\\\~~
(b)
(c)

-32-
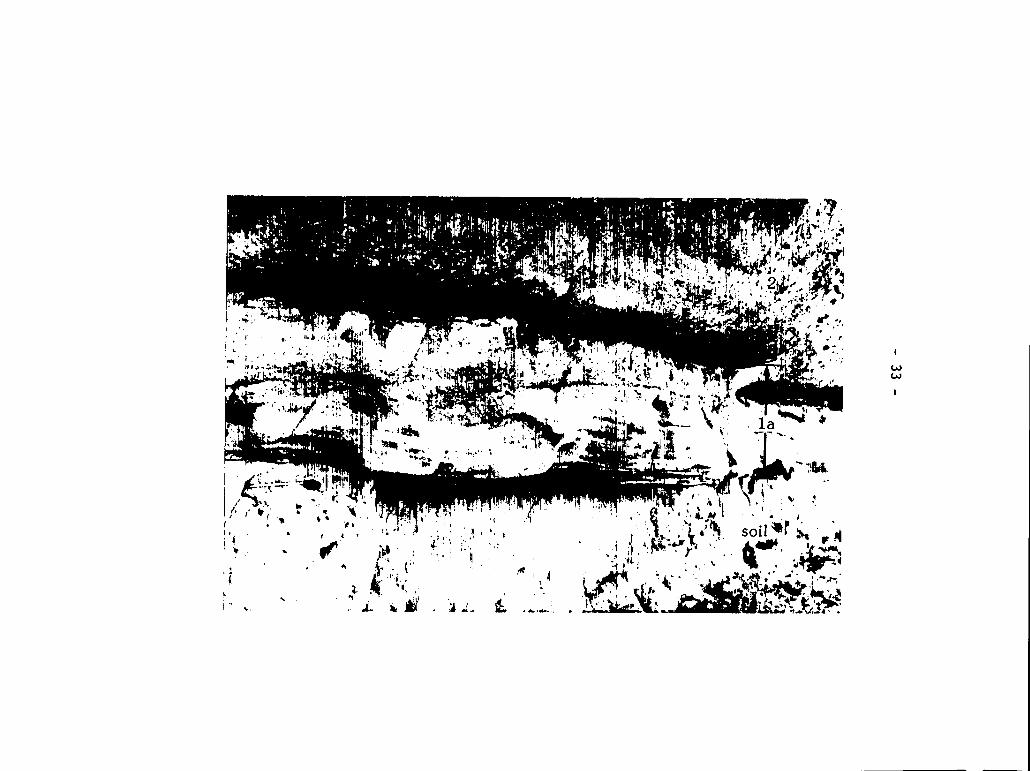
Figure 1-9: Photograph of undulation bed forms above a planar basal
contact of the layer in the Kingman area.
-33-
- 34 -
but most commonly is between 5 and 10 cm in thickness. In the
Kingman area lateral discontinuitywas caused by erosion by the
overlying pyroclastic flow in some cases, but in others the layer
was apparentlydeposited as lenses that extend 5-10 m laterally.
Layer lb consists mostly of coarse ash (Figure l-10b) in laminae to
very-thin beds of 2 cm maximum thickness. Individuallaminae are
commonly normally graded and grey to purple in color reflectinga
high concentrationof lithic fragments. A few white laminae with
high pumice concentrationalso occur.
Layer lb in the Kingman area is typicallycross bedded in low-
angle, subtle dune forms. Layering is accentuatedby lithic and
crystal-richzones that occur as small pod-shapedbodies,
representinglee-side lenses of the low angle dune forms.
Wavelengths range between about 5 and 30 cm. As in layer la, the lb
dune forms show both downstreamand upstreammigration of crests.
w%
Layer IC in the Kingman area is generallymassive, and ranges
in thickness from 5-35 cm. It consistsmainly of pumice and is
white to tan in color. The layer is typicallynormally graded with
grain sizes ranging from coarse ash to small lapi11i (Figure 1-1OC).
The base of the layer has a relativelyhigh lapilli content compared
to upper parts, and is mainly clast supported. The coarse ash
content increases upward until isolated lapilli are set in a coarse
ash matrix. In a few places the full layer IC is preserved (Figure
1-7c) but in most exposuresall but the lowest few centimetershave

- 35 -
been eroded away during transportof the overlying pyroclastic flow.
Where the full thicknessof the layer is preserved,the top 10 cm is
cross laminatedcoarse ash. The top surface of layer IC is shaped
into dunes of 2-8 m wavelengthand 20-30 cm amplitude,with a sharp
contact with the overlying layer 2. In most places incorporationof
IC into the pyroclasticflow has resulted in only the massive lower
part of the layer being preserved,with a gradational (over 2-5 cm)
contact with layer 2.
Average maximum lithic and pumice fragment diameters in layer
IC range from 1.8-0.6 and 1.7-0.7, cm, respectively,at Kingman. At
one location, two large lithic fragments (22 and 27 cm) were
observed in the middle of layer IC with no associated impact sag
structures, indicatingthat they were emplaced by flowage.
Regional Variations
The layer 1 deposits have been correlatedover distances of 70
km eastward from Kingman. Figure 1-6 shows the regional correlation
of stratigraphyfor various outcrop areas shown on Figure 1-2.
Characteristicsof layer 1 at each major outcrop area are summarized
in Table 1-1.
Layer la gradually thins and becomes finer grained with
increasingdistance from source. While features I refer to as
undulation bed forms (wavywith parallel beds) are common in the
Kingman area, to the east these are replaced by cross bedded forms
that, in most cases, are developed above irregularitieson the
substrate. As discussed above, at Kingman the transition from fine-

Table l-l:
L.,” la
b,” !8
b,w 1.
rm uL.,”
..1.,.1hwunr
191.,.1G=----z
w.CdolGwl SuOc-amad fmnu
L.1.ldLmlln.v
Slr.!q,+hn
~
1—
P.,1.dapo,,.land I..!w.,
Regional Layer 1 Characteristics.EXPOSUREAREAS
VAMNW4E PEAar SWWAGSNAD Mcxrlr42Fw AcuAfW2
KM cmmwomwl:- U21 . btokps~-z P-=----.. —Q @lIddb“ plu * 10 ‘!7$- P.-ad. b c,ou-W .oaw .* mm 2 m4.9 n! d 20 O-fl. A . mum
15.40 cmwho.tie ashP—aP!** O“alhl I.ml”.!d ●b,. ,IA,v.1.. Imoaul Got, Wlwuld alum, .Id
-* IAc m cm ~ . ~ @ =.* ---9481,*I8 ,m.gm” Ull, u.am C,.*IWmm.1 t“.. Lwmn.. ...0 IQ 8 uM
cOl-
020 ‘mL,hl ~o,LxunslzlPmrn.s mlh 10 20?4 tilhk It.omenlar%- 9“.1.( Iamm.lod 10 (101. km+ndd Oumn ●d IUMC* (k< ill cm. A .S an) Uwr..m as! nwr.um w..Lamn.. u. 0 t *.8 cm mkA
Lomu mm 2.15 m -.,.hm$m
0.1s amWUI* b I#u p.,Ce6fn 0111. ho. I#pmPlmu9c4A mm . 10% Lou IIagmmu
hum. h-l ..rau.t.a h11.tio,l ●W”*, m UFQOt23 ‘m1. “- -w COu” Uli
L..... wV! 2 1S a! ....k.glh,m..,, COl.eoa I.,.l lb Ion,..
mat. 4W la. I..dmg Suulw”..WV UP-d Jnio h,. lb
)15 cmmot.Ce+mo ●lPmau*F.* Imralmd u-d -.IT.as#” pm.. IWWOI “ml1.19 am. -ma
kwnllmls
Is cm*N 0,.,
k.mm9●u!,“nwcmua Wltl . 10X mm hqm8fAt●m, Iamm*tod. 11’asll, H*!U.patdbl .oh tat. a... Iamm.hn.
L*nlk”lml
0.4 cm1!9111g,.,Coaw.shP“!.uw,n mm . tom &w lt.Wlmll*Mu”,. mm ,,,. ‘,oss I,mnalm.
L.nl!culal
Z-boom lt,tis 1, .rd lb IFAI)
21 ‘m
Ch”<alml Crach, . .,pmul* d wWlia’.
UX2STAW6
20 2s cmWM.Cc.Dlm.“hP—L-w S cm b ph.. la k-.Il@. “w, bd4d. Id..ti.lrns .0 S cm *6.kAddk 10 c“ b ITU.-ow SIo au b rinw M“OM bddod. “Oq.uwl MC.
0.0 <mVmne 9 I.#11u.,-Anm$c.. -h < 20s bmk
IlqmmuMuln Ulh tw*mow hllATaBm
Sow-n Im,.m la d tb IFA!I
23 cm
n- liu.fvti
Vcsls.rw AalARms m..-snJrATAm.s CfwEM
1S.?0 cmWh,.C“*” dP-oouL-, S ‘m b p.nu 10 kOn@oCt-a-d, Id.bdual t-x .0 s ‘m ZikA.M* 10 cm b MUI.*.Uw s en b Pluw lo“0”. bddd, *.V Ill”w,
cOn-
O!zcrnLqhl o,.,- ●thP.w.c00”9 mm 10’20%
blka.
Lmm mm S-4 m vmkn$
09 cmWN1. b tlgm ,Im,
C.00mawlPlmumu 4* . m% hnc
kwm9nu
bnsmm law !* [FMBox 1. .nd lb IFAIIfAO.1 .2 cm. FAI.2.1 m
s cmWnlob- alFwluAwo
I
wmI
w%*MI
2UI
LAK-61C h“h d Laadl-4
I
grained at the
sharp and eros
the finer top.
and la2 is not
- 37 -
base (lal) to coarser-grainedin the middle (laz) is
onal, above which la2 gradually grades upward into
In more distal locationsthe distinctionbetween lal
as well defined, but is generally reflectedby the
occurrence of faint bedding structuresat the bottom and top of
layer la, with a massive middle. Upstreammigration of bed forms is
less common in eastern locationsthan in the Kingman area.
Regional variationsof layer lb contrast with those of layer la
in three main aspects. First, layer lb thicknessdecreasesmore
gradually with increasingdistance from source (in some places lb
thickness seems independentof flow distance). Second, it displays
well defined low-anglecross bedding of very-thinbeds to laminae
throughout its extent. Third, the grain size of layer lb remains
fairly constant everywhere,consistingalmost entirely of coarse ash
at any given outcrop. Layer lb retains its laterallydiscontinuous
and lenticularcharacter throughoutthe study area. The layer
displays a decrease in lithic fragment and crystal content and
resulting increase in pumice content along flow direction.
Eastward, layer IC tends to become lenticularand fills in
troughs between layer lb lenses. The layer also becomes thinner
overall to the east and its grain size decreases.
- 38 -
LABORATORYDATA
Granulometry
Grain size data are limitedbecause the layer 1 deposits are
indurated in many areas. Many samples taken from the Kingman area,
however, were relativelyunconsolidatedso that sieve analysis could
be performed after disaggregation. Because of incomplete
disaggregationin some samples, and artificialfragmentationin
others, I do not feel that the data are of sufficientquality for
detailed considerationof such granulometricparameters as sorting
coefficientsand skewness. Instead, I show the sieve results in
terms of weight percentagesof lapilli (> 2 mm), coarse ash (2 mmto
1/16 mm), and fine ash (< 1/16 mm) in ternary plots (Figure 1-10)
for layers la, lb, and Ic. The samples shown were collected at 14
stratigraphicsections in the Kingman area. Fragments larger than
lapilli size are rare in the deposits. The fine ash layer FA1 is
indurated at all observed exposures,thereforeno sieve data was
obtained for the layer.
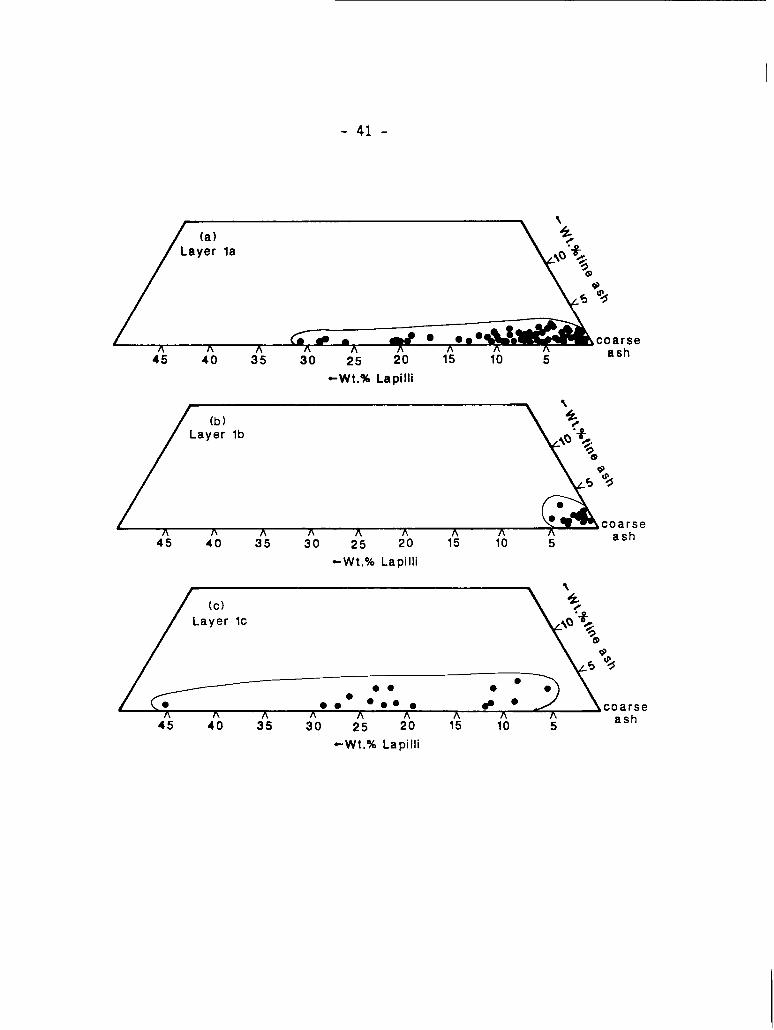
Layer la (Figure l-10a) contains very little fine ash (< 3% for
all samples). Samples from the basal part (lal) contain 88% to
99.5% coarse ash and less than 10% lapilli. Layer la2, on the other
hand, ranges up to 31% lapilli,with the fractionof lapilli
decreasing upward in the section. Layer lb (Figure l-10b) consists
of greater than 94% coarse ash, with no more than 3% fine ash and 5%
lapillio Layer IC (Figure 1-1OC) contains less than 4% fine ash,

- 39 -
but ranges from 4-45% lapilli,with coarser samples tending to occur
in the lower parts of the layer.
Eastward from Kingman the layer 1 deposits move toward the
coarse-ashvertex so that better sorted grain size distribution
occurs, reflecting improved sorting of the deposit with increasing
distance from vent. This is based on visual examinationand sieve
data from two locationson the Colorado Plateau.
Component Analysts
The 0.25 mm grain-size fractionsof samples from the Kingman
area were point counted using an optical microscope. Components
were divided into four categories: crystals, lithic fragments,
shards produced by magmatic fragmentation,and shards produced by
hydroclastic (magma-waterinteraction)processes. Criteria for
distinguishingbetween shard types are discussed below. 109 samples
were analyzed, with 500-600 grains counted on each sample. It is
thought that this approach al’
in the compositionof materia’
analogous study of a basaltic
ows one to study relative variations
produced at the vent(s). An
eruption which addresses stages of
magma degassing and magma-water interactionis that of Houghton and
Schmincke (1986).
The 0.25 mm size fractionwas chosen for analysis because all
of the clast types occur at that size. For example, larger size
fractionsmay not contain any hydroclasticshards, while smaller
fractions may not contain many crystals.
- 40 -
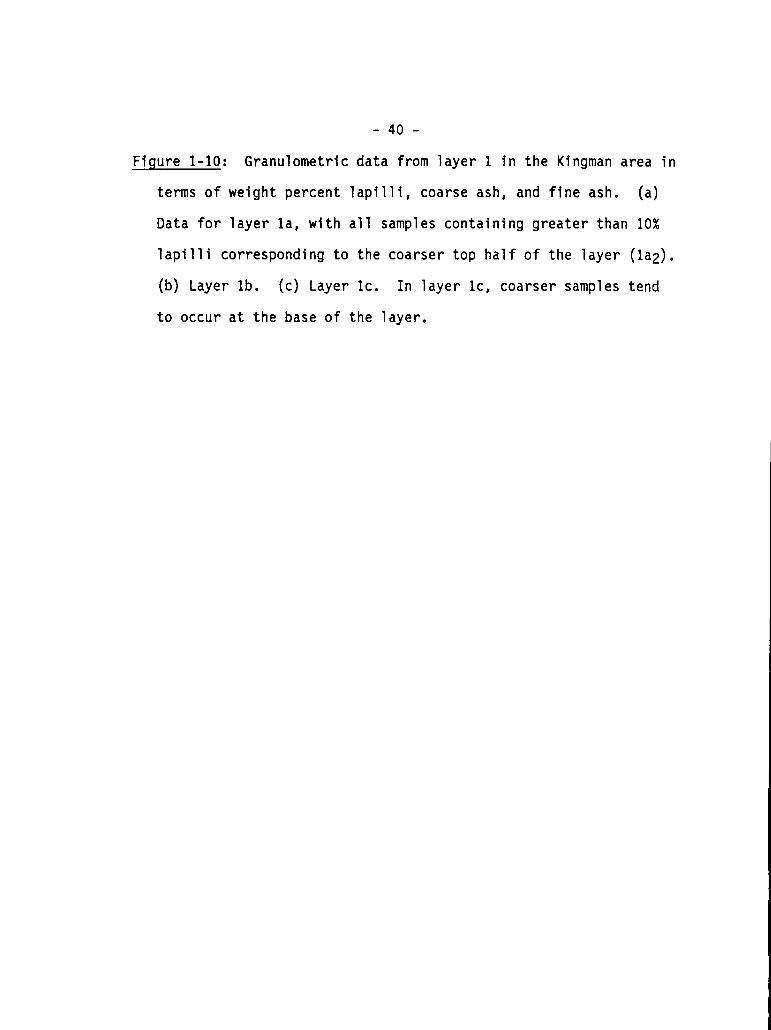
Figure 1-10: Granulometricdata from layer 1 in the Kingman area in
terms of weight percent lapilli,coarse ash, and fine ash. (a)
Data for layer la, with all samples containinggreater than 10%
lapil1i correspondingto the coarser top half of the layer (la2).
(b) Layer lb. (c) Layer Ic. In layer Ic, coarser samples tend
to occur at the base of the layer.
- 41 -
n n A45 40 35 30 25 20 15 10 5
-Wt.% LapiIli
n45 40 35 30 25 20 15 10 5
-Wt,OALapiIli
n n n45 40 35 30 25 20 15 10 5
-Wt.% LapiIli
- 42 -
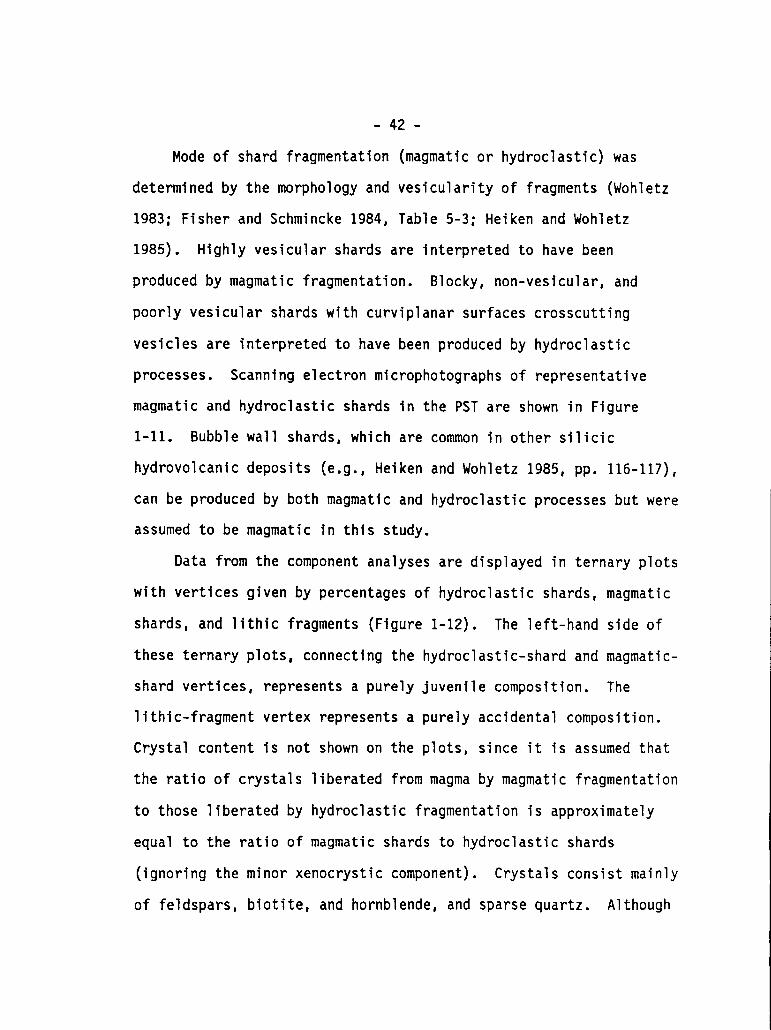
Mode of shard fragmentation(magmaticor hydroclastic)was
determined by the morphology and vesicularityof fragments (Wohletz
1983; Fisher and Schmincke 1984, Table 5-3; Heiken and Wohletz
1985). Highly vesicular shards are interpretedto have been
produced by magmatic fragmentation. Blocky, non-vesicular,and
poorly vesicular shards with curviplanarsurfaces crosscutting
vesicles are interpretedto have been produced by hydroclastic
processes. Scanning electronmicrophotograph of representative
magmatic and hydroclasticshards in the PST are shown in Figure
1-11. Bubble wall shards, which are common in other silicic
hydrovolcanicdeposits (e.g.,Heiken and Wohletz 1985, pp. 116-117),
can be produced by both magmatic and hydroclasticprocesses but were
assumed to be magmatic in this study.
Data from the componentanalyses are displayed in ternary plots
with vertices given by percentagesof hydroclasticshards, magmatic
shards, and lithic fragments (Figure1-12). The left-hand side of
these ternary plots, connectingthe hydroclastic-shardand magmatic-
shard vertices, representsa purely juvenile composition. The
lithic-fragmentvertex representsa purely accidentalcomposition.
Crystal content is not shown on the plots, since it is assumed that
the ratio of crystals liberatedfrom magma by magmatic fragmentation
to those liberatedby hydroclasticfragmentationis approximately
equal to the ratio of magmatic shards to hydroclasticshards
(ignoringthe minor xenocrysticcomponent). Crystals consist mainly
of feldspars,biotite, and hornblende,and sparse quartz. Although
I
-43-
Identificationof rock types is difficult at 0.25 mm, it appears
that lithic fragments are mainly volcanic.
Results for layer la are shown in Figure l-12a. The plot shows
that juvenile particles produced by magmatic fragmentationdominated
the beginning of the eruptive event. The transitionto coarser
material upward (layer la2) is reflectedby a sudden increase in
concentrationof hydroclasticshards and accidental lithic
fragments. The top of layer la records a gradual return to juvenile
clasts produced by magmatic fragmentation.
Layer lb (Figure l-12b) has a relativelyhigh content of
hydroclasticshards. It also is bimodal in terms of content of
juvenile material. Most of the samples are quite high in lithic
fragment content (35-60%),which produces the dominantly grey
coloring of the deposit in the field. However, a few samples of
locally exposed white beds retain the same range of hydroclastic
shard concentrationas the grey layers, but are mainly juvenile with
only 6-12% lithic fragments. Thus layer lb reflects a strong
hydroclasticblasting event, where most of the material is
accidental and is shattereddown to coarse-ash size with occasional
juvenile-component-richpulses during the event.
Layer IC samples, plotted in Figure 1-12c, also have a
relatively high hydroclasticcomponent. They are, however, mainly
juvenile material.
Layer 2, the main pyroclasticflow deposit, examined in thin
section, contains sparse hydroclasticshards. These may have been

- 44 -
Figure 1-11: Scanning electronmicrophotograph of shards from
layer 1 (0.25mm sieve fraction). Scale bar is 100 microns (0.1
mm). (a) Typical highly vesicular shard produced by magmatic
fragmentationprocesses. (b) Poorly vesicular shard produced by
hydroclasticprocesses. Note curviplanarsurface cross cutting a
vesicle and conchoidalfracture surface in (b).

-45
-
- 46 -
Figure 1-12: Ternary diagrams of percentageof hydroclasticshards,
magmatic shards, and llthic fragments in the 0.25 mm sieve
fraction. Samples that plot close to the left-handside of the
diagrams (connectinghydroclasticand magmatic vertices) have a
dominantlyjuvenile composition,while samples near the lithic-
fragment vertex are dominantlyaccidentalin composition. The
dashed line correspondsto 50% magmatic shards, and separatesthe
diagrams into two fields representingdominantlymagmatic
fragmentation(M) and hydroclasticfragmentation(H), assuming
that a high lithic content indicateshydrovolcanicactivity. (a)
Data for layer la (with subdivisionslal and la2). Points
plotting near the M-H boundary are from the lower part of la2.
(b) Data for layer lb, showing bimodal compositionwhich mainly
reflects bimodal lithic content. (c) Layer Ic.

-47
-
\I

- 48 -
incorporatedfrom the underlyinglayer 1 deposits. It appears that
fragmentationduring the “steady”pyroclasticflow phase was mostly
or entirely due to magmatic processes. Figure 1-13 qualitatively
shows the relative variationsin contributionsof hydroclasticand
magmatic fragmentationrecordedat various levels in the layer 1
sequence.
INTERPRETATION: INITIAL PHASES OF THE PEACH SPRINGS TUFF ERUPTION
Field characteristicsof layer 1 deposits in the Peach Springs
Tuff indicate that they were depositedby pyroclasticsurges. Layer
1 almost everywheredisplays wavy bedding (withor without cross
bedding). In the eastern exposures,cross bedding is commonly
associatedwith visible substrateroughnesselements such as rocks
jutting above the paleosoil, and is especiallywell developed on the
east-facing (lee) sides of these roughnesselements. Reverse to
normally graded beds also suggest lateralmovement of clasts in a
thin traction carpet. These featuresare typical of pyroclastic
surge deposits and indicate lateral transport instead of deposition
by fallout (Moore 1967; Fisher and Waters 1970; Waters and Fisher
1971; Schmincke et al. 1973; Crowe and Fisher 1973; Sparks and
Walker 1973; Wohletz and Sheridan 1979; Walker 1984; Sigurdssonet
al. 1987). Origin as pyroclasticflows is not supportedbecause
layer 1 is well-sortedrelativeto layer 2 and because it is not
significantlyponded in topographiclows (Wrightet al. 1980).
The low-anglenature of cross bedding and absence of
accretionarylapilli in the layer 1 deposits suggests that they were
- 49 -
emplaced by “dry” pyroclasticsurges (Heikenand Wohletz 1985).
The fine ash layer found beneath layer la in the southeast
(FAO) and that found between layers la and lb (FA1),are both
interpretedas fallout layers because they are generallymassive on
a small scale and are relativelywell-sorted. FA1 may represent
fallout of fine material winnowed from the layer la pyroclastic
surge and is regarded as a “co-surge”fallout. This interpretation
is supportedby its lateral continuityand by the fact that it does
not thin away from the vent. In a gross sense FA1is similar to the
ash layer that occurs on top of the 18 May 1980 blast deposit at
Mount St. Helens (Fisheret al. 1987). Based on the chronology of
that eruption (Criswell1987) I estimate that the minimum time for
accumulationof FA1 was on the order of one hour.
Several ideas on the origin of pyroclasticsurge deposits at
the base of ignimbrites (i.e.ground surges; Sparks et al. 1973)
have been sugge!
out for open-va’
accumulationof
of an hour betw[
ted, and all but one of these models can be ruled
ley layer 1 deposits for two main reasons: (1)
the fine ash layer records a time break on the order
en periods of lateral transport,and (2) shard types
in layer 1 differ from those in layer 2. These two observations
rule out any model based on processesdirectly associatedwith the
moving pyroclastic flow, such as explosivejetting (Wilson and
Walker 1982) and turbulentboundary layers (Valentineand Fisher
1986). Although less strongly,the layer 1 compositionaldata do
- 50 -
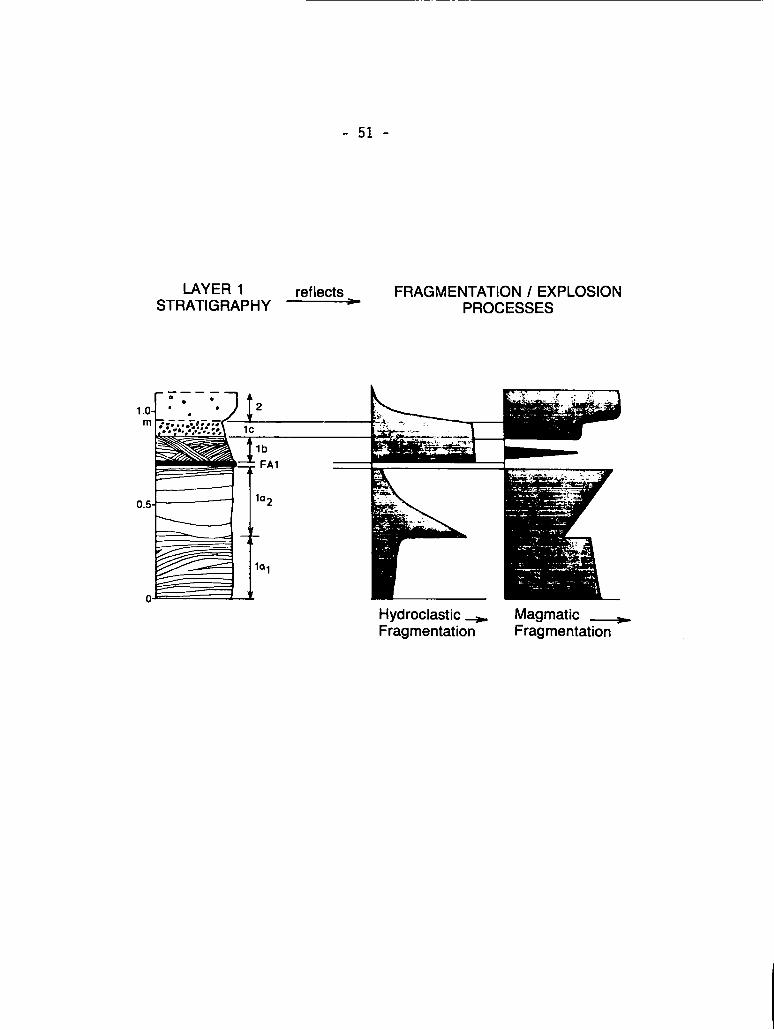
Figure 1-13: Diagrammaticrepresentationof the relative importance
of magmatic and hydroclasticfragmentationprocesses during the
eruption as recordedby the deposits. Layer lal records an
initial phase of dominantlymagmatic fragmentation. la2
representsa brief pulse of hydroclasticfragmentationfollowed
by a return to magmatic fragmentation. FA1 records a break in
eruptive activity,which is followedby highly hydroclasticlayer
lb. Layer lb records some brief pulses of magmatic fragmentation
as indicatedby its bimodal composition (Figure l-12b). Layer IC
records a return to magmatic fragmentationthat eventually leads
to the main layer-2 forming phase of the eruption.
- 51 -
LAYER 1 reflects= FRAGMENTATION /EXPLOSIONSTRATIGRAPHY PROCESSES
Hydroclastic- Magmatic ~Fragmentation Fragmentation

-52-
not support an origin of the surges by initial collapse of the
eruption column (Fisher 1979).
The most likely origin for these surge deposits is from initial
blast phases of the ignimbriteeruption. The significanceof blast
phenomena in explosive volcanismhas recentlybeen emphasizedby
Kieffer (1981),who found that observationsof the initial phase of
the 18 May 1980 eruption of Mount St. Helens could be explained in
terms of overpressuredjet dynamics. More recently,Wohletz et al.
(1984)numerically simulatedthe initial stages of large-volume
eruptions,where a dike of volatile-richmagma is catastrophically
exposed to atmosphericpressure. The result of this process is a
phase of highly unsteady flow, with expansion (rarefaction)waves
propagatingdown the conduit and shock waves propagating into the
atmosphereand along the ground. During this phase of an eruption,
pyroclasticsurges within a few tens of kilometersof the vent are
driven largely by shocks and are characterizedby pulsing, unsteady
flow. This “blast phase” is followedeventuallyby relatively
steady discharge,which is thought to produce pyroclastic flows.
The blasting phase of an eruptionmay have any number of pauses that
last for periods of up to weeks or months, thus solving the problem
of the time break for fine ash fallout. Blasting may be caused by
either purely magmatic or hydromagmaticprocesses (or any
combinationof the two) and thus may produce different shard types
than later phases of the eruption, so that the compositional
differencesbetween layer 1 and layer 2 can be explained.

- 53 -
By combining field data, component analysis,numerical
modeling, and ideas on magma-waterinteraction (Wohletz1986) a
sequence of eruption and emplacementevents correspondingto the
layer 1 deposits can be inferred. It is importantto keep in mind
that, because of the lack of knowledgeabout the source of the PST,
the interpretationsbelow may be only part of a much more complex
sequence of events.
Lower Fine Ash Layer (FAO)— —.
The lower fine ash layer, which occurs only in the southeastern
part of the study area, probably representsthe distal fallout from
a weak precursor blast event. This event may have been associated
with initial stages of magma ascent in a dike (Figure l-14a), the
geometry of which is unconstrained. The fact that FAO is only found
in the southeastpart of the area is probably a result of a
northwest-to-southeastwind at the time of the event.
W&
When the dike was relativelyclose to the surface, its
overburden burst open, allowing rapid decompressionof the magma and
blasting phenomena such as those modeled by Wohletz et al. (1984)
(Figure l-14b). Vesiculationproduced shards with characteristics
of magmatic fragmentation,and the erupted material was mainly
juvenile. Layer la surges moved across the landscape to produce the
most widespread and continuousof the surge deposits. Many of the
features of layer la parallel trends of the 1982 El Chichon surge
deposits described by Sigurdssonet al. (1987). The reverse-to-

- 54 -
Figure 1-14: Interpretedevents at the beginningof the Peach
Springs Tuff eruption that produced the observed layer 1
sequence. Initiallymagma (shaded)moved to the surface,
probably as a dike (a). The overburdenof the dike eventually
failed, leading to rapid decompressionand vesiculation,and
resultingblasting phenomena to produce layer la (b). As the
blasting progressed,the vent walls (dottedpattern) failed and
collapsed (c), plugging the vent and producing a period of
relative quiescenceduring which the fine-ash layer FA1 was
deposited. During this period of quiescence,magma interacted
wtth ground water, eventuallyleading to lithic-rich,
hydrovolcanicblasts and depositionof layer lb (d). As the vent
was cleared, eruptingmaterial became dominantlyjuvenile in
compositionduring the final phase of blasting (e), which led
directly to the long period of steady discharge that produced
layer 2 (f). Detailed discussionin text.

-55
-
-a/
I
/.:
..
,
.....
...
G
norma’
power
- 56 -
grading of the overall layer reflects an increase in flow
with time, in this case rather abruptly as demonstratedby the
erosional surface between Ial and la2 with its lack of fallout or
locally-reworkedtephra deposits. The increaseof flow power
correspondsto an increase in magma-waterinteraction(Figure 1-13).
This was followed by a decrease in magma-waterinteractionas the
layer la surge event waned. With increasingflow distance the
internal stratificationof layer la is progressivelyless well
defined. This appears to result from improvedsorting with flow
distance -- as the tephra becomes almost entirely coarse ash there
is less textural distinctionbetween beds. In addition, this trend
may result from a gradual transitionfrom sandwave to massive facies
(Wohletzand Sheridan 1979) due to stratifiedflow effects (Chapter
2; Valentine 1987). The change from upstream to downstream
migration of bed forms may reflect a graduallydecreasing Froude
number (definedfor continuouslystratifiedflow as in Chapter 2)
with distance. Internalstructuresof individualbeds, such as
symmetric and normal grading, can be explained in terms of high-
concentrationbed loads where particle size sorting is relatively
poor (comparedto eolian sands, for example) and where grain-
dispersiveprocesses occur. This has been discussed in detail by
Sigurdssonet al. (1987) in their study of pyroclasticsurges from
the 1982 El Chichon eruption.
An interestingfeature of layer la is the proximal-to-distal
change in bed form character from “undulationbed forms” (Figures1-
- 57 -
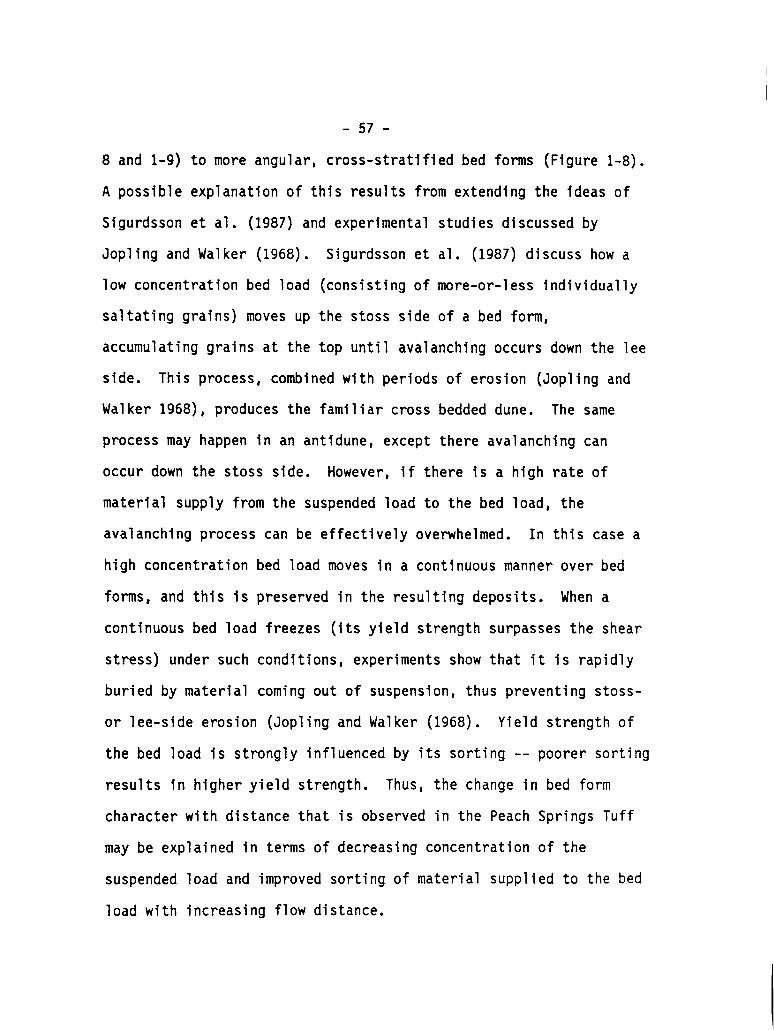
8 and 1-9) to more angular, cross-stratifiedbed forms (Figure 1-8).
A possible explanationof this results from extending the ideas of
Sigurdssonet al. (1987)and experimentalstudies discussed by
Jopling and Walker (1968). Sigurdssonet al. (1987)discuss how a
low concentrationbed load (consistingof more-or-lessindividually
saltatinggrains) moves up the stoss side of a bed form,
accumulatinggrains at the top until avalanchingoccurs down the lee
side. This process, combined with periods of erosion (Joplingand
Walker 1968), produces the familiar cross bedded dune. The same
process may happen in an antidune,except there avalanchingcan
occur down the stoss side. However, if there is a high rate of
material supply from the suspendedload to the bed load, the
avalanchingprocess can be effectivelyoverwhelmed. In this case a
high concentrationbed load moves in a continuousmanner over bed
forms, and this is preserved in the resultingdeposits. When a
continuousbed load freezes (itsyield strength surpasses the shear
stress) under such conditions,experimentsshow that it is rapidly
buried by material coming out of suspension,thus preventing stoss-
or lee-side erosion (Joplingand Walker (1968). Yield strength of
the bed load is strongly influencedby its sorting -- poorer sorting
results in higher yield strength. Thus, the change in bed form
characterwith distance that is observed in the Peach Springs Tuff
may be explained in terms of decreasingconcentrationof the
suspended load and improved sorting of material supplied to the bed
load with increasingflow distance.
- 58 -
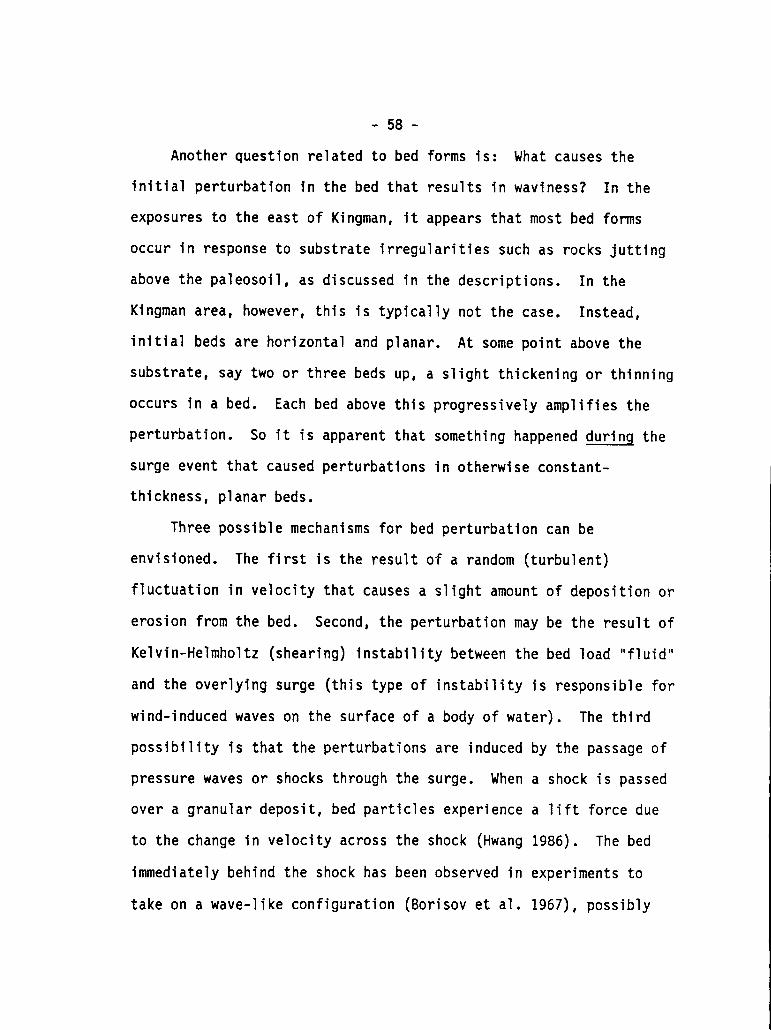
Another question related to bed forms is: What causes the
initfal perturbationin the bed that results in wavtness? In the
exposures to the east of Kingman, it appears that most bed forms
occur in response to substrate irregularitiessuch as rocks jutting
above the paleosoil,as discussed in the descriptions. In the
Kingman area, however, this is typical’
initial beds are horizontaland planar
substrate, say two or three beds up, a
y not the case. Instead,
At some point above the
slight thickeningor thinning
occurs in a bed. Each bed above this progressivelyamplifies the
perturbation. So it is apparent that somethinghappened durinq the
surge event that caused perturbationsin otherwise constant-
thickness,planar beds.
Three possible mechanisms for bed perturbationcan be
envisioned. The first is the result of a random (turbulent)
fluctuationin velocity that causes a slight amount of depositionor
erosion from the bed. Second, the perturbationmay be the result of
Kelvin-Helmholtz(shearing)instabilitybetween the bed load “fluid”
and the overlying surge (this type of instabilityis responsiblefor
wind-inducedwaves on the surface of a body of water). The third
possibility is that the perturbationsare induced by the passage of
pressure waves or shocks through the surge. When a shock is passed
over a granular deposit, bed particlesexperiencea lift force due
to the change in velocity across the shock (Hwang 1986). The bed
immediatelybehind the shock has been observed in experimentsto
take on a wave-like configuration(Borisovet al. 1967), possibly

- 59 -
influencedby internalwaves that occur in the density-stratified
surge (Chapter2; Valentine 1987). If the PST layer 1 deposits are
indeed the result of blast phenomena,then shocks are expected to
occur in the surges (Wohletzet al. 1984). The observationthat
these bed perturbations(occurringwithin the surge deposit) are
found mainly in the Kingman area, but not to the east, may reflect
gradual dissipationof shocks with increasingflow distance. I know
of no way to prove this idea from field measurementsat the present
time, but a shock-inducedorigin is a viable possibility.
It is worth noting that similar bed-form initiationfeatures
(smal1 perturbationsin otherwiseplanar beds) have been observed in
pyroclastic surge deposits around maar volcanoes (e.g. Fisher and
Waters 1970; Crowe and Fisher 1973; Schmincke et al. 1973) and
possibly in proximal veneer deposits of the Taupo ignimbrite (Wilson
1985). Especially in the case of maar volcanoes it is expected that
numerous shocks will be produced by magma-water interaction. The
occurrenceof these features in such environmentsmay indicate that
shock-inducedbed forms are a common phenomenon.
Fine Ash Layer (FA1)— —
Apparently the vent walls became unstable and eventually
collapsed,temporarilyclogging the vent (Figure 1-14c). This
brought the layer la-producingevent to an end and allowed time for
deposition of FA1, the “co-surge”fallout deposit. FA1 may
initially have been damp, as evidencedby dessicationcracks and
plastic deformation into flames and diapir-likestructures. In the
- 60 -
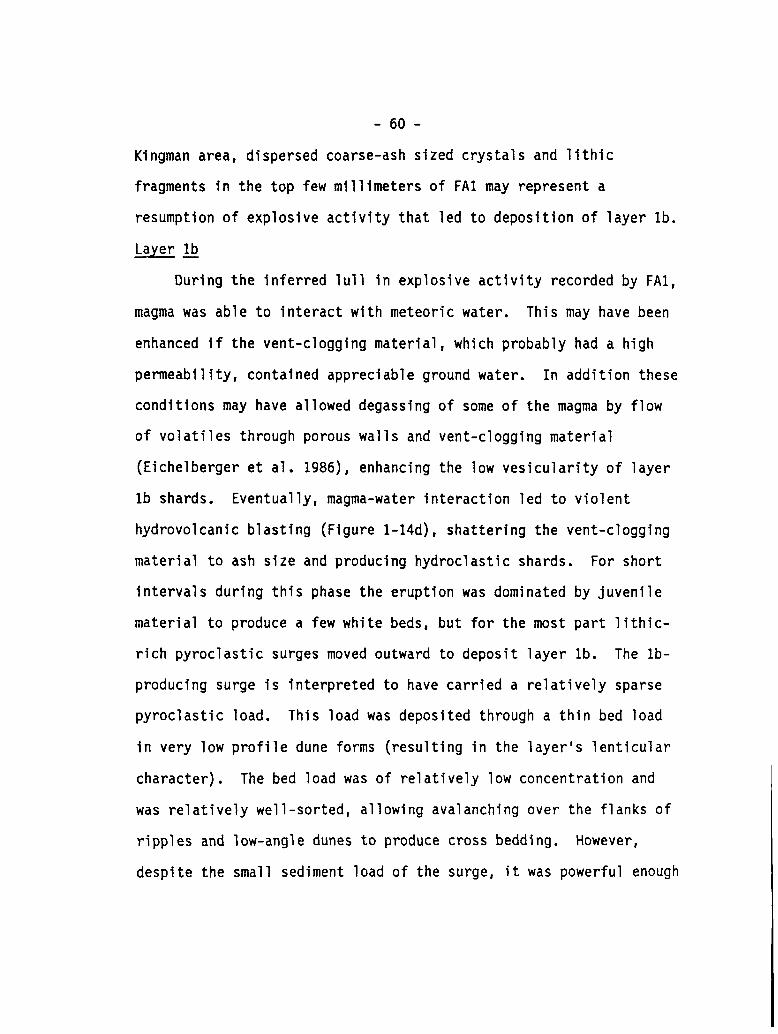
Kingman area, dispersed coarse-ashsized crystals and lithic
fragments in the top few millimetersof FA1 may representa
resumptionof explosive activity that led to depositionof layer lb.
Li?Y!zl!!
During the inferred lull in explosiveactivity recordedby FA1,
magma was able to interactwith meteoric water. This may have been
enhanced if the vent-cloggingmaterial,which probably had a high
permeability,containedappreciableground water
conditionsmay have allowed degassingof some of
of volatiles through porous walls and vent-clogg
In addition these
the magma by flow
ng material
(Eichelbergeret al. 1986), enhancingthe low vesicularityof layer
lb shards. Eventually,magma-waterinteractionled to violent
hydrovolcanicblasting (Figurel-14d), shatteringthe vent-clogging
material to ash size and producinghydroclasticshards. For short
intervalsduring this phase the eruptionwas dominated by juvenile
material to produce a few white beds, but for the most part lithic-
rich pyroclasticsurges moved outward to deposit layer lb. The lb-
producing surge is interpretedto have carried a relativelysparse
pyroclastic load. This load was deposited through a thin bed load
in very low profile dune forms (resultingin the layer’s lenticular
character). The bed load was of relativelylow concentrationand
was relativelywell-sorted,allowing avalanchingover the flanks of
ripples and low-angledunes to produce cross bedding. However,
despite the small sediment load of the surge, it was powerful enough
- 61 -
I
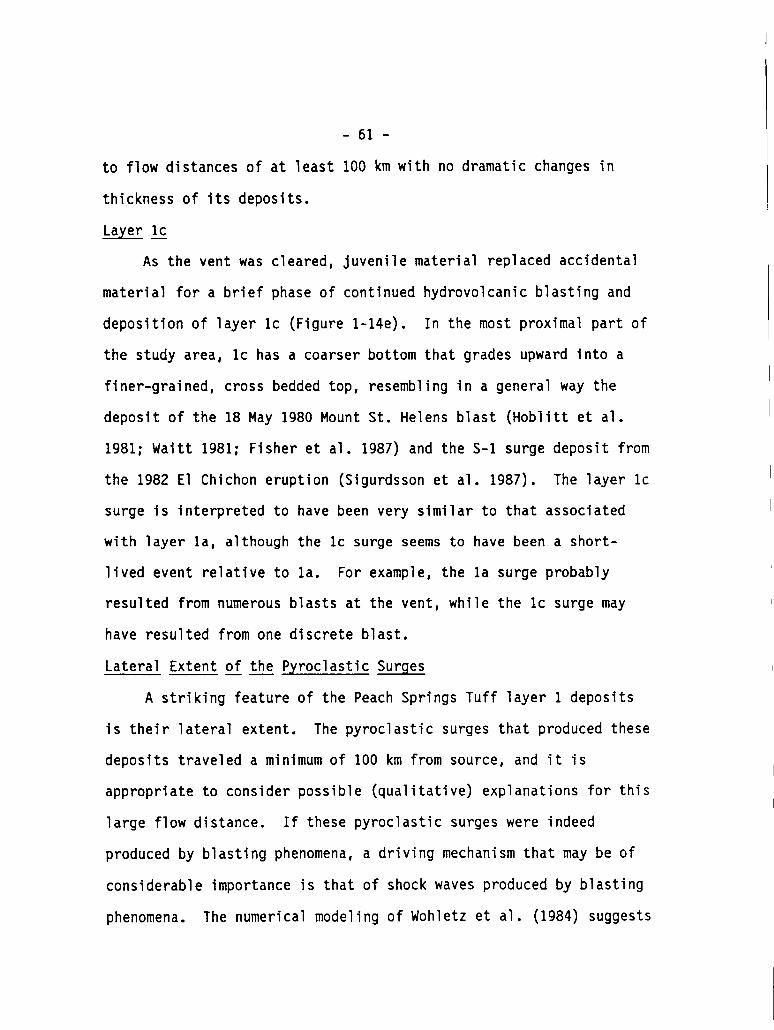
to flow distances of at least 100 km with no dramatic changes in
thicknessof Its deposits.
WE
As the vent was cleared, juvenile material replaced accidental
material for a brief phase of continuedhydrovolcanicblasting and
deposition of layer lC (Figure l-14e). In the most proximal part of
the study area, lC has a coarser bottom that grades upward into a
finer-grained,cross bedded top, resemblingin a general way the
deposit of the 18 May 1980 Mount St. Helens blast (Hoblittet al.
1981; Waitt 1981; Fisher et al. 1987) and the S-1 surge deposit from
the 1982 El Chichon eruption (Sigurdssonet al. 1987). The layer IC
surge is interpretedto have been very similar to that associated
with layer la, although the IC surge seems to have been a short-
lived event relative to la. For example, the la surge probably
resulted from numerous blasts at the vent, while the IC surge may
have resulted from one discrete blast.
Lateral Extent of the PyroclasticSurqes——
A striking feature of the Peach Springs Tuff layer 1 deposits
is their lateral extent. The pyroclasticsurges that produced these
deposits traveled a minimum of 100 km from source, and it is
appropriateto consider possible (qualitative)explanationsfor this
large flow distance. If these pyroclasticsurges were indeed
produced by blasting phenomena,a driving mechanism that may be of
considerableimportanceis that of shock waves produced by blasting
phenomena. The numericalmodeling of Wohletz et al. (1984) suggests
I
I
I
- 62 -
that shock waves may dominate the flow for several tens of
kilometersaway from the vent during the blast phase of an eruption.
Shock waves may serve to keep a surge turbulentas well as to
provide momentum. Also, beyond the Kingman paleovalleythe surges
moved across a relativelysmooth (low drag) terrain that sloped
downward to the east.
Another possible contributingfactor to the large flow extent
may be atmosphericw-
historicalpyroclast
there was a strong w
nd, which has been observed to Influence
c surges (e.g.Waters and Fisher 1971). If
nd blowing to the east, it may have been able
to take over particle transportwhen the surge’s primary drive was
lost. This is not favored because atmosphericwind would be
expected to continue blowing after it had lost its pyroclastic load,
which would not allow for depositionof the co-surge fine ash layer
between layers la and lb. Nevertheless,a contributionfrom
atmosphericwind cannot be completelyruled out.
DISCUSSION
The open-valley layer 1 deposits of the Peach Springs Tuff
record a complex blast phase, with variable interactionbetween the
rising magma and ground- or surface-water. The strength of the
blast phase, especiallythe part that led to layer lb, may be partly
responsiblefor the lack of a Plinian deposit at the base of the
ignimbrite.

- 63 -
Four variables interactduring an eruption to determinewhether
the eruption column will collapse or continue to high altitudes to
produce a fallout deposit. Three of these -- vent radius, exsolved
gas content, and exit velocity -- are discussed in detail by Sparks
et al. (1978). The fourth, exit pressure, is discussed in Chapter 3
and by Valentine and Wohletz (1987). Low values of exsolved gas
content, exit velocity, and exit pressure, and large vent radius
tend to produce eruption columns that collapse. In the case of the
Peach Springs Tuff eruption,where no Plinian fallout deposit has
been observed, it is thought that vent radius and its effect upon
exit pressure played the major role. Instead of the eruption
beginning with a small vent (producinga Plinian eruption column)
and subsequentlyevolving toward a wider vent for pyroclasticf-lows,
the powerful blasting that is recorded in the layer 1 deposits
rapidly produced a very wide vent (primarilyduring the phase that
produced layer lb) . A wide vent will correspondto relatively low
exit pressure, as discussed by Kieffer (1982). Thus the Peach
Springs Tuff eruption bypassed a Plinian phase.
The importanceof hydrovolcanicprocesses in other
intermediate-to large-volumesilicic eruptions has been discussed
by Self and Sparks (1978),Self (1983),and McPhie (1986). I
suggest that processes similar to those that occurred during the
Peach Springs Tuff eruption may be important in many large-volume
ignimbriteeruptions,which commonly lack significantfallout
deposits (Lipman 1986). One would especiallyexpect important

- 64 -
hydrovolcanicinput in eruptionsfrom nested or coalesced calderas,
such as have occurred in the San Juan Mountains volcanic field of
Colorado, U.S.A. (Stevenand Lipman 1976; Lipman et al. 1973). In
such cases, eruptions commonly occur through closed basins formed by
earlier caldera collapse events. These closed basins may accumulate
significantquantitiesof water both below the surface and in
caldera lakes, which would aid in hydrovolcanicblasting.

- 65 -
CHAPTER 2: STRATIFIEDFLOW IN PYROCLASTICSURGES
INTRODUCTION
Pyroclasticsurges are consideredto be low-particle-
concentration,high velocity flows that move in a dominantly
turbulentmode (Wrightet al. 1980). They leave relativelythin,
bedded and cross bedded to massive deposits (Fisherand Waters 1970;
Wohletz and Sheridan 1979; Walker 1984). Surges may originate by
eruption column collapse, lava dome collapse, lateral blast (Hoblitt
et al. 1981; Waitt 1981; Fisher et al. 1987), blast wave phenomena
(Wohletzet al. 1984), or as ash clouds generatedby dense
pyroclasticflows (Fisher1979). Attention in recent years has been
directed toward acquiringa more quantitativeunderstandingof surge
mechanisms; importantworks in this area include those of Wohletz
and Sheridan (1979), Kieffer (1981),and Wohletz et al. (1984).
Aspects of compressibleflow are extremely important in modeling
pyroclasticsurges, and have been addressed in Kieffer (1981) and
Wohletz et al. (1984). This chapter addresses applicationof
stratifiedflow theory to surges, where the word “stratified”
implies a density gradient from bottom to top of a surge, reflecting
the solids concentrationgradient.
The terms “surge” and “flow” as they are currently used in
volcanologyliteratureare ambiguous,since they are both really
flows (see Wright et al. 1980). Pyroclasticsurges are commonly
defined as gas-particlemixtures where particle concentrationis low
I
- 66 -
and rheology is approximatelyNewtonian,except In the bed-load
region, where local particle transportmay be by saltationand thin
granular flow (Savage 1984; Campbel1 and Brennan 1985). Particle
transport is dominated by turbulencein this definitionof surges.
Pyroclasticflows, on the other hand, are defined as high-
concentrationflows with characteristicsapproachingthose of debris
flows (Sparks1976; Valentine and Fisher 1986). In addition,
fluidizatfonprocesses probably play a role in dense pyroclastic
flows (Sparks 1976, 1978; Wilson 1980, 1984), while fluidizationis
relatively unimportantfor low concentrationsurges. Another
Importantdistinctionbetween pyroclasticflow and surge was
recently proposed by Fisher (1986),who suggestedthat regional
transport of particles and local deposition in the two types of
systems have fundamentallydifferent relationships. He suggested
that the deposit of a pyroclasticflow and the flow itself are
essentiallythe same. That 1s, the deposit representsthe frozen
flow, which correspondswith en masse depositionof pyroclastic
flows that has been suggestedby previous authors (Sparks1976;
Valentine and Fisher 1986). In contrast with this, pyroclastic
surges have separate transportand depositionalsystems. The
transport system of a surge is dominatedby turbulence,while the
depositionalsystem depends upon local conditionsand the amount of
material supplied to it from the transport system. Thus, while a
surge may leave local massive deposits that have characteristicsof
pyroclastic flow deposits, the material forming the deposits was
- 67 -
transportedmost of the distance from the vent by turbulent
suspension. In this chapter I will retain the current usage of the
terms “pyroclasticsurge” and “pyroclasticflow” as defined in this
paragraph, includingthe distinctionmade by Fisher (1986). “Surge”
is often used by itself and means pyroclasticsurge. “Flow,”
however, simply refers to fluid motions in general unless
preceded by “pyroclastic.
This chapter centers on the effects of density strat
it is
ficaton
in flows dominated by turbulenttransportof the pyroclastic
material. The order of the chapter is as follows. After
introducingimportantparametersof stratifiedflow theory, a
possible relationshipbetween internalgravity waves and surge bed
form mechanics is proposed. Facies variationsare then related to
the stratifiedflow approach. This is followed by a discussionof
the effects of density stratificationon the interactionof
pyroclastic surges with topography.
STRATIFIED FLOW PARAMETERS
The approach used here is the classicalmixing length method
for turbulent flow. Efficiencyof particle transport at a given
level in a turbulent flow depends on the scale of eddies, which
affects the sediment diffusivitycoefficient,at that level. Eddy
and sediment diffusion profiles used for streams and flumes are
assumed to be sufficientfor applicationto pyroclastic systems.
Although pyroclasticsurges are probably compressibleflows in most

- 68 -
cases, the use of steady, incompressibleflow profiles is justified
for the following reasons.
(1) The main flow property in the relationsdiscussedbelow is
the mixing length,which describes the length scale over
which momentum transfer occurs in a turbulent flow (Birdet
al. 1960, p. 160). In compressiblegas flows, the vertical
(away from boundary) rate of increaseof mixing length is
affected by an increasedtemperatureat the boundary due to
viscous dissipation. This increasedtemperaturereduces gas
density at the boundary,which in turn results in a
thickeningof the boundary layer and decreasing friction
coefficient (Liepmannand Roshko 1957, pp. 338-340;
Schlichting 1979, pp. 715-723). In pyroclasticsurges, the
presence of particles results in the flows being nearly
isothermal (see discussionby Kieffer 1981). Because of
this, boundary effects that occur in single phase gas flows
can be ignored.
(2) Compressibleflow of pyroclasticsurges results in an
accelerationcomponentdue to expansionor compression. If
this accelerationis smooth (i.e. the flow is gradually
varied), the steady flow relationsshould hold locally,
although the sedimentdiffusionand concentrationprofiles
at each section along the flow will be different. The
relationsdo not hold at the locationof a shock wave or
hydraulicjump, where conditionsare rapidly varied.
- 69 -
The empirical nature of the eddy diffusivity/mixinglengthmethod
should be stressed: It does not describe the actual physics of the
processes.
The sediment diffusionprofi’
greatest in the core of the flows
es used here have diffusion
decreasingto zero at the bottom
and top (see discussionby Dingman 1984, pp. 166-173). This
produces a nonlinear particle concentrationgradient. In the core
of a flow, where mixing Is most efficient,dp/dy (p = density, y =
vertical axis with origin at the base of the flow) will be at its
lowest value. The gradient becomes strongeras the flow boundaries
are approached because diffusionby eddy action is suppressedthere.
Symbols and their definitionsare given In Appendix 2A.
Concentrationprofiles for turbulenttransport systems are
governed by the Rouse number, which is a ratio of particle settling
velocities to the scale of turbulence. For flows with a single
particle size, or when determiningthe ability of any flow to carry
a specific particle size, the Rouse number is given by (see
Middleton and Southard 1978, pp. 6.37-41)
‘iPni = — (2-1)ku*
where Pni, the particle Rouse number, correspondsto particleswith
settling velocity wi in a flow with shear velocity u*. Von Karman’s
constant, k, is defined by k = L/y, L being the mixing length. The
conunonlyaccepted value of k is 0.4. In actuality,the density
- 70 -
stratificationInherent In turbulentsuspensionsinfluencesthe
value of von Karman’s constant,which in turn affects the density
gradient. These complex interactionsare just beginning to be
understood (see, for example Delvigne, 1986), but for this chapter
the constant value given above is adopted.
For a pyroclasticsurge, which may have a wide range of
particle sizes and settling velocities,a more comprehensiveform of
the Rouse number is
1 ‘iPn = – ES.— (2-2)Siavg 1ku*
Here, Savg is the average volume concentrationof all solids in the
flow, Si Is the average volume concentrationof particles in
settling velocity class Wio Pn is then the average of all particle
Rouse numbers, each weighted accordingto its volume concentration,
and is termed the “distribution”Rouse number.
To determine the density profile of a surge, begin with the
following form of the concentrationequation (Ghoshet al. 1986)
which gives particle concentration(S) as a function of height:
1 dS [11-— = -Pn (2-3)S dq ?(1-?)
where q = y/d is the dimensionlessheight taking d as the total
- 71 -
flow thickness (see Figure 2-1). Integrating(2-3) to find the
concentrationprofile we get
In this equation, zero subscriptrefers to conditionsat a reference
level In the flow. Equation (2-4) Is plotted in Figure 2-1. For
the density of the flow (mixture),the contributionof the gas phase
Is neglected so that
p =‘s’4::1‘n (2-5)
where ps is particle density. The density gradient is then
dp—= -’d~lpn;[;lpn-’
(2-6)dq
A parameter of fundamentalimportancein stratified flow theory
is the Brunt-Vaisalafrequency (N) given by (Lin and Pao 1979)
-72-
Figure 2-1. Relative concentration(S/S.)as a function of
dimensionlessheight (q) In a turbulentsurge. S. Is the
particle volume concentrationof at referencelevel q. = 0.01.
Profiles are shown for three values of the distributionRouse
number (Pn).
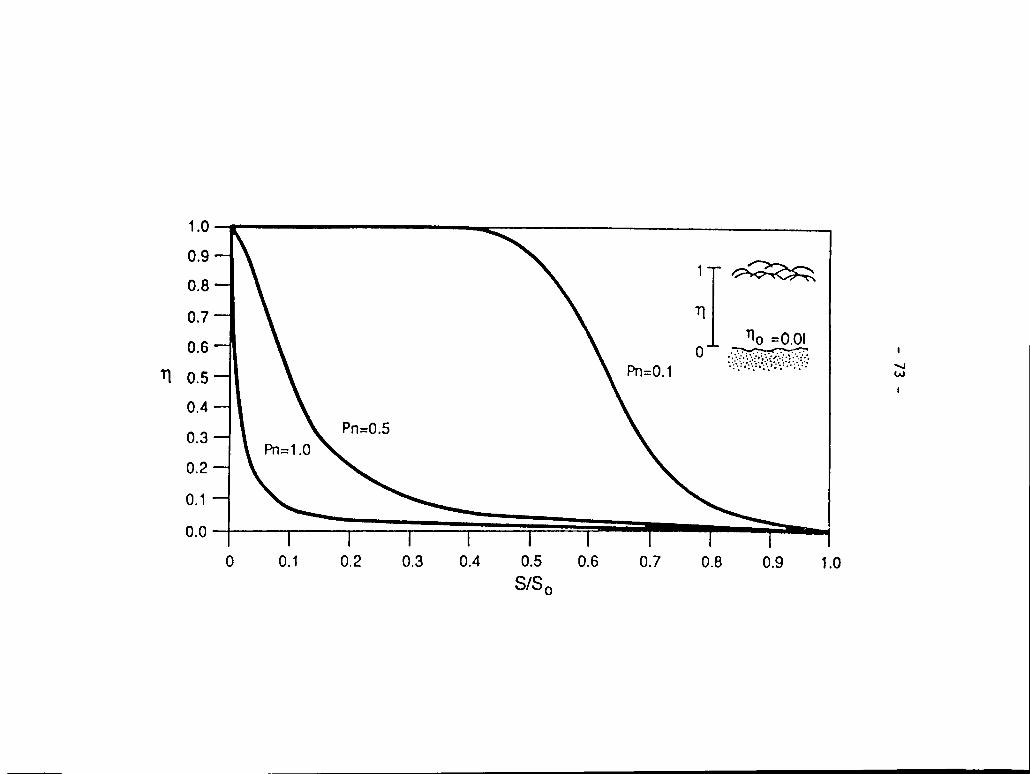
-73
-
11111111[
Oqabatnw
mm
l.o
Y0000000000
F
q-o
a)-oa-om-o
N-o
--o-o
- 74 -
[1-gdp1/2
N=~——2r p dy
(2-7)
where g is accelerationdue to gravity, directed in the negativey
direction. N representsthe maximum possible frequencyof internal
waves in a stratifiedflow. Just as waves may occur on a density
interface (which representsan Infinitedensity gradient),waves
also occur in a continuouslystratifiedflow (Yih 1980). This can
be visualizedby consideringthe continuouslystratifiedflow as
consisting of an infinitenumber of very small density interfaces
upon which the waves travel. Most stratifiedflow research has
centered on flows with linear density gradients (dp/dy = constant)
or with density interfaces,which closely approximateatmospheric
and ocean currents. As mentioned above, concentrationor density
stratificationin flows dominatedby turbulenttransport is
nonlinear so that the local N is a functionof height in the flow.
Substitutingq for y and applying Equation (2-6),the Brunt-
Vaisala frequencyprofile for a pyroclasticsurge becomes
‘(’)=% ,;:,)11’2 (2-8)
Thus N is not only a functionof height in the flow but also depends

- 75 -
on the distributionRouse number, as shown in Figure 2-2. Note that
N is not a preferred frequencybut is the maximum frequency at the
specified level in the flow. Internal waves may have any frequency
as long as N is not exceeded.
The Froude number (Fr) is of fundamentalimportancein all
flows where inertial and gravitationalforces are present. In
continuouslystratifiedflows Fr is defined as
uFr = —
NYh(2-9)
where yh is a height scale and u is flow velocity (Lin and Pao
1979). The height scale can representeither the hefght of an
obstacle in the flow or, in a more general form,
(Ap)sdYh = (2-lo)
dpldq
By this definition,yh is simply the depth through which a specified
density difference (Ap)soccurs. The term Nyh representsthe speed
of internal gravity waves generated at height h. Thus Fr can be
thought of as a ratio of flow velocity to internal gravity wave
speed. In flows with nonlinearN profiles such as those considered
in this chapter, Fr varies with height even if the flow is inviscid.

-76-
Figure 2-2. Example Brunt-Vaisalafrequency (N) profiles for a 100
m thick pyroclasticsurge at various distribution Rouse numbers
(Pn).

- 77 -
1.0
0.9
0.8
0.7
0.6
n 0.5
0.4
0.3
0.2
0.1
0
d
. /pn=0”5
t’Pn= 1.0
Flowdepth(d )= 100 m
0 0.1 0.2 0.3 0.4 0.5 0.6
N (t+z)

-78-
One more parameterof importancein stratifiedflow theory is
the Richardsonnumber (Ri). This dimensionlessgroup representsa
ratio of “buoyancy”forces to turbulenceproduction,and is given by
-gd dp/dqRi = — (2-11)
p (du/dq)2
In a fluid with strong stable density stratification,turbulence is
damped because parcels of fluid being moved to different levels by
eddies will experiencea buoyancy force and tend to return to their
original levels. For a boundary layer on a flat plate at zero
incidence,if Ri > 1/4, the flow is stable and turbulencecannot
occur no matter how high the Reynolds number (Schlichting1979, pp.
512-513). For pyroclasticflows and surges,which are density-
stratifiedflows over rough surfaces,the exact critical value of Ri
is not clearly defined. The manner in which Ri varies with height
in a surge is complex and probably cannot be predicted analytically
at present. For example, solving for Ri by applying Equation (2-6)
and using the standard relation for a turbulent flow velocity
profile yields the result that Ri is at a minimum at the flow
boundary, since this is the region of highest shear in the flow.
The same solution predicts that the Richardsonnumber increasesvery
rapidly with increasingheight. However,observed Ri values in
rivers carrying suspended loads, where the same relations should

- 79 -
hold, indicate that Ri is roughly constantwith height above the
immediate vicinity of the boundary. Thus, while the effects of
variations of the Richardsonnumber can be discussed qualitatively,
no attempt is made to analyze it further in this chapter. Wilson
(1985) has also discussed the effects of density stratificationon
turbulence in terms of fluidization-induceddensity gradients.
The above parameters have been introducedand are used
extensively in this chapter because they describe the interplayof
forces that affect pyroclasticsurges. In the discussion that
follows, the emphasis is on how these parametersvary as a surge
flows away from its vent or encounterstopography. The discussion
is largely qualitativeand is based on general physical
characteristicsof turbulent flows. No solutionsof the equations
of motion are given in terms of the stratifiedflow parameters. At
the current state of knowledgethis cannot be achieved because there
is as yet no general theory describingturbulent flows.
CONDITIONS FOR TURBULENT TRANSPORT
I now consider the conditionsnecessary for the turbulent
transport model used in this chapter. While it is generally agreed
that pyroclastic surge deposits such as those found around maars and
tuff rings are the product of dominantlyturbulent transport, some
disagreementhas arisen as to whether highly energetic flows, such
as the May 18, 1980 blast at Mount St. Helens, can be classifiedas
pyroclastic surges (Walkerand McBroome 1983, 1984; Waitt 1984;
- 80 -
Hoblitt and Miller 1984). Because of the importanceof this problem
wtth regard to interpret~ngthe deposits,the possibilityof
turbulent transport at Mount St. Helens is specificallyaddressed.
It has recentlybeen argued (Walker1983) that turbulent
transport can only be effectiverelativelynear the source of a
pyroclastic current, and that the majority of clasts in the current
would quickly settle into a highly concentratedbasal pyroclastic
flow. For instance, in his discussionof the Mount St. Helens
blast, Walker (1983)stated that “... the distance of travel (nearly
30 km from vent at Mount St. Helens) is unduly great for a low-
concentrationcloud moving against air resistanceand dependingon
internal turbulenceto maintain particles in suspension.
Sparks et al. (1978)have demonstratedhow rapidly particles settle
from such a cloud.” This argument is based on the modeling of
Sparks et al. (1978),but it is questionablewhether the Sparks et
al. model is applicableto Mount St. Helens. Their model is based
on column collapse,where the gas-pyroclastmixture falls to the
ground and moves laterallyacross a rather steep slope near the vent
and a gentle slope of 10 beyond that. In addition, they used a
roughnessof 1 cm and assumed that the entire flow was a boundary
layer. These conditions imitate those found around many established
ignimbrite-producingvolcanoes,but none of them are met for the
Mount St. Helens blast. Kieffer (1981)has shown that the laterally
moving flow produced by the blast was not due to column collapse,
but Instead was the result of laterallydirected discharge. The

- 81 -
topography around Mount St. Helens is very rugged, characterizedby
sharp ridges and valleys giving a relief of hundreds of meters. In
addition, the blast moved over devastatedforest with stumps about 1
m high as roughness elements. The assumptionof flow thickness
equalling boundary layer thicknessthat was used by Sparks et al.
(1978) is probably incorrectfor most cases. At Mount St. Helens,
Kieffer and Sturtevant (1986)have reportedevidence,based on
erosional features thought to be due to boundary layer vortices,
that boundary layers in some areas were on the order of 3 - 10 m
thick, while the total flow thicknesswas several hundreds of
meters.
In view of the difficultiesdiscussed above in applying the
modeling of Sparks et al. (1978),an alternativeapproach is taken
here in order to determine if turbulenttransportwas importantat
Mount St. Helens. In these calculations,relevant values of
substrate roughness height, boundary layer thickness,free stream
velocity, and pyroclast settling velocitywere used to calculate
particle Rouse numbers for particleswith diameters of 0.1, 1, and
10 cm. These are compared to the critical value of the particle
Rouse number, which is approximatelyPni = 2.5 (Middletonand
Southard 1978, pp. 6.37-41),above which turbulent suspension is
ineffective. The followingequation for velocity in a turbulent
boundary layer is used (Dingman1984, pp. 105)

- 82 -
[1Yu= ~ In —k Y.
(2-12)
where y. IS the roughnessparameter. Equation (2-12) Is a direct
consequenceof mixing length theory. For hydraulicallyrough flow,
which is assumed here,
Y~ 1x—
ks 30(2-13)
ks being the actual physical height of roughnesselements. Use of
(2-13) allows (2-12)to be written as
[13oyu = Y in —k ks ‘
(2-14)
Velocity u equals the free stream velocity at the top of the
boundary layer (y = ddl). Using ddl = S m and ks = 1 m, U* was
determined for velocitiesranging from 100 to 300 m/s (this
calculation is relativelyinsensitiveto variationsof dbl within
the range of values at Mount St. Helens). Particle settling
velocitieswere calculatedassuming a particle density of 2000 kg/m3
I
- 83 -
in a dusty gas mixture of steam at 3000C and 1 atmospherepressure
with an average solid volume concentrationof about 4.8 x 10⁻³,
which correspondsto the mass ratio of 25 used by Kieffer (1981). A
constant particle drag coefficientof 0.44 was used for settling
velocity calculations (Bird et al. 1960, pp. 190-194). Values of U*
and particle settling velocitywi allowed direct calculationof the
particle Rouse numbers (Pni) using Equation (2-1).
Figure 2-3 shows Pni for the three clast sizes given above as a
function of free stream velocity ufs. Pyroclastswith diameters of
1 cm or less are easily transportedby turbulence. As ufs
approaches 300 m/s, part<
in suspension. Model ca’
flow velocities at Mount
thus It seems likely tha(
cles approaching10 cm diameter are carried
culationsby Kieffer (1981) indicate that
St. Helens may have approached300 m/s,
large lithic fragmentscould have been
transported by turbulence in the blast. Certainlymost ash and fine
lapilli-sizedclasts could have been easily transportedin low-
concentrationsuspension. It is thought that the addition of form
drag from larger scale roughness such as avalanche hummocks and from
the rough topographywould lower all particle Rouse numbers, so that
1ithic fragments in excess of 10 cm could have been transportedby
turbulence at velocitiesmuch lower than 300 m/s.
On the basis of sedimentdiffusion experimentsin flumes
(Jobson and Sayre 1970), Sparks et al. (1978)argue that even in a
flow with sufficientlylow Pni most sedimentwill settle out of the
flow within distances correspondingto about 10 km in pyroclastic

-84 -
Ffgure 2-3. Partfcle Rouse numbers (Pni) for lithfc clasts wfth
diameters of 0.1, 1, and 10 cm as a functfonof free stream
velocfty (ufs) for the Mount St. Helens blast. Parameters
Include roughness height of 1 m, boundary layer thicknessof 5 m,
clast density of 2000 kg m-3, and particle volume concentration
of 4.8 X 10⁻³. For values of Pni greater than 2.5, turbulent
suspension fs Ineffective. See text fordiscussfon.
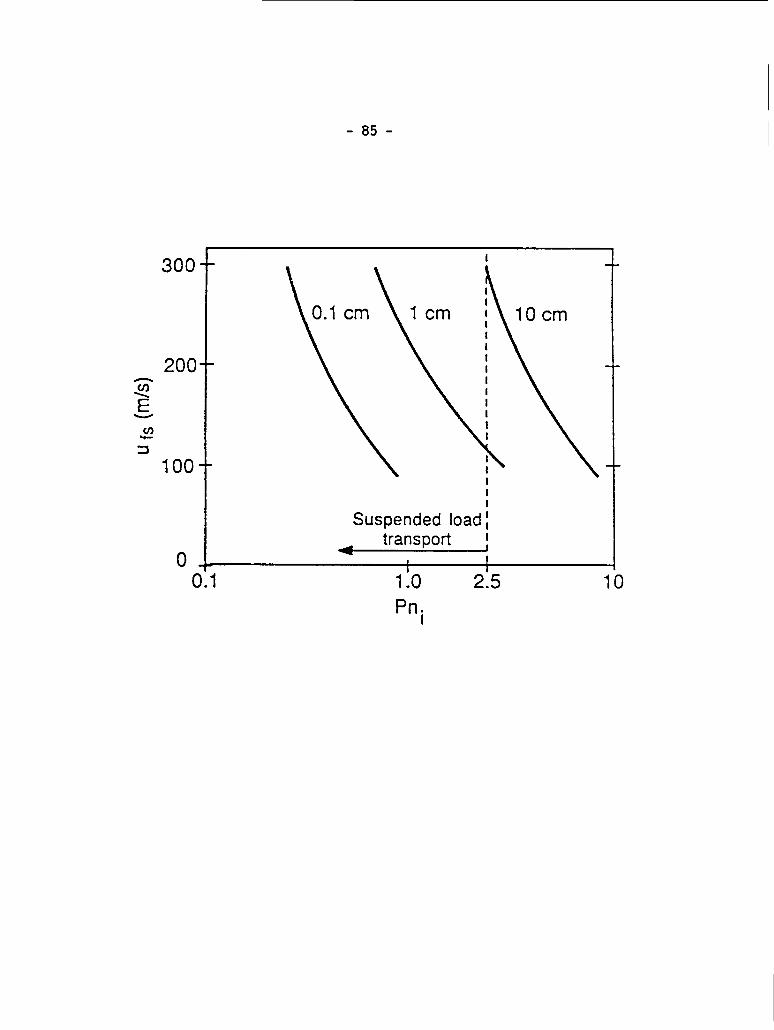
- 85 -
3 0
2 0
1 0
0c
I
S l \t :
4 1 II 1I 1.0 2.5 1
P
- 86 -
systems. However, the flume experimentsreferred to were aimed at
studying longitudinaldiffusion In uniform flows. Kieffer (1981)
has suggested convincinglythat the Mount St. Helens blast was
essentiallyan overpressuredjet, so that flow over most of its
extent was in the compressiblerange and was actually supersonicout
to about 10 km north of the vent. For nearly half of the extent the
flow was accelerating,with velocity increasingfrom about 105 to
320 m/s according to Kieffer’s (1981)model calculations.
Therefore, the flow was probably non-uniform,unlike the Jobson and
Sayre experiments. As the blast moved across the landscapeits
suspended-loadcarrying capacity Increasedthroughoutthe expansion
stage.
Note that relationsderived from flume experimentshave been
heavily used in the present chapter. However, these relationshave
only been used to derive local conditionsin a flow. As stated in
the previous section, variablessuch as the Rouse number and Brunt-
Vaisala frequencywill change in
not uniform.
Past models for pyroclastic
mainly on gravity as the driving
the flow directionwhen the flow is
transportprocesses have been based
force of the flows. As we have
seen at Mount St. Helens, another importantdriving force arising
from the thermodynamicsof the flows is supersonicexpansion. Most”
previously studied pyroclasticsurge deposits occur around maar
volcanos (Moore 1967; Fisher and Waters 1970; Waters and Fisher
1971; Wohletz and Sheridan 1979: Walker 1984). These deposits do

not extend for
apparently der<
- 87 -
more than a few km from their sources. They are
ved from surges formed by collapse of low
phreatomagmaticeruption
which dissipated quickly
columns; their source of energy was gravity
due to drag. Flows dominated by turbulent
transport over larger distances (tensof km) may have had a
significantcomponentof driving force due to supersonicexpansion.
The necessarily high initial flow velocity (sonicor supersonic)may
be due to collapse from an extremelyhigh eruption column or to
overpressuredconditionsin the column. An overpressuredjet need
not be laterallydirected as was the Mount St. Helens blast. Simple
Prandtl-Meyer
have the same
deposits that
expans
result
on of a verticaljet as it exits the vent might
The followingquestion might be asked: Are
suggest turbulent transportover tens of kilometers,
such as the Mount St. Helens blast and the Taupo ignimbrite (see
discussion below), indicationsof overpressurederuptions?
SURGE BED FORMS
Bed forms such as dunes, ripples,and chute-and-poolstructures
are very common in pyroclasticsurge deposits (Fisherand Waters
1970; Waters and Fisher 1971; Schminckeet al. 1973; Crowe and
Fisher 1973; Sparks and Walker 1973; Wohletz and Sheridan 1979).
They are similar In many ways to bed forms that occur in water
transport systems, but they are commonly lower-angleand more subtle
than their water-formedcounterparts,except in the deposits of wet
surges, where particle-to-bedcohesion is important. L dips of
- 88 -
foreset and backset laminationsin many surge bed forms preclude
dune migration by avalanchingor rolling of grains down lee-sides
(or stoss-sidesfor antidunes) (Fisherand Schmincke 1984, p. 251).
In surges, as in flumes, small-scaleripplesmay occur on larger bed
forms, and dunes may migrate downstreamor upstream (here called
antidunes, unless the dune can be demonstratedto have moved
upstream due to accretionon its wet surface). In somecases
ripples migrate downstreameven where they occur on antidunes. The
precise mechanisms by which bed forms originate in pyroclastic
surges are poorly understood.
Wavelength Variations
Data indicate that bed form wavelengthtends to
gradually as flow distance (measuredfrom the vent)
(Wohletzand Sheridan 1979; Waters and Fisher 1971).
decrease
increases
In addition,
Moore (1967) has documenteda rapid decrease in bed form wavelength
where pyroclasticsurges of the Taal Volcano flowed uphill and
decelerated. At Ubehebe volcano in California,Crowe and Fisher
(1973) noted that bed form wavelengthsincreasewhere substratedip
increases in the directionof flow. Thus the indicationsare that
bed form wavelength is a functionof flow velocity or flow power
(Fisherand Schmincke 1984, p. 251), although the exact physical
link between them is in question. Considerationof stratifiedflow
dynamics holds a possible answer.
As a surge moves across the ground, especially if the ground is
relatively smooth like the rim of a maar volcano, turbulencewill

- 89 -
become less intense as flow distance increases. This is due to
slowing of the flow and the self-dissipativenature of turbulence.
The result will be an increasingdistributionRouse number or
decreasing carrying capacity of the surge. From Figure 2-1 it can
be seen that increasingPn implies a steeper density gradient near
the bed. Now, dune mechanics in flumes and rivers are tied to waves
on the flow surfaces (Kennedy1963). In pyroclasticsurges we have
no compelling reason to assume the presence of a density interface,
so here I consider the more general case of a continuous
stratification. Thus, it is proposed that bed forms in surges are
related to internalwaves. The horizontalspeed of internalgravity
wave propagation is equal to Nyh, yh being given by Equatfon (2-10).
Minimum possible internalwavelength scales with wave speed divided
by maximum (Brunt-Vaisala)frequency,or simply yh. yh will
decrease with decreasing flow velocitydue to the steepeningdensity
gradient. Thus, the minimum internalwavelengthdecreaseswith
distance. It is here suggestedthat bed form wavelength is forced
to accommodatethe minimum internalwavelength in the near-bed
region, and reflects the changes in internalwavelengthwith flow
distance.
The idea of internalwaves relating to dune formationmay be
extended to ripples. Initiationof ripples in sediment transport
systems is usually attributedto rather random events. For
instance, Richards (1982) states that: “Chancediscontinuitiesin
the (viscous)sublayer,with a height (h’) of a few grain diameters,
- 90 -
cause flow separationeddies of up to IOOh’in length.
Sedimentation in these eddies results in incipientripple
formationow This explanationis for the beginning stages of ripple
formation, but gives no convincingreason for the periodic nature of
ripples. It is suggestedthat this periodic nature is related to
internal waves in the bed load. Transport in bed load is not due to
turbulence but to saltationand rolling,and has its own
characteristictype of density gradient (not treated here; see
Savage 1984). In a pyroclasticsurge, it is suggestedthat large
scale bed forms such as dunes and antidunesare related to internal
waves in the suspended load (near the bottom but abo~
where turbulent transportdominates,and smaller sea”
related to internal waves within the thin bed load.
app’
the
sys~
e the bed load)
e ripples are
The connectionof bed forms with internalwaves may have broad
ications for other sedimenttransportsystems. For instance,
above explanationof ripple wavelengthshould hold for water
ems as well as pyroclasticsurges. Bed forms have long been
observed in particulatepipe flows (Kennedy1963; Thomas 1964) where
there is no free surface for waves, thus the bed form periodicity
may be attributedto internalwaves. Also, bed forms in deep marine
environmentsmay be related to internalwaves in the density-
stratifiedwater (Karl et al. 1986).
Migration Direction
Migration directionof bed forms in pyroclasticsurges is
probably related to whether the near-bed region of the surge is

- 91 -
subcriticalor supercriticalrelativeto internalwaves, except
where governed by cohesion in wet surges. This was briefly
addressed by Crowe and Fisher (1973). They proposed that the Froude
number criterion for surges probably applies to an internaldensity
interface. However, as discussed in the preceding section, there is
no evidence for a density interface. Instead,the relevant Froude
number is that given by Equation (2-8). When the near-bed Fr< 1,
downstream migration of bed forms dominates. When Fr > 1, upstream
migration occurs. The transitionfrom supercriticalto subcritical
flow (hydraulicjump) is probably more complex in a flow with
nonlinear but continuousstrati<
interface, and may occur gradua’
abruptly.
PYROCLASTICSURGE FACIES
ication than in one with a density
ly over a short distance rather than
Proximal to Distal Facies Chanqes—
Wohletz and Sheridan (1979)defined three pyroclastic surge
facies: sandwave,massive, and planar. Sandwave facies occurs
proximally and is dominatedby sandwave (or wavy) beds with some
massive beds. Massive facies includesmassive, sandwave, and planar
beds and occurs in medial locations. Planar facies is defined by a
dominance of planar beds with lesser amounts of massive beds, and is
the distal facies. Wohletz and Sheridan (1979) used a
deflation/fluidizationapproach to explain these facies
relationships,where solids in a flowing surge become more
I

- 92 -
concentratednear the base of the surge as it moves away from vent.
According to this model, particle support in surges is due to a
relative upward movement of gases with respect to particles
(fluidization),resulting in a highly expanded,turbulent flow near
source that leaves sandwavedeposits. As gases escape during
lateral transport,degree of fluidizationdecreases,and eventually
deposition occurs only as thin non-turbulentgrain flows to produce
planar beds. Massive beds, then, result from deposition from flow
that Is transitionalbetween highly-fluidizedturbulent sandwave and
non-fluidized,non-turbulentplanar flow and deposition. Thus, in
the model of Wohletz and Sheridan (1979),surge facies are the
result of progressivedeflationof the flow with distance.
An alternativeview taken here Is based on turbulenttransport
In a stratified flow. When a surge is initiatedat the vent, it has
a high veloclty owing to kinetic energy gatned by column collapse,
blast waves (Wohletzet al. 1984), and other near-ventprocesses.
This produces a low Rouse number (Equation(2-2))which increases
with flow distance,giving rise to an increasingnear-bed density
gradient with distance (Figure2-l). Now consider the Richardson
number given by Equation (2-9). As a pyroclasticsurge moves away
from the vent, increasingdensity gradient and decreasing inertial
forces will produce an increase in Ri near the bed and damping of
turbulence. Thus, It is possible to explain the surge facies
changes observed by Wohletz and Sheridan (1979) in terms of a
progressivelyincreasingdensity (grainconcentration)gradient at

-93-
the base of a surge (Fisherand Schmincke 1984, p. 256). Proximal
locations have relativelylow Pn and Ri, and thus are highly
turbulent and deposit a wavy, thin bed load. It is in this region
where bed form processes discussed in the previous section are most
likely. In medial locations,the flows are more stratifiedat the
bottom and less turbulent,forming massive beds. In distal regions,
nearly all the remainingparticle load is at the base and there is a
very strong density stratification. Non-turbulentgrain flow
(Bagnold 1956; Savage 1984; Wohletz and Sheridan 1979) dominates
here, producing reverselygraded planar beds.
Note that the process of increasingparticle concentrationnear
the base of a surge is, in a way, analogousto the deflation process
of Wohletz and Sheridan (1979). However, the mechanisms for
increasing basal concentrationare different. In the model
presented here, increasingbasal concentrationis the result of a
decreasing capabilityof the surge to carry its load by turbulent
transport. In the model presentedby Wohletz and Sheridan (1979),
Increasing basal concentrationIs due to progressive loss of
fluidizing gases. Both processesprobably occur, but as presented
here, turbulence,rather than fluidization,is the dominant
transport mechanism in surges.
Facies Variationsdue to Topography—.
A common feature of pyroclasticsurge deposits is that they are
thicker in topographicallylow areas than on high areas (Wohletzand
Sheridan 1979; Fisher and Heiken 1982; Fisher et al. 1987), and

-94-
commonly show local facles variationsdue to topographywhich are
overprinted on proximal to distal variationsdiscussedabove. This
topographicallycontrolledproperty of surges is evidence for their
density-stratifiednature. Do the followingthought experiment:
follow a parcel of fluid along its streamlinein a non-stratified
flow. When the fluid parcel impingesupon a topographicobstacle,
say a hill, it will move up and over the hill, assuming that the
hill Is Infinite along the horizontalaxis perpendicularto flow.
Now consider the same parcel, but in a stably stratifiedfluid (see
Figure 2-4). When the parcel encountersthe hill, the up-and-over
motion will be retardedbecause this requiresthat the parcel moves
into regions of lower density than itself. For the parcel to
surmount the hill it must have enough kinetic energy upstream of the
hill to counteract the negativebuoyancy. For a given stratified
flow encounteringan obstacle,there will be a level (streamline)
above which all fluid has sufficientenergy to top the obstacle and
below which all fluid either is stopped (blocked)or simply moves
around the obstacle with no upward motion (Figure2-4). This
critical level is referredto as the “dividingstreamline.” The
relationshipbetween upstream kinetic energy, density gradient, and
height (yds) of the dividing streamlinewas due originallyto
Sheppard (1956) and was discussedand tested by Snyder et al.
(1985). It i

I
- 95 -
( :(2-15)
Here, the 1eft-hand side is simply the kinetic energy of a fluid
parcel at the level yds far upstreamof the obstacle. The right-
hand side is potential energy gained by hill overtopping,ym being
defined here as the hi11 height. Although this equation does not
take into account viscous effects and other flow complexities,it
has been very successful in predictingyds in laboratoryexperiments
with low Froude numbers, as shown by Snyder et al. (1985). Equation
(2-15) should not be extended quantitativelyto pyroclasticsurges
without experimentalevidence supportingits applicability,because
it has only been tested on low Froude number flows with linear
density gradients. As discussed earlier, for turbulent transport
systems such as surges, the Brunt-Vaisalafrequency is a function of
height and leads to a wide range of Fr within the flow. However,
the dividing streamlineconcept is useful for visualizingflow
behavior relative to topography. Note that the process of blocking
does not require that the flow be thicker than the height of the
obstacle. It only requires that the flow be internallystratified.
The degree of thickeningin topographiclows reflects two types
of processes. The first is the result of a substratewhere long
axes of low areas are roughly parallel to flow direction. In this
- 96 -
Fiqure 2-4. Blocking in a stratifiedpyroclasticsurge as it
encounters a hill. The dashed line indicatesthe position of the
dividing streamline,which occurs at heightyds (see Equation
2-15). Below yds, material cannot flow over the obstacle and
must either stop or flow around it. In a pyroclasticsurge, this
may lead to thick, massive deposits in topographiclows.

-97-
B I A DS TP YS --------~ “Y----
-[-2-==” “—““‘“~ f ~y---..,c’. : :“; “ . “
“-===?”?= “=7” “ ● . .“”““7“ .: ‘,~”p--y *\ , . . 1 . . “ . , “ ● “ .’ “,”.“’ , .2. ● , . “ “● . ● “* “ ● “ ● . “ ● ●“ “ . . . “ . ..” : , “ ““. .e .
● . ,. . ““ ● . .0 . .’●.”., ,0 .*.
+
. . .. “. .“. ., . . ● “s . ..
● “ .. ● “ . . “ ,“0 ,. .,. “, . .. , “. ● o “, . .
● . . “ . . “ . . ● o “. ●O“
.. . “
“. .0 .
Y
i
- D s

- 98 - .
case, deposits on highs are thinner essentiallybecause they formed
at levels above the maximum-concentrationlower parts of the flow.
In some cases it may be possible to have massive facies in lows and
sandwave facies on highs due to much higher particle concentration
near the base of the flow. The extreme example of this is a surge
moving down a deep canyon, where increasingRouse number causes
lower parts to become dense enough to take on characteristicsof a
pyroclastlc flow (gravitytransformation;Fisher 1983) while the
upper parts leave deposits more typical of surges (e.g.,the 1902
eruptions of Mt. Pelee; Fisher and Heiken 1982).
The second thickeningprocess occurs where surges encounter
ridges or valleys with long axes at high angles to flow direction.
Material below the dividing streamlineis ‘blocked,”and must either
stop or flow around the obstac<
It is easy to visualize how th
the base of such obstacles. A
e while staying at a constant level.
s might lead to a thick deposit at
possible example of blocking is the
occurrence of secondarypyroclasticflows in deposits of the May 18,
1980 blast at Mount St. Helens (Hoblittet al. 1981; Fisher et al.
1987). Apparently, as the blast moved across the South Coldwater
Creek valley, dense pyroclasticflows formed and moved down the
valley almost at right angles to the flow direction of the main
blast, a scenario that can be explainedby blocking. Druitt and
Bacon (1986)
llthic brecc
Crater Lake,
have also discussedthis process and its effects on
a depositionduring the ignimbrite-formingeruptionsat
Oregon.
- 99 -
The Low-Aspect-RatioIgnimbriteProblem——
A subject of recent controversyin pyroclasticgeology has been
the Interpretationof deposits as surges by some workers (e.g.
Fisher and Heiken 1982; Fisher et al. 1987) and as low-aspect-ratio
ignimbrites (LARI)by others (Walkerand McBroome 1983; Walker
1983). The main differencebetween the interpretationsis that
pyroclastic surges are thought of as low-concentrationcurrents
where turbulent transportdominates,as discussed above, whereas
pyroclastic flows that produce LARI’s are consideredto be high-
velocity, high-concentrationcurrentswhere turbulenceoccurs but is
not the principal particle support mechanism. Because of the
significanceof this problem for understandingflow and deposition
mechanisms of pyroclasticsystems, it is addressed here in terms of
stratified flow processes.
The two best studied deposits that fit into the category of
LARI are the Taupo ignimbrite (Wilson 1985) and the deposit of the
May 18, 1980 Mount St. Helens (MSH)blast (Waitt 1981; Hoblitt et
al. 1981; Fisher et al. 1987). While these two deposits differ in
the details of their stratigraphy,they show broad similarities.
Table 2-1 lists the general characteristicsof the deposits,
including terminologyused for their stratigraphy. This listing is
by no means comprehensive,and the reader is directed to the
references given with Table 2-1 for more detailed descriptionsand
granulometricdata. The overall characteristicsof the Taupo
ignimbrite and the MSH deposit can be summarizedas follows. The
- 100 -
lowest parts of the deposits consist of coarse (relativeto
overlying layers) bottom layerswhich occur throughoutmost of the
lateral extents, being thicker in topographiclows than on highs.
The coarse bottom layers are overlain by landscapemantling veneer
deposits which are bedded and comnonly cross bedded. In valleys the
mantling deposit grades laterally
filling deposits. The valley fil’
characteristicsof pyroclasticfl(
1976).
into thicker,massive, valley
ing deposits have flat tops and
w deposits sensu stricto (Sparks
Wilson and Walker (1982)proposed a model for the development
of the various facies of the Taupo ignimbrite. In their model,
coarse bottom layers are formed by explosivejetting of material
from the front of a pyroclasticflow (layerl(P)) and sedimentingof
heavy particles from the head (layer1(L)). Valley fil1 facies
(valley-pondedignimbrite,VPI) representsdeposition from the body
of the flow, and the tail of the flow leaves the mantling veneer
deposit (IVD). Wilson (1985)expanded this model to account for
lateral variations in the Taupo deposit by consideringthe flow to
be a giant fluidizedbed. In this model, easier fluidizedmaterial
such as low-densitypumice and pumiceousash are carried higher in
the flow and deposited furthest from the vent. Wilson (1985)also
discussed the density stratificationthat would be produced by the
fluidized bed scenario,and suggestedthat this would effectively
damp turbulence.
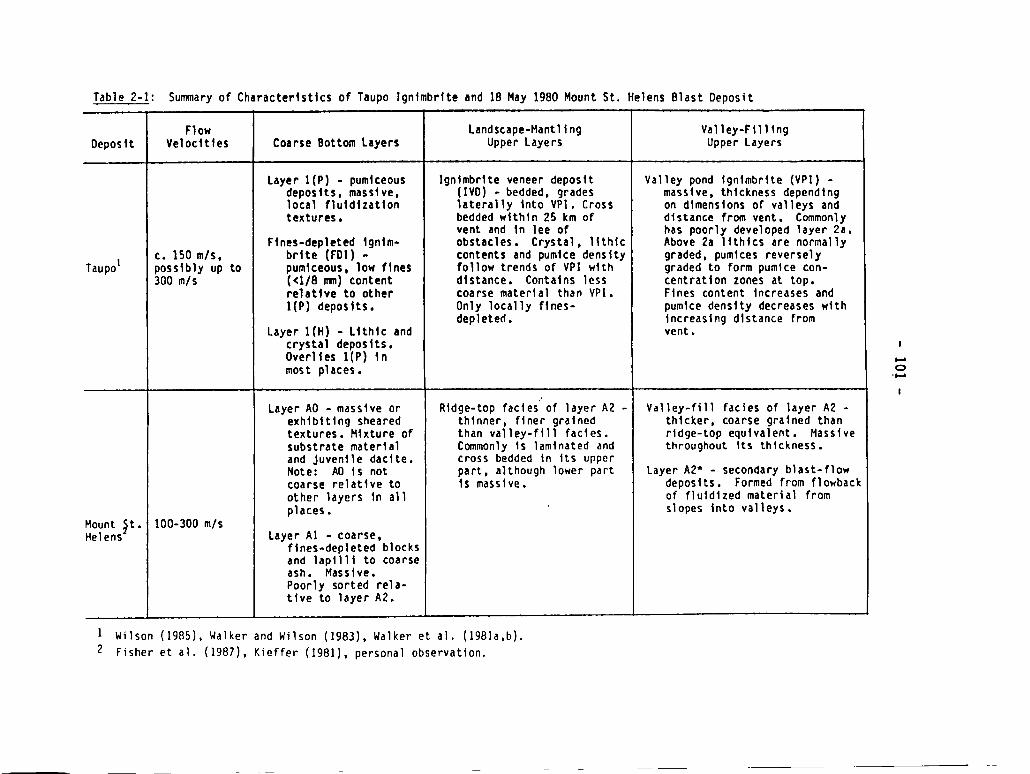
-1o1-
4
‘o2si
i.u4Woao

-1o2-
On the other hand, Fisher et al. (1987)attributedthe MSH
deposits
ascribed
that the
region.
to deposition from an expanded,turbulent surge. They also
certain layers to specificparts of the flow, suggesting
coarse bottom layer is deposited from the back of the head
The landscapemantling and valley filling upper deposits
were both attributedto the body of the flow. The Fisher et al.
model draws direct analogy with known
currents.
A new model is proposed here for
with the above characteristics. This
relationshipsof the various facies.
dynamics of turbidity
the developmentof deposits
model explains only the broad
It is thought that detailed
characteristicsof individualdeposits can be explained in terms of
the general frameworkof this model, taking into account the unique
conditions of each eruption. The model combines ideas of Wilson
(1985) and Fisher et al. (1987). The flow is stratifiedaccording
to particle settling velocity as in the Wilson model, but, as in the
Fisher et al. model, the stratificationis due to turbulent
transport Instead of fluidization. The likelihoodof turbulent
transport for most observed particle sizes has already been
addressed for the MSH blast. While the Taupo ignimbriteis much
more extensive than the MSH deposit, conditionssuch as rugged
topography and high-speedflow (estimatedvelocitiesfor the Taupo
flow are given in Table 2-1) were similar for the two events. In
addition, most of the far-travelledmaterial at Taupo is pumiceous
(Wilson, 1985), and has much lower settlingvelocitiesthan the
- 103 -
dense 1ithic fragmentstransportedby the MSH blast (Figure2-3).
The new model differs from both the Wilson and Fisher et al. models
in that the geometry of a flow (head,body, tail) plays no role in
developing the stratigraphy. Instead, lateral changes in deposition
are related to the interactionsof the turbulent stratifiedflow
with topography
vent. Vertical
the supply rate
and to velocity variationsdue to distance from
changes in depositionare due to time evolutionof
and type of material to the flow.
The model is shown diagranwnaticallyin Figure 2-5. Coarse
bottom layers, called layer 1, are deposited from suspended load
during the high energy waxing phase of the flow event (Figure2-5a).
Blocking occurs in topographiclows to produce thicker deposits
there. As the supply rate of material to the flow begins to
decrease (e.i.,eruption dischargedecreases),remainingparticles
with lower settling velocitiesfall out of suspension (Figure2-5b).
This material may move along the bed as traction carpet or as dense,
small scale flows to produce stratifiedand cross stratified layer 2
veneer deposits that mantle the landscape. Cross stratificationin
the veneer deposit is due to bed form processes discussed earlier.
This type of deposition is typical of more conventionalpyroclastic
surges such as those found around tuff rings. In support of this at
Taupo is the fact that cross stratificationin the veneer deposit
(other than that induced by topography)is found only within about
25 km from the vent (Walkeret al. 1981b;Wilson 1985), which may
correspondto the proximal sandwave facies of Wohletz and Sheridan

- 104 -
consistingof coarse bottom layers (layer 1)
which has a landscape-mantlingveneer facies
valley pond facies. The modelassumes
Figure 2-5. DiagrafmnaticIllustrationof the sequenceof events
leading to a deposit
overlain by layer 2,
and a thick, massive
turbulent transport and resultingstratification. (a) Layer 1 is
deposited during the high-energywaxing phase of the flow.
Deposits are thicker fn valleys due to blockfng below the
dfvfdfng streamline. Durfng this phase most deposition Is
dfrectly from suspension. (b) Layer 2 fs deposited as remafnfng
low-settlfng-velocftymaterial falls out of the wanfng flow.
Bed-1oad movement may produce stratfficatfon,and bed-form
processes dfscussed fn the text produce cross-beddingfn the
veneer deposft. Blocking continuesfn topographiclows,
resultfng in local pyroclasticflows with reverselygraded bases,
pumfce concentrationzones on their tops, and other features
commonly seen fn pyroclastfcflow deposfts. (c) The ffnal
product of the above processes.
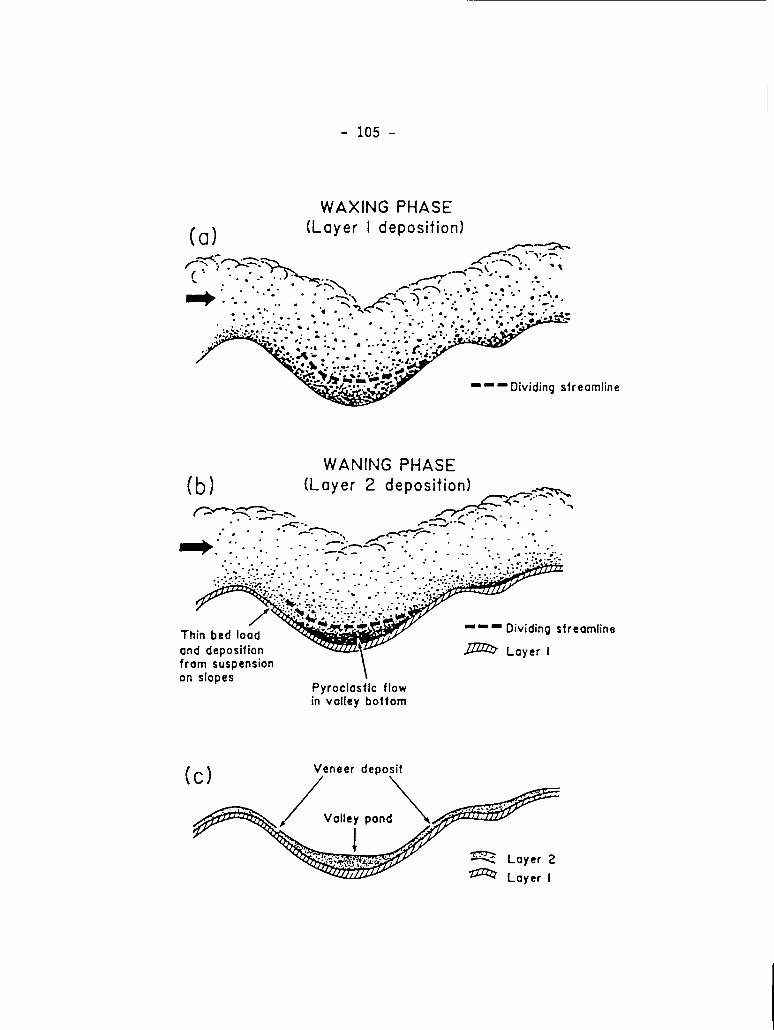
- 105 -
W P
(( I d
.“. .. ● . . -. .. ● . .“,..“., .. *. ●
....
‘ - D s ‘
W P
(b) ( 2 d
.. ... . . . - . - . - . .. - ..
T b l ‘ - D s
a d e~ L If s uo s \
P yfi v b
V d

- 106 -
(1979) discussed earlier In this chapter. Also during the waning
phase, material Is blocked in valleys to form thick, massive layer 2
deposits. Note that while material in the valley ponds may have
moved as pyroclastic flows within individualvalleys, particleswere
transported from the vent to the valleys by turbulence. This
contrasts with the model of Wilson and Walker (1982).
Note that in this model fluidizationtextures such as fines-
depleted pipes and patches (Wilson1985) are formed mainly after
deposition or during the very final stages of deflation of a
deposit. One objection that may be raised to this model is that the
deposits are too poorly sorted to have been formed from a low
concentrationsuspension. However, it is not clear that deposition
from suspended load would lead to good sorting. For example, recent
experimentsby Ghosh et al. (1986)suggest that the sorting of such
deposits may closely reflect the sorting of the actual suspended
load.
SUMMARY
The results of this study are summarizedbelow.
1. Turbulent suspensiontransport is likely for many
pyroclastic currents, includingthe May 18, 1980 blast at Mount St.
Helens. This is especiallytrue if the flows are initiatedat sonic
or supersonicvelocities.
2. Surge bed forms may be related to internalwaves.
Decreasingbed form wavelengthwith flow distance reflects a similar
- 107 -
relatlon between minimum wavelengthof internalwaves and the
distribution Rouse number. Dunes and ripples are related to
internal waves In the bottom of the suspended ‘
load, respectively. Bed form migration direct
internal Froude number.
oad and In the bed
on is related to the
3. The proximal to distal facies progressiondescribed by
Wohletz and Sheridan (1979)can be explalned in terms of changing
density stratificationwith flow distance. Namely, the increasing
Richardson number with flow distance results In progressivedamping
of near-bed turbulence.
4. Surge deposits in topographiclows may be thicker and more
massive than on topographichighs, reflectingtwo processes. The
first occurs when the long axis of relief is at low angles to the
flow direction. In this case, relativelythick and massive deposits
form in depressionsbecause the particle concentrationhigher there.
Second, when the long axis of relief is at high angles to the flow
direction, blocking of denser material may produce massive
pyroclastlc flows that move down slope, possibly independentof the
overall flow direction of the overridingsurge.
5. Deposits which have been termed both “pyroclasticsurgeM
and “low-aspect-ratioignimbrite,”such as at Mount St. Helens and
Taupe, can be explained by a general model incorporatingturbulent
transport, stratified flow, and time evolutionof the eruptive
events. Coarse bottom deposits representdeposition from suspended
load during the initial high-energy (waxing)phase of the eruption.

- 108 -
Finer-grainedand bedded upper layers representdepositionof
remaining fine material as the eruptive event wanes. Massive valley
deposits are due to blocking.

- 109 -
APPENDIX 2A: DEFINITIONOF NOTATION FOR CHAPTER 2
Symbol Definition Dimensions
d
ddl
Fr
9
k
ks
N
Pn
Pni
Ri
s
Total flow thickness
Boundary layer thickness
Froude number
Gravitationalacceleration
Von Karman constant (=0.4)
Height of roughnesselement
Brunt-Vaisalafrequency
DistributionRouse number
Particle Rouse number
Richardsonnumber
Particle volume concentration
L
L
--
LT-2
--
L
T-1
--
--
--
--
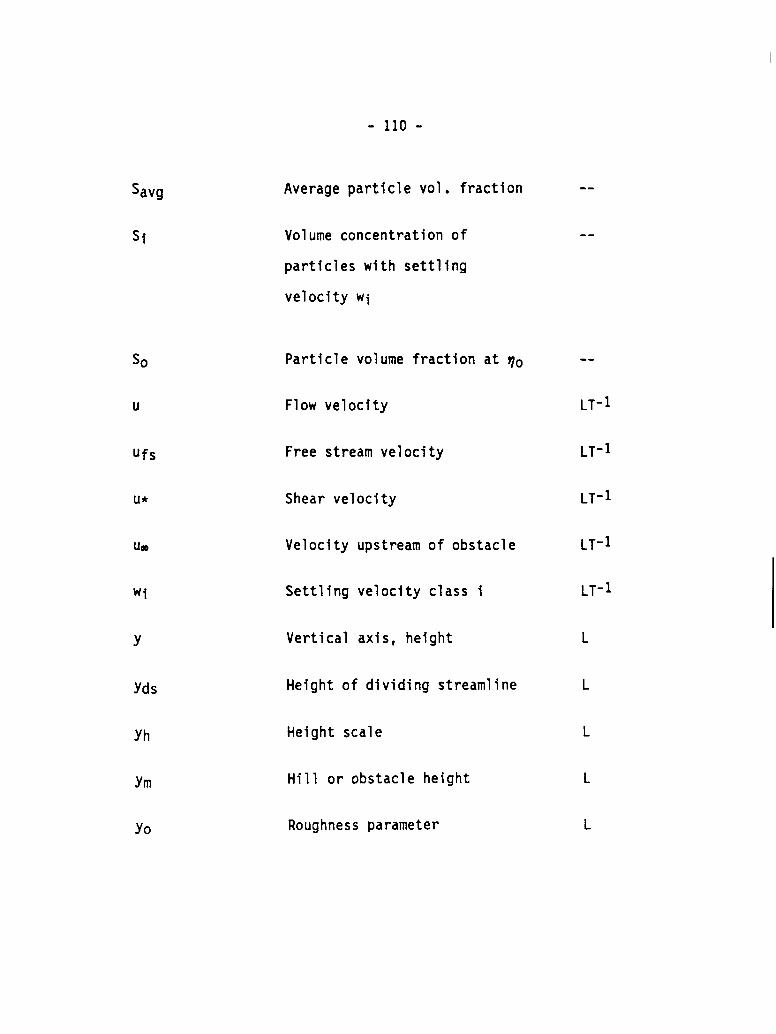
Savg
Sf
S
u
Ufs
U*
Um
W
Y
Yds
Yh
Ym
Yo
- 110 -
Average particle vol. fraction
Volume
partic’
veloci<
concentrationof
es with settling
y W
Particlevolume fraction at q.
Flow velocity
Free stream velocity
Shear velocity
Velocity upstreamof obstacle
Settling velocity class i
Vertical axis, height
Height of dividing streamline
Height scale
Hill or obstacle height
Roughnessparameter
--
.-
--
LT-l
LT-1
LT-1
LT-l
LT-1
L
L
L
L
L
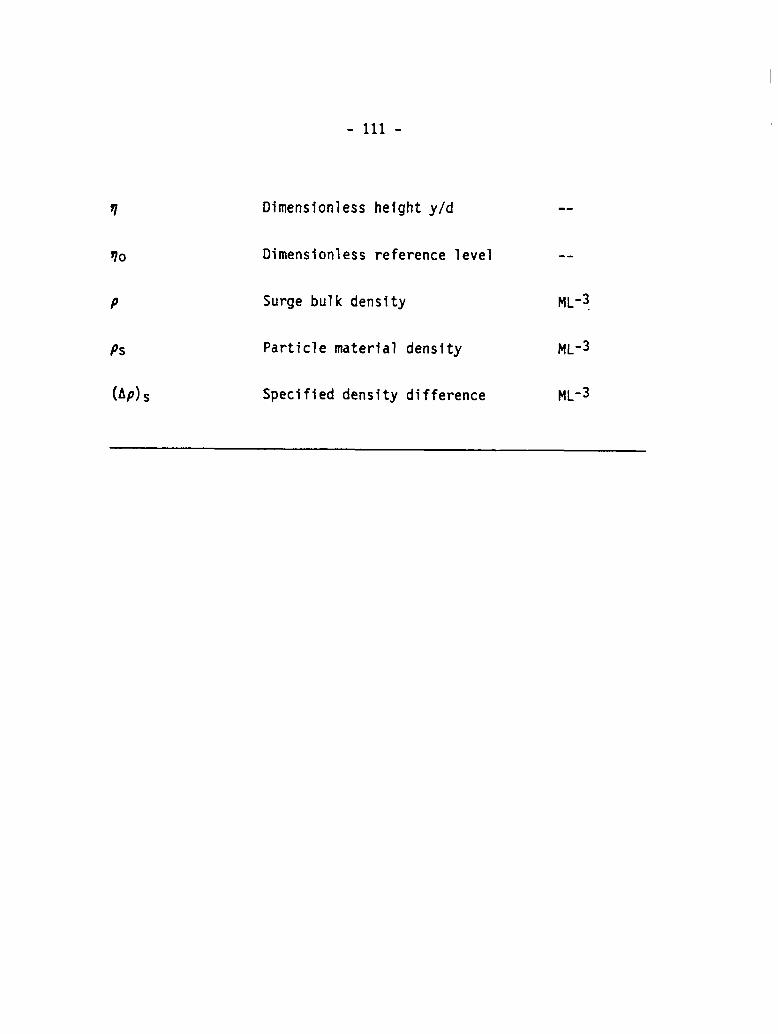
- 111 -
7 Dimensionlessheighty/d --
70 Dimensionlessreferencelevel --
P Surge bulk density ML-3,
Ps Particlematerial density ML-3
(Ap)~ Specifieddensity difference ML-3

- 112 -
CHAPTER 3: NUMERICALMODELS OF PLINIAN ERUPTION
COLUMNS AND PYROCLASTICFLOWS
INTRODUCTION
This chapter reports a second step in applicationof numerical
solution of the time-dependent,nonlinear,multiphasehydrodynamics
equations to explostve volcanicphenomenaassociatedwith Plinlan
eruptions. The first step Is presented In the paper by Wohletz et
al. (1984),which outlines an overall evolutionof caldera-related
eruptions. In this evolutionarysequence,a dike of volatile-rich
magma is catastrophicallyexposed to the atmosphere,producing an
initial phase of unsteady flow characterizedby shocks propagating
Into the atmosphereand rarefactionspropagatingdown the conduit.
This initial phase, during which ash is driven out of the vent and
laterally across the landscapelargelyby the pressure fluctuations
associatedwith blast waves, has been discussed in referenceto the
Peach Springs Tuff eruption in Chapter 1. The blasting phase
eventually comes to an end with the developmentof steady discharge
from the vent, which is characterizedby the developmentof ash
plumes and pyroclastic flows. This chapter is devoted to modeling
the first few minutes of steady discharge.
To develop perspectivefor the model results, previous modeling
of steady eruption columns is briefly reviewed. Descriptionof the
hydrodynamicsequations used in the models is followed by analysis
of the 51 numerical experiments. Dimensionlessratios are used to
- 113 -
analyze the effects of various forces on eruption dynamics.
Finally, I discuss implicationsof the modeling for developmentof
pyroclastic flows and associateddepositionalfacies variations.
Previous Modeling
Modeling of explosive volcanic eruptions has become popular
over the past twenty years with developmentof quantitativefield
techniques for the study of pyroclasticdeposits. The fact that
most large eruptions have not been witnessed and recorded has
spurred modeling efforts to obtain an understandingof eruption
processes responsiblefor various types of tephra deposits. With
respect to Plinian eruptionsmost modeling has been based upon
entrainmenttheory of turbulentjets and plumes. In the first
treatment of columns using this approach,Wilson (1976) uses a
single-phase,incompressible,turbulentjet model from Prandtl
(1949)with modificationsto account for gravity and thermal effects
of entrained particles. Wilson’s treatment solves the equations for
conservationof mass and momentum involving Prandtllsempirical
relations for the rate of entrainmentof ambient air (reflectedin
the assumed rate of widening of the jet with height). This approach
assumes that pressure in the column at any given elevation is in
perfect equilibriumwith the ambient pressure. Sparks and Wilson
(1976) and Sparks et al. (1978)extended the turbulent plume
treatment to include the conditionsunder which entrainmentof
ambient air, which produces buoyancy in a column, is not sufficient
- 114 -
to thrust the column higher by convection,and the column collapses
at the top of the gas thrust (jet) region to form pyroclasticflows.
In an effort to quantify the dynamics of Plinian eruption
columns in the convectivethrust region,which comprisesmost of the
height of Plinian column, Settle (1978)and Wilson et al. (1978)
apply the empirical formula of Morton et al. (1956)for
incompressible,convectiveplumes. This approach involves a power
law relationshipbetween mass discharge rate and eruption column
height, namely H Q D1/4, where H is the height of the column top and
D is the mass discharge rate of magma. Jakosky (1986) raises some
questions about this relation,suggestingthat it may be somewhat
fortuitousdue to the simplificationsinvolvingthe atmospheric
lapse rate and the use of the visible cloud top instead of the mass-
averaged cloud top for the value of H. Sparks and Wilson (1982)
apply the same type of Incompressibleturbulentplume theory to the
1979 eruptions of Soufriere,using an empiricalentrainmentconstant
(similarto a mixing length). This approach is extended by Wilson
and Walker (1987),who account for atmosphericwind, and applied to
tephra dispersal. Sparks (1986)refines the theory of eruption
plumes within the frameworkof turbulent,incompressibleconvection,
and includes climatic effects. Carey and Sparks (1986) apply the
refined theory to tephra dispersal.
The May 18, 1980 blast at Mount St. Helens brought attentionto
the importanceof compressiblefluid dynamic processes in volcanic
jets. With this focus, Kieffer (1981)applied experimentally
- 115 -
observed jet dynamics to that eruption,and discussed the effects of
exit pressures that exceed local ambient pressure. The jet is then
characterizedby complex patterns of rarefactionwaves and shocks.
To further this concept, Kieffer and Sturtevant (1984)present
results of laboratoryexperimentson single phase (one material)
jets that are thermodynamicallysimilar to multiphase volcanic
products within a single-phase(pseudogas)approximationscheme.
These experimentsprovide importantinsight into effects of jet exit
pressure and mixture density.
In summary, previous work on eruption columns consists of two
general approaches. The first is to model the effects of turbulence
and gravity but to neglect the thermodynamicsof the flows. The
second is to examine the thermodynamicsof the flows but neglect
turbulence and gravity. Also, both approacheshave essentially
considered the flows as single-phasefluids with propertiesmodified
by the presence of particles. In an effort to close the gap between
the two approaches, I have modeled the compressible,two-phase flow
in a gravitationalfield. Although a crude approximationof
turbulenceeffects is included,this approach does not strictly
model turbulenceand related diffusiveprocesses. This next step
awaits developmentof a theory of turbulent,two-phase,compressible
flow.
The modeling effort reported here has been continuedwith the
opinion that use of empiricalentrainmenttheory, derived from
incompressibleflow experiments,is problematicand may be

- 116 -
misleading. This problem is due to the strong dependenceof mixing
upon Mach number in shear flows -- namely that entrainmentrates
decrease substantiallywith increasingMach number (Brownand Roshko
1974). Basic similarityconsiderationsshow that it is not
satisfactoryto model volcaniceruption columns as incompressible
flows either theoreticallyor in the laboratory. Column velocities
of several hundreds of meters per second are typical of Plinian
eruptions. Kieffer and Sturtevant (1984)show that with moderate
solid particle concentrations,the sound speeds of the eruptive
mixtures are less than several hundred meters per second. So, in
general, the Mach number effect should not be neglected and the full
conservationof energy equationmust be solved along with continuity
and conservationof momentum to make a reasonablemodel.
THEORETICALAPPROACH
Governing Equations
A comprehensivereview of mathematicaland numerical techniques
for multiphase flow is given by Stewart and Wendroff (1984). The
approach taken here is to solve the full set of two-phase,
compressibleNavier-Stokesequations for injectionof a hot,
particle-ladengas into a cool, density-stratifiedatmosphere. The
geometry of the problem is shown in Figure 3-1. Each phase is
modeled as a continuum,one being compressible(gas phase) and the
other incompressible(solidphase), using the formulationgiven by

- 117 -
Harlow and Amsden (1975). In this situationthe governing equations
in vector form are:
&(esPs) + b(&7JJ = o
+ ?.(egpgtg)= o+ (
(3-la)
(3-lb)
@5ps&)+ h(t?spstisi?s) = -Ostp + KS(A;)
+ espsz - +*Ts (3-2a)
+ ij. ( e= +J?P + Kg(A:)+ (
+ egpg; - bTg (3-2b)
~ + ~ . ( , g- ,g?.i!g]= -1.wegij+%k) +
+ IKgI (Ai!)2- rg:?;g (3-3b)
Subscripts s and g refer to the solid (pyroclast)and gas phases of
the flow, respectively. O is volume fractionof a given phase, p i

- 118 -
the material density, i Is velocity,p is the pressure of the gas
phase, K is the momentum transfer (drag) function,~ is the
gravitationalacceleration,r is the viscous stress tensor, I is
specific internal energy, and R is the interphaseheat transfer.
Finally,At, the slip velocity, is given by At = ;9 - is. All
symbols and their definit
Equations 3-la,b are
phase, respectively. Equ(
ons are listed in Appendix 3A.
conservationof mass for the solid and gas
tions 3-2a,b are conservationof momentum.
In Equation 3-2a, note that the pressure term representsthe
acceleratingforce on the particle phase due to the gas pressure
gradient. Since the pyroclastsare assumed to be dispersed,with
negligibleparticle-particleinteractions,a pressure for the solid
phase vanishes. For both phases, conservationof specific internal
energy (Equations3-3a,b) includeseffects of interphaseheat
transfer and viscous dissipation. In additionto these, the
specific internalenergy of the gas phase is influencedby pressure
work and energy produced by interphasedrag. The numerical
approximationof these equations is discussed in Appendix 3D.
Equations 3-1,2,3 are very similar to those applied to the
blast phase of explosiveeruptionsby Wohletz et al. (1984), with
the exception of terms involvingheat conductionwithin the gas
phase and viscous effects. Appendix 3E summarizesscaling arguments
that show intraphaseheat conductionto be minor compared to other
forms of energy transfer in Equations3-3a,b. Building upon the

- 119 -
modeling of Wohletz et al. (1984)a stress tensor is included in the
momentum and energy equations,taking the form
r= -
o
2:
o
This expression is appropriatefor two-d
coordinates,r being the radial distance
z being vertical distance above the vent
[%+ Ho ● (3-4)
mensiona’ cylindrical
from the symnetry axis and
exit plane (simplifiedfrom
Bird et al. 1960, p. 89). Because the Reynolds number for these
flows is very large (-1010or larger, see Appendix 3E), the
contributionof stress from “molecular”viscosity (which is
influencedby the presence of particles) is negligible. However,
such h
flows,
diffus
stated
gh Reynolds numbers indicatethat turbulence is likely in the
in which case it is necessaryto consider turbulence-induced
on of transportquantities (mass,momentum, and energy). As
earlier a detailed model of compressible,multiphase
turbulence has not been developed,so as a crude approximationa
mixing-lengthapproach has been used to determine effective
turbulence viscosity. This approach is useful in many cases (see,
for example, Chapter 2 and Valentine 1987), but can be dangerous if
care is not used, since it relies on an analogy between turbulent

- 120 -
Figure 3-1: Geometry of problem and the computationaldomain. The
flow field is computed for a 7 x 7 km area above and laterally
away from the vent, with the computationaldomain discretized
into 100 x 100 m cells (toroidsin three dimensions,since a
cylindricalgeometry is assumed) for finite-difference
approximationof Equations3-1,2,3. The outer ‘frame”of cells
are used for specificationof boundary conditions. See text for
discussion.

rx,
–––––+
&–
—–———T
H g-I1$uP0W
LT
-121
-
I
Ll
——
T
\l ~––––——
——
——
——
Exf-
A .‘t-L
-(1(
/
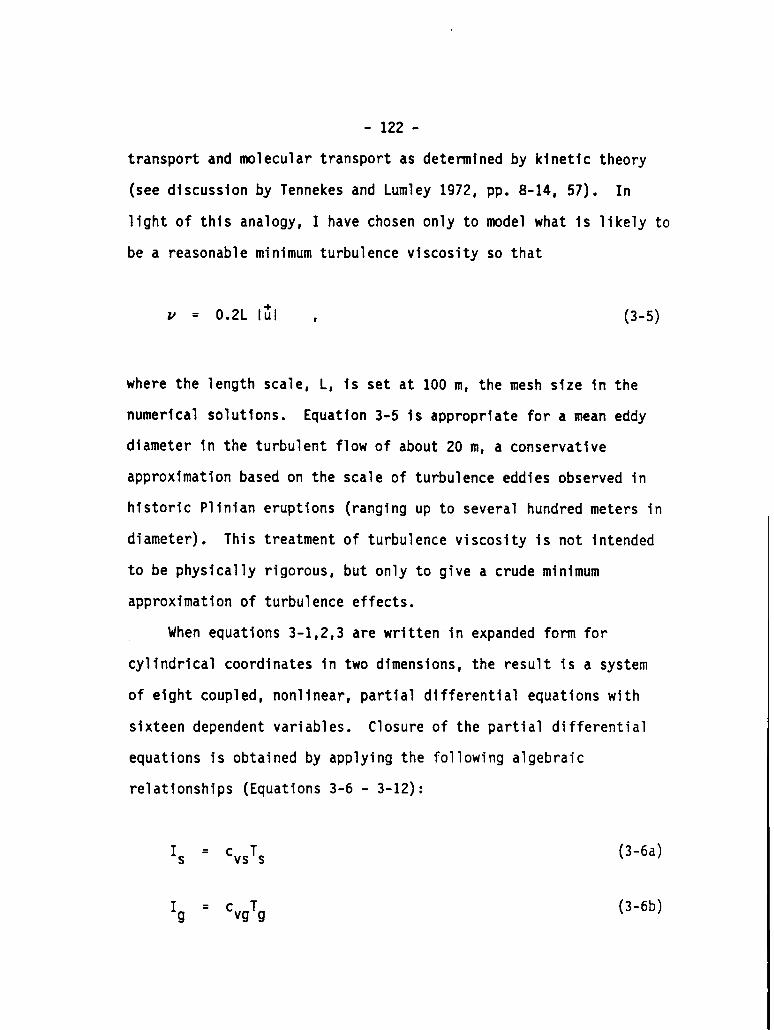
- 122 -
transport and molecular transportas determinedby kinet~c theory
(see discussionby Tennekesand Lumley 1972, pp. 8-14, 57). In
light of this analogy, I have chosen only to model what is likely to
be a reasonableminimum turbulenceviscosityso that
v = 0.2L 1;1 , (3-5)
where the length scale, L, is set at 100 m, the mesh size in the
numerical solutions. Equation 3-5 is appropriatefor a mean eddy
diameter in the turbulent flow of about 20 m, a conservative
approximationbased on the scale of turbulenceeddies observed in
historic Plinian eruptions (rangingup to several hundred meters in
diameter). This treatmentof turbulenceviscosity is not intended
to be physically rigorous,but only to give a crude minimum
approximationof turbulenceeffects.
When equations3-1,2,3 are written in expanded form for
cylindricalcoordinatesIn two dimensions,the result is a system
of eight coupled, nonlinear,partial differentialequationswith
sixteen dependent variables. Closure of the partial differential
equations is obtained by applying the followingalgebraic
relationships(Equations3-6 - 3-12):
15 = CV5TS
19=cT Vg g
(3-6a)
(3-6b)

- 123 -
P= ( - l
e = 1 - es9
K = -KS9
‘9 = -Rs
(3-7)
(3-8)
(3-9)
(3-lo)
Equations 3-6a,b are the thermal equationsof state for each phase,
with C a c being the speclflc heats at constant volume for
the solid and gas phases, respectively. Specific heats are treated
as constants (for values see Appendix 3B). Equation 3-7 is the
mechanical equation of state for the gas phase, with 7, a constant,
being the ratio of specific heats at constant pressure and constant
volume of the gas. Equation 3-8 relates the volume fraction of the
gas phase to that of the solid phase. Equations 3-9 and 3-1o state
that momentum and heat transfer between phases are coupled in such
a manner that a gain in momentum/heatby one phase is the result of
loss of momentum/heatin the other phase.
The functions Ks and Rs are given by
3 o s p g+Ks = 16rs Iul (3-11)
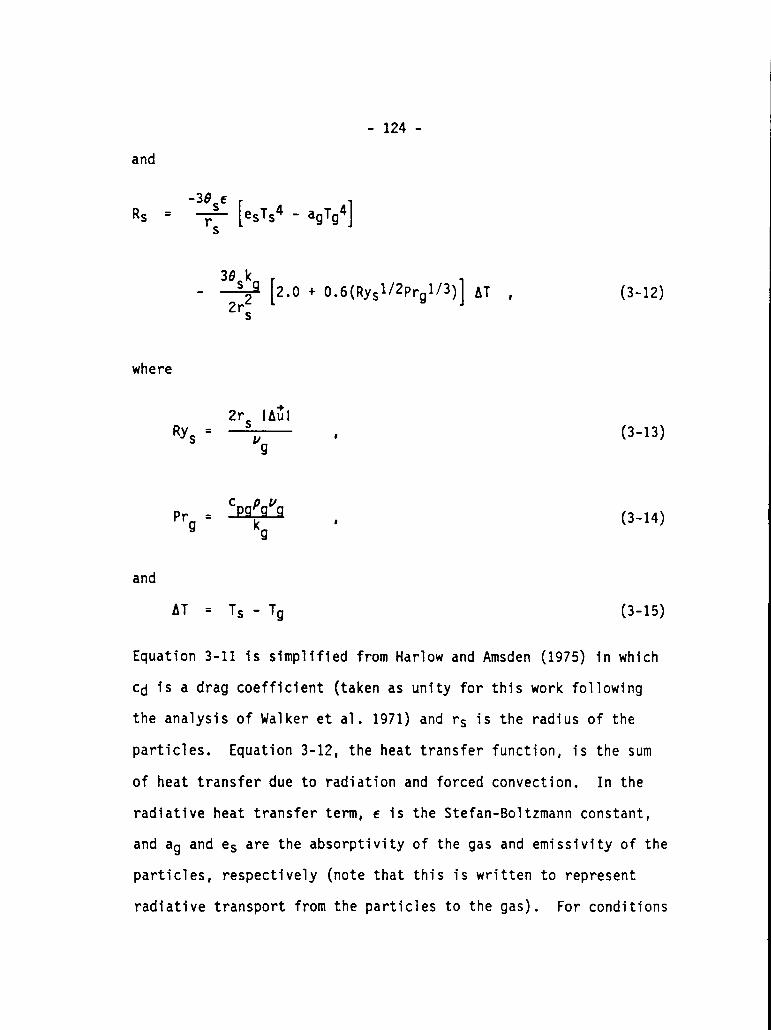
- 124 -
and
-3e~eR~ = ~ [esTs4 - agTg4
s I
[2.0+().6(Ry5@rgl/3)] AT t2r~
where
Zrs IA~lRy5 = t
‘9
cpqPguqPr =9 kg
(3-12)
(3-13)
(3-14)
and
AT = Ts - Tg (3-15)
Equation 3-11 is simplifiedfrom Harlow and Amsden (1975) in which
cd is a drag coefficient (takenas unity for this work following
the analysis of Walker et al. 1971) and rs is the radius of the
particles. Equation 3-12, the heat transfer function, is the sum
of heat transfer due to radiationand forced convection. In the
radiative heat transfer term, c is the Stefan-Boltzmannconstant,
and ag and es a the absorptivityof the gas and emissivityof the
particles, respectively(note that this is written to represent
radiativetransport from the particlesto the gas). For conditions
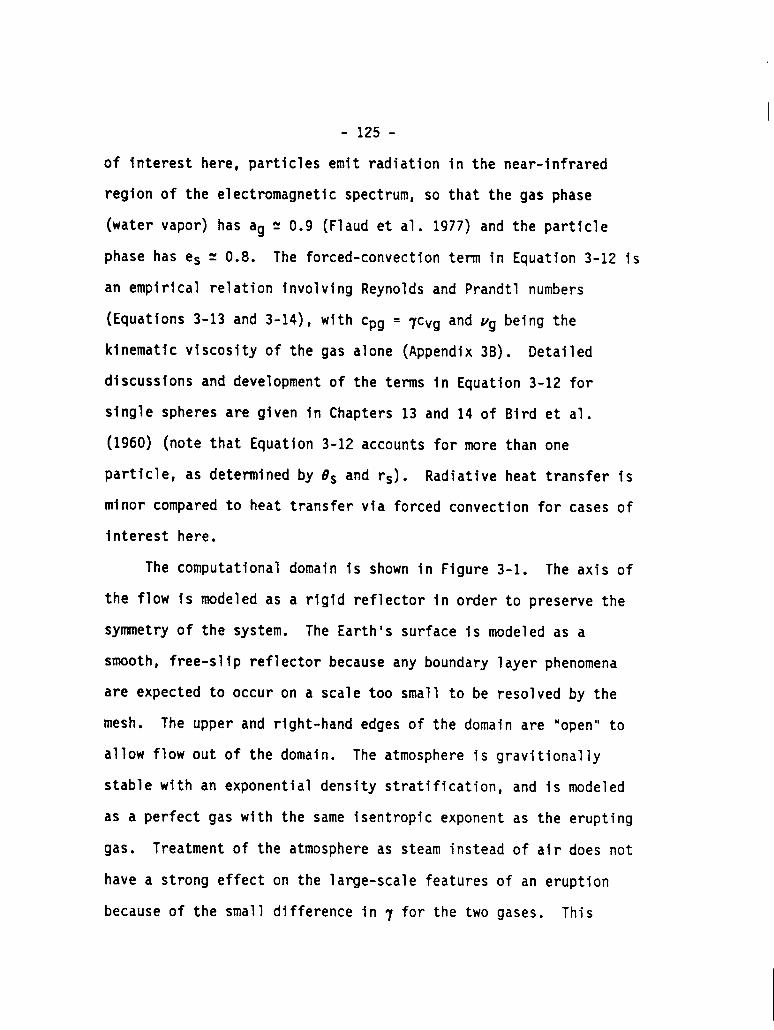
- 125 -
of Interest here, particlesemit radiat
region of the electromagneticspectrum,
on in the near-infrared
so that the gas phase
(water vapor) has ag s 0.9 (Flaudet al. 1977) and the particle
phase has es = 0.8. The forced-convectionterm in Equation 3-12 is
an empirical relation involvingReynoldsand Prandtl numbers
(Equations3-13 and 3-14), with Cpg = 7cvg and Vg being the
kinematic viscosityof the gas alone (Appendix3B). Detailed
discussionsand developmentof the terms in Equation 3-12 for
single spheres are given In Chapters 13 and 14 of Bird et al.
(1960) (note that Equation 3-12 accounts for more than one
particle, as determinedby 0s and rs). Radiativeheat transfer i
minor compared to heat transfer via forced convectionfor cases of
interest here.
The computationaldomain is shown in Figure 3-1
the flow is modeled as a rigid reflectorin order to
symnetry of the system. The Earth’s surface is mode’
The axis of
preserve the
ed as a
smooth, free-slip reflectorbecause any boundary layer phenomena
are expected to occur on a scale too small to be resolved by the
mesh. The upper and right-handedges of the domain are “open” to
allow flow out of the domain. The atmosphereis gravitionally
stable with an exponentialdensity stratification,and is modeled
as a perfect gas with the same isentropicexponent as the erupting
gas. Treatment of the atmosphereas steam instead of air does not
have a strong effect on the large-scalefeatures of an eruption
because of the small difference in 7 for the two gases. This
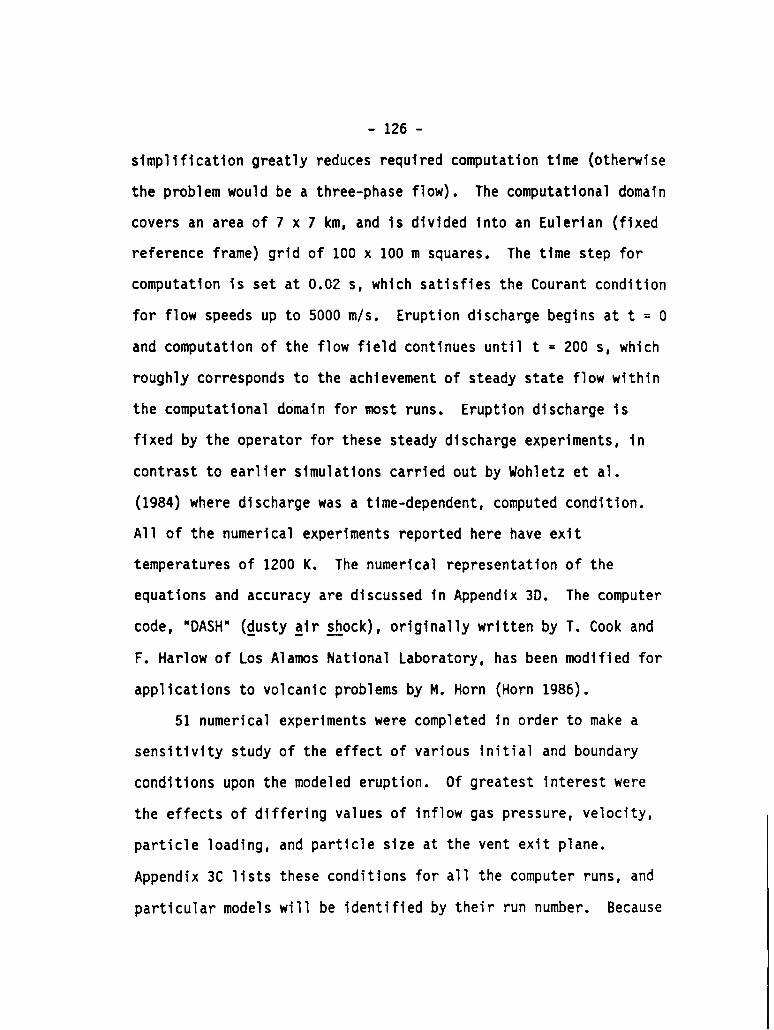
- 126 -
simplificationgreatly reduces requiredcomputationtime (otherwise
the problem would be a three-phaseflow). The computationaldomain
covers an area of 7 x 7 km, and is divided into an Eulerian (fixed
reference frame) grid of 100 x 100 m squares. The time step for
computation is set at 0.02 s, which satisfiesthe Courant condition
for flow speeds up to 5000 m/s. Eruptiondischargebegins at t = O
and computationof the flow field continuesuntil t = 200 s, which
roughly correspondsto the achievementof steady state flow within
the computationaldomain for most runs. Eruptiondischarge <
fixed by the operator for these steady dischargeexperiments
s
in
contrast to earlier simulationscarried out by Wohletz et al.
(1984)where dischargewas a time-dependent,computed condition.
All of the numerical experimentsreportedhere have exit
temperaturesof 1200 K. The numericalrepresentationof the
equations and accuracy are discussed in Appendix 3D. The computer
code, “DASH” (gustyAir shock), originallywritten by T. Cook and—
F. Harlow of Los Alamos National Laboratory,has been modified for
applicationsto volcanic problems by M. Horn (Horn 1986).
51 numericalexperimentswere completed in order to make a
sensitivitystudy of the effect of various initial and boundary
conditions upon the modeled eruption. Of greatest interestwere
the effects of differing values of inflow gas pressure, velocity,
particle loading, and particle size at the vent exit plane.
Appendix 3C lists these conditionsfor all the computer runs, and
particular models will be identifiedby their r n Because

- 127 -
the solutions obtained are listed by the computer for each variable
given above and for each computationalcell and time step, a large
volume of numerical results were generated. Each run produced more
than 500 pages of pr~nted data. Graphics programs were written to
produce six r-z contour plots of 0s, log 6s, p p, T a T f
each time step. T additionalr-z vector plots show us and ~g.
More than 400 plots were recorded for each run. Each run required
about 2.5 hours of Cray-1 time (note that this machine vectorizes
arrays and operates at a rate of about 108 floating point
operations per second).
DimensionlessParameters
The approach for study of the large volume of numerical data
generated by these experimentsconsists of non-dimenslonallzation
of data in order to compact and compare it. The dimensional
analysts given here pertains to terms In the momentum equations
(3-2a,b) as defined by exit conditions,and as such lends insight
Into the interplayof forces acting on an eruption column as It
exits the vent. Because of the simplificationsinherent in the
model, the actual values of the dimensionlessparameters cannot be
extrapolatedto natural eruptions. Relative variations in the
parameters, however, can be used to understandprocesses in a
natural eruption.
I focus on those variables that effect the large-scale
behavior of eruption columns. Examinationof the momentum
equations (3-2a,b)reveals four different types of forces: (1)
I

inertia, (2) pressure
gravitation. Forces
- 128 -
gradient, (3) Interphasedrag, and (4)
nvolvingmolecularor “dusty-gas”viscosity
are negligiblecompared to these forces, as shown in Appendix 3E,
and the effects of the turbulenceviscosityare not consideredin
this discussion. The pressure gradient at the vent can be
representedby the differencebetween exit pressure and local
atmosphericpressure. Interphasedrag or momentum coupling can be
representedby the settling velocityof particles,with low
settling velocitiesreflectinggood coupling. Gravitationalforces
acting on an eruption column are determinedby the density
differencebetween the eruptingmixture and the ambient atmosphere,
and the size scale of the column which is measured by the vent
radius. Gravitationalforces thus can be also called buoyancy
forces, since an eruption column exiting with a bulk density equal
to that of the atmospherewill experienceno downward acceleration
from gravity.
All these effects are put into ratios to form the following
parameters:
Pe - ‘atmTgm =(Pm - Patm)gRv ‘
wPn = s<’
(3-16)
(3-17)

- 129 -
Pmv:Rim =
IPm - Patm)9Rv “(3-18)
For these equations,subscripte refers to conditionsat the vent
exit plane, ve being the initial vertical velocity (both phases are
assigned equal velocitiesat the exit), and ws being the terminal
velocity of the particles. Terminal velocity is arrived at by
balancing gravitationaland drag forces on a particle so that,
within the simplifiedtreatment in this chapter,
[ ~
16rsg(ps - p ) 1/2w=s .
3cdpg(3-19)
The mixture density is determinedby pm = 6 + d Rv is the
vent radius. In words, Tgm, here referred to as the
“thermogravitationalparameter,”is a ratio of thermodynamic
(pressure)driving forces to buoyancy forces; Pn, the Rouse number,
is a ratio of clast settling velocity to upward flow velocity; and
the Richardsonnumber, Rim, is a ratio of inertial forces to
buoyancy forces. The subscriptm indicatesthat these parameters
are defined in terms of the propertiesof the erupting mixture.
For very small particleswith low values of the Rouse number, the
mixture will behave nearly as a single continuum,since the
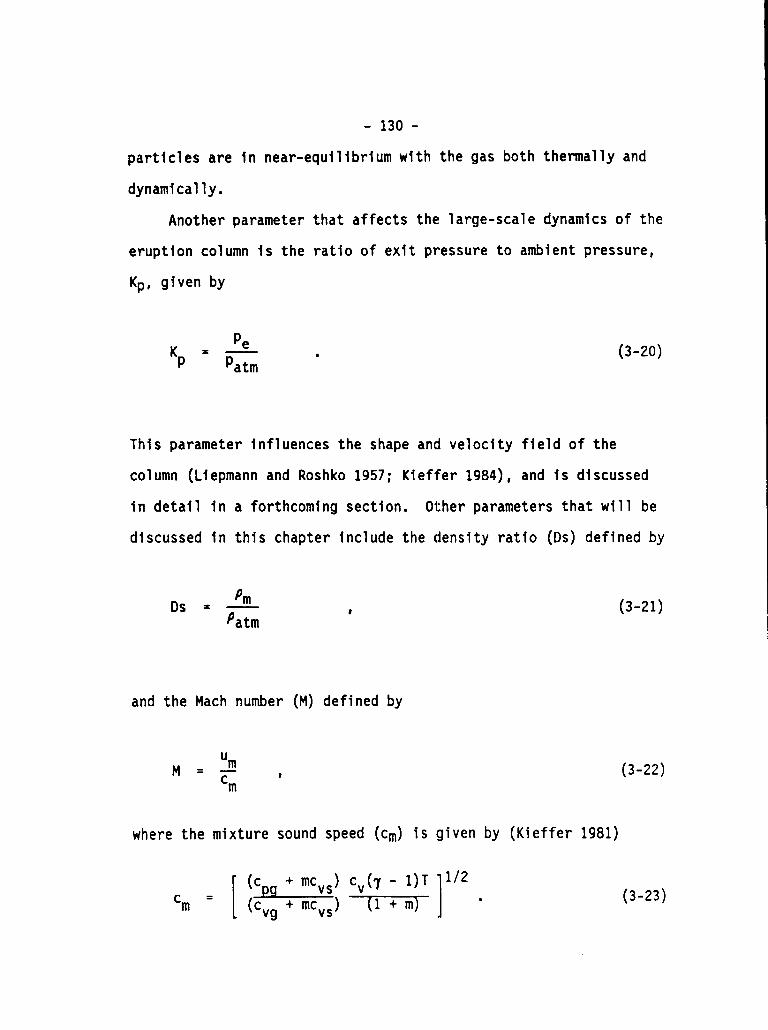
- 130 -
particles are in near-equilibriumwith the gas both thermallyand
dynamical1y.
Another parameter that affects the large-scaledynamics of the
eruption column is the ratio of exit pressure to ambient pressure,
Kp, given by
PeK=—P ‘atm “
(3-20)
This parameter influencesthe shape and velocity field of the
column (Liepmannand Roshko 1957; Kieffer 1984), and is discussed
in detail in a forthcomingsection. Other parametersthat will be
discussed In this chapter include the density ratio (Ds) defined by
PmOS = —Pat~
t (3-21)
and the Mach number (M) defined by
uM=m q # (3-22)
w t m s speed (cm) is given by (Kieffer1981)
[q
(c + mcvs) C - l)T 1/2cm= (C:gJ+ (1+md . (3-23)

In this equation,m Is
number as defined here
- 131 -
the mass ratio
only holds for
of solids to gas. The Mach
small particleswith low Pn,
so that the mixture can be approximatedas a single continuum
(pseudogas). Note that urnin Equation3-22 is the magnitude of
velocity of the mixture, implyingthat there is no slip between
phases. For runs where particles are larger than 10-4 m (above
the
which slip velocitiesexceed about 10% of the gas velocity),M is
not calculated.
Dimensional and dimensionlessparametersfor all runs reported
in this chapter are tabulated in Appendix 3C. Included in Appendix
3C are values of mass discharge rate of magma (D = rRv2Pmve) for
comparisonwith previouslypublished values.
GENERAL FEATURES OF THE
Definition of some
various features of the
for an example eruption
NUMERICAL EXPERIMENTS
terminologywill facilitatedescriptionof
model runs. These terms are illustrated
in Figure 3-2. The “column”designates the
main vertical part of the eruption flow field above the vent. The
“working surface” is at the top of the column, where large-scale
vorticity and an increaseddiameter result from the columnts
penetration into the atmosphere. This term is adapted from
Blandford and Rees (1974)and Norman et al. (1982),who have
modeled the structureof high-speedjets 1
applications. When a column does not co’
to as a “Pliniancolumn,” in contrast to
for astrophysical
lapse it will be referred
a “fountain”that develops
- 132 -
when a column collapses. The laterally-moving,ground-huggingflow
that results from a fountain is called the ‘pyroclasticflow.” The
word “flow” will be used to describe fluid motions in general
unless it is preceded by “pyroclastic,”which restricts it to the
above definition. “Pyroclastic-flowhead” is the front of a
pyroclastic flow.
Two example numericalexperimentsare shown in Figures 3-3 and
3-4. The plots show several types of information. Contours of the
logarithmof ash volume fraction (0s), each contour being an order
of magnitude different from neighboringcontours,give an idea of
the morphology of the cloud and the distributionof particles. The
innermost contour,where most of the ash in a given eruption
resides, correspondsto 0s at the exit plane. The velocity field
of the solid phase is superimposedon the volume-fractionplots.
Velocity vectors are drawn outward from the center of each
computationalcell in the directionof flow and with length
proportionalto flow speed. The combined @s-velocityplots are
especially useful because they give informationabout the shape and
motion of the eruption cloud, which can be compared to observed
natural eruptions. Pressureand density contours are shown for the
compressible (gas)phase, and temperaturecontours of the solid
phase are also given. Plots of gas temperatureand velocity are
not shown here but are very similar to the correspondingones for
the solid field except where the particlesare relativelycoarse.

- 133 -
The eruption discharge begins at time zero. The fast flow of
dense material into the atmosphereresults in an initial
compressionpulse that travels away from the vent as a
hemisphericalwave. Gas density and pressure plots at early times
display this pulse. In this numericalmodel, the pressure signal
is diffused over several computationalcells, but in nature it is
1ikely that this signal would form a shock (pressurediscontinuity)
after traveling a small distance from the vent (Kieffer1981;
Wohletz et al. 1984). As eruption time progresses,the eruption
columns continue to rise, and, at late time, the models shown in
Figures 3-3 and 3-4 begin to depart significantlyin their
behavior. The eruption column in Figure 3-3 begins to spread
laterally at several kilometersaltitude,but after the spreading
It continues to rise until the working surface Is out of the
computationaldomain. The run in Figure 3-4 also begins to spread
laterally at several kilometersaltitude,but instead of continuing
upward, the part of the column that has spread then falls back to
the ground, resulting in a pyroclasticflow. The interpretationof
these two types of behavior follows volcanologicobservation:
Figure 3-3 representsan eruption that produces a high-standing
Plinian column, while Figure 3-4 Is a fountain that produces
pyroclastic flows. Details of the behavior of noncollapsingand
collapsing columns are d below. M importantat this
stage, however, is an understandingof the conditionsthat
determine whether or not a column will collapse.

- 134 -
Figure 3-2: Illustrationof terminologyfor various featuresof a
Plinian eruption.

-135
-*
w
- 136 -
Ftqure 3-3: Numericaleruptionproduc
49)0 Contour plots of logOs-i!s,p,
ng a Plinian column (Run
pg, and TS are shown for
three times after initiationof discharge (10, 80, and 110 s).
The innermostloges contour correspondsto 0s = 10-3, and each
contour outward representsan order of magnitude decrease in 8s.
Maximum flow speeds of about 400 m/s are attained in the basal z
km of the column. The exit pressure of this eruption is 0.69
MPa (Kp = 6.9). The initial atmosphericpressure signal Is
shown in the pressure and gas-densityplots at t = 10 s as a
perturbationin the ambient values. Ts = IZOO K at the exit
plane (this temperatureis used for all runs reported in this
chapter). Ts contours are drawn at 100 K intervals,so that the
outermost temperaturecontour correspondsto 500 K. See detail
of the basal portion of the column in Figure 3-6.

t =10s t=llos
loges-us ~
N
R (km) R [km) R (km)
6.
< c65. 5
4. =4z
+5
3 N3+5N
2 2
1. 1
0 0012 4567 01234567
R (km)
-?&N
01234567
R [km)
R (km)7
6-
5-
4. -E2s
3. N
2,
1.
001234567
R (km)
-F*N
01234567
R [km)
R (km)
0123456
R (km)
- 138 -
Figure 3-4: Numerical experimentproducinga pyroclasticfountain
(Run 8). Contour plots of log6s-i&,p, pg, and TS are shown at
t= 10, 80, and 140 s. The innermost6s contour correspondsto
a solid volume fractionof 10-3, and maximum speed of 300 m/s
occurs at the exit plane. The exit pressure of this eruption
equals the ambient pressure (Kp = 1). Note the atmospheric
pressure signal at t = 10 s, which shows with better resolution
than the eruption of Figure 3-3 because pressure contours are
drawn at smaller intervalsfor this run. High pressure cells
are located at the elevationof collapse and where the
collapsing flow impingesupon the ground. The contour plot of
pg at t = 140 s shows how hot, relativelylow-densitygas is
dragged beneath relativelyhigh-densityambient gas by the solid
phase, producing an unstable situationwhere the hot gas tends
to rise out of the basal flow. This in turn leads to
developmentof a cloud of ash that rises above the basal
pyroclasticflow due to buoyancy. Ts contours follow closely
plot of pg.
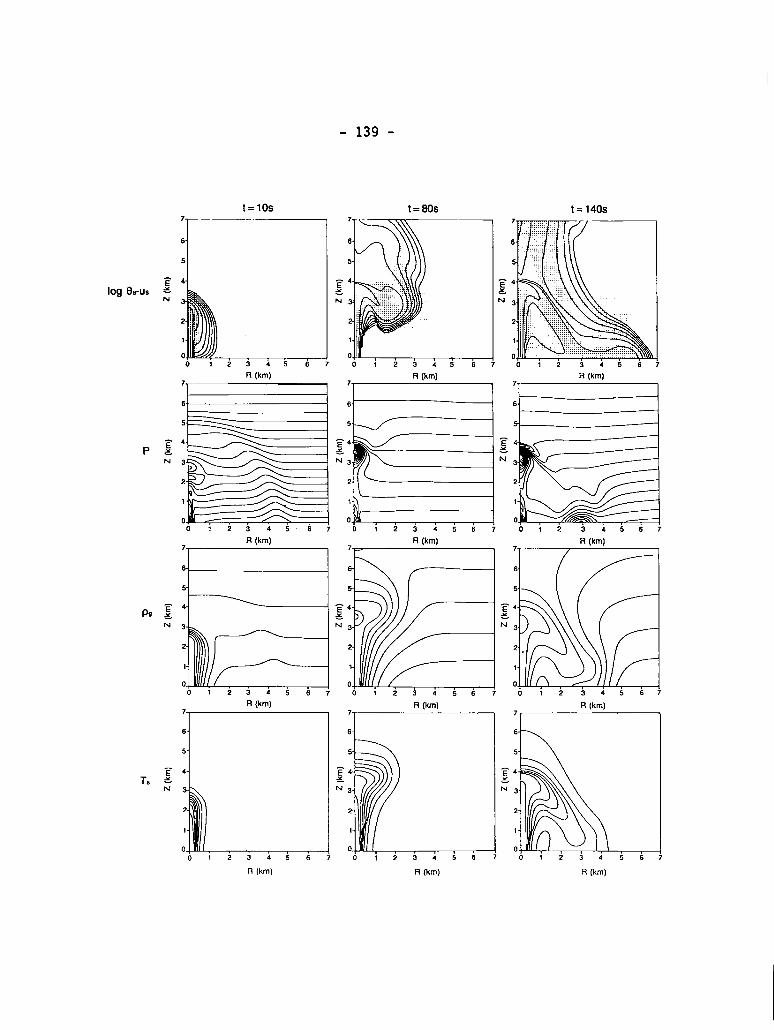
- 139 -
-Flog es-us :
PEN
T, :
t=10s7 ——
I
-.
6
4
L:,~i,:I:.
1.0
0123456
R (km)7.
6.
4.
3.
2-
1.
001234567
R (km)
3k21001234567
R (km)7-
6-
5-
4-
%
2-
1-
0=0123456
R (km)
t =80s
7-6J
5.
=4 -F“- 3
N3 N
2.
1-
001234567
R (km)
7~
R (km)
R (km)
oi23i 567R (km]
5
4
3
2
1
00123456
R (km)

- 140 -
Eruption Column Collapse
As discussed in the section DimensionlessParameters,
variables affectingthe large-scalebehavior of eruption columns
are summarized in the parametersTgm, Rim, Pn, and Kp. Special
attention is given here to Tgm, Rim, and Kp. The effect of the
Rouse number is such that a column with large-Pnclasts will tend
to collapse under conditionsthat would otherwiseproduce a Plinian
column. This result illustratesthe tendencyof large-Pn clasts to
follow nearly ballisticpaths.
apply one particle size per run
distributionsthat are found in
interpretationof particle size
Note that computationsin DASH
and do not follow size
nature, which limits the full
effects. The effect of multiple
particle sizes in an eruption is a subject for other calculations
and is not presented here. So, while it is reasonableto predict
that an overall increase In Pn will produce a tendency toward
column collapse, a specific relationshipis not sought by using a
single-particle-sizemodel. On the other hand, by varying the
properties of the eruptivemixtures,while retaininga constant
particle size (approximatelyconstant Pn), the behavior of the
eruptions with constant size distributionscan be compared.
Intuitively,one might expect a large Tgm to be typical of
Plinian columns, since this implies a large upward driving force
from the pressure gradient relativeto the downward force of
negative buoyancy (wherethe column exits with a density larger
than that of the atmosphere). The same is true of the Richardson

..
- 141 -
number -- a large Inftial componentof inertiawI1l counteractthe
negative buoyancy. Indeed, the Richardsonnumber, which Is
determined by the mixture density (directlyrelated to exsolved gas
content), exit velocity, and vent radius, embodies all the
variables consideredby Sparks et al. (1978),Wilson et al. (1980),
and Wilson and Walker (1987). Since Tgm and Rim contain all the
major forces acting on an eruption column, a collapse criterion
might be completelydefined in terms of these two parameters. In
the course of the numericalexperiments,however, it was found that
column collapse is also very sensitiveto the pressure ratio. This
result follows from the effect of overpressure(Kp > 1) on column
structure (Kieffer,1981, 1982, 1984; Kieffer and Sturtevant,
1984); as the supersonicflow exits the vent, the gas phase expands
and acceleratesto achieve pressure equilibriumwith the
atmosphere. This gas expansiondecreasesthe flow’s bulk density
and thus decreases the magnitude of the negative buoyancy force
(detailsof jet structure in the model runs wil1 be discussed in a
later section). The transfer of kinetic energy to internal energy
that takes place across the subsequentshock (referredto as the
Mach disk shock) is mainly reflected in a temperatureincrease and
velocity decrease. Above the Mach disk shock, velocity returns to
values very similar to those found at equivalentaltitudes in a
pressure-balancedjet. However, the mixture density does not
increase very much across the shock so that there is a net decrease
of density relative to a pressure-balancedjet. Thus, after going
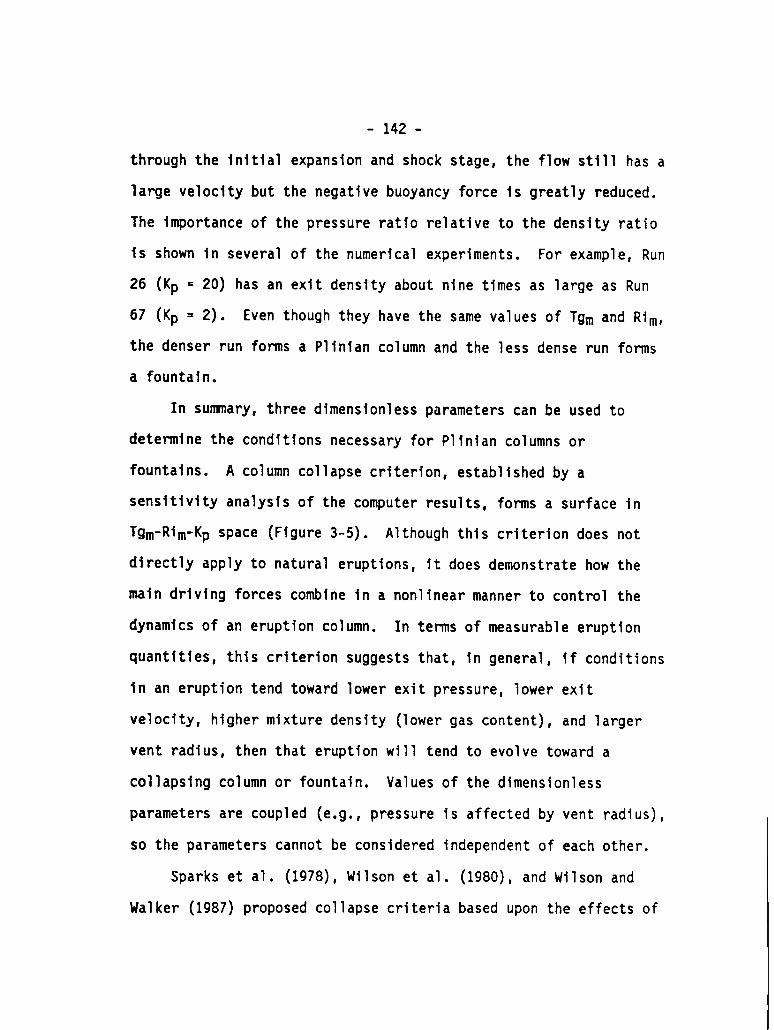
- 142 -
through the initial expansionand shock stage, the flow still has a
large velocity but the negativebuoyancy force Is greatly reduced.
The importanceof the pressure ratio relative to the density ratio
is shown in several of the numericalexperiments. For example, Run
26 (Kp = 20) has an exit density about nine times as large as Run
67 (Kp = 2). Even though they have the same values of Tgm and Rim,
the denser run forms a Plinian column and the less dense run forms
a fountain.
In sumnary, three dimensionlessparameterscan be used to
determine the conditionsnecessaryfor Plinian columns or
fountains. A column collapse criterion,establishedby a
sensitivityanalysis of the computer results,forms a surface in
Tgm-Rim-Kp space (Figure3-5). Although this criteriondoes not
directly apply to natural eruptions,it does demonstratehow the
main driving forces combine in a nonlinearmanner to control the
dynamics of an eruption column. In terms of measurable eruption
quantities,this criterion suggeststhat, in general, if conditions
in an eruption tend toward lower exit pressure, lower exit
velocity, higher mixture density (lowergas content), and larger
vent radius, then that eruptionwill tend to evolve toward a
collapsing column or fountain. Values of the dimensionless
parameters are coupled (e.g.,pressure is affected by vent radius),
so the parameters cannot be consideredindependentof each other.
Sparks et al. (1978),Wilson et al. (1980),and Wilson and
Walker (1987)proposed collapsecriteria based upon the effects of
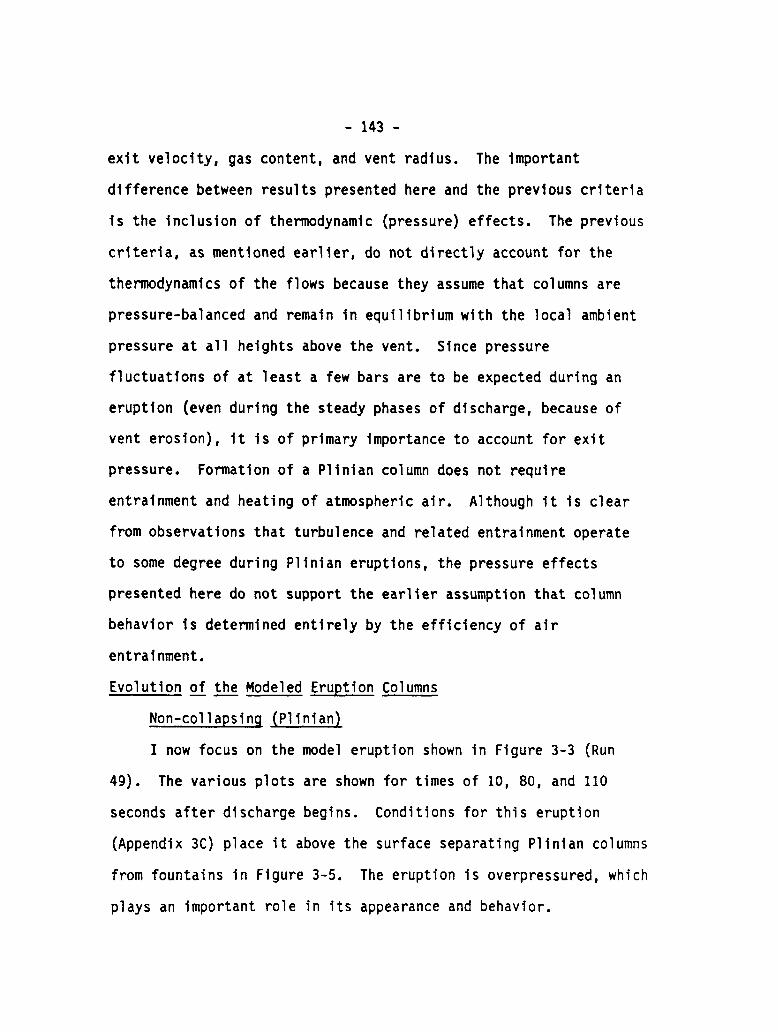
- 143 -
exit velocity, gas content, and vent radius. The important
difference between results presented here and the previous criteria
is the inclusionof thermodynamic(pressure)effects. The previous
criteria, as mentioned earlier,do not directly account for the
thermodynamicsof the flows because they assume that columns are
pressure-balancedand remain in equilibriumwith the local ambient
pressure at all heights above the vent. Since pressure
fluctuationsof at least a few bars are to be expected during an
eruption (even during the steady phases of discharge,because of
vent erosion), it is of primary importanceto account for exit
pressure. Formationof a Plinian column does not require
entrainmentand heating of atmosphericair. Although it Is clear
from observationsthat turbulenceand related entrainmentoperate
to some degree during Plinian eruptions,the pressure effects
presented here do not support the earlier assumptionthat column
behavior is determined entirely by the efficiencyof air
entrainment.
Evolution of the Modeled Eruption Columns.—
Non-collapsing(Plinian)
1 now focus on the model eruption shown in Figure 3-3 (Run
49)0 The various plots are shown for times of 10, 80, and 110
seconds after discharge begins. Conditionsfor this eruption
(Appendix3C) place it above the surface separating P1inian columns
from fountains in Figure 3-5. The eruption is overpressured,which
plays an important role in its appearanceand behavior.
- 144 -
Fiqure 3-5: Collapse of eruption columns (assumingsimilar
particle size characteristics)is determinedlargely by the
values of Tgm, Rim, and Kp as defined for exit conditions.
Critical conditionsfor column collapse appear to form a surface
in three-dimensionalspace defined by these three parameters,as
shown here. Exit conditionsthat plot above the surface produce
Plinian columns,while those below the surface produce
collapsingcolumns or fountainsleading to pyroclasticflows.

I
-145-
I/’1’/IIIIII
iIIit:IIII
\I\\\\\\\\\\\II\\\1\1\\\
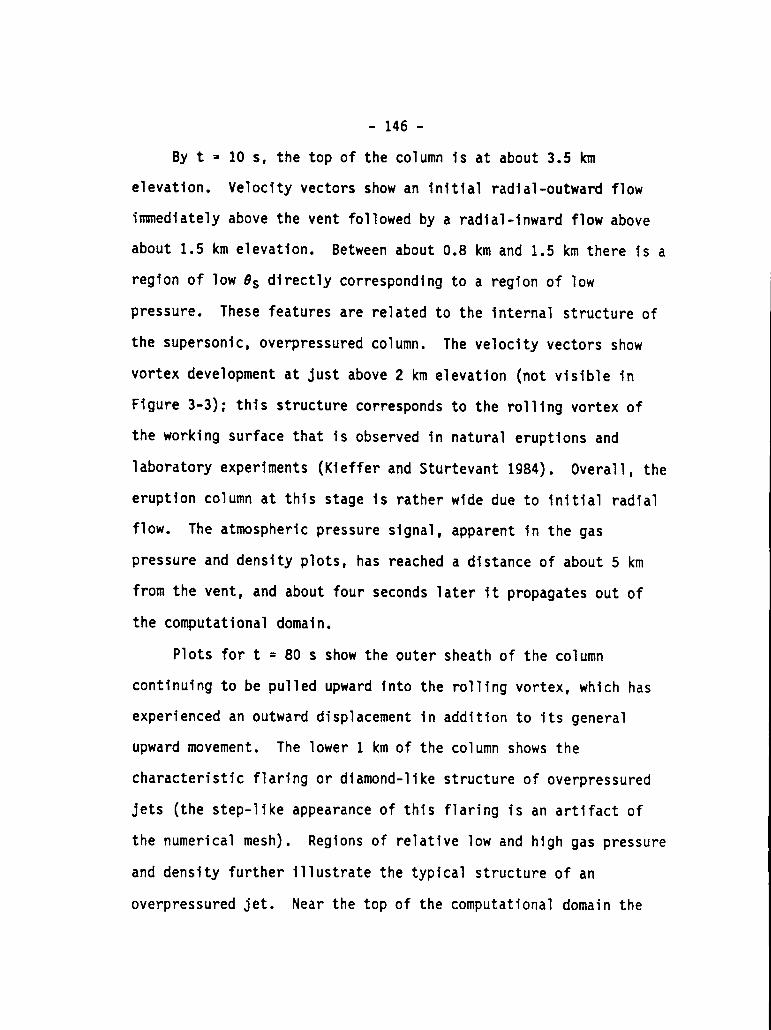
- 146 -
By t = 10 s, the top of the column is at about 3.5 km
elevatlon. Veloclty vectors show an Initial radial-outwardflow
immediatelyabove the vent followedby a radial-inwardflow above
about 1.5 km elevatlon. Between about 0.8 km and 1.5 km there is a
region of low 6s directly correspondingto a region of low
pressure. These features are related to the internal structureof
the supersonic,overpressuredcolumn. The velocity vectors show
vortex developmentat just above 2 km elevation (not visible in
Figure 3-3); this structurecorrespondsto the rolling vortex of
the working surface that is observed in natural eruptions and
laboratoryexperiments (Kiefferand Sturtevant1984). Overal1, the
eruption column at this stage is rather wide due to initial radial
flow. The atmosphericpressure signal, apparent in the gas
pressure and density plots, has reached a distance of about 5 km
from the vent, and about four seconds later it propagatesout of
the computationaldomain.
Plots for t = 80 s show the outer sheath of the column
continuingto be pulled upward into the rolling vortex, which has
experiencedan outward displacementin addition to its general
upward movement. The lower 1 km of the column shows the
characteristicflaring or diamond-likestructureof overpressured
jets (the step-likeappearanceof this flaring is an artifact of
the numericalmesh). Regions of relative low and high gas pressure
and density further illustratethe typical structureof an
overpressuredjet. Near the top of the computationaldomain the

- 147 -
gas pressure within the column is somewhat higher than that of the
adjacent atmosphere. This is due to a decrease in velocity at this
elevation and resultantconversionof kinetic energy to internal
energy. By t = 110 s, the velocity at this elevation has increased
and pressure has decreased accordingly. AlSO at t = 110 s, the
rolling vortex, which has spread laterallyto the edge of the
computationaldomain, is beginning to acceleraterapidly upward and
out of the domain, and by t = 140 s (not shown) the working surface
has completelyexited the domain.
As mentioned earlier the external form displayed by the model
column reflects the internal structurestypical of overpressured
jets, and it is appropriateat this point to discuss in some detai”
the internal structureof the overpressuredRun 49. In particular
I focus on the lowest 2.5 km, where jet dynamics as discussed by
Kieffer (1981, 1984) and Kieffer and Sturtevant (1984)dominate the
flow. Figure 3-6 shows detailed radial profiles of pressure, solid
volume fraction, and mixture density at 500 m intervalsabove the
vent when t = 64 s. At each elevation interval,local atmospheric
pressure and density are shown by dashed lines. The outer edge of
the eruption column correspondsto the locationof the 8s = 10-6
contour, which approximates
(Horn 1986).
At zero elevation (the
atmospheric (by a factor of
Although the vent has a rad
the visible edge of the eruption column
exit plane), the pressure exceeds
6.9 in this case) in the inner 200 m.
us of 200 m, the mixture immediately
- 148 -
expands to give the column a basal radius of slightlymore than 400
m. Beyond the edge of the vent, however, the flow has undergone
Prandtl-Meyerexpansionto a pressure slightly lower than
atmospheric. Because of this expansionof the gas phase, OS is
decreased by more than an order of magnitude relative to its exit
value. Mixture density follows the trend of solid volume fraction.
At 500 m, the amount of overpressurein the core of the column
has decreased significantlycompared to conditionsat the vent.
Along the margins of the column, beyond about 300 m from its
center, the pressure has increasedrelativeto the zero elevation
value, so that it is nearly equal to the local atmospheric
pressure. 0s and mixture density have maximum values at the center
of the column and decrease outward.
At 1000 m elevation,the pressure within the inner 500 m of
the column is substantiallylower than local atmosphericpressure.
Beyond this inner region, the flow is close to atmospheric
pressure. This distributionof pressure is the result of
overcompensationof the flow in its trend toward pressure
equilibriumwith the atmosphere,and produces 6s and mixture
density profiles with maxima located away from the center of the
column. At 1500 m elevation,the pressure within the inner 300 m
of the column is still less than atmospheric,and the outer part of
the column is now slightlyoverpressuredrelative to the
atmosphere. Again, the solid-volume-fractionand mixture-density
plots have maxima located away from the center of the flow.
- 149 -
By 2000 m elevation,the core of the flow has recompressedso
that it has a pressure slightly higher than the local atmospheric;
0s and PM have maximum values in the center of the column and
decrease steadilyoutward.
These phenomena can be explained in terms of observationsfrom
experimentswith overpressuredjets (JANNAF1975; Kieffer 1984;
Kieffer and Sturtevant 1984) and detailed numericalmodeling of
jets (Normanet al. 1982). This previous experimentaland
numericalwork has shown that overpressured,supersonicjets flare
rapidly upon exiting their nozzles (vents)and expand by the
Prandtl-Meyerprocess. Oblique rarefactionsreflect off the edges
of the jets to form weak convergingshocks. The shocks meet at
some distance downflow of the nozzle exit and form a strong shock
that Is parallel to the exit plane (Machdisk shock). Approximate
locationsof rarefactionsand shocks in the model run discussed
above are shown in Figure 3-6d. Rarefactionzones are well
representedin the numericalmodel because in reality they are
zones of smooth pressure gradients. Shocks, on the other hand, are
nearly discontinuitiesin real gas flows. However, in the
numerical results they are smeared out over larger distances than
would be expected in nature due to numericaldiffusion (Hirt 1968).
In addition, the presence of particles in a gas flow produces an
effective thickeningof shocks, because, although the gas itself
undergoes a sharp discontinuity,the imperfectcoupling of
particles and gas requiresa finite distance for the particles to

- 150 -
Figure 3-6: Detail of the basal 2.5 km of the overpressured
eruption shown in Figure 3-3. Radial variationsof p (a), 0s
(b), and mixture density pm (c) are plotted at 500 m intervals
above the exit plane. (d) shows how oblique rarefacttonsand
shocks interactwith the flow to produce the observed dynamics.
See text for detailed discussion.
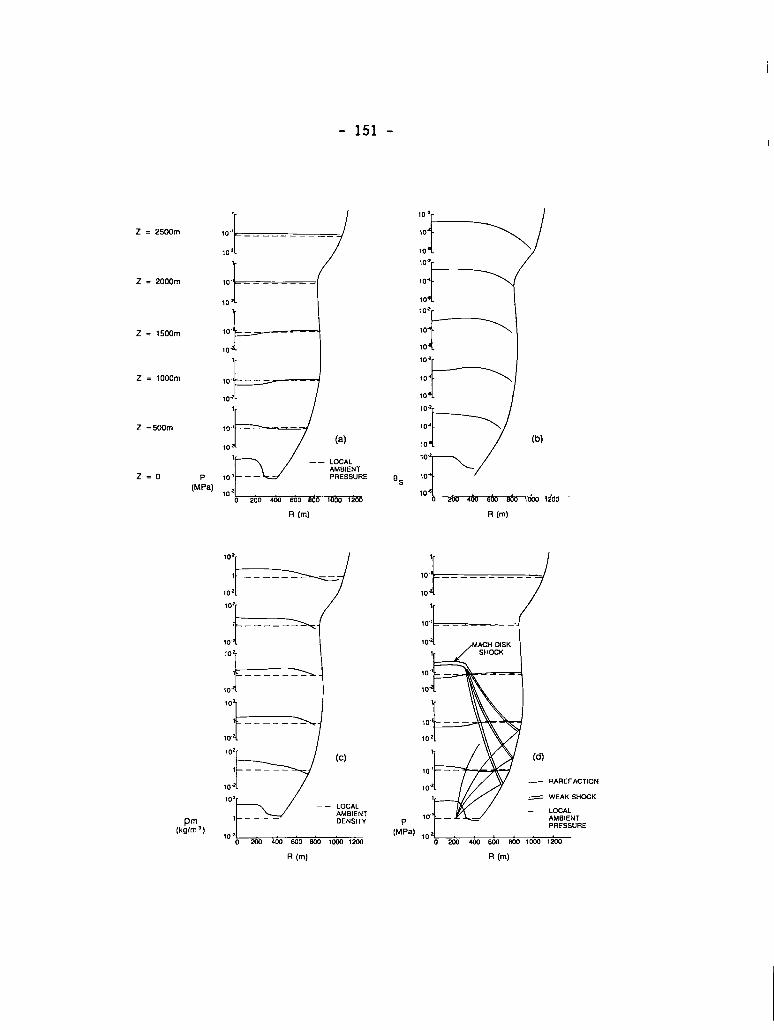
-151 -
Z.2500m
Z.2000m
Z.1500m
Z = 1000m
Z .5CQm
2.0
L----+,0. —
10”
31
10’———10*
1,.?———10 (a)
r----’/:-,..2
10’lo~
(MPa)>
lo~ 100 200 4cm Soo aoo 10001206 200 400 600 Soo 1000I2OO
R(m) R(m)
:+/
‘ok=+’+-+
‘1 /10+ – ——— —– –
10 1
i---- -
1 ————.—— 1
,.2.
1-——––– 1
102. 1
102–– LOCAL
[k::’) ,.., ,0 m 4CU Mo Sa3 1000 1ZOJ3
(d)
_ RAREFACTION
=== WEAK SHOCK
–– LOCALAMSIENTPRESSURE
R (m) R (m)
- 152 -
regain equilibrium with the gas (Carrier1958; Rudinger 1960;
Marble 1970). Thus there are no sharply defined shocks produced by
the numerical model, which instead shows regions of rapid
compression, illustratedas shocks drawn in Figure 3-6d.
Collapsing column (fountain)
Figure 3-4 shows the evolutionof an example collapsing
eruption column and resultingpyroclasticflow (Run 8, see Appendix
3C). This eruption plots below the critical surface of Figure 3-5,
and is in pressure equilibriumwith the atmosphereat the exit
plane.
At t = 10 s, the working surface is between 2 and 3.5 km
elevation with velocity vectors showing developmentof a rolling
vortex in this region (not visible at scale of figures). The
velocity vectors also show a rapid decelerationtoward the top of
the column along the r-axis. This decelerationproduces high-
-pressureregions in the flow as kinetic energy is converted to
internal energy (manifestedas pressure). The atmosphericpressure
signal is about 5 km from the vent at 10 seconds, and out of the
computationaldomain a few seconds later.
At t = 80 s, the column has spread laterallyat an elevation
of about 3.5 km, and that part of the flow is beginning to collapse
toward the ground. At the elevationof collapse, vertical velocity
along the axis of symmetry has decreasedto zero, resulting in a
high-pressure (and high gas density) cell. Also noteworthy is the
difference between the shapes of the bases of the eruption columns
- 153 -
shown in Figures 3-3 and 3-4. The model in Figure 3-4 exits at
atmosphericpressure and does not display the flaring property of
the run in Figure 3-3. Note the well-developedvortex above the
front of the collapsingflow (here referred to as the “stem”).
Also note that significantquantitiesof ash continue to rise above
the forming fountain. This observationis consistentwith
observationsfrom modern eruptions,and serves to point out a
difficulty in using cloud shape to determinewhether or not a
column is collapsing. If a column is undergoingasymmetrical
collapse, an observer on one side may witness collapse and
resulting pyroclastic flows, while an observer on the other side
will only see a steadily-risingplume of ash. Thus two radically
different interpretationsof eruption dynamics could result from
real-time observationsof the same eruption, and it is expected
that pyroclastic flow deposits and fallout deposits may form
contemporaneously(thispossibilityis suggested from field
observationsof deposits from the 1912 eruptionsof Novarupta;
Hildreth 1987).
By t = 140 s, pyroclasticflows are moving laterally across
the ground. A high pressure cell is present where the collapsing
stem Impinges on the substrate,reflectingrapid decelerationand
conversion of kinetic energy into internalenergy. The gas density
plot shows that the collaps
dense, hot gas beneath a re”
There are two componentsof
ng flow results in injectionof less
atively cooler and denser atmosphere.
pyroclasticground flow: one component

- 154 -
moves outward while the second componentof pyroclasticflow moves
inward toward the vent. At 140 s, the inward moving component is
just beginning to meet the main column, where later it is
reincorporatedinto the column. This phenomenonmay produce
considerablerecyclingof material during the course of an
eruption, a possible consequencebeing the mixing of earlier
erupted ash with later products. This process has not been
documented in the field, but it may be responsiblefor obscuring
temporal magma compositionalchanges that otherwisemight be
preserved by vertical zonationof the pyroclasticdeposit. For
example, a sharp compositionalinterfacein the magma chamber might
be smeared out stratigraphicallyin correspondingignimbrite,so
that it may be incorrectlyinterpretedas having been a smooth
compositionalgradient. Whether this remixingprocess occurs
during an eruption depends, for example,on the slope away from the
vent. Where a collapsingstem impingeson an outward-dipping
slope, the Inward-flowingpart may produce pyroclasticflow with
insufficientmomentum to flow up the slope toward the vent. Also,
as will be discussed in a later section, clast sizes control the
distances from the vent at which collapsingstems hit the ground.
Coarse material collapsingvery close to the vent can effectively
damp out the backflow.

- 155 -
IMPLICATIONSFOR PYROCLASTIC-FLOWTRANSPORTANDIGNIMBRITEFACIES
Results of the numerical experimentsare not appropriatefor
application to outcrop features smaller than the 100 m
computationalgrid. Most featuresobserved on the outcrop scale
are strongly influencedby the detailed rheologyof pyroclastic
flows (Sparks 1976; Wilson 1980; Wilson and Head 1981; Freundt and
Schmincke 1986; Valentine and Fisher 1986). In the multiphase
treatment used here, bulk fluid propertiesare essentially
Newtonian, and a detailed treatmentof pyroclasticflow mechanics
could incorporategranular flow dynamics (Savage 1984). The
strength of this model is that It sheds light on the large scale
features of an eruption, and the interpretationspresented below
pertain only to broad facies relationshipscomnonly observed in
pyroclastic flow deposits (see reviews by F’
1984, pp. 203-206; Cas and Wright 1987, pp.
Pyroclastic Flows
sher and Schmincke
244-250).
The structure of model pyroclasticflows reflect important
physical processes that control runout of pyroclasticflows and
ignimbrite facies. In addition to the results of Run 8, shown in
Figure 3-4, three other examples of fountains (Runs 19, 59, and 61)
are shown in Figures 3-7,8,9,where 0s and velocity vectors are
plotted at three times. Conditionsfor these runs are given in
Appendix 3C, and the main variationsrelative to the run in Figure
3-4 are: a short eruption dischargeduration (50 s) for Run 19;
- 156 -
Fiqure 3-7: 10ge~-i&
discharge duration
off,” and the flow
plots of the flow field produced by a brief
(Run 19). At t = 50 s, discharge is “turned
is producinga collapsingfountain. Although
the bulk of material in the eruption cloud produces laterally-
moving pyroclasticflow, a buoyant cloud of ash continuesto
rise above the vent, attainingupward speeds in excess of 50
mls. Note the well-developedvortex above the head of the
pyroclasticflow, especiallyevident at t = 70 s, and that
maximum velocitiesin the ash plume occur away from the symmetry
axis.
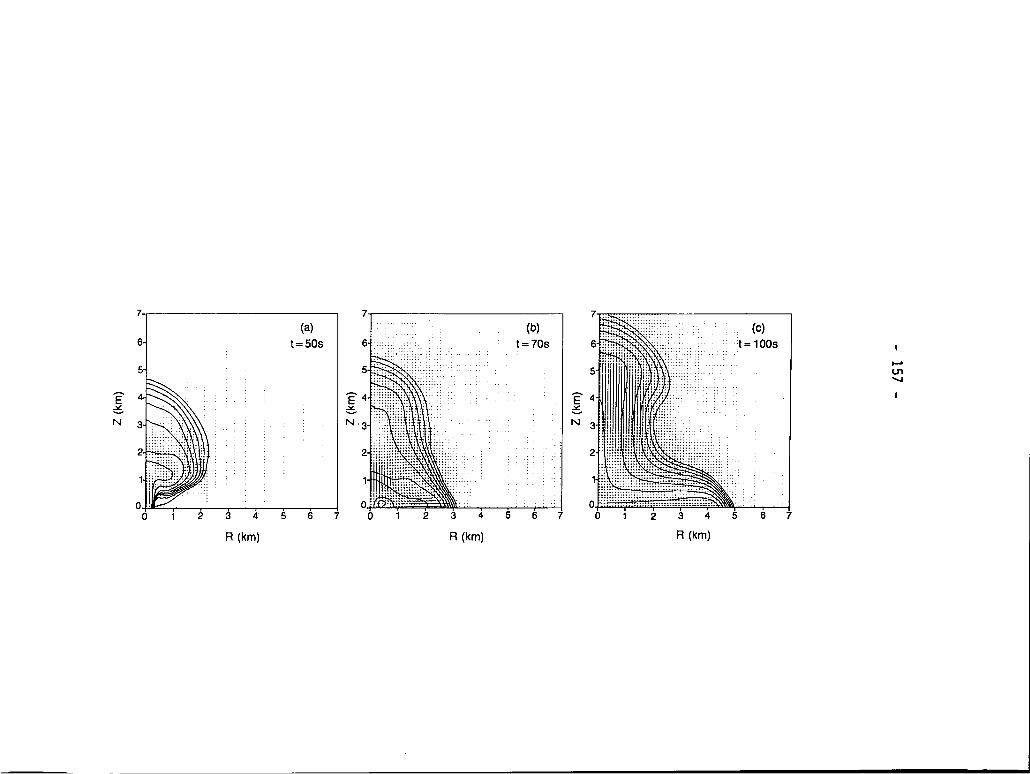
-157
-
~‘1 w
z-XK
(UJy)zI
::4
I.
~~‘“’t w-10t wI
ll
K-
Xtc
(Ul)oz
- 158 -
Figure 3-8: logO~-~~plots of coarse-grainederuption (Run 59).
Because of poor coupling between the gas and solid phases,
structureof the pyroclastlcflow is well illustratedby the
innermostcontour of the lateral flow. A relativelythick head
with a slight overhang is shown, followedby a relatively
thinner body of the flow.
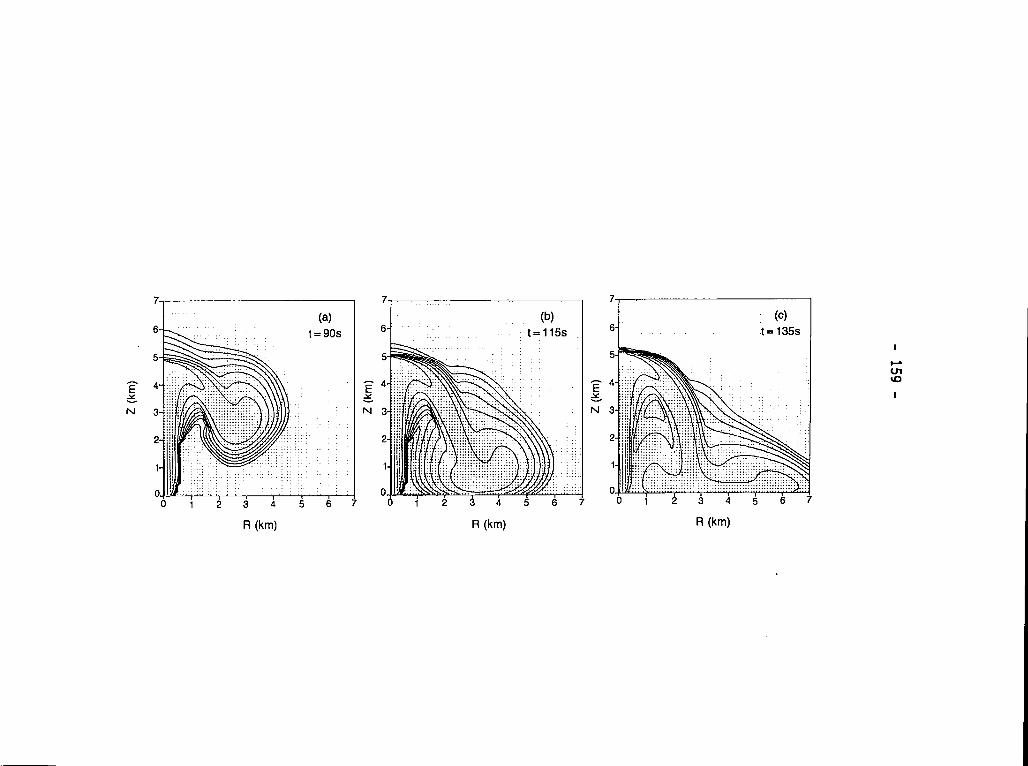
-159
-
~-$b
<t9U-J
-tmOJ
0
1?xu-E-
Xuzxu
-160 -
Fiqure 3-9: log6~-~~plots of a relativelyweak eruption (Run 61).
Most of the pyroclasticmaterial rises only 300 m above the
vent, then moves laterallyas a slow pyroclasticflow. However,
a buoyant plume of ash continuesto rise above the vent at
relativelyhigh speeds approaching120 m/s (note the exit
velocity is only 73 m/s). This rising ash cloud produces a
strong radially inward flow in the atmosphere,which exerts
sufficientdrag on the pyroclasticflow to effectivelystop its
progress.

-161
-
...
.1A
.,I-m
....,.,.:..:.,.:.,
,...:...:.,,.,,...,I*
(W)zhaIn
..
...............,..
.-;,:
,,..,::::.
..;:.,:.
...,:.,,:,,,::::....:.:.
,mJ)
*m&
:c
mw0
zxa
-162 -
large particle Rouse number (particlesare equivalentto 10 cm
radius lithic fragments)for Run 59; and low Tgm and Rim In Run 61.
Pyroclasticflows produced~ brief discharge
Figure 3-7 (Run 19) shows the developmentof a pyroclastic
flow and its evolution after discharge has ended. This has
relevance for pyroclasticflows produced by relativelybrief
periods of column collapse either from eruptionsconsistingof
discrete explosionsor from sustainedPlinian eruption columns with
brief periods of instability(producingintra-Plinianpyroclastic
flows; Wright 1981; Wilson and Walker 1985; Walker 1985). At t =
50 s, the column begins to collapse at an elevationof about 2 km,
and the eruption discharge is ‘turnedoff.” 20 s later, at t = 70
s, most of the erupted material (containedwithin the innermost0s
contour) is falling back to the ground and moving outward as the
beginning stages of pyroclasticflow. Note the strong vortex
developmenton top of the pyroclasticflow and that ash continues
to rise immediatelyabove the vent. The final snapshot in Figure
3-7 (t = 100 s) shows the developmentof a pyroclasticflow with a
relativelythick head that tapers gradually ventward to a lower-
concentrationtail. The head of the pyroclasticflow consists of a
relatively low-concentrationfront and a well-developedvortex
along its top. One might expect the deposits of such an eruption
to reflect an initial low concentrationphase, followed by a
higher-concentrationphase, and ending with another low-
concentrationphase. Note the cloud of buoyant ash rising above
- 163 -
the vent with relativelyhigh velocitiesbetween about 3 - 6 km
elevation. This phenomena suggests that it would be difficult to
determine exactly when dischargeends based on field observations
of eruption column dynamics.
Pyroclasticflows produced~ coarse-grainederuption
Figure 3-8 shows Run 59 at t = 90, 115, and 135 S. This Model
eruption consists of clasts of large Rouse number (10 cm radius,
density of 2400 kg/m3), so that interphasecoupling is extremely
poor. Note that this eruption has the same mixture parameters at
the vent as Run 49. Run 49 (Figure3-3) produced a Plinian column
and Run 59 produced a fountain,which demonstratesthe effect of Pn
on eruption dynamics.
Because of the poor coupling between the solid and gas phase
caused by large Rouse number, Run 59 permits observationof the
development of density-currentstructure. At 90 S, the collapsing
stem of the column has a well-developedhead, caused by resistance
of the atmosphere into which it is flowing and by drag associated
with vortex flow. When t = 115 s, the stem has just impingedon
the ground, and by t = 135 s, pyroclasticflows are moving rapidly
outward and inward. Note that the inner contour of the pyroclastic
flow, where the densest part of the flow exists, displays a
thickened head with a slight overhang at its front. This is a
common feature of density currents produced by laboratory
experiments (Hampton1972; Allen 1970, pp. 189-192), lending
credence to the numericalmodel presented here. This structure
- 164 -
also supports Ideas put forth by Wilson (1980, 1985), and Wilson
and Walker (1982)on the geometryof pyroclasticflows.
At later times In the run of Figure 3-8, the dilute cloud that
occurs above the pyroclasticflow graduallycollapsestoward the
ground until it is less than 2 km thick. Compare this to runs with
lower-Pn particles,which produce buoyant, continuouslyrising ash
clouds (discussedIn detail below). This differenceagain Is a
reflectionof the coupling between particles and gas.
Pyroclasticflows produced~ low T~-Rim-Kp eruption
Figure 3-9 shows Run 61 at three times. As can be seen in
Appendix 3C, this run has relativelylow values of Tgm and Rim, and
is pressure-balancedat the exit plane. In addition the Rouse
number of the particle phase Is low. These conditionscorrespond
to natural conditionsof low energy eruption in which eruptive
products appear to “boil” over the vent rim (e.g. the eruption of
Mount Lamingtondescribedby Taylor 1958).
Most of the material erupted during Run 61 rises only to
200-300 m above the vent, then collapsesto form a slow-moving
pyroclastic flow. A low-concentrationcloud of ash continuesto
rise above this level; the beginning stages of this cloud are seen
in the plot for t = 55 s. After 145 s of discharge,the
pyroclastic flow has only moved a total of about 2 km away from the
vent. The buoyant ash cloud, however, is rising very rapidly,
resulting in a strong radially-inwardwind as the atmosphere is
dragged up with the cloud. By t = 200 s the inward wind produced

- 165 -
by ash-cloud rise is exerting enough drag on the low energy
pyroclastic flow to effectivelyhalt its progress. Material
initially flowing outward in the pyroclasticflow is gradually fed
into the head of the flow and then sucked up into the buoyant ash
cloud. Thus it is seen that for a pyroclasticflow to make any
lateral progress, It must have enough inertia to counteractthe
inward wind produced by the convectiverise of the ash cloud above
the vent.
The results of Run 61 poc
observation of eruptions. An
nt to yet another problem with field
eruption that produces a very low
energy pyroclastic flow that is prematurelyhalted by wind drag may
appear to be entirely Plinian,especiallyif near-vent topography
or suspended ash hides the flow. Obviously,this would result in a
gross misinterpretationof the energetic of that eruption.
Ground Surge
Basal deposits of ignimbritescommonly display features of
pyroclastic surge deposits, such as improved sorting relative to
pyroclastic flow deposits and cross stratification. These basal
deposits were termed “ground surge” by Sparks and Walker (1973),
and were placed in the layer 1 position of the “standard”
ignimbrite sequence of Sparks et al. (1973)and Sparks (1976).
Subsequent variants of layer 1 deposits include ground layers and
fines-depletedignimbrite (Walkeret al. 1981; Wilson and Walker
1982). In addition,deposits that record turbulentboundary layer
- 166 -
processes In pyroclasticflows have been predictedby Valentine and
Fisher (1986).
Layer 1 deposits that fall into the category of ground surge
have been interpretedin terms of three models. First, Wilson and
Walker (1982) suggest that ground surge deposits are associated
with unsteady processes at the fronts of pyroclasticflows.
Second, Wohletz et al. (1984)present numericalmodeling that
suggests ground surges may be related to initial unsteady flow and
blasting phenomena at the beginningof an eruption. The third
model (Fisher,1979) suggeststhat these deposits record the
Initial stages of eruption column collapse. In Fisher’smodel, the
outer sheath of the eruption column has a lower particle
concentrationand is finer-grainedthan its core. The lower
concentrationis postulatedto be due to mixing with ambient air,
and the fine-grainedproperty is due to size grading inheritedfrom
the conduit flow. The model assumes that when column collapse
begins the outer sheath of the column collapsesfirst, producing
fine-grained,low-concentrationpyroclasticsurges that are
subsequentlyfollowed by denser, coarser-grainedpyroclasticflows.
Numericalmodeling of gas-particleflows moving through
diverging nozzles by Ishii et al. (1987)shows that the outer parts
of the flows have lower particle concentrationsbecause of the
relativelyslow responseof the particles to the nozzle shape,
compared to the nearly instantaneousresponseof the gas. Thus if
a volcanic eruption occurs through a flaring vent one might expect

- 167 -
higher particle concentrationsand coarser sizes in the core of the
eruption column flow than at its edges, supportingthe idea put
forth by Fisher (1979). The DASH models also indicate this
concentrationgradient,but they do not directly support the idea
that the outer sheath of the column will collapse before the core.
Instead, at the elevationof collapse,the entire cross section of
the column “flops”downward at the same time. Still, as
illustrated in Figure 3-4, the lower-concentrationouter part of
the column is pushed in front of the higher-concentrationcore
material during initial collapse. The result is that lower
concentrationparts of the flow hit the ground first and then
continue to move laterally in front of higher-concentrationparts
(note that this effect is exaggeratedsomewhat in the numerical
experimentsdue to numericaldiffusion;Hirt 1968). It is possible
that this leading part of the flow may have characteristicsof
pyroclastic surges, and thus lay down bedded and cross bedded
deposits just prior to the main pyroclasticflow. This is more
likely to be an active process near the vent, because with
increasing runout distance the low-concentrationfront may be
stripped off by aerodynamicdrag and possibly overtaken by the
dense pyroclastic flow.
Ash Cloud.—
The presence of a dilute ash cloud above model pyroclastic
fountains and related pyroclasticflows, mentioned several times in
the preceding discussion,has several importantimplications. In
- 168 -
Figure 3-4 at t = 140 s, notice the cloud of ash rising above the
fountain and pyroclasticflow. This dilute ash cloud flows back
toward the axis of symmetryby convectiveinflow of the atmosphere,
and then rises to form a buoyant plume analogousto the ash cloud
discussed by Fisher (1979) (see also documentedash clouds from the
May 18, 1980 eruption of Mount St. Helens in Criswell 1987). The
ash cloud is thought to deposit a “co-ignimbriteash,” layer 3 of
the standard Ignimbritesequenceof Sparks et al. (1973). Fine ash
layers at the tops of pyroclasticflow units have been described at
numerous locations (Wilsonand Walker 1985;Wilson 1985; Bacon
1983; Sparks 1976; Fisher 1979). Recently,Rose and Chesner (1987)
suggested that the voluminous75 ka Toba eruption generated several
hundred cubic kilometersof this co-ignimbriteash. Layer 3 has
been attributedto sorting of fine ash in collapsingeruption
columns and elutriationof fine ash from the dense pyroclasticflow
(Sparks and Walker 1977; Wilson 1980). Denlinger (1987) finds that
turbulent-boundary-layerand granular-flowprocesses act together
to produce ash clouds. Layer 3 seems to have been deposited by
fallout in some cases and by lateral transport in others (i.e. ash
cloud surge of Fisher 1979).
DASH results indicatethe followinginterpretation. Ash may
buoyantly rise above the main pyroclasticflow, carried by rising
hot gas (fluidization;Wilson 1980, 1984) and by diffusive
processes such as turbulence (Denlinger 1987). The rising ash
forms a relativelylow-concentrationcloud that flows inward,
- 169 -
relative to the main pyroclasticflow, toward the main axis of the
eruption column. As mentioned above, this is largely due to drag
from atmosphericwind that is pulled inward and upward with the
eruption column. The majority of ash cloud material rises
buoyantly and is later depositedby fallout. Coarser tephra may be
deposited during the backflow of the ash cloud, resulting in dunes
and other features typical of pyroclasticsurge deposits on top of
pyroclastic-flowunits. In this fashion,dunes recordingcrest
migration toward the vent are not necessarilyantidunes,because
their parent flow (the ash cloud) may have been itself flowing
toward the vent relative to the underlyingpyroclasticflow.
This backflow phenomena is predictedby DASH for only near-
vent locations. As radial distance increases,ash clouds may
become detached from the parent pyroclasticflow and move
unaffected by backflow and also can continue flowing after the
pyroclastic flow itself has come to a stop (see discussionby
Denlinger 1987). Farther from the vent, and for small eruptions,
the inward-flowingwind decreases so that the ash cloud would be
able to rise vertically,move entirely according to its own
momentum, or be blown by the non-volcanicwind in any direction.
Proximal Co-iqnimbriteBreccias and the Deflation Zone——
Previous work
The numerical modeling presented here has importantbearing on
near-vent processes that produce proximal breccias often observed
to be related to ignimbrites. Detailed descriptionsof proximal

- 170 -
breccias have been given by Wright and Walker (1977, 1981), Wright
(1981),Druitt (1985),Druitt and Sparks (1982),Druitt and Bacon
(1986), Bacon (1983),Caress (1985),Kite (1985),and Freundt and
Schmincke (1985). Several terms have been used for these deposits
and each term correspondsto a specific flow/emplacementmechanism
(see below). I use the term “proximalco-ignlmbritebreccia” as a
nongenetic name for lithic-richbreccias that are found in proximal
areas around ignimbritevents and are laterallyequivalentto or
associatedwith Ignlmbrltes. Proximalco-lgnimbrltebrecclas
originate by the same eruptive event as their laterallyequivalent
Ignimbrites. This discussionpertafns to outflow Ignimbriteonly,
and does not consider Intracalderabreccia formation (Lipman 1976).
Proximal co-ignimbritebrecciaswere first discussed by Wright
and Walker (1977)and were termed by them “co-ignimbritelag-fall”
deposits. They were interpretedby Wright and Walker (1977,1981)
to representdepositionof heavy clasts at the site of column
collapse. The term “lag-fall”reflectsthe idea
material falls from the eruption column and lags
remainderof the material that coalescesto form
Walker (1985)
breccla,” and
from a highly
column. This
Sparks et al.
simplifiedthe term used
proposed a model whereby
expanded,turbulentzone
for these
that the breccia
behind the
pyroclasticflows.
deposits to “lag
the breccias are deposited
around a collapsingeruption
zone, called the “deflationzone,” was postulatedby
(1978)and Sparks and Walker (1977)to be the site
where dense pyroclasticflows are actively segregatingfrom a low-

- 171 -
concentration flow. Drultt and Sparks (1982)observe that coarse,
poorly-sorted,clast-supportedbreccias verticallyand laterally
grade into ignimbrite,and that the brecclas are laterally
equivalent to layer 2bL, the lithic concentrationzone commonly
found near the base of ignimbriteflow units (Sparkset al. 1973).
In the above models, sorting of proximal breccias is attributedto
gas streaming,analogous to fluidization,during lateral flowage of
the material.
The significanceof proximal breccias in terms of eruption
dynamics has been discussed by Druitt and Sparks (1984),Druitt
(1985), and Walker (1985). These workers suggest that the
occurrence of proximal breccias within a caldera-formingeruption
sequence marks the onset of caldera collapse. In addition,Walker
(1985) proposes that variations in the extent of proximal breccias
in a given eruption sequence are related to variations in the
extent of the deflation zone due to discharge fluctuations. Druitt
(1985) suggested that the formationof proximal breccias is at
least partly due to overpressuredconditionsat the vent which
enhance vent erosion. He suggests that this conditionwill be met
during periods of rapidly increasingdischarge,such as the onset
of caldera collapse.
Modelinq Approach and Results
In order to examine the behavior of various clast Rouse
numbers, I have run the DASH code with clast radii ranging from
10-4 to 10-1 m. To isolate the effects of particle characteristics
- 172 -
alone, experimentswere designed to compare eruptionswith
different particle radii but with identicalmixture parameters,so
that Pn was varied while Tgml Rim, Kp, and DS were held constant.
Referring to Appendix 3C, the runs discussedhere are 8, 40, 43,
and 46.
F~gure 3-10 shows the 6s-velocityplots for four experiments
at late stages of column collapse (t = 185 s). Two general results
are illustrated: (1) collapse height varies inverselywith Pn; and
(2) higher-Pn clasts hit the ground much closer to the vent than
their finer counterparts. For example, fine ash is transportedto
about 3.5 km above the vent and falls to the ground at a rad”
distance of about 2.5 km, while 1 cm radius Iapillimoves on’
0.7 km and falls to the ground at about 0.5 km from the vent
center. 10 cm lithic fragmentsreturn to the ground at only
from the center of the vent. Not surprisingfrom a physical
standpoint,these results simply reflect the degree to which
al
y to
300 m
particles are coupled with the gas phase in an eruption (see also
discussion by Wilson et al. 1987). Very fine particles are nearly
perfectly coupled with the gas. They are dragged up much higher
before the mixture density causes instabilityand collapse. Large
particles, on the other hand, are barely affected by gas drag, and
follow paths that are more nearly ballistic. In reality, large
clasts will experiencean increaseddrag force caused by the
presence of fine particles suspendedin the gas. Thus the results
of the present numericalmodeling can not be exactly applied to
- 173 -
natural eruptions. Nonetheless,these experimentsshow the
relative effects of varying Pn, and I feel that the results apply
qualitativelyto real eruptions. Furthermore,the above results
indicate that the sorting observed in proximal breccias is
primarily inherited from the eruption column itself, and that gas
sorting during lateral flowage is a second order process.
Numerical experimentsfor all Rouse numbers show the formation
of pyroclastic flows that consist of inwardlyand outwardlymoving
parts as was discussed in an earlier section. The finest material
involved in collapse will fall to the ground at the largest
distance from vent, and all pyroclasticflows outside of this
distance will move away from the vent. What happens inside this
envelope in a real eruption, however, is not Clear. Some backflow
of finer material into areas where coarser material is falling will
lead to some mixing of the two. On the other hand, very close to
the vent, the coarsest material having followed nearly ballistic
paths may flow radially outward where it may mix with progressively
finer material. During flow away from the vent, coarse clasts
become progressivelydiluted because of two processes: 1)
sedimentationout of flow, and 2) mixing with increasingquantities
of finer clasts.
This simple analysis of model results can explain most
features of proximal co-ignimbritebreccias described by previous
authors. Some deposits, especiallythose extremely close to vent,
may be expected to have characteristicsof fallout deposits, such
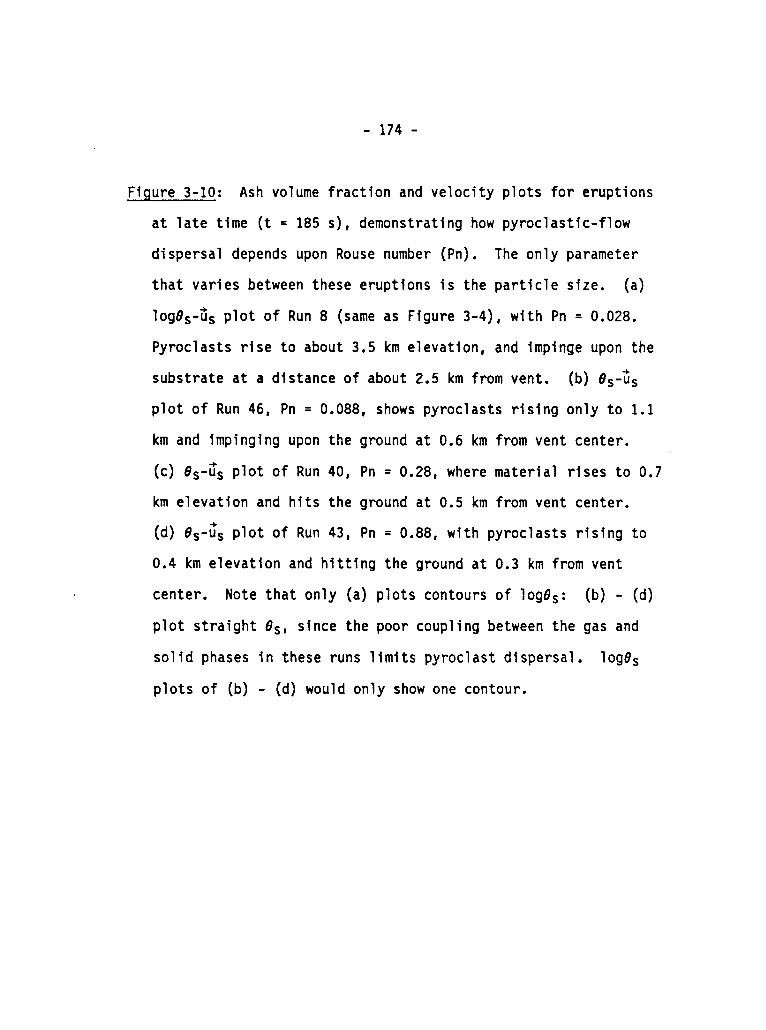
- 174 -
Figure 3-10: Ash volume fractionand velocityplots for eruptions
at late time (t = 185 s), demonstratinghow pyroclastic-flow
dispersal depends upon Rouse number (Pn). The only parameter
that varies between these eruptions is the particle size. (a)
logds-~s plot of Run 8 (same as Figure 3-4), with Pn = 0.028.
Pyroclastsrise to about 3.5 km elevation,and impinge upon the
substrateat a distance of about 2.5 km from vent. (b) Os-iis
plot of Run 46, Pn = 0.088, shows pyroclastsrising only to 1.1
km and impingingupon the ground at 0.6 km from vent center.
(c) Os-~s plot of Run 40, Pn = 0.28, where material rises to 0.7
km elevation and hits the ground at 0.5 km from vent center.
(d) Os-is plot of Run 43, Pn = 0.88, with pyroclasts rising to
0.4 km elevation and hlttlng the ground at 0.3 km from vent
center. Note that only (a) plots contoursof logOs: (b) - (d)
plot straight 6s, since the poor couplingbetween the gas and
solid phases in these runs limits pyroclastdispersal. 1090s
plots of (b) - (d) would only show one contour.

- 175 -
-Fx
N
R (km)
-sx
N
-Fx
N
R (km)7
(d)
6- es-us
R (km) R (km)

- 176 -
as continuous bedding and good sorting (Wrightand Walker 1977,
1981). These deposits would have indeed be true fallout because
they simply “piled up” where the material hit the ground. However,
the models show that much of the material can continue to flow
after falling to the ground, producingdiscontinuousstratification
and mixing with finer and less dense material. In places, coarse-
grained flows originatingfrom the vent may move over newly-
deposited, finer, pumiceous ash. If the coarse-grainedflows are
lithic rich, they will be much denser than the underlyingash
deposit, and pods and rafts of lithic breccia may sink down into
the underlyingmaterial (Druittand Sparks 1982). This situation
is expected to enhance degassingof the underlyingash resulting in
increased formationof degassingpipes.
Plots of maximum lithic size versus distance from vent
commonly show inflectionpoints (Wrightand Walker 1977; Wright
1981; Wilson 1985; Druitt and Bacon 1986; Caress 1985). These
inflectionsare suggestedby the above authors to mark the outer
edge of the postulateddeflationzone. In contrast, the DASH
models suggest that the inflectionsimply representsthe runout
distance of coarse breccia material as defined by its potential
energy line (Sheridan1979). Beyond that point, transport is
determined by the pumice flow, which may carry lithics and undergo
grading processes as discussedby Sparks (1976)and many other
authors.
- 177 -
In sununary,the main result of the numericalmodels regarding
proximal co-ignimbritebreccias is that the concept of the
deflation zone is not supported. In fact, the modeling indicates
that the near-vent region will have the highest particle
concentrationground flow, as opposed to being very low-
concentrationas postulatedfor the deflation zone concept (Figure
3-11).
CONCLUSIONS
Numerical models of Plinlan eruptions have been made in which
the full set of Navler-Stokesequationsare separatelysolved for
solid-particleand gas phases in two dimensions. These models
provide direct analysis of some basic nonlinearprocesses active in
eruption columns, processes that can not be generally understoodby
intuitive reasoning alone. The main results of the analysis of 51
numerical experimentsare as follows:
1. The most fundamentaltypes of eruption column behavior,
high-standingPlinian and collapsingfountain,are determinedby
the density and velocity of the eruptingmixture, the exit
pressure, and the vent radius. The critical conditions for
eruption column collapse form a surface in Tgm-Rim-Kp space for
eruptions with similar grain size characteristics. Column behavior
is more strongly influencedby the ratio of exit pressure to
ambient pressure than by the ratio of column density to ambient
density within the frameworkof this numericalmodel.
—

-178 -
Figure 3-11: Solid volume fract~on (8s) plotted against radial
distance from vent center for the model eruptions shown in
Figure 3-1o (t = 185 s). Peaks in 0s between O - 3 km from vent
center correspondto sites where collapsingflow Is impinging
upon the ground, so that the proximal area is the area of
highest pyroclast concentration. This runs contrary to the
deflatfon zone concept. Note that Runs 46, 40, and 43 have each
have second maximum in 0s between 5 - 7 km from the vent.
These features are associatedwith the heads of the individual
pyroclasticflows.
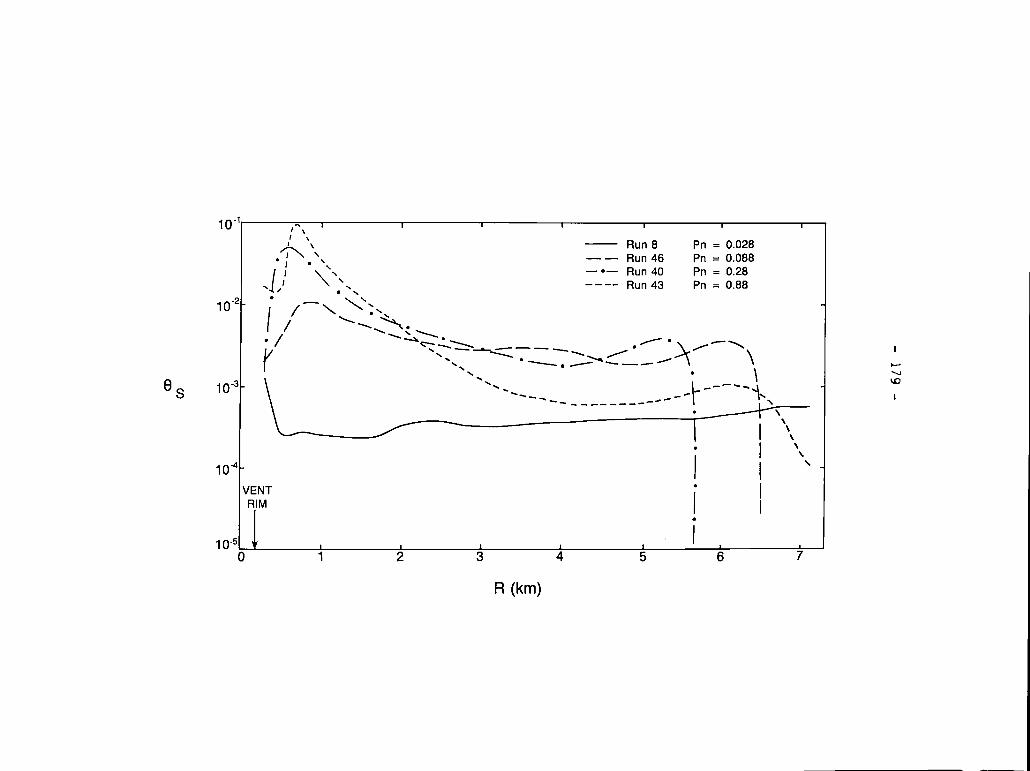
ma
-L -+’”‘–—
––O
lmm
mooN.
m.
0000r
/II
IIII
II\
1,C
cccL
LL
L\
●—
o—,—
x“
“,“
.\
\I
l\II
\/i,/
/1“I;;/h./1’
{//’/
/’?”/
,,/>”(
./’●
(L,
-.---.
-\\
u)
a)

- 180 -
2. Overpressurederuptionsdisplay features that are observed
in laboratory experimentsof overpressuredjets. The erupting
mixture initiallyexpands and acceleratesabove the vent, then
compresses and deceleratesthrough a Mach disk shock. This process
produces a characteristicdiamond-shapedcross section at the base
of eruption columns.
3. Pyroclasticflows can consist of two parts. One part
flows outward from the vent to form outflow facies tuff, the other
part may flow toward the vent and thus result in recyclingof
erupted material back into the column. Pyroclasticflows produced
by the numerical model display a relativelythick head, a thinner
body, and a lower-concentrationtail. This structurecorresponds
well with laboratorydensity currents. In order to flow away from
the vent, a pyroclasticflow must have enough momentum to overcome
drag of connectivelyinflowingatmosphere. Insufficientmomentum
may result in a weak pyroclasticflow eruptionwith only a towering
ash cloud visible to the observer.
4. The numerical experimentssuggest that during the
beginning stages of eruption column collapse, lower-concentration
outer parts of the column may be pushed ahead of higher-
concentrationparts. When the material impingeson the ground, the
result is a pyroclasticflow with a low-concentrationfront. This
may lead to depositionof the ground surge deposit commonly
observed beneath pyroclasticflow deposits.

- 181 -
5. Buoyant, low-concentrationclouds of ash that rise above
fountains and related pyroclasticflowsare observedin all
eruptions (exceptingthose in which the particles are very coarse).
In proximal areas (within7 km from vent), the ash clouds typically
flow toward the vent relative to the main pyroclasticflow.
Deposits from the inflowingash cloud may show
dunes. In natural eruptions It is likely that
obscure pyroclasticflow processes and lead to
ventward-migrating
the ash cloud may
misinterpretationof
eruption dynamics. It is also expected that fallout deposits may
form concurrentlywith pyroclasticflows, so that caution must be
used in interpretingdeposits In terms of eruption processes.
6. The model supports an origin of proximal co-ignimbrite
breccias by sorting within the eruption column. In this case,
coarser clasts collapse from the column at lower elevationsand hit
the ground closer to the vent than finer clasts. The breccias
become finer-grainedwith distancemainly due to sorting that
occurs before hitting the ground Instead of during lateral flowage.
Lateralflow of all the material spreads the clast size
distribution laterallyover greater distances than the vertical
distribution in the eruption column. It Is suggested that the
inflectionpoint commonly observed in maximum-lithic-sizeversus
distance-from-ventplots is related to the potential energy line of
the breccia material.
7. The numericalmodel does not support the existence of a
“deflationzone” in proximal areas around a fountain, as has been

- 182 -
suggestedby previous authors. Instead,pyroclasticflows In this
area appear to have a higher concentrationthan any other location
in the computationaldomain.
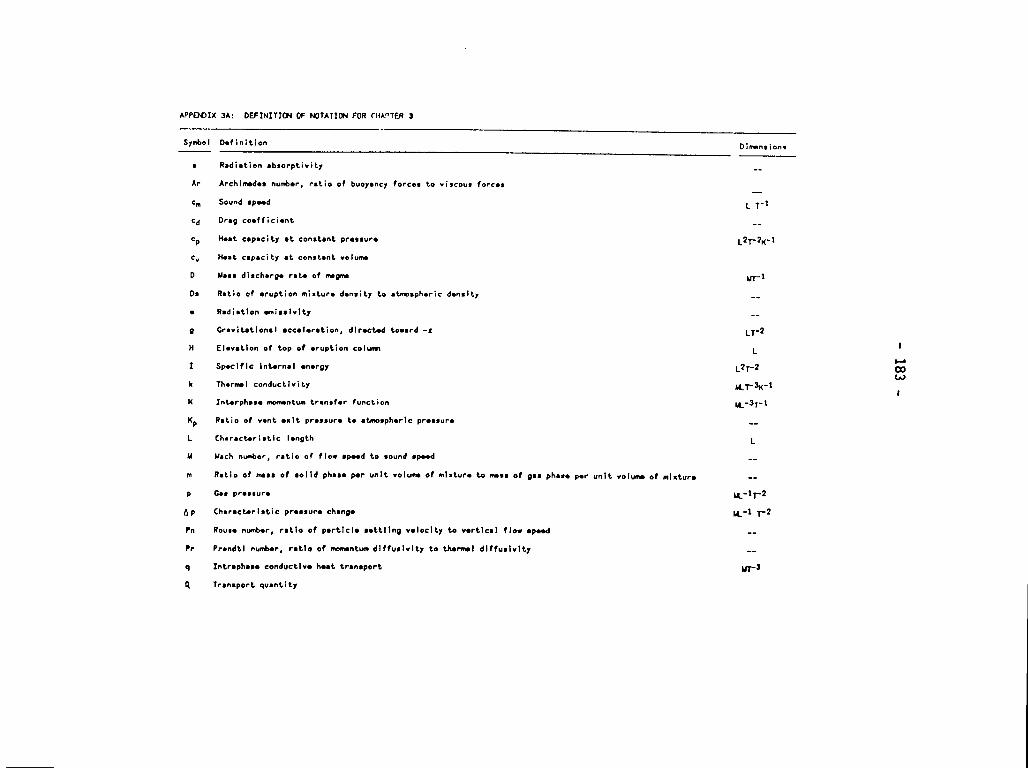
APPEWIX 3A: DEFINITIIM OF NOTATION FOR CNA”TER 3
Symbol Definition Oi nmnsi 0“s
a
Ar
cm
cd
CP
c“
o
08
9
9
M
I
k
K
Kv
L
M
m
P
6P
Pn
Pr
Radiation ●bsorptivity
Archinvdes number, ratio of buoyancy forces to viscouw forces
Sound spo.d
Orag cooffici.nt
Heat capacity ●t constont prbssure
Heat capacity ●t const.nt VOIUOU
Mass disch.r~. rat. of nngns
Rstio of ●ruption mixtur. d.nsity to .ksph.ric d.nslty
Rsdiotlon ~isslvlty
Cra.itatlonal ●ccelwation, dlrackd toward -x
E1.vatlon of top of ●r.ptlon COIUINI
Sp.ciflc Intarnsl ●noroy
Thornml conductivity
Int.rphnsm mmmntum transfar function
Ratio of vent .xlt pressure to stmosphorlc pr.ssure
Ch.racbriotic I.noth
Mach number, ratio of flos spo.d to sound sp..d
Ratio o? rmss of ●olld phaso por unit volum of ml.turo to mass of gas phas. pw unit volwm c.? mlsturo
Cm* pr*s.ur.
Ch.racbrlstic prassuro chonoo
RO.SO ntir, rntlo of psrtlclo settllng valoclty to vwtlcal flow sped
Prsndtl mm+ar, ratio of mmnntum dlffuslvlty to thorml dlffuslvlty
Introphaoo conductlvo host transport
Tronmport quantity
.-
—L T-l
--
L2~2K-1
ml
--
--
LT-2
L
L2~2
ur%-~U-3,-1
--
L
--
. .
~-1~2
~-l 7--2
--
--
~3
1
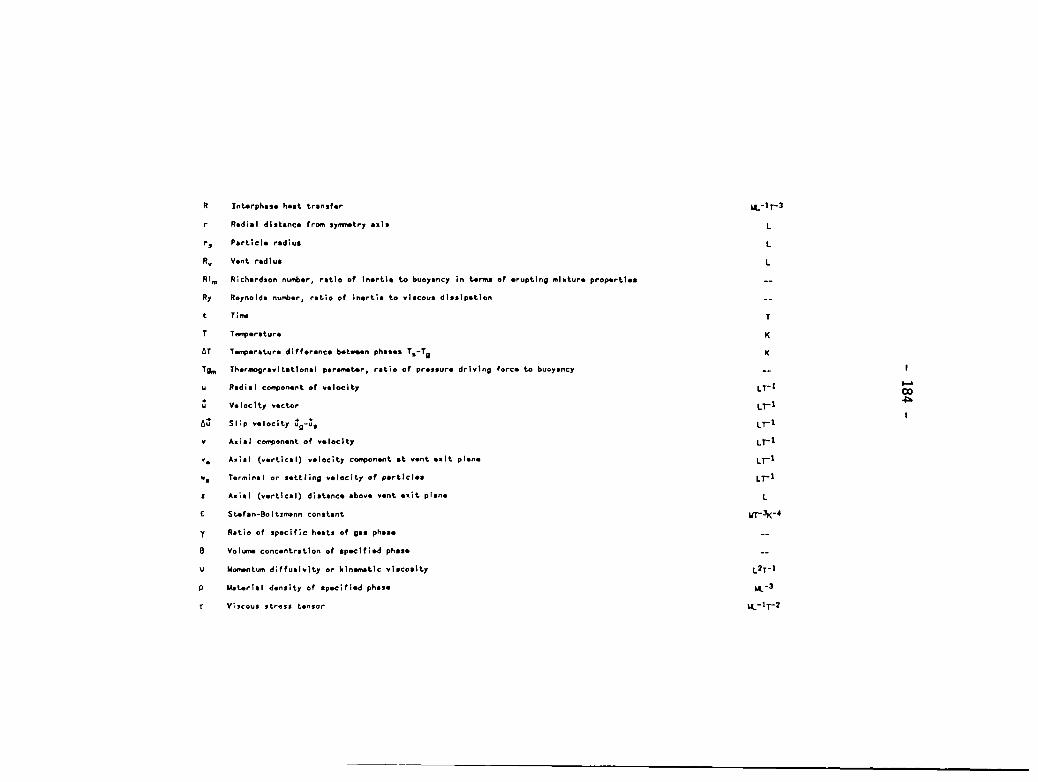
R
v
f
Intirphaso haot transfar
Radial dlstsnco frmm sym’mtry ●xis
Part.iclo r~dius
Vent radius
Richardson nuder, ratio of in.rtla to buoynncy in tarms of .ruptlng mlxtur. proportl.s
Reynolds number, r.t.io of in.rtia toVISCOUS dlsslpstlon
7ilm
Tenproture
TuIQ.r.uIr. difforance b.tw.m phas.s T.-TO
Th.rnmgrmvibtlonml paranvbr, ratio of pr.ssur* drlvlng fore. ta buoyancy
Radial componant of velocity
V.loclty wctor
Sl;p valocity ;Q-il,
Axial ccmponant of vcloclty
A.ial (.wtical) velocity cwonent ●t wont ●xlt plan=
Terminol or settling velocity of particles
A.ial (v.rtlcsl) distonco ●bove v.nt ●xitplane
Stmfan-Boltxmonn conatnnt
Rotio of specific hsats of LWS phasa
Volum concontratlon of spcclfiod phmso
Mmmntum diffuslvlty or klnemotlc vlocosity
Msbrlal density of mp.cifiod phoso
Viscous stress t.nsor
K-17-3
L
L
L
.---
T
K
K
--L7-i
L1-1
L1-1
L1-1
L7-1
Lrl
L
~3K-4
----
L2rl
K-3
K-17-2
I
I

Subscripts
●tmosphwo
dusty-gss
condlt; ons s?. wont .xlt plan.
gmc (cowywc,,lbl.) pha,o
rsdlal cc.w.utitiontl c.11 Index
●xla I computational c* I 1 lndox
mi .tura
tlfm c~cla for cqutmtlon
sol id (incompross ib 10) phase
I
I
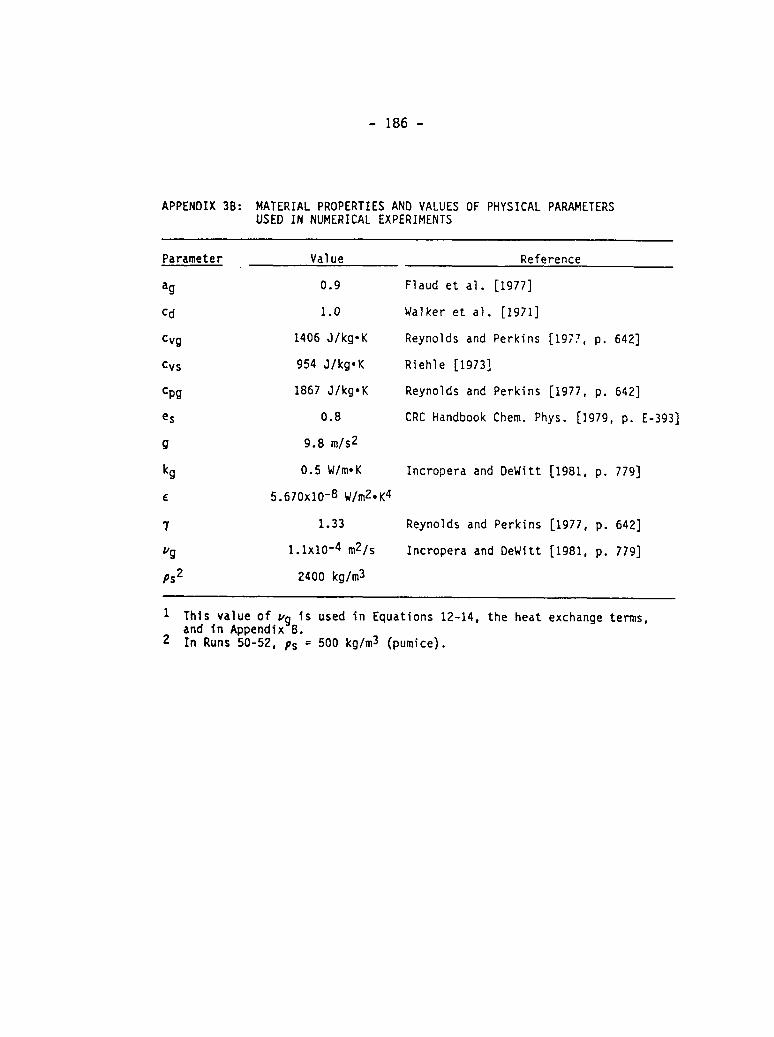
- 186 -
APPENDIX3B: MATERIALPROPERTIESAND VALUESOF PHYSICALPARAMETERSUSED IN NUMERICALEXPERIMENTS
Parameter Value Reference
ag 0.9
Cd 1.0
CVg 1406J/kg*K
Cvs 954 J/kg*K
CP9 1867J/kg*K
es 0.8
9 9.B m/s2
kg 0.5 W/m*K
E 5.670x10⁻⁸W/m2*K4
7 1.33
Pg 1.1x10⁻⁴ m2/s
PS2 2400 kglms
Flaudet al. [1977]
Walkeret al. [1971]
Reynoldsand Perkins[197?,p. 642]
Riehle[1973]
Reynoldsand Perkins[1977,p. 642]
CRC HandbookChem.Phys.[1979,p. E-393]
Incroperaand DeWitt[19B1,p. 779]
Reynoldsand Perkins[1977,p. 642]
Incroperaand DeWitt[1981,p. 779]
1 This value of Vg iS Used in Equations12-14,the heat exchangeterms,and in AppendixB.
2 In Runs 50-52,ps = 500 kg/m3 (pUmice).
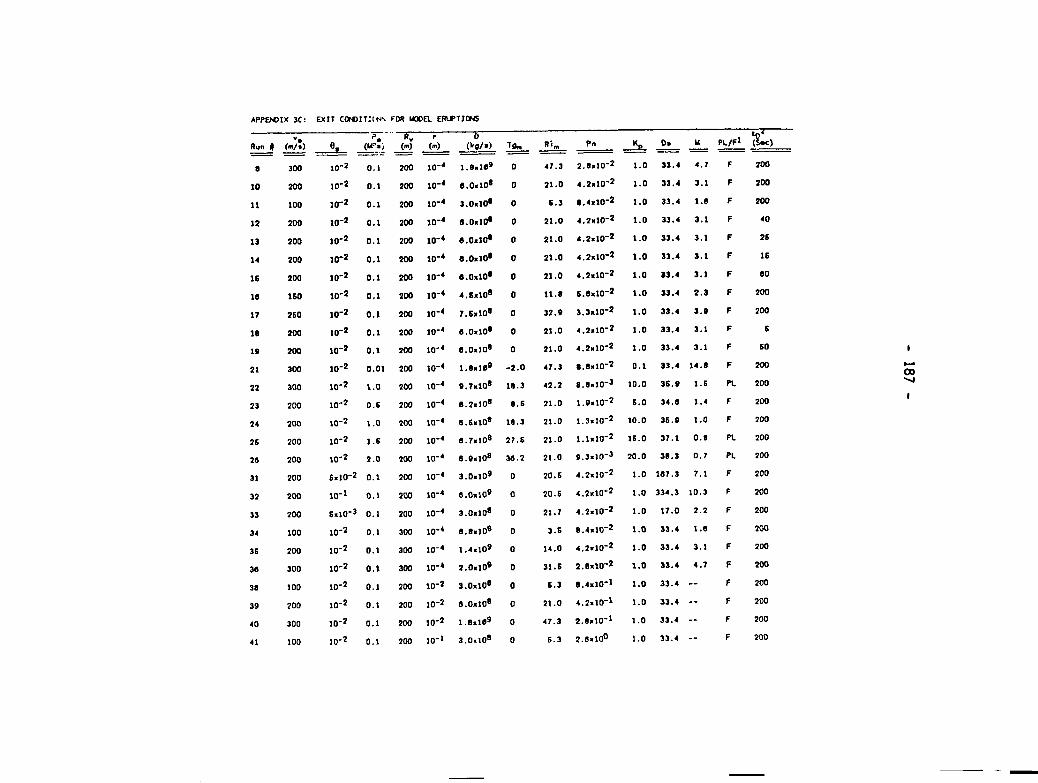

vk
- 189 -
APPENDIX 3D: NUMERICAL FORMULATIONAND ACCURACY
The numerical representationof the Navier-Stokesequations
used in the DASH code is discussed in detail in Harlow and Amsden
(1975). The overall technique is very similar to that utilized in
the KACHINA code (Amsdenand Harlow 1974),which was used by
Wohletz et al. (1984),except that in DASH the intraphaseheat
conduction terms are neglectedand a crude turbulenceviscosity Is
used as discussed in the text. The differencingscheme for
conservationof mass is explicit for the incompressible(solid)
phase and Implicit for the compressible(gas)phase. Conservation
of internal energy is representedby explicit finite-difference
equations (FDE’s) for both phases. Conservationof momentum is
representedby implicit finite-differenceequations for both
phases. Below I show the mass and internalenergy FDE’s, which are
relatively simple, and the interestedreader is referred to Harlow
and Amsden (1975)and Amsden and Harlow (1974) for the more complex
FDE form of the momentum equation along with the general solution
procedure.
Field variables P, 6, p, and I are defined at cell centers,
while velocity componentsare defined at midpoints of cell edges.
Field quantities are transportedfrom cell center to cell center
via the donor cell (upwinddifferencing)technique. In the finite-
difference representationof the differentialequations given
below, indices i and j refer to cell-centercoordinatesin the r
and z directions,respectively,and superscriptn is the time

- 190 -
cycle. For terms with no time cycle speclftcatton,assume cycle n.
In addition, br correspondsto the radial cell dimension,L5zto
the axial cell dimension,and &Jtto the time step for computation.
As noted in the text, for this work dr = 6Z = 100 m and bt = 0.02
s. Terms enclosed in angle brackets are subject to the donor-cell.condition,which states that
IQi,j ‘f h+l/2, j 2 0@Q>i+l/2, j
(3D-1)= (ur)i+l/2,j “Qi+l,j ‘f ui+l/2,j < 0
where Q is any field variable. This relationshipsimilarlyholds
for motion in the z-direction.
Equations 3-la,b, conservationof mass, are approximatedas
‘+l(esps)ij - ‘(esps)i~ + ‘<usresps>i+l/2,j- ‘<usr~sPJj-l/2,~t5t
+
and
ri 6t
‘<vsesps>i,j+112 - ‘<vso~ps>jj.1/2= o (3D-2)
(52
‘+1(6p )i j - ‘(8qpg)iJbt
‘+l<u r9qpq>1+l/2j - ‘+l<u r6Jpq>l-1/2 ~+ ri tir
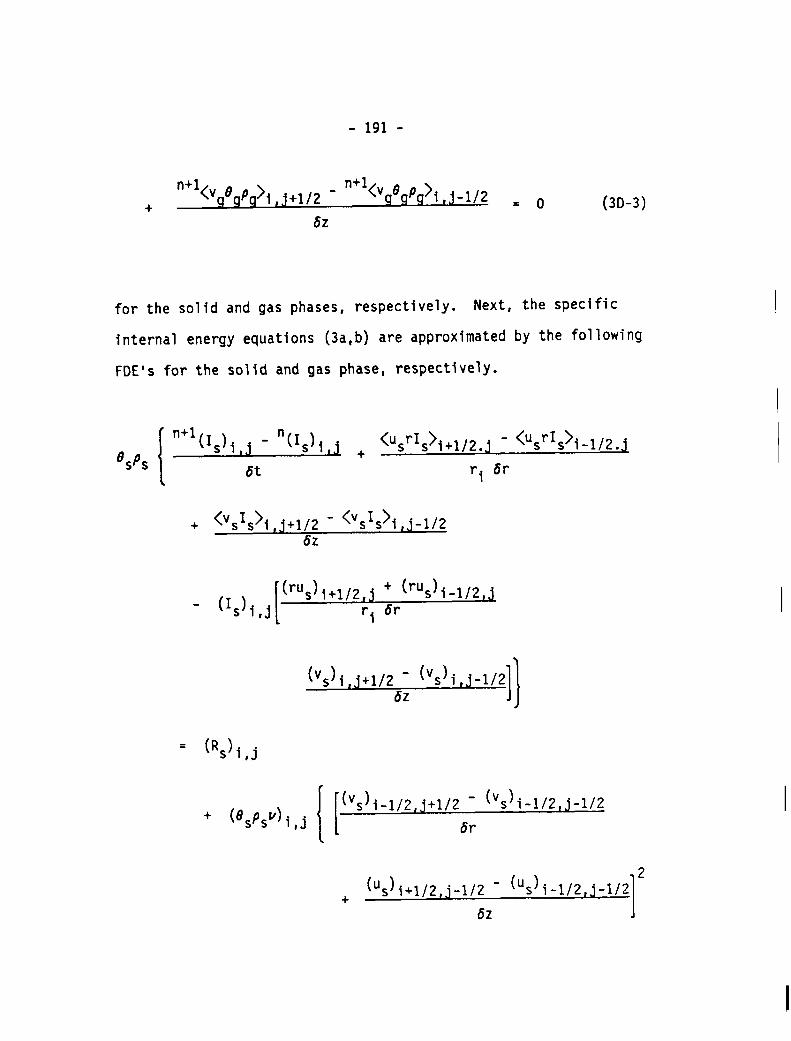
- 191 -
‘+l<V eqpq>lj+l/2 - n+l<v e pg>ij-~,* = ~+ (3D-3)
r5z
for the solid and gas phases, respectively. Next, the sPecific
internal energy equations (3a,b)are approximatedby the following
FDE’s for the solid and gas phase, respectively.
[
‘+l(Is)i ~ - ‘(Is)i ~ + <u~rIs>i+l/z.j - ‘“srls>i-l/2.~6SPS
m ri 6r
+ <v&>i j+~/2 - <VJS>I ,j-1/262
[
(rus)i+l,2rj~r(rus)i-1/2,~- (Is)i,j
i
(vs)i~+1/26; (Vs)i,j-1/21]= (Rs)i,j
[[
(Vs)i-1/2,j+l/2 - (vs)i-1/2,j-l/2+ (“spsv)i ,j 6r
I
I
2(us)i+~/2j-1/2 - ‘“s)i-l/2, j-l/2
+62 1
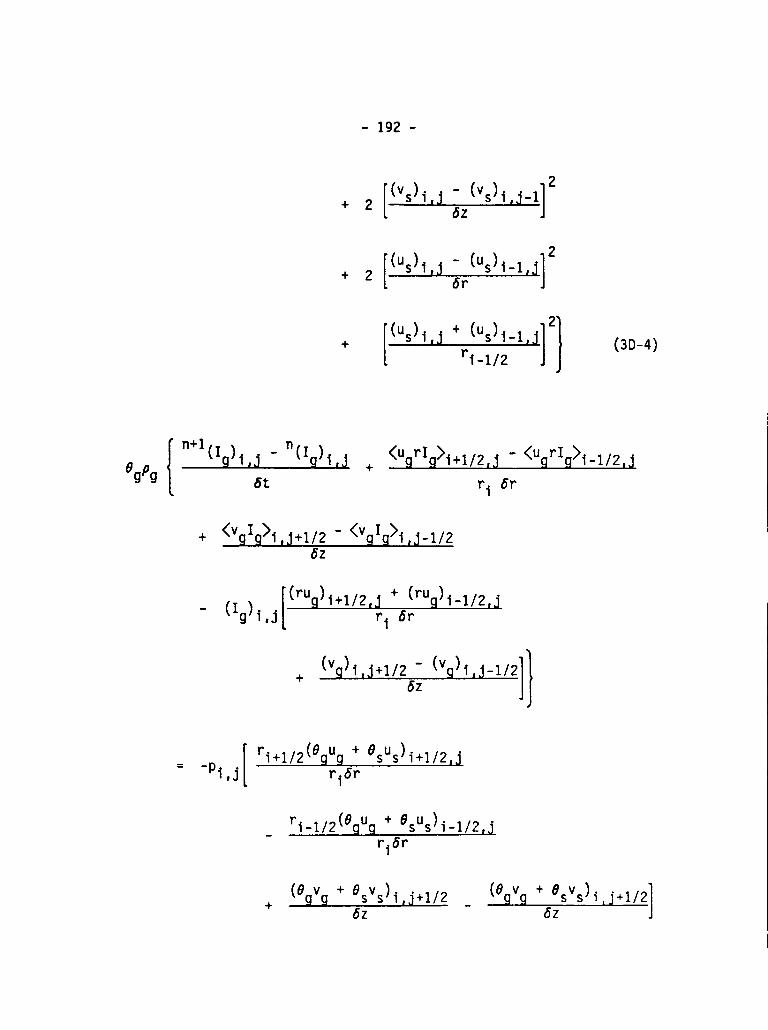
- 192 -
+ 2 ‘VS)’J -JJ’J-q2[
[
(Q1 j - (Q~-~ 2+2 6r 4
[(us),j+(Us)i-12
+‘1-1/2 4]
(3D-4)
v’‘+1(1 )1 ~ - ‘(Iq)f ~ <uqrIq>1+1f2 j - <uqrIq>i-1/2 ~egpg +
t5t rl t5r
+ <v I >, j+~/2 - <“g& ,j-1/2
6Z
[
(ruq)i+l/2,:‘6~ruq)i-l/2,~- (Ig)l,ji
(Vg), j+~/2 - @q4,j_l/2+6Z 1]
[
‘i +1/2(e~u~+ ‘s”s)i+~/* .=
‘pi, j rlbr
q4/J@gug+‘tj”s)i-l/2 jri~r
‘e~vq+ ‘svs)~ ,j+~/~(@q”g + 19/Ji .+1,2
+,
tiz (5Z ‘1

- 193 -
+ (Rg)i,J
+ I(Kg)i,jl● {[( )Ug ,,j - wi,j]2
+[(vg)i,~- (v~)j,j]2)
[[wf-1/2,j+l/2
- (V )i-1/*,j-l/*+ (q#@,,j
6r
2(ug)i+l/2J_l/2 - (ug)i-1/2,j-l/2
+f5z 1
[
(Q, j - (vg)~ -~ 2+2 6Z ‘d 1
[(Ug)tj -(q{_~2+2 6r ’11
[ g ‘j(u )i + (Uq)i-l “
2+
‘0(3D-5)
‘i-l/2J
that they are
centers for
In these formulationsvariables that are indexed such
at positions other than their defined locations (cell
field variables and midpoints of cell edges for velocity
components)are computed by extrapolationand averaging.
The DASH code was tested for accuracy by repeating Run 60
with three different values of cell dimension (&Jr,bz) and time
step (6t). Table 3D-1 presents values of ug, 0s, and p at
elevationsof 500 m, 1000 m, 2000 m, and 3000 m on the symmetry
- 194 -
axis at eruption time t = 10 s. At t = 10 s the calculationshave
gone through 500 to 2000 time cycles so that flaws in the numerical
scheme should be apparent. As time progressesvalues of flow
parameters are expected to diverge somewhat for different cell
dimensions and time steps due to the nonlinearnature of the
equations. For example, at a given (eruption)time a point in the
computationaldomain will have a slightlydifferent value if the
time step has a value 6t = 0.02 s than it would if the same
computation was carried out with 6t = 0.01 s. No matter how
precise the numerical scheme the subsequentvalues of flow
parameters at the point for the two time steps may or may not
diverge in a predictableway due simply to the nonlinearityof the
Navier-Stokes equations. This is a common feature of fluid-
dynamical systems (the unpredictabilityof weather is a good
example), and, In my opinion, indicatesthat comparisonof
numerical results at late times or large flow distances is not
reliable for evaluatingnumerical schemes. This is the
justification for only comparingnumbers at early to intermediate
times along the symmetry axis. A more detailed discussionof the
data in Table 3D-1 follows. Suffice it to say that at late times
the graphical (or qualitative)output of the runs in the table are
almost identical and that all flow parametersremain within the
same order of magnitude for the different6r,z’s and t5t’s.
The data in Table 3D-1 show that at a given 5r,z the
calculations are relativelyinsensitiveto t5t. For example, in the

-195
-
&l
.“2m.-x(t
1’o
b%t-~
“ggr-!-!60701’0
1’0
m-100-i’o?
-la
mx~05+0o
IIN
0IIIN

- 196 -
runs where t5r,z = 100 m the values of Ug vary only by 0.5% at z =
2000 m (relativeto the value when 6t = 0.02 s) and variationsin p
are negligible;0s varies by about 11%but remains within the same
order of magnitude. Similarly,for the two runs where 6r,z = 50 m
the flow parameters vary only slightlybetween the two dt’s. This
relative insensitivityto bt is expected from the Courant
criterion,which states that 6r/6t and 6z/t5tmust be at least as
large as the highest possible velocity in the flow field. In the
case of dr,z = 100 m and 6t = 0.02 s the calculationsare stable
for flow speeds up to 5000 m/s, which is much larger than any
velocities in the present problem. Decreasingthe time step merely
increases the maximum computableflow speed with very little effect
on accuracy.
The data in Table 3D-1 show some sensitivityto the choice of
&-,z. This is mainly the result of numerfcaldiffusion;a larger
cell dfmensfon will tend to diffuse gradientsof flow variables
relative to a small cell dfmensfon (Hirt 1968). Compare the values
of 6s at z = 1000 m for runs wfth i5r,z= 100 m and with 6r,z = 50
m. The variation between the two cell sizes is relativelysmall
(about 7%, but wfthin the same order of magnitude). In contrast,
the values of 0s at z = 2000 m show a large varfation between t$r,z
= 100 m and dr,z = 50 m. This fs explainedby the fact that the
flow front fs between the two elevations,but is better resolvedas
a sharp front fn the runs with smaller cell size. The goal of the
present modeling was to study large-scaleprocesseswithin the flow

- 197 -
field, so that the sllght loss in resolutionfrom using 6r,z = 100
m instead of a smaller value was balanced by the
computationalspeed and hence the lower cost.
APPENDIX 3E: SCALING OF VISCOUS FORCES AND HEAT
Scaling of Viscous Effects
Viscous effects have been omitted from the
dimensionlessparametersand the significanceof
gain in
CONDUCTION
discussionof
those parameters
with respect to eruption dynamics. As shown here, viscous forces
are negligible compared to the other forces representedin
Equations 3-13,14,15.
I apply the pseudogas (or dusty-gas)approximationto the
flows in order to calculate at effective kinematic viscosity
(Marble 1970):
‘dg.& , (3E-1)
where vg is given In Appendix 3B, and m is the mass ratio of solids
to gas. In the numericalexperiments,0s ranges from 10-1 to 10-3
at the exit plane, correspondingto m between 1500 and 10. Values
of vdg vary accordinglyfrom about 7X10⁻⁸ to 7X10⁻⁶ m2/S. To
determine the relative importanceof viscosity, I form ratios with
inertial,buoyancy, and thermodynamicforces.

- 198 -
The ratio of Inertialforces to viscous forces is given by
the Reynolds number (Re) in the followingform,
Ry = ~‘dg
(3E-2)
where u and L are the characteristicvelocity and length,
respectively. I take u N 100 m/s and L- 100 m. Thus for the
range of 8s in this work, we have Ry - 1012 to 1010, which
demonstratesthat viscous forces are negligiblecompared to
inertial forces.
The ratio of buoyancy forces
Archimedes number (Ar),given by
3Ar = ‘Ds - 1)~L .
Ds2Vdg
to viscous forces forms the
(3E-3)
For the range of conditionsconsideredin this work, the smallest
value of the Archimedes number is Ar - 1016, showing that viscous
forces are also negligiblecompared to buoyancy forces.
A ratio of thermodynamic(pressure)forces to viscous forces
is given by
Am N loMPmvdgz
I (3E-4)

- 199 -
where Ap is a characteristicpressure change, taken as Ap - 0.1
MPa. Thus it Is clear that the true viscosityof the flows plays a
negligible role in the dynamics relative to other types of forces.
This justifies the neglect of viscous forces throughoutthe
chapter.
Scalinq of IntraphaseHeat Conduction
Intraphaseheat conduction (heat conduct
phases) is not computed in the numericalmodel
on within ind vidua
used for this work.
To justify this, I examine the magnitude of conductive heat
transport relative to other forms of heat transport in Equation
3-3a,b. Since the solid phase is treated as dfspersed particles,
intraphase heat conduction is irrelevant. The gas phase, however,
is continuous and requires an order of magnitude estimate of heat
conduction. For thfs purpose we have
t (3E-5)
where the direction of heat transport is irrelevant. For a typical
temperature gradient of 1 K/m (or 100 K per computationalcell) and
kg from Appendix 3B, we get q - 0.5 W/m2. The ratio of advective
heat transport to conduction is
I (3E-6)
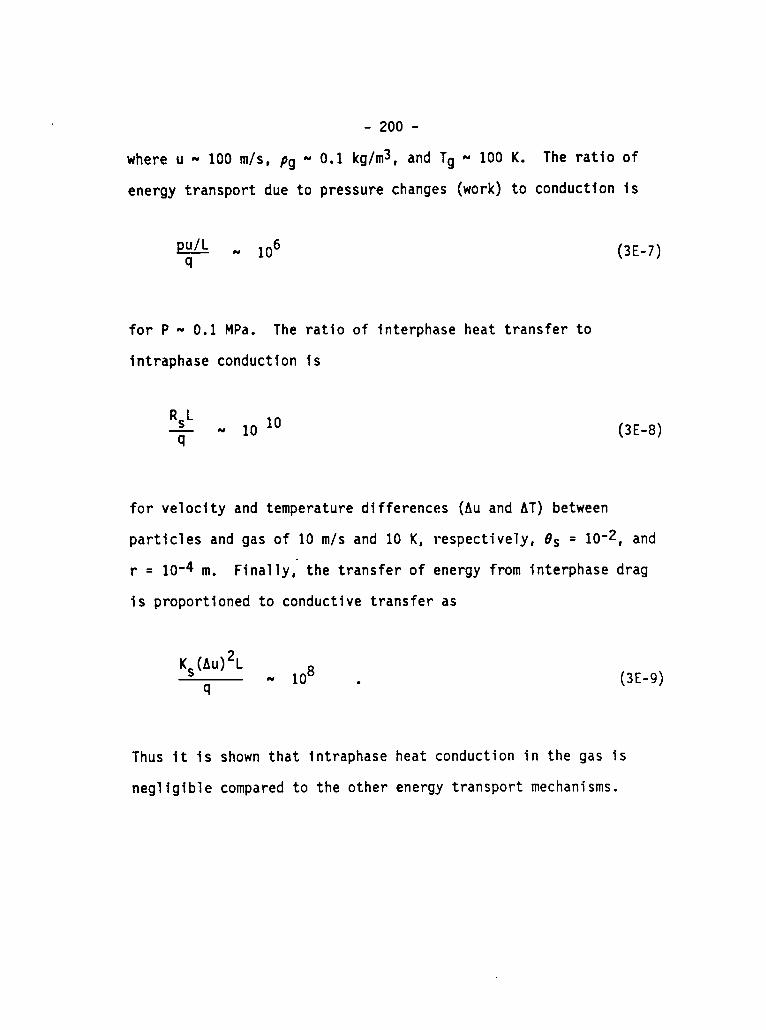
where u - 100 m/s, pg-energy transportdue to
pu/L~
N 106
- 200 -
oel kg/m3, and Tg N 100 K. The ratio of
pressure changes (work) to conductionis
(3E-7)
for P w 0.1 MPa. The ratio of interphaseheat transfer to
Intraphaseconductionis
(3E-8)
for velocity and temperaturedifferences (Au and AT) between
particles and gas of 10 m/s and 10 K, respectively,0s = 10-2, and
r= 10-4 m. Finally: the transfer of energy from interphasedrag
is proportionedto conductivetransfer as
Ks(Au)2L
~- 108 .
Thus it Is shown that intraphase
negligible compared to the other
(3E-9)
heat conductionin the gas is
energy transportmechanisms.

- 201 -
REFERENCES
Allen JRL (1970) Physicalprocessesof sedimentation. Allen and
Unwin Publ Co, London, pp 189-192
Amsden AA, Harlow FH (1974)KACHINA: An Euleriancomputer program
for multifield fluid flows. Los Alamos Nat Lab Rep LA-5680
Bacon CR (1983) Eruptive history of Mount Mazama and Crater Lake
Caldera, Cascade Range, USA. J VolcanolGeotherm Res 18: 57-115
Bagnold RA (1956) Flow of cohesionlessgrains in fluids. Phil Trans
R Soc London Ser A 255: 235-297
Bird R8, Stewart WE, LightfootEN (1960)Transportphenomena. John
Wiley and Sons New York, 780 pp
Blandford RD, Rees MF (1974)A ‘twin-exhaust’model for double radio
sources. Monthly Not R Astron Soc 169: 395-415
Borisov AA, Lyubimov AV, Kogarko S!4,Kozenko VP (1967) Instability
of the surface of a granularmedium behind a sliding shock. Comb
Expl Shock Waves 3: 149-151
Brown GL, Roshko A (1974)On density effects and large structure in
turbulent mixing layers. J Fluid Mech 64: 775-816
Buesch DC, Valentine GA (1986) Peach Springs Tuff and volcanic
stratigraphyof the southernCerbat Mountains, Kingman, Arizona.
In: Nielson JE, Glazner AF (eds) Cenozoic stratigraphy,
structure, and mineralizationin the Mojave Desert. Geol Soc Am
Guidebook and Volume, CordilleranSection, pp. 7-14
Campbell CS, Brennen C.E. (1985)Computer simulationof granular
shear flows. J Fluid Mech 151: 167-188

- 202 -
Caress ME (1985) Volcanologyof the YoungestToba Tuff, Sumatra.
Unpub PhD dissertation,Univ Hawaii
Carey S, Sparks RSJ (1986)Quantitativemodels of the fallout and
dispersal of tephra from volcanic eruption columns. Bull
Volcanol 48: 127-141
Carrier GF (1958)Shock waves in a dusty gas. J Fluid Mech 4:
376-382
Cas RAF, Wright JV (1987) Volcanic successions: Modern and ancient.
Allen and Unwin Publ Co, London, 528 pp
CRC handbook of chemistryand physics 60th edition (1979)p E-393.
The Chemical Rubber Publ Co, Boca Raton (Florida)
Criswell CW (1987) Chronologyand pyroclasticstratigraphyof the
May 18, 1980, eruption of Mount St. Helens, Washington.J Geophys
Res 92: 10237-10266
Crowe BM, Fisher RV (1973)Sedimentarystructuresin base-surge
deposits with special referenceto cross-bedding,Ubehebe
Craters, Death Valley, California. Geol Soc Am Bull 84: 663-682
Delvigne GAL (1986)Model for verticaldiffusion in stratified
flows. J HydraulicsDiv: ASCE 112: 1069-1086
Denlinger RP (1987)A model for generationof ash clouds by
pyroclastic flows, with applicationto the 1980 eruptions at
Mount St. Helens, Washington. J Geophys Res 92: 10284-10298
Dingman S1 (1984) Fluvial hydrology. WH Freeman and Co. New York,
pp 105, 166-173
- 203 -
Dokka RK (1983)Displacementon late Cenozoic strike slip faults in
the central Mojave Desert, California. Geology 11: 305-308
Dokka RK (1986) Patternsand modes of early Miocene crustal
extension,central Mojave Desert, California. Geol Soc Am Sp Pap
208: 75-95
Drultt TH (1985)Vent evolution
Cape Riva eruption of Santor
Druitt TH, Bacon CR (1986) Lith
and lag breccia formationduring the
ni, Greece. J Geol 93: 439-454
c breccia and ignimbriteerupted
during the collapse of Crater Lake caldera,Oregon. J Volcanol
Geotherm Res 29: 1-32
Druitt TH, Sparks RSJ (1982) A proximal ignimbritebreccia facies on
Santorini,Greece. J Volcanol Geotherm Res 13: 147-171
Druitt TH, Sparks RSJ (1984)On the formationof calderas during
ignimbriteeruptions. Nature 310: 679-681
EichelbergerJC, Carrigan CR, Westrich HR, Price RH (1986)Non-
explosive siliclc volcanism. Nature 323: 598-602
Fisher RV (1979)Models for pyroclasticsurges and pyroclastic
flows. J Volcanol Geotherm Res 6: 305-318
Fisher RV (1983) Flow transformationsin sediment gravity flows.
Geology 11: 273-274
Fisher RV (1986)Systems of transportand depositionwithin
pyroclastic surges: Evidence from Mount St. Helens, Washington.
EOS Trans Am Geophys Union 67: 1246

- 204 -
Fisher RV, Heiken G (1982)Mt. Pelee, Martinique: May 8 and 20,
1902 pyroclasticflows and surges. J VOlcanOlGeOthermRes 13:
339-371
Fisher RV, Schmincke H-U (1984)Pyroclasticrocks. Springer-Verlag
Berlin Heidelberg,472 pp
Fisher RV, Waters AC (1970)Base surge bed forms in maar volcanoes.
Am J Sci 268: 157-180
Fisher RV, Glicken HX, Hoblitt RP (1987)May 18, 1980, Mount St.
Helens deposits in South ColdwaterCreek, Washington. J Geophys
Res 92: 10267-10,283
Flaud JM, Peyret CC, Maillard JP, GuelachviliG (1977)The H20
spectrum between 4200 and 5000 cm-l. J Mol Spectro 65: 219-228
Freundt A, Schmincke H-U (1985)Lithic-enrichedsegregationbodies
in pyroclastic flow deposits of Laacher See volcano (East Eiffel,
Germany). J Volcanol,Geotherm Res 25: 193-224
Freundt A, Schmincke H-U (1986)Emplacementof small-volume
pyroclastic flows at Laacher See (East-Eiffel,Germany). Bull
Volcanol 48: 39-59
Ghosh JK, Mazumder BS, Saha MR, Sengupta S (1986)Depositionof sand
by suspensioncurrents: Experimentaland theoreticalstudies. J
Sed Pet 56: 57-66
Glazner AF, Nielson JE, Howard I(A,Miller DM (1986)Correlationof
the Peach Springs Tuff, a large-volumeMiocene ignimbritesheet
in California and Arizona. Geology 14: 840-843
- 205 -
Goff FE, Eddy AC, Arney BH (1983)Reconnaissancegeologic strip map
from Kingman to south of Bill Williams Mountain,Arizona. Los
Alamos National LaboratoryLA-9202-MAP
Gusa S, Nielson JE, Howard K4 (1987) Heavy-mineralsuites confirm
the wide extent of the Peach Springs Tuff in Californiaand
Arizona, USA. J VolcanolGeotherm Res 33: 343-347
Hampton MA (1972) The role of subaqueousdebris flow in generating
turbidity currents. J Sed Pet 42: 775-793
Harlow FH, Amsden AA (1975)Numericalcalculationof multiphase
fluid flow. J CompPhys 17: 19-52
Heiken G, Wohletz K (1985)VolcanicAsh. Universityof California
Press Berkely Los Angeles London, pp 113-117
Hildreth W (1987)New perspectiveson the eruption of 1912 in the
Valley of Ten Thousand Smokes, Katmai National Park, Alaska.
Bull Volcanol 49: 680-693
Hirt CW (1968) Heuristic stabilitytheory for finite-difference
equations. J Comp Phys 2: 339-355
Hoblitt RP, Miller DC (1984)Comment on ‘Mount St. Helens 1980 and
Mount Pelee 1902--F1owor surge?” Geology 12: 692-693
Hoblitt RP, Miller DC, Vallance JE (1981) Origin and stratigraphyof
the deposits produced by the May 18 directed blast. In: Lipman
PW, Mullineaux DR eds. The 1980 eruptionsof Mount St. Helens,
Washington, USGS Prof Pap 1250: 401-419
Horn M (1986) Physicalmodels of pyroclasticclouds and fountains.
Unpub MS thesis, Arizona State Univ

- 206 -
Houghton BF, Schmincke H-U (1986)Mixed deposits of simultaneous
Strombolianand phreatomagmaticvolcanism: Rothenbergvolcano,
East Eifel volcanic field. J VolcanolGeotherm Res 30: 117-130
Howard KA, John BE (1987)Crustal extensionalong a rooted system of
imbrlcate low-angle faults:
Californiaand Arizona. In:
(eds) ContinentalExtension’
299-311
Colorado River extensionalcorridor,
Coward MP, Dewey JF, Hancock PL
Tectonics. Geol Soc Am Sp Pub 28:
Hwang CC (1986) Initial stages of the interactionof a shock wave
with a dust deposit. Int J MultiphaseFlow 12: 655-666
Incropera FP, DeWitt DP (1981)Fundamentalsof heat transfer. John
Wiley and Sons, New York, 819 pp
Ingram RL (1954)Terminologyfor the thicknessof stratificationand
parting units In sedimentaryrocks. Geol Soc Am Bull 65: 937-938
Ishli R, Umeda Y, Kawasaki K (1987)Nozzle flows of gas-particle
mixtures. Phys Fluids 30: 752-760
Jakosky BM (1986)Volcanoes,the stratosphere,and climate. J
Volcanol Geotherm Res 28: 247-255
Jobson HE, Sayre WW (1970)Vertical transfer in open channel flow.
J HydraulicsDiv: ASCE 96: 703-724
Joint Army, Navy, NASA, Air Force JANNAF (1975)Handbook of rocket
exhaust plume technology. Chem Prop Info Agency Publ 263, 237
PP*
- 207 -
Jopling AV, Walker RG (1968)Morphologyand origin of ripple-drift
cross-lamination,with examples from the Pleistoceneof
Massachusetts. J Sed Pet 38: 971-984
Karl HA, Cacchione DA, Carlson PR (1986) Internal-wavecurrents as a
mechanism to account for large sand waves in NavarinskyCanyon
head, Bering Sea. J Sed Pet 56: 706-714
Kennedy JF (1963) The mechanics of dunes and antidunes in erodible-
bed channels. J Fluid Mech 30: 741-773
Kleffer SW (1981) Fluid dynamics of the May 18 blast at Mount St.
Helens. In: Lipman PW, MullineauxDR eds. The 1980 eruptions of
Mount St. Helens, Washington,USGS Prof Pap 1250: 379-400
Kieffer SW (1982)Dynamics and thermodynamicsof volcanic eruptions:
Implicationsfor the plumes on Io. In: Morrison D (cd)
Satellites of Jupiter, Univ Arizona Press, Tucson, pp 647-723
Kieffer SW (1984) Factors governing the structureof volcanic jets.
In Explosive volcanism: Inception,Evolution,and Hazards,
National Academy Press, Washington,pp 143-157
Kieffer SW, Sturtevant B (1984) Laboratorystudies of volcanic jets.
J Geophys Res 89: 8253-8268
Kieffer SW and Sturtevant B (1986) Erosionalfurrows formed during
the lateral blast at Mount St. Helens, May 18, 1980: Indicators
of longitudinalvortices in the boundary layer. Abstr Intl
Volcanol Cong, New Zealand: p. 53
- 208 -
Kite WM (1985) Caldera-formingeruption sequencesand facies
variations in the BandelierTuff, central New Mexico. Unpubl MS
thesis, Arizona State Univ
Liepmann HW, Roshko A (1957)Elementsof gas dynamics. John Wiley
and Sons, Inc. NewYork, pp. 338-340
Lin J-T, Pao Y-H (1979)Wakes in stratifiedfluids. Ann Rev Fluid
Mech 11: 317-338
Lipman PW (1976)Caldera-col’
Mountains, Colorado. Gee’
Lipman PW (1986) Emplacement
apse breccias in the western San Juan
Soc Am Bull 87: 1297-1410
of large ash-flow sheets and relation
to caldera collapse. Abstr Intl Volcanol Cong, New Zealand, p 58
Lipman PW, Steven TA, Luedke RG, BurbankWS (1973)Revised volcanic
history of the San Juan, Uncompahgre,Silverton,and Lake city
calderas in the western San Juan Mountains,Colorado. US Geol
Survey J Res 1: 627-642
Marble FE (1970) Dynamicsof dusty gases. Ann Rev Fluid Mech 2:
397-446
McPhie J (1986) Primary and redepositedfacies from a large-
magnitude, rhyolitic,phreatomagmaticeruption: Cana Creek Tuff,
late Carboniferous,Australia. J VolcanolGeotherm Res 28:
319-350
Middleton GV, Southard JB (1978)Mechanicsof sediment movement.
Soc Econ PaleontolMineral Short Course 3, Eastern Section: pp
6.37-41
- 209 -
Moore JG (1967) Base surge in recent volcanic eruptions. Bull
Volcanol 30: 337-363
Morton BR, Taylor GI, Turner JS (1956)Turbulentgravitational
convection from maintained and instantaneoussources. Philos
Trans R Soc London Ser A 234: 1-23
Norman ML, Smarr L, Winkler KHA, Smith MD (1982)Structure and
dynamics of supersonicjets. Astron Astrophys 113: 285-302
Prandtl L (1949)The essentialsof fluid mechanics. Blackie and Son
Ltd, London
Reynolds WC, Perkins HC (1977)Engineeringthermodynamics. McGraw
Hill Book Co, New York, 690 pp
Richards K (1982)Rivers, form and process in alluvial channels.
Methuen & Co. Ltd. London, p 87
Riehle JR (1973)Calculatedcompactionprofiles of rhyolitic ash-
flow tuffs. Geol Soc Am Bull 84: 2193-2216
Rose WI, Chesner CA (1987)Dispersalof ash in the great Toba
eruption, 75 ka. Geology 15: 913-917
Rudinger G (1964)Some propertiesof shock relaxation in gas flows
carrying small particles. Phys Fluids 7: 658-663
Savage SB (1984)The mechanics of rapid granular flows. Adv Applied
Mech 24: 289-366
Schlichting H (1979) Boundary-layertheory, 7th edition. McGraw-
Hill Book Co. New York, pp 512-513, 715-723
Schmlncke H-U, Fisher RV,
pool structures in the
- 210 -
Waters AC (1973)Antidune and chute and
base surge deposits of the Laacher See
area, Germany. Sedimentology20: 553-574
Self S (1983) Large-scalephreatomagmaticsilicic volcanism: A case
study from New Zealand. J VolcanolGeotherm Res 17: 433-469
Self S, Sparks RSJ (1978)Characteristicsof
deposits formed by the interactionof sil”
Bull Volcanol 41: 196-212
widepsreadpyroclastic
cic magma and water.
Settle M (1978) Volcanic clouds and the thermal output of explosive
eruptions. J Volcanol Geotherm Res 3: 309-324
Sheppard PA (1956)
528-529
Sheridan MF (1979)
Airflow over mountains.Qu J R Met Soc 82:
Emplacementof pyroclasticflows: A review.
Geol Soc Am Sp Pap 180: 125-136
Sigurdsson H, Carey SN, Fisher RV (1987)The 1982 eruption of El
Chichon volcano, Mexico (3): Physicalpropertiesof pyroclastic
surges. Bull Volcanol 49: 467-488
Smith RL (1960)Zones and zonal variationsin welded ash flows. US
Geol Surv Prof Pap 354-F
Smith RL (1979)Ash-flow magmatism.
Snyder WH, Thompson RS, Eskridge RE,
Geol Soc Am Sp Pap 180: 5-27
Lawson RE, Castro 1P, Lee JT,
Hunt JCR, Ogawa Y (1985)The structureof strongly stratified
flow over hills: dividing-streamlineconcept. J Fluid Mech 152:
249-288
- 211 -
Sparks RSJ (1976) Grain size variationsin ignimbritesand
implicationsfor the transportof pyroclasticflows.
Sedimentology23: 147-188
Sparks RSJ (1978) Gas release rates from pyroclasticflows: An
assessment of the role of fluidisationin their emplacement.
Bull Volcanol 41: 1-9
Sparks RSJ (1986) The dimensionsand dynamics of volcanic eruption
columns. Bull Volcanol 48: 3-16
Sparks RSJ, Walker GPL (1973)The ground surge deposit--A third type
of pyroclastic rock. Nature, Phys Sci 241: 62-64
Sparks RSJ, Walker GPL (1977)The significanceof vitric-enriched
air-fall ashes associatedwith crystal-enrichedignimbrites. J
Volcanol Geotherm Res 2: 329-341
Sparks RSJ, Wilson L (1976)A model for the formationof ignimbrite
by gravitationalcolumn collapse. J Geol SOC London 132: 441-451
Sparks RSJ, Wilson L (1982) Explosivevolcanic eruptions - V.
Observationsof plume dynamics during the 1979 Soufriere
eruption, St. Vincent. Geophys J R Astron Soc 69: 551-570
Sparks RSJ, Self S, Walker GPL (1973) Productsof ignimbrite
eruption. Geology 1: 115-118
Sparks RSJ, Wilson L, Hulme G (1978)Theoreticalmodeling of the
generation, movement and emplacementof pyroclastic flows by
column collapse. J Geophys Res 83: 1727-1739
Steven TA, Lipman PW (1976)Calderas of the San Juan volcanic field,
southwesternColorado. US Geol Surv Prof Pap 958
- 212 -
Stewart HB, Wendroff B (1984)Two-phaseflow: Models and methods.
J Comp Phys 56: 363-409
Taylor GA (1958)The 1951 eruption of Mount Lamington,Papua. Austr
Bur Min Resour Geol Geophys Bull 38: 1-117
Tennekes H, Lumley JL (1972) A first course in turbulence. MIT
Press, Cambridge (Massachusetts),300 pp
Thomas DG (1964) Periodicphenomenaobserved with spherical
particles in horizontalpipes. Science 144: 534-536
Thorson JP (1971) Igneous Petrologyof the Oatman District,Mojave
County, Arizona. Unpub PhD dissertation,Univ Calif Santa
Barbara
Valentine GA (1987)Stratifiedflow in pyroclasticsurges. Bull
Volcanol 49: 616-631
Valentine GA, Fisher RV (1986)Origin of layer 1 deposits in
ignimbrites. Geology 14: 146-148
Valentine GA, Wohletz KH (1987)Significanceof exit pressure in
plinian eruptions. EOS Trans Am Geophys Union 68: 1535
Waitt RB Jr. (1981) Devastatingpyroclasticdensity flow and
attendant air fall of May 18--Stratigraphyand sedimentologyof
the deposits. In: Lipman PW, MullineauxDR, eds. The 1980
eruptions of Mount St. Helens, Washington,USGS Prof Pap 1250:
439-458
Waitt RB Jr. (1984)Comments on “Mount St. Helens 1980 and Mt. Pelee
1902--F1owor surge?” Geology 12: 693

I
- 213 -
Walker GPL (1983) Ignimbritetypes and ignimbriteproblems. J
Volcanol Geotherm Res 17: 65-88
Walker GPL (1984) Characteristicsof dune-beddedpyroclasticsurge
bedsets. J Volcanol Geotherm Res 20: 281-296
Walker GPL (1985)Origin of coarse lithic breccias near ignimbrite
source vents. J Volcanol Geotherm Res 25: 157-171
Walker GPL, McBroome LA (1983)Mount St. Helens 1980 and Mount Pelee
1902--F1owor surge? Geology 11: 571-574
Walker GPL, McBroome LA (1984)Reply to comments on “Mount St.
Helens 1980 and Mount Pelee 1902--F1owor surge?” Geology 12:
693-695
Walker GPL, Wilson CJN (1983) Lateral variationsin the Taupo
ignimbrite. J Volcanol Geotherm Res 18: 117-133
Walker GPL, Wilson L, Bowell ELG (1971)Explosivevolcanic eruptions
-I. The rate of fall of pyroclasts. Geophys J R Astron SOC 22:
377-383
Walker GPL, Self S., Froggatt PC (1981a) The ground layer of the
Taupo ignimbrite: A striking example of sedimentationfrom a
pyroclastic flow. J Volcanol Geotherm Res 10: 1-11
Walker GPL, Wilson CJN, Froggatt PC (1981b)An ignimbriteveneer
deposit: The trail-markerof a pyroclasticflow. J Volcanol
Geotherm Res 9: 409-421
Waters AC, Fisher RV (1971)Base surges and their deposits:
Capelinhos and Taal volcanoes. J Geophys Res 76: 5596-5614
- 214 -
Wilson CJN (1980) The role of fluidizationin the emplacementof
pyroclastlc flows: An experimentalapproach. J Volcanol
Geothenn Res 8: 231-249
Wilson CJN (1984) The role of fluidizationin the emplacementof
pyroclastic flows 2: Experimentalresults and their
interpretation. J Volcanol Geotherm Res 20: 55-84
Wilson CJN (1985) The Taupo eruption,New Zealand II: The Taupo
ignimbrite. Phil Trans R Soc London Ser A 314: 229-310
Wilson CJN, Walker GPL (1982) Ignimbritedepositionalfacies: The
anatomy of a pyroclasticflow. J Geol Soc London 139: 581-592
Wilson CJN, Walker GPL (1985)The Taupo eruption,New Zealand I.
General aspects. Phil Trans R Soc London Ser A 314: 199-228
Wilson L (1976) Explosivevolcanlc eruptions - III. Plinian
eruption columns. Geophys J R Astron Soc 45: 543-556
Wilson L, Head JW (1981) Morphologyand rheologyof pyroclastic
flows and their deposits,and guidlines for future observations.
In: Lipman PW, MullineauxDR (eds) The 1980 eruptions of Mount
St. Helens, Washington,USGS Prof Pap 1250: 513-524
Wilson L, Walker GPL (1987)Explosivevolcanic eruptions - VI.
Ejecta dispersal in plinian eruptions: The control of eruption
conditions and atmosphericproperties. Geophys J R Astron Soc
89: 657-679
Wilson L, Sparks RSJ, Huang TC, Watkins ND (1978)The control of
volcanic column heights by eruption energetic and dynamics. J
Geophys Res 83: 1829-1836
- 215 -
Wilson L, Sparks RSJ, Walker GPL (1980) Exploslvevolcanic eruptions
- IV. The control of magma propertiesand conduit geometry on
eruption column behavior. Geophys J R Astron Soc 63: 117-148
Wilson L, PinkertonH, MacDonald R (1987)Physical processes in
volcanic eruptions. Ann Rev Earth Planet Sci 15: 73-95
Wohletz KH (1983)Mechanismsof hydrovolcanicpyroclast formation:
Grain-size, scanning electronmicroscopy,and experimental
studies. J Volcanol Geotherm Res 17: 31-63
Wohletz KH (1986) Explosivemagma-waterinteractions:
Thermodynamics,explosionmechanisms,and field studies. Bull
Volcanol 48: 245-264
Wohletz KH, Sheridan MF (1979)A model of pyroclasticsurge. Geol
Soc Am Sp Pap 180: 177-194
Wohletz KH, McGetchin TR, Sandford MT II, Jones EM (1984)
Hydrodynamicaspects of caldera-formingeruptions: Numerical
models. J Geophys Res 89: 8269-8286
Wright JV (1981) The Rio Caliente ignimbrite: Analysis of a
compound intraplinianignimbritefrom a major late Quaternary
Mexican eruption, Bull Volcanol 44: 189-212
Wright JV, Walker GPL (1977)The ignimbritesource problem:
Significanceof a co-ignimbritelag-falldeposit.
729-732
Wright JV, Walker GPL (1981)Eruption
ignimbrite: A case study from Mex”
9: 111-131
Geology 5:
transportand depositionof
co. J Volcano’ Geotherm Res

- 216 -
Wright JV, Smith AL, Self S (1980)A working terminologyof
pyroclasticdeposits. J Volcanol Geotherm Res 8: 315-336
Yih C-S (1980)Stratifiedflows. Academic Press New York, PP
103-141
Young RA (1966)Cenozoic Geology Along the Edge of the Colorado
Plateau in NorthwesternArizona. Unpub PhD dissertation,
Washington Univ
Young RA, Brennan WJ (1974)Peach Springs luff: Its bearing on
structuralevolutionof the Colorado Plateau in northwestern
Arizona. Geol Soc Am Bull 85: 83-90
* U.S. GOVERNMENT PRINTING OFFICE: 1988-573-103/60039
NTISPage Rangt Price code
Printed inthc United Statesof AmericaAwilablc from
National Technical Information ServiceUS Department of Commerce
5285 PorI Royal RendSpringfield,VA 22161
Microfiche (AOl]
NTISPage Range price Code Page Range
NTISPrice Code
NTISPage Range Pricz Code
001.025 A02026.050 A030s 1.075 A04076.100 A05101.125 A06126.150 A07
151.175 ‘ A08176.200 A09201.225 AIO226250 All251.275 A12276300 A13
301.32S326.350351.375376.400401.425426.4sO
A14A15A 16A17A18A19
451.475 A20476500 A21501.525 A22526.550 A23551575 A24576600 A25601 Up” A99
“Contact NTIS for a price quote.
,