Fidelity Investments Hong Kong Retirement Education March 6, 2002 Fidelity Retirement Services...
25
Fidelity Investments Hong Kong Retirement Education March 6, 2002 Fidelity Retirement Services Investment Review
-
date post
21-Dec-2015 -
Category
Documents
-
view
218 -
download
2
Transcript of Fidelity Investments Hong Kong Retirement Education March 6, 2002 Fidelity Retirement Services...

Fidelity Investments Hong KongRetirement Education
March 6, 2002
Fidelity Retirement Services Investment Review
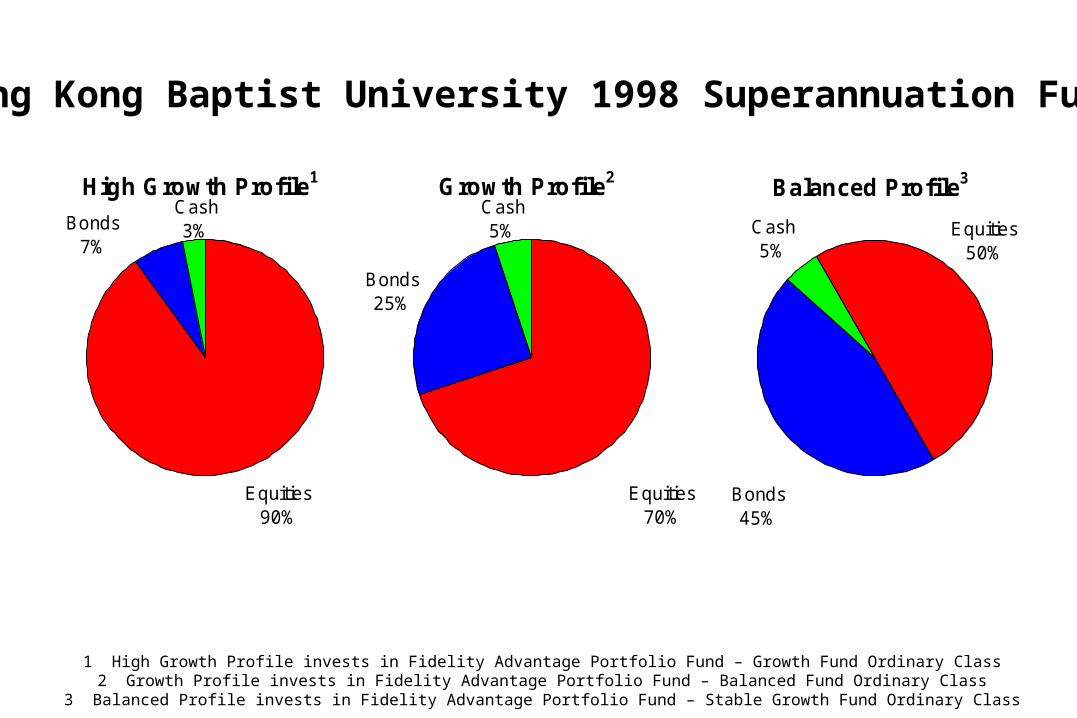
Hong Kong Baptist University 1998 Superannuation Fund
High Growth Profile1
Equities90%
Cash3%Bonds
7%
Growth Profile2
Bonds25%
Equities70%
Cash5%
Balanced Profile3
Cash5%
Bonds45%
Equities50%
1 High Growth Profile invests in Fidelity Advantage Portfolio Fund – Growth Fund Ordinary Class2 Growth Profile invests in Fidelity Advantage Portfolio Fund – Balanced Fund Ordinary Class
3 Balanced Profile invests in Fidelity Advantage Portfolio Fund – Stable Growth Fund Ordinary Class
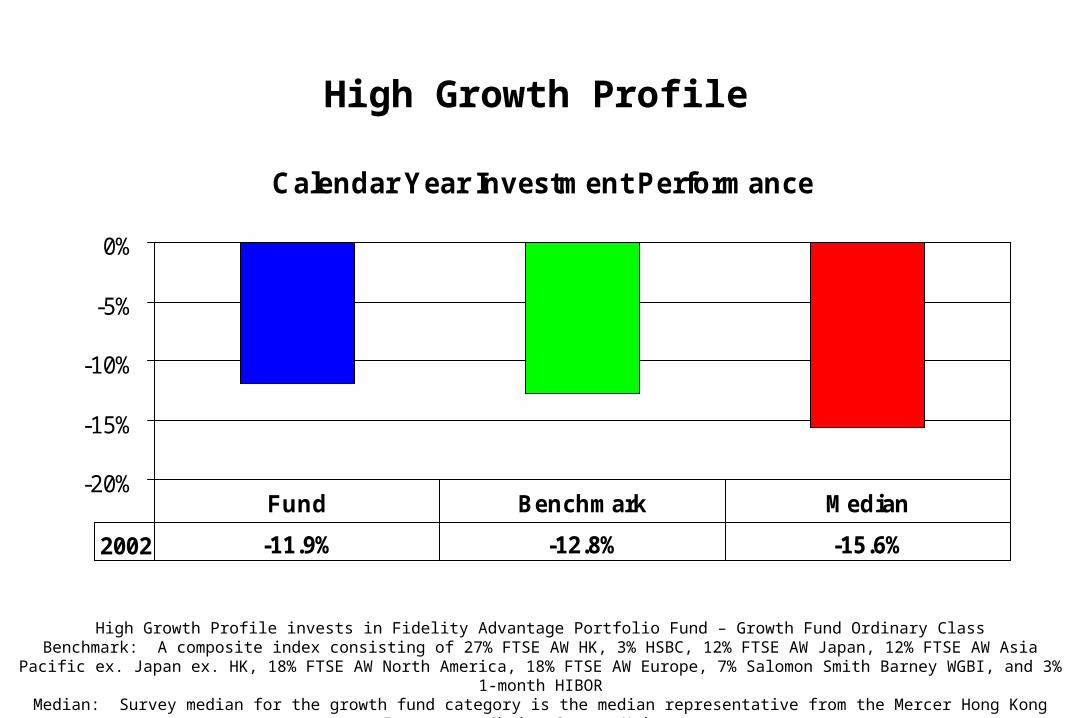
High Growth Profile
High Growth Profile invests in Fidelity Advantage Portfolio Fund – Growth Fund Ordinary ClassBenchmark: A composite index consisting of 27% FTSE AW HK, 3% HSBC, 12% FTSE AW Japan, 12% FTSE AW Asia Pacific ex. Japan ex. HK,
18% FTSE AW North America, 18% FTSE AW Europe, 7% Salomon Smith Barney WGBI, and 3% 1-month HIBORMedian: Survey median for the growth fund category is the median representative from the Mercer Hong Kong Investment Choice Survey Universe
Source: Fidelity Investments & Mercer Investment Consulting, Ordinary Class, NAV to NAV, in USD, as of December 31, 2002.
Calendar Year Investment Performance
-20%
-15%
-10%
-5%
0%
2002 -11.9% -12.8% -15.6%
Fund Benchmark Median

Growth Profile
Calendar Year Investment Performance
-20%
-15%
-10%
-5%
0%
2002 -6.9% -7.1% -8.3%
Fund Benchmark Median
Growth Profile invests in Fidelity Advantage Portfolio Fund – Balanced Fund Ordinary ClassBenchmark: A composite index consisting of 21.6% FTSE AW HK, 2.4% HSBC, 9% FTSE AW Japan, 9% FTSE AW Asia Pacific ex. Japan ex. HK,
14% FTSE AW North America, 14% FTSE AW Europe, 25% Salomon Smith Barney WGBI, and 5% 1-month HIBORMedian: Survey median for the balanced fund category is the median representative from the Mercer Hong Kong Investment Choice Survey
UniverseSource: Fidelity Investments & Mercer Investment Consulting, Ordinary Class, NAV to NAV, in USD, as of December 31, 2002.

Balanced Profile
Calendar Year Investment Performance
-20%
-15%
-10%
-5%
0%
2002 -1.3% -0.9% -1.7%
Fund Benchmark Median
Balanced Profile invests in Fidelity Advantage Portfolio Fund – Stable Growth Fund Ordinary ClassBenchmark: A composite index consisting of 15.3% FTSE AW HK, 1.7% HSBC, 6.5% FTSE AW Japan, 6.5% FTSE AW Asia Pacific ex. Japan ex.
HK, 10% FTSE AW North America, 10% FTSE AW Europe, 45% Salomon Smith Barney WGBI, and 5% 1-month HIBORMedian: Survey median for the stable growth fund category is the median representative from the Mercer Hong Kong Investment Choice Survey
UniverseSource: Fidelity Investments & Mercer Investment Consulting, Ordinary Class, NAV to NAV, in USD, as of December 31, 2002.

High Growth Profile
High Growth Profile invests in Fidelity Advantage Portfolio Fund – Growth Fund Ordinary ClassMedian: Survey median for the growth fund category is the median representative from the Mercer Hong Kong Investment Choice Survey Universe
Source: Mercer Investment Consulting, NAV to NAV, in USD, as of December 31, 2002.
Quarterly Investment Performance
-20%
-15%
-10%
-5%
0%
5%
Fund 1.1% -2.4% -13.9% 3.7%
Median 0.8% -4.5% -15.2% 3.8%
Q1 2002 Q2 2002 Q3 2002 Q4 2002

Growth Profile
Quarterly Investment Performance
-15%
-10%
-5%
0%
5%
Fund 0.4% -0.3% -10.2% 3.8%
Median 0.3% -1.6% -11.2% 3.8%
Q1 2002 Q2 2002 Q3 2002 Q4 2002
Growth Profile invests in Fidelity Advantage Portfolio Fund – Balanced Fund Ordinary ClassMedian: Survey median for the balanced fund category is the median representative from the Mercer Hong Kong Investment Choice Survey
UniverseSource: Mercer Investment Consulting, NAV to NAV, in USD, as of December 31, 2002.

Balanced Profile
Quarterly Investment Performance
-10%
-5%
0%
5%
Fund -0.1% 1.9% -6.6% 3.8%
Median -0.2% 1.1% -7.0% 3.7%
Q1 2002 Q2 2002 Q3 2002 Q4 2002
Balanced Profile invests in Fidelity Advantage Portfolio Fund – Stable Growth Fund Ordinary ClassMedian: Survey median for the stable growth fund category is the median representative from the Mercer Hong Kong Investment Choice Survey
UniverseSource: Mercer Investment Consulting, NAV to NAV, in USD, as of December 31, 2002.

Cumulative Performance
-12%
-10%
-8%
-6%
-4%
-2%
0%
6-Month -10.7% -10.6%
Fund Benchmark
High Growth Profile
High Growth Profile invests in Fidelity Advantage Portfolio Fund – Growth Fund Ordinary Class
Benchmark: A composite index consisting of 27% FTSE AW HK, 3% HSBC, 12% FTSE AW Japan, 12% FTSE AW Asia Pacific ex. Japan ex. HK, 18% FTSE AW North America, 18% FTSE AW Europe, 7% Salomon Smith Barney WGBI, and 3% 1-month HIBOR
Source: Fidelity Investments, Ordinary Class, NAV to NAV, in USD, as of December 31, 2002.
Cumulative Performance
0%
5%
10%
15%
20%
25%
30%
Since 1/1995 24.5% 20.0%
Fund Benchmark

Cumulative Performance
-8%
-6%
-4%
-2%
0%
6-Month -6.9% -6.7%
Fund Benchmark
Growth Profile
Growth Profile invests in Fidelity Advantage Portfolio Fund – Balanced Fund Ordinary Class
Benchmark: A composite index consisting of 21.6% FTSE AW HK, 2.4% HSBC, 9% FTSE AW Japan, 9% FTSE AW Asia Pacific ex. Japan ex. HK, 14% FTSE AW North America, 14% FTSE AW Europe, 25% Salomon Smith Barney WGBI, and 5% 1-month HIBOR
Source: Fidelity Investments, Ordinary Class, NAV to NAV, in USD, as of December 31, 2002.
Cumulative Performance
0%
5%
10%
15%
20%
25%
30%
35%
Since 1/1995 32.7% 31.9%
Fund Benchmark

Cumulative Performance
-3.5%
-3.0%
-2.5%
-2.0%
-1.5%
-1.0%
-0.5%
0.0%
6-Month -3.1% -2.7%
Fund Benchmark
Balanced Profile
Balanced Profile invests in Fidelity Advantage Portfolio Fund – Stable Growth Fund Ordinary Class
Benchmark: A composite index consisting of 15.3% FTSE AW HK, 1.7% HSBC, 6.5% FTSE AW Japan, 6.5% FTSE AW Asia Pacific ex. Japan ex. HK, 10% FTSE AW North America, 10% FTSE AW Europe, 45% Salomon Smith Barney WGBI, and 5% 1-month HIBOR
Source: Fidelity Investments, Ordinary Class, NAV to NAV, in USD, as of December 31, 2002.
Cumulative Performance
0%
1%
2%
3%
4%
5%
6%
Since 5/1997 5.2% 2.7%
Fund Benchmark

Cumulative Performance since Inception
Superannuation Fund Inception with Fidelity Investments on April 1, 2002 and performance inception on April 30, 2002High Growth Profile invests in Fidelity Advantage Portfolio Fund – Growth Fund Ordinary Class
Benchmark: A composite index consisting of 27% FTSE AW HK, 3% HSBC, 12% FTSE AW Japan, 12% FTSE AW Asia Pacific ex. Japan ex. HK, 18% FTSE AW North America, 18% FTSE AW Europe, 7% Salomon Smith Barney WGBI, and 3% 1-month HIBOR
Growth Profile invests in Fidelity Advantage Portfolio Fund – Balanced Fund Ordinary Class
Benchmark: A composite index consisting of 21.6% FTSE AW HK, 2.4% HSBC, 9% FTSE AW Japan, 9% FTSE AW Asia Pacific ex. Japan ex. HK, 14% FTSE AW North America, 14% FTSE AW Europe, 25% Salomon Smith Barney WGBI, and 5% 1-month HIBOR
Balanced Profile invests in Fidelity Advantage Portfolio Fund – Stable Growth Fund Ordinary ClassBenchmark: A composite index consisting of 15.3% FTSE AW HK, 1.7% HSBC, 6.5% FTSE AW Japan, 6.5% FTSE AW Asia Pacific ex. Japan ex.
HK, 10% FTSE AW North America, 10% FTSE AW Europe, 45% Salomon Smith Barney WGBI, and 5% 1-month HIBORSource: Fidelity Investments, Ordinary Class, NAV to NAV, in USD, from April 30, 2002 to January 31, 2003.
-20%
-15%
-10%
-5%
0%
Fund -15.7% -9.6% -3.1%
Benchmark -15.6% -9.3% -2.7%
High Growth Growth Balanced

Difficult to see bonds outperforming equities by so much = Own bonds and equities
Corporate bonds, especially high yield bonds, offer value relative to government bonds
= Bias towards corporate bonds
Difficult to forecast market returns =Own globally diversified on a sector and geographic basis portfolio
Divergence between growth and value likely to be less extreme = Own growth and value
Value in large, mid and small cap stocks = Stock pickers market - invest across the broad market
2003 Investment Strategy Outlook

Asset Class Investment View Main Reasons
Hong Kong EquityCautiously
Positive Downgraded High dividend yield. Fundamental slowly improving.
USA EquityCautiously
Positive Upgraded
Valuations improving. Strong buying momentum. Fundamental improving.
Japan EquityCautiously
Positive Downgraded Attractive valuations. Excess money supply.
Europe Equity Negative DowngradedDim economic prospect. More company downgrades than upgrades.
Asia Pacific EquityCautiously
PositiveStable Relatively cheap valuations. Maybe more upgrades in 2003.
Global Bond Negative DowngradedValuation fair but equities are little more attractive in the coming cycle.
Investment Strategy Summary

www.fidelity.com.hk


2629 2666
Investment involves risks. Past performance is no guarantee of future returns. Please refer to the Explanatory Memorandum of Fidelity Advantage Portfolio Fund for further details.
Investment in the Fidelity Advantage Portfolio Fund is not available to the general investing public. Investment in the Fidelity Advantage Portfolio Fund is available only to ORSO and MPF retirement benefit schemes, their related Approved Pool Investment Funds, institutions, high net worth individuals, or those individuals who have recently been or still are members of an ORSO or MPF retirement benefit scheme.
If you are an individual retail investor who is not a current member of an ORSO or MPF retirement benefit scheme but wish to invest your accrued benefits in Fidelity managed funds, please contact Fidelity for further details about our range of investment funds, which are available to the general public.

Geographic Allocation
Asset Class Target Current
Hong Kong Equities 30% 30%
Japan Equities 12% 11.88%
Other Asia Pacific Equities 12% 11.88%
US Equities 18% 17.86%
European Equities 18% 17.94%
Global Bonds 7% 7.39%
Cash & Others 3% 3.09%
High Growth Profile
High Growth Profile invests in Fidelity Advantage Portfolio Fund – Growth Fund Ordinary Class
Source: Fidelity Investments as of December 31, 2002.

Geographic Allocation
Asset Class Target Current
Hong Kong Equities 24% 24.45%
Japan Equities 9% 8.88%
Other Asia Pacific Equities 9% 9.00%
US Equities 14% 14.03%
European Equities 14% 13.98%
Global Bonds 25% 26.69%
Cash & Others 5% 2.99%
Growth Profile invests in Fidelity Advantage Portfolio Fund – Balanced Fund Ordinary Class
Source: Fidelity Investments as of December 31, 2002.
Growth Profile

Geographic Allocation
Asset Class Target Current
Hong Kong Equities 17% 17.02%
Japan Equities 6.5% 6.06%
Other Asia Pacific Equities 6.5% 6.29%
US Equities 10% 9.70%
European Equities 10% 9.52%
Global Bonds 45% 46.43%
Cash & Others 5% 5%
Balanced Profile invests in Fidelity Advantage Portfolio Fund – Stable Growth Fund Ordinary Class
Source: Fidelity Investments as of December 31, 2002.
Balanced Profile

Major Holdings
Hutchison Whampoa Ltd Hong Kong 2.95%
HSBC Holdings Plc (HK) Hong Kong 2.92%
Cheung Kong Holdings Ltd Hong Kong 2.73%
China Mobile (HK) Ltd Hong Kong 2.38%
Hang Seng Bank Ltd Hong Kong 2.35%
Sun Hung Kai Properties Ltd Hong Kong 2.23%
Hong Kong & China Gas Co Ltd Hong Kong 1.82%
CLP Holdings Ltd Hong Kong 1.42%
Hong Kong Electric Holdings Ord Hong Kong 1.17%
Vodafone Group Plc United Kingdom 0.87%
Total 20.84%
High Growth Profile
High Growth Profile invests in Fidelity Advantage Portfolio Fund – Growth Fund Ordinary Class
Source: Fidelity Investments as of December 31, 2002.
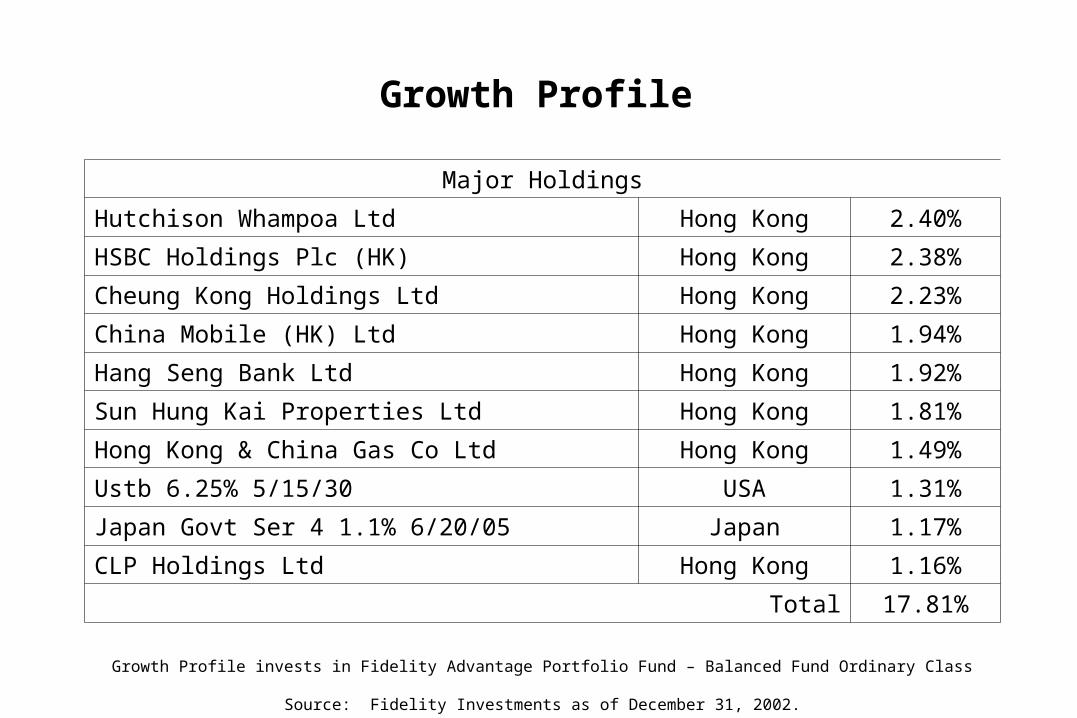
Major Holdings
Hutchison Whampoa Ltd Hong Kong 2.40%
HSBC Holdings Plc (HK) Hong Kong 2.38%
Cheung Kong Holdings Ltd Hong Kong 2.23%
China Mobile (HK) Ltd Hong Kong 1.94%
Hang Seng Bank Ltd Hong Kong 1.92%
Sun Hung Kai Properties Ltd Hong Kong 1.81%
Hong Kong & China Gas Co Ltd Hong Kong 1.49%
Ustb 6.25% 5/15/30 USA 1.31%
Japan Govt Ser 4 1.1% 6/20/05 Japan 1.17%
CLP Holdings Ltd Hong Kong 1.16%
Total 17.81%
Growth Profile invests in Fidelity Advantage Portfolio Fund – Balanced Fund Ordinary Class
Source: Fidelity Investments as of December 31, 2002.
Growth Profile

Major Holdings
Ustb 6.25% 5/15/30 USA 2.28%
Japan Govt Ser 4 1.1% 6/20/05 Japan 2.03%
France Oat 5.75% 10/25/32 France 1.97%
France Oat 5.25% 4/25/08 France 1.91%
Instituto De Credit Frn 2/1/05 Spain 1.80%
Hutchison Whampoa Ltd Hong Kong 1.67%
HSBC Holdings Plc (HK) Hong Kong 1.65%
Belgium Govt 7.75% 10/15/04 20 Belgium 1.64%
Cheung Kong Holdings Ltd Hong Kong 1.55%
Denmark Govt Bullet 7% 12/15/4 Denmark 1.43%
Total 17.93%
Balanced Profile invests in Fidelity Advantage Portfolio Fund – Stable Growth Fund Ordinary Class
Source: Fidelity Investments as of December 31, 2002.
Balanced Profile


![TOYOTA MOTOR SALES - Fidelity Investments · FIDELITY INVESTMENTS Fidelity Viewpoints® Webcast: January 29, 2013 Transcript eReview #: 640768.1.0 Page 1 [Operator] Good day everyone](https://static.fdocuments.in/doc/165x107/5bfc04b109d3f2b5178c97ce/toyota-motor-sales-fidelity-investments-fidelity-investments-fidelity-viewpoints.jpg)