
GUARANTEES GROWTH FLEXIBILITY - Fidelity Investments · Build a Retirement Plan that Can Last a...
24
Income Diversification Creating a Plan to Support Your Lifestyle in Retirement GUARANTEES FLEXIBILITY GROWTH
Transcript of GUARANTEES GROWTH FLEXIBILITY - Fidelity Investments · Build a Retirement Plan that Can Last a...
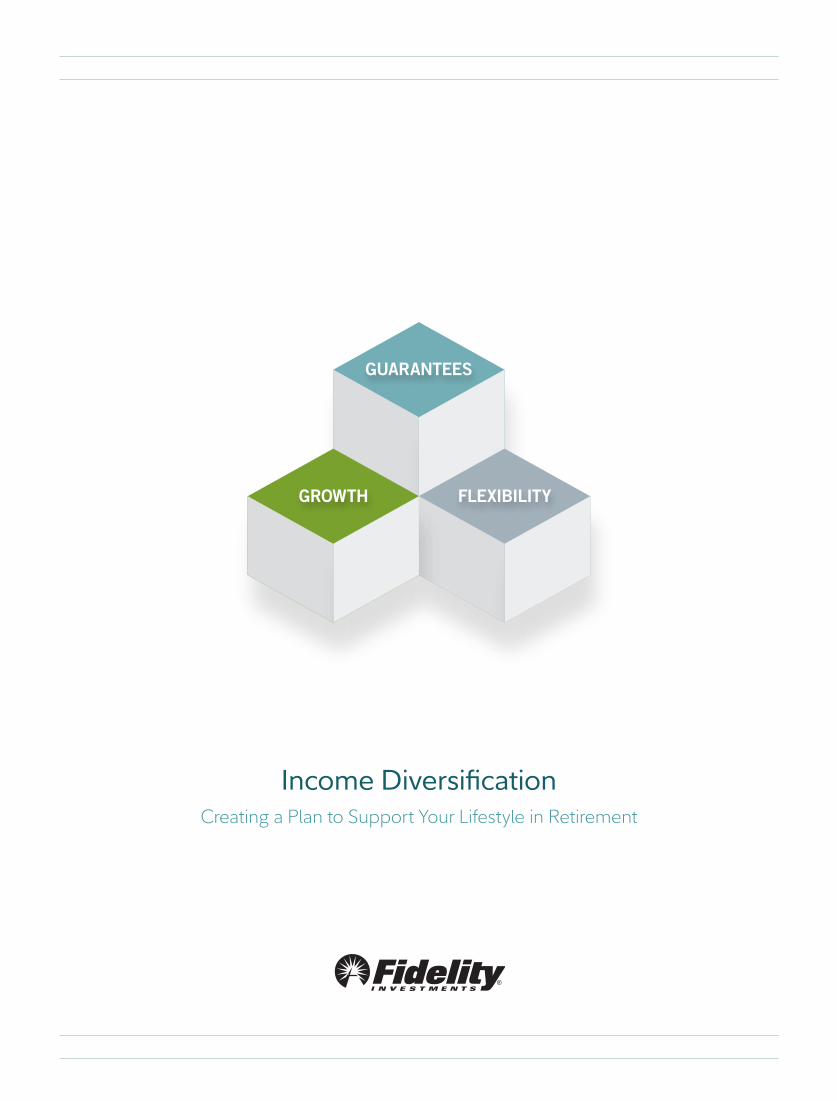
Income DiversificationCreating a Plan to Support Your Lifestyle in Retirement
GUARANTEES
FLEXIBILITYGROWTH
Contents
Build a Retirement Plan that Can Last a Lifetime
2 Retirement Is Different Today4 Preparing for a Long Retirement6 Weathering the Markets8 Impact of Withdrawals in Retirement
Creating a Diversified Income Plan12 Plan Your Lifestyle in Retirement13 Guarantees: Reliable Income to Cover
Essential Expenses14 Growth Potential: Build an Investment
Strategy and Remain Disciplined16 Flexibility: Create Your Diversified
Income Plan18 Create Your Plan — Your Next Steps
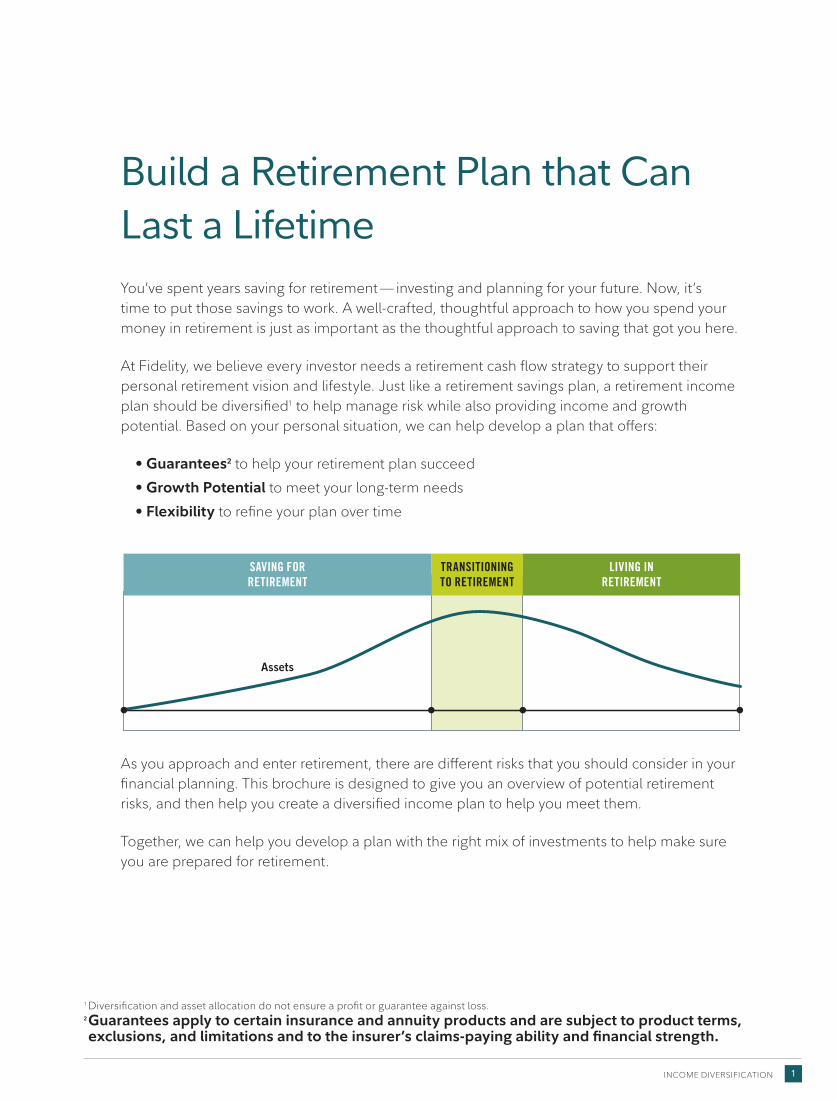
Build a Retirement Plan that Can Last a LifetimeYou’ve spent years saving for retirement — investing and planning for your future. Now, it’s time to put those savings to work. A well-crafted, thoughtful approach to how you spend your money in retirement is just as important as the thoughtful approach to saving that got you here.
At Fidelity, we believe every investor needs a retirement cash flow strategy to support their personal retirement vision and lifestyle. Just like a retirement savings plan, a retirement income plan should be diversified1 to help manage risk while also providing income and growth potential. Based on your personal situation, we can help develop a plan that offers:
• Guarantees2 to help your retirement plan succeed• Growth Potential to meet your long-term needs • Flexibility to refine your plan over time
Assets
TRANSITIONING TO RETIREMENT
SAVING FOR RETIREMENT
LIVING IN RETIREMENT
As you approach and enter retirement, there are different risks that you should consider in your financial planning. This brochure is designed to give you an overview of potential retirement risks, and then help you create a diversified income plan to help you meet them.
Together, we can help you develop a plan with the right mix of investments to help make sure you are prepared for retirement.
INCOME DIVERSIFICATION 1
1 Diversification and asset allocation do not ensure a profit or guarantee against loss.2 Guarantees apply to certain insurance and annuity products and are subject to product terms, exclusions, and limitations and to the insurer’s claims-paying ability and financial strength.
FIDELITY INVESTMENTS2
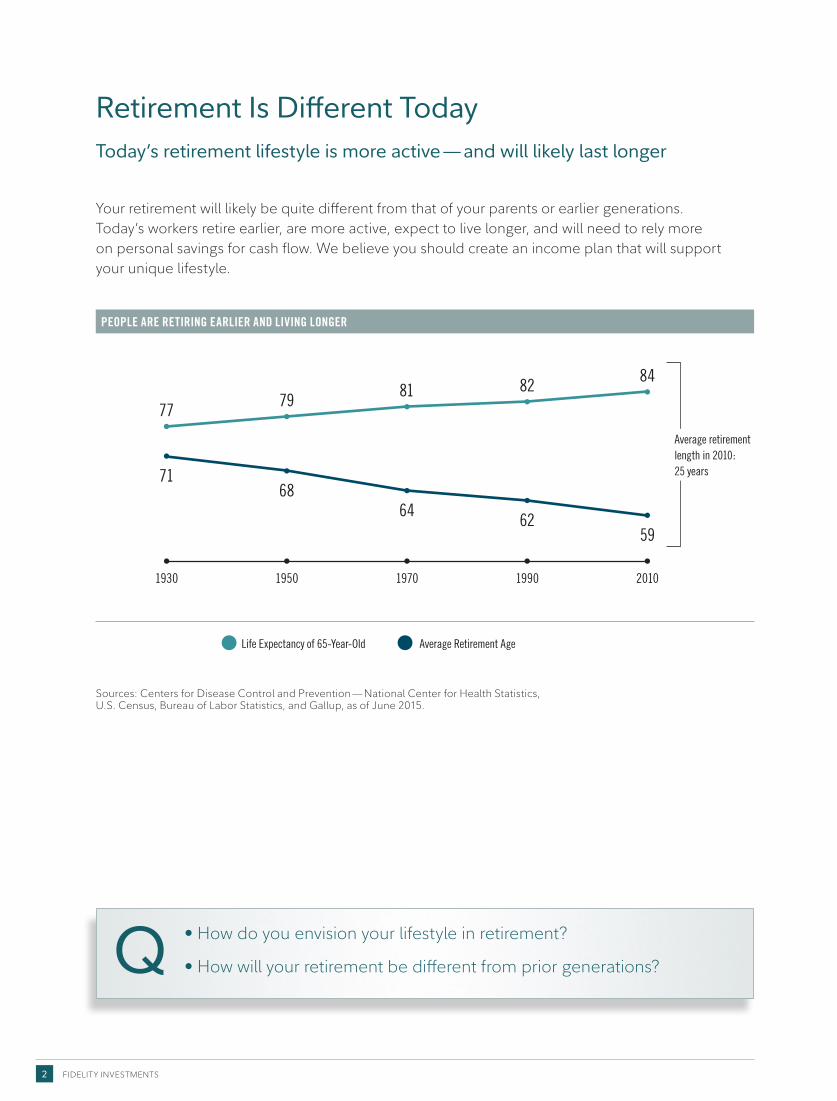
Retirement Is Different TodayToday’s retirement lifestyle is more active — and will likely last longer
Your retirement will likely be quite different from that of your parents or earlier generations. Today’s workers retire earlier, are more active, expect to live longer, and will need to rely more on personal savings for cash flow. We believe you should create an income plan that will support your unique lifestyle.
• How do you envision your lifestyle in retirement?
• How will your retirement be different from prior generations?Q
Sources: Centers for Disease Control and Prevention — National Center for Health Statistics, U.S. Census, Bureau of Labor Statistics, and Gallup, as of June 2015.
PEOPLE ARE RETIRING EARLIER AND LIVING LONGER
Life Expectancy of 65-Year-Old Average Retirement Age
1930 1950 1970 1990 2010
77 79 81 82 84
596264
6871
Average retirement length in 2010: 25 years
INCOME DIVERSIFICATION 3
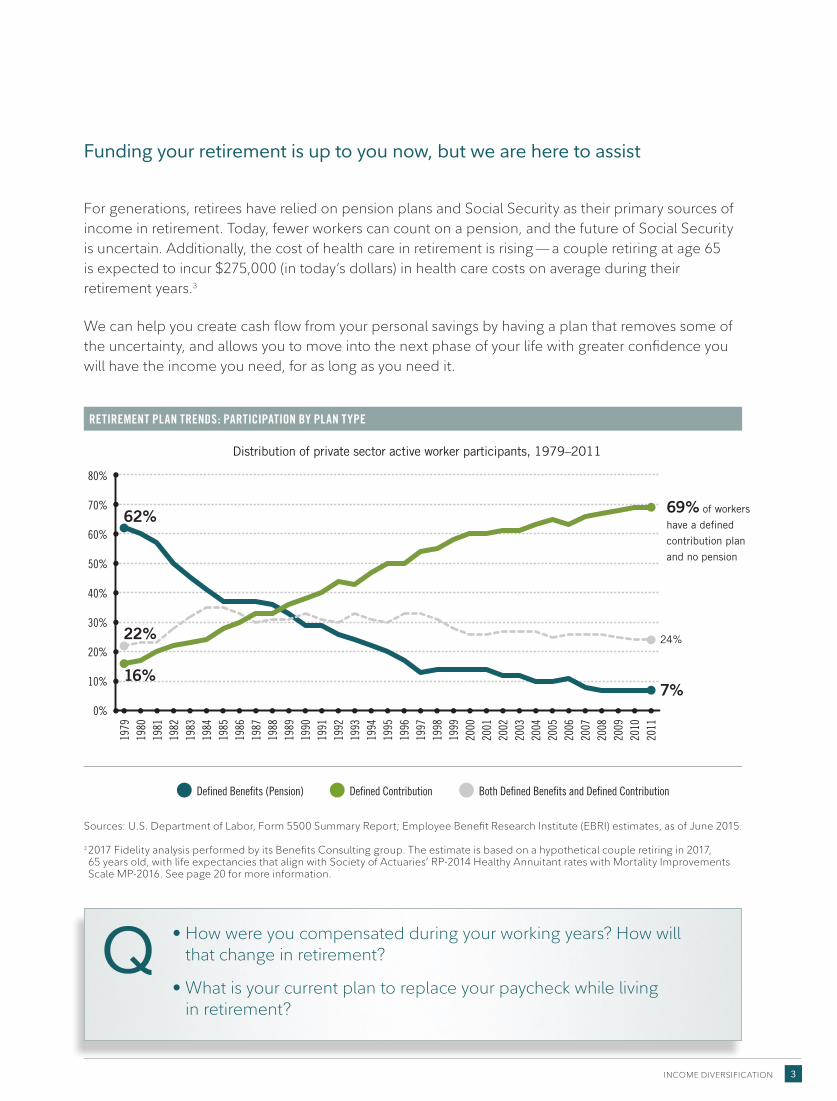
Funding your retirement is up to you now, but we are here to assist
For generations, retirees have relied on pension plans and Social Security as their primary sources of income in retirement. Today, fewer workers can count on a pension, and the future of Social Security is uncertain. Additionally, the cost of health care in retirement is rising — a couple retiring at age 65 is expected to incur $275,000 (in today’s dollars) in health care costs on average during their retirement years.3
We can help you create cash flow from your personal savings by having a plan that removes some of the uncertainty, and allows you to move into the next phase of your life with greater confidence you will have the income you need, for as long as you need it.
• How were you compensated during your working years? How will that change in retirement?
• What is your current plan to replace your paycheck while living in retirement?
Q
RETIREMENT PLAN TRENDS: PARTICIPATION BY PLAN TYPE
Sources: U.S. Department of Labor, Form 5500 Summary Report; Employee Benefit Research Institute (EBRI) estimates, as of June 2015.
3 2017 Fidelity analysis performed by its Benefits Consulting group. The estimate is based on a hypothetical couple retiring in 2017, 65 years old, with life expectancies that align with Society of Actuaries’ RP-2014 Healthy Annuitant rates with Mortality Improvements Scale MP-2016. See page 20 for more information.
80%
1979
1980
1981
1982
1983
1984
1985
1986
1987
1988
1989
1990
1991
1992
1993
1994
1995
1996
1997
1998
1999
2000
2001
2002
2003
2004
2005
2006
2007
2008
2009
2010
2011
70%
60%
50%
40%
30%
20%
10%
0%
69% of workers
have a defined
contribution plan
and no pension
62%
24%22%
7%16%
Distribution of private sector active worker participants, 1979–2011
Defined Benefits (Pension) Defined Contribution Both Defined Benefits and Defined Contribution
FIDELITY INVESTMENTS4
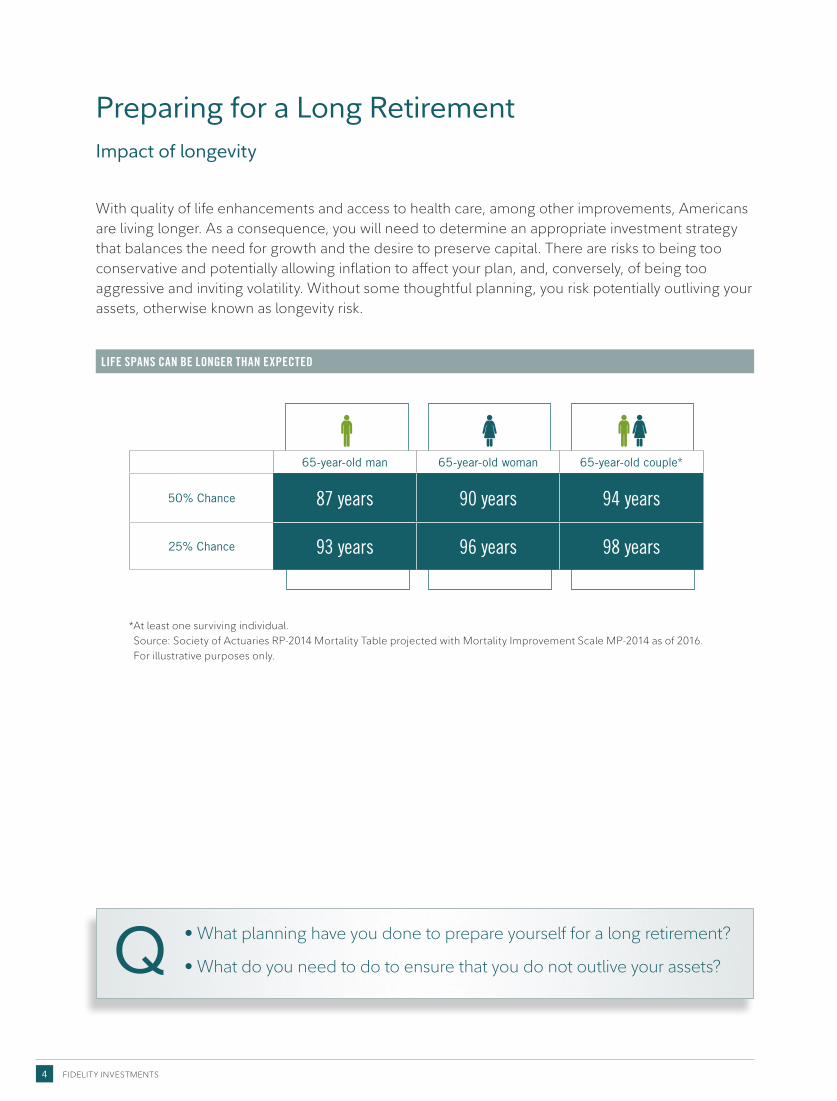
Preparing for a Long RetirementImpact of longevity
With quality of life enhancements and access to health care, among other improvements, Americans are living longer. As a consequence, you will need to determine an appropriate investment strategy that balances the need for growth and the desire to preserve capital. There are risks to being too conservative and potentially allowing inflation to affect your plan, and, conversely, of being too aggressive and inviting volatility. Without some thoughtful planning, you risk potentially outliving your assets, otherwise known as longevity risk.
LIFE SPANS CAN BE LONGER THAN EXPECTED
65-year-old man 65-year-old woman 65-year-old couple*
50% Chance 87 years 90 years 94 years
25% Chance 93 years 96 years 98 years
* At least one surviving individual.Source: Society of Actuaries RP-2014 Mortality Table projected with Mortality Improvement Scale MP-2014 as of 2016.For illustrative purposes only.
• What planning have you done to prepare yourself for a long retirement?
• What do you need to do to ensure that you do not outlive your assets?Q
INCOME DIVERSIFICATION 5
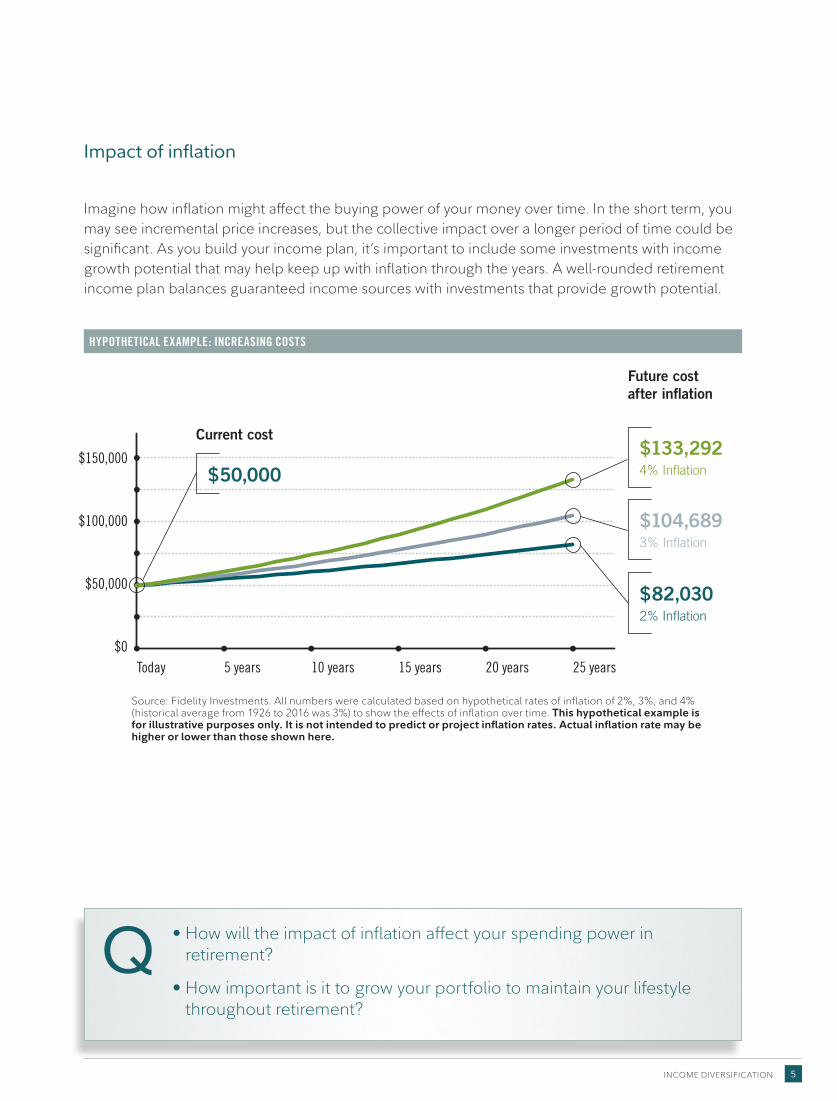
Impact of inflation
Imagine how inflation might affect the buying power of your money over time. In the short term, you may see incremental price increases, but the collective impact over a longer period of time could be significant. As you build your income plan, it’s important to include some investments with income growth potential that may help keep up with inflation through the years. A well-rounded retirement income plan balances guaranteed income sources with investments that provide growth potential.
Source: Fidelity Investments. All numbers were calculated based on hypothetical rates of inflation of 2%, 3%, and 4% (historical average from 1926 to 2016 was 3%) to show the effects of inflation over time. This hypothetical example is for illustrative purposes only. It is not intended to predict or project inflation rates. Actual inflation rate may be higher or lower than those shown here.
HYPOTHETICAL EXAMPLE: INCREASING COSTS
$0Today 5 years 10 years 15 years 20 years 25 years
$50,000
$100,000
$150,000 $133,2924% Inflation$50,000
$104,6893% Inflation
$82,0302% Inflation
Future cost after inflation
Current cost
• How will the impact of inflation affect your spending power in retirement?
• How important is it to grow your portfolio to maintain your lifestyle throughout retirement?
Q
FIDELITY INVESTMENTS6
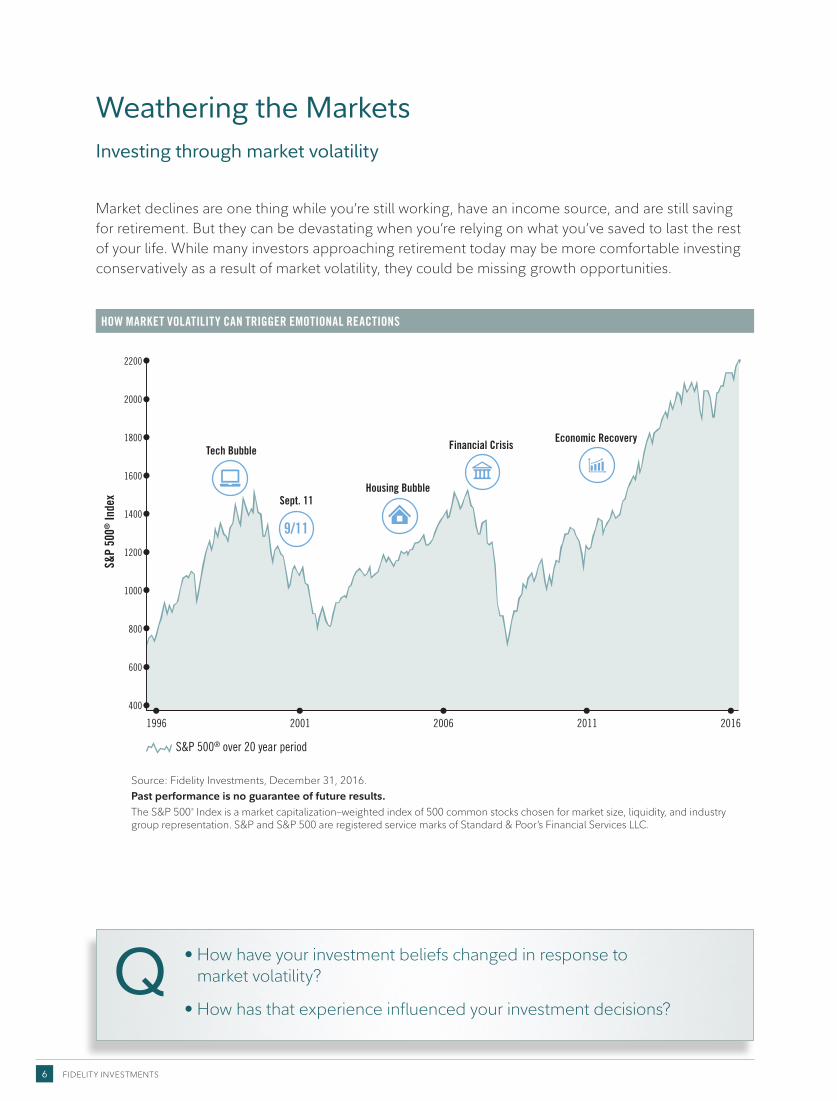
Weathering the MarketsInvesting through market volatility
Market declines are one thing while you’re still working, have an income source, and are still saving for retirement. But they can be devastating when you’re relying on what you’ve saved to last the rest of your life. While many investors approaching retirement today may be more comfortable investing conservatively as a result of market volatility, they could be missing growth opportunities.
HOW MARKET VOLATILITY CAN TRIGGER EMOTIONAL REACTIONS
2200
2000
1800
1600
1400
1200
1000
800
600
400
1996 2001 2011 2016
9/11
Sept. 11
Tech Bubble Financial Crisis
Housing Bubble
Economic Recovery
S&P 500® over 20 year period
2006
S&P
500®
Inde
x
Source: Fidelity Investments, December 31, 2016. Past performance is no guarantee of future results.The S&P 500® Index is a market capitalization–weighted index of 500 common stocks chosen for market size, liquidity, and industry group representation. S&P and S&P 500 are registered service marks of Standard & Poor’s Financial Services LLC.
• How have your investment beliefs changed in response to market volatility?
• How has that experience influenced your investment decisions?Q
INCOME DIVERSIFICATION 7
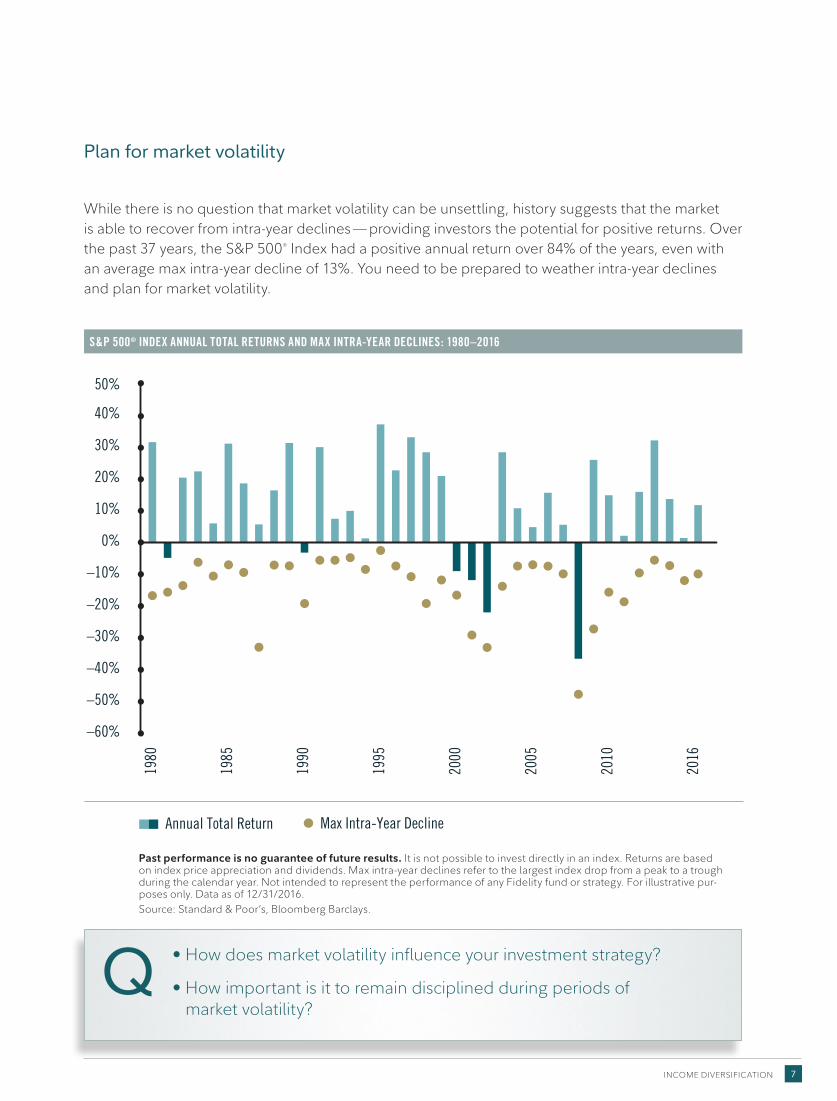
Plan for market volatility
While there is no question that market volatility can be unsettling, history suggests that the market is able to recover from intra-year declines — providing investors the potential for positive returns. Over the past 37 years, the S&P 500® Index had a positive annual return over 84% of the years, even with an average max intra-year decline of 13%. You need to be prepared to weather intra-year declines and plan for market volatility.
Past performance is no guarantee of future results. It is not possible to invest directly in an index. Returns are based on index price appreciation and dividends. Max intra-year declines refer to the largest index drop from a peak to a trough during the calendar year. Not intended to represent the performance of any Fidelity fund or strategy. For illustrative pur-poses only. Data as of 12/31/2016. Source: Standard & Poor’s, Bloomberg Barclays.
–60%
–50%
–40%
–30%
–20%
–10%
0%
10%
20%
30%
40%
50%
1980
1985
1990
1995
2000
2005
2010
2016
Annual Total Return
Max Intra-Year Decline
–60%
–50%
–40%
–30%
–20%
–10%
0%
10%
20%
30%
40%
50%
1980
1985
1990
1995
2000
2005
2010
2016
Annual Total Return
Max Intra-Year Decline
–60%
–50%
–40%
–30%
–20%
–10%
0%
10%
20%
30%
40%
50%
1980
1985
1990
1995
2000
2005
2010
2016
Annual Total Return
Max Intra-Year Decline
S&P 500® INDEX ANNUAL TOTAL RETURNS AND MAX INTRA-YEAR DECLINES: 1980–2016
• How does market volatility influence your investment strategy?
• How important is it to remain disciplined during periods of market volatility?
Q
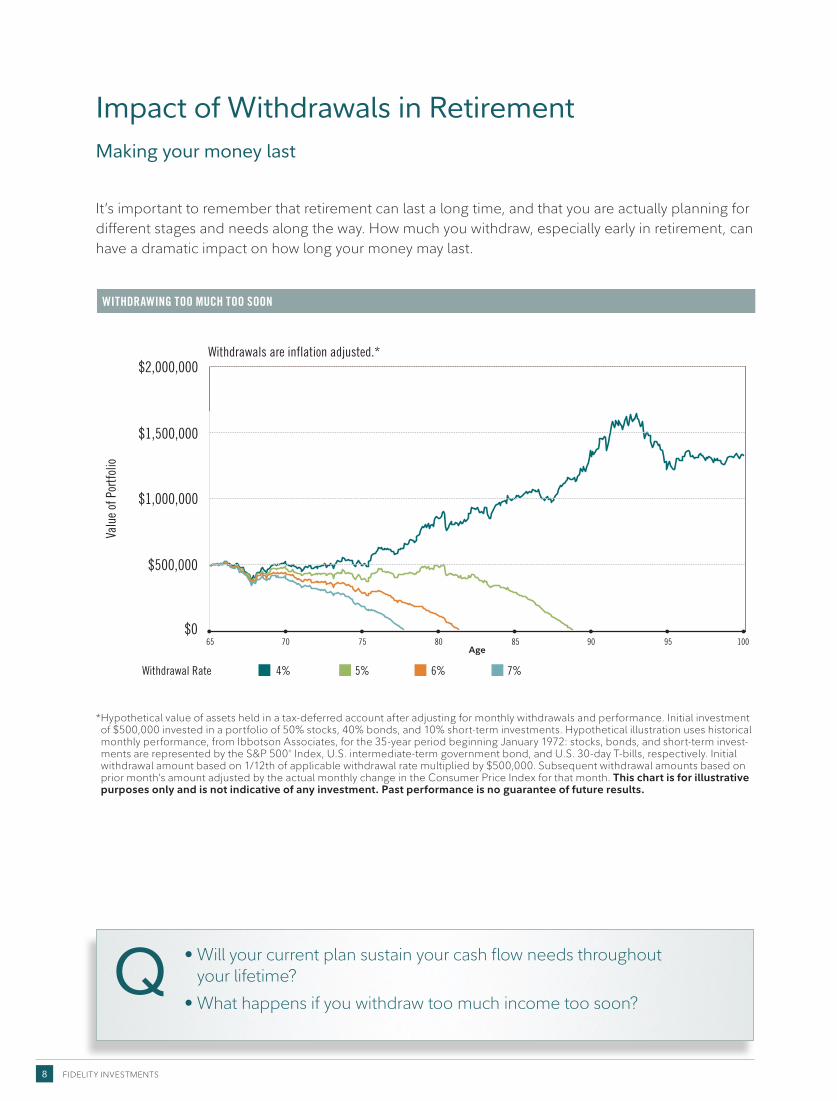
Impact of Withdrawals in RetirementMaking your money last
It’s important to remember that retirement can last a long time, and that you are actually planning for different stages and needs along the way. How much you withdraw, especially early in retirement, can have a dramatic impact on how long your money may last.
WITHDRAWING TOO MUCH TOO SOON
* Hypothetical value of assets held in a tax-deferred account after adjusting for monthly withdrawals and performance. Initial investment of $500,000 invested in a portfolio of 50% stocks, 40% bonds, and 10% short-term investments. Hypothetical illustration uses historical monthly performance, from Ibbotson Associates, for the 35-year period beginning January 1972: stocks, bonds, and short-term invest-ments are represented by the S&P 500® Index, U.S. intermediate-term government bond, and U.S. 30-day T-bills, respectively. Initial withdrawal amount based on 1/12th of applicable withdrawal rate multiplied by $500,000. Subsequent withdrawal amounts based on prior month’s amount adjusted by the actual monthly change in the Consumer Price Index for that month. This chart is for illustrative purposes only and is not indicative of any investment. Past performance is no guarantee of future results.
65 70 75 80 85 90 95 100
Age
$0
Withdrawals are inflation adjusted.*
$1,500,000
$2,000,000
$1,000,000
$500,000
4%Withdrawal Rate 5% 6% 7%
Valu
e of
Por
tfolio
65 70 75 80 85 90 95 100
Age
$0
Withdrawals are inflation adjusted.*
$1,500,000
$2,000,000
$1,000,000
$500,000
4%Withdrawal Rate 5% 6% 7%
Valu
e of
Por
tfolio
FIDELITY INVESTMENTS8
• Will your current plan sustain your cash flow needs throughout your lifetime?
• What happens if you withdraw too much income too soon?Q
INCOME DIVERSIFICATION 9
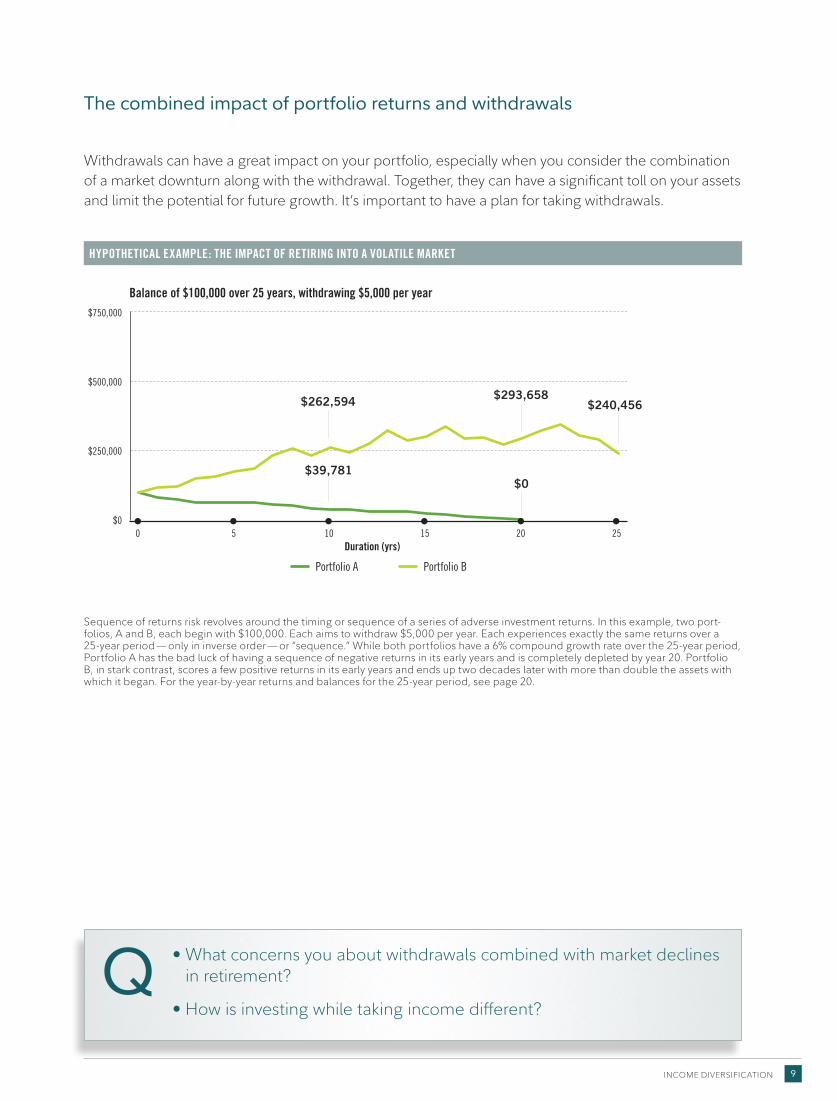
The combined impact of portfolio returns and withdrawals
Withdrawals can have a great impact on your portfolio, especially when you consider the combination of a market downturn along with the withdrawal. Together, they can have a significant toll on your assets and limit the potential for future growth. It’s important to have a plan for taking withdrawals.
• What concerns you about withdrawals combined with market declines in retirement?
• How is investing while taking income different?Q
HYPOTHETICAL EXAMPLE: THE IMPACT OF RETIRING INTO A VOLATILE MARKET
Sequence of returns risk revolves around the timing or sequence of a series of adverse investment returns. In this example, two port-folios, A and B, each begin with $100,000. Each aims to withdraw $5,000 per year. Each experiences exactly the same returns over a 25-year period — only in inverse order — or “sequence.” While both portfolios have a 6% compound growth rate over the 25-year period, Portfolio A has the bad luck of having a sequence of negative returns in its early years and is completely depleted by year 20. Portfolio B, in stark contrast, scores a few positive returns in its early years and ends up two decades later with more than double the assets with which it began. For the year-by-year returns and balances for the 25-year period, see page 20.
$0
$250,000
$500,000
$750,000
0 5 10 15 20 25
Portfolio A Portfolio B
$0
$293,658 $240,456
Balance of $100,000 over 25 years, withdrawing $5,000 per year
Duration (yrs)
$262,594
$39,781
FIDELITY INVESTMENTS10 FIDELITY INVESTMENTS10
Transitioning to retirement involves a broad range of considerations and risks. We can help you build a plan with the right mix of investments to create cash flow to help make sure you are prepared for retirement.
Creating a Diversified Income Plan
INCOME DIVERSIFICATION 11
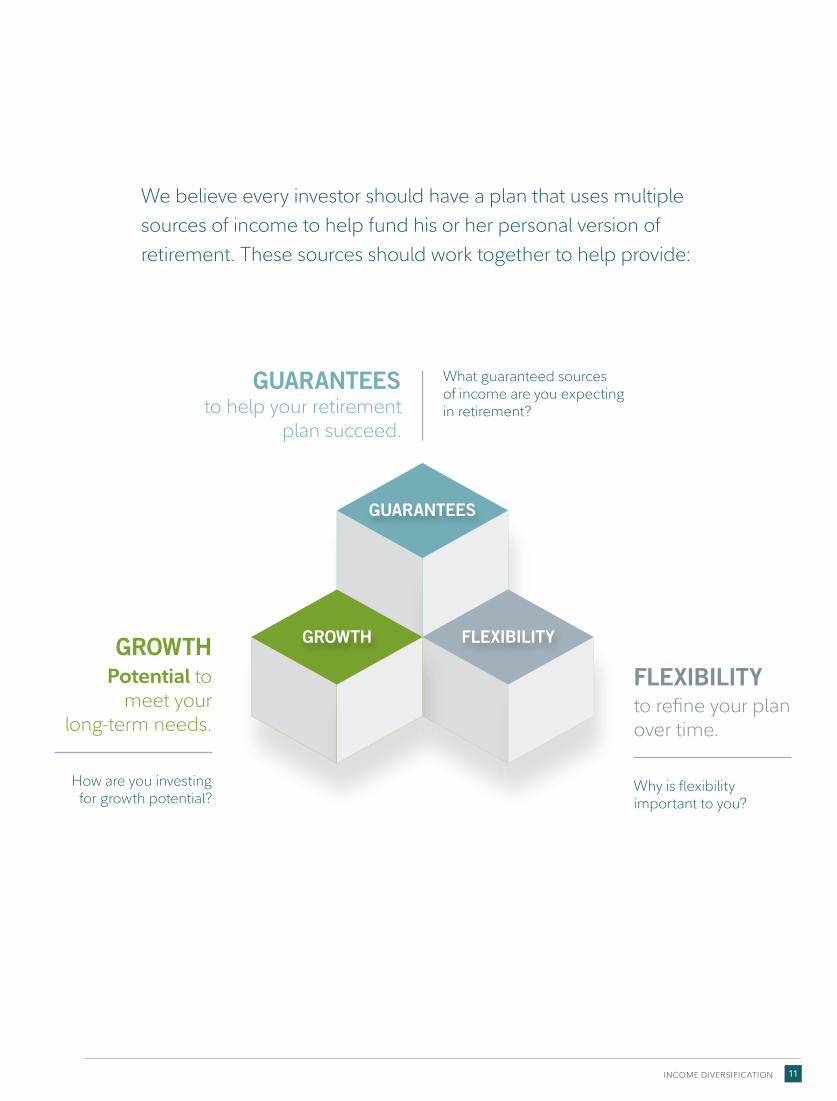
We believe every investor should have a plan that uses multiple sources of income to help fund his or her personal version of retirement. These sources should work together to help provide:
Why is flexibility important to you?
What guaranteed sources of income are you expecting in retirement?
FLEXIBILITYto refine your plan over time.
GUARANTEESto help your retirement
plan succeed.
How are you investing for growth potential?
GROWTHPotential to
meet your long-term needs.
GUARANTEES
FLEXIBILITYGROWTH
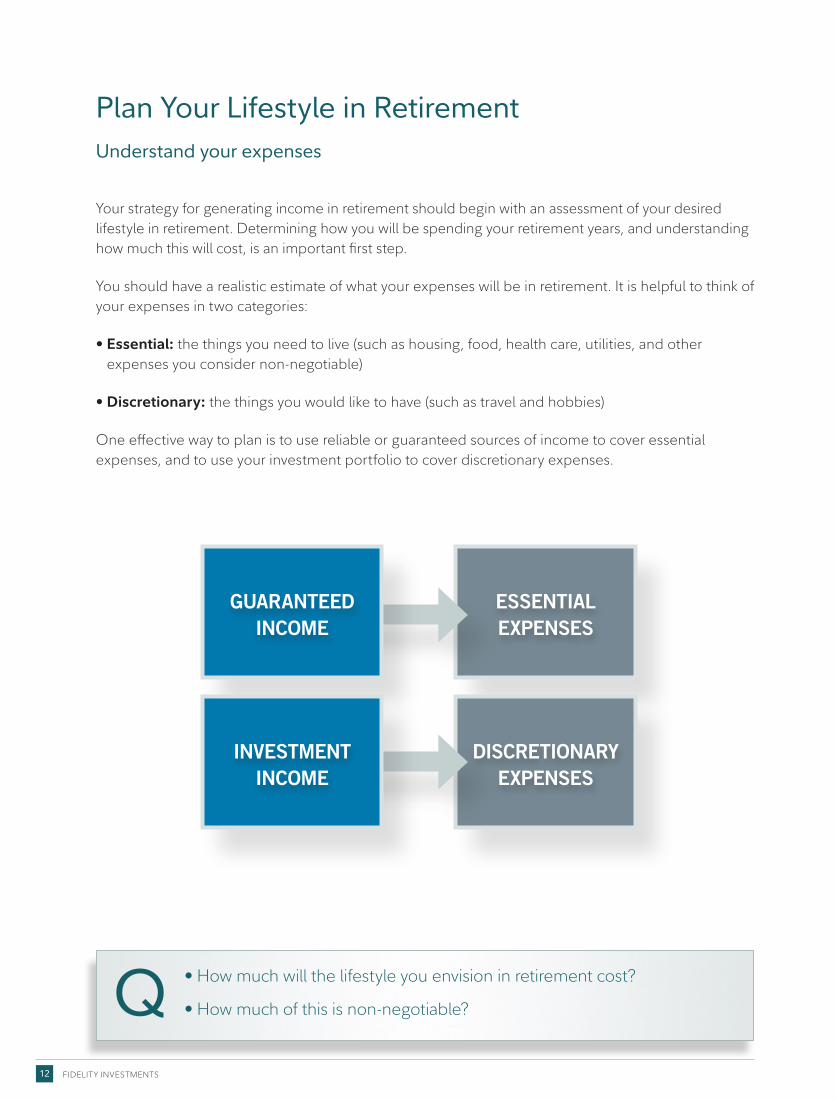
Plan Your Lifestyle in Retirement Understand your expenses
Your strategy for generating income in retirement should begin with an assessment of your desired lifestyle in retirement. Determining how you will be spending your retirement years, and understanding how much this will cost, is an important first step.
You should have a realistic estimate of what your expenses will be in retirement. It is helpful to think of your expenses in two categories:
• Essential: the things you need to live (such as housing, food, health care, utilities, and other expenses you consider non-negotiable)
• Discretionary: the things you would like to have (such as travel and hobbies)
One effective way to plan is to use reliable or guaranteed sources of income to cover essential expenses, and to use your investment portfolio to cover discretionary expenses.
FIDELITY INVESTMENTS12
DISCRETIONARY EXPENSES
ESSENTIAL EXPENSES
GUARANTEEDINCOME
INVESTMENTINCOME
• How much will the lifestyle you envision in retirement cost?
• How much of this is non-negotiable?Q
INCOME DIVERSIFICATION 13
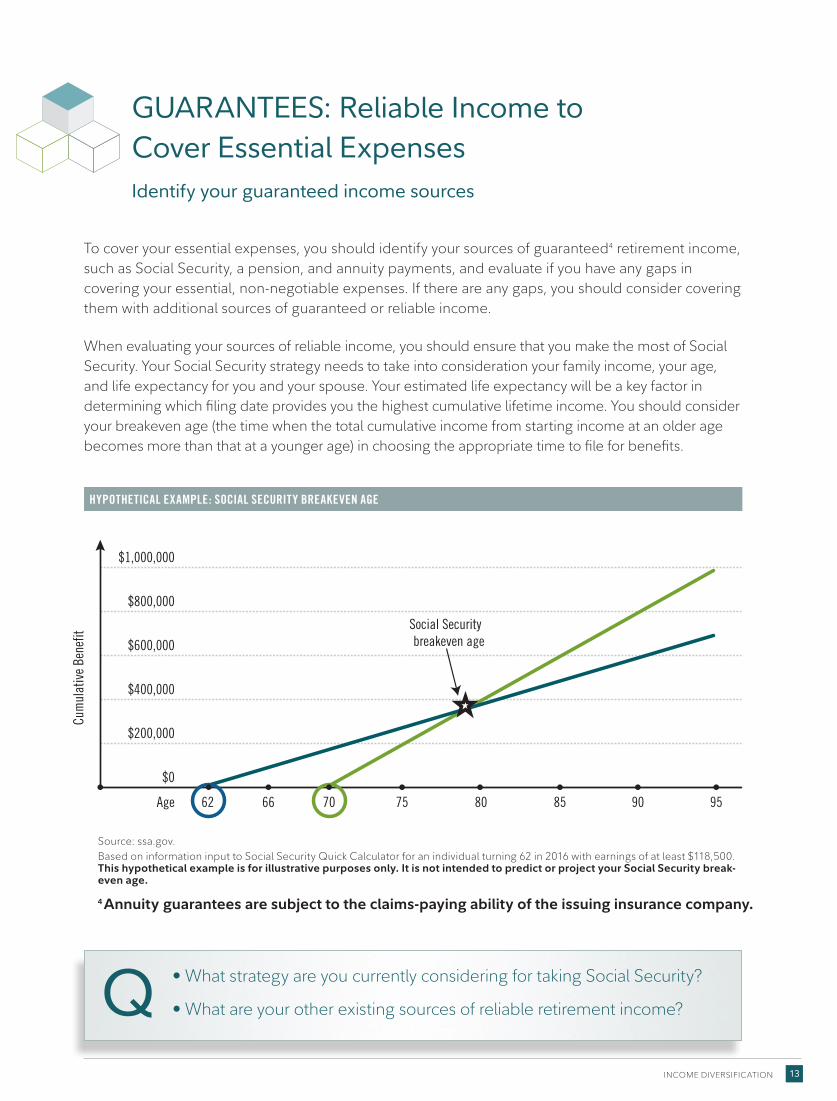
GUARANTEES: Reliable Income to Cover Essential Expenses Identify your guaranteed income sources
To cover your essential expenses, you should identify your sources of guaranteed4 retirement income, such as Social Security, a pension, and annuity payments, and evaluate if you have any gaps in covering your essential, non-negotiable expenses. If there are any gaps, you should consider covering them with additional sources of guaranteed or reliable income.
When evaluating your sources of reliable income, you should ensure that you make the most of Social Security. Your Social Security strategy needs to take into consideration your family income, your age, and life expectancy for you and your spouse. Your estimated life expectancy will be a key factor in determining which filing date provides you the highest cumulative lifetime income. You should consider your breakeven age (the time when the total cumulative income from starting income at an older age becomes more than that at a younger age) in choosing the appropriate time to file for benefits.
Cum
ulat
ive
Bene
fit
$0
Age 62 66 70 75 80 85 90 95
$200,000
$400,000
$600,000
$800,000
$1,000,000
Social Security breakeven age
HYPOTHETICAL EXAMPLE: SOCIAL SECURITY BREAKEVEN AGE
Source: ssa.gov.Based on information input to Social Security Quick Calculator for an individual turning 62 in 2016 with earnings of at least $118,500. This hypothetical example is for illustrative purposes only. It is not intended to predict or project your Social Security break-even age.
4 Annuity guarantees are subject to the claims-paying ability of the issuing insurance company.
• What strategy are you currently considering for taking Social Security?
• What are your other existing sources of reliable retirement income?Q
FIDELITY INVESTMENTS14
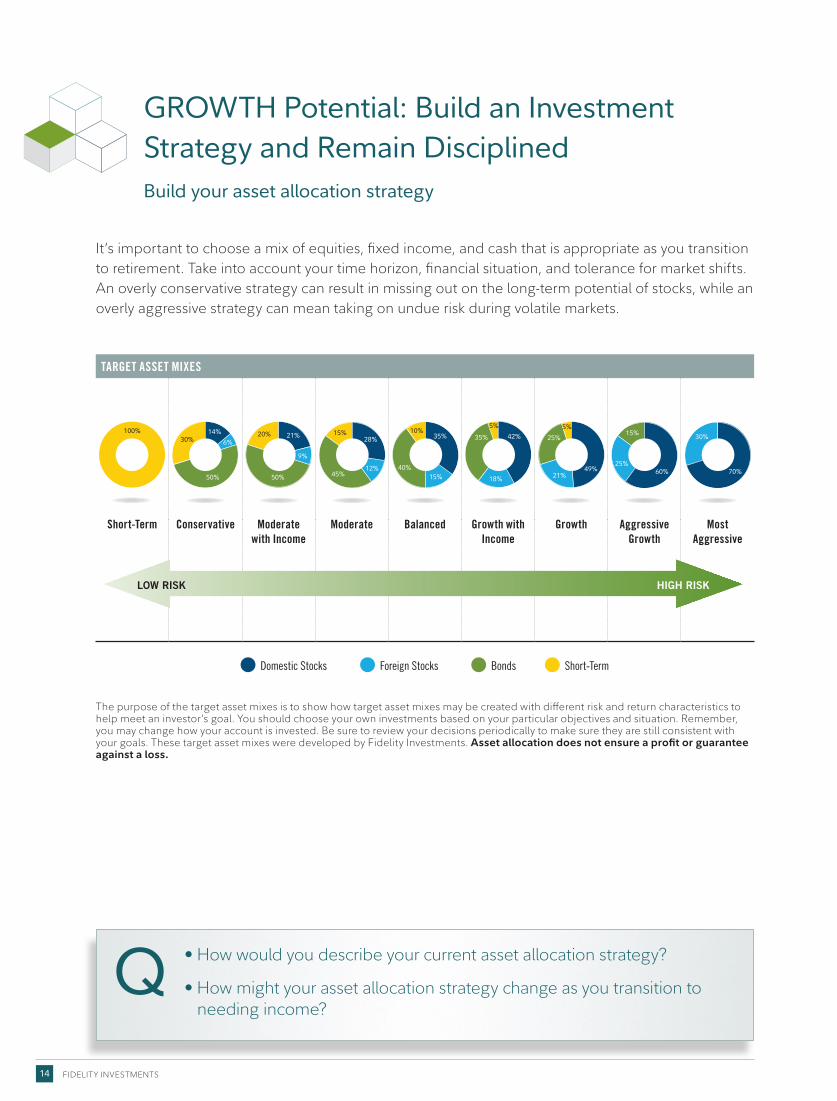
GROWTH Potential: Build an Investment Strategy and Remain DisciplinedBuild your asset allocation strategy
It’s important to choose a mix of equities, fixed income, and cash that is appropriate as you transition to retirement. Take into account your time horizon, financial situation, and tolerance for market shifts. An overly conservative strategy can result in missing out on the long-term potential of stocks, while an overly aggressive strategy can mean taking on undue risk during volatile markets.
TARGET ASSET MIXES
Short-Term BondsForeign StocksDomestic Stocks
100%
Short-Term BondsForeign StocksDomestic Stocks
30%
50%
14% 6%
Short-Term BondsForeign StocksDomestic Stocks
20%
50%
21%
9%
Short-Term BondsForeign StocksDomestic Stocks
15%
45%
28%
12%
Short-Term BondsForeign StocksDomestic Stocks
10%
40%
35%
15%
Short-Term BondsForeign StocksDomestic Stocks
5%
35% 42%
18%
Short-Term BondsForeign StocksDomestic Stocks
5%
25%
49% 21%
Short-Term BondsForeign StocksDomestic Stocks
15%
60% 25%
Short-Term BondsForeign StocksDomestic Stocks
30%
70%
Short-Term Conservative Moderate with Income
Moderate Balanced Growth with Income
Growth Aggressive Growth
Most Aggressive
Short-TermForeign StocksDomestic Stocks Bonds
The purpose of the target asset mixes is to show how target asset mixes may be created with different risk and return characteristics to help meet an investor’s goal. You should choose your own investments based on your particular objectives and situation. Remember, you may change how your account is invested. Be sure to review your decisions periodically to make sure they are still consistent with your goals. These target asset mixes were developed by Fidelity Investments. Asset allocation does not ensure a profit or guarantee against a loss.
• How would you describe your current asset allocation strategy?
• How might your asset allocation strategy change as you transition to needing income?
Q
LOW RISK HIGH RISK
INCOME DIVERSIFICATION 15
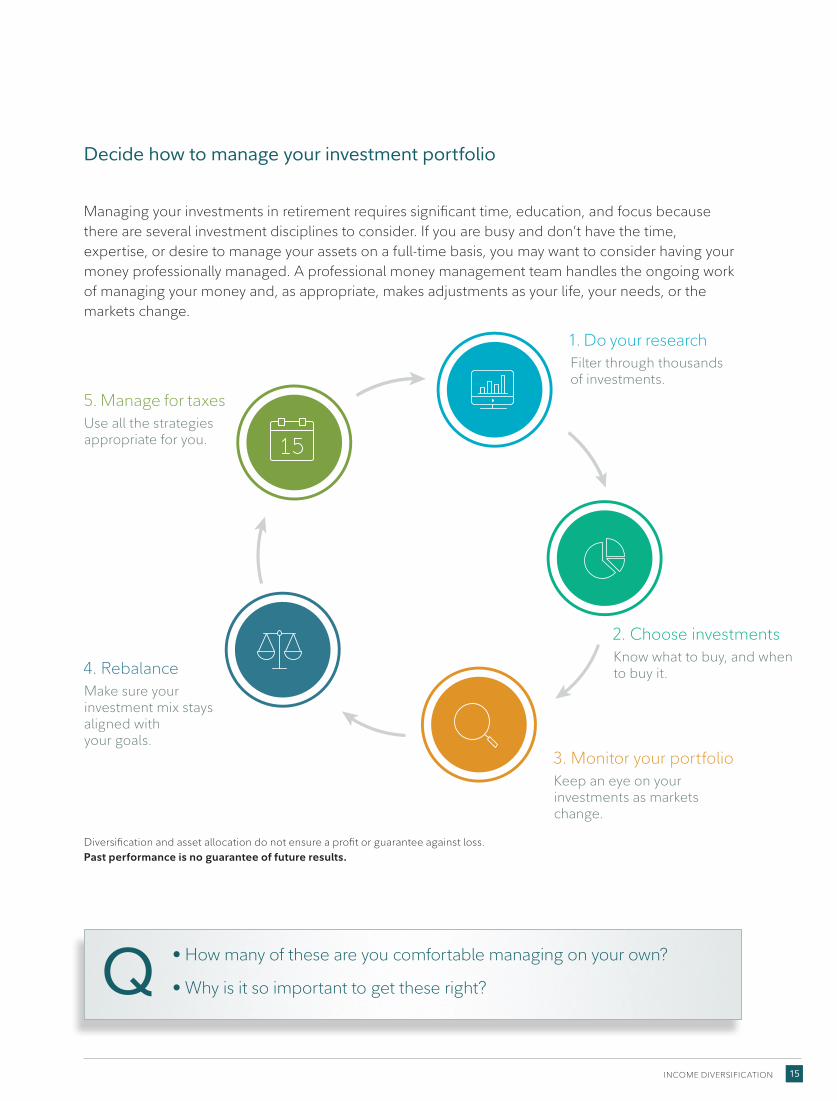
Decide how to manage your investment portfolio
Managing your investments in retirement requires significant time, education, and focus because there are several investment disciplines to consider. If you are busy and don’t have the time, expertise, or desire to manage your assets on a full-time basis, you may want to consider having your money professionally managed. A professional money management team handles the ongoing work of managing your money and, as appropriate, makes adjustments as your life, your needs, or the markets change.
• How many of these are you comfortable managing on your own?
• Why is it so important to get these right?Q
1. Do your researchFilter through thousands of investments.
2. Choose investmentsKnow what to buy, and when to buy it.
3. Monitor your portfolioKeep an eye on your investments as markets change.
4. Rebalance Make sure your investment mix stays aligned with your goals.
5. Manage for taxesUse all the strategies appropriate for you.
Diversification and asset allocation do not ensure a profit or guarantee against loss.Past performance is no guarantee of future results.
FIDELITY INVESTMENTS16
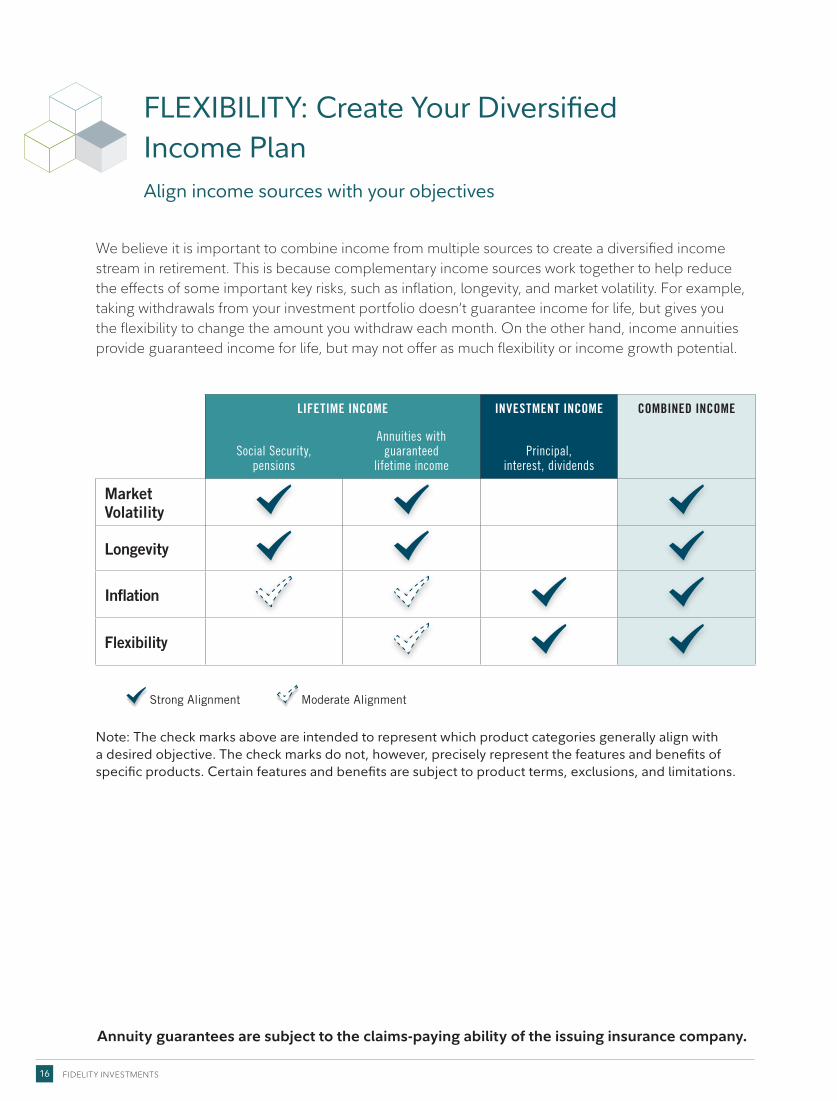
FLEXIBILITY: Create Your Diversified Income Plan Align income sources with your objectives
We believe it is important to combine income from multiple sources to create a diversified income stream in retirement. This is because complementary income sources work together to help reduce the effects of some important key risks, such as inflation, longevity, and market volatility. For example, taking withdrawals from your investment portfolio doesn’t guarantee income for life, but gives you the flexibility to change the amount you withdraw each month. On the other hand, income annuities provide guaranteed income for life, but may not offer as much flexibility or income growth potential.
LIFETIME INCOME INVESTMENT INCOME COMBINED INCOME
Social Security, pensions
Annuities with guaranteed
lifetime incomePrincipal,
interest, dividends
Market Volatility
Longevity
Inflation
Flexibility
Strong Alignment Moderate Alignment
Note: The check marks above are intended to represent which product categories generally align with a desired objective. The check marks do not, however, precisely represent the features and benefits of specific products. Certain features and benefits are subject to product terms, exclusions, and limitations.
Annuity guarantees are subject to the claims-paying ability of the issuing insurance company.
INCOME DIVERSIFICATION 17
Your diversified income plan
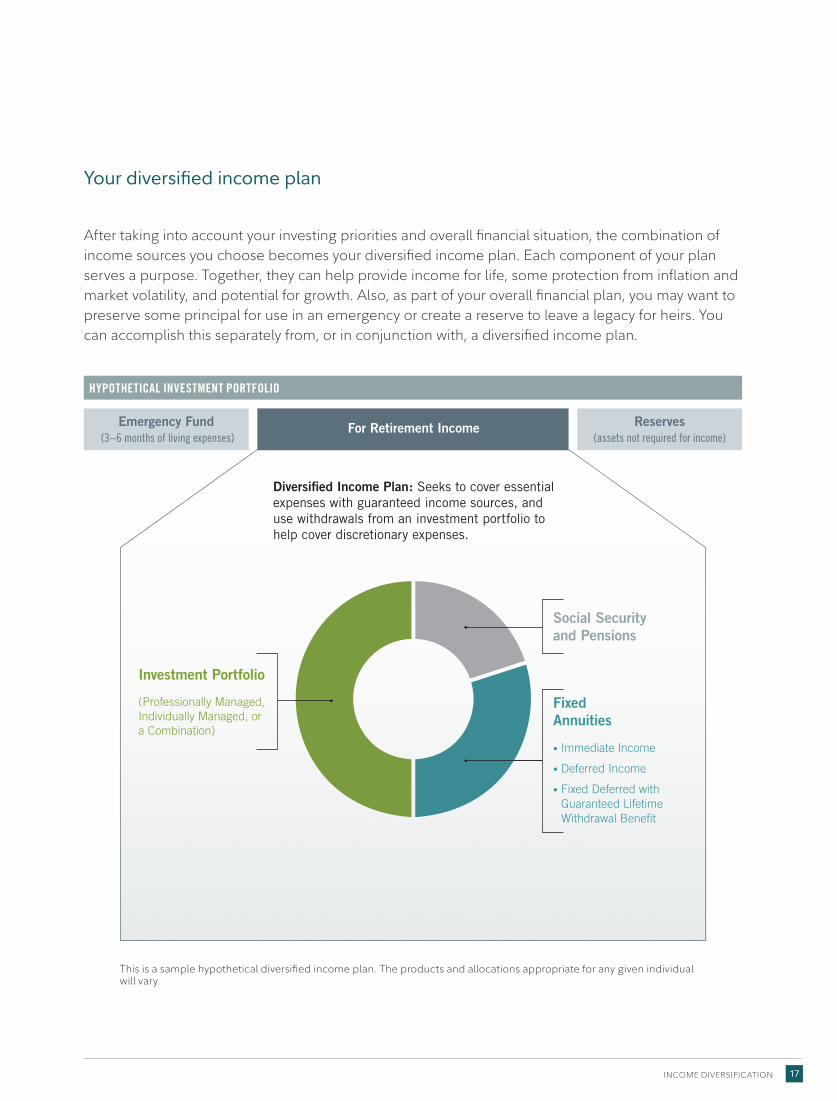
After taking into account your investing priorities and overall financial situation, the combination of income sources you choose becomes your diversified income plan. Each component of your plan serves a purpose. Together, they can help provide income for life, some protection from inflation and market volatility, and potential for growth. Also, as part of your overall financial plan, you may want to preserve some principal for use in an emergency or create a reserve to leave a legacy for heirs. You can accomplish this separately from, or in conjunction with, a diversified income plan.
HYPOTHETICAL INVESTMENT PORTFOLIO
Fixed Annuities
• Immediate Income
• Deferred Income
• Fixed Deferred with Guaranteed Lifetime Withdrawal Benefit
Social Security and Pensions
Diversified Income Plan: Seeks to cover essential expenses with guaranteed income sources, and use withdrawals from an investment portfolio to help cover discretionary expenses.
Investment Portfolio
(Professionally Managed, Individually Managed, or a Combination)
Emergency Fund ReservesFor Retirement Income(assets not required for income)(3–6 months of living expenses)
This is a sample hypothetical diversified income plan. The products and allocations appropriate for any given individual will vary.
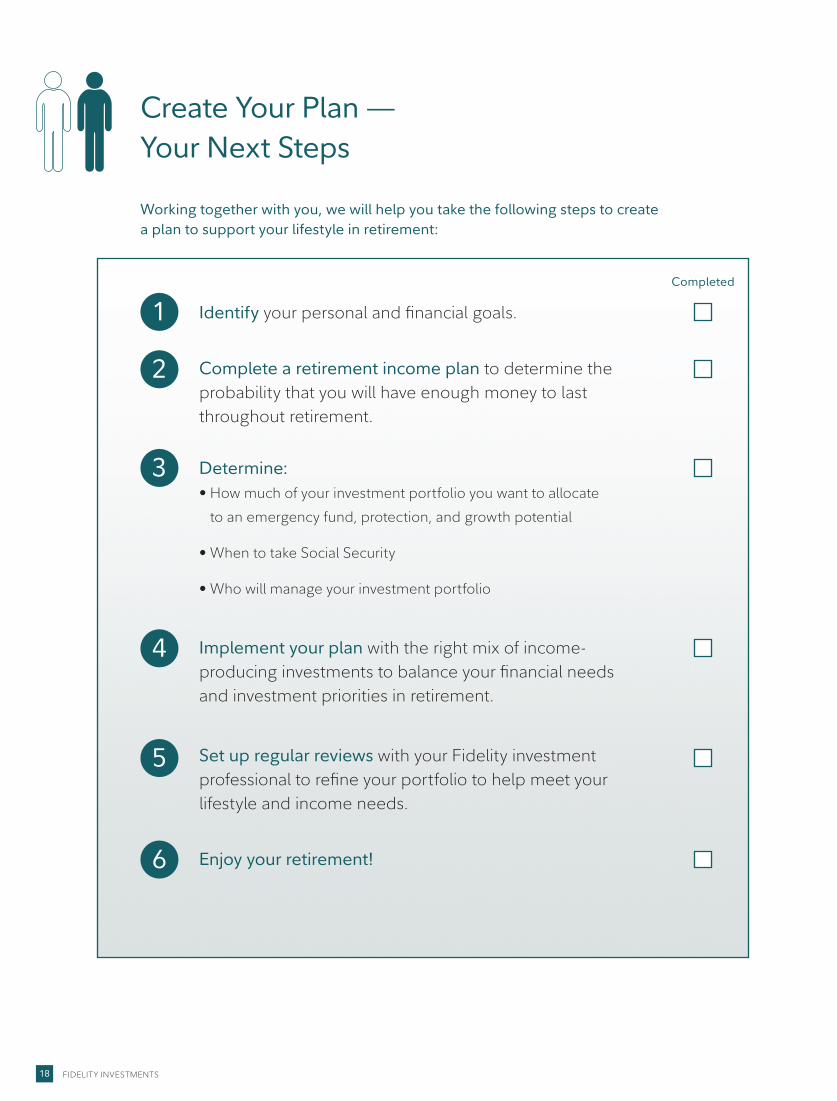
Working together with you, we will help you take the following steps to create a plan to support your lifestyle in retirement:
FIDELITY INVESTMENTS18
1
2
3
4
5
6
Identify your personal and financial goals.
Complete a retirement income plan to determine the probability that you will have enough money to last throughout retirement.
Determine: • How much of your investment portfolio you want to allocate
to an emergency fund, protection, and growth potential
• When to take Social Security
• Who will manage your investment portfolio
Implement your plan with the right mix of income-producing investments to balance your financial needs and investment priorities in retirement.
Set up regular reviews with your Fidelity investment professional to refine your portfolio to help meet your lifestyle and income needs.
Enjoy your retirement!
Create Your Plan —Your Next Steps
Completed

INCOME DIVERSIFICATION 19
FIDELITY INVESTMENTS20
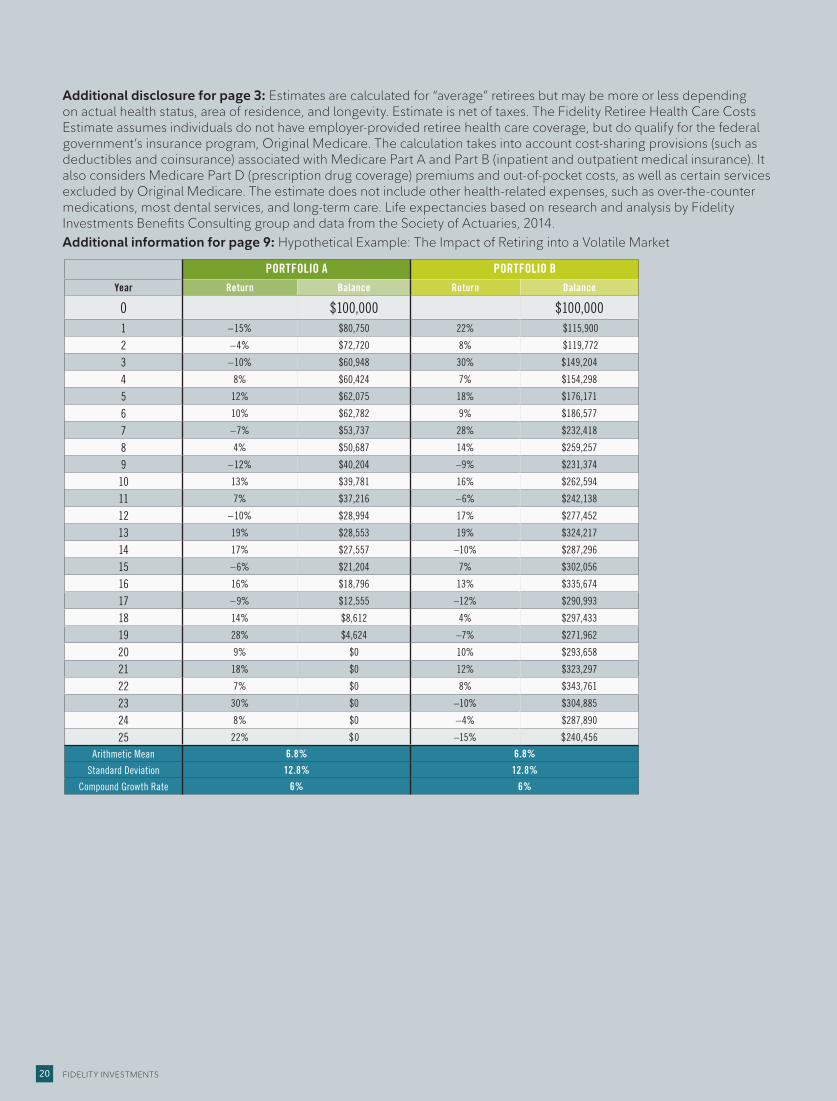
Additional disclosure for page 3: Estimates are calculated for “average” retirees but may be more or less depending on actual health status, area of residence, and longevity. Estimate is net of taxes. The Fidelity Retiree Health Care Costs Estimate assumes individuals do not have employer-provided retiree health care coverage, but do qualify for the federal government’s insurance program, Original Medicare. The calculation takes into account cost-sharing provisions (such as deductibles and coinsurance) associated with Medicare Part A and Part B (inpatient and outpatient medical insurance). It also considers Medicare Part D (prescription drug coverage) premiums and out-of-pocket costs, as well as certain services excluded by Original Medicare. The estimate does not include other health-related expenses, such as over-the-counter medications, most dental services, and long-term care. Life expectancies based on research and analysis by Fidelity Investments Benefits Consulting group and data from the Society of Actuaries, 2014.Additional information for page 9: Hypothetical Example: The Impact of Retiring into a Volatile Market
PORTFOLIO A PORTFOLIO BYear Return Balance Return Balance
0 $100,000 $100,0001 –15% $80,750 22% $115,900
2 –4% $72,720 8% $119,772
3 –10% $60,948 30% $149,204
4 8% $60,424 7% $154,298
5 12% $62,075 18% $176,171
6 10% $62,782 9% $186,577
7 –7% $53,737 28% $232,418
8 4% $50,687 14% $259,257
9 –12% $40,204 –9% $231,374
10 13% $39,781 16% $262,594
11 7% $37,216 –6% $242,138
12 –10% $28,994 17% $277,452
13 19% $28,553 19% $324,217
14 17% $27,557 –10% $287,296
15 –6% $21,204 7% $302,056
16 16% $18,796 13% $335,674
17 –9% $12,555 –12% $290,993
18 14% $8,612 4% $297,433
19 28% $4,624 –7% $271,962
20 9% $0 10% $293,658
21 18% $0 12% $323,297
22 7% $0 8% $343,761
23 30% $0 –10% $304,885
24 8% $0 –4% $287,890
25 22% $0 –15% $240,456
Arithmetic Mean 6.8% 6.8%
Standard Deviation 12.8% 12.8%
Compound Growth Rate 6% 6%


90 0 SALEM STREET SMITHFIELD, RHODE ISL AND 02917
This information is intended to be educational and is not tailored to the investment needs of any specific investor.
Keep in mind that investing involves risk. The value of your investment will fluctuate over time, and you may gain or lose money.Fidelity does not provide legal or tax advice. The information herein is general in nature and should not be considered legal or tax advice. Consult an attorney or tax professional regarding your specific situation.
Fixed annuities available at Fidelity are issued by third-party insurance companies, which are not affiliated with any Fidelity Investments company. These products are distributed by Fidelity Insurance Agency, Inc., and, for certain products, by Fidelity Brokerage Services, Member NYSE, SIPC. A contract’s financial guarantees are solely the responsibility of and are subject to the claims-paying ability of the issuing insurance company.Fidelity Brokerage Services LLC, Member NYSE, SIPC, 900 Salem Street, Smithfield, RI 02917© 2017 FMR LLC. All rights reserved. 728341.7.0 1.9866017.105


