FIBER REINFORCEMENTS: CORRELATING PERMEABILITY …. Oral... · 3 FIBER REINFORCEMENTS: CORRELATING...
6
18 TH INTERNATIONAL CONFERENCE ON COMPOSITE MATERIALS 1 Introduction The manufacturing of composite materials is influenced by variability in the constituent materials. For the Liquid Composite Moulding (LCM) family of processes, development of resin flow and tooling forces are governed by the architecture of the reinforcement. Permeability and compaction response depend on local fibre content and architecture, and significant variability can occur in-plane within a single reinforcement layer. As multi-layered preforms are constructed, accumulation of layers generates several additional sources of variability. This paper focuses on global and spatial variability in the permeability of fibre reinforcements, relating this important transport property to variation in reinforcement architecture. A novel image processing technique is used to automatically quantify spatial variation in geometric features within preform samples. The same samples were then submitted to an efficient radial flow permeability measurement. Radial injection studies are presented for single layer samples (three architectures). Multi-layer preform results are also provided. Statistical analysis of the permeability results will be correlated to data gathered via the image processing characterisation. 2 Experimental Assessment of Variability 2.1 Optical Geometric Assessment Significant in-plane spatial variability can occur in the structure of a single layer of fibre reinforcement. Permeability is known to be a strong function of local fibre volume fraction, and of the geometry of flow channels between fibre tows [1,2]. Spatial variability in reinforcement architecture has been quantified via image analysis based techniques. Images of light transmitted through a sample are analyzed to automatically measure spatial variation in areal weight, and geometric features of biaxial fabrics [3]. Large data sets are established [4] for parameters such as tow direction, spacing, and width, which are known to govern permeability. 2.2 Anisotropic Permeability Assessment Optically characterised samples have been submitted to an in-plane radial flow, anisotropic permeability measurement. Permeability data is computed from the injection pressure trace and flow front evolution. Flow fronts are tracked optically, and processed using automated image processing procedures. 2.3 Materials Three materials are studied: a Chopped Strand Mat (CSM), a Bi-Directional stitched (BD) and a Plain Weave (PW). All three are formed from E- glass fibres, and are good representations of the type of fibrous architecture commonly applied in fibre reinforced composites. Table 1 displays the characteristics of the three reinforcements. The unit cell sizes of the BD and PW are around 2.8 mm x 3.7 mm, and 12.7 mm x 12.4 mm respectively. Tab. 1 Details of fibre reinforcements studied. Fibre Reinforce- ment Manufacturer Manufactu rer’s Reference Measured areal weight CSM Owens Corning M705450 457 g/m 2 PW Lintex Wovifab EWR 800 822 g/m 2 BD Haining Chengrudan Reinf. Fabrics LT 800 875 g/m 2 FIBER REINFORCEMENTS: CORRELATING PERMEABILITY AND LOCAL SPATIAL FIBROUS FEATURES S. Comas-Cardona 1 , F. Zhang 1 , S. Bickerton 2 , L. Tournier 2 , J.M. Gan 2 , C. Binetruy 1 1 Technology of Polymers and Composites & Mech. Eng. Dep., Ecole des Mines de Douai, 941 Rue Charles Bourseul, 59508 Douai, France 2 Centre for Advanced Composite Materials, University of Auckland, Auckland, New Zealand * Corresponding author ([email protected]) Keywords: Variability, reinforcement architecture, resin flow, permeability
Transcript of FIBER REINFORCEMENTS: CORRELATING PERMEABILITY …. Oral... · 3 FIBER REINFORCEMENTS: CORRELATING...
18TH INTERNATIONAL CONFERENCE ON COMPOSITE MATERIALS
1 Introduction
The manufacturing of composite materials is influenced by variability in the constituent materials. For the Liquid Composite Moulding (LCM) family of processes, development of resin flow and tooling forces are governed by the architecture of the reinforcement. Permeability and compaction response depend on local fibre content and architecture, and significant variability can occur in-plane within a single reinforcement layer. As multi-layered preforms are constructed, accumulation of layers generates several additional sources of variability. This paper focuses on global and spatial variability in the permeability of fibre reinforcements, relating this important transport property to variation in reinforcement architecture. A novel image processing technique is used to automatically quantify spatial variation in geometric features within preform samples. The same samples were then submitted to an efficient radial flow permeability measurement. Radial injection studies are presented for single layer samples (three architectures). Multi-layer preform results are also provided. Statistical analysis of the permeability results will be correlated to data gathered via the image processing characterisation. 2 Experimental Assessment of Variability 2.1 Optical Geometric Assessment
Significant in-plane spatial variability can occur in the structure of a single layer of fibre reinforcement. Permeability is known to be a strong function of local fibre volume fraction, and of the geometry of flow channels between fibre tows [1,2]. Spatial variability in reinforcement architecture has been quantified via image
analysis based techniques. Images of light transmitted through a sample are analyzed to automatically measure spatial variation in areal weight, and geometric features of biaxial fabrics [3]. Large data sets are established [4] for parameters such as tow direction, spacing, and width, which are known to govern permeability. 2.2 Anisotropic Permeability Assessment
Optically characterised samples have been submitted to an in-plane radial flow, anisotropic permeability measurement. Permeability data is computed from the injection pressure trace and flow front evolution. Flow fronts are tracked optically, and processed using automated image processing procedures. 2.3 Materials
Three materials are studied: a Chopped Strand Mat (CSM), a Bi-Directional stitched (BD) and a Plain Weave (PW). All three are formed from E-glass fibres, and are good representations of the type of fibrous architecture commonly applied in fibre reinforced composites. Table 1 displays the characteristics of the three reinforcements. The unit cell sizes of the BD and PW are around 2.8 mm x 3.7 mm, and 12.7 mm x 12.4 mm respectively. Tab. 1 Details of fibre reinforcements studied. Fibre Reinforce-ment
Manufacturer Manufacturer’s Reference
Measured areal weight
CSM Owens Corning M705450 457 g/m2 PW Lintex Wovifab
EWR 800 822 g/m2
BD Haining Chengrudan Reinf. Fabrics
LT 800 875 g/m2
FIBER REINFORCEMENTS: CORRELATING PERMEABILITY AND LOCAL SPATIAL FIBROUS FEATURES
S. Comas-Cardona1, F. Zhang1, S. Bickerton2, L. Tournier2, J.M. Gan2, C. Binetruy1
1 Technology of Polymers and Composites & Mech. Eng. Dep., Ecole des Mines de Douai, 941 Rue Charles Bourseul, 59508 Douai, France
2 Centre for Advanced Composite Materials, University of Auckland, Auckland, New Zealand * Corresponding author ([email protected])
Keywords: Variability, reinforcement architecture, resin flow, permeability
3 Single Layer Injection Study 3.1 Experimental analysis A series of radial injection tests have been performed on the three glass reinforcementspresented in Tab. 1 and in Fig. 1, 35 completed for each. Example images obtained from the optical assessment describedare provided in Fig. 1.
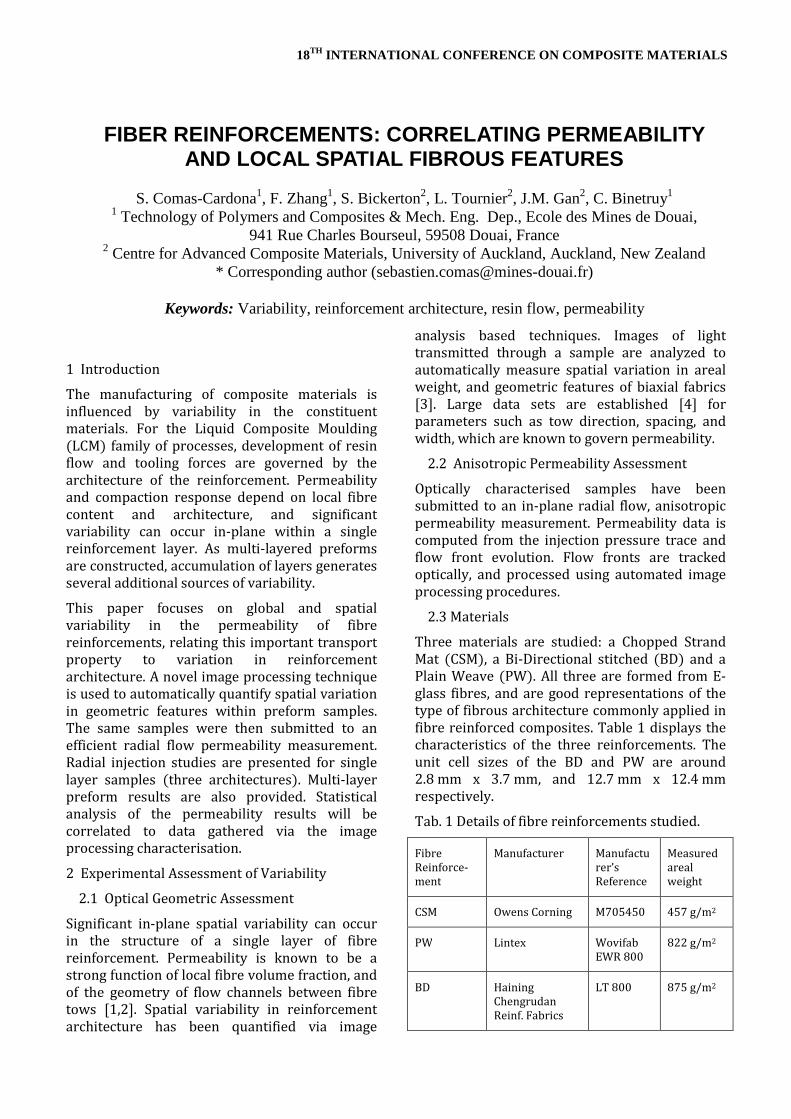
Fig. 1 Optical images obtained from the light transmission setup. The central injection hole is 15 mm in diameter. Observations have been made on variability in flow front shape, and in average permeability data (magnitudes, anisotropy ratio). flow fronts are presented in Figure 2
CSM (39s of injection)
PW (41s of injection
BDinjection)
Fig. 2 Illustration of central injection flow front variability (resin impregnated area is Variability results (coefficients of variation CV) sample areal weights and average permeabilities
A series of radial injection tests have been three glass reinforcements
, 35 experiments images obtained
described in Sec. 2.1
1 Optical images obtained from the light
The central injection hole is
made on variability in flow front shape, and in average permeability data (magnitudes, anisotropy ratio). Example
ronts are presented in Figure 2.
BD (32s of injection)
entral injection flow front (resin impregnated area is in white).
(coefficients of variation CV) of average permeabilities
are provided in Tab. 2. While areal weight is very lowmanufacturing control and qualitypermeability variations for Vf of 0.38 for the CSM and BD. Tab. 2 Coefficients of variation (CV, i.e. standard deviation divided by mean values) for the three reinforcements. Principal permeabilities and anisotropy ratios are presented. Areal
weight Kx
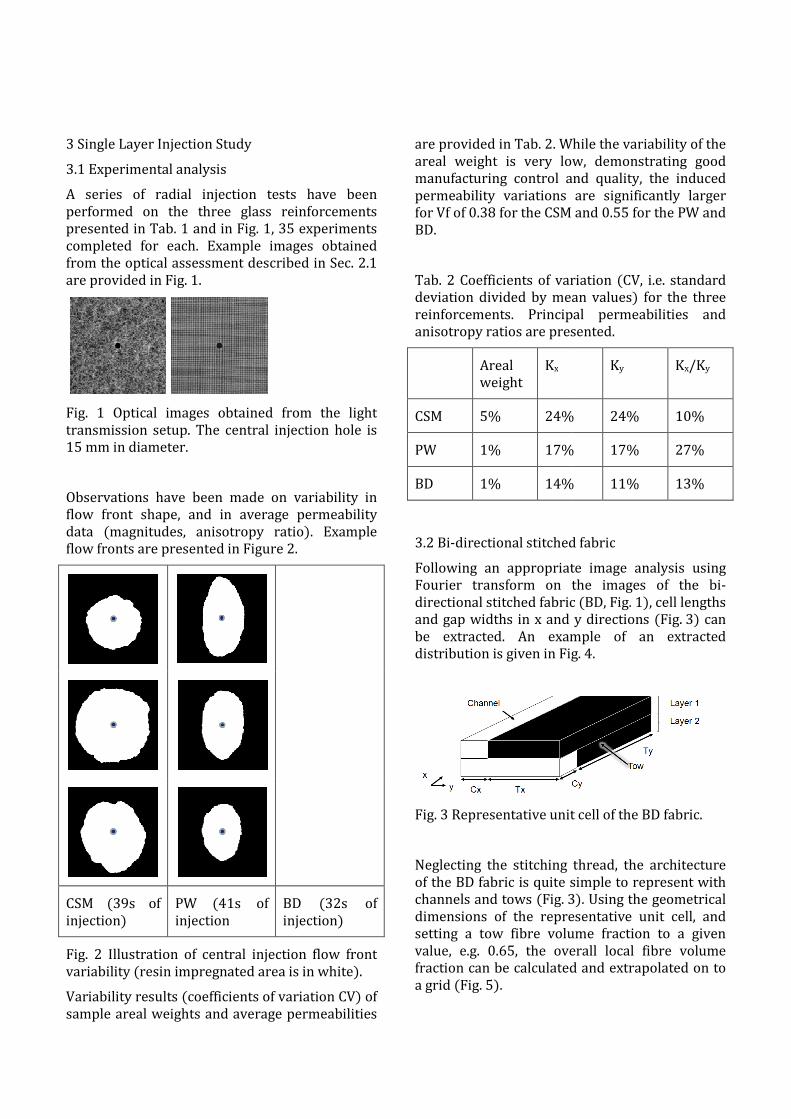
CSM 5% 24%PW 1% 17%BD 1% 14% 3.2 Bi-directional stitched fabricFollowing an appropriate image analysis Fourier transform on the images of the bidirectional stitched fabric (BD, Fig.and gap widths in x and y directions (Fig.be extracted. An example of distribution is given in Fig.
Fig. 3 Representative unit cell of the BD fabric. Neglecting the stitching threadof the BD fabric is quite simple to represent with channels and tows (Fig. 3). dimensions of the representatisetting a tow fibre volume fraction to a given value, e.g. 0.65, the overall local fibre volume fraction can be calculated and extrapolated on a grid (Fig. 5).
While the variability of the low, demonstrating good
manufacturing control and quality, the induced are significantly larger
for the CSM and 0.55 for the PW and
Tab. 2 Coefficients of variation (CV, i.e. standard deviation divided by mean values) for the three
Principal permeabilities and anisotropy ratios are presented.
Ky Kx/Ky
24% 24% 10% 17% 17% 27% 14% 11% 13%
directional stitched fabric Following an appropriate image analysis using
on the images of the bi-stitched fabric (BD, Fig. 1), cell lengths
x and y directions (Fig. 3) can An example of an extracted
distribution is given in Fig. 4.
Fig. 3 Representative unit cell of the BD fabric.
the stitching thread, the architecture s quite simple to represent with
3). Using the geometrical of the representative unit cell, and
setting a tow fibre volume fraction to a given , the overall local fibre volume
fraction can be calculated and extrapolated on to
3
FIBER REINFORCEMENTS: CORRELATING PERMEABILITY AND LOCAL SPATIAL FIBROUS FEATURES
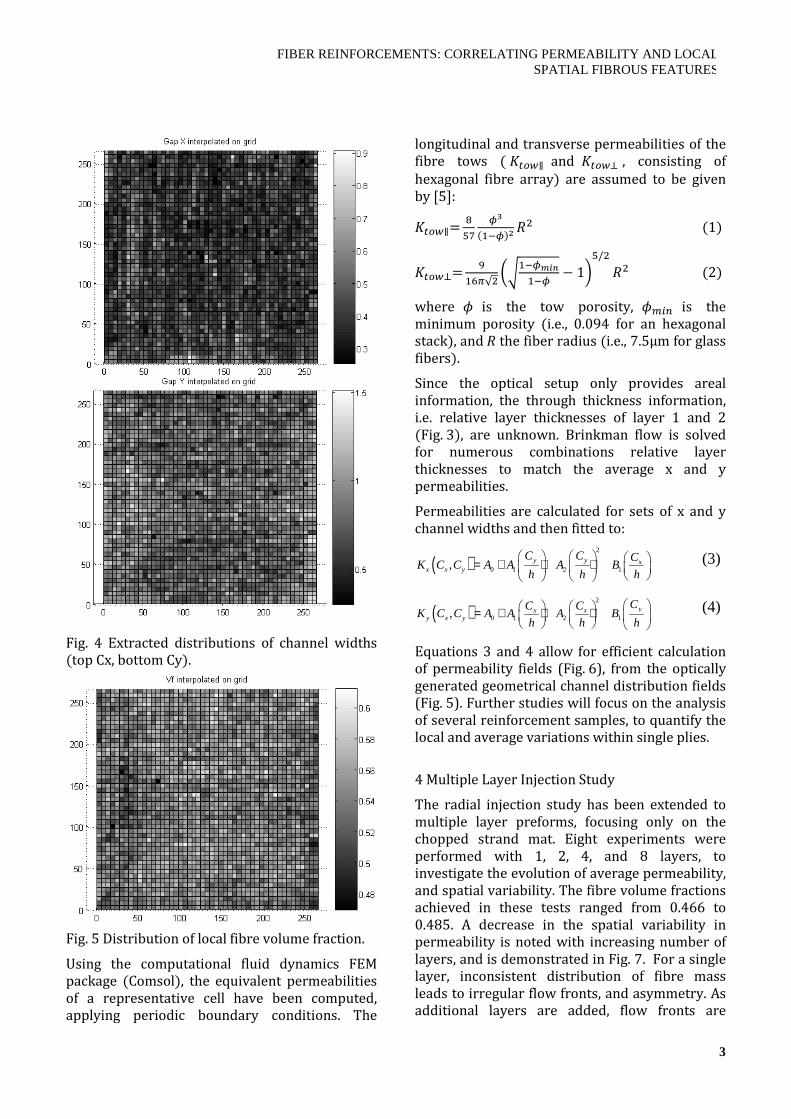
Fig. 4 Extracted distributions of channel widths (top Cx, bottom Cy).
Fig. 5 Distribution of local fibre volume fraction. Using the computational fluid dynamics FEM package (Comsol), the equivalent permeabilities of a representative cell have been computed, applying periodic boundary conditions. The
longitudinal and transverse permeabilities of the fibre tows ( EFGHI and EFGHJ , consisting of hexagonal fibre array) are assumed to be given by [5]: EFGHIK L
MNOP
(QRO)S TU (1)
EFGHJK VQWX√U Z[QRO\]^
QRO _ 1`M/U
TU (2)
where a is the tow porosity, abcd is the minimum porosity (i.e., 0.094 for an hexagonal stack), and T the fiber radius (i.e., 7.5µm for glass fibers).
Since the optical setup only provides areal information, the through thickness information, i.e. relative layer thicknesses of layer 1 and 2 (Fig. 3), are unknown. Brinkman flow is solved for numerous combinations relative layer thicknesses to match the average x and y permeabilities.
Permeabilities are calculated for sets of x and y channel widths and then fitted to:
( )2
0 1 2 1, y y xx x y
C C CK C C A A A B
h h h
= + + +
(3)
( )2
0 1 2 1, yx xy x y
CC CK C C A A A B
h h h
= + + +
(4)
Equations 3 and 4 allow for efficient calculation of permeability fields (Fig. 6), from the optically generated geometrical channel distribution fields (Fig. 5). Further studies will focus on the analysis of several reinforcement samples, to quantify the local and average variations within single plies.
4 Multiple Layer Injection Study
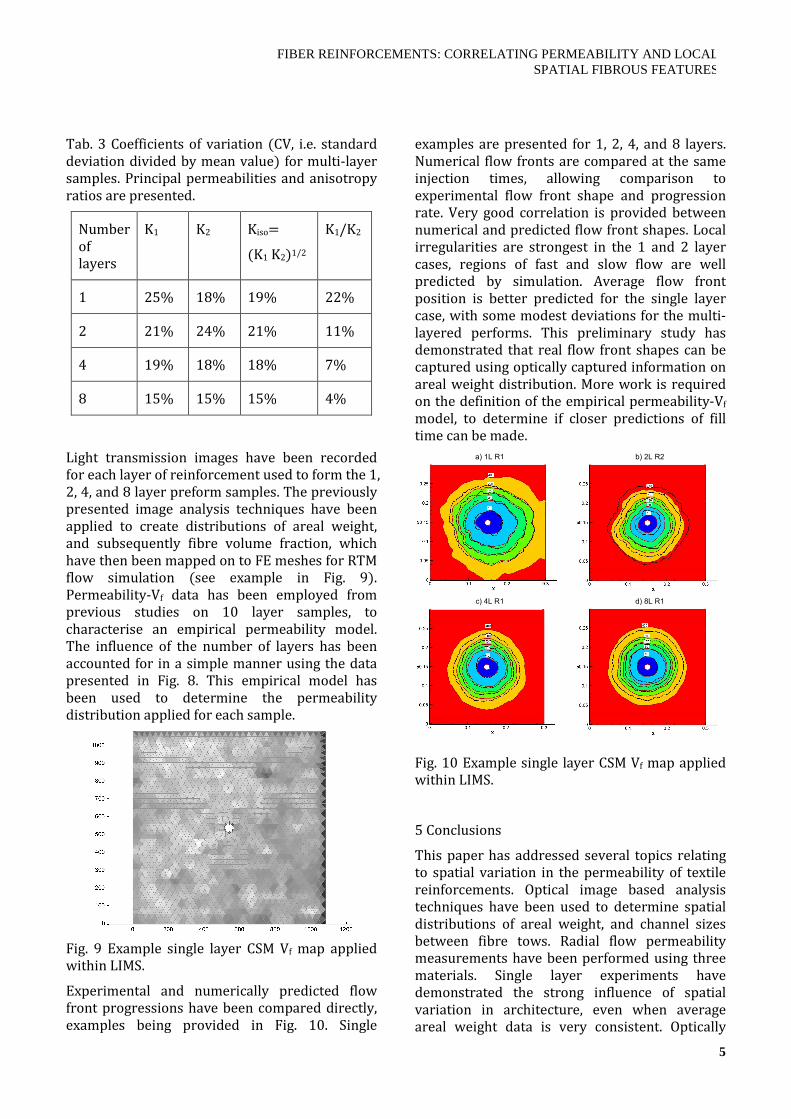
The radial injection study has been extended to multiple layer preforms, focusing only on the chopped strand mat. Eight experiments were performed with 1, 2, 4, and 8 layers, to investigate the evolution of average permeability, and spatial variability. The fibre volume fractions achieved in these tests ranged from 0.466 to 0.485. A decrease in the spatial variability in permeability is noted with increasing number of layers, and is demonstrated in Fig. 7. For a single layer, inconsistent distribution of fibre mass leads to irregular flow fronts, and asymmetry. As additional layers are added, flow fronts are
increasingly smoothed, resulting in the highest isotropy for 8 layers.
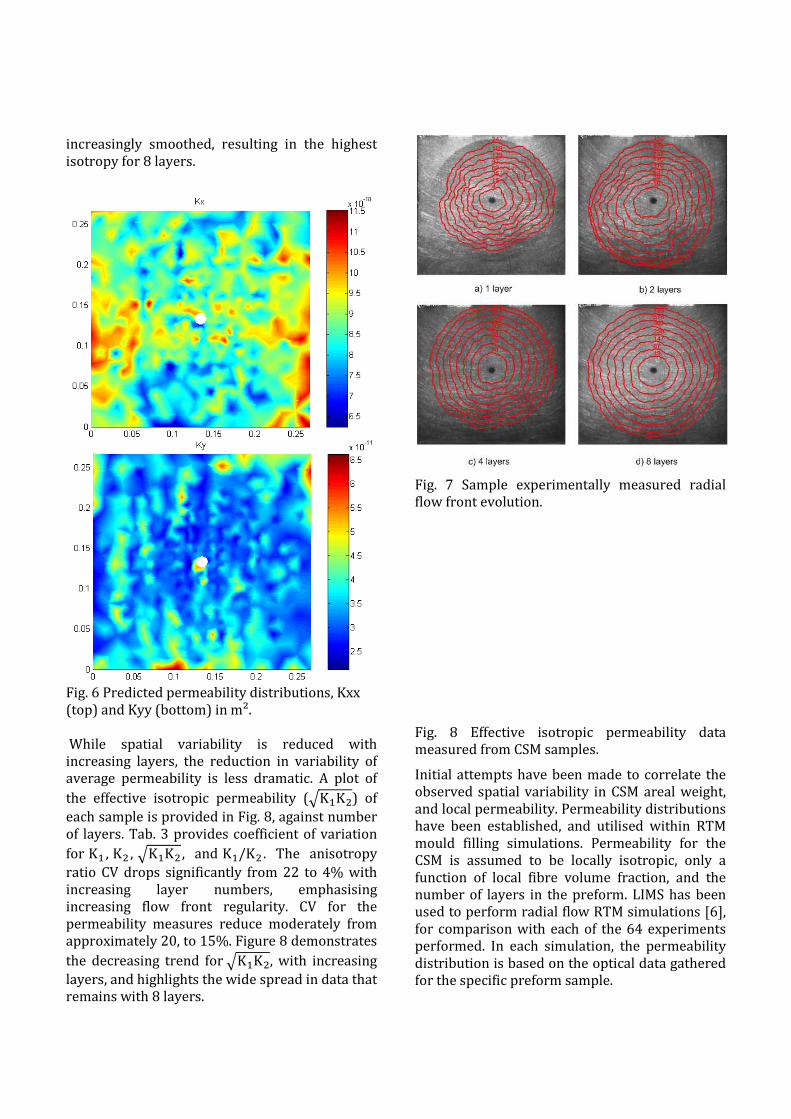
Fig. 6 Predicted permeability distributions, Kxx (top) and Kyy (bottom) in m². While spatial variability is reduced with increasing layers, the reduction in variability of average permeability is less dramatic. A plot of
the effective isotropic permeability (fKQKU) of each sample is provided in Fig. 8, against number of layers. Tab. 3 provides coefficient of variation
for KQ , KU , fKQKU , and KQ/KU . The anisotropy ratio CV drops significantly from 22 to 4% with increasing layer numbers, emphasising increasing flow front regularity. CV for the permeability measures reduce moderately from approximately 20, to 15%. Figure 8 demonstrates
the decreasing trend for fKQKU, with increasing layers, and highlights the wide spread in data that remains with 8 layers.
Fig. 7 Sample experimentally measured radial flow front evolution.
Fig. 8 Effective isotropic permeability data measured from CSM samples.
Initial attempts have been made to correlate the observed spatial variability in CSM areal weight, and local permeability. Permeability distributions have been established, and utilised within RTM mould filling simulations. Permeability for the CSM is assumed to be locally isotropic, only a function of local fibre volume fraction, and the number of layers in the preform. LIMS has been used to perform radial flow RTM simulations [6], for comparison with each of the 64 experiments performed. In each simulation, the permeability distribution is based on the optical data gathered for the specific preform sample.
5
FIBER REINFORCEMENTS: CORRELATING PERMEABILITY AND LOCAL SPATIAL FIBROUS FEATURES
Tab. 3 Coefficients of variation (CV, i.e. standard deviation divided by mean value) for multi-layer samples. Principal permeabilities and anisotropy ratios are presented.
Number of layers
K1
K2
KisoK (K1 K2)1/2
K1/K2
1 25% 18% 19% 22% 2 21% 24% 21% 11% 4 19% 18% 18% 7% 8 15% 15% 15% 4%
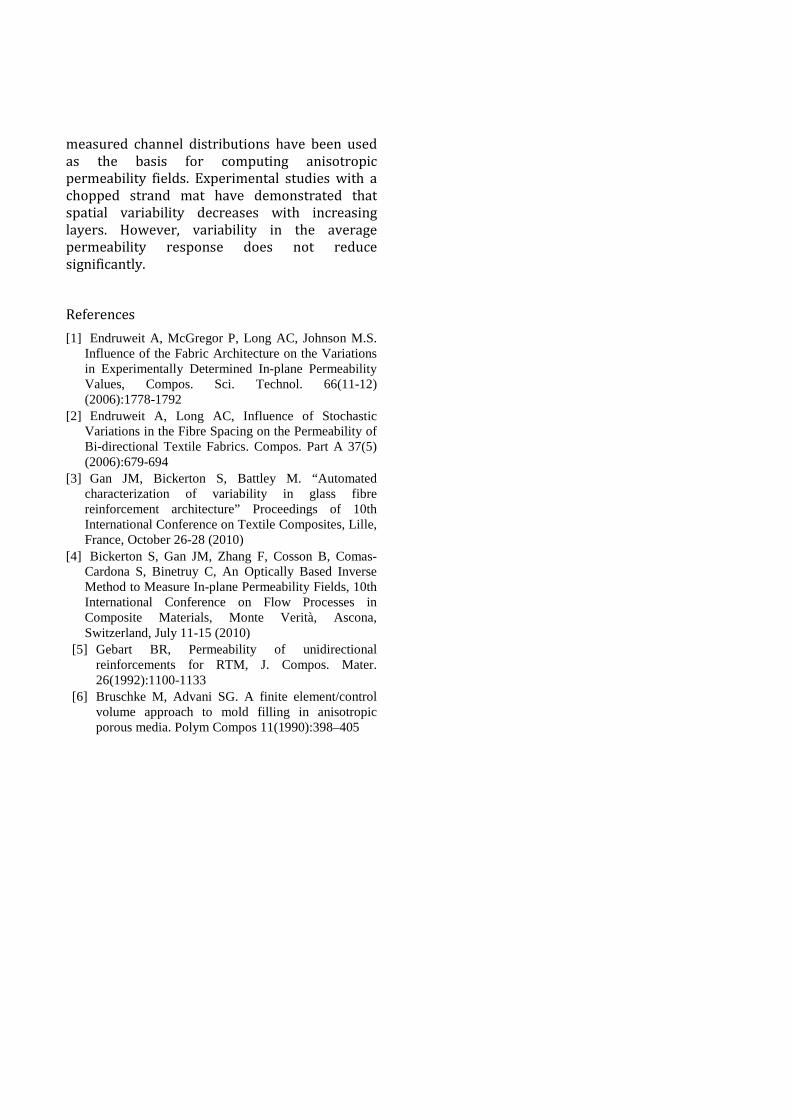
Light transmission images have been recorded for each layer of reinforcement used to form the 1, 2, 4, and 8 layer preform samples. The previously presented image analysis techniques have been applied to create distributions of areal weight, and subsequently fibre volume fraction, which have then been mapped on to FE meshes for RTM flow simulation (see example in Fig. 9). Permeability-Vf data has been employed from previous studies on 10 layer samples, to characterise an empirical permeability model. The influence of the number of layers has been accounted for in a simple manner using the data presented in Fig. 8. This empirical model has been used to determine the permeability distribution applied for each sample.
Fig. 9 Example single layer CSM Vf map applied within LIMS. Experimental and numerically predicted flow front progressions have been compared directly, examples being provided in Fig. 10. Single
examples are presented for 1, 2, 4, and 8 layers. Numerical flow fronts are compared at the same injection times, allowing comparison to experimental flow front shape and progression rate. Very good correlation is provided between numerical and predicted flow front shapes. Local irregularities are strongest in the 1 and 2 layer cases, regions of fast and slow flow are well predicted by simulation. Average flow front position is better predicted for the single layer case, with some modest deviations for the multi-layered performs. This preliminary study has demonstrated that real flow front shapes can be captured using optically captured information on areal weight distribution. More work is required on the definition of the empirical permeability-Vf model, to determine if closer predictions of fill time can be made.
a) 1L R1 b) 2L R2
c) 4L R1 d) 8L R1
Fig. 10 Example single layer CSM Vf map applied within LIMS. 5 Conclusions This paper has addressed several topics relating to spatial variation in the permeability of textile reinforcements. Optical image based analysis techniques have been used to determine spatial distributions of areal weight, and channel sizes between fibre tows. Radial flow permeability measurements have been performed using three materials. Single layer experiments have demonstrated the strong influence of spatial variation in architecture, even when average areal weight data is very consistent. Optically
measured channel distributions have been used as the basis for computing anisotropic permeability fields. Experimental studies with a chopped strand mat have demonstrated that spatial variability decreases with increasing layers. However, variability in the average permeability response does not reduce significantly. References [1] Endruweit A, McGregor P, Long AC, Johnson M.S.
Influence of the Fabric Architecture on the Variations in Experimentally Determined In-plane Permeability Values, Compos. Sci. Technol. 66(11-12) (2006):1778-1792
[2] Endruweit A, Long AC, Influence of Stochastic Variations in the Fibre Spacing on the Permeability of Bi-directional Textile Fabrics. Compos. Part A 37(5) (2006):679-694
[3] Gan JM, Bickerton S, Battley M. “Automated characterization of variability in glass fibre reinforcement architecture” Proceedings of 10th International Conference on Textile Composites, Lille, France, October 26-28 (2010)
[4] Bickerton S, Gan JM, Zhang F, Cosson B, Comas-Cardona S, Binetruy C, An Optically Based Inverse Method to Measure In-plane Permeability Fields, 10th International Conference on Flow Processes in Composite Materials, Monte Verità, Ascona, Switzerland, July 11-15 (2010)
[5] Gebart BR, Permeability of unidirectional reinforcements for RTM, J. Compos. Mater. 26(1992):1100-1133
[6] Bruschke M, Advani SG. A finite element/control volume approach to mold filling in anisotropic porous media. Polym Compos 11(1990):398–405