Fertilizer Subsidy in India: Who are the Beneficiaries? subsidy.pdf · INDIAN INSTITUTE OF...
33
INDIAN INSTITUTE OF MANAGEMENT AHMEDABAD INDIA Research and Publications Fertilizer Subsidy in India: Who are the Beneficiaries? Vijay Paul Sharma Hrima Thaker W.P. No. 2009-07-01 July 2009 The main objective of the working paper series of the IIMA is to help faculty members, research staff and doctoral students to speedily share their research findings with professional colleagues and test their research findings at the pre-publication stage. IIMA is committed to maintain academic freedom. The opinion(s), view(s) and conclusion(s) expressed in the working paper are those of the authors and not that of IIMA. INDIAN INSTITUTE OF MANAGEMENT AHMEDABAD-380 015 INDIA
-
Upload
hoangkhuong -
Category
Documents
-
view
218 -
download
1
Transcript of Fertilizer Subsidy in India: Who are the Beneficiaries? subsidy.pdf · INDIAN INSTITUTE OF...
INDIAN INSTITUTE OF MANAGEMENT AHMEDABAD INDIA
Research and Publications
Fertilizer Subsidy in India: Who are the Beneficiaries?
Vijay Paul Sharma Hrima Thaker
W.P. No. 2009-07-01 July 2009
The main objective of the working paper series of the IIMA is to help faculty members, research staff and doctoral students to speedily share their research findings with professional colleagues
and test their research findings at the pre-publication stage. IIMA is committed to maintain academic freedom. The opinion(s), view(s) and conclusion(s) expressed in the working paper are
those of the authors and not that of IIMA.
INDIAN INSTITUTE OF MANAGEMENT AHMEDABAD-380 015
INDIA
IIMA INDIA Research and Publications
W.P. No. 2009-07-01 Page No. 2
Fertilizer Subsidy in India: Who are the Beneficiaries?
Vijay Paul Sharma1 and Hrima Thaker
Abstract
Agricultural subsidies that encourage production and productivity have been widely criticized because of the cost of subsidies and they are perceived to be far from uniformly distributed. There is a general view in academic, policy and political circles that agricultural subsidies are concentrated geographically, they are concentrated on relatively few crops and few producers and in many cases do not reach the targeted group(s). One of the most contentious issues surrounding input subsidies in general and fertilizer in particular in India is how much of what is paid out actually finds its way into the pocket of the farmer, and how much is siphoned away by the input companies. There has also been a debate about the issue of real beneficiaries of fertilizer subsidy like small vs. large farmers, well-developed vs. less developed regions, etc. Therefore, there is need to understand the fertilizer subsidy distribution pattern to assess whether the subsidy benefits the target group(s), an argument often made while giving any farm subsidy. This paper examines trends in fertilizer subsidy and the issue of distribution of fertilizer subsidies between farmers and fertilizer industry, across regions/states, crops and different farm sizes. The study shows that fertilizer subsidy has increased significantly in the post-reforms period from Rs. 4389 crore in 1990-91 to Rs. 75849 crore in 2008-09. As a percentage of GDP, this represents an increase from 0.85 per cent in 1990-91 to 1.52 per cent in 2008-09. The paper shows that general perception that about one-third of fertilizer subsidy goes to fertilizer industry is misleading because the underlying assumptions (i) that India’s entry into world market as an importer does not affect world prices, and (ii) world fertilizer markets are perfectly competitive, do not hold true. The world fertilizer trade-flows and markets are more concentrated and volatile and imports by India have significant impact on world prices. Moreover, with shift from the earlier cost-plus based approach to import parity pricing (IPP), the Indian fertilizer industry would be exposed to the world competition and efficient units would survive. Therefore, the proposed policy of direct transfer of fertilizer subsidy to farmers is misconceived and inappropriate and its adverse effects outweigh the perceived benefits of it. The study shows that fertilizer subsidy is more concentrated in few states, namely, Uttar Pradesh, Andhra Pradesh, Maharashtra, Madhya Pradesh, and Punjab. Inter-state disparity in fertilizer subsidy distribution is still high though it has declined over the years. Rice is the most heavily subsidized crop followed by wheat, sugarcane and cotton. These four crops account for about two-third of total fertilizer subsidy. The study highlights the existence of fair degree of equity in distribution of fertilizer subsidy among farm sizes. The small and marginal farmers have a larger share in fertilizer subsidy in comparison to their share in cultivated area. A reduction in fertilizer subsidy is, therefore, likely to have adverse impact on farm production and income of small and marginal farmers as they do not benefit from higher output prices but do benefit from lower input prices. This paper justifies the fertilizer subsidies and questions the rationale for direct transfer of subsidy to farmers. Keywords: Fertilizer, Subsidies, Beneficiaries, Import Parity Price, Direct Transfer, Farm Size
1 Email: [email protected]

IIMA INDIA Research and Publications
W.P. No. 2009-07-01 Page No. 3
Fertilizer Subsidy in India: Who are the Beneficiaries?
Vijay Paul Sharma and Hrima Thaker
Governments in both developed and developing countries intervene in agriculture with a view
to achieving a wide range of economic and social objectives. The reasons for government
intervention are diverse and varied. Some of the most cited reasons for intervention are self
sufficiency, employment creation, support small-scale producers for adopting modern
technologies and inputs, reduce price instability and improve the income of farm households.
This intervention can take a number of forms such as import policies export policies and
domestic policies like price support programmes, direct payments, and input subsidies to
influence the cost and availability of farm inputs, like credit, fertilizers, seeds, irrigation
water, etc. Of all domestic support instruments in agriculture, input subsidies and product
price support are the most common. Various benefits are cited in justifying input subsidies:
economic, environmental and social (World Bank, 2008). Input subsidies can bring economic
benefits to society but can also be a major cause of negative environmental externalities when
they promote excessive use of fertilizers, agrochemicals and irrigation water. The inputs like
fertilizers, irrigation water and electricity have significant share in agricultural subsidies in
India and fertilizer subsidy has attracted a lot of attention of policy makers, researchers, and
politicians in the recent past. One of the most contentious issues surrounding fertilizer
subsidies in India is how much of what is paid out actually finds its way into the pocket of the
farmer, and how much is siphoned away by the fertilizer companies. There has also been a
debate about the issue of real beneficiaries of these subsidies (small vs. large farmers, well-
developed vs. less developed regions, etc.).
This paper focuses primarily on the issues, whether fertilizer subsidy is going to the farmers
or to the industry and is there equity in distribution of fertilizer subsidy across regions, crops,
and different farm sizes. Section I of this paper describes the trends in fertilizer subsidies in
IIMA INDIA Research and Publications
W.P. No. 2009-07-01 Page No. 4
India while section II deals with the issue of beneficiaries of fertilizer subsidy and inter-state,
inter-crop and inter-farm size disparity in fertilizer subsidy. The final section sums up the
findings of the paper and raises some policy issues.
I
Trends in Fertilizer Subsidies
Both intensity of fertilizer usage in terms of nutrients per hectare area and the extent of
fertilization as measured by the ratio of fertilized area to total cropped area in many
developing countries including India are lower than developed countries. However, fertilizer
use has been and will continue to be a major factor in the increasing agricultural production
and productivity. Typically, very few countries, even advanced ones, have relied entirely on
the free market system to set fertilizer prices. It is, therefore, not surprising that governments
in developing countries are promoting use of fertilizers using various policy instruments
including subsidies. The fertilizer prices at both producer and farmer levels are determined
directly or indirectly by the government in most of the countries and such government
interventions generally have two basic objectives: (i) to provide fertilizers to farmers at stable
and affordable prices in order to increase agricultural production through higher fertilizer use,
and (ii) to encourage domestic production by allowing fertilizer producers a reasonable return
on their investments.
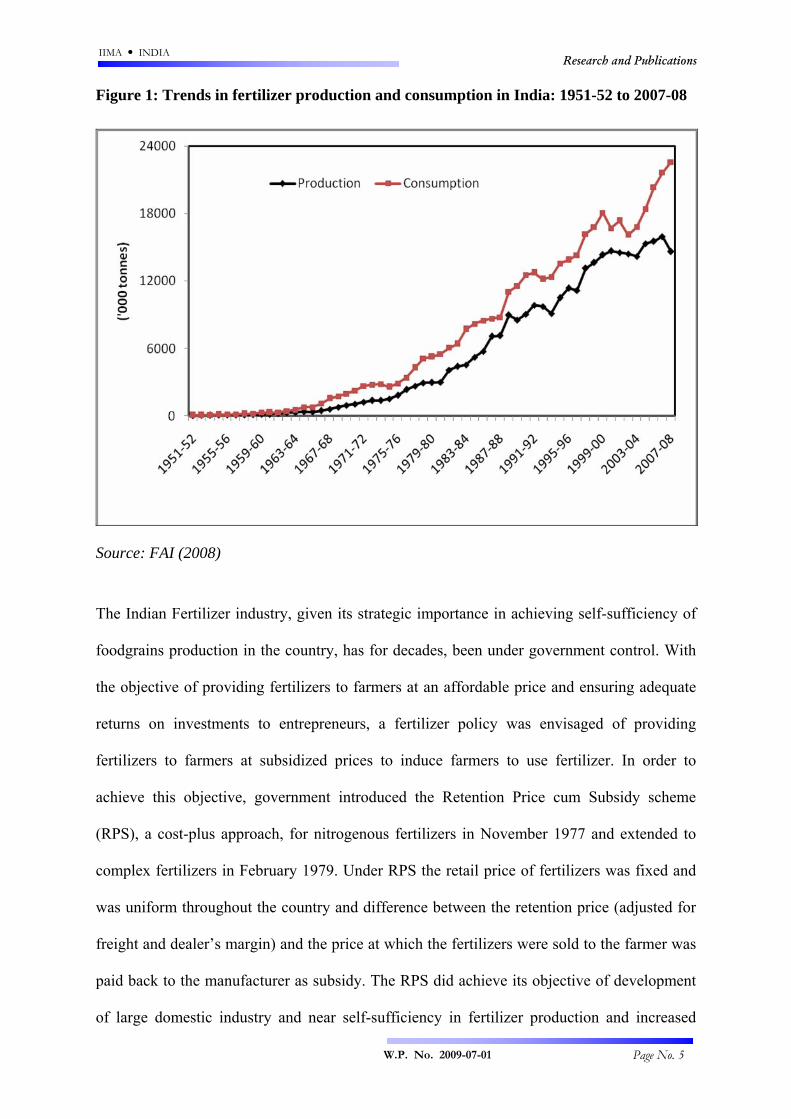
The Indian fertilizer industry has come a long way since its early days of post independence
era. India today is one of the largest producer and consumer of fertilizers in the world. India’s
production in terms of nutrients (N and P2O5) reached a level of 15.96 million tonnes in
2006-07 from 38.7 thousand tonnes in 1951-52. Similarly, consumption of fertilizers in terms
of nutrients (NPK) has also grown from 65.6 thousand tonnes in 1951-52 to nearly 22.57
million tonnes in 2007-08 (Figure 1).
IIMA INDIA Research and Publications
W.P. No. 2009-07-01 Page No. 5
Figure 1: Trends in fertilizer production and consumption in India: 1951-52 to 2007-08
Source: FAI (2008)
The Indian Fertilizer industry, given its strategic importance in achieving self-sufficiency of
foodgrains production in the country, has for decades, been under government control. With
the objective of providing fertilizers to farmers at an affordable price and ensuring adequate
returns on investments to entrepreneurs, a fertilizer policy was envisaged of providing
fertilizers to farmers at subsidized prices to induce farmers to use fertilizer. In order to
achieve this objective, government introduced the Retention Price cum Subsidy scheme
(RPS), a cost-plus approach, for nitrogenous fertilizers in November 1977 and extended to
complex fertilizers in February 1979. Under RPS the retail price of fertilizers was fixed and
was uniform throughout the country and difference between the retention price (adjusted for
freight and dealer’s margin) and the price at which the fertilizers were sold to the farmer was
paid back to the manufacturer as subsidy. The RPS did achieve its objective of development
of large domestic industry and near self-sufficiency in fertilizer production and increased
IIMA INDIA Research and Publications
W.P. No. 2009-07-01 Page No. 6
consumption of chemical fertilizers but it had not been free from criticism of fostering
inefficiency leading to huge burden of subsidies.
The mounting burden of subsidies compelled the policy planners to make a serious attempt to
reform fertilizer price policy to rationalize the fertilizer subsidy. As part of economic reforms
initiated in early-90s, the government decontrolled the import of complex fertilizers such as
di-ammonium phosphate (DAP) and muriate of potash (MOP) in 1992, and extended a flat-
rate concession on these fertilizers. But, urea imports continue to be restricted and canalized.
Based on the recommendations of various committees including the High Powered Fertilizer
Pricing Policy Review Committee (HPC) and Expenditure Reforms Commission (ERC), a
New Pricing Scheme (NPS) for urea units was implemented in a phased manner from April
2003 with an objective to bring transparency, uniformity, and efficiency and reduce cost of
production. Similarly based on the recommendations of the Expert Group on P and K
fertilizers, policy for phosphatic and potassic fertilizers has been implemented. The main
objective of all policy interventions has been to contain and target fertilizer subsidies.
However, estimates of fertilizer subsidy as per Central government budgets over the years in
the post-reforms era show that fertilizer subsidy has increased significantly. Table 1 presents
the estimates of major subsidies including the food and fertilizer subsidies in the post-reforms
period (1991-92 to 2008-09). It is evident form the Table that total subsidies have increased
from Rs. 12158 crore in 1990-91 to Rs. 129243 crore in 2008-09, an increase by 10.6 times.
The fertilizer subsidy has increased from Rs. 4389 crore in 1990-91 to Rs. 75,849 crore in
2008-09 representing an increase of over 17 times. As a percentage of GDP, this represents
an increase from 0.85 percent in 1990-91 to 1.52 percent in 2008-09 (Figure 2). The fertilizer
subsidy in India as percentage of the GDP varied from 0.47 in 2002-03 to 1.52 percent in
2008-09. The total food subsidy has jumped to Rs. 43627 crore in 2008-09 from 2450 crores
in 1990-91, about 18-fold increase in less than two decades in absolute terms. But if one
looks at the percentage of GDP, then the burden of food subsidies in India is much less than
IIMA INDIA Research and Publications
W.P. No. 2009-07-01 Page No. 7
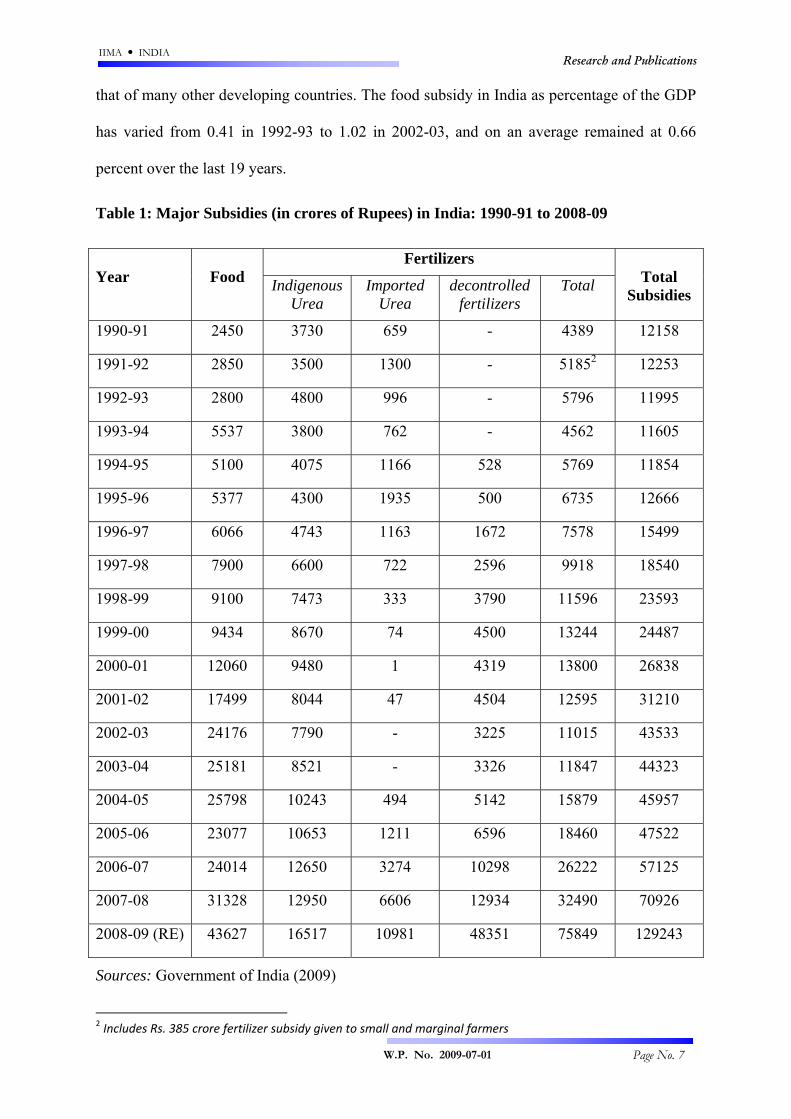
that of many other developing countries. The food subsidy in India as percentage of the GDP
has varied from 0.41 in 1992-93 to 1.02 in 2002-03, and on an average remained at 0.66
percent over the last 19 years.
Table 1: Major Subsidies (in crores of Rupees) in India: 1990-91 to 2008-09
Fertilizers Year
Food Indigenous
Urea Imported
Urea decontrolled
fertilizers Total
Total
Subsidies
1990-91 2450 3730 659 - 4389 12158
1991-92 2850 3500 1300 - 51852 12253
1992-93 2800 4800 996 - 5796 11995
1993-94 5537 3800 762 - 4562 11605
1994-95 5100 4075 1166 528 5769 11854
1995-96 5377 4300 1935 500 6735 12666
1996-97 6066 4743 1163 1672 7578 15499
1997-98 7900 6600 722 2596 9918 18540
1998-99 9100 7473 333 3790 11596 23593
1999-00 9434 8670 74 4500 13244 24487
2000-01 12060 9480 1 4319 13800 26838
2001-02 17499 8044 47 4504 12595 31210
2002-03 24176 7790 - 3225 11015 43533
2003-04 25181 8521 - 3326 11847 44323
2004-05 25798 10243 494 5142 15879 45957
2005-06 23077 10653 1211 6596 18460 47522
2006-07 24014 12650 3274 10298 26222 57125
2007-08 31328 12950 6606 12934 32490 70926
2008-09 (RE) 43627 16517 10981 48351 75849 129243
Sources: Government of India (2009)
2 Includes Rs. 385 crore fertilizer subsidy given to small and marginal farmers

IIMA INDIA Research and Publications
W.P. No. 2009-07-01 Page No. 8
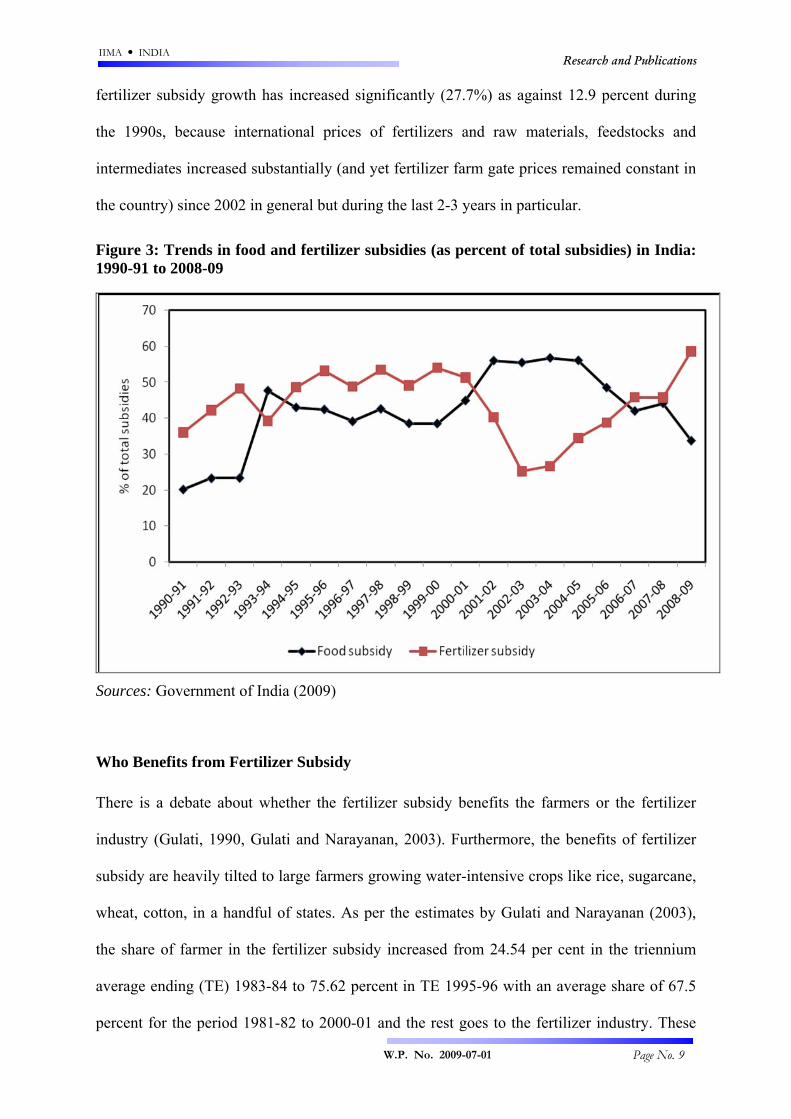
During the nineties (1990-91 to 2000-01), fertilizer subsidy accounted for about 47 percent of
the total subsidies and share of food subsidy was 35.1 percent (Figure 3). In the 2000s (2001-
02 to 2008-09), food subsidy became dominant, accounting for 49.1 percent of the total
subsidy while fertilizer subsidy accounted for 39.5 percent. However, during the last three
years, fertilizer subsidy has taken the largest share and accounted for 58.7 percent of total
subsidies in 2008-09.
Figure 2: Trends in food and fertilizer subsidies (as percent of GDP at current prices) in India: 1990-91 to 2008-09
Sources: Government of India (2009 & 2009a)
The above analysis shows that the volume of subsidies increased substantially during the
post-reforms period (1991-92 to 2008-09). The rate of increase, however, was higher for food
subsidy (compound annual growth rate of 16.9% per year) than for fertilizer (12.9%). The
rate of change in the amount of subsidies was uneven over time. Total subsidies and fertilizer
subsidy increased at a much faster rate during the 2000s while growth rate in food subsidies
was higher (16.9%) during the 1990s compared with 2000s (9.3%). During the 2000s,
IIMA INDIA Research and Publications
W.P. No. 2009-07-01 Page No. 9
fertilizer subsidy growth has increased significantly (27.7%) as against 12.9 percent during
the 1990s, because international prices of fertilizers and raw materials, feedstocks and
intermediates increased substantially (and yet fertilizer farm gate prices remained constant in
the country) since 2002 in general but during the last 2-3 years in particular.
Figure 3: Trends in food and fertilizer subsidies (as percent of total subsidies) in India: 1990-91 to 2008-09
Sources: Government of India (2009)
Who Benefits from Fertilizer Subsidy
There is a debate about whether the fertilizer subsidy benefits the farmers or the fertilizer
industry (Gulati, 1990, Gulati and Narayanan, 2003). Furthermore, the benefits of fertilizer
subsidy are heavily tilted to large farmers growing water-intensive crops like rice, sugarcane,
wheat, cotton, in a handful of states. As per the estimates by Gulati and Narayanan (2003),
the share of farmer in the fertilizer subsidy increased from 24.54 per cent in the triennium
average ending (TE) 1983-84 to 75.62 percent in TE 1995-96 with an average share of 67.5
percent for the period 1981-82 to 2000-01 and the rest goes to the fertilizer industry. These
IIMA INDIA Research and Publications
W.P. No. 2009-07-01 Page No. 10
estimates of share of fertilizer subsidy going to farmers and/or industry have been computed
by comparing subsidy estimates through import parity price and farm gate prices of fertilizers
with the amount of subsidy given in the Central Government budget. Some of the recent
policy announcements like the intention of the government to move to a system of direct
transfer of subsidy to the farmer are based on such findings which are based on unrealistic
assumptions. For example the study assumes that India’s entry into the world fertilizer market
as an importer would not affect world prices and world fertilizer markets are perfectly
competitive. However, both the assumptions are not valid and we discussed these
assumptions in greater details with empirical data in the following section.
World Fertilizer Market
First, when studying prices and price determination in any industry, one usually looks to a
body of economic theory called industrial organization and relevant empirical studies to help
provide answers. In perfect markets, prices will be determined by the forces of supply and
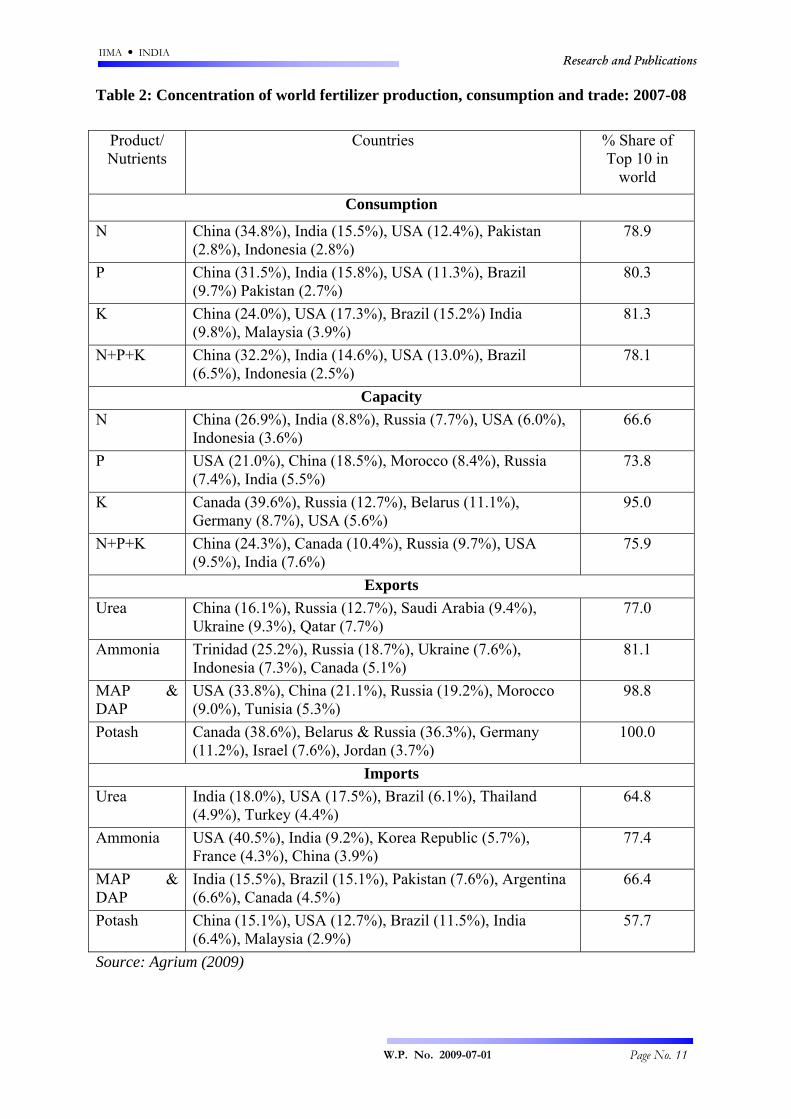
demand, but the international fertilizer market is not perfect market. Table 2 indicates the
level of concentration in the industry. The top five fertilizer consumers, namely, China, India,
USA, Brazil and Indonesia, accounted for nearly 70 percent of fertilizer consumption while
top five producers (China, Canada, Russia, USA and India) controlled about 60 percent of
world fertilizer production. Exports of potash and DAP and MAP are highly concentrated in
few countries and top six exporters (Canada, Belarus, Russia, Germany, Israel and Jordan)
control 97.4 percent of world exports in case of potash and 88.4 percent in MAP and DAP.
The share of top five urea exporters is 55 percent and in case of ammonia they control about
64 percent of world exports. Imports of fertilizer products are relatively diversified as top five
importers of urea account for about 51 percent of world imports while in case of MAP, DAP
and potash is nearly 50 percent. The results clearly show that world fertilizer market is
concentrated.
IIMA INDIA Research and Publications
W.P. No. 2009-07-01 Page No. 11
Table 2: Concentration of world fertilizer production, consumption and trade: 2007-08
Product/ Nutrients
Countries % Share of Top 10 in
world
Consumption
N China (34.8%), India (15.5%), USA (12.4%), Pakistan (2.8%), Indonesia (2.8%)
78.9
P China (31.5%), India (15.8%), USA (11.3%), Brazil (9.7%) Pakistan (2.7%)
80.3
K China (24.0%), USA (17.3%), Brazil (15.2%) India (9.8%), Malaysia (3.9%)
81.3
N+P+K China (32.2%), India (14.6%), USA (13.0%), Brazil (6.5%), Indonesia (2.5%)
78.1
Capacity N China (26.9%), India (8.8%), Russia (7.7%), USA (6.0%),
Indonesia (3.6%) 66.6
P USA (21.0%), China (18.5%), Morocco (8.4%), Russia (7.4%), India (5.5%)
73.8
K Canada (39.6%), Russia (12.7%), Belarus (11.1%), Germany (8.7%), USA (5.6%)
95.0
N+P+K China (24.3%), Canada (10.4%), Russia (9.7%), USA (9.5%), India (7.6%)
75.9
Exports Urea China (16.1%), Russia (12.7%), Saudi Arabia (9.4%),
Ukraine (9.3%), Qatar (7.7%) 77.0
Ammonia Trinidad (25.2%), Russia (18.7%), Ukraine (7.6%), Indonesia (7.3%), Canada (5.1%)
81.1
MAP & DAP
USA (33.8%), China (21.1%), Russia (19.2%), Morocco (9.0%), Tunisia (5.3%)
98.8
Potash Canada (38.6%), Belarus & Russia (36.3%), Germany (11.2%), Israel (7.6%), Jordan (3.7%)
100.0
Imports Urea India (18.0%), USA (17.5%), Brazil (6.1%), Thailand
(4.9%), Turkey (4.4%) 64.8
Ammonia USA (40.5%), India (9.2%), Korea Republic (5.7%), France (4.3%), China (3.9%)
77.4
MAP & DAP
India (15.5%), Brazil (15.1%), Pakistan (7.6%), Argentina (6.6%), Canada (4.5%)
66.4
Potash China (15.1%), USA (12.7%), Brazil (11.5%), India (6.4%), Malaysia (2.9%)
57.7
Source: Agrium (2009)
IIMA INDIA Research and Publications
W.P. No. 2009-07-01 Page No. 12
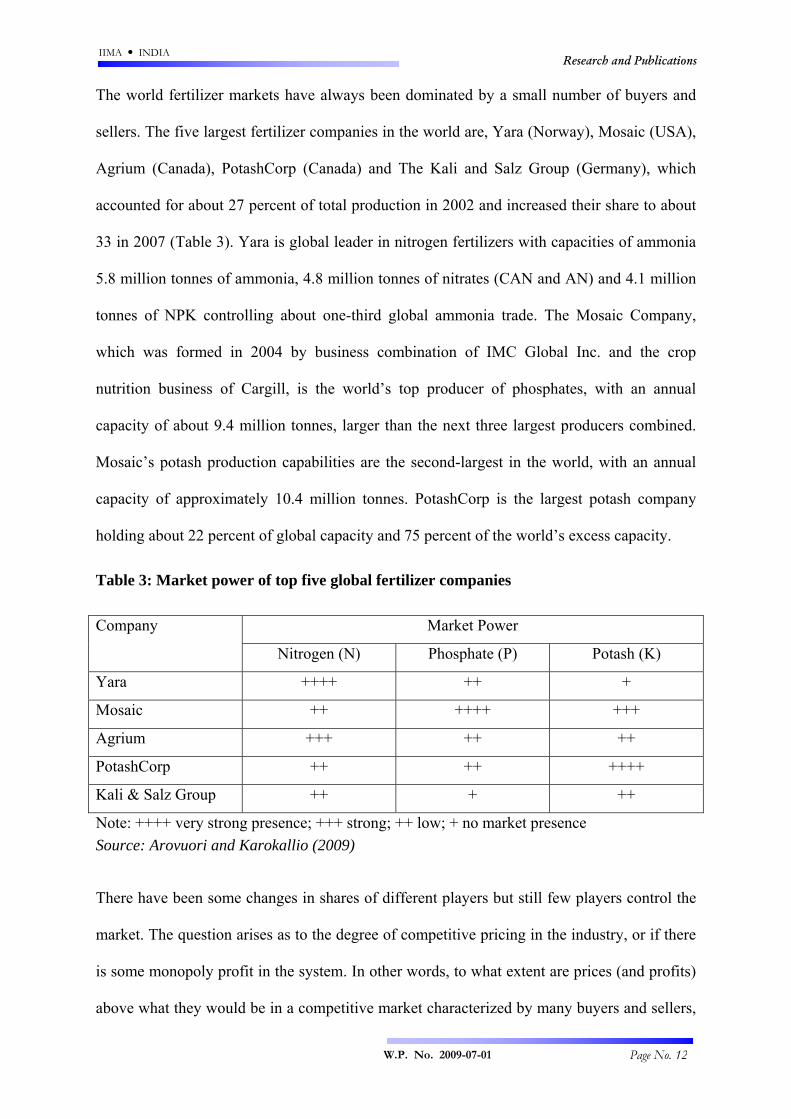
The world fertilizer markets have always been dominated by a small number of buyers and
sellers. The five largest fertilizer companies in the world are, Yara (Norway), Mosaic (USA),
Agrium (Canada), PotashCorp (Canada) and The Kali and Salz Group (Germany), which
accounted for about 27 percent of total production in 2002 and increased their share to about
33 in 2007 (Table 3). Yara is global leader in nitrogen fertilizers with capacities of ammonia
5.8 million tonnes of ammonia, 4.8 million tonnes of nitrates (CAN and AN) and 4.1 million
tonnes of NPK controlling about one-third global ammonia trade. The Mosaic Company,
which was formed in 2004 by business combination of IMC Global Inc. and the crop
nutrition business of Cargill, is the world’s top producer of phosphates, with an annual
capacity of about 9.4 million tonnes, larger than the next three largest producers combined.
Mosaic’s potash production capabilities are the second-largest in the world, with an annual
capacity of approximately 10.4 million tonnes. PotashCorp is the largest potash company
holding about 22 percent of global capacity and 75 percent of the world’s excess capacity.
Table 3: Market power of top five global fertilizer companies
Market Power Company
Nitrogen (N) Phosphate (P) Potash (K)
Yara ++++ ++ +
Mosaic ++ ++++ +++
Agrium +++ ++ ++
PotashCorp ++ ++ ++++
Kali & Salz Group ++ + ++
Note: ++++ very strong presence; +++ strong; ++ low; + no market presence Source: Arovuori and Karokallio (2009)
There have been some changes in shares of different players but still few players control the
market. The question arises as to the degree of competitive pricing in the industry, or if there
is some monopoly profit in the system. In other words, to what extent are prices (and profits)
above what they would be in a competitive market characterized by many buyers and sellers,
IIMA INDIA Research and Publications
W.P. No. 2009-07-01 Page No. 13
where prices are determined by forces of supply and demand, and industry profits are
"normal". Apart from the level of prices in the industry, there is also the question of spatial
prices, which is important in the fertilizer industry because farmers constitute a
geographically dispersed market. Fertilizer prices can be extremely variable, and this raises
the question of what price dynamics are at work that results in such price variability.
Fertilizer demand is a derived demand, which in the developed countries is price inelastic
while in developing country markets, demand is price elastic, such as in major markets like
China and India.
World Fertilizer Prices
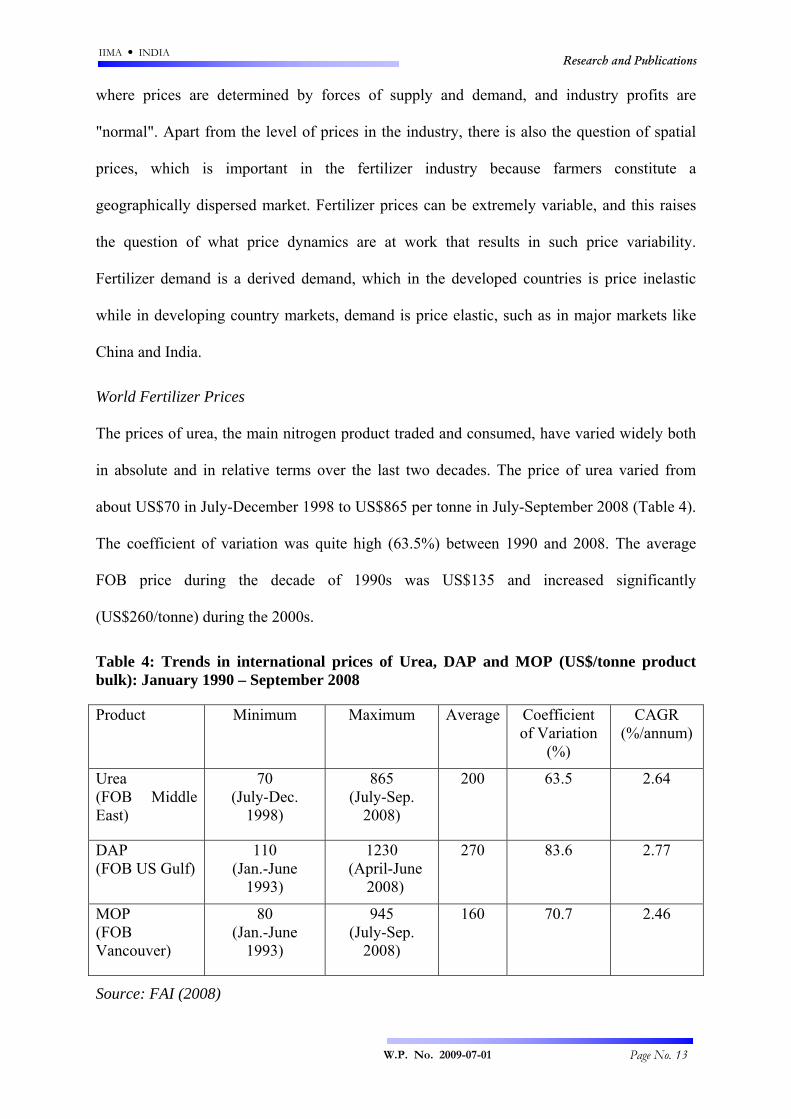
The prices of urea, the main nitrogen product traded and consumed, have varied widely both
in absolute and in relative terms over the last two decades. The price of urea varied from
about US$70 in July-December 1998 to US$865 per tonne in July-September 2008 (Table 4).
The coefficient of variation was quite high (63.5%) between 1990 and 2008. The average
FOB price during the decade of 1990s was US$135 and increased significantly
(US$260/tonne) during the 2000s.
Table 4: Trends in international prices of Urea, DAP and MOP (US$/tonne product bulk): January 1990 – September 2008
Product Minimum Maximum Average Coefficient of Variation
(%)
CAGR (%/annum)
Urea (FOB Middle East)
70 (July-Dec.
1998)
865 (July-Sep.
2008)
200 63.5 2.64
DAP (FOB US Gulf)
110 (Jan.-June
1993)
1230 (April-June
2008)
270 83.6 2.77
MOP (FOB Vancouver)
80 (Jan.-June
1993)
945 (July-Sep.
2008)
160 70.7 2.46
Source: FAI (2008)

IIMA INDIA Research and Publications
W.P. No. 2009-07-01 Page No. 14
The price of DAP varied from about US$110 in January-June 1993 to US$1230 per tonne in
April-June 2008. The prices of DAP are the most volatile among three major products,
namely Urea, DAP and MOP. The average FOB price during the decade of 1990s was
US$177 and increased significantly (US$422/tonne) during the 2000s, an increase of 238
percent.
The prices of MOP varied from US$80 per tonne to US$945 per tonne between 1991 and
2008. The price of muriate of potash (MOP), the most common source of potassium, rose
from about US$175 per tonne in 2006 to US$280 per tonne in 2007 and by December 2008,
MOP was sold for US$870 per tonne, an increase of about 400 percent. The above
discussion clearly shows that fertilizer markets are highly concentrated and prices of fertilizer
products show a wide variability.
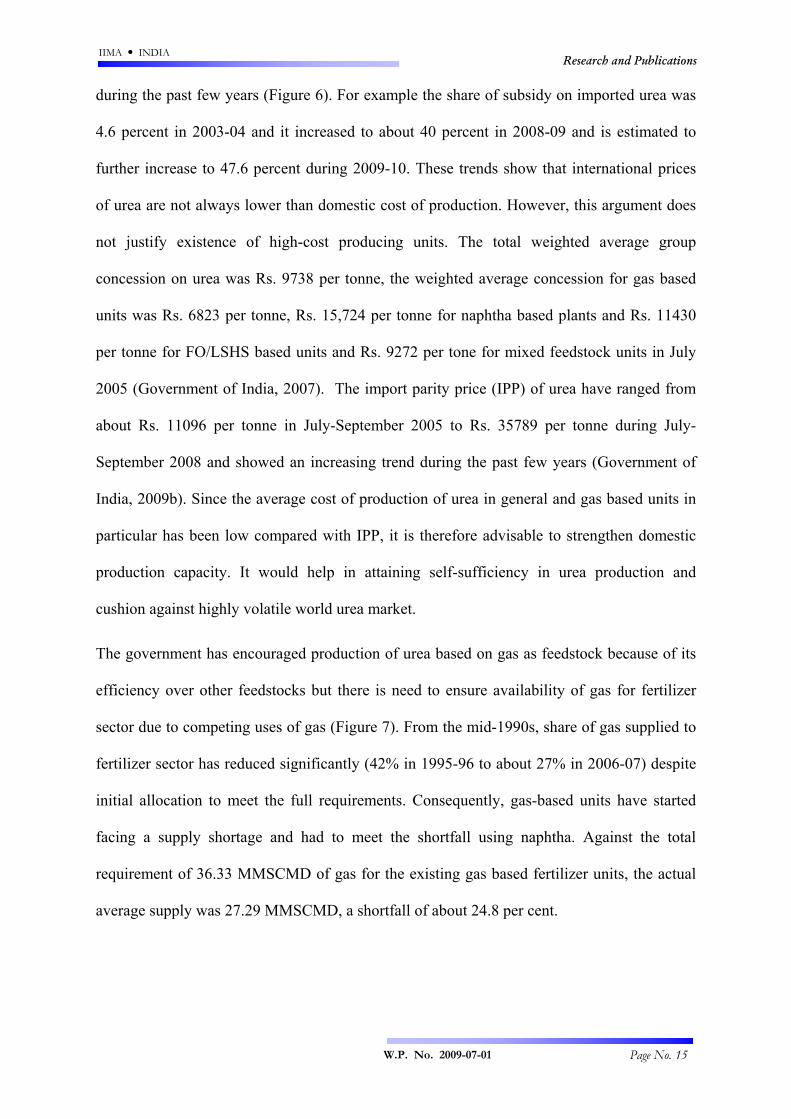
India’s Position in World Markets
India is one of the largest producer as well as consumer of fertilizers in the world and entry of
India in world markets as an importer influences world prices significantly (Figure 4). Strong
positive association exists between world price of urea and imports of urea by India.
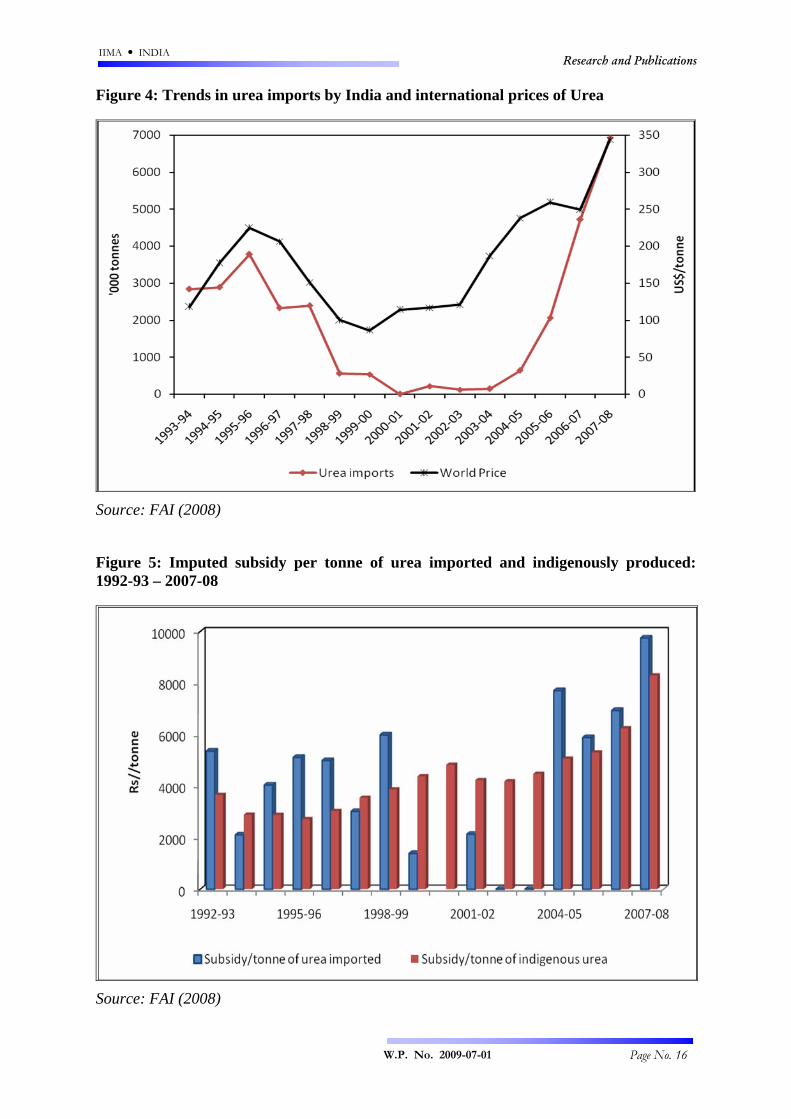
It has also been argued several times that domestic urea industry is a high-cost producing
industry, therefore, import substitution strategy could be thought about. However, we need to
keep in mind the nature, structure and conduct of urea industry. In order to look at the cost
structure of imported urea vs. domestically produced urea, we computed per unit subsidy on
imported and indigenously produced product (by dividing the total subsidy on indigenous
urea by total production and total subsidy on imported urea by total imports) and the results
are presented in Figure 5.
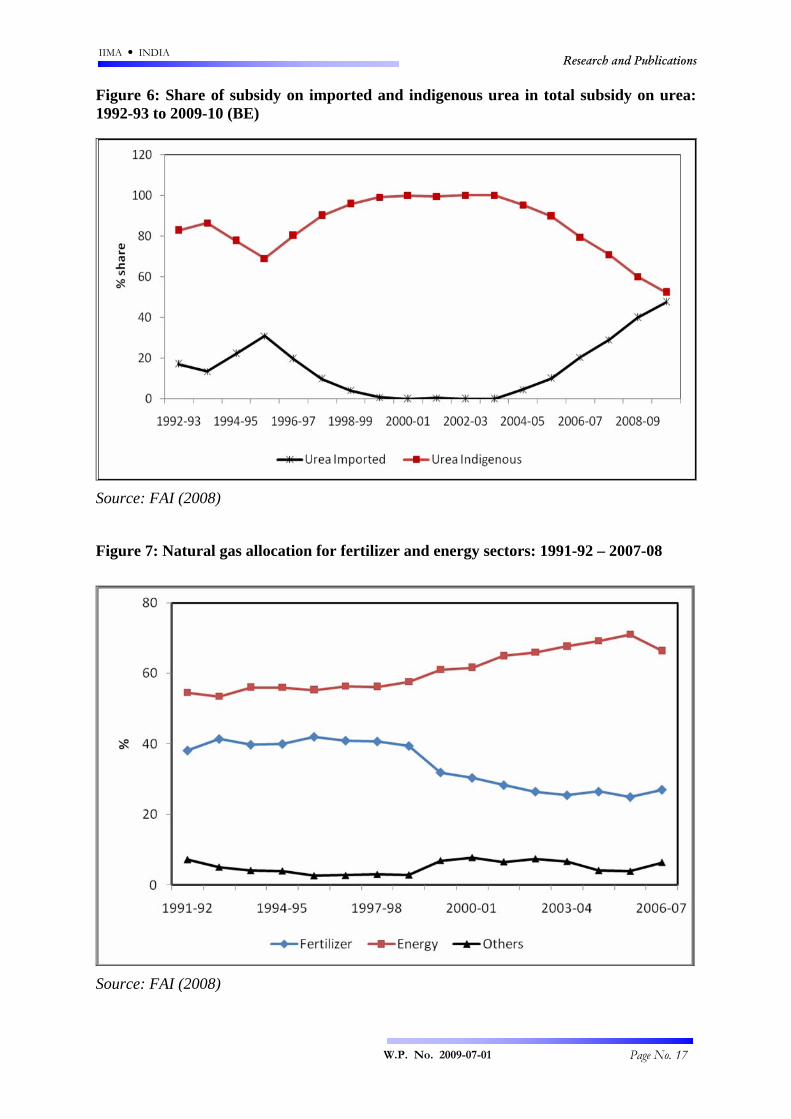
As is evident from the Figure out of 13 years between 1992-93 and 2007-08 when urea was
imported, nine years average subsidy on imported urea was higher than indigenously
produced urea. Likewise, share of subsidy on imported urea has also increased significantly
IIMA INDIA Research and Publications
W.P. No. 2009-07-01 Page No. 15
during the past few years (Figure 6). For example the share of subsidy on imported urea was
4.6 percent in 2003-04 and it increased to about 40 percent in 2008-09 and is estimated to
further increase to 47.6 percent during 2009-10. These trends show that international prices
of urea are not always lower than domestic cost of production. However, this argument does
not justify existence of high-cost producing units. The total weighted average group
concession on urea was Rs. 9738 per tonne, the weighted average concession for gas based
units was Rs. 6823 per tonne, Rs. 15,724 per tonne for naphtha based plants and Rs. 11430
per tonne for FO/LSHS based units and Rs. 9272 per tone for mixed feedstock units in July
2005 (Government of India, 2007). The import parity price (IPP) of urea have ranged from
about Rs. 11096 per tonne in July-September 2005 to Rs. 35789 per tonne during July-
September 2008 and showed an increasing trend during the past few years (Government of
India, 2009b). Since the average cost of production of urea in general and gas based units in
particular has been low compared with IPP, it is therefore advisable to strengthen domestic
production capacity. It would help in attaining self-sufficiency in urea production and
cushion against highly volatile world urea market.
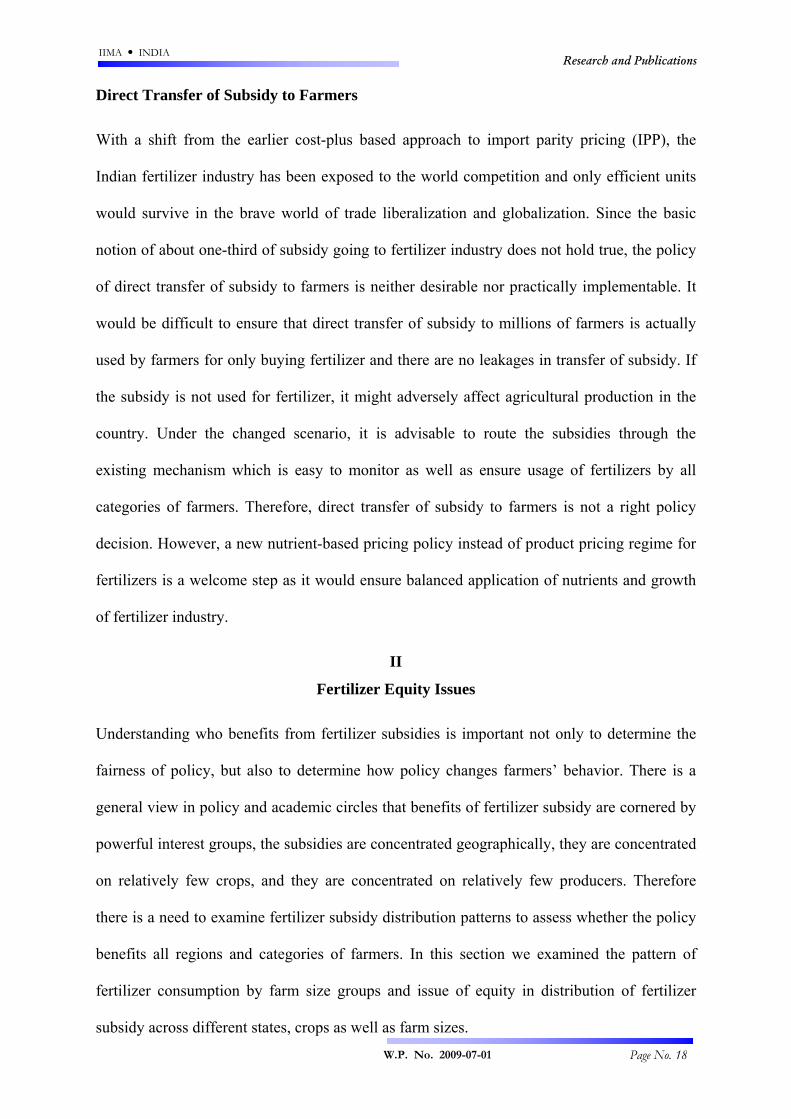
The government has encouraged production of urea based on gas as feedstock because of its
efficiency over other feedstocks but there is need to ensure availability of gas for fertilizer
sector due to competing uses of gas (Figure 7). From the mid-1990s, share of gas supplied to
fertilizer sector has reduced significantly (42% in 1995-96 to about 27% in 2006-07) despite
initial allocation to meet the full requirements. Consequently, gas-based units have started
facing a supply shortage and had to meet the shortfall using naphtha. Against the total
requirement of 36.33 MMSCMD of gas for the existing gas based fertilizer units, the actual
average supply was 27.29 MMSCMD, a shortfall of about 24.8 per cent.
IIMA INDIA Research and Publications
W.P. No. 2009-07-01 Page No. 16
Figure 4: Trends in urea imports by India and international prices of Urea
Source: FAI (2008)
Figure 5: Imputed subsidy per tonne of urea imported and indigenously produced: 1992-93 – 2007-08
Source: FAI (2008)
IIMA INDIA Research and Publications
W.P. No. 2009-07-01 Page No. 17
Figure 6: Share of subsidy on imported and indigenous urea in total subsidy on urea: 1992-93 to 2009-10 (BE)
Source: FAI (2008)
Figure 7: Natural gas allocation for fertilizer and energy sectors: 1991-92 – 2007-08
Source: FAI (2008)
IIMA INDIA Research and Publications
W.P. No. 2009-07-01 Page No. 18
Direct Transfer of Subsidy to Farmers
With a shift from the earlier cost-plus based approach to import parity pricing (IPP), the
Indian fertilizer industry has been exposed to the world competition and only efficient units
would survive in the brave world of trade liberalization and globalization. Since the basic
notion of about one-third of subsidy going to fertilizer industry does not hold true, the policy
of direct transfer of subsidy to farmers is neither desirable nor practically implementable. It
would be difficult to ensure that direct transfer of subsidy to millions of farmers is actually
used by farmers for only buying fertilizer and there are no leakages in transfer of subsidy. If
the subsidy is not used for fertilizer, it might adversely affect agricultural production in the
country. Under the changed scenario, it is advisable to route the subsidies through the
existing mechanism which is easy to monitor as well as ensure usage of fertilizers by all
categories of farmers. Therefore, direct transfer of subsidy to farmers is not a right policy
decision. However, a new nutrient-based pricing policy instead of product pricing regime for
fertilizers is a welcome step as it would ensure balanced application of nutrients and growth
of fertilizer industry.
II
Fertilizer Equity Issues
Understanding who benefits from fertilizer subsidies is important not only to determine the
fairness of policy, but also to determine how policy changes farmers’ behavior. There is a
general view in policy and academic circles that benefits of fertilizer subsidy are cornered by
powerful interest groups, the subsidies are concentrated geographically, they are concentrated
on relatively few crops, and they are concentrated on relatively few producers. Therefore
there is a need to examine fertilizer subsidy distribution patterns to assess whether the policy
benefits all regions and categories of farmers. In this section we examined the pattern of
fertilizer consumption by farm size groups and issue of equity in distribution of fertilizer
subsidy across different states, crops as well as farm sizes.
IIMA INDIA Research and Publications
W.P. No. 2009-07-01 Page No. 19
Pattern of Fertilizer Consumption by Farm Size
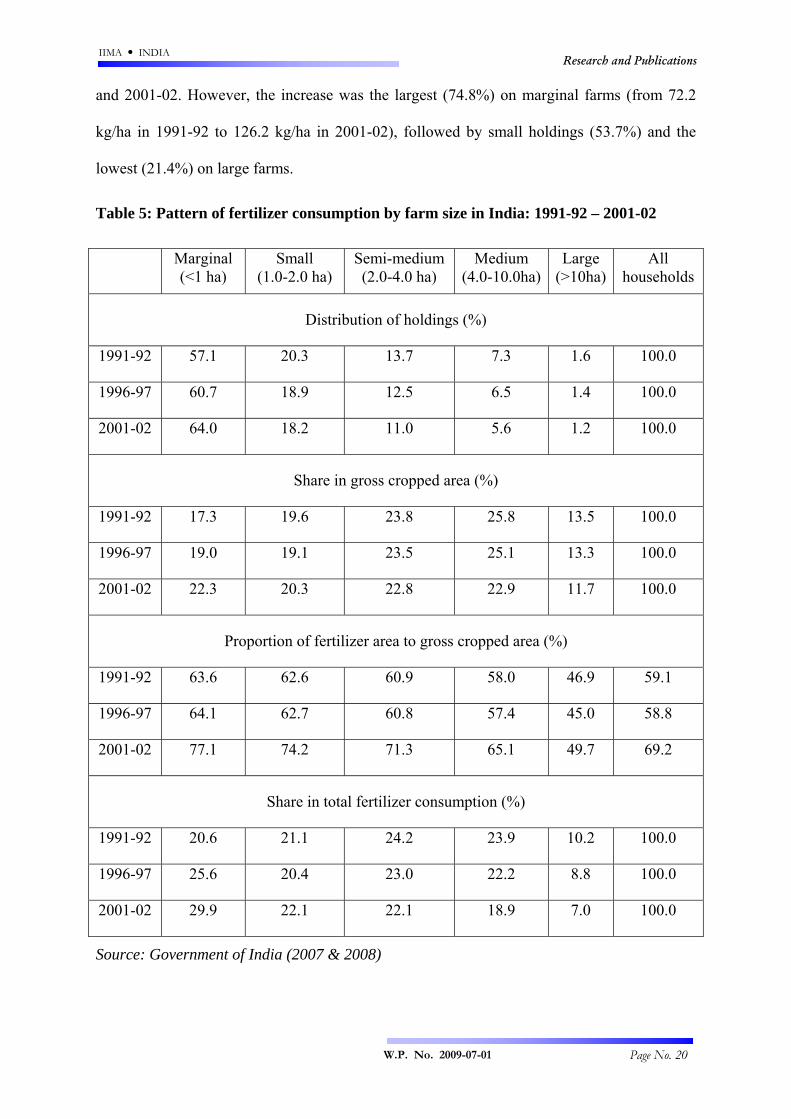
Table 5 shows farm size wise consumption of fertilizers in India in 1991-92, 1996-97 and
2001-02. As is evident from the Table, the share of small and marginal farmers in total
operational holdings increased from 77.4 percent in 1991-92 to 82.2 percent in 2001-02 while
the share of large holdings declined marginally from 1.6 percent to 1.2 percent. Medium and
large holdings (with holding size of more than 4 ha) with a share of 6.8 percent used just over
one-fourth of total fertilizer consumed in the country in 2001-02. In contrast, the small and
marginal farmers, which constituted about 82 percent of total holdings, consumed 52 percent
of total fertilizers. The share of small and marginal farmers in total operational holdings
increased by 4.8 percent between 1991-92 and 2001-02 but their share in total fertilizer use
increased by over 10 percent. However, if we compared the relative shares of different farm
size groups in total operational area and fertilizer use, the scenario is completely changed. In
2001-02, small and marginal farmers accounted for 42.6 percent of area operated but
accounted for 52 percent of total fertilizer consumption in the country. On the other hand
medium and large farmers, which accounted for over one-third of operational area, consumed
25.9 percent of total fertilizer used in the country in 2001-02.
In 2001-02, over 77 percent of the gross cropped area was fertilized on marginal holdings
while nearly 50 percent of the area was fertilized on large farms. An inverse relationship
between farm size and proportion of fertilized area to gross cropped area was witnessed
during all the years.
The intensity of fertilizer use was significantly higher on small and marginal farms compared
to large farms (Table 6). The average fertilizer consumption per hectare of gross cropped area
was the highest (126.2 kg) on marginal holdings and the lowest on large farms (55.9 kg) in
2001-02. Similar trend was observed during 1991-92 and 1995-96. Moreover there has been a
significant increase in fertilizer intensity on all farm size holdings during the period 1991-92
IIMA INDIA Research and Publications
W.P. No. 2009-07-01 Page No. 20
and 2001-02. However, the increase was the largest (74.8%) on marginal farms (from 72.2
kg/ha in 1991-92 to 126.2 kg/ha in 2001-02), followed by small holdings (53.7%) and the
lowest (21.4%) on large farms.
Table 5: Pattern of fertilizer consumption by farm size in India: 1991-92 – 2001-02
Marginal (<1 ha)
Small (1.0-2.0 ha)
Semi-medium (2.0-4.0 ha)
Medium (4.0-10.0ha)
Large (>10ha)
All households
Distribution of holdings (%)
1991-92 57.1 20.3 13.7 7.3 1.6 100.0
1996-97 60.7 18.9 12.5 6.5 1.4 100.0
2001-02 64.0 18.2 11.0 5.6 1.2 100.0
Share in gross cropped area (%)
1991-92 17.3 19.6 23.8 25.8 13.5 100.0
1996-97 19.0 19.1 23.5 25.1 13.3 100.0
2001-02 22.3 20.3 22.8 22.9 11.7 100.0
Proportion of fertilizer area to gross cropped area (%)
1991-92 63.6 62.6 60.9 58.0 46.9 59.1
1996-97 64.1 62.7 60.8 57.4 45.0 58.8
2001-02 77.1 74.2 71.3 65.1 49.7 69.2
Share in total fertilizer consumption (%)
1991-92 20.6 21.1 24.2 23.9 10.2 100.0
1996-97 25.6 20.4 23.0 22.2 8.8 100.0
2001-02 29.9 22.1 22.1 18.9 7.0 100.0
Source: Government of India (2007 & 2008)
IIMA INDIA Research and Publications
W.P. No. 2009-07-01 Page No. 21
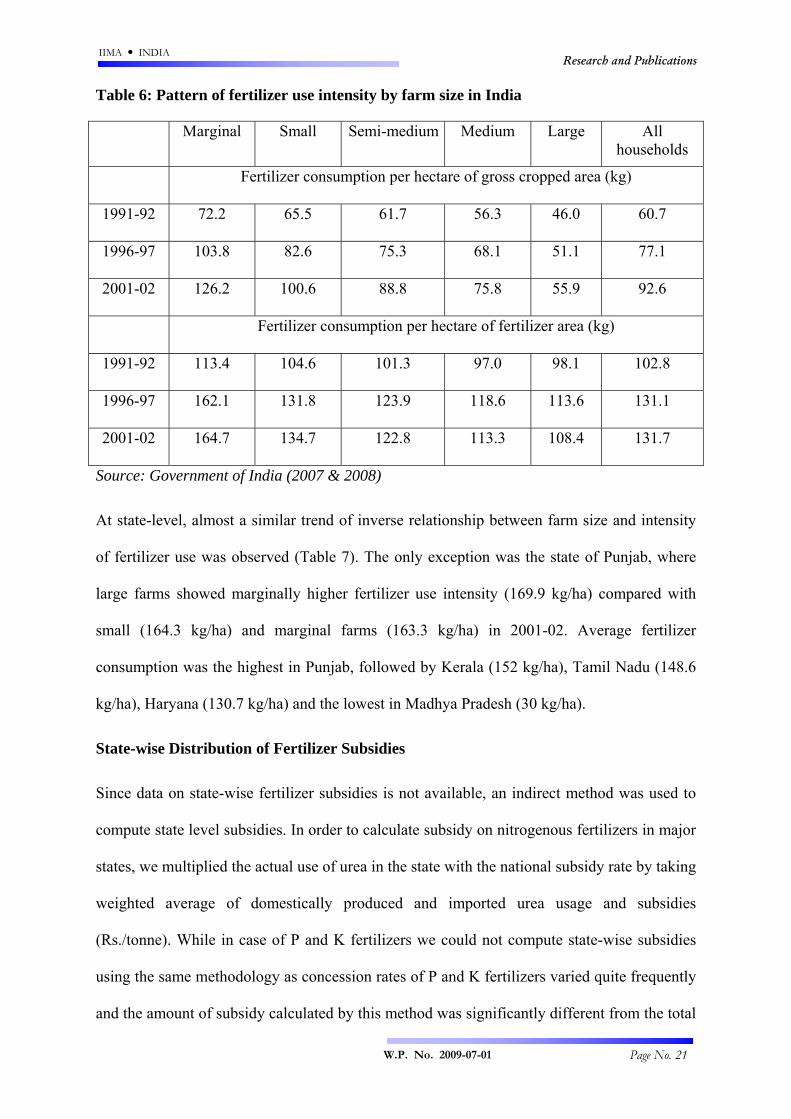
Table 6: Pattern of fertilizer use intensity by farm size in India
Marginal Small Semi-medium Medium Large All households
Fertilizer consumption per hectare of gross cropped area (kg)
1991-92 72.2 65.5 61.7 56.3 46.0 60.7
1996-97 103.8 82.6 75.3 68.1 51.1 77.1
2001-02 126.2 100.6 88.8 75.8 55.9 92.6
Fertilizer consumption per hectare of fertilizer area (kg)
1991-92 113.4 104.6 101.3 97.0 98.1 102.8
1996-97 162.1 131.8 123.9 118.6 113.6 131.1
2001-02 164.7 134.7 122.8 113.3 108.4 131.7
Source: Government of India (2007 & 2008)
At state-level, almost a similar trend of inverse relationship between farm size and intensity
of fertilizer use was observed (Table 7). The only exception was the state of Punjab, where
large farms showed marginally higher fertilizer use intensity (169.9 kg/ha) compared with
small (164.3 kg/ha) and marginal farms (163.3 kg/ha) in 2001-02. Average fertilizer
consumption was the highest in Punjab, followed by Kerala (152 kg/ha), Tamil Nadu (148.6
kg/ha), Haryana (130.7 kg/ha) and the lowest in Madhya Pradesh (30 kg/ha).
State-wise Distribution of Fertilizer Subsidies
Since data on state-wise fertilizer subsidies is not available, an indirect method was used to
compute state level subsidies. In order to calculate subsidy on nitrogenous fertilizers in major
states, we multiplied the actual use of urea in the state with the national subsidy rate by taking
weighted average of domestically produced and imported urea usage and subsidies
(Rs./tonne). While in case of P and K fertilizers we could not compute state-wise subsidies
using the same methodology as concession rates of P and K fertilizers varied quite frequently
and the amount of subsidy calculated by this method was significantly different from the total
IIMA INDIA Research and Publications
W.P. No. 2009-07-01 Page No. 22
concession on P and K fertilizers reported in the budget. Hence, we first computed per unit
fertilizer subsidy on decontrolled P and K fertilizers by dividing total concession paid on
these fertilizers by total consumption of P and K fertilizers in the concerned year and
multiplying it with total P and K consumption in the concerned state. In this case our
assumption is that fertilizer subsidy is distributed in proportion to fertilizer used. The results
are presented in Table 8.
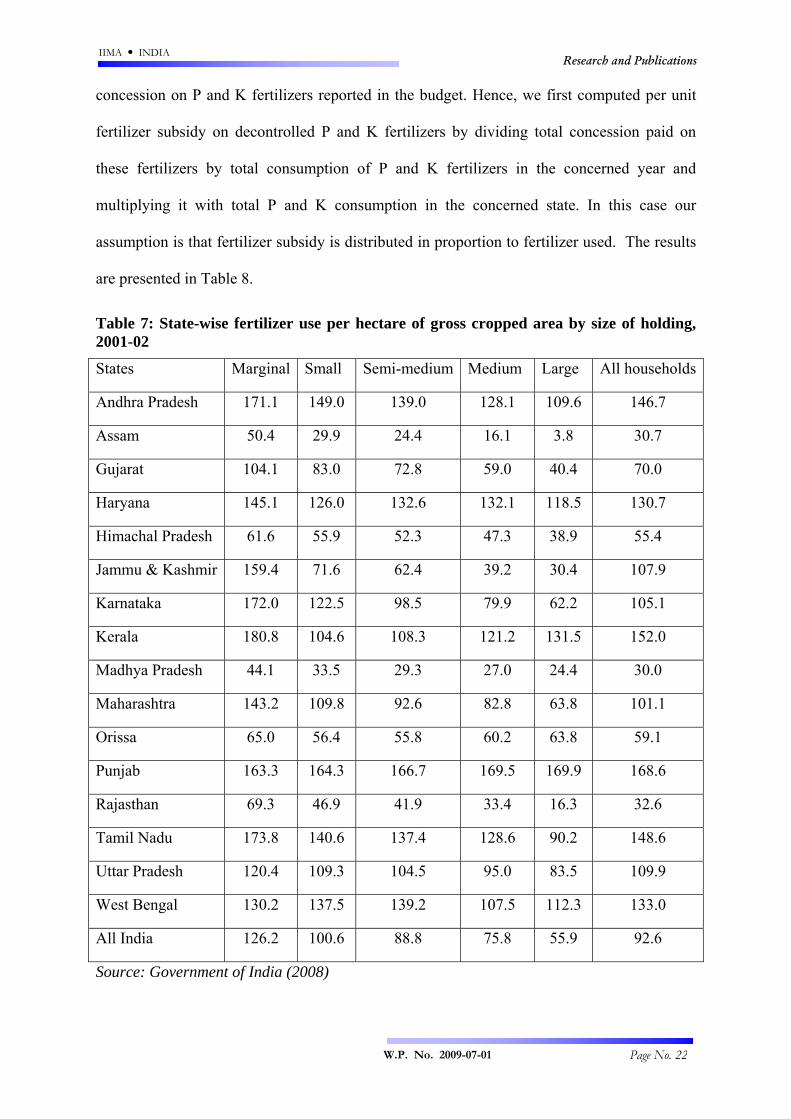
Table 7: State-wise fertilizer use per hectare of gross cropped area by size of holding, 2001-02
States Marginal Small Semi-medium Medium Large All households
Andhra Pradesh 171.1 149.0 139.0 128.1 109.6 146.7
Assam 50.4 29.9 24.4 16.1 3.8 30.7
Gujarat 104.1 83.0 72.8 59.0 40.4 70.0
Haryana 145.1 126.0 132.6 132.1 118.5 130.7
Himachal Pradesh 61.6 55.9 52.3 47.3 38.9 55.4
Jammu & Kashmir 159.4 71.6 62.4 39.2 30.4 107.9
Karnataka 172.0 122.5 98.5 79.9 62.2 105.1
Kerala 180.8 104.6 108.3 121.2 131.5 152.0
Madhya Pradesh 44.1 33.5 29.3 27.0 24.4 30.0
Maharashtra 143.2 109.8 92.6 82.8 63.8 101.1
Orissa 65.0 56.4 55.8 60.2 63.8 59.1
Punjab 163.3 164.3 166.7 169.5 169.9 168.6
Rajasthan 69.3 46.9 41.9 33.4 16.3 32.6
Tamil Nadu 173.8 140.6 137.4 128.6 90.2 148.6
Uttar Pradesh 120.4 109.3 104.5 95.0 83.5 109.9
West Bengal 130.2 137.5 139.2 107.5 112.3 133.0
All India 126.2 100.6 88.8 75.8 55.9 92.6
Source: Government of India (2008)
IIMA INDIA Research and Publications
W.P. No. 2009-07-01 Page No. 23
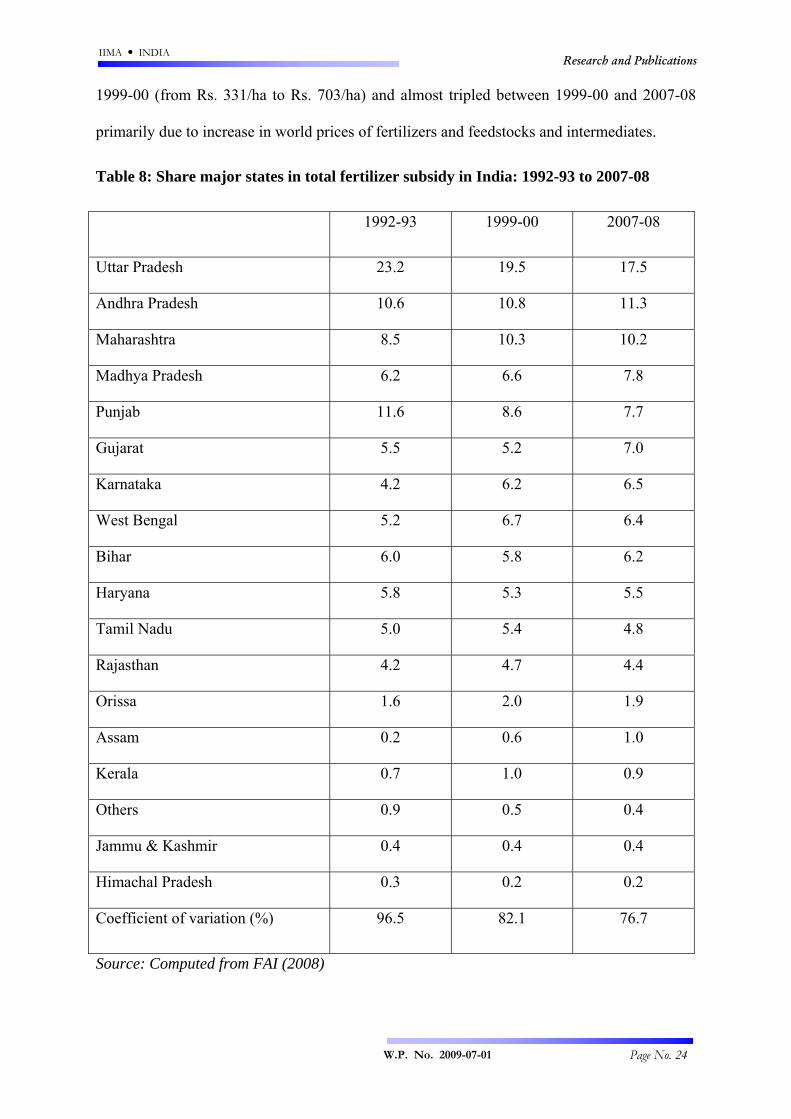
As Table shows, more than half of total fertilizer subsidy is cornered by top five states,
namely, Uttar Pradesh, Andhra Pradesh, Maharashtra, Madhya Pradesh and Punjab. Most of
these states grow fertilizer-intensive crops such as rice, wheat, cotton and sugarcane. The
share of these five states in 1992-93 was about 60 percent, which declined to 55.8 percent in
1999-00 and further to 54.5 percent in 2007-08. Other major beneficiary states were Gujarat,
Karnataka, West Bengal, Bihar Haryana and Tamil Nadu. Their share in total subsidy has
increased from 31.7 percent in 1992-93 to 36.4 percent in 2007-08. The share of less
developed states like Rajasthan, Orissa, Assam, Jammu and Kashmir and Himachal Pradesh
was low and they accounted for only 6.7 percent of total subsidy in 1992-93, which increased
to about 7.9 percent in 1999-00 and was the same in 2007-08. The share of major fertilizer
consuming states like Uttar Pradesh, Punjab, Haryana and Tamil Nadu has declined during
the last one and half decade, while the share of agriculturally less developed states like
Madhya Pradesh, Gujarat, Bihar, Rajasthan and Orissa has increased.
Looking at absolute shares of states in total fertilizer subsidy in not a good indicator because
there are large variations in total cropped area among various states. Therefore, it would be
appropriate to examine inter-state equity in terms of average subsidy per hectare of cropped
area. Punjab, Andhra Pradesh, Haryana, Tamil Nadu, West Bengal and Uttar Pradesh are the
main beneficiaries of fertilizer subsidy on per hectare basis (Table 9). In these states, fertilizer
consumption per hectare is significantly higher than the national average. Out of 17 states
included in the present analysis, 10 states had less than national average during 1992-93 and
1999-00 and this number fell to 8 in 2007-08. States like Maharashtra, Jammu & Kashmir,
Kerala, Madhya Pradesh, Assam, Himachal Pradesh, Orissa and Rajasthan had less than
national average subsidy (Rs. 2083/ha) in 2007-08. The per hectare subsidy in Punjab (Rs.
3924) was more than four times compared with states like Orissa (Rs. 824) and Rajasthan
(Rs. 894). The average subsidy on per hectare basis more than doubled between 1992-93 and
IIMA INDIA Research and Publications
W.P. No. 2009-07-01 Page No. 24
1999-00 (from Rs. 331/ha to Rs. 703/ha) and almost tripled between 1999-00 and 2007-08
primarily due to increase in world prices of fertilizers and feedstocks and intermediates.
Table 8: Share major states in total fertilizer subsidy in India: 1992-93 to 2007-08
1992-93 1999-00 2007-08
Uttar Pradesh 23.2 19.5 17.5
Andhra Pradesh 10.6 10.8 11.3
Maharashtra 8.5 10.3 10.2
Madhya Pradesh 6.2 6.6 7.8
Punjab 11.6 8.6 7.7
Gujarat 5.5 5.2 7.0
Karnataka 4.2 6.2 6.5
West Bengal 5.2 6.7 6.4
Bihar 6.0 5.8 6.2
Haryana 5.8 5.3 5.5
Tamil Nadu 5.0 5.4 4.8
Rajasthan 4.2 4.7 4.4
Orissa 1.6 2.0 1.9
Assam 0.2 0.6 1.0
Kerala 0.7 1.0 0.9
Others 0.9 0.5 0.4
Jammu & Kashmir 0.4 0.4 0.4
Himachal Pradesh 0.3 0.2 0.2
Coefficient of variation (%) 96.5 82.1 76.7
Source: Computed from FAI (2008)

IIMA INDIA Research and Publications
W.P. No. 2009-07-01 Page No. 25
Table 9: State-wise trends in intensity of fertilizer subsidy (Rs./ha. of gross cropped area)
States 1992-93 1999-00 2007-08
Punjab 946 1454 3924
Andhra Pradesh 512 1096 3561
Haryana 607 1164 3476
Tamil Nadu 430 1104 3307
West Bengal 373 931 2660
Uttar Pradesh 553 981 2617
Bihar 394 774 2432
Gujarat 304 651 2301
Karnataka 207 682 2107
Maharashtra 247 637 1829
Jammu & Kashmir 242 457 1264
Kerala 150 455 1235
Madhya Pradesh 159 334 1213
Assam 35 206 1143
Himachal Pradesh 170 277 958
Orissa 102 314 894
Rajasthan 129 322 824
India 331 703 2083
Coefficient of Variation (%) 79.3 57.1 51.9
Source: Computed from FAI (2008)
The above discussion reveals that there is a high degree of concentration of fertilizer
subsidies in few states but overtime the inequalities in distribution of subsidy among states
have declined sharply. The coefficient of variation in the share of states in total fertilizer
subsidy has declined from 96.5 percent in 1992-93 to 82.1 percent in 1999-00 and further to
76.7 percent in 2007-08. The coefficient of variation in per hectare fertilizer subsidy at state
level is substantially lower and has declined more sharply from 79.3 percent in 1992-93 to
51.9 percent in 2007-08. This has happened due to improvement in rural infrastructure,
irrigation facilities, coverage of area under high yielding variety seeds, easy access to
IIMA INDIA Research and Publications
W.P. No. 2009-07-01 Page No. 26
fertilizers, affordable prices, and shift in crop pattern towards fertilizer intensive crops in
some of these less developed states during the last decade. The benefits of fertilizer subsidy
are not restricted to only resource-rich states but have spread to other states.
Irrigated vs. Unirrigated Areas
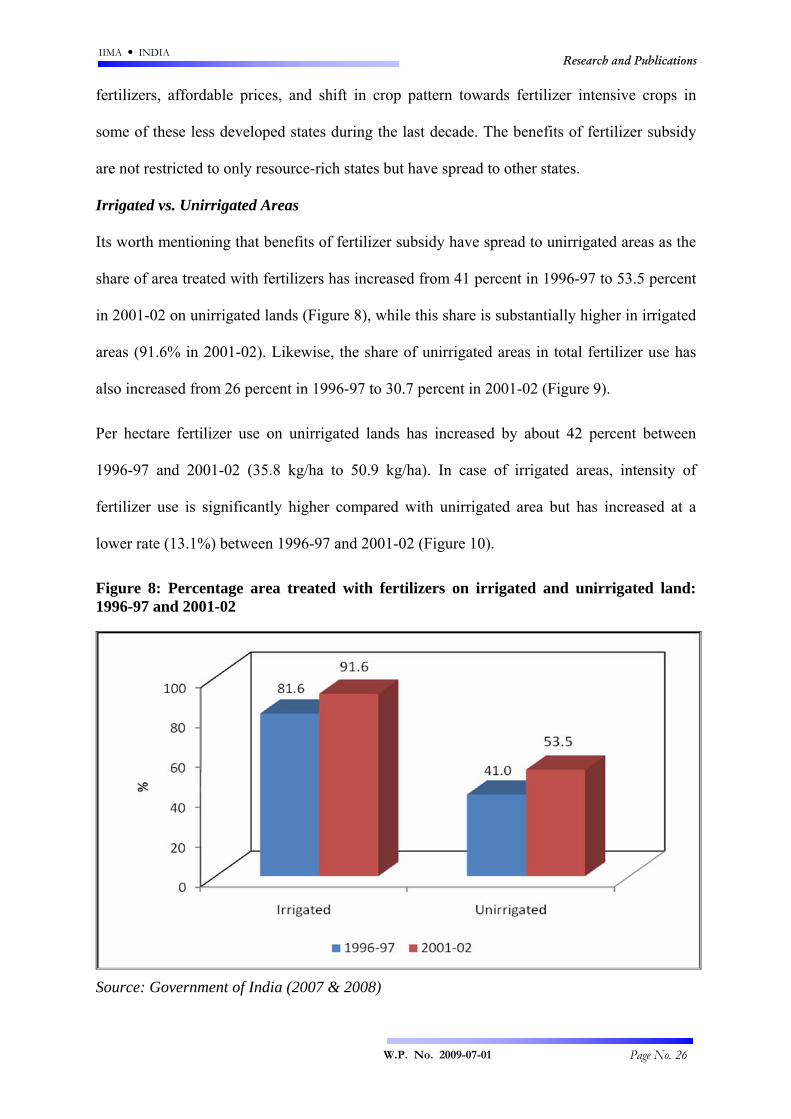
Its worth mentioning that benefits of fertilizer subsidy have spread to unirrigated areas as the
share of area treated with fertilizers has increased from 41 percent in 1996-97 to 53.5 percent
in 2001-02 on unirrigated lands (Figure 8), while this share is substantially higher in irrigated
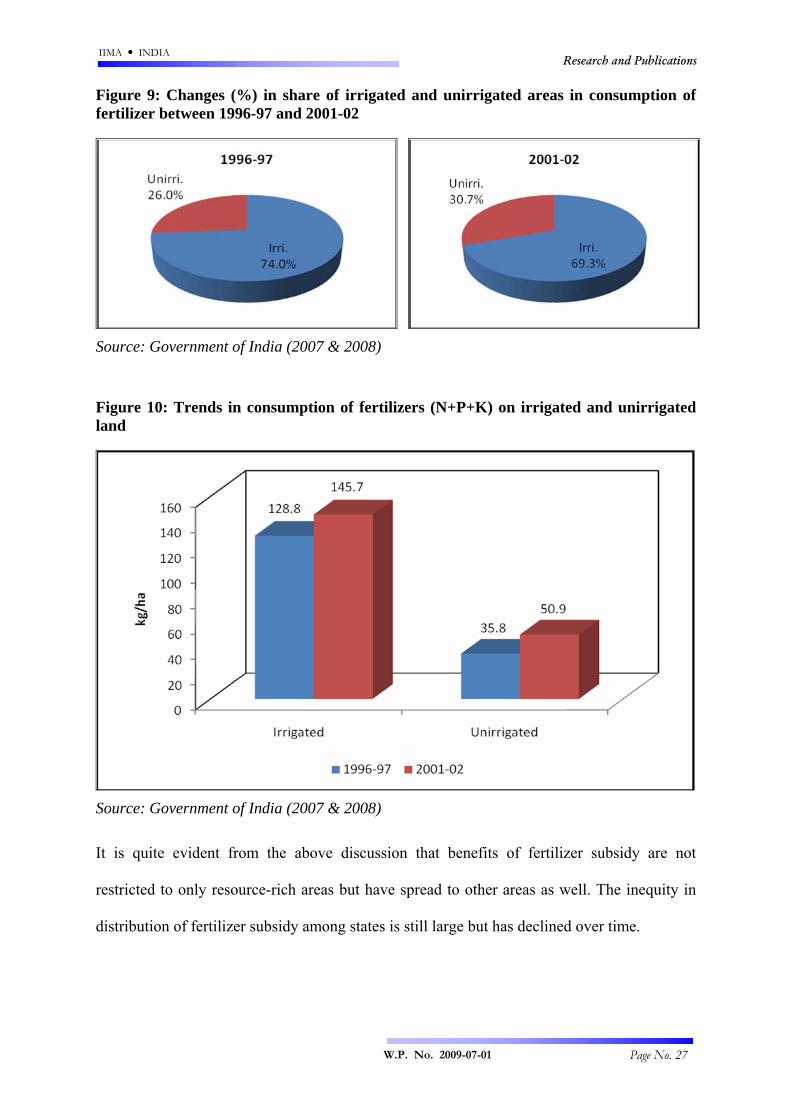
areas (91.6% in 2001-02). Likewise, the share of unirrigated areas in total fertilizer use has
also increased from 26 percent in 1996-97 to 30.7 percent in 2001-02 (Figure 9).
Per hectare fertilizer use on unirrigated lands has increased by about 42 percent between
1996-97 and 2001-02 (35.8 kg/ha to 50.9 kg/ha). In case of irrigated areas, intensity of
fertilizer use is significantly higher compared with unirrigated area but has increased at a
lower rate (13.1%) between 1996-97 and 2001-02 (Figure 10).
Figure 8: Percentage area treated with fertilizers on irrigated and unirrigated land: 1996-97 and 2001-02
Source: Government of India (2007 & 2008)
IIMA INDIA Research and Publications
W.P. No. 2009-07-01 Page No. 27
Figure 9: Changes (%) in share of irrigated and unirrigated areas in consumption of fertilizer between 1996-97 and 2001-02
Source: Government of India (2007 & 2008)
Figure 10: Trends in consumption of fertilizers (N+P+K) on irrigated and unirrigated land
Source: Government of India (2007 & 2008)
It is quite evident from the above discussion that benefits of fertilizer subsidy are not
restricted to only resource-rich areas but have spread to other areas as well. The inequity in
distribution of fertilizer subsidy among states is still large but has declined over time.
IIMA INDIA Research and Publications
W.P. No. 2009-07-01 Page No. 28
Distribution of Subsidy across Crops
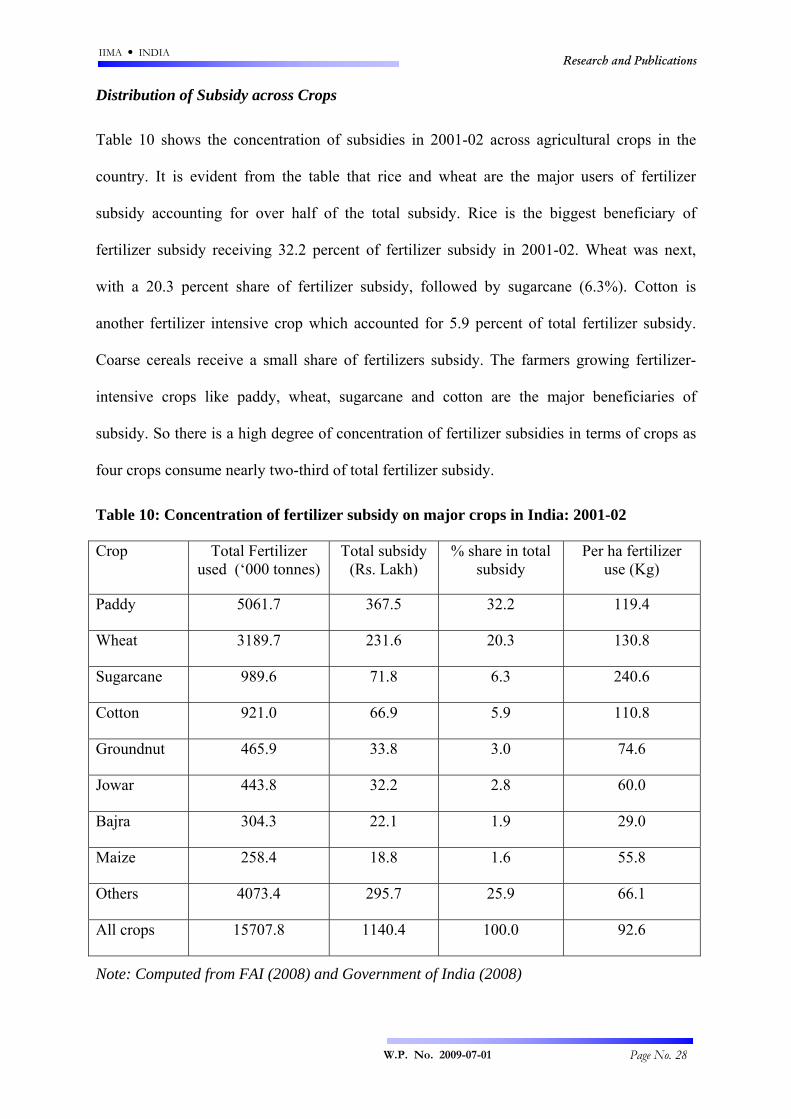
Table 10 shows the concentration of subsidies in 2001-02 across agricultural crops in the
country. It is evident from the table that rice and wheat are the major users of fertilizer
subsidy accounting for over half of the total subsidy. Rice is the biggest beneficiary of
fertilizer subsidy receiving 32.2 percent of fertilizer subsidy in 2001-02. Wheat was next,
with a 20.3 percent share of fertilizer subsidy, followed by sugarcane (6.3%). Cotton is
another fertilizer intensive crop which accounted for 5.9 percent of total fertilizer subsidy.
Coarse cereals receive a small share of fertilizers subsidy. The farmers growing fertilizer-
intensive crops like paddy, wheat, sugarcane and cotton are the major beneficiaries of
subsidy. So there is a high degree of concentration of fertilizer subsidies in terms of crops as
four crops consume nearly two-third of total fertilizer subsidy.
Table 10: Concentration of fertilizer subsidy on major crops in India: 2001-02
Crop Total Fertilizer used (‘000 tonnes)
Total subsidy (Rs. Lakh)
% share in total subsidy
Per ha fertilizer use (Kg)
Paddy 5061.7 367.5 32.2 119.4
Wheat 3189.7 231.6 20.3 130.8
Sugarcane 989.6 71.8 6.3 240.6
Cotton 921.0 66.9 5.9 110.8
Groundnut 465.9 33.8 3.0 74.6
Jowar 443.8 32.2 2.8 60.0
Bajra 304.3 22.1 1.9 29.0
Maize 258.4 18.8 1.6 55.8
Others 4073.4 295.7 25.9 66.1
All crops 15707.8 1140.4 100.0 92.6
Note: Computed from FAI (2008) and Government of India (2008)
IIMA INDIA Research and Publications
W.P. No. 2009-07-01 Page No. 29
Distribution of Fertilizer Subsidy across Farm Sizes
Fertilizer subsidies are generally criticized because they are perceived to be far from
universally distributed and concentrated on relatively few producers, mainly large farmers. In
order to assess whether subsidy policy benefits only large farmers or all categories of
farmers, subsidy distribution patterns across different farm size groups were analyzed. We
computed fertilizer subsidy on per hectare basis as well as share of different farm size groups
in total subsidy and the results are presented in Table 11.
It can be seen from the Table that there is an inverse relationship between farm size and
average subsidy per hectare. Per hectare subsidy on marginal farms was more than double
compared with large farms. The average subsidy was the highest (Rs. 916.2/ha) on marginal
farms and the lowest on large farms (Rs. 405.8/ha). The share of marginal farmers in total
fertilizer subsidy in 2001-02 was the highest (28.3 percent), followed by small farms (23.0%)
and the lowest on large farms (6.3%). The share of small, marginal and semi-medium farms
has increased between 1996-97 and 2001-02 while the share of medium and large farms has
declined. The results clearly show that fertilizer subsidy is distributed more equitably among
different farm sizes compared with crop-wise and state-wise distribution of fertilizer subsidy.
It may be concluded form the above discussion that there is a fair degree of inter-farm equity
in distribution of fertilizer consumption. However, it would be useful to examine changes in
equity in fertilizer consumption over time. In order to investigate this issue, gini coefficients
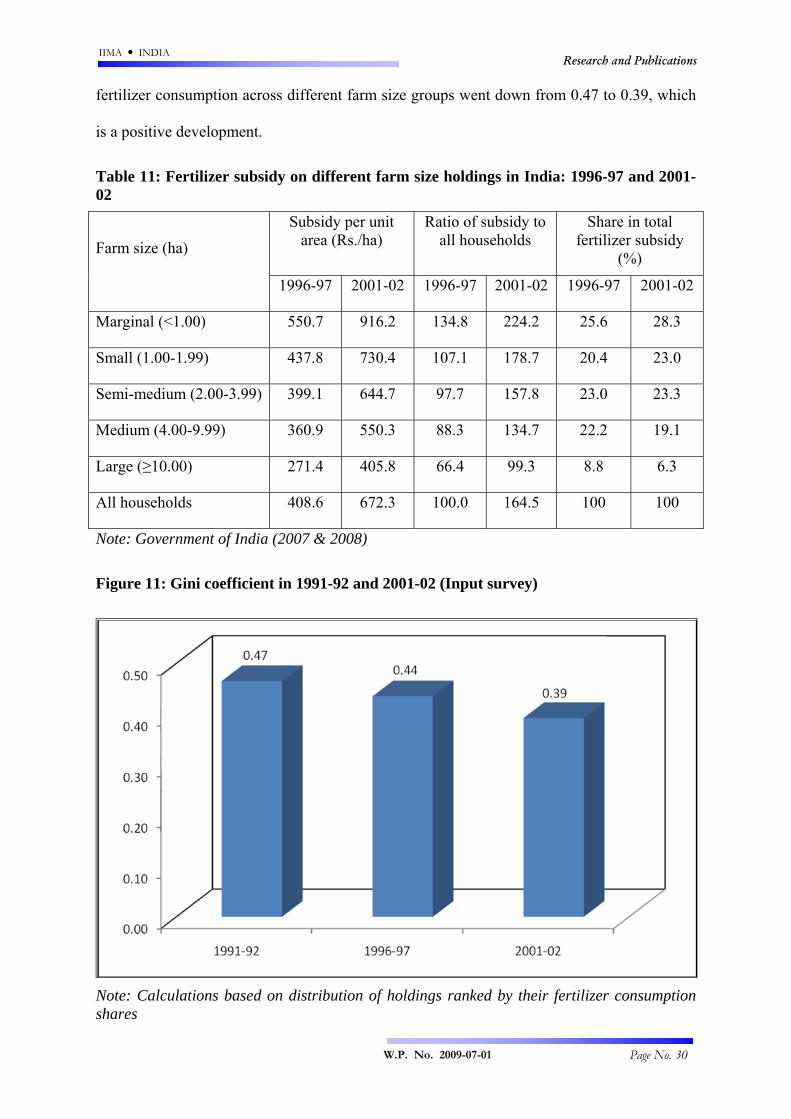
were computed for the period 1991-92, 1996-97 and 2001-02 and are given in Figure 11. The
gini coefficient is a measure of statistical dispersion most prominently used as a measure of
inequality of income distribution. It is defined as a ratio with values between 0 and 1. A low
gini coefficient indicates more equal distribution, while a high gini coefficient indicates more
unequal distribution. As Figure makes clear, between 1991-92 and 2001-02, inequality in
IIMA INDIA Research and Publications
W.P. No. 2009-07-01 Page No. 30
fertilizer consumption across different farm size groups went down from 0.47 to 0.39, which
is a positive development.
Table 11: Fertilizer subsidy on different farm size holdings in India: 1996-97 and 2001-02
Subsidy per unit area (Rs./ha)
Ratio of subsidy to all households
Share in total fertilizer subsidy
(%)
Farm size (ha)
1996-97 2001-02 1996-97 2001-02 1996-97 2001-02
Marginal (<1.00) 550.7 916.2 134.8 224.2 25.6 28.3
Small (1.00-1.99) 437.8 730.4 107.1 178.7 20.4 23.0
Semi-medium (2.00-3.99) 399.1 644.7 97.7 157.8 23.0 23.3
Medium (4.00-9.99) 360.9 550.3 88.3 134.7 22.2 19.1
Large (≥10.00) 271.4 405.8 66.4 99.3 8.8 6.3
All households 408.6 672.3 100.0 164.5 100 100
Note: Government of India (2007 & 2008)
Figure 11: Gini coefficient in 1991-92 and 2001-02 (Input survey)
Note: Calculations based on distribution of holdings ranked by their fertilizer consumption shares
IIMA INDIA Research and Publications
W.P. No. 2009-07-01 Page No. 31
III Concluding Observations and Policy Implications
The importance of fertilizers to agricultural production has made promotion of fertilizer use
an important aspect of national policy in India. Almost all developing countries including
India have, at various times and to different degrees, subsidized fertilizers. Subsidies have
been widely used to stimulate increased fertilizer use and thereby bring about increased
production and yields. Fertilizer subsidies were considered particularly important in inducing
farmers to adopt high yielding varieties, which often depended heavily on fertilizers.
Subsidies appear to have been successful in this regard. Therefore, with increase in fertilizer
use over time, fertilizer subsidy has also increased. In India fertilizer subsidies increased
rapidly during the post-reforms period and peaked in the second-half of 2000s. The fertilizer
subsidy has increased from Rs. 4389 crore in 1990-91 to Rs. 75849 crore in 2008-09. As a
percentage of GDP, this represents an increase from 0.85 per cent in 1990-91 to 1.52 per cent
in 2008-09. The general perception that about one-third of fertilizer subsidy goes to fertilizer
industry is misleading because the underlying assumptions (i) that India’s entry into world
market as an importer does not affect world prices, and (ii) world fertilizer markets are
perfectly competitive, do not hold true. The world fertilizer markets and trade-flows are
highly concentrated and volatile and Indian imports have significant impact on world prices.
Moreover, with shift from the earlier cost-plus based approach to import parity pricing (IPP),
the Indian fertilizer industry would be exposed to the world competition, which would drive
the inefficient units out. The proposed policy of direct transfer of fertilizer subsidy to farmers
that is based on unrealistic assumptions is misconceived and inappropriate and its adverse
effects outweigh the perceived benefits of it.
On the issues of whether fertilizer subsidy is distributed equitably across crops, states, and
farm classes, our results indicate that fertilizer subsidy is concentrated in few states, namely,
Uttar Pradesh, Andhra Pradesh, Maharashtra, Madhya Pradesh, and Punjab. Inter-state

IIMA INDIA Research and Publications
W.P. No. 2009-07-01 Page No. 32
disparity in fertilizer subsidy distribution is still high though it has declined over the years.
Rice, wheat, sugarcane and cotton account for about two-third of total fertilizer subsidy.
However, we found that fertilizer subsidy is more equitably distributed among farm sizes.
The small and marginal farmers have a larger share in fertilizer subsidy in comparison to
their share in cultivated area. The benefits of fertilizer subsidy have spread to unirrigated
areas as the share of area treated with fertilizers has increased from 41 percent in 1996-97 to
53.5 percent in 2001-02 on unirrigated lands and the share of unirrigated areas in total
fertilizer use has also increased during the corresponding period. A reduction in fertilizer
subsidy is, therefore, likely to have adverse impact on farm production and income of small
and marginal farmers and unirrigated areas (about 60%) as they do not benefit from higher
output prices but do benefit from lower input prices. This paper justifies the fertilizer
subsidies and questions the rationale for direct transfer of subsidy to farmers.
References
Agrium (2009), “Agrium’s 2008/2009 Fact book”, Agrium Inc. Calgary, Alberta, Canada.
Arovuori, A. and H. Karikallio (2009), “Consumption Patterns and Competition in the World
Fertilizer Markets”, Paper presented at the 19th Symposium of the International Food
and Agribusiness Management Association, Budapest, Hungary, June 20-21, 2009.
FAI (2008), “Fertilizer Statistics 2007-08 and earlier issues”, Fertilizer Association of India,
New Delhi
Government of India (2007), “All India Report on Input Survey 1996-97” Agriculture Census
Division, Department of Agriculture & Cooperation, Ministry of Agriculture, Govt. of
India, New Delhi.
Government of India (2007a), “Report of the Working Group on Fertilizers for Eleventh Five
Year Plan (2007-12), Planning Commission, Govt. of India, New Delhi, pp. 127.
Government of India (2008), “All India Report on Input Survey 2001-02” Agriculture Census
Division, Department of Agriculture & Cooperation, Ministry of Agriculture, Govt. of
India, New Delhi.
IIMA INDIA Research and Publications
W.P. No. 2009-07-01 Page No. 33
Government of India (2009), “Union Budget, various Issues from 1991-92 to 2009-10” Ministry of Finance, Government of India, New Delhi.
Government of India (2009a), “National Accounts Statistics, various Issues from 1991 to 2009”, Central Statistical Organization, Ministry of Statistics & Programme Implementation, Government of India, New Delhi.
Government of India (2009b), “Import Parity Price of Urea for the Quarter July 2008 to
September 2008 & Earlier Quarters” Department of Fertilizers, Ministry of Chemicals
and Fertilizers, Govt. of India, New Delhi.
Gulati Ashok and Sudha Narayanan (2003), “The Subsidy Syndrome in Indian Agriculture”
Oxford University Press, New Delhi.
Gulati, Ashok (1990), “Fertilizer Subsidy: Is the Cultivator ‘Net Subsidised’? Indian Journal
of Agricultural Economics, Vol. 45, No. 1, Jan.-Mar. 1990, pp. 1-11.
World Bank (2008), “World Development Report 2008: Agriculture for Development”,
World Bank, Washington, D.C.