Does the Farm Input Subsidy Program Displace Commercial Fertilizer Sales? Empirical Evidence from...
19
Does the Farm Input Subsidy Program Displace Commercial Fertilizer Sales? Empirical Evidence from Agro-dealers in Malawi Presented by Stevier Kaiyatsa on behalf of Charles Jumbe, Julius Mangisoni, Abdi Edriss, & Jacob Ricker-Gilbert Malawi Institute of Management 4-5 June, 2015
-
Upload
ifprimassp -
Category
Presentations & Public Speaking
-
view
43 -
download
2
Transcript of Does the Farm Input Subsidy Program Displace Commercial Fertilizer Sales? Empirical Evidence from...
Does the Farm Input Subsidy Program Displace Commercial Fertilizer Sales? Empirical Evidence from Agro-dealers in Malawi
Presented
by
Stevier Kaiyatsa
on behalf of
Charles Jumbe, Julius Mangisoni, Abdi Edriss, & Jacob Ricker-Gilbert
Malawi Institute of Management
4-5 June, 2015

Introduction
• Increased use of agricultural technologies to achieve substantial agricultural
productivity growth in SSA is widely recognized.
• There has been substantial increase in private sector participation in the input markets
in most countries.
– The private sector has been allowed to import and market fertilizers at all levels of the supply chain.
import, distribution, wholesale, and retail.
• Despite the greater involvement of the private sector, the input markets remain
underdeveloped and fragmented.
– Poor dealer network, inadequate infrastructure, uncertain policy environment, credit constraints, limited
market information and access to inputs are some of the challenges facing smallholder farmers in rural
areas.

Motivation of the Study
• Private sector plays a critical role in shortening farmers’
distance to input markets,
• Most ADMARC/SFFRFM depots operate on a seasonal basis.
– Private sector enhances farmers’ access to farm inputs for both rainy
season and winter cropping under irrigation schemes.
• We might expect the subsidy program to have some effects on
agro-dealers’ business (Dorward et al., 2007; Kelly et al., 2010).

Motivation of the Study
• Most studies have focused on the overall evaluation of the
subsidy program as it relates to a broadly defined private
sector (Chinsinga, 2011; Dorward and Chirwa, 2011).
– Limited empirical evidence about the extent to which the program
affects the commercial fertilizer supply system, separately for
different market players.
• Other studies have estimated crowding in/out of fertilizer by
farmers (demand side analysis) (Ricker-Gilbert et al., 2011,
Holden and Lunduka 2011).
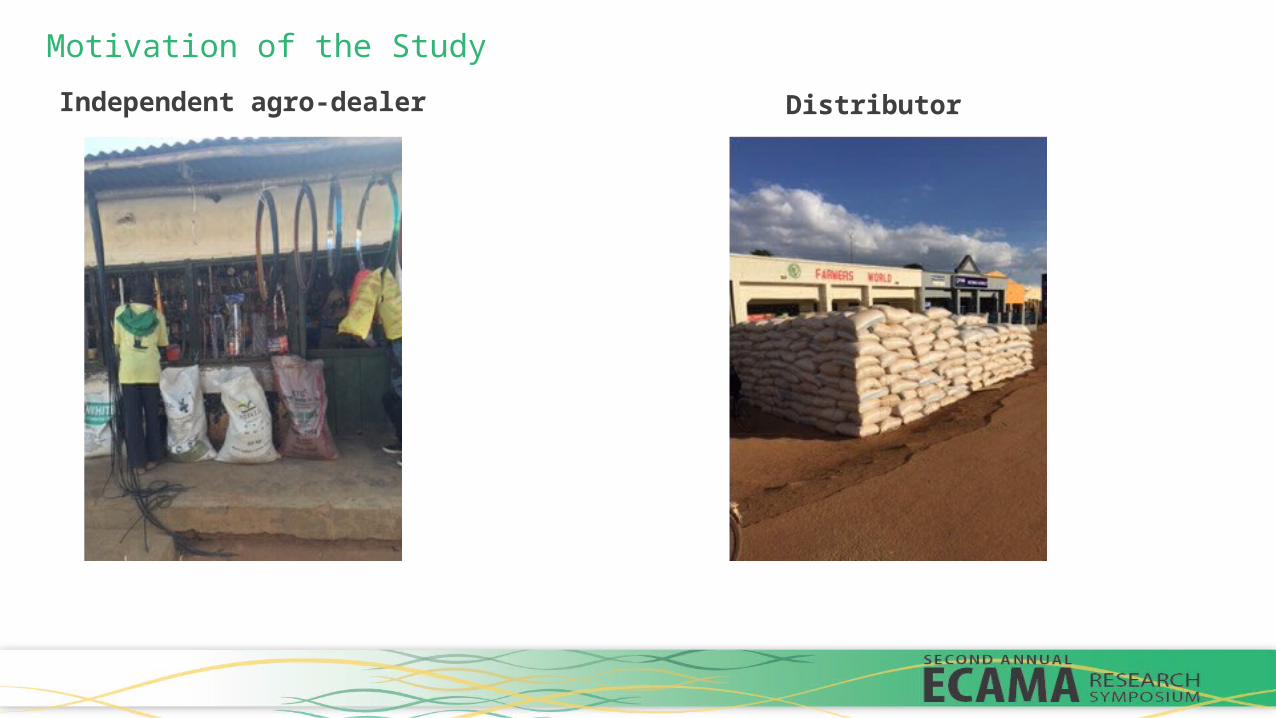
Motivation of the Study
Independent agro-dealer Distributor

Specific objectives of the study
• To analyse factors that influence independent agro-dealers’ decision to participate in fertilizer market and its effect on commercial fertilizer sales.
• To estimate the extent to which input subsidy program reduces or stimulates commercial fertilizer sales.
Rationale of the study
• The exclusion of private sector from selling subsidized fertilizer implies loss
of business to private sector during the peak periods of the subsidy program.
• If the exclusion of private sector reduce demand for commercial fertilizers, it
poses questions about the continued existence and growth of fertilizer
businesses (Kelly et al., 2010).
• If the exclusion of private sector increase sales of commercial fertilizers,
private sector may handle larger volumes of commercial fertilizer and
increase farmers’ access to productivity enhancing inputs.

Research Questions
• What factors influence independent agro-dealers’ decision to
participate in the fertilizer input market?
• Does the increase in the volume of subsidized fertilizer
distributed in an area cause commercial fertilizer sales by
private sector to decrease/increase?
• Does distance to ADMARC/SFFRFM depots decrease/increase
the volume of commercial fertilizer sales by the private sector?

Empirical Strategy
• Lognormal hurdle model was used to analyse factors that influence independent agro-dealers’ decision to
participate in fertilizer market and its effect on commercial fertilizer sales.
– Log-likelihood function (Wooldridge, 2009),
First is probit model; then OLS of for observations with .
• Ordinary Least Square regression: determine factors that influence fertilizer distributor commercial fertilizer
sales.
–
• Policy variables:
– Amount of subsidized fertilizer distributed at EPA and District levels
– Distance to ADMARC/SFFRFM depot.

Data Sources
• Cross-sectional analysis: A simple random sampling method
was used to select 20 districts. During the months of April and
May, 2014.
– 97 market centres were selected using simple random sampling method
in each sampled district. Average of 4 market centres per district
– A representative sample of 609 retailers was selected using PPS. 431
independent dealers and 178 retail outlets of fertilizer distributors.

Empirical Results
Independent agro-dealer Distributor
Annual Sales: Annual Sales: Mean: 20,250 kgs Mean: 617,809 kgs Std. dev: 2,307 kgs Std. dev: 330,8382 kgsMedian: 3,000 kgs Median: 123,950 kgs
Share of total commercial Share of total commercial fertilizer sales=7% fertilizer sales=93%

Hurdle 1: What factors derive independent agro-dealers to participate in commercial fertilizer market and its effect on commercial fertilizer sales?
. Variables: Dummy variable indexing entry in fertilizer market
Probit estimatorCoefficients Std. Errors
Distance to ADMARC/SFFRFM (km) -.0340731** .0142574Selling maize seed=1 -.1366505*** .0469337Log of initial capital (MK) .0213058*** .0083432Education level of agro-dealer =1 .0113487 .0278577Gender of independent agro-dealer=1 .0265581 .0338806Average age of independent agro-dealer (years) -.0027555* .0015479
Number of other dealers at market centre .0010208 .0042546
Experience in input market (years) .002437 .0030643Credit access=1 .0763322 .0730547Stored ownership=1 -.0362649 .0375303State of road connecting market centre=1 .0392679 .0468112
Location of the agro-dealer 2=Central region .2459497*** .0340987
3=Southern region .1618411** .0788412 Observations 431 Log-likelihood = -163.896

HURDLE 2 Independent agro-dealers (Extent of participation)
Variables: Dependent var. log of commercial fertilizer sales
OLS estimator at EPA n=362
OLS estimator at district
n=362
Coefficients Std. Error Coefficients Std. Error
Log of subsidized fertilizer retailed at EPA (Mt) -.1079091 .1987801 Log of subsidized fertilizer sold at district (Mt) ________ ________ .0066232 .1675062Log of distance to ADMARC/SFFRFM (km) .0720493 .0629242 .0802812 .064932More than one selling point=1 .7318876*** .2728748 .7269319*** .2019476Number of other dealers at market centre .0522467** .0221037 .0479114*** .0173697Log of average fertilizer selling price (MK/kg) -2.235278*** .6232939 -1.707797** .7225099Experience in fertilizer business (years) .0192602 .0190369 .0254189 .0160638Number of farm families per EPA .0133583 .0143602 ________ ________Log of population density per district (persons/km2)
________ ________ .6726737*** .1860522
Store ownership=1 .7807628*** .2090148 .8267626*** .2677203Log of store size (m2) .3573085*** .0562959 .3599004*** .0634479Full time employees .122169** .0498976 .1133363** .0480435Location of agro-dealer
2=Central region -.7267836** .3522642 -1.185723***
.324998
3=Southern region -1.451067*** .4958664 -2.228684***
.4779278
Log-likelihood = -818.31 Log-likelihood = -814.77

What factors influence commercial fertilizer sales by fertilizer distributor retail outlets? Variables: Dependent variable log of commercial fertilizer sales
OLS regression at EPA level OLS regression at district level
Coefficient Std. Errors Coefficient Std. Errors
Log of subsidized fertilizer retailed at EPA level (Mt)
.8342623 .4390355*
Log of subsidized fertilizer retailed at district level (Mt)
.8524529 .3137611**
Log of distance to ADMARC/SFFRFM (KM) -.3248515 .1632194* -.4660561 .1691826**
Number of other dealers at market centre .0169088 .0841858 .0241175 .0797587
Log of average fertilizer selling price (MK/kg) -1.212001 1.515564 -1.172434 1.168469
Experience in fertilizer business (years) .0104366 .00614* .0075535 .0061097
Number of farm families per EPA -.0187231 .0190197
Log of population density per district (persons/km2)
.2113384 .2525989
Location of agro-dealer
2=Central region .1637378 .6622623 .4745618 .5377769
3=Southern region -1.633513 .6716475** -1.187472 .5733529*Constant 12.867 8.860584 8.747125 6.857844
Observation 178 Adjusted R2=19.2 Adjusted R2=22.5

Impact of subsidy on commercial fertilizer sales
• The volume of commercial fertilizer sales by retail outlets of major
distributors increase with the volume of subsidized fertilizer retailed
at both EPA (0.83%) and district levels (0.85%).
• No effect on independent agro-dealers.

Conclusion
• The study assessed how the subsidy program is affecting the
commercial fertilizer sales by the private sector
• Findings revealed that subsidy program is promoting commercial
fertilizer sales by private sector.

Policy Implication
• The study has established that the probability of independent agro-dealers to
participate in fertilizer market increases with increasing initial start-up capital.
– To promote participation of independent agro-dealers in fertilizer market
there is need to support agro-dealers with start-up capital.
• Independent agro-dealers should be promoted to open more selling points
selling fertilizer in different locations as a strategy to increase market share.
– This will directly increase the volume of commercial fertilizer sales and
indirectly reduce the distance that farmers travel to access fertilizer.

Key message
• The subsidy program does not crowd-out the private sector.
• The study found that the private sector around
ADMARC/SFFRFM depots sold more quantities of commercial
fertilizer than those far from these depots.
– Government should open more ADMARC/SFFRRM depots to
help the private sector grow and serve small-scale farmers
that cannot afford a 50kg bag of fertilizer.

Thank you!!!