Fertility and marriage behavior in Israel: Diversity ... · PDF fileOBJECTIVE We describe the...
50
DEMOGRAPHIC RESEARCH VOLUME 28, ARTICLE 17, PAGES 457-504 PUBLISHED 12 MARCH 2013 http://www.demographic-research.org/Volumes/Vol28/17/ DOI: 10.4054/DemRes.2013.28.17 Research Article Fertility and marriage behavior in Israel: Diversity, change, and stability Barbara S. Okun © 2013 Barbara S. Okun. This open-access work is published under the terms of the Creative Commons Attribution NonCommercial License 2.0 Germany, which permits use, reproduction & distribution in any medium for non-commercial purposes, provided the original author(s) and source are given credit. See http:// creativecommons.org/licenses/by-nc/2.0/de/
-
Upload
nguyendieu -
Category
Documents
-
view
222 -
download
5
Transcript of Fertility and marriage behavior in Israel: Diversity ... · PDF fileOBJECTIVE We describe the...

DEMOGRAPHIC RESEARCH VOLUME 28, ARTICLE 17, PAGES 457-504 PUBLISHED 12 MARCH 2013 http://www.demographic-research.org/Volumes/Vol28/17/ DOI: 10.4054/DemRes.2013.28.17 Research Article
Fertility and marriage behavior in Israel: Diversity, change, and stability
Barbara S. Okun © 2013 Barbara S. Okun. This open-access work is published under the terms of the Creative Commons Attribution NonCommercial License 2.0 Germany, which permits use, reproduction & distribution in any medium for non-commercial purposes, provided the original author(s) and source are given credit. See http:// creativecommons.org/licenses/by-nc/2.0/de/

Table of Contents
1 Introduction 458
2 The Israeli context 459
2.1 Nationality in Israel 460
2.2 Religion and religiosity in Israel 460
2.2.1 Religion and religiosity within the Arab population 461
2.2.2 Religiosity within the Jewish population of Israel 462
2.3 Nativity status within the Jewish population 463
3 Data 464
4 Dimensions of fertility and marriage behavior in Israel 467
4.1 Period measures of fertility: TFR, fertility postponement and recuperation 467
4.2 Cohort measures of fertility 471
4.2.1 Fertility postponement 471
4.2.2 Average cohort completed fertility (CF) 474
4.2.3 Final parity distributions 477
4.3 Marriage 487
4.3.1 Non-marriage among women aged 40 and over 487
4.3.2 Marriage postponement among young adults 490
5 Summary and discussion 493
6 Acknowledgements 495
References 496
Appendix 501

Demographic Research: Volume 28, Article 17
Research Article
http://demographic-research.org 457
Fertility and marriage behavior in Israel:
Diversity, change, and stability
Barbara S. Okun1
Abstract
BACKGROUND
Based on aggregate statistics, the population of Israel, as compared to all or most other
developed societies, has very high levels of fertility and marriage (e.g. TFR of 2.96 in
2009 and only 9.7% never married among women aged 40-44 in 2009). However,
studying aggregate demographic measures is problematic, because Israel is an
extremely heterogeneous society, with family formation patterns differing greatly
across numerically important social groups. Until now, little has been documented
about the basic fertility and marriage behavior of different population groups.
OBJECTIVE
We describe the fertility and marriage behavior of populations in Israel, broken down
by nationality, religion, religiosity and nativity-status. Although our main focus is on a
detailed presentation of fertility patterns, we also look at marriage behavior, as it is
closely related to fertility in Israel.
METHODS We analyze recently available annual data from the Israel Social Surveys for 2002-
2009, which, for the first time in several decades,, provides detailed information on
family and household demographic behavior and direct information on level of
religiosity. We focus primarily on comparisons across cohorts born from the late 1940s
to the late 1960s and between periods in the early and late 2000s.
RESULTS We provide a detailed portrait of striking diversity in fertility and marriage behavior
across population groups, along with important patterns of change and stability across
cohorts and over time. We document findings and differential patterns, some
unexpected, regarding comparisons across groups and across cohorts.
1 Department of Sociology and Anthropology, Demographic Studies, The Hebrew University of Jerusalem.
E-mail: [email protected].

Okun: Fertility and marriage behavior in Israel: Diversity, change, and stability
458 http://demographic-research.org
CONCLUSIONS
The descriptive findings form the basis for a clearer understanding of fertility and
marriage patterns in different population subgroups in Israel. In addition, the reported
results suggest many questions for future research, which are outlined in the paper.
1. Introduction
The population of Israel has very high levels of aggregate fertility as compared to all or
most developed countries. For example, in 2009, period total fertility stood at 2.96
(Israel Central Bureau of Statistics (ICBS) 2010). However, interpreting aggregate
demographic measures such as TFR is very problematic, because it is widely
acknowledged that Israel is an extremely heterogeneous society, with family formation
patterns differing greatly across numerically important social groups. There are
significant differences in demographic patterns between the minority Arab (primarily
Muslim) population and the majority Jewish population (Friedlander et al. 2010).
Moreover, there is great heterogeneity in demographic patterns within the Arab and
Jewish populations. However, little has been documented about the basic fertility and
marriage behavior of different population groups, primarily because of a lack of up-to-
date, adequate data (but see Friedlander and Feldmann 1993). For example, it has not
been possible until very recently to construct measures of demographic and family
behavior across groups from official government statistics because direct data on
religiosity is not collected in census or vital registration systems (see also Bystrov
2012).
In this paper, we analyze a series of eight annual data files from the Israeli Social
Survey (ISS), 2002-2009, in order to document detailed patterns and trends in fertility
and marriage behavior among population subgroups in Israel, defined by nationality,
religion, religiosity and nativity status. We take a primarily cohort perspective, although
in some cases we also look at period changes in demographic behavior. While our main
goal is an examination of fertility, we also explore marriage behavior, because, as will
be discussed below, in Israel, in contrast to many other rich societies, marriage is still
very closely related to childbearing. Throughout the paper, we compare fertility and
marriage behavior in Israel, and in Israeli subpopulations, to that in other developed
country populations.

Demographic Research: Volume 28, Article 17
http://demographic-research.org 459
2. The Israeli context
Israel is ranked by the United Nations Human Development Index as among the "very
high human development countries" in terms of income, education and health (United
Nations 2011). For example, its income (GDP per capita of approximately $27,000 in
2009) puts it at about 75% of the OECD average, just below Korea (ICBS 2011). Israel
is ranked near the highest among OECD countries in terms of proportions of persons
aged 25-64 with tertiary level education (45% among persons aged 25-64 in 2009),
higher than that in the United States and Japan, and significantly above the OECD
average (OECD 2011). Women's labor force participation is also high, particularly
among mothers with young children (Mandel and Semyonov 2006) and the division of
household labor in Israel is relatively egalitarian (Raz-Yurovich 2011). Life expectancy
in Israel is also very high – 83 years for women and 80 for men – thus matching or
exceeding that of many Northern, Western and Southern European countries (ICBS
2011). Despite its overall high rankings in terms of socioeconomic development, the
population of Israel is extremely heterogeneous along many dimensions. We briefly
describe below the complex mosaic of overlapping and cross-cutting population groups
defined by nationality, religion, religiosity and nativity-status.
2.1 Nationality in Israel
We begin by describing one of Israel's major societal divisions between two nationality
groups – Palestinian Arabs (referred to in this paper as Arabs) and Jews.2 Patterns of
population change in these two very broad groups have been closely connected with
Israel’s political and ideological history and conflict. Around the time of the war and
the establishment of the State in 1948, most Arabs were expelled or fled from their
homes, or were displaced within what would become the borders of the State of Israel.
Although formally, Arabs who live within the internationally recognized borders of
Israel have citizenship status, they are subject to various forms of discrimination, which
have contributed to their social and economic disadvantage vis-à-vis the Jewish
majority. Today, Arabs in Israel are a heterogeneous and largely underprivileged
minority.
In terms of population size, Arabs account for slightly under one-fifth of the total
(1.3 million), while Jews account for the rest (6.1 million)3 (ICBS 2011). The Jewish
2 We refer to Arabs living within the pre-1967 internationally recognized borders of Israel, without making
any suggestion whether they do or do not consider themselves part of the State of Israel. 3 The total for Arabs does not include roughly 300,000 Arabs living in Jerusalem. The total for Jews includes
roughly 300,000 people who are non-Arab Christians or people with no classified religion

Okun: Fertility and marriage behavior in Israel: Diversity, change, and stability
460 http://demographic-research.org
and Arab populations respectively grew 3.6% and 3.8% annually on average since
1948. While there is a relatively small difference in the average growth rates between
the Jewish and Arab populations, the sources of population growth differ. Large net
inmigration accounted for 44.5% of Jewish population growth during the period 1948-
2008, while among Arabs, net migration was negligible since 1948 (ICBS 2009).
Natural increase accounts for the high rate of population growth among Arabs.
2.2 Religion and religiosity in Israel
The population of Israel is comprised primarily from four religion groups. In addition to
the majority Jewish population, the minority Arab population consists of Muslims
(primarily Sunni) (84%), but also has smaller subpopulations of Christian Arabs (from a
variety of denominations) (8%) and Druze (8%) (ICBS 2011).
In Israel, contemporary fertility differentials and population dynamics by religion
and religiosity are very much the focus of current popular debate, if relatively little
scholarly study. Although as a group, Arab fertility rates are much higher than those of
the Jews, there is enormous heterogeneity within the Arab population. In the past,
Druze and especially Muslim women maintained levels of period fertility that were
substantially higher than those of Christian women. However, Druze have experienced
substantial declines in period total fertility since the 1970s, and currently have levels of
total fertility that are below those of the Jews, and just above those of the Christians.
Muslims, after experiencing declines in period fertility during the 1970s, had near
constant levels of fertility from the mid-1980s to the early 2000's, and have only in the
last ten years or so experienced a renewed decline in period fertility to levels just below
four (ICBS 2011).
In addition to heterogeneity in religions, there is also great variability with respect
to religiosity within religion groups. It is beyond the scope of this paper to provide a
general review of empirical and theoretical research related to the associations between
religion, religiosity and family demographic behavior (see McQuillan 2004). However,
below we discuss relevant aspects of religiosity within the Muslim and Jewish groups,
which are the primary foci of this study.
2.2.1 Religion and religiosity within the Arab population
With few exceptions, there has been little research that has focused specifically on the
association between religiosity and family demographic behavior among Muslim Arabs
in Israel (Schellekens and Eisenbach 2010). Recently, Atrash (2010) and Atrash and

Demographic Research: Volume 28, Article 17
http://demographic-research.org 461
Schellekens (2011) have shown that there is a positive empirical association between
religiosity of Muslim women, variously measured, and levels of marital fertility, in a
Muslim locality in the North of Israel.
There is some debate in the literature regarding how religiosity among Muslims
should be measured, and some researchers argue that the meaning of religiosity within
Islam differs from that within Christianity. Nevertheless, research has shown that there
are statistical associations in the expected directions between different measures of
religious salience among Muslims, adherence to modest religious dress among Muslim
women, and fulfillment of Islamic commandments among Muslim women in Israel
(Atrash 2010). González (2011) has recently suggested that religious salience (“how
religious do you consider yourself to be?”) is a more appropriate measure of religiosity
in the Muslim context than standard measures of religiosity used in international
surveys, which are based on religious behavior or beliefs. According to the responses to
the 2009 Israel Social Survey, most adult Muslim women (aged 20 and over) in Israel
consider themselves religious (51.1%) or very religious (10.1%), while the remainder
see themselves as not so religious (24.4%) or not religious (14.5%). Adult Muslim men
report that they are somewhat less religious than do Muslim women (ICBS 2010).
It should be kept in mind that these categories of religiosity among the Muslim
population in Israel may not be as clear-cut or commonly understood as categories
relevant in the Jewish population (see section 2.2.2 and Hleihel 2011). Despite the
difficulties inherent in measuring religiosity, particularly within the Muslim population,
we feel that it is important to discuss differences in family demographic behavior by
religiosity within the Muslim population, because there is a lack of research in this area.
2.2.2 Religiosity within the Jewish population of Israel
A discussion of religiosity in the Jewish population in Israel is more straightforward
than a similar discussion in the Muslim population of Israel, because categories of
Jewish religiosity in Israel are more easily defined social constructs (Hleihel 2011), and
there is more published research in the area of Jewish religiosity. Distinctions are
normally made among the following numerically important groups: (1) ultra-Orthodox;
(2) religious; (3) traditional; and (4) secular/not religious.
These religiosity categories are closely associated with fulfillment of religious
commandments (e.g. observance of the Sabbath), affiliation with certain Jewish
religious political parties, specific types of religious education for children, and
particular religious communities (Hleihel 2011). For example, self-defined ultra-
Orthodox and religious persons are much more likely to strictly observe the Sabbath
and keep kosher laws than are traditional individuals; likewise, traditional are much

Okun: Fertility and marriage behavior in Israel: Diversity, change, and stability
462 http://demographic-research.org
more likely to fulfill these commandments than are self-defined secular persons (author
calculations based on Israel Social Survey 2009).
We discuss the different religiosity groupings in terms of distinctions based on
social characteristics and behaviors. The ultra-Orthodox have a commitment to extreme
segregation from the secular world. As Friedman (1991) discusses, the ultra-Orthodox
groups stem from a contra-acculturation movement, which developed during the period
of Enlightenment in Europe. They shun all contact with outside culture and essentially
form separate societies living in segregated neighborhoods and towns. Based on the
2009 Israel Social Survey, 7.6% of adult Jewish women aged 20 and over define
themselves as ultra-Orthodox (ICBS 2010).
In contrast to the ultra-Orthodox, the national religious movement originated
during Enlightenment in the acculturation groups that promoted contact with the outside
world while maintaining Jewish culture and practices (Friedman 1991). Persons who
see themselves as part of the national religious movement are likely to self-identify as
religious, but not ultra-Orthodox. These religious Jews are generally well integrated
into Jewish Israeli society. Based on the 2009 Israel Social Survey, 10.6% of adult
Jewish women aged 20 and over self-identify as religious (ICBS 2010).
An additional 39.8% of Jewish adult women in the 2009 Social Survey define
themselves as traditional (ICBS 2010). Traditional Jews in Israel do not define
themselves as strictly religious or Ultra-orthodox, and not as secular. Generally,
traditional Jews do fulfill some religious commandments and maintain Jewish customs.
However, their traditional behavior is not necessarily motivated only by religious
commitment, but may also be associated with identification and affiliation with the
Jewish people or with their Jewish ethnic group, community and family (Ben-Rafael
and Sharot 1991). The large category of traditional Jews is sometimes broken down
further into two subcategories: traditional/religious Jews and traditional/less religious
Jews. The former group, while less likely to fulfill strictly the Jewish commandments
(such as Sabbath observance) than are Ultra-orthodox or self-defined religious women,
are more likely to do so than are traditional/less-religious women.
The largest group of adult Jews, at 41.8%, self-defines as secular/not religious
(ICBS 2010). We note that substantial proportions of self-identified secular women
report at least occasional observance of religious commandments, attend synagogue for
major holidays, and rate religious ceremonies as very important in their lives.4 This
would seem to suggest that even secular Jews in Israel are not completed secularized.
4 For example, among native-born secular women aged 20-44, 49% report that they follow kosher laws at least to some degree, 26% report attending synagogue on Rosh Hashanah or Yom Kippur, or more frequently,
and 45% report that having a Jewish burial for themselves is very important.
Demographic Research: Volume 28, Article 17
http://demographic-research.org 463
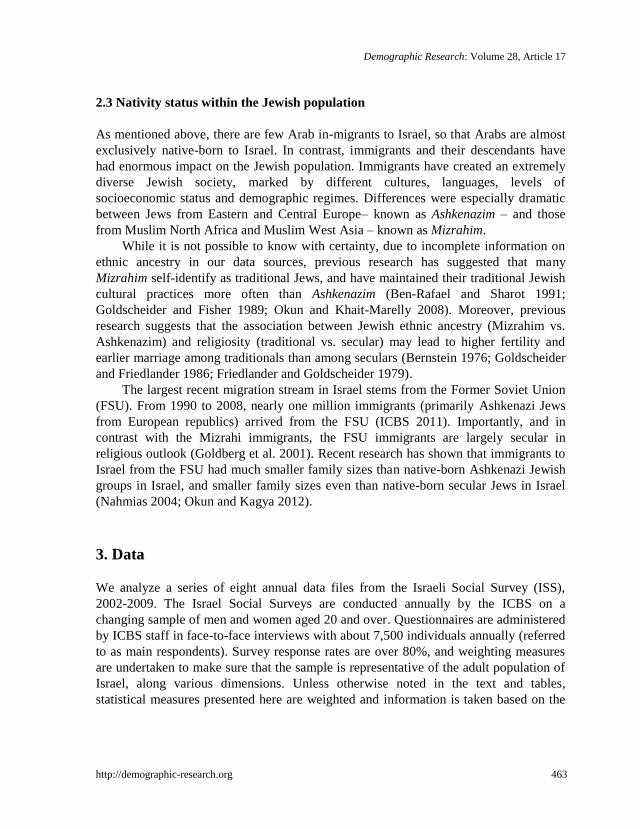
2.3 Nativity status within the Jewish population
As mentioned above, there are few Arab in-migrants to Israel, so that Arabs are almost
exclusively native-born to Israel. In contrast, immigrants and their descendants have
had enormous impact on the Jewish population. Immigrants have created an extremely
diverse Jewish society, marked by different cultures, languages, levels of
socioeconomic status and demographic regimes. Differences were especially dramatic
between Jews from Eastern and Central Europe– known as Ashkenazim – and those
from Muslim North Africa and Muslim West Asia – known as Mizrahim.
While it is not possible to know with certainty, due to incomplete information on
ethnic ancestry in our data sources, previous research has suggested that many
Mizrahim self-identify as traditional Jews, and have maintained their traditional Jewish
cultural practices more often than Ashkenazim (Ben-Rafael and Sharot 1991;
Goldscheider and Fisher 1989; Okun and Khait-Marelly 2008). Moreover, previous
research suggests that the association between Jewish ethnic ancestry (Mizrahim vs.
Ashkenazim) and religiosity (traditional vs. secular) may lead to higher fertility and
earlier marriage among traditionals than among seculars (Bernstein 1976; Goldscheider
and Friedlander 1986; Friedlander and Goldscheider 1979).
The largest recent migration stream in Israel stems from the Former Soviet Union
(FSU). From 1990 to 2008, nearly one million immigrants (primarily Ashkenazi Jews
from European republics) arrived from the FSU (ICBS 2011). Importantly, and in
contrast with the Mizrahi immigrants, the FSU immigrants are largely secular in
religious outlook (Goldberg et al. 2001). Recent research has shown that immigrants to
Israel from the FSU had much smaller family sizes than native-born Ashkenazi Jewish
groups in Israel, and smaller family sizes even than native-born secular Jews in Israel
(Nahmias 2004; Okun and Kagya 2012).
3. Data
We analyze a series of eight annual data files from the Israeli Social Survey (ISS),
2002-2009. The Israel Social Surveys are conducted annually by the ICBS on a
changing sample of men and women aged 20 and over. Questionnaires are administered
by ICBS staff in face-to-face interviews with about 7,500 individuals annually (referred
to as main respondents). Survey response rates are over 80%, and weighting measures
are undertaken to make sure that the sample is representative of the adult population of
Israel, along various dimensions. Unless otherwise noted in the text and tables,
statistical measures presented here are weighted and information is taken based on the

Okun: Fertility and marriage behavior in Israel: Diversity, change, and stability
464 http://demographic-research.org
questionnaire administered to female main respondents, supplemented with more
limited data taken from other household members.
Our sample of Jews consists of all native-born and foreign-born persons who
define themselves as Jewish. Our sample of Arabs consists of native-born persons who
identify as Muslims, Christians or Druze.5 Our analyses do not include Bedouins who
live outside recognized localities in Israel.6 In addition, we exclude from our analyses
non-Jewish residents of Jerusalem and the West Bank.7 For completion, when we
present figures on the overall population of Israel, our sample includes people from all
religions, (including atheists), regardless of nativity-status, but does not include
Bedouins living outside recognized localities in Israel nor non-Jewish residents of
Jerusalem and the West Bank (see footnotes 6 and 7).
Our analyses focus primarily on quinquennial birth cohorts, centered around 1950,
1955, 1960 and 1965. The first quinquennial birth cohort begins with 1948, the year of
the foundation of the State of Israel. Thus, the birth cohorts are defined as: 1948-1952,
1953-1957, 1958-1962, and 1963-1967. In some cases, we are able to consider the birth
cohort of 1968-1970. Younger birth cohorts were too young during the period 2002-
2009 to have reached the end, or near the end, of the childbearing years, so cannot be
considered in terms of analysis of completed fertility. For purposes of examining trends
in age at first birth and marriage patterns among younger individuals, we also consider
younger birth cohorts.
The most important demographic information which can be garnered from the ISS
questionnaire includes information on main respondents’ numbers of children ever
born, age and sex of children living in the household, current marital status, number of
times married, year of last change in marital status, country of birth and year of
immigration. For divorced or remarried women, we do not have information on age at
first marriage. Therefore, we will not be able to estimate models of age at first marriage.
Information on age at first birth is derived using the own child method, based on
information of the oldest child in the household and woman's current age (Okun and
Kagya 2012). We do not include in our sample women aged 41 and older at the survey
date, since it is more likely that these women have an older child who has already left
the household. Thus, we can consider age at first birth only for the birth cohorts born in
or after 1962. We also include only women for whom we have correspondence between
number of children found in the household and reported number of children ever born.
The proportion with this correspondence is well over 90%.
5 As mentioned above, Arab immigration to Israel after 1948 was minimal, and Christian immigrants are
mainly non-Arab Christians from the Former Soviet Union. 6 Bedouins living outside recognized localities in Israel are not included in the ISS samples. 7 Arabs living in these areas are not considered part of the population of Israel (Haidar 2005).

Demographic Research: Volume 28, Article 17
http://demographic-research.org 465
In terms of religiosity, all of the ISS contain information on self-defined religiosity
at the time of the survey. The ISS questions on religiosity refer primarily to the concept
of subjective religious salience, which may be considered appropriate for non-Christian
populations (González 2011). In particular, the Arab main respondents are asked "How
do you see yourself?" and are asked to choose among one of four categories: (1) very
religious, (2) religious, (3) not so religious, or (4) not religious. The Jewish main
respondents are asked "How do you define yourself?" and are asked to choose among
one of five categories: (1) ultra-Orthodox, (2) religious, (3) traditional/religious, (4)
traditional/less-religious, or (5) secular.
In all cases, we measure religiosity as self-defined by the main respondent at the
time of the survey; we do not have data on religiosity at every point over the life course.
Thus, changes in religiosity over time may lead to difficulties in terms of interpreting
demographic histories by level of religiosity. However, Hleihel (2011) shows that this
issue has minor impact on estimated period total fertility for the secular Jewish
population, although there is a somewhat larger impact on the estimated period total
fertility of the ultra-Orthodox Jewish population, particularly in periods of time further
removed from the survey year. In general, by basing our measure of religiosity on
current religiosity, rather than on a changing measure of religiosity across the life
course (not generally available in the data), we tend to underestimate the differentials in
fertility across religiosity subgroups among Jews (Hleihel 2011, Appendix 2a). For
Muslims, as discussed above, the distinctions among religiosity subgroups are less
clear. Hleihel (2011), however, suggests that for the majority of Muslim respondents in
the ISS, subjective level of religiosity did not change over the life course (Appendix
2b).
In general, we present our findings for population subgroups defined by cross-
cutting categories of nationality, religion, religiosity and nativity status (native-born vs.
foreign-born). The two nationality groups are Arabs and Jews. We also present findings
for the numerically largest religion subgroup within the Arab population: Muslim Arabs
(referred to in the text, figures and tables as Muslims). However, due to sample size
restrictions, we cannot present separate figures for Christian Arab or Druze
subpopulations. Also, due to sample size limitations, we grouped together Muslim Arab
women who self-defined as very religious or religious into an aggregate group which
we term 'more religious Muslims'; the remaining Muslim Arab women, who self-
defined as not-so-religious or not religious, were also grouped together in a category we
term 'less religious Muslims'. In addition, as discussed above, because there is no
sizeable foreign-born Arab population in Israel, foreign-born Muslims, Christians and
Druze are excluded from the analyses of Arabs.
Regarding the Jewish population, information on religiosity is presented for the
five religiosity subgroups. However, when figures are also presented by nativity status,

Okun: Fertility and marriage behavior in Israel: Diversity, change, and stability
466 http://demographic-research.org
Jewish religiosity is recategorized into two religiosity groups: secular and non-secular;
due to sample size restrictions, we could not present all the five religiosity groups of
Jews by nativity status. Readers should keep in mind that it is somewhat difficult to
interpret levels and changes in the family demographic behavior of the broadly-defined
non-secular group, because of the changing composition of this group over birth cohorts
in terms of factors such as level of religiosity. Similarly, it is difficult to interpret levels
and changes in the family-demographic behavior of the foreign-born population over
birth cohorts, because of the changing composition of this group in terms of region of
origin, age at immigration, and duration of time spent in Israel. Our main goal in
presenting the Jewish group broken down by religiosity and nativity status was to focus
attention on the secular, native-born subpopulation. This group is more homogenous
than the other Jewish nativity-status religiosity groups, and also is probably the most
likely to show early signs of second demographic transition behavior, as secularization
is generally considered one of the preconditions of the Second Demographic Transition
(SDT) (Lesthaeghe 2010; Bystrov 2012). We should also note that only a very small
proportion of the Muslim population self-defined in the ISS as not religious, so that it is
not possible to provide detailed analyses of secular Muslims in the same way that we
provide them for secular Jews.
4. Dimensions of fertility and marriage behavior in Israel
Below we consider various measures of fertility and marriage behavior among
population subgroups defined by nationality, religion, religiosity and nativity status.
The importance of marriage behavior in understanding fertility becomes clear when we
consider that, unlike in many rich societies, the vast majority of childbearing in Israel
still occurs within marriage. For example, only 3.6% of Jewish women who gave birth
during the period 2005-2009 had never been married at the time of the birth; although
official statistics are not published, proportions are likely to be even lower for Arab
populations (ICBS 2012).
In this paper, we consider period and cohort measures of fertility, including
detailed presentations of parity distributions and age at first birth. In addition, we
present measures of non-marriage and marriage postponement. When relevant, we point
out similarities in trends and differentials in non-marriage and marriage postponement,
as they are related to childlessness and increases in age at first birth, respectively.
Recently, Bystrov (2012) has presented some attitudinal and behavioral data on
family demography in Israel, but her article focuses more particularly on issues directly
associated with second demographic transition. In contrast, the approach taken here is
to provide careful analyses of more detailed fertility and associated marriage behavior.
Demographic Research: Volume 28, Article 17
http://demographic-research.org 467
Often, because of differences in variable and sample definitions, results in Bystrov
(2012) are not directly comparable to those reported here; however, where relevant in
terms of comparison, the Bystrov (2012) article is referenced.
4.1 Period measures of fertility: TFR, fertility postponement and recuperation
Much has been written about trends in period total fertility in most developed societies.
With the exception of New Zealand and the United States, developed societies over the
recent decades have had below-replacement fertility levels, which have usually been
accompanied by postponement of fertility (Frejka and Sobotka 2008). In the last several
years, there are instances of a slight recovery in total fertility, as this postponement has
begun to slow in some areas (Goldstein et al. 2009). Nevertheless, fertility remains
below replacement in nearly all countries.
In contrast, total fertility in Israel has remained well above replacement-level, both
among Muslims and Jews. Trends in Muslim TFR can be discussed in four periods: (1)
the 1960s, characterized by extremely high levels of period total fertility over 9; (2) the
early 1970s to the mid-1980s, when TFR declined rapidly to a level of about 4.7; (3) the
mid-1980s to the early 2000s, when TFR levels were stagnant at around 4.7; and (4) the
early 2000s to the present, during which there is a dramatic resumption of fertility
decline to levels around 3.5 (ICBS 2012; Friedlander et al. 2010; Nahmias and Stecklov
2007). Among Jews, changes in period TFR are also noteworthy. Following an increase
in fertility associated with mass immigration following Israel’s Statehood in 1948
(Friedlander 1975), period total fertility among Jews declined from 3.9 in 1950 to
around 2.6 in the early 1990s, after which time total fertility remained fairly constant
until the early 2000s, when a slight increase began, bringing fertility back to a level just
under 3.0 (ICBS Statistical Abstracts, various years).
Recently, Hleihel (2011) has published estimates of period age-specific fertility
rates by level of current religiosity for Muslims and Jews, based on information on
Israel Social Survey data, linked to information on births from vital registration.
Figure 1, adapted from Hleihel (2011), shows that, perhaps surprisingly, women who
define themselves as religious actually have somewhat higher period fertility than do
those who define themselves as very religious. These two groups, however, tend to have
higher fertility than those who define themselves as not so religious or not religious
(reclassified by Hleihel and here as 'less religious'). For example, during the 1990s,
'religious' and 'very religious' women had levels of total fertility which were about one
child higher than that among 'less religious' women.
Broadly, the fertility trends for the overall Muslim population, described above,
are reflected in the patterns within each religiosity group. Thus, the changes over time

Okun: Fertility and marriage behavior in Israel: Diversity, change, and stability
468 http://demographic-research.org
in Muslim period fertility are not simply a result of changes in population composition
according to religiosity. For example, beginning in the early-to-mid 2000s, we note
significant declines in fertility rates among all religiosity groups (Hleihel 2011). Period
TFR remains well above replacement in all Muslim groups.
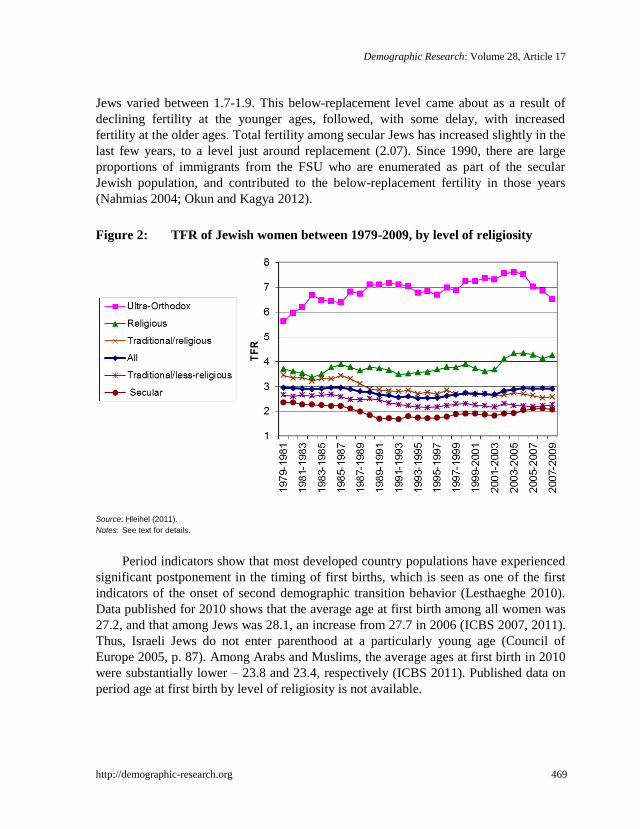
Figure 2, also adapted from Hleihel (2011), presents estimates of period total
fertility of Jews, by level of religiosity. In contrast to the graph concerning the Muslim
population, the graph for the Jewish population shows a consistent and clear positive
relationship between level of TFR and religiosity. Ultra-Orthodox women had TFRs
ranging over the period from about 6-7.5, with high levels reached during the early
2000s. Religious women had rates ranging between 3.5-4.3, with highs also reached
during the 2000s. Traditional/religious women had levels between 2.5-3.5 and
traditional/less-religious women had levels of about 2.2 to 2.7 (both with a small
downward trend over time). Secular women had the lowest rates of period fertility
throughout, with levels ranging from about 1.7-2.4.
Figure 1: TFR of Muslim women between 1979-2009, by level of religiosity
Source: Hleihel (2011).
Notes: Due to sample size considerations, women who self-defined as 'not so religious' or 'not religious' were combined into one
category, referred to here as 'less religious'. See text for details.
We note that only the secular Jewish group has reached below-replacement period
fertility levels. In particular, during the period 1989-2003, total fertility among secular
Demographic Research: Volume 28, Article 17
http://demographic-research.org 469
Jews varied between 1.7-1.9. This below-replacement level came about as a result of
declining fertility at the younger ages, followed, with some delay, with increased
fertility at the older ages. Total fertility among secular Jews has increased slightly in the
last few years, to a level just around replacement (2.07). Since 1990, there are large
proportions of immigrants from the FSU who are enumerated as part of the secular
Jewish population, and contributed to the below-replacement fertility in those years
(Nahmias 2004; Okun and Kagya 2012).
Figure 2: TFR of Jewish women between 1979-2009, by level of religiosity
Source: Hleihel (2011).
Notes: See text for details.
Period indicators show that most developed country populations have experienced
significant postponement in the timing of first births, which is seen as one of the first
indicators of the onset of second demographic transition behavior (Lesthaeghe 2010).
Data published for 2010 shows that the average age at first birth among all women was
27.2, and that among Jews was 28.1, an increase from 27.7 in 2006 (ICBS 2007, 2011).
Thus, Israeli Jews do not enter parenthood at a particularly young age (Council of
Europe 2005, p. 87). Among Arabs and Muslims, the average ages at first birth in 2010
were substantially lower – 23.8 and 23.4, respectively (ICBS 2011). Published data on
period age at first birth by level of religiosity is not available.
Okun: Fertility and marriage behavior in Israel: Diversity, change, and stability
470 http://demographic-research.org
4.2 Cohort measures of fertility
4.2.1 Fertility postponement
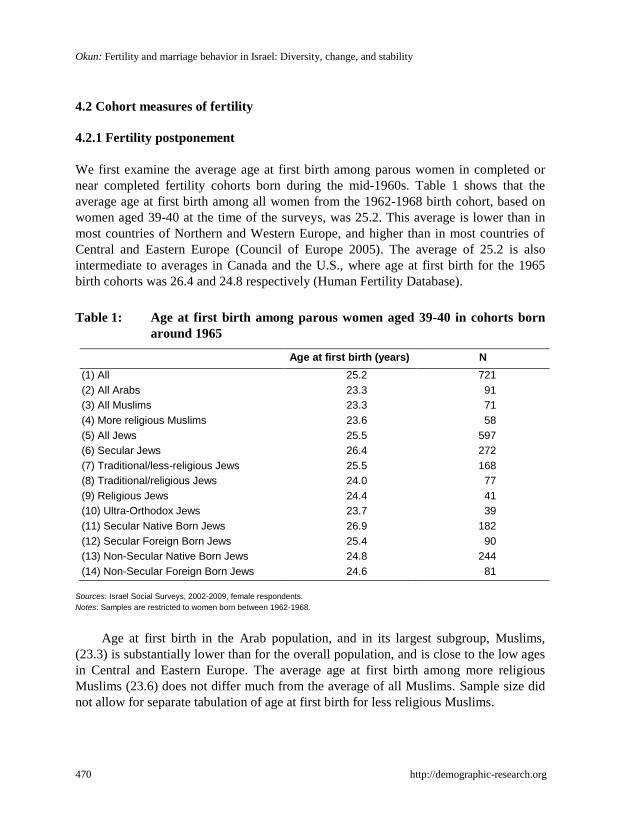
We first examine the average age at first birth among parous women in completed or
near completed fertility cohorts born during the mid-1960s. Table 1 shows that the
average age at first birth among all women from the 1962-1968 birth cohort, based on
women aged 39-40 at the time of the surveys, was 25.2. This average is lower than in
most countries of Northern and Western Europe, and higher than in most countries of
Central and Eastern Europe (Council of Europe 2005). The average of 25.2 is also
intermediate to averages in Canada and the U.S., where age at first birth for the 1965
birth cohorts was 26.4 and 24.8 respectively (Human Fertility Database).
Table 1: Age at first birth among parous women aged 39-40 in cohorts born
around 1965
Age at first birth (years) N
(1) All 25.2 721
(2) All Arabs 23.3 91
(3) All Muslims 23.3 71
(4) More religious Muslims 23.6 58
(5) All Jews 25.5 597
(6) Secular Jews 26.4 272
(7) Traditional/less-religious Jews 25.5 168
(8) Traditional/religious Jews 24.0 77
(9) Religious Jews 24.4 41
(10) Ultra-Orthodox Jews 23.7 39
(11) Secular Native Born Jews 26.9 182
(12) Secular Foreign Born Jews 25.4 90
(13) Non-Secular Native Born Jews 24.8 244
(14) Non-Secular Foreign Born Jews 24.6 81
Sources: Israel Social Surveys, 2002-2009, female respondents.
Notes: Samples are restricted to women born between 1962-1968.
Age at first birth in the Arab population, and in its largest subgroup, Muslims,
(23.3) is substantially lower than for the overall population, and is close to the low ages
in Central and Eastern Europe. The average age at first birth among more religious
Muslims (23.6) does not differ much from the average of all Muslims. Sample size did
not allow for separate tabulation of age at first birth for less religious Muslims.
Demographic Research: Volume 28, Article 17
http://demographic-research.org 471
For Jews, the average age at first birth (25.5) is higher than that of Muslims, and
we note substantial variability in age at first birth according to level of religiosity. For
example, among secular Jews, the age at first birth is relatively high (26.4), while
among ultra-Orthodox Jews the average is closer to that of the Muslims (23.7). Secular,
native-born Jews have the highest average age at first birth (26.9). This is high
compared to national populations in Europe, and close to levels in Ireland, Sweden,
Denmark, Spain and Italy.
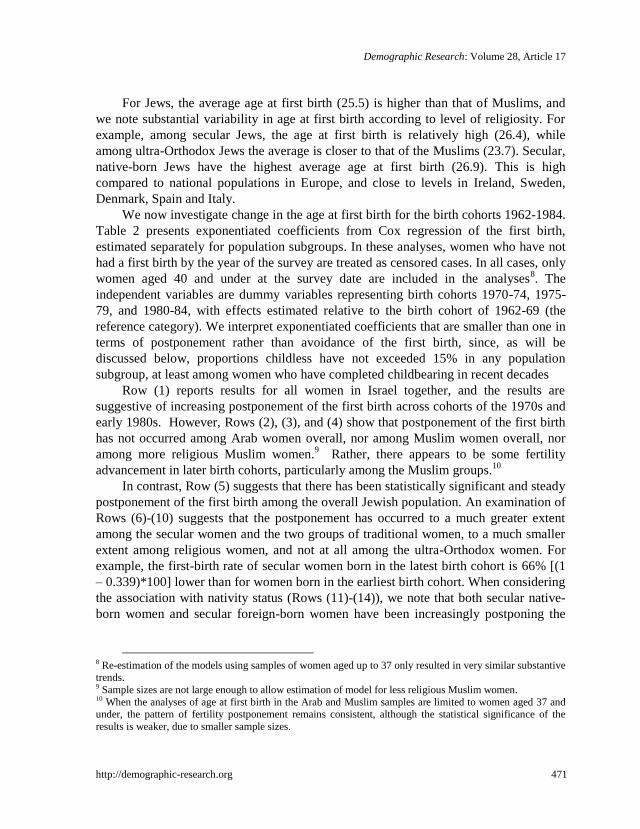
We now investigate change in the age at first birth for the birth cohorts 1962-1984.
Table 2 presents exponentiated coefficients from Cox regression of the first birth,
estimated separately for population subgroups. In these analyses, women who have not
had a first birth by the year of the survey are treated as censored cases. In all cases, only
women aged 40 and under at the survey date are included in the analyses8. The
independent variables are dummy variables representing birth cohorts 1970-74, 1975-
79, and 1980-84, with effects estimated relative to the birth cohort of 1962-69 (the
reference category). We interpret exponentiated coefficients that are smaller than one in
terms of postponement rather than avoidance of the first birth, since, as will be
discussed below, proportions childless have not exceeded 15% in any population
subgroup, at least among women who have completed childbearing in recent decades
Row (1) reports results for all women in Israel together, and the results are
suggestive of increasing postponement of the first birth across cohorts of the 1970s and
early 1980s. However, Rows (2), (3), and (4) show that postponement of the first birth
has not occurred among Arab women overall, nor among Muslim women overall, nor
among more religious Muslim women.9 Rather, there appears to be some fertility
advancement in later birth cohorts, particularly among the Muslim groups.10
In contrast, Row (5) suggests that there has been statistically significant and steady
postponement of the first birth among the overall Jewish population. An examination of
Rows (6)-(10) suggests that the postponement has occurred to a much greater extent
among the secular women and the two groups of traditional women, to a much smaller
extent among religious women, and not at all among the ultra-Orthodox women. For
example, the first-birth rate of secular women born in the latest birth cohort is 66% [(1
– 0.339)*100] lower than for women born in the earliest birth cohort. When considering
the association with nativity status (Rows (11)-(14)), we note that both secular native-
born women and secular foreign-born women have been increasingly postponing the
8 Re-estimation of the models using samples of women aged up to 37 only resulted in very similar substantive
trends. 9 Sample sizes are not large enough to allow estimation of model for less religious Muslim women. 10 When the analyses of age at first birth in the Arab and Muslim samples are limited to women aged 37 and under, the pattern of fertility postponement remains consistent, although the statistical significance of the
results is weaker, due to smaller sample sizes.

Okun: Fertility and marriage behavior in Israel: Diversity, change, and stability
472 http://demographic-research.org
first birth. The same general trend holds for non-secular native-born and foreign-born,
although to a lesser degree.
Table 2: Exponentiated coefficients from Cox Regressions of age at first birth
Birth Cohort
1962-1969 1970-1974 1975-1979 1980-1984 N
(1) All Ref. 0.915** 0.779*** 0.618*** 11,667
(2) All Arabs Ref. 1.117 1.185* 1.173 1,817
(3) All Muslims Ref. 1.142 1.223* 1.327** 1,388
(4) More religious
Muslims Ref. 1.144 1.274* 1.362** 926
(5) All Jews Ref. 0.863*** 0.700*** 0.524*** 9,349
(6) Secular Jews Ref. 0.844*** 0.627*** 0.339*** 4,271
(7) Traditional/ less
religious Jews Ref. 0.826** 0.628*** 0.361*** 2,331
(8) Traditional/
religious Jews Ref. 0.871 0.602*** 0.313*** 1,032
(9) Religious Jews Ref. 0.879 0.775* 0.77 855
(10) Ultra-Orthodox
Jews Ref. 1.191 1.161 1.238 860
(11) Secular Native
Born Jews Ref. 0.832** 0.618*** 0.323*** 3,207
(12) Secular Foreign
Born Jews Ref. 0.965 0.682*** 0.366*** 1,064
(13) Non-Secular
Native Born Jews Ref. 0.869** 0.742*** 0.578*** 4,101
(14) Non-Secular
Foreign Born Jews Ref. 1.020 0.806* 0.689** 977
Source: Israel Social Surveys 2002-2009, Jewish female respondents. See text for details.
Notes: * p < 0.05, ** p < 0.01, *** p<0.001
In summary, the table shows that there is substantial postponement of the first birth
in secular and traditional Jewish cohorts from the 1960's through the 1980-84 birth
cohort. Religious Jewish women show less postponement, while Ultra-orthodox and all
Arab, Muslim and religious Muslim women show no evidence of postponement at all.
Rather, there is evidence of fertility advancement among Muslim and religious Muslim
women.

Demographic Research: Volume 28, Article 17
http://demographic-research.org 473
4.2.2 Average cohort completed fertility (CF)
In most areas of Europe, N. America and Oceania, completed fertility (CF) for cohorts
of the 1960s has stood at or below replacement-level. For European cohorts of 1960 and
1965, for example, CF generally did not exceed 2.1, with most levels a bit below 2.0.
Some of the highest CF levels in Europe for the 1965 cohort are found in France (2.03),
Norway (2.07), and Ireland (2.19), while lows of 1.51 are found in Italy and Germany
(Council of Europe 2005). In the U.S., CF for the birth cohorts of 1960 and 1965 were
2.0, while the analogous figures for Canada were 1.8 and 1.7 for these two cohorts,
respectively (Human Fertility Database). In Australia and New Zealand, CF values are
slightly higher, with Australia registering 2.2 and 2.1 for the 1960 and 1965 cohorts
(Myrskylä et al. 2012, Australian Bureau of Statistics 2011), and New Zealand
registering 2.4 and 2.3 respectively (Statistics New Zealand 2012). As will be seen
below, values for cohort fertility in Israel are extremely high when compared with all of
these figures, and there is remarkable diversity across population groups.
Figures 3-6 report estimated values of CF for different population subgroups in
quinquennial birth cohorts starting from 1948-1952 through 1963-1967, and also for the
birth cohort 1968-1970. With the exception of the last birth cohort, only women who
were at least 40 years of age during the survey year were included in the analyses in this
section and in section 4.2.3 so that CF reflects completed, or nearly completed fertility.
For the 1968-1970 birth cohort, women were aged 37 and over during the survey year,
so their completed fertility may be slightly underestimated. From Figure 3, we see that
the overall CF values for all women born around 1950, 1955, 1960, 1965, and 1969
were roughly constant at levels close to 3.1. The averages for all women are just
slightly above those for the Jewish population, which also show nearly constant CF
values close to 2.9 for all birth cohorts. The CF values of Arab and Muslim women are
much higher and reveal a very substantial and statistically significant decline in CF
values over birth cohorts (see also Bystrov 2012). Trends in Arab cohort fertility are
similar to those of Muslim cohort fertility, due to the numerical dominance of the
Muslim group within the Arab population. While the 1948-1952 cohort averaged 6.1
children per Muslim woman, the 1968-1970 birth cohort averages only about 3.5
children per Muslim woman. This large decline in CF occurred over Muslim birth
cohorts, many of which had their exposure to childbearing during years of stagnant
period fertility rates (1985-2002). Thus, there is remarkably little similarity between
trends in cohort and period fertility among Muslims in Israel.
Figure 4 reports CF values among Muslim women, by level of religiosity.
Downward trends in cohort fertility are substantial and statistically significant for more
religious as well as less religious women. While levels of cohort fertility during the
1950s are substantially lower for the less religious as compared to the more religious,
religiosity differentials in cohort fertility have narrowed in the later birth cohorts.

Okun: Fertility and marriage behavior in Israel: Diversity, change, and stability
474 http://demographic-research.org
Cohort completed fertility among Jews shows much greater variability with respect
to religiosity (see also Bystrov 2012). Figure 5 shows that ultra-Orthodox women have
levels of cohort fertility ranging from 6.2 to 8.0.11
Religious women have cohort
fertility in the range of 4.0; the two groups of traditional women have cohort fertility in
the range of 2.5 to 3.5, with a slight downward trend noticeable among
traditional/religious women. Secular women have the lowest number of children on
average, but maintain replacement-level or just above replacement-level cohort fertility
across birth cohorts, with no statistically significant change over cohorts. With the
exception of a short-lived peak in cohort fertility among the ultra-Orthodox, there is
remarkably little trend in cohort fertility among any of the religiosity groups, or among
Jews overall (Figure 3).
Figure 3: Completed or near completed fertility among women, by birth
cohort, nationality and religion
Source: Israel Social Surveys 2002-2009, female respondents.
Notes: Women included in the sample were aged 40 and over during the survey year, except for women in the 1968-1970 birth
cohort, who were aged 37 and over during the survey year.
* indicates that the cohort completed fertility is statistically significantly different than in the analogous 1948-1952 cohort, at
the 5% level of significance, in a two-tailed test.
11 Based on a smaller and differently defined sample, Bystrov (2012) reports somewhat lower figures for
completed fertility among the Ultra-orthodox.

Demographic Research: Volume 28, Article 17
http://demographic-research.org 475
Figure 4: Completed or near completed fertility among Muslim women, by
birth cohort and level of religiosity
Source: Israel Social Surveys 2002-2009, Muslim female respondents.
Notes: See notes to Figure 3. For the less-religious Muslims only, * indicates that the cohort completed fertility is statistically
significantly different than in the analogous 1953-1957 cohort, at the 5% level of significance, in a two-tailed test. 'b' indicates
that the cohort sample size is less than 30.
Figure 5: Completed or near completed fertility among Jewish women, by
birth cohort and level of religiosity
Source: Israel Social Surveys 2002-2009, Jewish female respondents.
Notes: See notes to Figure 3.

Okun: Fertility and marriage behavior in Israel: Diversity, change, and stability
476 http://demographic-research.org
Finally, Figure 6 presents cohort fertility for secular and non-secular women by
nativity status. For reasons discussed above, we focus our attention on the fertility of
the secular native-born group. We note that the secular native-born group has
experienced statistically significant declines in cohort fertility, but still maintains levels
of cohort fertility above replacement, at the level of 2.3 or so. In all birth cohorts
considered, the CF among secular native-born Jews in Israel is higher than in the U.S.
and nearly every European nation (values are close to those of national populations in
Ireland, Iceland and New Zealand in some cohorts).
Figure 6: Completed or near completed fertility among Jewish women,
by birth cohort, level of religiosity and nativity status
Source: Israel Social Surveys 2002-2009, Jewish female respondents.
Notes: See notes to Figure 3.
4.2.3 Final parity distributions
In all of Europe, the two-child norm has been firmly entrenched for decades, and is very
common for birth cohorts of the 1950s and 1960s, with roughly 40% or more of women
having exactly two children by the end of their reproductive years (Frejka 2008).12
In
the U.S., the mode of two children per woman has also been well established for birth
cohorts from the 1950s and earlier. For example, 34% of the 1962-1966 birth cohort in
12 In spite of this, there are some signs of the incipient decline of the two-child family, with increasing
childlessness and one-child families in some areas (Frejka 2008).

Demographic Research: Volume 28, Article 17
http://demographic-research.org 477
the U.S. have exactly two children (Hamilton and Cosgrove 2010). The analogous
figure for Australia is 38% (Australian Bureau of Statistics 2007).
In Europe, the United States and Australia, the proportion of women at final
parities other than two are much lower than the proportion with exactly two children
(see Breton and Prioux 2009 for a discussion of childlessness and one-child families in
Europe). For example in European cohorts born around 1965, the per cent of women
with exactly one child ranges from a low of about 12% in England and Wales to a high
of 37% in the Russian Federation, with typical values from 15%-25%. In Australia and
the United States, 13% and 19% of women born during 1962-1966 eventually have
exactly one child (Australian Bureau of Statistics 2007; Hamilton and Cosgrove 2010).
Proportions childless among cohorts born around 1965 are also much lower than
proportions with exactly two children. In European cohorts born around 1965, final
proportions childless range from a low of 5% in Portugal to a high of 24% in Italy, with
typical values from 10%-20% (Frejka 2008). In the United States and Australia, values
are within this range, with 15% and 16% of women born during 1962-1966 childless
(Australian Bureau of Statistics 2007; Hamilton and Cosgrove 2010).
At the high-parity end, it has been noted that by the early 1960s birth cohorts, the
prevalence of large families with four or more children had declined greatly in Europe
and the United States, relative to birth cohorts of the 1930s and 1940s. In almost all
cases, proportions of women in the early 1960s birth cohorts with four or more children
did not exceed 20%, with typical values in the range of about 10% to 20% (Frejka and
Sardon 2007). Proportions of the 1965 European birth cohorts with three or more
children ranged from around 10% to 30%. In all cases, the proportions of mid-1960s
European birth cohorts with three or more children are quite a bit lower than analogous
proportions with two children (Frejka 2008). In the United States and Australia, the
proportions of the 1962-1966 birth cohorts with three or more children are on the high
side, at 32.1% and 32.5% (Australian Bureau of Statistics 2007; Hamilton and
Cosgrove 2010). However, even there, the two-child mode is apparent.
A comparison with Israel shows a dramatically different picture. Figures 7-17
present parity distributions and proportions with 7 or more children, for quinquennial
birth cohorts of women in different population subgroups. In many cases (e.g. in
religiosity subgroups), the samples of women born during 1968-1970 were too small to
allow for detailed analysis of final parity distributions, because data was limited to
survey years in 2007 and onwards. Therefore, parity distributions for these cohorts are
not presented here. Numerical values appearing in the figures refer to the proportions of
women with exactly 0, 1, 2, 3 and at least 4 children. The linear segments refer to the
proportions of women in each birth cohort with at least 7 children. When numerical
values at parities 0, 1, 2, 3 or 4+ are smaller than 5 %, they are not indicated on the
graphs. Also, when numerical values of 7+ are small, the lines for 7+ are not indicated.

Okun: Fertility and marriage behavior in Israel: Diversity, change, and stability
478 http://demographic-research.org
Figure 7 presents the figures for all women in Israel. Stability characterizes the
parity distributions of all women, with few large or statistically significant changes over
birth cohorts. In all cohorts, approximately 60% of women have at least three children,
with about 30% having exactly three children, close to a third of the women having at
least four children, and 5-7% having at least seven children. On the lower parity end,
only approximately 25% of women have exactly two children, 10% have exactly one
child, and 5-10% are childless. Thus, women with two or fewer children make up less
than half of each birth cohort, and childlessness and one child families are on the very
low end of the range typical of most developed populations.
In contrast to the overall picture of stability portrayed in Figure 7, Figure 8
documents a very substantial decline over Arab birth cohorts in the proportion with
very large families of seven or more children. This proportion dropped from over 30%
in the 1948-1952 birth cohort to under 10% in the 1963-1967 birth cohort, and the
change is statistically significant. There was also a corresponding drop of about 16
percentage points (77% – 61%) in the proportions with four or more children. Thus,
there was a drop not only at the extremely high parities (7+), but also a shift out of the
moderately high parities (4+) to parities of three and below. In particular, there was a
statistically significant increase in the proportions with exactly three children, and
smaller increases at parities 0, 1 and 2. There is a relatively high level of childlessness
(12%) in the latest cohort of Arab women examined. The level of childlessness here is
higher than in the overall population (Figure 7), despite the generally much higher than
average level of fertility in the Arab population than in the overall population. As will
be discussed below, the relatively high levels of childlessness are related to the
prevalence of non-marriage.
Figure 9, which presents the parity distribution for Muslim women, shows a
similar pattern of change as was seen for all Arab women13
, with a particularly dramatic
drop of roughly 30 percentage points in the proportion with 7 or more children (from
nearly 40% to under 10%). Proportions with 4 or more children declined less
dramatically, by 17 percentage points (from 82% to 65%). The change appears to have
accelerated among the most recent birth cohorts examined. As in the case of all Arab
women, there was a significant increase in the proportion with exactly 3 children, and
smaller increases at parities 0, 1 and 2. We note that the level of childlessness among
Muslims is even higher than among the overall Arab population, and is likely related to
non-marriage. The picture of change for more religious Muslims women is very similar
(Figure 10).
The Jewish population experienced much less cohort change in parity distribution
than the Muslim and overall Arab populations (Figure 11). This finding is consistent
with the rough stability in average parity described above (section 4.2.2). Statistically
13 Recall that Muslim women comprise the largest subgroup within the Arab population.

Demographic Research: Volume 28, Article 17
http://demographic-research.org 479
significant changes occur only at the extremes of the parity distributions, with
counterbalancing increases in the proportions with 7 or more children, and increases in
the proportions with no children. Proportions with 7 or more children increase to over
5% in the last birth cohort examined, and levels of childlessness climb to 7%. In
general, for all birth cohorts, three children is the modal value of completed fertility
(just over 30%), with slightly lower and roughly equal proportions of 25% to 30% each,
at parities 2 and 4+. Thus, compared with most developed societies in recent cohorts,
the Jewish population has extraordinarily high proportions at the moderately high to
high parities (4+), and low proportions childless or with one child.
Turning to Figures 12-16, we note the extraordinary variance in parity distributions
across Jewish subpopulations defined by religiosity. As will be seen, there are clear
distinctions between all religiosity subgroups. For ultra-Orthodox women (Figure 12),
we note the remarkable 30 percentage-point increase in proportions with 7 or more
children (a statistically significant increase from roughly 35% to over 65%). There is
also a large and statistically significant 15 percentage-point increase in the proportions
with 4 or more children, to a high of 96% with at least 4 children in the last birth cohort.
Among religious Jewish women (Figure 13), there is less systematic change, with
a clear majority of women at moderately high to very high parities of four or more
children. An additional 20% to 30% of religious women have exactly three children,
and women with two or fewer children comprise only 15% to 20% in each cohort.
In contrast to religious Jewish women, who showed little sign of systematic cohort
change in final parity distributions, traditional/religious women show clear signs of a
shifting out of very high (7+) and moderately high (4+) parities (Figure 14). We see
some indications of increases in proportions with exactly two or three children, with the
latter change being statistically significant. By the last cohort examined, the three-child
family is clearly numerically dominant.
In contrast to the traditional/religious women, traditional/less-religious women
(Figure 15) have much lower proportions at moderately high and very high parities
(4+), although they are at the very high end compared with most developed populations.
Women with exactly three children make up nearly one-third of the last cohort
examined, and women with three or more children make up more than one-half of the
last cohort. Together with this, there is a statistically significant increase in the
proportion of women with exactly two children.
Secular women (Figure 16) show statistically significant declines in the
proportions with 4 or more children, with fewer than 6% in the last cohort examined.
Together with this, proportions with exactly three children are high and unchanging at
about one-third of all birth cohorts. Similarly, proportions with exactly two children
also make up about one-third. Even in the secular groups, women with one child are
relatively rare (14% in the last cohort), and childlessness is also relatively uncommon,

Okun: Fertility and marriage behavior in Israel: Diversity, change, and stability
480 http://demographic-research.org
although on the rise. Secular Jews in Israel, in contrast with most developed
populations, have a higher proportion at three or more children than at exactly two
children (see also Bystrov 2012). As can be seen in Figure 17, among native-born
secular Jews, there is an even clearer and greater predominance of the three-child norm
than among all secular Jews.
In summary, we see enormous heterogeneity between Muslim and Jewish
populations regarding final parity distributions and trends in parity distributions. In
particular, the Muslim population has higher proportions at the upper end and lower end
of the parity distribution. Muslims in recent birth cohorts have higher proportions with
7 or more children than do analogous Jewish cohorts, although this proportion has
declined greatly in recent cohorts. Muslims also have higher proportions childless than
do Jewish populations. We also document extraordinary differences in final parity
distributions within the Jewish population by level of religiosity. The only notable
commonality among all Jewish religiosity subgroups is in the low levels of
childlessness and one-child families. Only secular Jews have seen small but statistically
significant increases in childlessness, and only native-born secular Jews have seen
statistically significant increases in proportions with exactly one child.
Figure 7: Cumulative parity distribution and percent with 7 or more children:
All women, by birth cohort
Source: Israel Social Surveys 2002-2009, female respondents.
Notes: Women included in the sample were aged 40 and over during the survey year.
* indicates that the per cent is statistically significantly different than in the analogous 1948-1952 cohort, at the 5% level of
significance, according to a Pearson Chi-square test.
'c' indicates that the per cent with 7 or more children is statistically significantly different than in the analogous 1948-1952
cohort, at the 5% level of significance, according to a Pearson Chi-square test.

Demographic Research: Volume 28, Article 17
http://demographic-research.org 481
Figure 8: Cumulative parity distribution and percent with 7 or more children:
Arab women, by birth cohort
Source: Israel Social Surveys 2002-2009, Arab female respondents.
Notes: See notes to Figure 7. Value labels for values smaller than 5% are not shown.
Figure 9: Cumulative parity distribution and percent with 7 or more children:
Arab Muslim women, by birth cohort
Source: Israel Social Surveys 2002-2009, Muslim female respondents.
Notes: See Notes to Figure 8.

Okun: Fertility and marriage behavior in Israel: Diversity, change, and stability
482 http://demographic-research.org
Figure 10: Cumulative parity distribution and percent with 7 or more children:
More religious Arab Muslim women, by birth cohort
Source: Israel Social Surveys 2002-2009, more religious Muslim female respondents.
Notes: See notes to Figure 8. 'a' indicates that birth cohort sample size is less than 100.
Figure 11: Cumulative parity distribution and percent with 7 or more children:
Jewish women, by birth cohort
Source: Israel Social Surveys 2002-2009, Jewish female respondents.
Notes: See Notes to Figure 7.

Demographic Research: Volume 28, Article 17
http://demographic-research.org 483
Figure 12: Cumulative parity distribution and percent with 7 or more children:
Ultra-orthodox Jewish women, by birth cohort
Source: Israel Social Surveys 2002-2009, Jewish Ultra-orthodox female respondents.
Notes: See Notes to Figure 10.
Figure 13: Cumulative parity distribution and percent with 7 or more children:
Religious Jewish women, by birth cohort
Source: Israel Social Surveys 2002-2009, Jewish religious female respondents.
Notes: See Notes to Figure 10.

Okun: Fertility and marriage behavior in Israel: Diversity, change, and stability
484 http://demographic-research.org
Figure 14: Cumulative parity distribution and percent with 7 or more children:
Traditional/religious Jewish women, by birth cohort
Source: Israel Social Surveys 2002-2009, Jewish traditional/religious female respondents.
Notes: See Notes to Figure 8.
Figure 15: Cumulative parity distribution: Traditional/less-religious Jewish
women, by birth cohort
Source: Israel Social Surveys 2002-2009, Jewish traditional/less-religious female respondents.
Notes: Women included in the sample were aged 40 and over during the survey year.
* indicates that the per cent is statistically significantly different than in the analogous 1948-1952 cohort, at the 5% level of
significance, according to a Pearson Chi-square test.
Value labels for values smaller than 5% are not shown.

Demographic Research: Volume 28, Article 17
http://demographic-research.org 485
Figure 16: Cumulative parity distribution: Secular Jewish women, by birth
cohort
Source: Israel Social Surveys 2002-2009, Jewish secular female respondents.
Notes: See Notes to Figure 15.
Figure 17: Cumulative parity distribution: Secular, native-born Jewish women,
by birth cohort
Source: Israel Social Surveys 2002-2009, Jewish secular, native-born female respondents.
Notes: See Notes to Figure 15.

Okun: Fertility and marriage behavior in Israel: Diversity, change, and stability
486 http://demographic-research.org
4.3 Marriage
In this section, we consider two measures of marriage behavior: non-marriage among
older women, and marriage postponement among younger women. Since the vast
majority of childbearing in Israel occurs within marriage, non-marriage among older
women can be associated with childlessness or, perhaps, with the occurrence of one-
child families. Similarly, marriage postponement is often associated with fertility
postponement among women in the childbearing ages. Consistency between marriage
and fertility patterns across population groups will be discussed below, where relevant.
4.3.1 Non-marriage among women aged 40 and over
Non-marriage among cohorts of women aged 40 and over has been on the rise in most
developed societies. For example, in many Northern and Western European countries,
non-marriage began increasing during the 1950s cohorts, and reached levels generally
in the range of 20% - 30% by the 1965 birth cohorts. The decline in marriage started
later in most Southern, Central and Eastern European countries: during the 1960s birth
cohorts, reaching levels of 10-15% in most countries by the 1965 birth cohort (Council
of Europe 2005, pp. 71+). Among the English-speaking overseas populations, figures
were intermediate to those in Europe, and ranged roughly between 15%-20%. For U.S.,
Australian, New Zealand, and Canadian cohorts of 1962-1966, 14.6%, 15.6%, 18.2%,
and 21.5%, respectively, had never been married in 2006 (at ages 40-44) (Australian
Bureau of Statistics no date; Statistics New Zealand 2009; Statistics Canada 2007; U.S.
Census Bureau 2006). Thus, for most European and English-speaking overseas
populations, the figures for non-marriage among those aged 40-44 around the 1965
birth cohort ranged from 10%-30%.
Relative to these figures, the values in Israel are quite low. Figure 18 shows
statistically significant increases in non-marriage across birth cohorts, among all
women aged 40 and over in Israel, although overall levels of non-marriage in cohorts
born in the mid 1960s remain at the very low end (under 8%). Marriage, while clearly
no longer nearly universal among women in Israel, is still a predominant form of
behavior among women born during the 1950s and 1960s. However, as will be seen
below, there is also heterogeneity in the extent of non-marriage.
Non-marriage among Arabs and Muslims, in particular, is more common than
among Jews. Research has suggested that an imbalance in the number of marriage-age
men and women, caused by very high levels of Muslim fertility in the past, coupled
with fairly large age gaps between brides and grooms, may contribute to non-marriage

Demographic Research: Volume 28, Article 17
http://demographic-research.org 487
among Muslim women (Hleihel 2009)14
Because non-marital childbearing is extremely
rare in this subpopulation, we can understand the relatively high levels of childlessness
discussed above (see Figures 8-10), in terms of the high levels of non-marriage.
Although there does appear to be a steady increase in non-marriage among Muslim
cohorts of women, the proportion who have never married by age 40 and over in the
last cohort (11%) is not found to be statistically significantly different than the
analogous proportion in the first cohort (5.5 %), based on the ISS samples.15
Regarding
differences by levels of religiosity, we find small increases in non-marriage among the
more religious Muslim population, and slightly lower levels of non-marriage among the
more religious than among the less religious, but differentials and trends are not found
to be large or statistically significant (Figure not shown but available from author).
Among Jewish women, the increase in non-marriage across cohorts, based on the
ISS samples, is statistically significant (Figure 18), although overall levels of non-
marriage among Jews remain quite low compared to most other developed societies16
.
Also, there are important differences in levels and trends in non-marriage by degree of
religiosity among Jews. Figure 19 shows substantial and statistically significant
increases in non-marriage among secular Jews as compared with rough stability at
lower levels among all other religiosity groups. Among secular Jews, non-marriage
increased to over 13% in the 1963-1967 cohort, whereas levels of non-marriage
remained at or below 5% in all other religiosity groups born at the same time. Thus, the
levels of non-marriage among seculars in the 1963-1967 cohort approach those of
nationally representative cohorts of the mid-1960s in countries such as Italy, Spain, and
Hungary. The significant increase in non-marriage across secular birth cohorts has
occurred among the native-born as well as the foreign-born (Figure not shown, but
available from author). In addition, the increase in non-marriage among secular groups
may be one factor associated with the statistically significant increase in childlessness
among secular Jews, discussed above (see Figures 16 and 17).
14 This suggestion is supported empirically by the extremely low proportions of Muslim men who remain unmarried: fewer than 2% among Muslim men aged 40-44 in 2009, as compared with 13.4% among the
analogous group of women (ICBS 2011). 15 Official statistics, however, do suggest a significant increase in non-marriage among Muslim women, with
8.9% of women aged 40-44 in 1996 never married, as compared with 13.4% among women of the same age
in 2009 (ICBS 1999, 2011) 16 Official statistics also show increases in non-marriage among Jews, with 6.1% never married, among women aged 40-44 in 1996, and 9.2% never-married among the analogous age group of women in 2009
(ICBS, 1999, 2011).

Okun: Fertility and marriage behavior in Israel: Diversity, change, and stability
488 http://demographic-research.org
Figure 18: Percent never married (%) among women aged 40 and over, by birth
cohort, nationality and religion
Source: Israel Social Surveys 2002-2009, female respondents.
Notes: Women included in the sample were aged 40 and over during the survey year.
* indicates that the percent never married is statistically significantly different than in the analogous 1948-1952 cohort, at the
5% level of significance, according to a Pearson Chi-square test.
Figure 19: Percent never married (%) among Jewish women aged 40 and over,
by birth cohort and level of religiosity
Source: Israel Social Surveys 2002-2009, Jewish female respondents.
Notes: See Notes to Figure 18. 'a' indicates that birth cohort sample size is less than 100.
Significant changes were found only among seculars. Percent never married among the religious and the traditional are
between 1.7% and 5.2%.

Demographic Research: Volume 28, Article 17
http://demographic-research.org 489
4.3.2 Marriage postponement among young adults
Marriage postponement has been an indicator of family change in many developed
societies over the last several decades (e.g. Lesthaeghe 2010; Sobotka and Toulemon
2008). Even in England and Wales, where the proportion of the adult population who
are married is one of the highest in Europe, 83.4% of women and 89.6% of men aged
20-29 in 2010 had never married (Office for National Statistics 2011). Although the
analogous figures in Australia, New Zealand, and Canada in 2006 are a bit lower, with
about 75% and 85% of women and men unmarried at ages 20-29, a very large majority
of young women and men in those countries have never married (Australian Bureau of
Statistics no date; Statistics Canada no date; Statistics New Zealand 2012b).17
Proportions never married are lower in the United States, with 62.2% of young women
and 73.0% of young men (aged 20-29) never married in 2006 (U.S. Census Bureau
2006).
Figure 20 reports proportions never married among women and men aged 20-29,
by sex and period, for all Arabs, Muslims, Jews and for the overall population in
Israel.18
The figure reports proportions never married in the sub-periods 2002-2005 and
2006-2009. Despite statistically significant increases over time, proportions never
married at ages 20-29 remain generally low relative to the national populations
mentioned above. For example, in the later sub-period, only 59% of all women and
63.5% of Jewish women remained never married. Differences across population
subgroups are very large among women, with much lower proportions never married
among Arab and Muslim women – 38.3% and 35.0%, respectively in the latter period.
Although Arab and Muslim women have lower levels of never marrying among
younger women (20-29), they have higher levels of non-marriage among older women
(aged 40+) than do Jewish women (see Section 4.3.1).
Proportions never married among all men aged 20-29 are also rather low, although
they are increasing and are roughly at U.S. levels in the latter sub-period. In contrast to
the case of women, there is little difference across population subgroups in proportions
never married among men.
A closer inspection of the marriage behavior of young Muslim women and men
reveals differences across population subgroups defined by level of religiosity, with less
religious women and men having higher levels of proportions never married than more
religious women and men. Less religious men also showed statistically significant
increases in never-marriage over the sub-periods (Figure 21).
17 Proportions never-married among persons aged 20-29 are 75.2% for women and 84.8% for men in
Australia; 77.6% for women and 85.3% for men in New Zealand; and 77.4% for women and 86.4% for men
in Canada. 18 The data do not allow us to ascertain age at first marriage for all ever-married adults, because there is
incomplete information regarding the timing of first marriage for persons no longer in their first marriage.

Okun: Fertility and marriage behavior in Israel: Diversity, change, and stability
490 http://demographic-research.org
Religiosity differentials tend to be even larger among young Jewish men and
women, particularly the contrast with the ultra-Orthodox and religious groups (Figure
22) (see also Bystrov 2012). While young religious and ultra-Orthodox women and men
have very low proportions never married, the traditional and secular groups have
proportions never married that are closer to those in the United States or other countries
mentioned above. All groups experienced increases in proportions never married,
although not all increases are statistically significant, and the broad religiosity
differentials are retained. These documented increases in proportions never married at
ages 20-29 are likely to be associated with the postponement of the first birth in recent
birth cohorts among seculars and both groups of traditional Jews (see Table 2). There
was a particularly large increase in proportions never married among
traditional/religious Jewish women, whose behavior in the later sub-period resembles
that of traditional/less-religious women. Overall, there is a consistent ordering in terms
of religiosity, such that the proportions never married increase as the level of religiosity
declines. Proportions never married by religiosity and nativity status indicate that there
were increases in marriage postponement for both secular groups, although increases
were statistically significant only among native-born secular women (Figure not shown,
but available from author).
Figure 20: Percent never married (%) among women and men aged 20-29, by
period, nationality and religion
Source: Israel Social Surveys 2002-2009, male and female respondents.
Notes: * indicates that the percent never married is statistically significantly different than in the 2002-2005 period, at the 5% level of
significance, according to a Pearson Chi-square test.

Demographic Research: Volume 28, Article 17
http://demographic-research.org 491
Figure 21: Percent never married (%) among Muslim women and men aged 20-
29, by period and level of religiosity
Source: Israel Social Surveys 2002-2009, Muslim male and female respondents.
Notes: See Notes to Figure 20.
Figure 22: Percent never married (%) among Jewish women and men aged 20-
29, by period and level of religiosity
Source: Israel Social Surveys 2002-2009, Jewish male and female respondents.
Notes: See Notes to Figure 20.

Okun: Fertility and marriage behavior in Israel: Diversity, change, and stability
492 http://demographic-research.org
5. Summary and discussion
This paper documents trends and differentials in fertility and marriage behavior among
population subgroups in Israel. In this section, we highlight findings that are worthy of
further research.
In terms of cohort fertility behavior, we document a dramatic fertility decline
among Muslim and Arab cohorts of women born from the late 1940s/early 1950s to the
late 1960s. For Muslims – the largest population subgroup among Arabs – cohort
fertility has declined from 6.1 births per woman to about 3.7 births per woman. This
decline in fertility among Muslim women appears to be the continuation of a fertility
transition, the first signs of which were detected some 30 years ago (Friedlander,
Eisenbach and Goldscheider 1979). We show that the recent decline occurred among
more religious as well as less religious Muslim women. In contrast, there has been little
change over the analogous birth cohorts among Jews, who maintain a fairly constant
level of completed fertility around 3.1. Thus, large differences between Muslims and
Jews in the level of cohort completed fertility have been greatly reduced. Further
research is needed to understand better the causes of dramatic decline in Muslim cohort
fertility.
We also point out the distinct trends that have characterized period and cohort
fertility among Muslims. While period total fertility rates between the late 1980s and
the early 2000s were nearly stagnant at a level of 4.6 (ICBS, various years), cohort
fertility declined steadily for cohorts who were in the prime childbearing years during
these periods. It may be that, as a result of fertility advancement, period fertility has
declined less than cohort fertility. However, we cannot make firm conclusions from the
data presented here because the trends in terms of fertility advancement (see Table 2)
refer to later birth cohorts than do the trends in cohort completed fertility (see Figures 3
and 4). This puzzle in patterns of Muslim period and cohort fertility is an important
topic for future research in the area of fertility transition and marriage behavior.
Future research should also examine factors underlying reductions in age at first
birth among Muslim women. We also note that the fertility advancement among
Muslim women contrasts with fertility postponement among secular and traditional
Jewish women, and to a lesser extent among religious Jewish women.
We also document differences among Muslims and Jews in fertility variations by
level of religiosity. While cohort fertility among Muslims does differ by level of
religiosity, fertility variation by religiosity is greater and more consistent across time
among Jews (see also Hleihel 2011). Differential trends in cohort completed parity are
also striking, with increasing proportions of ultra-Orthodox women having at least 7
children, while increasing proportions of secular Jewish women are childless. The
documentation of these large religiosity differentials in cohort fertility sets the stage for

Demographic Research: Volume 28, Article 17
http://demographic-research.org 493
future research, which can explore the roles of religion and religiosity in explaining
fertility in Israel. Such research on religiosity in Israel could also help to shed light on
our understanding of the role of religion and religiosity in a variety of contexts outside
Israel (Adsera 2006; Frejka and Westoff 2008; McQuillan 2004; Zhang 2008).
In contrast to many affluent national populations in Europe, N. America, Oceania
and parts of Asia, where cohort fertility in 1960s birth cohorts is just at or somewhat
below replacement levels, nearly all population subgroups examined here have above-
replacement cohort fertility. Even secular Jews in Israel maintain replacement-level
cohort fertility, and native-born secular Jews are at above-replacement levels (with a
modal family size of three). The only group which has dipped to below-replacement
levels in the most recent cohort is that of foreign-born secular women, most of whom
arrived from the FSU, and experienced low levels of childbearing abroad and in Israel
(Okun and Kagya 2012). The relatively high levels of completed fertility among native-
born secular Jews is remarkable, especially given the fact that secular Jews show signs
of SDT behavior, including marriage and fertility postponement, increasing
childlessness, and increasing non-marriage and cohabitation (see also Bystrov 2012).
Other religiosity groups do not show all of these same trends. We note that, despite
secular Jews having a typical pattern of SDT fertility delay and recuperation, their total
fertility was higher throughout the periods examined, and remains above that of nearly
all other OECD populations (Frejka and Sobotka 2008). Future research could usefully
explore factors associated with high levels of cohort fertility among secular native-born
Jews in Israel, despite some indicators of their incipient SDT.
Many other issues may be explored in the laboratory that is Israel's demographic
mosaic. For example, one issue revolves around the higher levels of childlessness and
non-marriage among Muslims than among Jews, despite what might be expected based
on the much higher levels of cohort completed fertility among the former than among
the latter. Another important and related issue for further investigation is the nature of
the changing interrelationships between marriage and fertility behavior in Israel, in
various population subgroups. It is also worth emphasizing the low levels of
childlessness among all Jews, even among secular Jews, although there has been some
increase in childlessness and non-marriage among seculars in the most recent cohorts
examined. Finally, another fascinating pattern worthy of future research is the
temporary increase in ultra-Orthodox cohort fertility to the extraordinarily high level of
8.0 in the birth cohort of the mid-1960s.
We end with some consideration of the limitations of the study. Due to sample size
limitations, we could not explore the family demographic behavior of the numerically
small Christian Arab and Druze populations, and other subpopulations. Similarly,
because of data limitations of the Social Surveys, we could not get at direct information
on age at marriage. In addition, because of a lack of suitable data, we could not present

Okun: Fertility and marriage behavior in Israel: Diversity, change, and stability
494 http://demographic-research.org
information on divorce behavior or non-marital fertility behavior. Overall, however, we
feel that the study has helped to fill gaps in our knowledge regarding cohort and period
changes in basic family demographic measures for important social groups in Israel.
The figures we present regarding fertility and marriage behavior for nationality,
religion, religiosity and nativity status groups cannot be derived from any other
available source. The information we present is important to our understanding of
population dynamics in Israel, and sets the stage for related future demographic
research, which is relevant for Israel, as well as for contexts outside Israel.
6. Acknowledgements
This research was supported by The Israel Science Foundation (grant no. 939/11), and
by the Levi Eshkol Fund of the Hebrew University of Jerusalem. The author also
acknowledges the assistance of the Israel Social Science Data Archive and the Israel
Central Bureau of Statistics in making the data accessible. In addition, the author would
like to thank Itay Cohen, Avital Manor, Shlomit Kagya and Carla Friedman for research
assistance, and Dov Friedlander and Guy Stecklov for useful discussions regarding the
paper. The author gratefully acknowledges the very helpful comments and suggestions
made by the journal editors and referees. Finally, the author would like to thank
participants at the 'Contentious Politics and Society' Seminar Series at Florida Atlantic
University, where a previous version of this paper was presented.

Demographic Research: Volume 28, Article 17
http://demographic-research.org 495
References
Adsera, A. (2006). Marital fertility and religion in Spain, 1985 and 1999. Population
Studies 60(2): 205-221. doi:10.1080/00324720600684817.
Atrash, A. (2010). Fertility, religiosity and Moslem women's labor force participation in
Israel. [PhD thesis]. Jerusalem: The Hebrew University of Jerusalem, Faculty of
Social Sciences.
Atrash, A. and Schellekens, J. (2011). Religiosity and marital fertility among Israeli
Muslims. Paper presented at the 2011 Meetings of the Population Association of
America, Washington D.C., March 31 - April 2 2011.
Australian Bureau of Statistics (2007). Births. Canberra: Australian Bureau of Statistics.
www.ausstats.abs.gov.au/ausstats/subscriber.nsf/0/0C4C341C51104DC4CA257
3800015C2DC/$File/33010_2006.pdf.
Australian Bureau of Statistics (2011). Births, Australia, 2010 Completed Fertility.
Canberra: Australian Bureau of Statistics. www.abs.gov.au/ausstats/
[email protected]/Products/0D54B8B21636942FCA25793300167530?opendocument#.
Australian Bureau of Statistics (No date). Registered marital status by age by sex –
times series statistics. Canberra: Australian Bureau of Statistics.
www.censusdata.abs.gov.au
Ben-Rafael, E. and Sharot, S. (1991). Ethnicity, Religion, and Class in Israeli Society.
Cambridge: Cambridge University Press.
Bernstein, D. (1976). The Black Panthers of Israel. [PhD thesis]. Sussex: University of
Sussex.
Breton, D. and Prioux, F. (2009). The one-child family: France in the European context.
Demographic Research 20(27): 657-692. doi:10.4054/DemRes.2009.20.27.
Bystrov, E. (2012). The second demographic transition in Israel: One for all?
Demographic Research 27(10): 261-298. doi:10.4054/DemRes.2012.27.10.
Council of Europe (2005). Recent demographic developments in Europe 2005.
Strasbourg: Council of Europe Publishing.
Frejka, T. (2008). Overview chapter 2: Parity distribution and completed family size in
Europe: Incipient decline of the two-child family model. Demographic Research
19(4): 47-72. doi:10.4054/DemRes.2008.19.4.

Okun: Fertility and marriage behavior in Israel: Diversity, change, and stability
496 http://demographic-research.org
Frejka, T. and Sardon, J.-P. (2007). Cohort birth order, parity progression ratio and
parity distribution trends in developed countries. Demographic Research 16(11):
315-374. doi:10.4054/DemRes.2007.16.11.
Frejka, T. and Sobotka, T. (2008). Overview chapter 1: Fertility in Europe: Diverse,
delayed and below replacement. Demographic Research 19(3): 15-46.
doi:10.4054/DemRes.2008.19.3.
Frejka, T. and Westoff, C.F. (2008). Religion, religiousness and fertility in the US and
in Europe. European Journal of Population 24(1): 5-31. doi:10.1007/s10680-
007-9121-y.
Friedlander, D. (1975). Mass immigration and population dynamics in Israel.
Demography 12(4): 581-599. doi:10.2307/2060715.
Friedlander, D., Eisenbach, Z., and Goldscheider, C. (1979). Modernization patterns
and fertility change: The Arab populations of Israel and the Israel-administered
territories. Population Studies 33(2): 239-254. doi:10.1080/00324728.1979.
10410440.
Friedlander, D. and Feldmann, C. (1993). The modern shift to below-replacement
fertility: Has Israel’s population joined the process? Population Studies 47(2):
295-306. doi:10.1080/0032472031000147026.
Friedlander, D. and Goldscheider, C. (1979). The Population of Israel. New York:
Columbia University Press.
Friedlander, D., Okun B.S., Ben-Moshe, E., and Hliehel, A. (2010). Stalls, resistance
and classic patterns in demographic transition: Variations among major
population groups in Israel. Paper presented at the 2010 Quetelet Seminar,
Louvain-la-Neuve, Belgium, November 2010.
Friedman, M. (1991). The Haredi (Ultra-Orthodox) Society – Sources, Trends and
Processes. Jerusalem: The Jerusalem Institute for Israel Studies.
Goldberg, A.I., Oigenblick, L., and Kirschenbaum, A. (2001). The family link to
migration: Soviet immigrants to Israel. In: Dellapergola, S. and Even, J. (eds.).
Papers in Jewish demography 1997. Jerusalem: The Hebrew University of
Jerusalem: 181-198.
Goldscheider, C. and Friedlander, D. (1986). Reproductive norms in Israel. In:
Schmelz, U.O. and Nathan, G. (eds.). Studies in the population of Israel, in
honor of Roberto Bachi, Volume XXX. Jerusalem: Magnes Press, The Hebrew
University: 15-35.

Demographic Research: Volume 28, Article 17
http://demographic-research.org 497
Goldscheider, F.K. and Fisher, Z. (1989). Household structure and living alone in
Israel. In: Goldscheider, F.K. and Goldscheider, C. (eds.). Ethnicity and the new
family economy: Living arrangements and intergenerational financial flows.
Boulder, CO: Westview Press: 147-161.
Goldstein, J.R., Sobotka, T., and Jasilioniene, A. (2009). The end of "lowest-low"
fertility? Population and Development Review 35(4): 663-699.
doi:10.1111/j.1728-4457.2009.00304.x.
González, A.L. (2011). Measuring religiosity in a majority Muslim context: Gender,
religious salience, and religious experience among Kuwaiti college students – A
research note. Journal for the Scientific Study of Religion 50(2): 339-350.
doi:10.1111/j.1468-5906.2011.01571.x.
Haidar, A. (ed.). (2005). Arab society in Israel: Populations, society, economy.
Jerusalem and Tel Aviv: The Van Leer Jerusalem Institute and Hakibbutz
Hameuhad. (in Hebrew).
Hamilton, B.E. and Cosgrove, C.M. (2010). Distribution of women, by parity, exact
age, and race of women in selected groups of cohorts from 1912-1916 through
1987-1991: United States, 1961-2006, Table 7. Hyattsville, MD: National Center
for Health Statistics. http://www.cdc.gov/nchs/nvss/cohort_fertility_tables.htm.
Hleihel, A. (2009). Relationships between social, cultural and economic factors and
marriage patterns: Consanguineous marriage and marriage within and across
localities among Moslems in North Israel. [PhD Thesis]. Jerusalem: The Hebrew
University of Jerusalem, Faculty of Social Sciences.
Hleihel, A. (2011). Fertility among Jewish and Muslim women in Israel, by level of
religiosity, 1979-2009. Jerusalem: Israel Central Bureau of Statistics. (ICBS
Working Paper Series 60). (in Hebrew).
ICBS (2009). Statistical Abstract 2008. Jerusalem: Israel Central Bureau of Statistics.
ICBS (2010). Press Release: Social Survey 2009 - Religiosity in Israel - Characteristics
of different groups. Jerusalem: Israel Central Bureau of Statistics.
http://www1.cbs.gov.il/reader/newhodaot/hodaa_template.html?hodaa=2010191
01. (in Hebrew).
ICBS (2011). Statistical Abstract 2010. Jerusalem: Israel Central Bureau of Statistics.
ICBS (2011). Findings of the Social Survey 2009. Jerusalem: Israel Central Bureau of
Statistics. http://www1.cbs.gov.il/publications11/seker_hevrati09/pdf/t13.pdf
ICBS (2012). Statistical Abstract 2011. Jerusalem: Israel Central Bureau of Statistics.

Okun: Fertility and marriage behavior in Israel: Diversity, change, and stability
498 http://demographic-research.org
ICBS (various years). Statistical Abstracts. Jerusalem: Israel Central Bureau of
Statistics.
Lesthaeghe, R. (2010). The unfolding story of the second demographic transition.
Population and Development Review 36(2): 211–251. doi:10.1111/j.1728-
4457.2010.00328.x.
Mandel, H. and Semyonov, M. (2006). A welfare state paradox: State interventions and
women’s employment opportunities in 22 countries. American Journal of
Sociology 111(6): 1910–1949.
McQuillan, K. (2004). When does religion influence fertility? Population and
Development Review 30(1): 25-56. doi:10.1111/j.1728-4457.2004.00002.x.
Myrskylä, M., Goldstein, J.R., and Cheng, Y-H.A. (2012). New cohort fertility
forecasts for the developed world. Rostock: Max Planck Institute for
Demographic Research. (MPIDGR Working Paper WP 2012-014).
Nahmias, P. (2004). Fertility behaviour of recent immigrants in Israel: A comparative
analysis of immigrants from Ethiopia and the former Soviet Union.
Demographic Research 10(4): 83-120. doi:10.4054/DemRes.2004.10.4.
Nahmias, P. and Stecklov, G. (2007). The dynamics of fertility amongst Palestinians in
Israel from 1980 to 2000. European Journal of Population 23(1): 71-99.
doi:10.1007/s10680-006-9113-3.
OECD (2011). Education at a Glance. Paris: OECD. www.oecd.org/dataoecd/61/47/
48630299.pdf.
Office for National Statistics (2011). Population estimates by marital status - Mid 2010.
London: Office for National Statistics. (Statistical Bulletin).
Okun, B.S. and Kagya, S. (2012). Fertility change among post-1989 immigrants to
Israel from the former Soviet Union. International Migration Review: 46(4):
792-827. doi:10.1111/imre.12001.
Okun, B.S. and Khait-Marelly, O. (2008). Demographic behaviour of adults of mixed
ethnic ancestry: Jews in Israel. Ethnic and Racial Studies: 31(8): 1357-1380.
doi:10.1080/01419870701719071.
Raz-Yurovich, L. (2011). Divorce penalty or divorce premium? A longitudinal analysis
of the consequences of divorce for men's and women's economic activity.
European Sociological Review: doi:10.1093/esr/jcr073.

Demographic Research: Volume 28, Article 17
http://demographic-research.org 499
Schellekens, J. and Eisenbach, Z. (2010). Religiosity and marital fertility: Israeli Arab
Muslims, 1955-1972. Journal of Family History 35(2): 147-163. doi:10.1177/
0363199009357157.
Sobotka, T. and Toulemon, L. (2008). Overview chapter 4: Changing family and
partnership behaviour: Common trends and persistent diversity across Europe.
Demographic Research 19(6): 85-138. doi:10.4054/DemRes.2008.19.6.
Statistics Canada. (2007). Data tabulation. Ottawa: Statistics Canada. www12.statcan.
gc.ca/census-recensement/2006/dp-pd/tbt/index-eng.cfm.
Statistics New Zealand. (2009). Measuring Fertility. Wellington, NZ: Statistics New
Zealand. www.stats.govt.nz/browse_for_stats/people_and_communities/women/
measuring-fertility.aspx.
Statistics New Zealand. (2012). Demographic Trends 2011, Births. Wellington, NZ:
Statistics New Zealand. www.stats.govt.nz/browse_for_stats/population/births/
births-tables.aspx.
United States Census Bureau. (2006) American community service. Sex by marital
status by age for the population 15 years and over. Washington, DC: US Census
Bureau. factfinder2.census.gov/faces/tableservices/jsf/pages/productview.
xhtml?pid=ACS_06_EST_B12002&prodType=table.
Zhang, L. (2008). Religious affiliation, religiosity, and male and female fertility.
Demographic Research 18(8): 233-262. doi:10.4054/DemRes.2008.18.8.

Okun: Fertility and marriage behavior in Israel: Diversity, change, and stability
500 http://demographic-research.org
Appendix
A1: TFR of Muslim women between 1979-2009, by level of religiosity
Very Religious Religious Less Religious All
1979-1983 5.66 6.25 5.49 5.99
1980-1984 5.51 6.05 5.36 5.80
1981-1985 5.77 5.67 5.15 5.52
1982-1986 5.22 5.50 5.07 5.25
1983-1987 4.98 5.22 4.79 4.97
1984-1988 4.73 4.87 4.90 4.71
1985-1989 4.65 4.75 4.44 4.55
1986-1990 4.35 4.87 4.76 4.64
1987-1991 4.42 4.92 4.76 4.67
1988-1992 4.68 4.97 4.40 4.70
1989-1993 4.73 5.22 4.08 4.84
1990-1994 4.85 5.16 4.22 4.84
1991-1995 4.78 5.02 3.97 4.69
1992-1996 4.84 4.95 3.97 4.67
1993-1997 4.60 4.88 3.86 4.59
1994-1998 4.79 4.84 3.91 4.59
1995-1999 4.49 4.71 3.83 4.45
1996-2000 4.71 4.73 4.00 4.53
1997-2001 4.47 4.74 4.29 4.57
1998-2002 4.37 4.78 4.23 4.56
1999-2003 4.44 4.75 4.24 4.56
2000-2004 4.70 4.84 4.18 4.62
2001-2005 4.37 4.67 4.03 4.44
2002-2006 4.29 4.50 3.64 4.21
2003-2007 4.06 4.24 3.72 4.05
2004-2008 3.47 4.04 3.57 3.83
2005-2009 2.78 3.83 3.47 3.62
Notes: Data for Figure 1.
Source: Hleihel (2011).

Demographic Research: Volume 28, Article 17
http://demographic-research.org 501
A2: TFR of Jewish women between 1979-2009, by level of religiosity
Ultra-
Orthodox Religious
Traditional/
religious
Traditional/
less-
religious
Secular All
1979-1981 5.62 3.71 3.45 2.65 2.35 2.94
1880-1982 5.96 3.60 3.34 2.60 2.36 2.93
1981-1983 6.20 3.53 3.36 2.65 2.27 2.91
1982-1984 6.67 3.37 3.21 2.61 2.26 2.89
1983-1985 6.47 3.50 3.32 2.65 2.24 2.91
1984-1986 6.43 3.77 3.31 2.68 2.21 2.95
1985-1987 6.38 3.88 3.44 2.58 2.21 2.95
1986-1988 6.82 3.78 3.31 2.47 2.10 2.89
1987-1989 6.73 3.63 3.10 2.46 1.98 2.80
1988-1990 7.09 3.77 2.89 2.51 1.84 2.76
1989-1991 7.09 3.73 2.86 2.46 1.69 2.66
1990-1992 7.16 3.66 2.83 2.33 1.72 2.63
1991-1993 7.10 3.49 2.79 2.27 1.68 2.56
1992-1994 7.04 3.51 2.85 2.22 1.79 2.60
1993-1995 6.77 3.56 2.70 2.17 1.73 2.52
1994-1996 6.84 3.58 2.76 2.15 1.72 2.53
1995-1997 6.68 3.67 2.69 2.17 1.73 2.53
1996-1998 6.97 3.78 2.85 2.23 1.78 2.62
1997-1999 6.88 3.77 2.69 2.28 1.87 2.66
1998-2000 7.24 3.90 2.71 2.31 1.90 2.73
1999-2001 7.25 3.72 2.67 2.24 1.89 2.70
2000-2002 7.37 3.60 2.70 2.22 1.85 2.69
2001-2003 7.31 3.68 2.63 2.16 1.82 2.67
2002-2004 7.54 4.11 2.65 2.31 1.90 2.83
2003-2005 7.62 4.33 2.74 2.23 1.92 2.88
2004-2006 7.51 4.34 2.69 2.21 2.04 2.93
2005-2007 7.02 4.28 2.63 2.18 2.10 2.91
2006-2008 6.86 4.13 2.54 2.22 2.11 2.92
2007-2009 6.53 4.26 2.58 2.26 2.07 2.91
Notes: Data for Figure 2.
Source: Hleihel (2011).

Okun: Fertility and marriage behavior in Israel: Diversity, change, and stability
502 http://demographic-research.org
A3: Sample sizes for women, by birth cohort, nationality and religion
Jewish Arab Muslim All
1948-1952 2,181 168 116 2,458
1953-1957 2,204 253 188 2,546
1958-1962 2,090 309 229 2,534
1963-1967 730 152 120 927
1968-1970 493 112 89 637
Total 7,698 994 742 9,102
Source: Israel Social Surveys, 2002-2009.
Notes: Sample sizes for Figures 3,7,8,9, and 18.
A4: Sample sizes for Muslim women, by birth cohort and level of
religiosity
Less religious More religious All
1948-1952 18 98 116
1953-1957 31 157 188
1958-1962 50 179 229
1963-1967 45 75 120
1968-1970 27 62 89
Total 171 571 742
Source: Israel Social Surveys, 2002-2009.
Notes: Sample sizes for Figures 4 and10.
A5: Sample sizes for Jewish women, by birth cohort and level of
religiosity
Ultra-
Orthodox Religious
Traditional/
Religious
Traditional/
less-religious Secular All
1948-1952 95 179 322 615 970 2,181
1953-1957 128 197 309 628 942 2,204
1958-1962 135 189 337 546 883 2,090
1963-1967 46 75 109 201 299 730
1968-1970 38 32 61 136 226 493
Total 442 672 1,138 2,126 3,320 7,698
Source: Israel Social Surveys, 2002-2009.
Notes: Sample sizes for Figures 5,11,12,13,14,15,16, and 19.

Demographic Research: Volume 28, Article 17
http://demographic-research.org 503
A6: Sample sizes for Jewish women, by birth cohort, level of religiosity
and nativity status
Non-Secular
Native Born
Non-Secular
Foreign Born
Secular
Native Born
Secular
Foreign Born All
1948-1952 468 743 480 490 2,181
1953-1957 675 587 512 430 2,204
1958-1962 759 448 522 361 2,090
1963-1967 315 116 203 96 730
1968-1970 208 59 151 75 493
Total 2,425 1,953 1,868 1,452 7,698
Source: Israel Social Surveys, 2002-2009.
Notes: Sample sizes for Figures 6 and 17.
A7: Sample sizes for women and men aged 20-29, by period, nationality
and religion
2002-2005 2006-2009
Men Women Men Women
Jewish 2,748 2,804 2,628 2,558
Arab 559 543 512 548
Muslim 424 417 399 424
All* 3,410 3,460 3,230 3,213
Source: Israel Social Surveys, 2002-2009.
Notes: Sample sizes for Figure 20.
* Includes a small number of respondents who are neither Jewish nor Arab. See text for details.
A8: Sample sizes for Muslim women and men aged 20-29, by period and
level of religiosity
2002-2005 2006-2009
Men Women Men Women
Less Religious 215 132 252 177
More Religious 209 285 147 247
All 424 417 399 424
Source: Israel Social Surveys, 2002-2009.
Notes: Sample sizes for Figure 21.

Okun: Fertility and marriage behavior in Israel: Diversity, change, and stability
504 http://demographic-research.org
A9: Sample sizes for Jewish women and men aged 20-29, by period and
level of religiosity
2002-2005 2006-2009
Men Women Men Women
Ultra-Orthodox 253 297 326 335
Religious 244 262 279 287
Traditional-Religious 292 271 310 314
Traditional/less-religious 669 670 623 568
Secular 1,290 1,304 1,090 1,054
All 2,748 2,804 2,628 2,558
Notes: Sample sizes for Figure 22.
Source: Israel Social Surveys, 2002-2009.