FERTILISER ASSOCIATION OF IRELAND
53
FERTILISER ASSOCIATION OF IRELAND Proceedings of Spring Scientific Meeting 2017 7 th February 2017 Horse and Jockey, Thurles, Co. Tipperary Publication No. 52 Contents Soil Fertility and Management on Heavy Soils Programme Farms ................................ 3 Ger Courtney 1 , James O’Loughlin 2 and David P. Wall 3 1 Teagasc, Cleeney, Killarney, Co Kerry. 2 Teagasc, Moorepark, Fermoy, Co. Cork. 3 Teagasc, Johnstown Castle, Co. Wexford. Optimising Nitrogen Inputs for Cereals .......................................................................... 17 Richie Hackett Teagasc, Oak Park Research Centre, Carlow. Updating Nutrient Recommendations for Irish farms ................................................... 33 David P. Wall and Mark Plunkett Teagasc, Johnstown Castle, Co. Wexford.
Transcript of FERTILISER ASSOCIATION OF IRELAND
FERTILISER ASSOCIATION OF IRELAND
Proceedings of Spring Scientific Meeting 2017
7th February 2017
Horse and Jockey, Thurles, Co. Tipperary
Publication No. 52
Contents
Soil Fertility and Management on Heavy Soils Programme Farms ................................ 3
Ger Courtney1, James O’Loughlin2 and David P. Wall3
1Teagasc, Cleeney, Killarney, Co Kerry.
2Teagasc, Moorepark, Fermoy, Co. Cork.
3Teagasc, Johnstown Castle, Co. Wexford.
Optimising Nitrogen Inputs for Cereals .......................................................................... 17
Richie Hackett
Teagasc, Oak Park Research Centre, Carlow.
Updating Nutrient Recommendations for Irish farms ................................................... 33
David P. Wall and Mark Plunkett
Teagasc, Johnstown Castle, Co. Wexford.

2

3
Soil Fertility and Management on Heavy Soils
Programme Farms
Ger Courtney1, James O’Loughlin2 and David P. Wall3
1Teagasc, Cleeney, Killarney, Co Kerry. 2Teagasc, Moorepark, Fermoy, Co. Cork.
3Teagasc, Johnstown Castle, Co. Wexford.
Introduction
There has been a notable decline in soil fertility nationally and the impact is even
more serious on farms with heavy soil types. On heavy soils, there is the potential
to increase annual grass production by 30% where soil pH, phosphorus (P) and
potassium (K) status is optimised. Seven dairy farms farming on ‘heavy’ soil types
are participating in a monitoring and development programme and contributing key
data on farm performance. The farms are deemed ‘heavy’ (i.e. predominately clay
mineral soils) located in high rainfall areas of the South West of Ireland.
Heavy Soils Programme (HSP) farm profiles
There is significant variation within the HSP farms in terms of annual rainfall, clay
content, topography/elevation and aspect. These greatly influence the grass growth
& utilisation pattern.
Individual farms have limitations to a greater or lesser extent. However, what is
common to all the farmers is that their management is always flexible and
opportunistic in optimising grazed grass in their systems.
- The Doonbeg farm can become saturated very quickly but is in a lower
rainfall location compared to other farms.
- The Athea farm is North facing, elevated, and is particularly vulnerable to
cold NW winds and prolonged periods of dull/drizzly weather even in
summer.
- The Listowel farm has 40% of paddocks with a peat soil type, is very low
lying, and has lower rainfall than the average.
- The Kiskeam farm has the highest rainfall (c. 1600 mm/annum) and both
Kiskeam & Castleisland have high content of very impermeable clay in the
soil. Kiskeam also has some steep ground.
- The Macroom farm has high elevation with stony sub-surface.
- The Rossmore, Co Tipperary farm has heavy clay soils in lower rainfall area.
The soils have lower aluminium (Al) and iron (Fe) contents than other farms
in the programme.

4
Changes in soil fertility 2013-2016
It has been firmly established in research that soil pH must be corrected as a first
step in the overall improvement of soil fertility status.
HSP farms embarked on a programme of soil fertility improvement in 2010. The
low soil pH was due in part to a trend of low usage of lime nationally with higher
nitrogen (N) usage masking the impact of low pH on grass growth. Fertiliser plans
prepared in 2013 indicated a lime requirement of, on average, 90 tonnes of ground
limestone per annum. A comprehensive soil testing programme takes place across
all the heavy soils farms in December each year. The impact of these lime
applications over time on the soil pH across the milking block area of the HSP
farms is summarised in Table 1.
Table 1. Soil fertility status summary across the milking block on the seven farms in
the Heavy Soils Programme from 2014 to 2016.
Average soil pH has increased from 5.8 to 6.3. All of the seven farms showed a pH
increase. The farms continued to focus on applying lime in 2016 to bring all
paddocks to target pH of 6.3. No noticeable change in soil trafficability has been
observed by the farmers largely due to quantities applied being limited to 2 t/acre
(5 t/ha) in any one application.
Average fertiliser costs in 2015 were 3.3 c/l on the heavy soils farms, with lime
accounting for 0.42 c/l of that cost. Phosphorus status increased on four farms and
decreased on three farms (Kiskeam, Doonbeg and Listowel). Higher offtake issues
combined with high fixation capacity remain the key factors militating against
improved P status on these farms. Potassium status remained static between 2015
and 2016 with only two farms recording an improvement in K status. Higher K
offtake issues will be discussed later in this paper.
Lime and loss through drainage/rainfall losses
The HSP farms are in high rainfall areas. Therefore, lime losses are estimated to be
high, at up to 625 kg/ha/year. This equates to a loss through drainage alone of 1.2
t/acre over a five-year period. In addition, lime required to counteract acidity from
Chemical N use and loss in milk/meat means a maintenance requirement of 2
tonnes/acre every five years is required on these farms. In effect, any lime applied
in 2011-2014 was only keeping pace with the maintenance requirement and was
not having an impact on lifting farm soil pH.
Year 2014 2015 2016
Average soil pH 5.8 6.1 6.3
Phosphorus (P) (mg/l) 7.2 5.9 5.8
Potassium (K) (mg/l) 123 102 102

5
Timing of lime application
The experience of the HSP farms shows that lime can be applied at any time of
year when ground conditions are suitable. Outside of the normal application peaks
at reseeding and late Autumn, monthly lime usage statistics suggest that very little
lime is applied in the Spring. April can be an ideal time to apply lime when ground
is well grazed out. June/July is another suitable time after silage has been harvested
or as surplus bales are taken out (stubble available) and when ground conditions
are good for spreading.
Impact of lime application observed on HSP farms.
- Paddocks that were at soil pH 5.5 on HSP farms in 2013 and are now at soil
pH 6.3 and grew an additional 2 t/ha of grass DM in 2016.
- Farms that are now at target pH notice a much faster response to applied
fertilisers. When soil temperatures are good, paddocks are easily achieving
the 21 day pre-grazing target cover of 1500 kg/ha of grass DM. This have
taken 26-28 days to achieve previously. This has led to more surplus silage
of high quality being harvested during the main growing season, which gives
a significant boost to the winter feed supply - an invaluable resource on
farms with heavy soils and longer winters!
- In 2016, the Athea farm had an average soil pH of 6.5. As well as supporting
a Dairy herd stocking rate of 2.5 cows/ha, the farm also produced an
additional 70 t of silage DM in the form of 390 surplus bales of silage
equivalent to 10 bales/ha (almost 4 bales per cow). The farm grew 11.4 t/ha
and utilised 9 t/ha of grass DM.
- Paddocks are better grazed out by the herd and palatability of grass has
improved.
- Grass has a better root structure, better tillering and less open swards.
- Good progress is being made in increasing soil pH up to target. The
challenge for these farms is to put a strategy in place to maintain lime status
in the years ahead.
- Farmers aware of the risk of excessive lime use reducing soil trafficability
have split the lime applications over time. (max. 2 tonnes per single
application). This has worked well for building soil pH without negatively
affecting soil structure.
- Summary financial analysis of lime application on the HSP farms is included
in Appendix 1.

6
Building P and K status on HSP farms
Phosphorus (P)
In the past, many heavy soils would have received only low amounts of P
fertilisers, at or below maintenance requirement rates. Heavy soils also tend to have
high P fixation characteristics. Therefore, building soil P status on heavy clay soils
can be a slow process. These soils are P hungry and have high capacity to fix
applied Phosphorus. In many cases, attempts to increase the productivity of these
soils must account for the fact that the P sponge/sump in the soil may effectively be
empty.
The increased fixation that occurs at low soil pH is an additional complication that
occurs on all mineral soils but is more easily remedied by lifting soil pH to target
6.3. The real soil P dividend that comes from being at target soil pH will only come
over time when P inputs become sufficient and the P demand of the soil itself is
satisfied as well as the P offtake of the grass crop (i.e. as the P reading reaches 5 to
6 mg/l, the P supply of the soil itself increases provide the pH is correct).
Building the P status on heavy clay soils is a long-term project. On the HSP farms
progress is being made, but over a 5-7 year time frame. With offtakes of over
500,000 litres of milk from each farm and significant silage surpluses also being
taken, it can be challenging to build P status.
Information is vital and farms should be soil tested at least every two years while
building soil fertility.
Potassium (K)
Potassium status and usage has suffered due to the link with P in compound
fertilisers. This combined with high rainfall has hit K status, especially on lighter
soils, where K leaching can be higher than on heavier soils. Potassium is also
cheaper than P so an easier problem to fix on grazing ground (ideally apply from
July onwards) but needs more focus on silage ground where K offtakes are higher.
Each tonne of grass dry matter harvested as surplus silage is removing 25 kg of K.
Typical surpluses of six bales/ha will remove 30 kg/ha of K.
Slurry is the primary source of K on the HSP farms. However, dilute slurry may
only contain 15 units/1000 gallons of K. This must be borne in mind in meeting the
full K requirement of the crop. Slippage in K status continues on some farms.
The first step in building soil fertility on the HSP farms is to maximise the usage of
slurry, where possible, on low Index soils. Annual soil testing provides great
information on the paddocks that need additional nutrients. The slurry contribution
to total nutrient supply is significant (see Table 2). Slurry supplies 12 kg/ha of P,
which is 32% of the total P input. The slurry contribution of 92 kg/ha of K is the
7
equivalent of 66% of total K input on these farms. The K content of slurry can be
highly variable, depending on dilution, and care must be taken to ensure full crop
requirement is applied to avoid soil Index falling quickly and reducing production.
Tools are available to establish slurry dry matter percentage.
Table 2. Slurry contribution to total available nutrient (N, P and K) supply on the
HSP farms (kg/ha).
N P K
14 12 92
Weather conditions in the Spring of 2016 were not conducive to slurry application
on heavy clay soils. After a heavy winters rainfall, these soil types were close to
saturation during the spring and the risk of runoff was significant if large quantities
of slurry were applied. The % of slurry applied in Spring varied from less than 20%
of total slurry in the Kerry farms to over 50% in the Macroom farm. The
development of low ground pressure umbilical systems is helping to get
significantly more slurry spread in the Spring period. However, the HSP farms are
cautious to avoid any runoff risk, particularly in steep terrain where nutrients could
potentially be lost if conditions were not suitable for heavy slurry applications.
Experience with fertiliser use on HSP farms
Apply P little and often to low P Index soils
It is clear that at very low soil P status (low Index 1), P applied as either fertiliser
or slurry is only available to the growing plant for a short time (i.e. less than 2
months). To counteract the impact this is having on grass production, a planned
approach is required to fertiliser application on the HSP farms that ensures a steady
supply of P fertiliser across the growing season.
Fertiliser application strategy on the grazing platform
In addition to targeting slurry application to the available grazing area by 1st April
adequate fertiliser application is crucial to kick start grass growth.
The planned approach on the HSP farms has been to firstly apply straight nitrogen
in urea form as soon as ground conditions allow. They target 60 units of N applied
in two splits before 1st April with additional N in the compound fertiliser bringing
total N application on the grazing area to 100 units/acre applied by 1st May.
Compound fertilisers containing N, P and K are applied from mid-March to early
April in the second or third fertiliser application with a target of applying half of
the annual P requirement before 1st May (e.g. if P allowance is 3 bags/acre of
18:6:12, then ensure that 1.5 bags/acre is applied to all grazing ground by 1st May.
The balance of PK compound is applied in the late July/August period.

8
Fertiliser response
Overall chemical fertiliser input on the HSP farms is shown in Table 3. The farms
are applying the full chemical P allowance allowed in their nutrient management
plans (NMP) for nitrates regulations (average of 25 kg/ha/farm of chemical P). The
HSP farms have seen huge variation in fertiliser response across their farms
because of variations in soil type and fertility status within the paddocks. In spring,
the heavier clay soil paddocks are colder and are slow to respond until the first P
application. Indeed, at any stage these colder clay soils appear to need a continuous
drip feed of P fertiliser to achieve good grass growth response. This was very
noticeable in April, July and Aug/Sept in 2016. During these periods, after wet dull
conditions, application of NPK compound fertiliser gave a better response than
straight nitrogen applications, regardless of the P status of the paddock or extent of
previous P applications. In the case of low Index soils, care must be taken to ensure
that the P and K contents of compounds used are high enough to build as well as
maintain fertility status.
Table 3. Average application rates of chemical fertiliser (N, P and K) on the HSP
farms (kg/ha).
N P K
234 25 47
Where some poaching took place in the previous grazing, the use of compound
fertiliser combined with a lower pre-grazing cover (1,200 kg/ha) gave better
tillering and recovery of the ryegrass in the sward.
Table 4 Grass Production on HSP Farms in 2016.
Grass Production
(t/ha of DM)
Farm
(location)
Milking
block
(ha)
Date of first
measurement
No. of
measurements Total
1/12
to
10/4
11/4
to
10/8
11/8
to
30/11
Doonbeg 36.8 13/01/16 36 12.1 0.2 8.3 3.6
Athea 39.3 03/02/16 42 11.4 0.6 7.3 3.5
Kiskeam 42.1 14/02/16 23 9.2 0.2 6.0 3.1
Castleisland 41.7 12/03/16 28 11.6 0.2 7.4 4.0
Listowel 31.3 29/01/16 22 11.1 0.4 7.5 3.1
Macroom 55.8 11/02/16 25 11.8 0.35 7.66 3.8
Rossmore 31.3 01/01/16 28 12.7 0.42 7.69 4.62
Average 39.8 02/02/2016 29 11.4 0.3 7.4 3.7
Grass Production in the HSP farms (Table 4) was variable in 2016. Average growth
recorded was 11.4 t/ha of grass DM, a slight increase in the 11.2 t/ha recorded in
9
2015. Baseline grass growth on these farms in 2011 was 10 t/ha. The trend on
average grass production on the HSP farms over time is shown in Figure 1.
Spring growth was very poor due to many soils being waterlogged until late April
2016. Overall recorded spring production was only 0.3 t/ha of grass DM compared
to 0.6 t/ha recorded in spring 2015. Midseason growth was quite good across the
Region with 7.4 t/ha grown up to 10th Aug. This was 0.5 t/ha higher than the
corresponding period in 2015. Autumn growth at 3.7 t/ha was the same as 2015.
Figure 1. Trend in the average annual grass DM production on HSP farms.
Ryegrass content
The HSP farms (milking block area) have been scored for ryegrass ground cover
for five years (Figure 2). To optimise grass production, ground cover should be 40-
50% ryegrass. The HSP farms have remained at approximately 30% or below. The
level of re-seeding is dependent on weather conditions. Very little re-seeding was
done in 2016 and there was none in 2014. It is interesting that our new farms in
Cavan and Monaghan coming into the programme have higher ryegrass scores
(39% and 44%) and coincidentally also have the best soil fertility status.
Figure 2. Percentage of perennial ryegrass grazed swards on HSP farms over time.
10.0
6.8
8.9
11.0 11.2 11.4
0.0
2.0
4.0
6.0
8.0
10.0
12.0
2011 2012 2013 2014 2015 2016
An
nu
al
Gra
ss
Pro
du
cti
on
(t/
ha)
18%
29% 29%32%
26%
0%
5%
10%
15%
20%
25%
30%
35%
2012 2013 2014 2015 2016
% R
yeg
rass i
n
Sw
ard
s
10
Focus on maximising Mid-Season Grass Growth
The HSP Farms run a moderate stocking rate across the mid-season period (Figure
3). The target is to fully feed the herd on a grass diet and take out surpluses on a
regular basis based on grass measurement data from a regular grass measurement
walk.
Average grass demand during the period 25th April to 27th Sept 2016 was 46
kg/ha/day equivalent to a stocking rate of 3 cows/ha. The herd demand compared
to average grass growth of 66 kg/ha/day during the 5 month period is shown in
Figure 3.
Figure 3. Grass Demand (Solid line) compared with Grass Growth (dotted line)
between 25th April and 27th September in 2016 on HSP Farms.
These farms are focused on maximising grass intake so average concentrates fed
during that key 5 month period averaged 1.7 kg/cow/day with July concentrate
feeding restricted to 0.8 kg/cow/day.
The high grass intake is reflected in average milk protein for the period of 3.53%
and milk solids averaging 1.7 kg/cow/day peaking at 2 kg/cow/day and remaining
at that level for the four weeks in May 2016.
Harvesting surplus grass as high quality baled silage is a key strategy adopted by
the HSP farms. This high quality feed is fed back to the herd during periods of poor
grass utilisation and in the shoulders when high quality forage is required by the
milking herd. However, the nutrient offtake is significantly higher when the grass
crop is removed as silage.
0
20
40
60
80
100
120
25
-Apr
02
-May
09
-May
16
-May
23
-May
30
-May
06
-Jun
13
-Jun
20
-Jun
27
-Jun
04
-Jul
11
-Jul
18
-Jul
25
-Jul
01
-Aug
08
-Aug
15
-Aug
22
-Aug
29
-Aug
05
-Sep
12
-Sep
19
-Sep
26
-Sep
Gra
ss G
row
th R
ate
/G
rass D
em
an
d(k
g/h
a/d
ay)
11
Prioritise the paddocks within the farm that will give biggest response in
terms of grass production.
Annual grass measurement has taken place on these farms since 2011 and very
strong farm information has been generated. While average grass grown is an
important measure for any farm, it is the knowledge of individual paddock
performance over time that drives good farm investment decisions.
Each of the HSP farms has variation within their farms in key factors such as soil
quality, ryegrass content, stock carrying capacity, drainage and elevation.
The first priority is to ensure that the paddocks with better soil type are quickly
brought up to target pH and soil Index 3 for P & and K. On HSP farms, this
strategy is bringing these paddocks quickly up to average annual production of c.
13 t/ha of grass DM. A middle group of paddocks may have a potential to grow 10
t/ha of DM and these generally have high clay content and take longer to build
fertility.
Finally, all farms have poorer quality paddocks with poor grass species, poor
drainage and poor soil fertility. Such paddocks are contributing 4-6 t/ha of DM
each year. These paddocks require more intensive investment, which should only
be undertaken when soil fertility/ryegrass content issues are corrected in the rest of
the farm.
Prioritise farm spending - apply your annual P allowance
Improving soil pH by on-going lime application and applying your full chemical P
allowance are both good long term investments for your farm. All aspects of the
annual running cost of over €1000 per cow need to be evaluated in terms of impact
on farm profitability and return on investment.
On a grassland farm where high grass production is critical to farm profitability
prioritise spend on fertiliser requirement in a difficult milk price year. Apply at
least maintenance P in a poor milk price year like 2016 and on heavy clay soils at
least a third more.
HSP farms are focused on grass
Many Profit monitors in 2015/16 show a higher spend on purchased concentrate
than on fertiliser. A feature of farms that are highly grass focused is that feed costs
per litre are almost always less than fertiliser cost per litre (e.g. feed 2.5 c/l with
fertiliser at 3.5 c/litre).
The silage reserve built up since 2013 is a key feature of the HSP farms system. On
average the HSP farms maintain a silage reserve of 0.45 t/cow of silage DM or a
25% reserve.

12
Growing and using grass on HSP farms
Overall cornerstones of maximising the potential of grass in the HSP Dairy system
include:
- Silage Reserve
- Compact Calving
- Flexible Approach to Grazing
- Introducing high quality silage when grazing conditions deteriorate
- Grazing infrastructure: paddock access and spur roads are vital
Seasonally, the following targets are prioritised on HSP farms:
Autumn:
- Start building grass cover from 10th Aug onwards
- Peak farm cover target – 1,000 kg/ha DM
- Start closing paddocks in late September
- Have at least 80% by 31st Oct
- Closing cover target: 650 kg/ha DM
Spring:
- Mean calving date target: 29th February
- Graze 50% of the platform before 17th March
- Graze 100% of the platform before 10th April
- Use on-off grazing to minimise soil damage
- Apply 60 units/acre of N fertiliser by 1st April (2 splits)
- Apply 100 units/acre of N fertiliser by 1st May
Summer:
- Whole milking block available for cows only
- Measure grass every 5 days
- 18 – 21 day grazing rotation
- Maintain grass DM cover at 180-200 kg/cow
- Surplus target: make 2.5 bales/cow on the milking platform

13
Farm financial performance on HSP farms
There has been a steady increase in the financial performance of the HSP farms as
stocking rate and milk output have increased while cost structure has been
maintained. The net margin per dairy hectare averaged €1377/ha in the period
2011-2015 (Figure 4), with milk price volatility largely responsible for the
variation in margin from year to year. This level of profitability is in line with high
performing farms on drier soil types.
Figure 4. Net Margin per hectare on HSP farms from 2011 to 2015.
However, the HSP farms are cautious of increasing overall stocking rate (Table 5)
in the milking block due to the increased risk to the business. However, as grass
growth production improves, gradual increases in stocking rate are occurring.
Table 5. Evolution of herd size and stocking rate from 2012 to 2015 on HSP farms.
Herd size
(milking cows)
Stocking Rate
(LU/Ha)
Whole Farm Milking Block
2011 82 1.69 2.25
2012 85 1.71 2.27
2013 86 1.68 2.31
2014 90 1.78 2.37
2015 92 1.81 2.45
€1,580
€1,007
€1,370
€1,700
€1,227
0
250
500
750
1000
1250
1500
1750
2000
2011 2012 2013 2014 2015
Net
Marg
in p
er
Dair
y h
ecta
re (
€/h
a)
14
Summary messages from HSP experience
- Do a comprehensive soil test of all paddocks at least every two years.
- Correct lime deficiency based on lime requirement. On heavy soils limit
lime application to 2 t/acre (5 t/ha) in any single application.
- As a guide, where average soil pH on the farm is below 5.8, apply 1 tonne of
ground limestone per cow in the herd in year 1.
- Use your soil results to set up a fertiliser plan and know the total amount of
P fertiliser you are allowed to apply. New nutrient management plans will
have colour coded maps indicating the paddocks with low Indices for P and
K or high lime requirements.
- The use of the low ground pressure umbilical and trailing shoe systems of
slurry spreading have revolutionised the ability of HSP farms to get more
slurry spread in the spring time. However, great care must be exercised to
avoid runoff losses from heavy soils, especially when saturated or
waterlogged.
- Apply P fertiliser on a little and often basis - split your P allowance to apply
50% in spring and remainder in the summer period.
- Prioritise lime and fertiliser spending above other lower return costs.
15
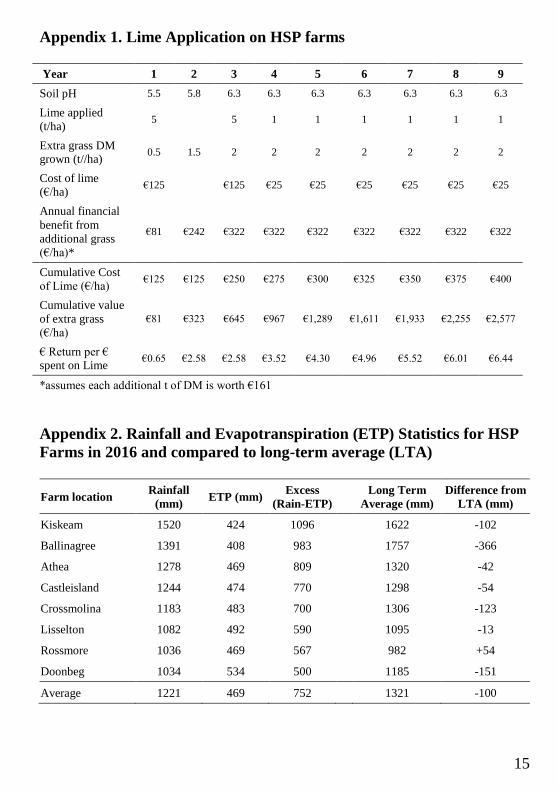
Appendix 1. Lime Application on HSP farms
Year 1 2 3 4 5 6 7 8 9
Soil pH 5.5 5.8 6.3 6.3 6.3 6.3 6.3 6.3 6.3
Lime applied
(t/ha) 5
5 1 1 1 1 1 1
Extra grass DM grown (t//ha)
0.5 1.5 2 2 2 2 2 2 2
Cost of lime
(€/ha) €125
€125 €25 €25 €25 €25 €25 €25
Annual financial
benefit from
additional grass
(€/ha)*
€81 €242 €322 €322 €322 €322 €322 €322 €322
Cumulative Cost
of Lime (€/ha) €125 €125 €250 €275 €300 €325 €350 €375 €400
Cumulative value
of extra grass
(€/ha)
€81 €323 €645 €967 €1,289 €1,611 €1,933 €2,255 €2,577
€ Return per € spent on Lime
€0.65 €2.58 €2.58 €3.52 €4.30 €4.96 €5.52 €6.01 €6.44
*assumes each additional t of DM is worth €161
Appendix 2. Rainfall and Evapotranspiration (ETP) Statistics for HSP
Farms in 2016 and compared to long-term average (LTA)
Farm location Rainfall
(mm) ETP (mm)
Excess
(Rain-ETP)
Long Term
Average (mm) Difference from
LTA (mm)
Kiskeam 1520 424 1096
1622 -102
Ballinagree 1391 408 983
1757 -366
Athea 1278 469 809
1320 -42
Castleisland 1244 474 770
1298 -54
Crossmolina 1183 483 700
1306 -123
Lisselton 1082 492 590
1095 -13
Rossmore 1036 469 567
982 +54
Doonbeg 1034 534 500
1185 -151
Average 1221 469 752
1321 -100

16
17
Optimising Nitrogen Inputs for Cereals
Richie Hackett
Teagasc, Oak Park Research Centre, Carlow.
Introduction
Fertilizer nitrogen (N) is one of the largest input costs for cereal production in
Ireland. Hence, from an economic viewpoint, it is imperative that it is used as
efficiently as possible. However, within the soil/crop system nitrogen is essentially
a ‘leaky’ nutrient that is subject to several loss processes that can have negative
environmental consequences. Nitrogen can be lost from the soil/crop system in
many forms including nitrous oxide, a potent greenhouse gas, nitrate, which can
cause issues in ground and estuarine waters and ammonia. This ‘leaky’ nature of
nitrogen makes the process of achieving high efficiency of use of fertilizer N
challenging, but essential if the environment is to be protected.
Efficient use of fertilizer N entails achieving good recovery of the applied N by the
crop from the soil and subsequently achieving high crop productivity, in terms of
grain yield, per unit of recovered N. While these processes can be affected by a
range of soil and environmental factors the key decisions at farm level that will
impact on these processes are the quantity and timing of N that is applied to the
crop as well as the form of nitrogen applied.
Theoretical considerations
A key requirement of an efficient fertilizer N strategy is to ensure that there is
sufficient available N present in the soil to satisfy the crops requirements through
the season and that large excesses of available N are avoided. Therefore, a
knowledge of the uptake pattern of cereals is an important prerequisite for
determining fertilizer strategies. A typical pattern of N uptake by a crop is
presented in Figure 1 (green line). Cereals have low requirements for nitrogen
during the very early stages of growth since the amount of green area being
produced, the main driver of N requirement, is relatively small. The rate of N
uptake increases very considerably once the crop enters the stem elongation phase
because of a large increase in the rate of green leaf area production. Typically, up
to 75% of total N accumulated in the crop at harvest will be accumulated after
GS30. Therefore, it is essential that sufficient N is available to the crop during this
period.

18
Figure 1. Diagrammatic illustration of the seasonal pattern of total N uptake (green
line) and N acquired from soil (red line) by a cereal crop. Dashed lines indicate the
variation that can occur in both total N uptake and soil N supply. Blue lines indicate
the effect of this variation on the amount of N that must be supplied by fertilizer.
The total amount of N (from both soil and fertilizer) that a crop will accumulate
over its lifetime will be influenced by the yield level and the N content (protein
content) of that yield. Both are variable although there tends to be an inverse
relationship between the two i.e. as yield goes up N content of the grain (protein
content) tends to decrease due to a dilution effect. A key problem is that there is
often not a well-defined relationship between yield level and total accumulated N
i.e. for a given yield the total amount of N accumulated is not constant. For
example, a wheat crop with a grain yield of 10 t/ha that has a protein content of
12% (2.1% N) would have a total N content in the grain of 210 kg/ha whereas if
the same crop had a protein content of 8% (1.4 % N) the total N content of the
grain would only be 140 kg/ha. This indicates that using yield to determine the
crop N requirement has limitations. However, as will be shown later, while yield is
not a necessarily a good indicator of the total amount of N that a crop will
accumulate it can be used to adjust the economic optimum fertilizer N rate for
crops. Obviously as well as the N that is in the grain there will be N in the straw
also. The amount of N in the straw tends to be relatively constant relative to what is
in the grain. Typically, at harvest, there is 25 kg/ha of N in the straw for every 75
kg/ha of N in the grain.
Not all N in the crop originates from fertilizer N; crops acquire a proportion of
their nitrogen from the soil. Generally during the very early stages of growth the
soil will supply sufficient N to meet the crops needs, which will be low, and often
there will be little effect of applied fertilizers visible in the crop. The length of this
tillering GS30
GS32
GS37
GS59
GS71 GS91
Cro
p N
co
nte
nt
Time
Total Crop N
Crop N from soil
N from fertiliser

19
period will depend on how much N is in the soil and how quickly the crop is
growing. For an autumn sown cereal crop, which will be growing relatively slowly
and will not enter the nitrogen demanding stem elongation phase until spring, there
is normally sufficient available N in the soil, either residual fertilizer N from the
previous crop or N mineralized from soil organic N, to meet the crops demands
over the winter period. Hence autumn sown cereals rarely respond to autumn
applied fertilizer N, in terms of grain yield, and such applications are not
recommended. For spring sown cereals, the duration of the period that the crops’ N
needs will be satisfied by soil N is much shorter. Available soil N in the spring in
the upper soil layer, which the young cereal plant will be exploiting, under Irish
conditions is likely to be nearly always much lower than in autumn due to
downwards movement of the available N over the winter period in drainage water.
In addition, the spring crop will be emerging at a time when day length, radiation
intensity and temperature are increasing and hence the crop will enter the period of
rapid growth at a much younger age than a winter crop. Therefore, spring crops can
respond to N applied at or before sowing in some cases, and in any case, will
require fertilizer N application soon after emergence if N has not already been
applied at sowing.
Soil N supply will be affected by a large range of factors including previous
cropping history, organic matter content, soil type and overwinter rainfall as well
as soil conditions that affect N mineralization (temperature and moisture). Thus,
soil N supply is very variable between fields and even within fields. Currently the
soil N Index is used to alter fertilizer N advice based on the potential of the soil to
supply N but this is a relatively crude system and doesn’t take many factors that
can affect soil N supply into account. In other European countries, mineral N
content in the soil to a depth of 90 cm measured in spring before significant crop
growth is sometimes used to indicate the potential of soils at different sites to
supply N. This has shown some promise in improving estimates of soil N supply
under our conditions. However, this is a laborious and potentially expensive
measurement and is unlikely to gain widespread commercial acceptance. More
precise estimates of soil N supply have the potential to considerably improve the
accuracy of fertilizer N recommendations but considerably more research is
required to identify suitable methods under our conditions.
The total amount of N that a crop must acquire from fertilizer is the difference
between the amount that the crop requires and the amount that the soil can supply.
However, as is illustrated in Figure 1, there can be considerable variability in both
the total amount of N that a crop will accumulate and the soil N supply. This
variability can occur between different sites within a season, between the same site
in different seasons and even for a single site in a single season. Kindred et al.
(2015), working in the UK, found that within a single field the crop demand for N
and soil N supply could vary by over 100 kg/ha which resulted in variation in the
optimum fertilizer N rate for different parts of that field of over 100 kg/ha. This

20
illustrates the difficulty in determining accurate estimates of how much N a crop
must recover from applied fertilizer N.
Even if we knew exactly how much N a crop needed to recover from applied
fertilizer N we still would not know exactly how much fertilizer N to apply. This is
because fertilizer N is not recovered with 100 % efficiency by cereal crops.
Recovery of fertilizer by cereal crops can typically range from 40-70 % although in
practice many crops will have recovery rates in the range 50-60 % i.e. for every
100 kg/ha of N applied as fertilizer a crop will recover 50-60 kg/ha of that N. This
can have a significant effect on the amount of fertilizer N required to meet crop
demand. For example, where a crop needs to accumulate 100 kg/ha of N from
applied fertilizer N a recovery rate of 70% would mean that 143 kg/ha of fertilizer
N needs to be applied so that the crop will accumulate 100 kg/ha of N (143 x 0.7)
into its tissues. However, if the recovery rate is only 40% the fertilizer N
requirement would be 250 kg/ha of N. Many factors affect how efficiently a crop
recovers N. Any factor that negatively affects rooting will tend to reduce N uptake
so factors such as compaction and root disease will reduce fertilizer recovery.
There is little evidence to date to suggest that this value can be predicted with any
degree of certainty under our climatic conditions.
Variability in optimum N
It can be seen from the preceding paragraphs why the biggest challenge with N
management in crops is to accurately estimate the amount of fertilizer N that will
maximize the return on investment in fertilizer N for the grower, the economic
optimum N rate (Nopt), for any crop at the time of fertilizer application. This is
because Nopt can vary considerably even on sites that might be expected to have
similar responses to N. An example of the level of variation in Nopt that can occur
between sites can be seen in Figure 2 which presents data on the response of spring
barley to fertilizer N at a range of sites where the supply of N to the crop from the
soil would be expected to be low (Index 1) and which might be expected to have a
similar response to N. While some of this variation can be explained by differences
in yield and soil N supply between sites, a significant proportion of the variation
remains unexplained. As mentioned earlier as well as there being considerable
variation in optimum N between sites with similar characteristics there is a growing
body of work that suggests that the optimum rate of fertilizer N varies quite
substantially even within fields (Kindred et al. 2015).
21
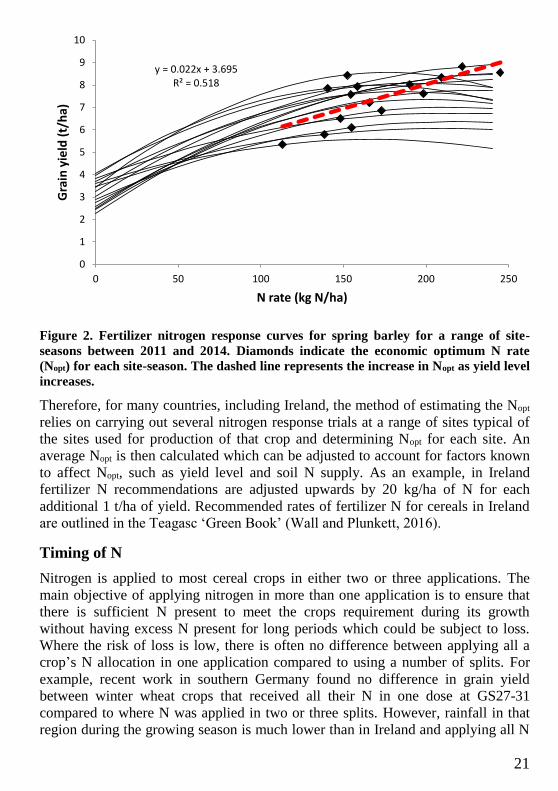
Figure 2. Fertilizer nitrogen response curves for spring barley for a range of site-
seasons between 2011 and 2014. Diamonds indicate the economic optimum N rate
(Nopt) for each site-season. The dashed line represents the increase in Nopt as yield level
increases.
Therefore, for many countries, including Ireland, the method of estimating the Nopt
relies on carrying out several nitrogen response trials at a range of sites typical of
the sites used for production of that crop and determining Nopt for each site. An
average Nopt is then calculated which can be adjusted to account for factors known
to affect Nopt, such as yield level and soil N supply. As an example, in Ireland
fertilizer N recommendations are adjusted upwards by 20 kg/ha of N for each
additional 1 t/ha of yield. Recommended rates of fertilizer N for cereals in Ireland
are outlined in the Teagasc ‘Green Book’ (Wall and Plunkett, 2016).
Timing of N
Nitrogen is applied to most cereal crops in either two or three applications. The
main objective of applying nitrogen in more than one application is to ensure that
there is sufficient N present to meet the crops requirement during its growth
without having excess N present for long periods which could be subject to loss.
Where the risk of loss is low, there is often no difference between applying all a
crop’s N allocation in one application compared to using a number of splits. For
example, recent work in southern Germany found no difference in grain yield
between winter wheat crops that received all their N in one dose at GS27-31
compared to where N was applied in two or three splits. However, rainfall in that
region during the growing season is much lower than in Ireland and applying all N
y = 0.022x + 3.695R² = 0.518
0
1
2
3
4
5
6
7
8
9
10
0 50 100 150 200 250
Gra
in y
ield
(t/
ha)
N rate (kg N/ha)
22
in one dose under Irish conditions, particularly where more than 100 kg N is to be
applied, could expose the N to a high risk of loss because of high rainfall after
application.
Since, as indicated in Figure 1, the highest rates of uptake occur during stem
extension the largest doses will be applied during the early stages of stem extension
to ensure sufficient amounts of N are available to the crop during this period.
Research has shown that there is considerable flexibility in the timing and splitting
of fertilizer N for cereal crops as will be outlined in the following sections.
Winter wheat
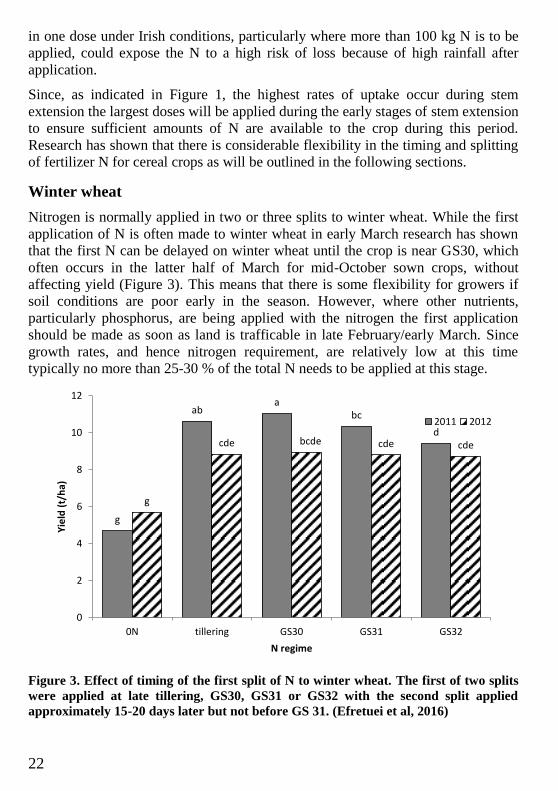
Nitrogen is normally applied in two or three splits to winter wheat. While the first
application of N is often made to winter wheat in early March research has shown
that the first N can be delayed on winter wheat until the crop is near GS30, which
often occurs in the latter half of March for mid-October sown crops, without
affecting yield (Figure 3). This means that there is some flexibility for growers if
soil conditions are poor early in the season. However, where other nutrients,
particularly phosphorus, are being applied with the nitrogen the first application
should be made as soon as land is trafficable in late February/early March. Since
growth rates, and hence nitrogen requirement, are relatively low at this time
typically no more than 25-30 % of the total N needs to be applied at this stage.
Figure 3. Effect of timing of the first split of N to winter wheat. The first of two splits
were applied at late tillering, GS30, GS31 or GS32 with the second split applied
approximately 15-20 days later but not before GS 31. (Efretuei et al, 2016)
g
aba
bc
d
g
cde bcde cde cde
0
2
4
6
8
10
12
0N tillering GS30 GS31 GS32
Yie
ld (
t/h
a)
N regime
2011 2012
23
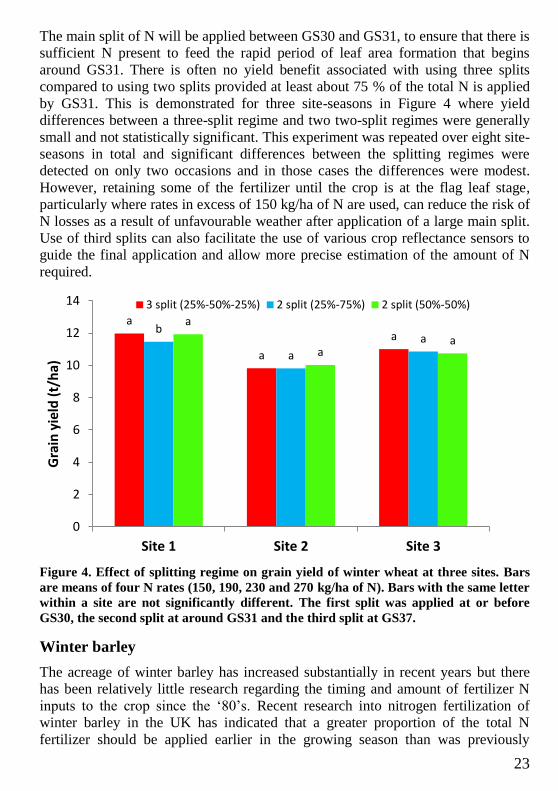
The main split of N will be applied between GS30 and GS31, to ensure that there is
sufficient N present to feed the rapid period of leaf area formation that begins
around GS31. There is often no yield benefit associated with using three splits
compared to using two splits provided at least about 75 % of the total N is applied
by GS31. This is demonstrated for three site-seasons in Figure 4 where yield
differences between a three-split regime and two two-split regimes were generally
small and not statistically significant. This experiment was repeated over eight site-
seasons in total and significant differences between the splitting regimes were
detected on only two occasions and in those cases the differences were modest.
However, retaining some of the fertilizer until the crop is at the flag leaf stage,
particularly where rates in excess of 150 kg/ha of N are used, can reduce the risk of
N losses as a result of unfavourable weather after application of a large main split.
Use of third splits can also facilitate the use of various crop reflectance sensors to
guide the final application and allow more precise estimation of the amount of N
required.
Figure 4. Effect of splitting regime on grain yield of winter wheat at three sites. Bars
are means of four N rates (150, 190, 230 and 270 kg/ha of N). Bars with the same letter
within a site are not significantly different. The first split was applied at or before
GS30, the second split at around GS31 and the third split at GS37.
Winter barley
The acreage of winter barley has increased substantially in recent years but there
has been relatively little research regarding the timing and amount of fertilizer N
inputs to the crop since the ‘80’s. Recent research into nitrogen fertilization of
winter barley in the UK has indicated that a greater proportion of the total N
fertilizer should be applied earlier in the growing season than was previously
a
a
ab
a
a
a
aa
0
2
4
6
8
10
12
14
Site 1 Site 2 Site 3
Gra
in y
ield
(t/
ha)
3 split (25%-50%-25%) 2 split (25%-75%) 2 split (50%-50%)
24
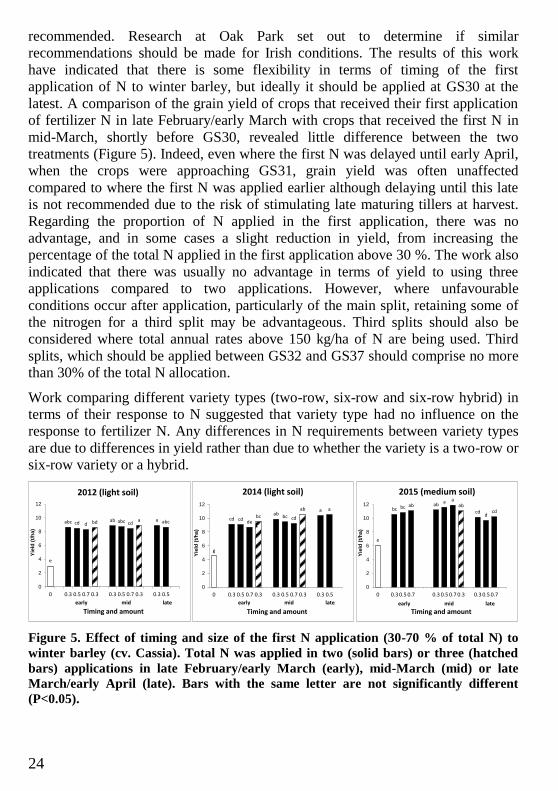
recommended. Research at Oak Park set out to determine if similar
recommendations should be made for Irish conditions. The results of this work
have indicated that there is some flexibility in terms of timing of the first
application of N to winter barley, but ideally it should be applied at GS30 at the
latest. A comparison of the grain yield of crops that received their first application
of fertilizer N in late February/early March with crops that received the first N in
mid-March, shortly before GS30, revealed little difference between the two
treatments (Figure 5). Indeed, even where the first N was delayed until early April,
when the crops were approaching GS31, grain yield was often unaffected
compared to where the first N was applied earlier although delaying until this late
is not recommended due to the risk of stimulating late maturing tillers at harvest.
Regarding the proportion of N applied in the first application, there was no
advantage, and in some cases a slight reduction in yield, from increasing the
percentage of the total N applied in the first application above 30 %. The work also
indicated that there was usually no advantage in terms of yield to using three
applications compared to two applications. However, where unfavourable
conditions occur after application, particularly of the main split, retaining some of
the nitrogen for a third split may be advantageous. Third splits should also be
considered where total annual rates above 150 kg/ha of N are being used. Third
splits, which should be applied between GS32 and GS37 should comprise no more
than 30% of the total N allocation.
Work comparing different variety types (two-row, six-row and six-row hybrid) in
terms of their response to N suggested that variety type had no influence on the
response to fertilizer N. Any differences in N requirements between variety types
are due to differences in yield rather than due to whether the variety is a two-row or
six-row variety or a hybrid.
Figure 5. Effect of timing and size of the first N application (30-70 % of total N) to
winter barley (cv. Cassia). Total N was applied in two (solid bars) or three (hatched
bars) applications in late February/early March (early), mid-March (mid) or late
March/early April (late). Bars with the same letter are not significantly different
(P<0.05).
e
abc cd d bd ab abc cda a abc
0
2
4
6
8
10
12
0 0.3 0.5 0.7 0.3 0.3 0.5 0.7 0.3 0.3 0.5
Yie
ld (
t/h
a)
2012 (light soil)
Timing and amount
g
cd cdde
bc abbc cd
ab a a
0
2
4
6
8
10
12
0 0.3 0.5 0.7 0.3 0.3 0.5 0.7 0.3 0.3 0.5
Yie
ld (
t/h
a)
2014 (light soil)
Timing and amount
e
bc bc ab aba a
abcd
dcd
0
2
4
6
8
10
12
0 0.3 0.5 0.7 0.3 0.5 0.7 0.3 0.3 0.5 0.7
Yie
ld (
t/h
a)
2015 (medium soil)
Timing and amountearly mid lateearly mid late early mid late

25
Spring barley
Spring barley is the arable crop with the greatest area in Ireland. While principally
grown as a source of animal feed a growing proportion is being grown for malting.
While fertiliser N management is important for all spring barley it is particularly
important for malting barley where protein content of the grain is an important
criterion for acceptance of grain by maltsters.
A considerable amount of work has been carried out at Oak Park in recent years
regarding the timing and splitting of fertiliser N in terms of both yield and protein
content. The key message from this work is that fertilizer N rate has the largest
effect on grain yield and particularly grain protein content rather than timing or
number of splits used. As for other cereal crops, there is large variation in the
optimum N rate for spring barley between sites and seasons and this will be
influenced by yield level and soil N supply.
Figure 6. Effect of timing of the first N application (at sowing or at emergence) and
size (30, 60 or 90 of a total of 150 kg/ha of N) on grain yield and protein content of
spring barley. Data are averaged over 17 site-seasons. The remaining N was applied at
mid-tillering for all treatments.
While the first dose of nitrogen is normally applied to spring barley at or just
before sowing research has indicated little consistent difference, in either grain
yield or protein content, between applying the first N at sowing compared to
applying the first N as the crop emerges (Figure 6). This is of particular relevance
to growers who are planting barley very early (February) as they can avoid
applying N at sowing and thus reduce the risk of N loss if wet weather conditions
5
6
7
8
9
10
11
0
1
2
3
4
5
6
7
8
9
10
Pro
tein co
nten
t (%)G
rain
yie
ld (
t/h
a)
30 60 90N applied in first application (kg N/ha)
Grain yield Protein

26
occur between sowing and emergence. Applying a greater proportion of the total N
at sowing had little effect on either grain yield or protein content.
Figure 7. Effect of timing of a third split of N compared to applying N in two splits to
spring barley. All treatments received a total of 150 kg/ha of N, with 30 kg/ha applied
at sowing. The remaining 120 kg/ha was either all applied at mid tillering (2-split) or
90 kg/ha was applied at mid tillering and the remaining 30 kg/ha applied at GS31,
GS32, GS37 or GS 61. Data are mean of 10 site seasons.
A comparison of using two splits compared to three splits to apply the total N
allocation to spring barley showed that, on average, there were no significant
differences in grain yield between treatments that received all the N in two splits
compared to where a proportion of the total was retained and applied as a third split
(Figure 7). There was a small increase in protein content where some of the N was
retained for a third split and that third split was applied at GS37 or later. However,
for more typical timings of a third split, GS31-GS32, differences in protein content
compared to using a two split programme, where all the N was applied by mid-
tillering, were very small.
Forms of N
Calcium ammonium nitrogen (CAN) is the predominant form of ‘straight’ nitrogen
fertilizer used on arable crops in Ireland. It supplies ammonium and nitrate, the
readily plant available forms of nitrogen. It has been widely used and gives
consistent results. In recent years, there has been considerable interest in urea as a
nitrogen source for cereals principally due to its lower cost per unit of N relative to
8
8.5
9
9.5
10
10.5
11
11.5
12
0
1
2
3
4
5
6
7
8
9
2split GS31 GS32 GS37 GS61
Pro
tein co
nten
t (%)G
rain
yie
ld (
t/h
a)
Timing of third split
Yield
Protein

27
CAN. Additionally, urea is a more concentrated form of N (46 % N vs 27 % N)
with consequent handling and transport advantages. However, urea has two
potential disadvantages compared to CAN which need to be considered by
growers. Firstly, urea has a lower bulk density than CAN, its bulk density typically
being 75-80 % that of CAN. This makes it more difficult to spread evenly with
spinning disc type spreaders, particularly at wider bout widths and its spread
pattern is more susceptible to disruption by wind. Most spreaders are not capable of
spreading urea evenly at as wide a tramline width as CAN. Where spreaders are
technically capable of reaching the required tramline width using urea, careful
setting of the spread components (discs, vanes, drop point angle etc.), as well as
consideration of weather conditions on the day of spreading, is required to ensure
even spread across the full bout width. A particular problem can occur where
fertilizers with a greater bulk density are blended with urea e.g. where ammonium
sulphate (21 % N) is blended with urea (46 % N). In this case the spreader can be
set up to give an even distribution of granules across a particular bout width but
separation of the two fertilizers in the blend can occur across the bout width, with
the fertilizer with the greater bulk density concentrated towards the outer regions of
the bout width and the urea more concentrated towards the centre of the spread
pattern. Where the two fertilizers have different concentrations of nitrogen this will
lead to uneven distribution of nitrogen even though there was an even distribution
of granules. Some spreaders may spread both blend components more evenly than
others. This problem can be mitigated by careful selection of granule size of the
two fertilizers before blending; growers should check with suppliers that their
product’s spreading capability has been validated for the particular spreader and
bout width being used.
The second disadvantage of urea compared to CAN is that a portion of the nitrogen
applied as urea can be lost to the atmosphere as ammonia gas in the process known
as volatilization. The amount of N that is lost through this process is variable and
very much dependent on soil and weather conditions around the time of
application. High soil pH will increase the risk of volatilization; therefore urea
should not be spread on recently limed land. Similarly, drying conditions after
application of urea increase the risk of loss so application of urea on moist soils or
just before light rain can minimise losses. Many experiments comparing CAN and
urea as a nitrogen source for cereals have been carried out both in Ireland and
abroad over the last 40-50 years. These experiments have shown that urea can give
similar results to CAN in the majority of occasions but in some instances urea will
give inferior results particularly where conditions favour nitrogen loss as ammonia.
This risk, albeit a relatively small risk, has militated against the widespread use of
urea on cereal crops in Ireland.
28
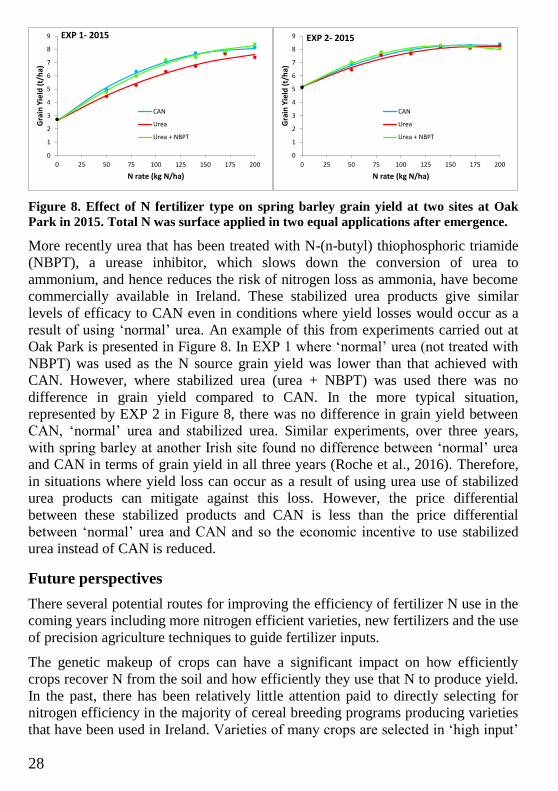
Figure 8. Effect of N fertilizer type on spring barley grain yield at two sites at Oak
Park in 2015. Total N was surface applied in two equal applications after emergence.
More recently urea that has been treated with N-(n-butyl) thiophosphoric triamide
(NBPT), a urease inhibitor, which slows down the conversion of urea to
ammonium, and hence reduces the risk of nitrogen loss as ammonia, have become
commercially available in Ireland. These stabilized urea products give similar
levels of efficacy to CAN even in conditions where yield losses would occur as a
result of using ‘normal’ urea. An example of this from experiments carried out at
Oak Park is presented in Figure 8. In EXP 1 where ‘normal’ urea (not treated with
NBPT) was used as the N source grain yield was lower than that achieved with
CAN. However, where stabilized urea (urea + NBPT) was used there was no
difference in grain yield compared to CAN. In the more typical situation,
represented by EXP 2 in Figure 8, there was no difference in grain yield between
CAN, ‘normal’ urea and stabilized urea. Similar experiments, over three years,
with spring barley at another Irish site found no difference between ‘normal’ urea
and CAN in terms of grain yield in all three years (Roche et al., 2016). Therefore,
in situations where yield loss can occur as a result of using urea use of stabilized
urea products can mitigate against this loss. However, the price differential
between these stabilized products and CAN is less than the price differential
between ‘normal’ urea and CAN and so the economic incentive to use stabilized
urea instead of CAN is reduced.
Future perspectives
There several potential routes for improving the efficiency of fertilizer N use in the
coming years including more nitrogen efficient varieties, new fertilizers and the use
of precision agriculture techniques to guide fertilizer inputs.
The genetic makeup of crops can have a significant impact on how efficiently
crops recover N from the soil and how efficiently they use that N to produce yield.
In the past, there has been relatively little attention paid to directly selecting for
nitrogen efficiency in the majority of cereal breeding programs producing varieties
that have been used in Ireland. Varieties of many crops are selected in ‘high input’
0
1
2
3
4
5
6
7
8
9
0 25 50 75 100 125 150 175 200
Gra
in Y
ield
(t/
ha)
N rate (kg N/ha)
EXP 1- 2015
CAN
Urea
Urea + NBPT
0
1
2
3
4
5
6
7
8
9
0 25 50 75 100 125 150 175 200
Gra
in Y
ield
(t/
ha)
N rate (kg N/ha)
EXP 2- 2015
CAN
Urea
Urea + NBPT
29
environments where increased N efficiency, particularly recovery efficiency is
unlikely to be selected for. Thus, while crop yields have increased there has also
been a gradual increase in the amount to fertilizer N required by some cereal crops
over the years (Foulkes et al 1998). An exception to this has been shown to occur
in barley breeding programs, where achieving malting specification is an objective,
since the varieties are often evaluated with lower levels of fertilizer N addition
than, for example, in wheat breeding programs. Work in the UK indicated that
spring barley yields were increased as newer varieties became available but this
increase in yield was not associated with a corresponding increase in fertilizer N
requirement (Sylvester-Bradley and Kindred, 2009).
The availability of variable rate technology on modern fertilizer spreading units
offers the potential to modify fertilizer application rates on-the-go even within
fields. For such technology to be useful for fertiliser N applications a sound
rationale for determining the amount of N to apply to any particular area of the
field is required. A range of sensors, which can be mounted on tractors, aircraft,
drones or satellites as well as being handheld, have been developed which can
detect the nitrogen status of crops at high spatial resolution. This offers the
opportunity to refine fertilizer application rates based on growth characteristics of
the actual crop rather than using crop independent information, such as historic
yield levels, as is currently the case. However, while many of these systems can
redistribute a particular pre-determined rate of fertilizer N between areas that have
a higher or lower nutrient status, many do not give any indication of how much
should be applied and so are subject to any error associated with a grower’s
estimation of nitrogen requirement. Determining the optimum rate of N to apply
based on sensed characteristics remains a challenge.
More precise and site-specific estimation of soil N supply (SNS) would contribute
substantially towards more refined fertiliser N recommendations for cereals.
Despite much work in this area worldwide progress has been modest. Recent work
at Oak Park has indicated that as a means of estimating SNS the current soil N
Index system, which relies on previous crop as an indicator of SNS, is limited. The
system could potentially be improved by including more variables to improve
estimation of SNS, with soil mineral N measurements in spring showing some
promise. The use of other sensing technologies such as near-infra red spectroscopy
(NIRS) may also have a role to play but again considerable research would be
needed before any such system could be recommended at farm level. Monitoring of
unfertilized areas within crops during the growing season, with for example
reflectance sensors, has the potential to give good estimations of variations in soil
N supply between sites and seasons, and could allow adjustment of fertilizer N
inputs. Such a system, which would be of particular use for guiding late season N
inputs, is already in limited use in parts of Sweden (Delin et al. 2015).

30
There is also potential for new fertilizer formulations to improve nitrogen use
efficiency either by reducing the risk of loss or improving the efficiency with
which the crop uses N. A range of inhibitors and coatings, that either slow down
the conversion of nitrogen from one form to another or that slow down the rate at
which the nitrogen is released into the bulk soil have been developed and tested
(Thapa et al., 2016). Some of these have already been evaluated and shown
promise under Irish conditions, as described earlier in the case of stabilized urea.
However, before being used any new fertilizer formulations need to be
comprehensively evaluated to ensure that they offer enhanced efficacy to the Irish
grower.
References
Delin S., Gruvaeus, I., Wetterlind, J., Stenberg, M., Frostgard, G., Borling, K.,
Olsson, C. and Krijger, A. (2015). Fertilisation for optimized yield can
minimize nitrate leaching in grain production. Proceedings International
Fertiliser Society 774, 24pp.
Efretuei, A., Gooding, M., White, E., Spink, J. and Hackett, R. (2016) Effect of
nitrogen fertilizer application timing on nitrogen use efficiency and grain yield
of winter wheat in Ireland. Irish Journal of Agricultural and Food Research
55:63-73
Foulkes, M. J., Sylvester-Bradley, R., & Scott, R. K. (1998). Evidence for
differences between winter wheat cultivars in acquisition of soil mineral
nitrogen and uptake and utilization of applied fertilizer nitrogen. The Journal of
Agricultural Science 130: 29-44.
Kindred, D. R., Milne, A. E., Webster, R., Marchant, B. P., & Sylvester-Bradley,
R. (2015). Exploring the spatial variation in the fertilizer-nitrogen requirement
of wheat within fields. The Journal of Agricultural Science 153: 25-41.
Roche, L., Forrestal, P.J., Hackett, R., Lanigan, G.J., Richards, K.G., Shaw, L.J.,
and Wall, D.P. (2016). How does urea and protected urea compare to CAN for
spring barley production? In: ‘Efficient fertilizer use for tillage crops’ Teagasc
Soil Fertility Conference 2016 pp 10-11.
Schulz, R., Makary, T., Hubert, S., Hartung, K., Gruber, S., Donath, S., Döhler, J.,
Weiß, K., Ehrhart, E., Claupein, W., Piepho, H.P., Pekrun, C. and Müller, T.
2015. Is it necessary to split nitrogen fertilization for winter wheat? On-farm
research on Luvisols in South-West Germany. The Journal of Agricultural
Science 153: 575–587.

31
Sylvester-Bradley, R. and Kindred, D.R., (2009). Analysing nitrogen responses of
cereals to prioritize routes to the improvement of nitrogen use efficiency.
Journal of Experimental Botany, 60:1939-1951.
Thapa, R., A. Chatterjee, R. Awale, D. A. McGranahan, and A. Daigh. (2016).
Effect of enhanced efficiency fertilizers on nitrous oxide emissions and crop
yields: a meta-analysis. Soil Science Society of America Journal 80:1121-1134.
Wall, D.P. and Plunkett, M. (2016). Major and micro nutrient advice for productive
agricultural crops. Teagasc, Johnstown Castle. (available at:
www.teagasc.ie/media/website/publications/2016/soil-fertility-green.pdf)

32
33
Updating Nutrient Recommendations for Irish farms
David P. Wall and Mark Plunkett
Teagasc, Johnstown Castle, Co. Wexford.
Introduction
Since the publication of the 1st Programme for Economic Expansion in the 1958 the
importance of grassland farming “... future agricultural expansion will depend
mainly on a dynamic policy of grassland development” coupled with good soil
fertility “first and basic essential is the presence in the soil of a satisfactory level of
lime and nutrients” has been recognised as being closely linked with Irish
economic development (Whitaker 1958). Current government policy is still closely
aligned with these concepts and the recent FoodWise 2025 (DAFM 2015)
strategies for the development of the agricultural and food sector reinforce these
aims. A major responsibility of the research staff at Johnstown Castle (An Foras
Taluntais and currently Teagasc) has been to support the development and
dissemination of good soil fertility advice through the publication of leaflets,
booklets and manuals providing nutrient and trace element advice for grassland and
crops (Coulter, 2002). This paper discusses the challenges faced by farmers and the
agricultural sector in relation to soil fertility, increased productivity and
environmental sustainability. It also outlines the recent developments in fertiliser
advice detailed in the Teagasc Green Book “Major and Micro Nutrient Advice for
Productive Agricultural Crops (Wall and Plunkett, 2016).
Sustainable intensification of agricultural production
Food Wise 2025 represents the national policy vision for the Irish agri-food sector
(DAFM, 2015). It envisages a 65% increase in the value of farm gate output to
almost €10bn in the next ten years. It also sets a target for an additional 23,000 jobs
in the sector, with an 85% increase in food exports from their 2012 level to €19bn.
It recognises that achieving economic competitiveness and environmental
sustainability are equal pillars in the delivery of this vision. Ireland has an
advantage over most countries in terms of our water quality (and quantity), but
there is a danger that our ability to maintain satisfactory water quality and improve
our unsatisfactory water quality could constrain our ability to increase farming
outputs
The effect of FW 2025 has been examined based on the Strategic Environmental
Assessment (SEA) for FW 2025 and scenario modelling. Expansion in the
agriculture sector must comply with a range of environmental legislation such as
the Nitrates Directive and thus there are constraints to this expansion. Overall, the
FW 2025 scenario projects an increase in milk production, stable beef production
and a relatively stable total cattle population. Increased milk production has and

34
will be achieved through a slight increase in cow numbers, increased milk per cow
associated with an increase in the Economic Breeding Index. The increased
numbers of dairy cows will be offset by a reduced number of beef cows, leading to
a relatively stable overall number of bovines. This projection is supported by
evidence of the evolution of dairy cow numbers and milk production from 1990:
compared to the 1990 baseline year, in 2015 milk production and milk fat/protein
has increased by 24 and 39%, respectively while dairy cow numbers are 5.5%
lower. The result of changes in the national herd composition will result in a small
(+2.9%) increase in national bovine manure N excretion between 2005-07 and
2030, but it is projected to still be 2.4% lower than the peak year in 1998.
FoodWise 2025 is expected to result in changes to our national inorganic fertiliser
use. Currently only 11 % of soil samples have the optimum mix of soil pH, P & K.
Changes in fertiliser use nationally must comply with the Good Agricultural
Practice regulations under the Nitrates Directive. A small increase in inorganic
nitrogen fertiliser use is projected to occur between 2005-07 and 2030 (an increase
of 8.8% however, this is still lower than the average used in the period 1990 to
2000. National P fertiliser use is more difficult to predict. Any additional use of
inorganic P fertiliser requires a farmer to demonstrate a requirement for P on their
farm based on soil testing. Any increases in P use must take other non-fertiliser P
imports into account e.g. feed and/or imported manures. Over the last decade, the
percentage of soils that are suboptimal for P (Index 1 and 2) has increased from
40% in 2007 to 61% in 2015 (Plunkett and Wall, 2016). At the same time,
excessive soil P (index 4) decreased by 43% between 2007 and 2015. This suggests
that the production potential of our grassland soils is being slowly eroded and to
increase production nationally there will need to be increased use of P fertiliser on
the suboptimal index 1 and 2 soils. So how can Irish agriculture expect to grow
output and income within the potential confines of environmental constraint as we
look towards the future?
Good agricultural practices for the protection of the environment
In order to maximise the efficiency of nutrient use on farmland and to minimise
environmental impacts, application of nutrients should follow a code of good
agricultural practice. The major environmental risks from nutrients are (a) leaching
of nitrate from the soil to groundwater which can result in the nitrate levels in
water supplies being unacceptably high; (b) surface loss or runoff of soluble P from
soils or manure, or movement of P enriched clay to drainage channels, ditches or
streams increasing the risk of eutrophication of rivers and lakes and (c) losses of
ammonia or nitrogen oxides from chemical or organic fertilizers to the atmosphere
with possible adverse effects on the upper atmosphere. Good agricultural practice
requires that nutrient supply be matched to crop demand, both in terms of the
quantity applied and the time of application relative to the crop yield, soil and
climatic conditions.

35
On the 1st February 2006, the government transposed the EU Nitrates Directive –
National Action Programme (NAP) (Anon, 2006) into Irish law. The original legal
instrument (SI 378 of 2006), called the Good Agricultural Practice for Protection of
Waters Regulations has undergone 3 revisions (SI 101 of 2009, SI 610 of 2010 and
SI 31 of 2014) and will be reviewed and update again in 2017. This legally binding
statutory instrument deals with the protection of waters from pollution caused by
nitrates and phosphates from agricultural sources and is a now part of Irish law.
Under the single farm payment scheme there are 13 Statutory Management
Requirements (SMRs) of which compliance with the Nitrates Directive is one.
Thus, Irish farming must comply with the NAP regulations to meet cross
compliance requirements.
Under the NAP there is a cap on stocking rate of 170 kg Organic N loading /ha
which equates to 2 LU (dairy cows)/ha. However, since 2006 Ireland has
successfully negotiated derogation from these limits for farmers who wish to farm
more intensively up to a stocking rate of 250 kg organic N loading/ha (2.9 LU/ha).
The current NAP and nitrates derogation are up for review by the EU Commission
during 2017 and the new programme will run from 2018 to 2021. In recent Nitrates
Directive reviews, other member states, for example Denmark and Germany, have
had difficulty securing their derogation to farm more intensively as they were not
able to satisfy the EU Commission that water quality was being adequately
protected. Similarly, Ireland will be required to provide evidence of good
agricultural practice and cross compliance on farms in addition to improved
nutrient fertility and reduced risk to water quality to secure a new Nitrates
derogation up until 2021.
Reducing risk to water from agriculture – evidence from the monitoring and
research
Phosphorus loss is considered the main risk to water from farming in Ireland. Since
well-drained soils generally pose a relatively low risk of phosphorus loss,
intensification of agricultural production on these soils is unlikely to substantially
increase risk to water quality. It is likely that the greater part of the expected
increased production (particularly dairy) in the mid-west, south east and the
southwest will be concentrated on well drained soils given their suitability for this
purpose. Thus, intensification will mainly occur in areas where the soils potential
for natural attenuation of P is greatest. Substantial efforts have been made by the
farming community to implement the Good Agricultural Practice (GAP) measures
under the Nitrates Action programme since their introduction in 2006. Evidence of
the implementation and its efficacy has been gathered through a range of studies
and on-going research and monitoring programmes are summarised as follows.
36
National water quality monitoring
While the Water Framework Directive (WFD) 2000/60/EC monitoring programme
in Ireland (EPA 2016a) has noted a general decrease in levels of phosphorus in
Irish waters and evidence of this decrease has emerged from a number of sources,
including agriculture. A recently published study, on the intensively farmed Suir
catchment, improved fertiliser usage and good timing of nutrient applications was
linked to reduced nutrient loadings in the estuary. Here, P and water column
chlorophyll concentrations improved while N remained stable.
Agricultural Catchments Programme (ACP)
Research from the ACP shows that good nutrient management practices can reduce
P source pressure while maintaining high production levels (Murphy et al., 2015).
Over a three-year study period the proportion of soils with excessive P
concentrations (i.e. Index 4) decreased from 32 to 24%. Over the same period, P
concentrations in shallow groundwater decreased. As well as targeting slurry and
fertiliser applications to their low fertility field’s, the farmers have changed the
timing of slurry spreading with more slurry going out in the spring and early
summer reflecting national trends. This better matching of the application of
nutrients to the peak growing season is a big factor in improving the uptake of the
nutrients thus reducing the risk of nutrient loss to water.
A further study in a Co. Monaghan catchment that is vulnerable to P runoff from
surrounding poorly drained drumlin soils looked at changes in P levels in lake
water. Sediment records showed that while agriculture intensified in the area
between 2000 and 2010 (i.e. 8 to 17 kg/ha in organic livestock P loading) there was
a decline in P enrichment of the lake. Phosphorus mitigation measures from rural
environmental protection schemes, group water scheme initiatives and the GAP
regulations were indicated as the key drivers of the lake’s recovery.
On-farm water quality monitoring
Evidence from farm scale research also points to positive impacts from careful
management of nutrient sources including manures and soiled water. Nitrogen (N)
and P concentrations in water leaving these farms have been reduced (Fenton et al.
in press). These concentrations are below water quality thresholds and on a
downward trajectory. Similar outcomes have been shown from work in the Heavy
Soils Programme where data from five commercial farms across the south west
shows that water quality in open drains, in-field drains and groundwater are below
the maximum admissible concentrations for N (Teagasc, 2012).

37
National fertiliser use and soil fertility
Use of chemical P has roughly halved in Ireland over the past 30 years with the
result that soil P levels have dropped dramatically. Currently less than 15% of
samples analysed through Teagasc, have P in excess of the optimum (P Index 4)
and this has declined from 30% in 2007, just after the introduction of the GAP
measures. The risk of P loss to water has been shown to increase where surplus P
to crop requirement is present (i.e. Index 4), thus the reduction in the area of
farmland at Index 4 has significantly reduced the potential for P loss to water
nationally. However, this reduction in fertiliser use has also negatively impacted on
national soil fertility and in 2016 over 60% of samples analysed from commercial
farms had low or deficient status for P (Index 1 and 2). Additionally, the low soil
pH and K status of the majority of soils tested indicates that overall N and P
fertiliser use efficiency is being compromised due to lack of correct nutrient
balance (pH, P and K) across Irish farms
Overall farm production efficiency increases
The overall thrust of Irish research and knowledge transfer is focused on increasing
the efficiency of production i.e. producing the same or more from a fixed or
reduced level of inputs. Any improvement in efficiency contributes to better use of
inputs, including nutrient inputs, leading to more nutrient exports in product and
less nutrient available for loss to the environment. Many metrics of increasing
efficiency of grass-based production are being used to focus farmers’ attention and
efforts on efficiency gains, particularly in dairying. Substantial strides have been
and will continue to be made in improving efficiency. To succeed, this practice
adoption based approach ‘will require improved knowledge exchange among
farmers, knowledge providers and policy makers. This knowledge exchange will
have to be facilitated through a range of existing and new structures and policy
instruments (EPA, 2016b).
To date, improvements in nutrient use efficiency have been found at national level
stemming from reduced levels of nutrient inputs and a consequent reduction in
nutrient available for loss to water. A study of 150 specialist dairy farms between
2006 and 2012 showed declines in farm-gate N and P surpluses and increases in N
and P use efficiencies since the introduction of GAP regulations, (Buckley et al.,
2016a, 2016b). Similar results were reported in a survey of 21 dairy farms in the
south-east of Ireland, (Mihailescu et al., 2014, 2015). Another study reported
notable shifts in farm practice aligned with utilizing organic manures according to
their nutrient value (e.g. spring applications) citing the change to the “positive
impact of GAP regulations”, (Hennessy et al., 2011).
38
National Nutrient Management Advice
National nutrient advice is being constantly developed and refined as we gain new
knowledge of soil-plant nutrient dynamics and changes in crop varieties and impact
of climate. Prior to now the latest nutrient advice for grassland and tillage crops
was available in 3rd edition of the Teagasc Green Book (Coulter and Lalor, 2008).
In 2016 a full revision and update of nutrient advice was conducted incorporating
the latest scientific research and knowledge to produce the present volume (4th
edition) published by Wall and Plunkett (2016). New sections soil types and
nutrient cycling, fertilizer ingredients, adaptive nutrient management planning and
nutrients for energy crops have been added. Additionally, new information and
updates based on the latest scientific findings have been made to soil acidity and
liming, organic manures, grassland, and crops sections. Many of the chapters have
been reorganised to make them easier to consult and the advice and tables have
been redesigned to reflect the latest knowledge, which is supported by recent
research.
A major objective in this revision was to ensure that it was comprehensive and that
it contained sufficient information to allow agricultural and farm advisors and
consultants to recommend optimum levels of major and micro nutrients for the
most important agricultural and field horticultural crops. The Teagasc Green Book
sets out to minimise conflicts between the need to ensure an economic return from
grassland and tillage farming on the one hand, and concerns about losses of
nutrients to water or gaseous emissions to the atmosphere on the other.
Many of the changes in this 4th Edition were made necessary by legally binding
requirements of the NAP Regulations. This NAP has major implication for use of
N and P in farming, both for the farmer and for organisations and advisers
recommending levels of nutrient use for agriculture. It has been the intention of
Teagasc that fertilizer advice, if followed carefully, should have the desirable effect
of optimising yield, protecting the environment, as well as saving money for the
farmer. In revising this document, this policy has been continued, where
appropriate, within the constraints of the current NAP particularly when dealing
with the environmental consequences of N and P use.
Fertilizer rates for optimum yield may sometimes exceed the maximum currently
allowed under the NAP. For example, N fertilizer rates for high yielding crops
require that proof of historic yields are available, although, historic yields are not
necessarily a good predictor of expected yields. Nutrient advice tends to be self-
correcting when accompanied by frequent soil testing. Thus, if soil variation or
sampling errors cause nutrient applications to be higher than necessary, this will
tend to be corrected following the next soil test. Since soil nutrient levels change
slowly under most cropping systems, it is usually safe to base fertilizer advice on
soil tests for four to five years from the date of sampling. Where soil analysis
suggests that no nutrient applications are needed, or with very light soils which
39
have limited buffering capacity, it is prudent to have soil analysis carried out more
frequently to monitor soil fertility statues for example every three years.
Teagasc Green Book, 4th Edition Summary of Changes
New Sections
- Soil Types and Nutrient Cycling: Information on the major soil types in
Ireland and their influence on nutrient cycling and management, including
links to further information of Irish soils
- Fertiliser Ingredients: Definitions and information on the main fertiliser
ingredients available in Ireland
- Adaptive Nutrient Management Planning; NMP–online: Information on the
new nutrient management system “NMP-online” and how it can be used to
facilitate better nutrient management planning and sustainable outcomes for
farmers into the future
- Nutrients for Energy Crops: New information and nutrient recommendations
for energy crop production
Revised Sections
- Soil Acidity and Liming: Improved information on importance of soil pH
correction and new information on lime and lime products has been included
- Nutrients in Organic Manures: Updated the fertiliser replacement values for
slurries and provide new information nutrient constituents in a range of
organic manure and biosolid types. Information on tools to measure slurry
variability and how to maximise slurry efficiency
- Grassland: New N advice for beef and sheep systems and suggested
application timings for fertilisers
- Cereals: New advice on N application timings for cereal crops
- Potatoes: New N advice for potatoes, which considers production system and
haulm longevity
- Oilseed Rape: New advice on N timing based on density of the crop and leaf
area index
- Vegetable Crops: Updated of N, P and K advice for vegetable crops based
on best available information has been included.
Teagasc fertilizer advice is not static but is reviewed constantly in the light of new
national and international research findings, changes in farm practices, nutrient
regulations and the onset of new grass and crop varieties with different nutrient

40
requirements. Some of these updates in the new Green Book are summarised as
follows
Soil types and Nutrient cycling
Plant production and nutrient cycling are two of the key functions that farmed soils
must perform. Nutrient cycling is the capacity of soil to provide nutrition for food,
fuel and fibre crops that are grown across the landscape. ‘Cycling’ stands for a
movement of matter without getting lost out of an imaginary circle and that is
exactly how we want essential plant nutrients to behave (Schroder & Wall et al.,
2016). The quality of agricultural soils is deemed to play a role in the cycling of
nutrients in residues, indirectly by governing the productivity and harvest ability of
crops and thus the effective capture of nutrients from soils, and more directly by its
impact on the capacity to accommodate the reception of nutrients in residues and
convert these nutrients in forms that can be utilized by crops.
Farmers regularly manage the fertility of the soils on their farms by applying
fertilizers and organic manures to build-up or maintain the supply of nutrients
required for the grass or crop types they produce. However, experienced farmers
will know that not all soils (or fields) have the same production potential (or
suitability for certain crop types) or respond in terms of their soil fertility status to
the nutrients that are applied. While several factors will determine production
potential and fertility status, one major denominator is soil type and most farms
will have at least two different soil types, if not more, dispersed within the farm
boundary. Given the nature of the Irish landscape and its origins (glaciation) there
is often large variability in soils over relatively small spatial areas, even within
towns-lands or farms. This poses a challenge for individual farmers and their
advisors when planning nutrient and fertilizer management strategies for their
farms. A blanket approach, where all fields, even with similar soil test results,
receive and “are perceived to respond” to similar nutrient application rates may not
happen in reality. This is because different soil types possess different
characteristics and qualities. Some of the main characteristics related to soil
fertility and nutrient cycling include parent material (rock type, glacial till or
mineral deposit) that soil is derived from and its nutrient composition, soil texture
(i.e. proportions of sand, silt & clay present), soil organic matter level, water
holding capacity and drainage class (i.e. free draining vs. poorly draining) etc.
Soil test phosphorus
Low soil P levels, especially P Index 1, will not achieve optimum sward
productivity throughout the year without additional P fertilizer above the rate
required for soil P maintenance. Soil P levels at Index 2 may restrict grass growth
in spring. Where grass demand is low early in the season P index 2 soils may
achieve sufficient dry matter (DM) yields, but the herbage P concentration may not

41
meet the dietary requirements of some grazing animals. In general, soil P levels at
Index 3 are advised to ensure that the grass sward will achieve optimum DM yield,
encourage growth of clover and early grass, and contain a P concentration that is
adequate to meet the dietary requirements of grazing animals.
A recent study of Irish soil types showed that aluminium (Al) in soil had a strong
influence on the soil’s ability to supply available P for plant uptake (Daly et al.,
2015). At high Al to P ratios, P fixation occurred and soils had difficulty supplying
P. For these soils the critical range of Morgan’s P at which P was plant available
fell between 5.9 and 8.7 mg/l. The current grassland P Index 3 range (5.1 – 8.0
mg/l Morgan’s extractable P) may not capture all these high P fixing soils.
Therefore, soils within the current Index 3 and Index 4 categories may show
additional P responses beyond the generalised recommended rates of P fertilizers.
In addition, the Morgan’s soil test may overestimate the available soil P on
calcareous soils and those with high soil pH (>7.0) as it was developed for
naturally acidic soils where a large proportion of P is bonded to Al, Iron and
Manganese in the mineral matter. These high pH soils may require additional P
fertilizer, even at optimum soil test P levels, for intensive grassland production to
maintain an adequate P supply throughout the growing season.
Management of organic manures
There are many forms of organic fertilizer that can be land spread to supply
nutrients to crops. The most common of these are animal manures, with over 40
million tonnes available nationally. Another organic fertilizer is spent mushroom
compost which is often used to provide N, P and K. Organic materials from
industrial and municipal sources may also be considered, under certain
circumstances, as these can have a valuable nutrient contribution when applied to
land. The aim when land spreading organic fertilizer is to optimise nutrient uptake
by the crop and to minimise losses to water and air resources. Understanding the
manure composition and timing of application are critical to achieving these
objectives.
Fertilizer replacement value
In addition to the variation that exists between manures regarding the total nutrient
content, the proportion of the total nutrient content that is actually available for
plant uptake is also variable due to timing and method of application. In the season
of application, the fertilizer replacement value of N, P and K is lower than the total
quantities applied and farmers may need to adopt strategies that improve the
nutrient uptake from organic fertilizers as a result.
Animal slurries account for approximately 80% of organic fertilizers used in
Ireland. Land application of slurry and manure is also susceptible to ammonia loss.

42
Exposure of slurry or manure to warm, windy and sunny conditions at the time of
application promotes high ammonia losses. Therefore, applying manure or slurry in
a manner that minimises ammonia losses will maximise the N fertilizer
replacement value. Adherence to the following guidelines will help to maximise
the N fertilizer replacement value.
1. Timing of application:
- Apply at a time when crop demand is high in spring. Where soil conditions
allow, aim to have 70% applied by the end of April. Opportunity for spring
application on heavy soils may be increased by using application methods
that reduce soil compaction, e.g. umbilical system.
- Application in dull, cool, overcast or misty conditions will result in lower
ammonia losses compared to application in warm, dry, sunny weather.
2. Slurry management to reduce N losses:
- Slurry dry matter: slurries with lower dry matter contents will percolate and
wash into the soil more quickly than material with higher dry matter, thus
reducing the duration of exposure to the air. Dilution of slurry with soiled
water increases the volume to be managed; however, a 1% decrease in slurry
DM% will decrease ammonia losses by approximately 5 - 8%.
- Slurry application method: ‘low emission’ application methods, have been
shown to increase the N fertilizer replacement value of slurry under Irish
conditions (Lalor et al., 2010). Methods such as band spreading and trailing
shoe, place the slurry in bands or lines rather than on the entire surface of the
soil or crop as with the conventional splashplate method. Slurry applied with
a low emission method has reduced ammonia losses compared to splashplate
applied slurry. For example, ≥25% reduction in ammonia losses for a trailing
shoe technique compared to splashplate under Irish grassland conditions.
- Speed of incorporation: where organic fertilizers are applied to tillage land
prior to or during the cultivation process, incorporation is beneficial for
reducing ammonia losses, as this will reduce the length of time for which the
manure is exposed to the air. Immediate incorporation (or at least within 3 -
6 hours of application) is recommended.
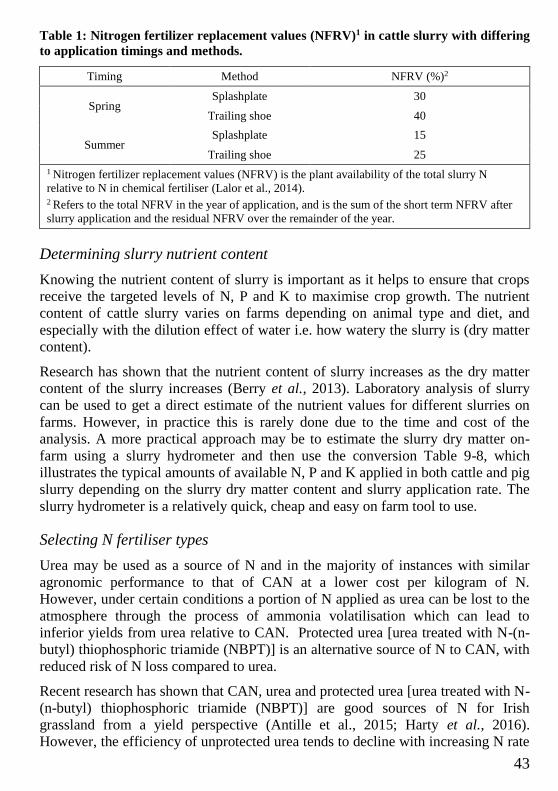
43
Table 1: Nitrogen fertilizer replacement values (NFRV)1 in cattle slurry with differing
to application timings and methods.
Timing Method NFRV (%)2
Spring Splashplate 30
Trailing shoe 40
Summer Splashplate 15
Trailing shoe 25
1 Nitrogen fertilizer replacement values (NFRV) is the plant availability of the total slurry N
relative to N in chemical fertiliser (Lalor et al., 2014). 2 Refers to the total NFRV in the year of application, and is the sum of the short term NFRV after
slurry application and the residual NFRV over the remainder of the year.
Determining slurry nutrient content
Knowing the nutrient content of slurry is important as it helps to ensure that crops
receive the targeted levels of N, P and K to maximise crop growth. The nutrient
content of cattle slurry varies on farms depending on animal type and diet, and
especially with the dilution effect of water i.e. how watery the slurry is (dry matter
content).
Research has shown that the nutrient content of slurry increases as the dry matter
content of the slurry increases (Berry et al., 2013). Laboratory analysis of slurry
can be used to get a direct estimate of the nutrient values for different slurries on
farms. However, in practice this is rarely done due to the time and cost of the
analysis. A more practical approach may be to estimate the slurry dry matter on-
farm using a slurry hydrometer and then use the conversion Table 9-8, which
illustrates the typical amounts of available N, P and K applied in both cattle and pig
slurry depending on the slurry dry matter content and slurry application rate. The
slurry hydrometer is a relatively quick, cheap and easy on farm tool to use.
Selecting N fertiliser types
Urea may be used as a source of N and in the majority of instances with similar
agronomic performance to that of CAN at a lower cost per kilogram of N.
However, under certain conditions a portion of N applied as urea can be lost to the
atmosphere through the process of ammonia volatilisation which can lead to
inferior yields from urea relative to CAN. Protected urea [urea treated with N-(n-
butyl) thiophosphoric triamide (NBPT)] is an alternative source of N to CAN, with
reduced risk of N loss compared to urea.
Recent research has shown that CAN, urea and protected urea [urea treated with N-
(n-butyl) thiophosphoric triamide (NBPT)] are good sources of N for Irish
grassland from a yield perspective (Antille et al., 2015; Harty et al., 2016).
However, the efficiency of unprotected urea tends to decline with increasing N rate

44
(Forrestal et al., 2016). Urea protected with NBPT has lower ammonia loss,
comparable to CAN, and thus is consistently as good as CAN in terms of yield and
efficiency (Forrestal et al., 2016). Urea protected with NBPT also has significantly
lower losses of the greenhouse gas nitrous oxide compared with CAN (Harty et al.,
2016).
On spring barley protected urea reduced ammonia losses compared to urea and
consistently produced similar grain yields to CAN, with slightly higher N uptake
(Roche et al., 2016). Using protected urea also reduced N2O emissions. On soils
where conditions are conducive to ammonia volatilisation, which include high pH
and drying conditions after application, protected urea can be used to minimise N
loss risk.
Nitrogen Advice for grazing systems
Nitrogen fertilizer requirements for all grazing systems are related to the demand
for grazed grass over the growing season. The N requirements for dairy grazing is
generally highest while sheep grazing requirements are generally lower than for
dairy cows or cattle.
Figure 1. Grass demand for different beef systems at a stocking rate of 2 LU/ha over
the grazing season.
New advice for beef and sheep grazing systems has been included in the 4th edition
of the green book. Research has quantified the demand for grass across the
different beef production systems according to the length of the grazing season and
grazing intensity. Additionally, grass demand will depend on a number of

45
management factors for the beef production system (e.g. calving/turnout dates,
silage harvest strategy, animal finishing system, housing dates, etc). A generalised
depiction of grass demand for different spring calving beef systems is shown in
Figure 1. New N advice for grazed swards is now provided for the 3 main beef
production systems; suckler calf to weaning, suckler calf to beef and calf to beef.
Nitrogen Advice for potatoes
Potato cultivars differ in their N requirement and there is no correct standard rate of
N for all cultivars. Deep rooting varieties with very long haulm longevity such as
Kerr’s Pink and Markies are effective nitrogen scavengers and may require lower
application rates in certain circumstances compared to those with medium or long
haulm longevity. Varieties can be divided into four distinct groups according to the
haulm longevity (Table 2).
Table 2: Classification of varieties according to haulm longevity1 or maturity.
Haulm Longevity Group
1 2 3 4
Determinate varieties Partially determinate
varieties Intermediate varieties
Short haulm
longevity1
Medium haulm
longevity1
Long haulm
longevity1
Very long haulm
longevity1
Premiere
Home Guard
British Queen
Lady Rosetta
Lady Claire
Nectar,
Maris Peer
Charlotte
Rooster
Maris Piper
Golden Wonder
Record
Electra
Markies
Kerr’s Pink
Cara
1 Haulm longevity assessed from 50% emergence to haulm death.
The main effect of N is to increase canopy size and prolong its duration. Yield
increases from higher nitrogen rates will only result if harvest is delayed to take
advantage of the extended canopy duration and consequent solar interception.
However, this is more likely up to September as yield increases are small from
mid-September onwards due to reduced solar radiation intensity. Also, harvesting
prior to canopy maturity may result in reduced dry matter/specific gravity and after
cooking blackening in some cultivars. Where sowing date is delayed, nitrogen rates
should be reduced accordingly. Thus, where tuber quality is important it is essential
not to use high amounts of N in the event of a restricted growing season. The
recommended available N rates are shown in Table 3. For most crops apply the
nitrogen to the seedbed prior to planting. However, where the risks of leaching are
high (light or shallow soils) a top dressing of no more than one third of the total
can be considered but should be applied well before canopy closure.

46
Table 3. Example - Main Crop Rooster planted into long term tillage land (Index 1).
Length of growing
season
Variety determinacy
group Index 1
Available N
(kg/ha)
>120 days
Main crop 3 1 170 kg/ha1
1 Recommended maximum N rate – for Rooster which has high soil N utilisation is not recommended to apply more than 170 kg/ha N.
For early, second early and late maturing cultivars high N delays maturity therefore
it is important to avoid over-use. The recommendations below take into account the
length of growing period from planting to burn off. Where planting is delayed or
early burn off is predicted to meet early market demands N use should be reduced
accordingly.
Timing of fertiliser applications for cereal crop production
Nitrogen for winter and spring barley
The latest advice for winter and spring barley is that N should not be applied to
winter barley at sowing. For winter barley, the first application should be made at
the onset of significant growth between late February and mid- March when the
crop is at the late tillering stage, before GS 30. Generally, 25-30% of the total
should be applied at this timing. The second application should be made at around
GS 31, which will typically be in late March/early April. In general, a third
application will not be required.
For spring barley, the initial fertilizer N can be applied at sowing, either broadcast
before sowing or combine drilled, or alternatively, particularly for early drilled
crops (i.e. February sown crops), the initial N application can be made as soon as
the crop has emerged. Research has shown little difference between applying the
first N at sowing compared to applying the first N at emergence to spring barley.
Since the crop demand is very low in the early stages of growth approximately 25-
30% of the total planned N application is sufficient at the first application. The
second application should be made during tillering (GS22-25). At this stage the
remainder of the fertilizer N can be applied, or, particularly if there is a risk of high
rainfall after application, a portion of the total N to be applied (typically <20%) can
be retained and applied as a third application at GS 31.
Phosphorus
With regards to P applications on cereal crops recent research has investigated p
application methods for spring barley across various soil types. For spring sown
cereals on low P soils (P Index 1 and 2) it is advisable that fertilizer P be
incorporated at or before sowing. Research has shown a consistent benefit of

47
placing P with the seed (combine drilling) for spring crops at Index 1 and 2 (Wall
et al., 2013) soils. While benefits to placing P with the seed can be obtained at
Index 3 the benefits are likely to be smaller and less consistent than at lower soil P
indices. For early sown spring cereals placement of P fertilizers may be more
critical where soil and weather conditions are less than optimal.
Research with winter wheat crops has indicated no consistent yield benefit, even
where soil P levels are very low, of autumn applied P, compared to broadcast
applications in the spring. While there is some evidence of increased seedling
survival where P is placed with the seed at sowing time, this maybe more pertinent
to winter barley crops grown on low P supply sites where yield formation is more
dependent on tiller number development and survival compared to winter wheat.
Since fertilizer P application after mid-September is prohibited, spring applications
of P are normally advised for winter cereal crops and these applications should be
made in February/early March before the onset of significant growth in the spring.
Restricted periods for fertilizer application as set out in the NAP regulations must
be observed.
Nitrogen management for oilseed rape
Oilseed rape is a crop that has increased in popularity in the last decade and better
advice was required by farmers and agronomists to manage N fertiliser inputs for
this crop more precisely and depending on the levels of growth over the winter
period. While some farmers will follow the green area index approach as a basis
for prescribing N fertiliser application rates and splits a more general and practical
guide to making decision on N fertiliser was included in the Green Book as
follows;
For backward crops or crops grazed extensively by pigeons a light dressing (30kg
N/ha) should be applied at the onset of spring growth (late Feb to early March), a
third of the remainder should be applied 10 days later and the final dressing in
early April.
On moderate crops, one third of the N should be applied in mid -March with the
rest applied in early April.
On large crops with lots of leaf area post winter, early N will encourage excessive
vegetative growth and applications should be delayed with the first third of the
total applied in late March/early April and the remainder applied as late as possible
whilst still allowing a uniform spread pattern between the tramlines (before the
crop gets too tall).
This approach can be further refined by assessing the extent of green or leaf area
development post winter using image analysis (mobile phone apps). A green area
index (GAI) of 0.5 or less can be considered ‘backward’ or grazed. An LAI of 0.5

48
to 1.5 would be normal, while anything above 1.5 at the end of February would be
considered large.
For spring oilseed rape some nitrogen will normally be applied to the seedbed, but
no more than 50 kg/ha N should be applied to reduce the risk of poor
establishment. The remainder of the nitrogen will be applied between the two-true
leaf stage and the early stem extension stage.
Facilitating Better Nutrient Advice
Over the last decade, since the introduction of environmental legislation on farms,
nutrient planning has changed from being a relatively straightforward field by field
process to being a complex whole farm nutrient balance based system. To deal with
the new complexity a variety of nutrient planning tools have been prepared to aid
farmers in meeting statutory requirements. However, the complexity of the
statutory requirement provided plans which were not suitable for guiding farmers
to apply chemical and organic fertilizers.
Teagasc undertook a process of consultation with farmers. The outcome of this
process was a request for a divergence in output within a nutrient management
planning system with tabulation based outputs for regulators but a much more
visual output for farmers integrating mapping and graphical outputs that support
the day to day actions at farm level. In developing NMP On-line Teagasc had three
main objectives:
- To improve nutrient management at farm level in support of more efficient,
competitive and profitable farming systems
- To improve the efficiency and quality of plans produced to meet the
statutory requirements
- To improve environmental outcomes, particularly in relation to water quality
and gaseous emissions
NMP On-line is available to all advisers and consultants working in Ireland. It
facilitates the efficient production of high quality nutrient management plans and
provides a basis for improving soil fertility management on Irish farms.
NMP On-line utilises a data-set of farm information to allow a consultant to work
with a farmer to create a nutrient management plan. Much of the required data is
available from other sources and the system integrates with many databases to
speed up the planning process. Connected databases include Department of
Agriculture Food and the Marine (DAFM) land parcel data, DAFM livestock
information, and soil analysis results.
The NMP On-line planning system is based on two main rule sets. The first is the
European Union - National Action Programme (NAP) (Good Agricultural Practice
for Protection of Waters) regulations. This provides the regulatory rules which set

49
the limits for fertilizer use at farm level. The Teagasc Green Book (Major and
Micro Nutrient Advice for Productive Agricultural Crops) provides the basis for
the recommendation for field by field application of organic and chemical nutrient
based on crop and animal requirements.
Figure 3. Conceptual framework of the Teagasc NMP Online system.
50
A nutrient management plan needs to satisfy two basic requirements:
1. To provide a plan to the farmer in a comprehensible format that will act as
a guide to the application of organic and chemical fertilizer and which will
support the achievement of a good soil fertility status and targeted crop
output on the farm
2. To provide a plan to show compliance with regulation and to be in a format
required by the statutory authorities
Conclusions
Fertilizer advice from Johnstown Castle has always been based on a combination
of agronomic and economic factors. In recent decades, environmental sustainability
which has been given increased prominence and is advocated by adherence with
codes of good agricultural practice (Anonymous, 2001), by taking account of
nutrients in organic manures, and by applying no more nutrients than were
necessary to achieve optimum yields of crops. As more scientific studies are
conducted with the aim of increasing the technical and environmental efficiency of
Irish farm production systems, new advice must be developed and effectively
disseminated to achieve practice adoption by advisors and farmers. The new Green
Book of nutrient advice is an example of this process and aims to provide the
agricultural industry with the latest knowledge to manage our most important
resource “our soils” for the future.
Acknowledgements
Finally, we would like to acknowledge all who contributed the review process and
to delivery of the new Teagasc “Green Book”.
References
Anon. (2006). European Communities (Good Agricultural Practice for Protection
of Waters) Regulations 2006. SI 378 of 2006. Department of Environment,
Heritage and Local Government. The Stationary Office, Dublin, 49 pp.
Antille, D.L., Hoekstra, N.J. and Lalor, S.T.J. (2015). Field-scale evaluation of
Calcium Ammonium Nitrate, Urea and urea Treated with N-(N-Butyl)
Thiophosphoric Triamide applied to grassland in Ireland. Communications in
soil science and plant analysis. 46:11, 1345-1361.
Buckley, C., Wall, D.P., Moran, B., O’ Neill, S. and Murphy, P.N.C. (2016a)
‘Farm gate level nitrogen balance and use efficiency changes post
implementation of the EU Nitrates Directive’. Nutrient Cycling in
Agroecosystems, 104: 1-13.

51
Buckley, C., Wall, D.P., Moran, B., O’ Neill, S. and Murphy, P.N.C. (2016b)
‘Phosphorus management on Irish Dairy farms post controls introduced under
the EU Nitrates Directive’. Agricultural Systems, 142: 1-8.
Coulter B. S., (2000). The Development of Agronomic Advice on the Use of
Nutrients and Trace Elements for Grassland and Tillage Crops. Proc. Fert.
Assoc. of Ireland Winter Scientific Meeting, 38, 80-95.
DAFM (2015) Department of Agriculture, Food and the Marine. (2015). Food
Wise 2025.
Available:www.agriculture.gov.ie/media/migration/foodindustrydevelopmenttra
demarkets/foodwise2025/report/FoodWise2025.pdf.
Daly, K., Styles, D., Lalor, S. and Wall, D.P. (2015). Phosphorus sorption, supply
potential and availability in soils with contrasting parent material and soil
chemical properties. European Journal of Soil Science 66, 792-801 ISSN 1351-
0754.
EPA (2016). Irelands environment 2016 - An assessment. Environment Protection
Agency, Wexford. ISBN: 978-1-84095-679-5
http://www.epa.ie/pubs/reports/indicators/irel andsenvironment2016.html
EPA (2016). AgImpact Project: Identifying Approaches to Improving Knowledge
Exchange (KE) in the Irish AgriFood Sector using Expert Opinion.
Environment Protection Agency, Wexford.
www.epa.ie/pubs/reports/research/water/researchreport175.html
Forrestal, P.J., Harty, M., Carolan, R., Lanigan, G.J., Watson, C.J., Laughlin, R.J.,
McNeill, G., Chambers, B. and Richards, K.G. (2016a). Ammonia emissions
from urea, stabilised urea and calcium ammonium nitrate: insights into loss
abatement in temperate grassland. Soil Use and Management. 32: 92-100.
Forrestal, P.J., Wall, D.P., Carolan, R., Harty, M.A. Roche, L.M, Krol, D.J.
Watson, C.J., Lanigan, G.J. and Richards, K.G. (2016b). Effects of urease and
nitrification inhibitors on yields and emissions in grassland and spring barley.
Proceedings of the International Fertiliser Society, Cambridge, U.K. 9th
December, 2016.
Harty, M.A., Forrestal, P.J., Carolan, R., Watson, C.J., Hennessy, D., Lanigan,
G.J., Wall, D.P and Richards, K.G. (2017). Temperate grassland yields and
nitrogen uptake are influenced by fertilizer nitrogen source. Agronomy Journal
109: 1-9.

52
Hennessy, T., Buckley, C., Cushion, M., Kinsella, A. and Moran, B. (2011).
Teagasc Report-‘National farm survey of manure application and storage
practices on Irish farms’. Available at
https://www.teagasc.ie/media/website/publications/2011/1001/Teagasc
NationalFarmSurveyOfManureApplication.pdf
Lalor, S.T.J., Coulter, B.S., Quinlan, G. and Connolly, L., 2010. A survey of
fertilizer use in Ireland from 2004–2008 for grassland and arable crops. Project
report, RMIS 5943. Teagasc, Johnstown Castle Environment Research Centre,
Wexford, Ireland. March 2010, ISNB No. 1-84170-557-8.
Lalor, S.T.J., Schröder, J.J., Lantinga, E.A., and Schulte, R.P.O. (2014) Effect of
application timing and grass height on the nitrogen fertilizer replacement value
of cattle slurry applied with a trailing-shoe application system. Grass and
Forage Science. 69(3) 488-501.
Mihailescu, E., Murphy, P.N.C., Ryan, W., Casey, I. and Humphreys, J. (2014)
‘Nitrogen balance and use efficiency on twenty-one intensive grass-based dairy
farms in the South of Ireland’. Journal of Agricultural Science, 152: 843-859.
Mihailescu, E., Murphy, P.N.C., Ryan, W., Casey, I. and Humphreys, J. (2015)
‘Phosphorus balance and use efficiency on 21 intensive grass-based dairy farms
in the South of Ireland’. Journal of Agricultural Science, 153: 520-537.
Murphy, P.N.C., Mellander, P-E., Melland, A., Shore, M., Shortle, G., Wall, D.P.,
Treacy, M., Shine, O., Mechan, S., and Jordan, P. (2015) ‘Variable response to
phosphorus mitigation measures across the nutrient continuum in a dairy
grassland catchment’. Agriculture, Ecosystems and the Environment, 207: 192-
202.
Plunkett M. and Wall D. 2016, Soil fertility trends – latest update. In Proceedings
of Fertiliser Association of Ireland Spring Scientific Meeting 2016. Fertilising
for yield and profit, Horse and Jockey, Tipperary, 2nd Feb, 2016. Publication
No 51.
Roche, L., Forrestal, P.J., Lanigan, G.J., Richards, K.G., Shaw, L.J. and Wall, D.P.
Impact of fertiliser nitrogen formulation, and N stabilisers on nitrous oxide
emissions in spring barley. (2016). Agriculture Ecosystems and the
Environment. 233: 229-237.
Schröder, J.J. Schulte, R.P.O., Creamer, R.E., Delgado, A. van Leeuwen, J.,
Lehtinen, T. Rutgers, M., Spiegel, H. J., Staes, J., Tóth G. and Wall, D.P.
(2016). The elusive role of soil quality in nutrient cycling: a review. Soil Use
and Management, DOI:10.1111/sum.12288.
Teagasc (2012) www.teagasc.ie/crops/grassland/heavy-soils/

53
Wall, D.P., Plunkett, M., Hackett, R., and Lalor, S.T.J. (2013). Phosphorus
fertilizer applications to cereals: Comparing different methods for phosphorus
use efficiency. Proceedings of the International Fertiliser Society, Cambridge,
U.K. 13th December, 2013.
Wall and Plunkett (2016). Major and micronutrient advice for productive
agricultural crops, Teagasc, Environment Research Centre, Johnstown Castle,
Wexford. October 2016. ISBN: 978-1-84170-632-0.
https://www.teagasc.ie/media/website/publications/2016/ soil-fertility-
green.pdf.