THE FERTILIZER ASSOCIATION OF IRELAND Proceedings of ...
21
THE FERTILIZER ASSOCIATION OF IRELAND Proceedings of Spring Scientific Meeting 2009 “Fertilizer in 2009 – Economics and Agronomy” 3 rd February 2009 Horse and Jockey, Thurles, Co Tipperary World fertilizer markets – future prospects, supply and demand Mr. Bernard Brentnall, Fertilizer Consultant, UK Grassland management and fertilizer use on intensive dairy farms Dr. Brendan Horan, Teagasc, Moorepark The need for trace elements in grass and crop nutrition Mr. Ian Robertson, The Glenside Group Ltd., Scotland. www.fertilizer-assoc.ie Publication No. 44
Transcript of THE FERTILIZER ASSOCIATION OF IRELAND Proceedings of ...

THE FERTILIZER ASSOCIATION OF IRELAND
Proceedings of Spring Scientific Meeting 2009
“Fertilizer in 2009 – Economics and Agronomy”
3rd February 2009
Horse and Jockey, Thurles, Co Tipperary
World fertilizer markets – future prospects, supply anddemandMr. Bernard Brentnall, Fertilizer Consultant, UK
Grassland management and fertilizer use on intensive dairyfarmsDr. Brendan Horan, Teagasc, Moorepark
The need for trace elements in grass and crop nutritionMr. Ian Robertson, The Glenside Group Ltd., Scotland.
www.fertilizer-assoc.ie
Publication No. 44

FERTILIZER ASSOCIATION OF IRELAND
PRESIDENTSName Year Name Year
Dr T Walsh 1968 Mr T King 1989
Mr WJC Milne 1969 Mr G Leonard 1990
Mr G Foley 1970 Dr TF Gately 1991
Dr JN Greene 1971 Mr LT Stafford 1992
Me EJ Sheehy 1972 Mr R Walsh 1993
Mr JC Brogan 1973 Mr J Gavin 1994
Mr T James 1974 Mr J Murphy 1995
Prof DM McAleese 1975 Mr L Larkin 1996
Mr S McCann 1976 Dr N Culleton 1997
Mr M Roche 1977 Dr P Barry 1998
Mr G Cussen 1978 Mr B Barnes 1999
Mr WE Murphy 1979 Mr C Watson 2000
Mr P McEnroe 1980 Mr M Cunningham 2001
Mr T Fingleton 1981 Mr P Drennan 2002
Mr J Leonard 1982 Mr J Carroll 2003
Mr P Duffy 1983 Dr T Storey 2004
Dr M Ryan 1984 Dr B Coulter 2005
Mr P Keane 1985 Dr B Coulter 2006
Dr JF Collins 1986 Mr J McGrath 2007
Mr M Stanley 1987 Mr T Carroll 2008
Mr W O’Brien 1988

FERTILIZER ASSOCIATION OF IRELANDProceedings of Spring Scientific Meeting 2009
3rd February 2009
Horse and Jockey, Thurles, Co. Tipperary
Publication No. 44
Edited by: Stan Lalor, Teagasc, Johnstown Castle, Wexford
Contents
Grassland Management and Fertilizer Use on Intensive Dairy Farms ............................ 2
Brendan Horan
Teagasc, Moorepark, Fermoy, Co. Cork
Livestock Health starts in the Soil ................................................................................... 16
Ian Robertson
The Glenside Group Ltd.,
Block 2, Unit 4, Bandeath Estate, Throsk, Stirlingshire,
FK7 7XY Scotland

2
Grassland Management and Fertilizer Use on IntensiveDairy FarmsBrendan Horan
Teagasc, Moorepark, Fermoy, Co. Cork
Introduction
The introduction of milk quotas on Irish dairy farms capped production and focusedproducers on profitability per litre of quota by reducing production costs on theirfixed quotas (Shalloo et al., 2004). This policy indirectly motivated producers toincrease milk production performance per cow and resulted in gross underproduction and utilisation of home grown feed on Irish farms. Recent analysis carriedout within the EU has suggested that milk quotas are now constraining thedevelopment of an efficient European dairy industry (van Berkum and Helming,2006). Quota deregulation will result in a reduction in dairy farm numbers withinternational prices determining the price received by farmers for their milk.However, despite a decrease in the number of farms, there will be an expansion inoverall production due to increases in cow numbers; land conversions from otherenterprises to dairying; reductions in input costs; and increases in productivity asfarmers reduce expenditure and redistribute resources to areas of comparativeadvantage (Philpott, 1995). Ireland has a comparative advantage over other countriesin the production of milk because of our temperate grass growing climate and lowercosts of milk production. Lips and Rieder (2005), in an international analysis of theimpact of quota change, have projected that EU quota abolition will allow productionto move to areas of competitive advantage such as Denmark, Ireland and theNetherlands, predicting that milk production in Ireland could increase by up to 39%post quotas. A further study of Irish dairy farmers in 2007 (O’Donnell et al., 2008)showed that with best practice management among existing suppliers, milkproduction could increase by 80% post milk quotas.
Recent EU level policy outlook press releases suggest that EU milk quotas will beincreased by 9% between 2008 and 2015. This increase which includes a 2% rise inApril 2008 is anticipated to include an approximate 2% increase due to the removalof butterfat correction on quotas as part of the Health check review in 2009 andfurther annual 1% increases in overall EU quotas between 2009 and 2015. There areonly 6 countries anticipated to increase milk production in line with quota increases(Austria, Denmark, Germany, Ireland, Italy, Luxembourg and The Netherlands) andit is also expected that only 2/3rd or 6% of the total increase in quotas will be takenup in the period to 2015. On that basis and taking into consideration the EU
3
preference for a ‘soft landing’ for dairy markets prior to quota removal in 2015, EUdairy farmers are unlikely to experience milk quotas beyond 2011 if not before.
A Change in Objective for Dairy Production Research
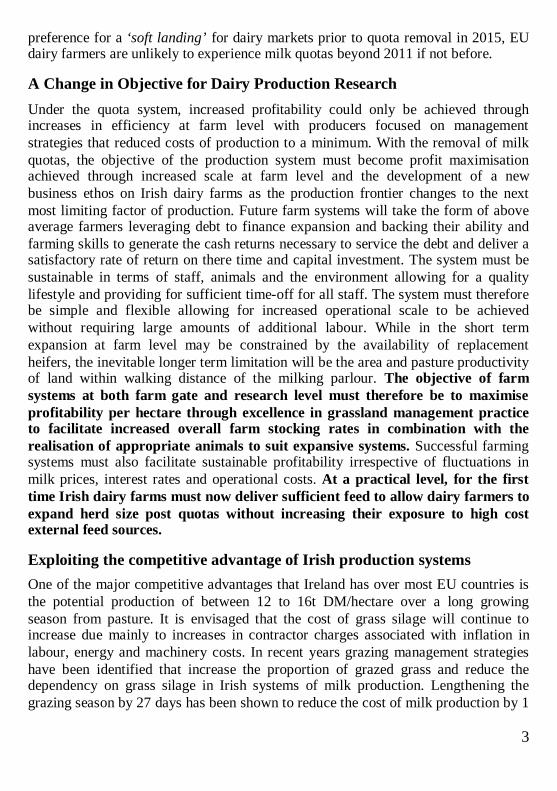
Under the quota system, increased profitability could only be achieved throughincreases in efficiency at farm level with producers focused on managementstrategies that reduced costs of production to a minimum. With the removal of milkquotas, the objective of the production system must become profit maximisationachieved through increased scale at farm level and the development of a newbusiness ethos on Irish dairy farms as the production frontier changes to the nextmost limiting factor of production. Future farm systems will take the form of aboveaverage farmers leveraging debt to finance expansion and backing their ability andfarming skills to generate the cash returns necessary to service the debt and deliver asatisfactory rate of return on there time and capital investment. The system must besustainable in terms of staff, animals and the environment allowing for a qualitylifestyle and providing for sufficient time-off for all staff. The system must thereforebe simple and flexible allowing for increased operational scale to be achievedwithout requiring large amounts of additional labour. While in the short termexpansion at farm level may be constrained by the availability of replacementheifers, the inevitable longer term limitation will be the area and pasture productivityof land within walking distance of the milking parlour. The objective of farmsystems at both farm gate and research level must therefore be to maximiseprofitability per hectare through excellence in grassland management practiceto facilitate increased overall farm stocking rates in combination with therealisation of appropriate animals to suit expansive systems. Successful farmingsystems must also facilitate sustainable profitability irrespective of fluctuations inmilk prices, interest rates and operational costs. At a practical level, for the firsttime Irish dairy farms must now deliver sufficient feed to allow dairy farmers toexpand herd size post quotas without increasing their exposure to high costexternal feed sources.
Exploiting the competitive advantage of Irish production systemsOne of the major competitive advantages that Ireland has over most EU countries isthe potential production of between 12 to 16t DM/hectare over a long growingseason from pasture. It is envisaged that the cost of grass silage will continue toincrease due mainly to increases in contractor charges associated with inflation inlabour, energy and machinery costs. In recent years grazing management strategieshave been identified that increase the proportion of grazed grass and reduce thedependency on grass silage in Irish systems of milk production. Lengthening thegrazing season by 27 days has been shown to reduce the cost of milk production by 1

4
cent/litre. Continued technical innovation in grazing management will further reducethe cost of milk production and therefore ensure the viability of the dairy industry asa whole. Figure 1 shows a strong relationship between total costs of production andproportion of grass in the cow’s diet in a number of countries (Dillon et al., 2005).The data also show that increasing the proportion of grazed grass in a system thatalready entails a high proportion of grazed grass (UK and Ireland) will have a greaterbenefit in reducing the cost of milk production than a country that already has a lowproportion (Denmark and US). The relationship shows that the average cost of milkproduction is reduced by 1 cent/litre for a 2.5% increase in grazed grass in the cow’sdiet. The level of grass utilization on the average Irish dairy farms is relatively lowand can be increased significantly through increased stocking rate and applyingmodern grazing management technology.
y = -0.0033x2
+ 0.0415x + 34.034R2 = 0.9074
0
10
20
30
40
0 20 40 60 80 100
Proportion of grass in diet (% )
To
tal
co
sts
of
pro
du
ctio
n(€
c/l) US (Confined)
Denm ark
US (Grazing)
G erm any
The Netherlands
France
UK
Ireland
Australia
New Zealand
Figure 1. Relationship between total costs of production and proportion of grazed grassin the cow’s diet.
Table 1 outlines the overall changes in management practice at Curtins farm,Moorepark over the last 8 years, as well as the impact of management changestowards the development of superior milk production systems for a quota freeenvironment. The overall objective of all systems research is now to increase farmprofitability per hectare by implementing practices to increase the amount of energyharvested per hectare for milk productivity by increasing milk solids production fromhome-grown feed while improving nutrient use efficiency. Unlike the results

5
presented from Lincoln University dairy farm, Curtins can still be considered at anearly developmental phase in terms of these new systems characteristics. Asillustrated in the Table 1, the stocking rate on the farm has increased from 2.5 LU/hain 2005 to 2.82 LU/ha in 2008, while reducing both concentrate use and artificialfertiliser usage. Grazing management practice has resulted in total pasture productionincreases of 25% from 12.5ton DM/ha on grazing paddocks in the 2001 to 2005period to 15.7 tons DM/ha in 2008. (This increase in total growth has resulted in thedevelopment of a surplus of 1.6 tons of DM per hectare on the farm which willincrease stock carrying capacity to 3.3 LU per hectare for next season.) Milk solidsproduction per cow have fallen from 500kg to 430 kg due to increased grazingintensity and reduction in concentrate usage and consequently milk solids productionper hectare has largely remained static. The net consequence of these initial 2 yearsof development have been to identify significant quantities of extra feed withinthe system, which coupled with a further increase in overall farm stocking rateto 3.3 LU/ha will facilitate the realisation of increased milk solids productionper hectare from home grown feed in future years. The productivity gainindicators on which we will judge our success over the next 5 years are outlined inthe target column of Table 1 below.
Table 1. A comparison of the Curtins Farm production system 2001-2008.
Year 2001-2005 2007 2008 Target
Stocking rate (LU/ha) 2.5 2.65 2.82 3.3
Concentrate (kg/cow) 350 190 175 -Fertilizer (kg N/ha) 300 305 246 250
Grass growth (t DM/ha/yr) 12.5 14.7 15.7 18Surplus feed (t DM/ha) - 1.6 1.8 -
Milk solids (kg/cow) 500 478 430 450(kg/ha) 1,250 1,254 1,220 1,500
In terms of the individual management practices, the challenge within the farm gateis essentially four fold:
- Environmental sustainability based on increased nutrient use efficiency
- Grow more higher quality grass on each paddock within the farm
- Manage for high animal performance and a long grazing season
- Develop appropriate animals for high productivity within this system
6
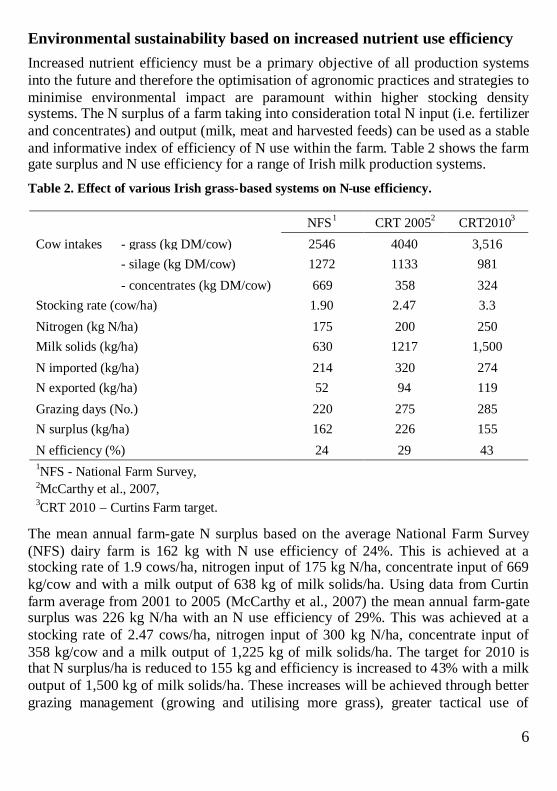
Environmental sustainability based on increased nutrient use efficiencyIncreased nutrient efficiency must be a primary objective of all production systemsinto the future and therefore the optimisation of agronomic practices and strategies tominimise environmental impact are paramount within higher stocking densitysystems. The N surplus of a farm taking into consideration total N input (i.e. fertilizerand concentrates) and output (milk, meat and harvested feeds) can be used as a stableand informative index of efficiency of N use within the farm. Table 2 shows the farmgate surplus and N use efficiency for a range of Irish milk production systems.
Table 2. Effect of various Irish grass-based systems on N-use efficiency.
The mean annual farm-gate N surplus based on the average National Farm Survey(NFS) dairy farm is 162 kg with N use efficiency of 24%. This is achieved at astocking rate of 1.9 cows/ha, nitrogen input of 175 kg N/ha, concentrate input of 669kg/cow and with a milk output of 638 kg of milk solids/ha. Using data from Curtinfarm average from 2001 to 2005 (McCarthy et al., 2007) the mean annual farm-gatesurplus was 226 kg N/ha with an N use efficiency of 29%. This was achieved at astocking rate of 2.47 cows/ha, nitrogen input of 300 kg N/ha, concentrate input of358 kg/cow and a milk output of 1,225 kg of milk solids/ha. The target for 2010 isthat N surplus/ha is reduced to 155 kg and efficiency is increased to 43% with a milkoutput of 1,500 kg of milk solids/ha. These increases will be achieved through bettergrazing management (growing and utilising more grass), greater tactical use of
NFS1 CRT 20052 CRT20103
Cow intakes - grass (kg DM/cow) 2546 4040 3,516- silage (kg DM/cow) 1272 1133 981
- concentrates (kg DM/cow) 669 358 324Stocking rate (cow/ha) 1.90 2.47 3.3
Nitrogen (kg N/ha) 175 200 250Milk solids (kg/ha) 630 1217 1,500
N imported (kg/ha) 214 320 274N exported (kg/ha) 52 94 119
Grazing days (No.) 220 275 285N surplus (kg/ha) 162 226 155
N efficiency (%) 24 29 431NFS - National Farm Survey,2McCarthy et al., 2007,3CRT 2010 – Curtins Farm target.

7
chemical N fertilizer and increased use efficiency of organic N fertilizer. The impactof these management practices is already evident from the Curtins site asgroundwater nitrate levels have reduced from 15.4mg/ litre in 2002 to 10.9mg/ litrein 2008.
Fertiliser Application Strategy
Regulations stipulating the quantities of fertilizer N that can be applied to grasslandhave been implemented under Statutory Instruments (SI No. 378 of 2006) whichcame into effect in Ireland on 1 August 2006 and a derogation from these regulationshas been granted until 17 July 2010 on Irish farms. In terms of fertilizer N use up toJuly 2010, we are allowed to apply 250kg N per hectare within the regulations. Thispermits us to grow sufficient feed up to 2.9 LU/ha. Despite the recent pricefluctuations, fertilizer N remains a very efficient supplement to the system based onefficient nutrient recovery. Our objective in this respect therefore is to maximisepasture growth from a well conceived application strategy to increaseproductivity and N use efficiency rather than to reduce fertiliser use below the250 kg N limit. Our existing application strategy is outlined below:
Spring
The quantity of fertiliser N to apply in spring becomes one of cost-effectivenessversus efficiency; i.e. high spring grass growth can be guaranteed by applyingsufficient fertiliser N, however losses can be considerable (O'Donovan al., 2004).Our current fertiliser strategy entails applying 23 units of urea per acre on 70% ofthe farm on the 15th of January in Cork and early February in Cavan when there isa low soil temperature, slow growth and a greater risk of low N use efficiency.The remaining 30% of the farm receives 2,500gals of watery slurry. Our secondapplication of N occurs in early March and is usually 40 units of urea on 90% ofthe farm, with the remaining area again receiving 2,500 gallons of slurry whengrowth is more favourable and after drainage from the topsoil has normally ceased.A further advantage of this approach is that there is greater potential for retentionof applied fertiliser N in the topsoil and to recover this residual-N later in thegrowing season (Murphy, 1977). The second rotation on the farm commences onApril 3rd and typically we will follow the cows with 20 units of N per acre untilgrass supply allows us to reduce application rate to 13.5 units per acre. Up tomid- April we use urea, as Herlihy (1988) found that there was a better responseto urea than to CAN applied in spring in terms of DM production and recovery ofN by the pasture and because urea is the more cost-effective fertiliser to applyduring the spring.

8
SummerMid-season fertilizer use is entirely based on the feed budget outlined in Figure 2.Application rate will fluctuate between 13.5 and 20 units of CAN per acre on arotational basis after grazing on rotation lengths of 16 days. Total N application of43kg N per hectare is typical during May and June and reducing to 21kg N/ha duringJuly as the rotation length extends.
0
50
100
150
200
250
300
350
400
450
21 -
J un
0 5-J
ul
1 9-J
ul
02-A
u g16
-Aug
3 0-A
ug1 3
-Sep
2 7-S
e p1 1
-Oct
2 5-O
ct0 8
-No v
2 2-N
ov06
-Dec
20-D
ec0
3-Ja
n1
7 -Ja
n3
1 -Ja
n1
4-F
eb2
8-F
eb1
4-M
ar
28 -
Ma
r1 1
-Ap
r25
-Ap
r0 9
-Ma y
2 3-M
ay0
6-Ju
n
Far
mco
ver
(kg
DM
/LU
)
Target supply Actual supply
Figure 2. Curtins farm feed budget 2008/2009.
Autumn
Once again fertiliser application rates during August and up to the start of Septemberwill depend on the feed budget usually resulting in 21 and 33 kg N/ha being appliedin August and September, respectively. In early September, 40 units of Urea per acrewill be applied on a number of paddocks in front of the cows to ensure high growthrates into October.
Growing more higher quality grass
The extent to which new growth occurs is dependant on soil fertility, climaticconditions (moisture, sunlight) and sward characteristics (variety and leaf area). Ourapproach to maximise pasture production has focused on creating the idealenvironment for growth by:

9
1) Annually reviewing soil fertilityIn general terms these results show that Curtins farm is soil index 4 for P and alsohigh in K. Therefore no additional dressing of either P or K are applied each year.With the exception of dry summers when the farmlets receive either Sulpha CAN orASN, only CAN or Urea are applied during the season.
2) Maximise sward sunlight penetration by grazing to 3.5cm residual height
The sward grazing residual is the primary determinant of overall pasture production,as net pasture production results from the difference between pasture growth anddecay within the sward. Optimal growth will be achieved by grazing to keep stemcompressed and the growing point below grazing height. If stem is allowed toelongate, the growing point will be removed during the grazing process resulting inreduced regrowth rates. The optimum post-grazing height for net pasture productionis 3.5cm. In poorly grazed swards (>4cm residual), the remaining material decayswhile the shading effect of this material prevents light reaching the primary growingpoints in the newly formed tillers at the base of the sward. Figure 3 illustrates theimpact of residual grazing height on net leaf production from the sward.
When residual grazing height is 6cm, approximately 30% of the material remainingin the sward is senesced and unavailable for future production. At a practical level,grazing to 3.5cm removes the requirement for topping which further reduces totalannual production by 3 to 5%.
3) Maximise sward leaf area by realising the optimal grazing horizon
Leaf area within the sward determines the portion of incoming solar radiation that isintercepted and absorbed by green leaf. While maintaining an optimal grazingresidual will ensure green leaf availability to the sward base, ensuring that the pre-grazing herbage mass is maintained at 1,200 to 1,400kg DM per hectare will ensurethat the post-grazing pasture is leafy to the base and capable of trapping light fromthe day of grazing.
4) Reseed underperforming paddocksIdentify and reseed 15% of the lowest productivity sward each season. At highstocking rates, feed budgetary requirements will restrict opportunities for reseeding.Spring reseeding in mid-April will allow area to be removed from the system for 7weeks without influencing the overall feed budget. Varieties currently being usedinclude Tyrella and Bealey.

10
Figure 3. Relationship between herbage mass and leaf growth, leaf senescence, and netherbage production in continuously grazed swards (adapted from Bircham andHodgson, 1983).
Manage for high animal performance over a long grazing season
Within the context of the grazing residual criteria outlined above, managementpractice will continue to have a significant impact on the ability of herds to achievehigh animal performance over an extended grazing season. In this respect there arethree critical components:
a) Measurement and feed budgetingAs stocking rates increase on Irish farms, the financial implications of deviationsfrom the herd feed budget are likely to cause significant financial loss. On that basis,management practice must be disciplined to react swiftly based on measurement ofany surplus/deficit within the system. Figure 2 represents the feed budget for Curtinsfarm over the winter/spring period and illustrates how immediate reaction tounanticipated changes to pasture growth can ensure that minimum additional cost isincurred while still extending the grazing season into late November.
120
100
80
60
40
20
0
0 500 1000 1500 2000
0 1 2 3 4 5 6 7 8
Growth
Net Production
Senescence
Herbage Mass (kg DM/ha)
Sward Height (cm)
Rat
e(k
gD
M/h
a/da
y)

11
b) Maintaining the grazing horizonThe DM intake of the dairy herd is partially determined by residual grazing heightbut is also partially determined by the relationship between pre-grazing herbage massand post-grazing residual height. As evident from Figure 4 (INRA, 2007), a DMintake of 15kg per cow per day will only be achieved where pre-grazing sward heightis maintained at 8cm. For every 1cm increase in pre-grazing sward height above8cm, pasture DM intake will be reduced by 0.5 kg DM per cow per day or equivalentto a reduction of 0.11 kg of milk solids per cow per day.
Figure 4. The relationship between pasture pre-grazing height, pasture post-grazingheight and DM intake per cow per day (adapted from INRA, 2007).
c) Changing cow behaviour to increase DM intake
The habitual behaviour of dairy cows is often ignored by dairy farmers and can haveimportant consequences on animal performance from pasture. Previous grazingbehaviour experiments have observed two main grazing bouts during the day, one inthe morning and another in the evening (Rook et al., 1994; Linnane et al., 2001),generally coinciding with the time cows return to pasture after milking. Kennedy etal. (2009) designed an experiment to manipulate cow grazing behaviour to increasedaily DM intake and maintain performance during periods of inclement weather.The hypothesis of the experiment was to restrict access time to pasture to periods ofthe day when advantage could be taken of the cow’s natural drive to graze/forage –
2
3
4
5
6
7
8
7 8 9 10 11 12 13 14 15 16 17 18
Pre-grazing height (cm)
Po
st-g
razi
ng
hei
gh
t(c
m)
15 kg DM/cow/day
14 kg DM/cow/day
Reducing DM intake

12
early in the morning and later in the evening. Three treatments were used during theexperiment; cows at grass full-time between milkings (24hr); cows at grass for only 9hours between morning and evening milking (9hr); and cows at grass for 2 periods of3 hours after each milking (2x3hr). No silage was offered to animals when housed.Table 3 below shows the results from this experiment.
Table 3. The impact of restricted access time on animal performance and grazingbehaviour.
Access Time (hrs) 24hr 9hr 2×3hr
Milk solids yield (kg/day) 1.7 1.7 1.6Grazing time (hr/day) 9.0 7.2 5.8
% of time spent grazing 41 80 97DM Intake (kg/cow/day) 17.4 15.7 16.6
% of 24hr intake achieved 90 95
Kennedy et al., 2009
The results show that where cows are given access to pasture for only 6 hours perday in two three hour blocks/periods, animals have a much greater grazing efficiencyand will compensate for the short access time by adjusting their natural grazingbehaviour (grazing time and bite rate) to achieve 95% of total 24 hour intake throughincreased foraging behaviour during the grazing window. On the basis of this study,management practice has been adjusted to restrict access time during inclementconditions, while providing no silage to animals at housing thereby ensuring agreater compulsion to graze at the next allocation.
Develop appropriate animals for high productivity within this system
The system as outlined above is based on creating the ideal environment within thefarm to grow higher quantities of higher energy pasture which can in turn feedadditional animals and consequently realise new levels of productivity. This entireprocess will only be successful if animals that are capable of high milk solidsproduction, good reproductive performance, and maintaining a satisfactory bodycondition score (BCS) can be identified for higher stocking rate systems. Ultimately,excellence in grassland management will reach a certain energy production capacitywithin the farm gate at which point further increases in productivity can only berealised through increases in feed conversion efficiency. While Irish dairy farms aremany years removed from reaching the feed production capacity of their farms, theselection of animals with increased feed conversion efficiency must now begin inearnest to realise such animal characteristics in advance of this necessity. On thatbasis, recent results from the New Zealand Cattle Database (LIC, 2006) show thatwithin the New Zealand cow population, high genetic potential (EBI/BW) Jersey

13
cross-Holstein-Friesian progeny outperform the two parent breeds in terms oflifetime productivity, survival and feed conversion efficiency (Table 5). Consistentwith this finding, a review of 11 experiments by Grainger and Goddard (2004)showed that Jersey cows had higher DM intake per 100 kg live weight had higherfeed conversion efficiency (g milk solids per kg of DM intake).
Table 4. Productive performance and measures of efficiency of the major breed groupsof dairy cattle in New Zealand (production season 2005-06; Livestock Improvement,2006).
Breed of cow
MeasurementHolstein-
Friesian (F) Jersey (J)Crossbred
(JFX)Number of lactating cows 1,956,461 562,290 1,009,041
Lactation length, days 219 223 222Milk solids yield kg 329 295 328
Live weight, kg 490 378 444Pasture dry matter required, kg1 4454 3732 4234
Feed conversion efficiency2 73.9 79.1 77.51Pasture dry matter required for production, maintenance and pregnancy calculatedaccording to AFRC (1991).2Feed conversion efficiency calculated as (kg fat + kg protein)/t pasture dry matter.
Conclusions
As a collective industry, we have underestimated the profit potential into the futureof simple low cost grazing systems. Recent research results within Irish grass-basedsystems demonstrate that considerable potential exists to increase pasture growth andquality beyond historical levels, while improving nutrient use efficiency throughimproved management practice in combination with a reseeding programme onpoorly performing pastures. When this increase in sward productivity is matchedwith an appropriate stocking rate, the performance and profit potential per hectare ofIrish dairy farms can increase significantly in a no milk quota scenario and on thatbasis management systems (animals and pastures) should now be implementedtowards this defining objective.
(Weekly updates on research herds at Moorepark are available online at:www.agresearch.teagasc.ie/moorepark)

14
AcknowledgementsTeagasc Moorepark wishes to acknowledge National Dairy Levy, NDP and EUFunding for this research.
ReferencesBircham, J. and Hodgson, J. 1983. The influence of sward condition on rates of
herbage growth and senescence in mixed swards under continuous stockingmanagement Grass and Forage Science 38, 323-331.
Dillon P, Roche J R, Shalloo L and Horan B (2005) Optimising financial return fromgrazing in temperate pastures. In Utilisation of Grazed Grass in TemperateAnimal Systems. Murphy J J ed. Proceedings of a Satellite Workshop of the XxthInternational Grassland Congress, Cork, Ireland.
Grainger, C.; Goddard, M.E. 2004: A review of the effect of dairy cow breed on feedconversion efficiency- an opportunity lost? Proceedings of the 25th BiennialConference of Australian Society of Animal Production, University ofMelbourne, Victoria July 4-8.
Herlihy, M. (1988) Optimising efficiency of fertiliser-nitrogen for grassland ins p r i n g . Proceedings of the 12t h General Meeting of the European GrasslandFederation, Dublin, 1988, 333-337.
INRA, 2007. Alimentation des bovines, ovins et caprins, Besoins des animaux –valeurs des aliments. ISBN: 978-2-7592-0020-7, ISSN: 1952-2770.
Kennedy, E., M. McEvoy, J.P. Murphy, and O'Donovan, M. 2009. Effect ofrestricted access time to pasture on dairy cow milk production, grazing behaviourand dry matter intake. Journal of Dairy Science (In press).
Livestock Improvement, 2006: Dairy statistics 2005 – 2006. Livestock ImprovementCorporation, Hamilton, New Zealand.
Lips, M. and Rieder, P., 2005. Abolition of Raw Milk Quota in the European Union:A CGE Analysis at the Member Country Level. Journal of AgriculturalEconomics 56: 1-17.
Linnane, M.I., A.J. Brereton and P.S. Giller. 2001. Seasonal changes in circadiangrazing patterns of Kerry cows (Bos Taurus) in semi-feral conditions in KillarneyNational Park, Co. Kerry, Ireland. Appl Anim Behav Sci 71: 277-292.

15
McCarthy S., Horan, B., Dillon, P., Berry, D.P., O’Connor, P., Rath, M. and Shalloo,L. 2007. Economic Comparison of Divergent Strains of Holstein-Friesian DairyCows in Various Pasture-based Production Systems. Journal of Dairy Science 90:1493-1505.
Murphy, W.E. (1977) Management factors affecting seasonal growth pattern ing r a s s l a n d p r o d u c t i o n . Proceedings of an International Meeting on AnimalProduction and Temperate Grassland, D u b l i n , J u n e 1 9 7 7 , 1 6 6 -1 2 0 .
National Farm Survey (NFS), 2007. Teagasc, Athenry, Ireland.
O’Donovan, M., Delaby, L., Stakelum, G. and Dillon, P., 2004. Effect ofautumn/spring nitrogen application date and level on dry matter production andnitrogen-efficiency in perennial ryegrass swards. Irish Journal of AgriculturalResearch 43, 31-41.
O’Donnell, S., L. Shalloo, B. Horan and A.M. Butler, 2008 A survey analysis ofopportunities, challenges and limitations of Irish dairy farmers. Journal of FarmManagement (In press).
Philpott, B., 1995. New Zealand Aggregate and Sectoral Productivity Growth 1960-95. RPEP Paper 274, Victoria University, Wellington, New Zealand.
Rook, A.J., C.A. Huckle, and P.D. Penning. 1994. Effects of sward height andconcentrate supplementation on the ingestive behaviour of spring-calving dairycows grazing grass-clover swards. Appl Anim Behav Sci 40: 101-112.
Shalloo L., P. Dillon, M. Rath, and E. M. Wallace. 2004. Description and validationof the Moorepark Dairy Systems Model. J. Dairy Sci. 87:1945-1959.
Van Berkum S. and Helming, J., 2006. European dairy policy in the years to come:impact of quota abolition on the dairy sector. Agricultural Economic ResearchInstitute, P.O. Box 29703, 2500 LS The Hague, The Netherlands.

16
Livestock Health starts in the SoilIan Robertson
The Glenside Group Ltd.,Block 2, Unit 4, Bandeath Estate, Throsk, Stirlingshire,
FK7 7XY Scotland
The Glenside Group have been working with farmers and their advisors for over 26years helping identify the key factors that are limiting crop yields, forage quality andanimal health.
Why do we look at soil nutrient management in greater detail?
If animals suffer from trace element deficiencies, is it because there is:
- not enough in the soil?
- or are they being locked up by high Molybdenum?
- or is it because the plant rooting system is not big enough or workingeffectively enough to be able pick up the trace elements?
Why do cows on some farms get milk fever and cows on other farms rarely do?Should you worry if a lot of animals are regurgitating their cud? Every problem has acause, and most start in the soil.
Where do we start?
We start with the Glenside Albrecht® Soil Survey which was developed by ProfessorWilliam A Albrecht who was head of soil science at the University of Missouri.
If you don’t measure it, you can’t manage it
What extra information does the Glenside Albrecht® soil survey give us?
- Total Exchange Capacity (CEC) (soil’s potential to hold nutrients)- Colloidal Organic Matter- Trace Elements- Base Saturation (% of different cations on the clay colloid)
It is important to know the soil’s capacity. Most soil analyses measure only the soilpH, rather than what effects pH. You can have a good pH but have an unbalancedsoil. Our objective is to take care of major and minor deficiencies. If you have aphosphate and a potassium deficiency as well as a trace element deficiency, start bytaking care of the P & K, because sorting out the trace elements is not going to workuntil your major nutrients are correct.

17
Table 1. Comparing desired levels for different CEC,s:
CEC 10 – light 15 – medium 20 - heavy 45 – very heavy
Desired Calcium (kg/ha) 3000 4500 6000 13500Desired Magnesium 320 480 640 1440
Desired Potassium 360 500 600 800Desired Phosphorus 268 272 278 396
Always take care of the Calcium and let the pH take care of itself
CropsBoron
Boron (B) is a very important element effecting the translocation of calcium andsugars, carbohydrate metabolism, hormone movement, nitrogen utilisation, fruitingand flowering. If you have low boron levels in grassland, your sugar levels can belower than expected. In maize crops the cobs may not fill out to the end. On the otherhand, boron is a very effective weed killer and excess applications of boron can betoxic and can kill a growing crop when used incorrectly.
Iron
Iron (Fe) is an indispensable carrier of oxygen required in the production ofchlorophyll. Most soils have excess iron levels which can interfere with the uptake ofcopper and zinc. The only way to reduce levels of iron is to introduce oxygen or sub-soiling to allow iron to leach away.
Manganese
Manganese (Mn) is required for carbohydrate metabolism and seed formation.
Copper
Copper (Cu) is vitally important to root metabolism, and helps form compounds suchas proteins and amino acids. It also helps produce dry matter via growth stimulation.
Zinc
Zinc (Zn) is vital to the life process of soil micro-organisms.
ChlorideChloride (Cl) has a negative effect on the beneficial bacteria in the soil which breakdown crop residues. By applying small amounts of chloride, the farmer may notnotice the gradual damage being done and, initially, may even see animals grazing

18
grass better. But as chloride builds up in the soil, it will also increase in the grazingand silage. An excess of sodium (Na) is synonymous with salt toxicity.
Molybdenum
Molybdenum (Mo) is essential for nitrogen fixing plants, governs micro-organismsneeded for anion nutrient uptake, and is interrelated in animal health where excessmolybdenum makes copper unavailable.
CalciumCalcium (Ca) is the most important nutrient for microbial activity. It promotes rootand leaf development and enhances the uptake of other nutrients. Lack of Calciumcan have severe health problems in animals such as milk fever.
pH
The measurement of pH on its own demonstrates the acidity or alkalinity of the soilbut does not tell you whether you have to little or too much calcium. If you have alow pH, that tells you the soil is lacking nutrients but not which nutrients are short.The cations calcium, magnesium, potassium and sodium will all raise soil pH.
Trace Elements and AnimalsIron
Iron (Fe) is vitally important in haemoglobin and oxygen transport in the animal.Excesses will have a depreciating effect on trace element absorption in the gut,leading to reduced feed intake and live weight gain.
Manganese
Manganese (Mn) is needed for growth and for fat and carbohydrate metabolism.Excesses will reduce other trace element absorption and haemoglobin production.
Copper
Copper (Cu) is essential for a large number of functions in the body including co-ordination. An excess will impair other trace element absorption, and result in liverdegeneration, ultimately leading to sudden death.
Zinc
Zinc (Zn) is fundamental for regeneration of body tissues. Excessive amounts willreduce liver function and the absorption of Calcium.
19
ChlorideSmall amounts of chloride (Cl) are required in the gastric juices. In ruminants, excesschloride levels increase osmotic pressure in the rumen and decrease the microbialpopulation, therefore leading to poorer feed conversion. First signs tend to be animalsbringing up their cud, excessive thirst, and nasal discharge. It can also lead to poorfertility and animal blindness in extreme cases.
MolybdenumMolybdenum (Mo) is needed for effective cellulose digestion. Deficiencies are veryrarely seen. Excess molybdenum is a greater risk, and can lead to major issues withcopper, sulphur, and iron, causing a wide range of animal health issues whichadversely impact on performance.
Calcium
Calcium (Ca) is essential in animals for good bone growth. High levels will upset thecation balance in the rumen, increase the requirement for phosphate, and will reducethe availability of a range of trace elements.
ConclusionsThe Albrecht® Soil Survey is a powerful diagnostic tool enabling farmers tomaximise the natural productivity of their soil whilst obtaining the full benefit of thefertiliser used.