ferrovial Ferrovial App · UNITED NATIONS PARTNER IN SUSTAINABLE DEV’T & MEMBER OF PRIVATE SECTOR...
62
ferrovial Ferrovial App
-
Upload
phamnguyet -
Category
Documents
-
view
213 -
download
0
Transcript of ferrovial Ferrovial App · UNITED NATIONS PARTNER IN SUSTAINABLE DEV’T & MEMBER OF PRIVATE SECTOR...

1
ferrovial Ferrovial App

2
FY2016 figures
TALENT MANAGEMENT: engaged on optimize workforce & develop mobility of talent.
ENGAGEMENT: focus on being an employer of choice in the sector and markets in which it works & promote a flexible work environment.
CULTURE: attend to develop company’s leaders for an innovative culture. Ferrovial UNIVERSITY
ACKNOWLEDGEMENTS Ferrovial has been included in the DJSI (Dow Jones Sustainability Index) for the last 15 consec years, at a global level; in the FTSE 4Good index for the past 11, in the Carbon Disclosure Project for the past 5, and is also a member of Stoxx and MSCI Global Sustainability Index.
Ferrovial assumes a firm commitment on emissions reduction and environmental impact of their activities. In addition, It also drives generation of new ideas and models of business, to offer its clients & users of its assets, innovative solutions with lower environmental impact.
People Environment TALENT MANAGEMENT, ENGAGEMENT & CULTURE Operating excellence & innovation are possible given Ferrovial employees’ talent, high engagement & corporate culture. Over 96.000 people work in the Group to offer the best solutions in the markets where it operates.
WORKFORCE
Ferrovial has been recognized as Top Employer in Spain for 7 consecutive years
SERVICES 81,0%
AIRPORTS 0,03% TOLL ROADS 0,9%
CONSTRUCTION 17,0%
New competences model for 360º performance appraisal.
Implementation of 70/20/10 development model to impulse professionals' improvement.
Meeting point to catalyze learning and knowledge
School that creates a unique leadership model of company to prepare leaders and innovative teams capable of anticipating new times by acting as internal references
Forum for exchange that facilitates synergies & global business opportunities
-31,6% REDUCTION OF CO2 EMISSIONS RECYCLED WASTE (t)
-18,1% 2.083.333 -35,4% IN RELATIVE TERMS
(tCO2 eq/€mn) (2009-2016)
IN ABSOLUTE TERMS (2009-2016)
NEW REDUCTION TARGET (2009-2016)
WATER FOOT PRINT • Business Water Index (BWI): 4,146,441. Water
footprint related to water consumption and discharge carried out in Ferrovial activities.
• Water Treatment Index (WTI): -322,183,025.
The impact of the water treatment process of Cadagua and the treatment of leachate in landfills of Ferrovial Servicios and Amey on the footprint of Ferrovial.
• Water Access Index (WAI): -413.738; related to water supply projects in Social Action program.
POLAND
3
FY2016 figures
INNOVATION PROCESS
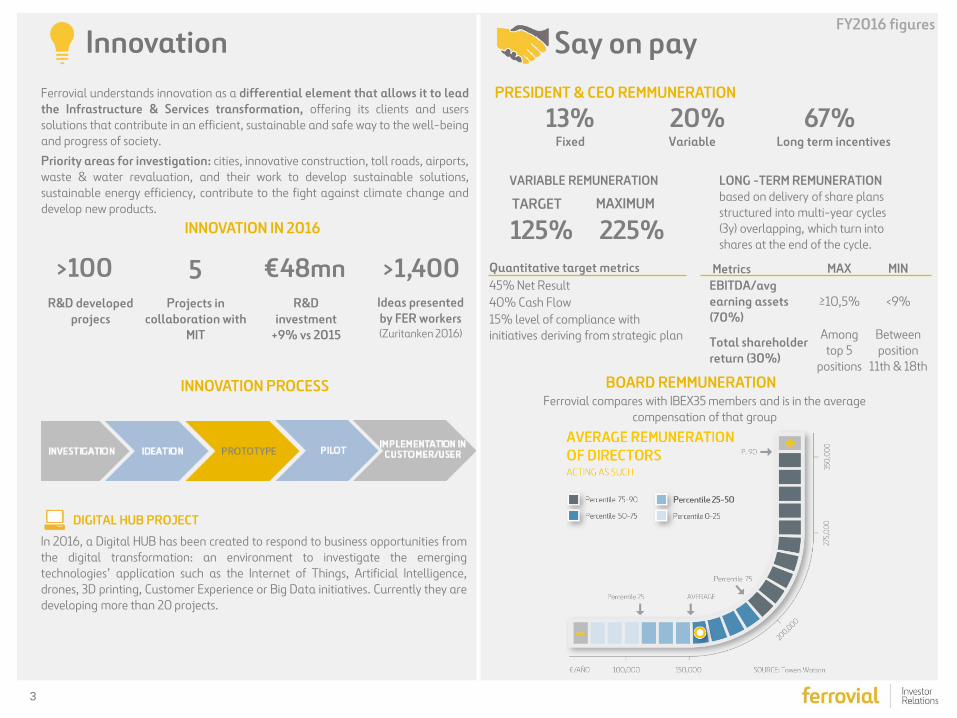
Ferrovial understands innovation as a differential element that allows it to lead the Infrastructure & Services transformation, offering its clients and users solutions that contribute in an efficient, sustainable and safe way to the well-being and progress of society. Priority areas for investigation: cities, innovative construction, toll roads, airports, waste & water revaluation, and their work to develop sustainable solutions, sustainable energy efficiency, contribute to the fight against climate change and develop new products.
INNOVATION IN 2016
>100 €48mn 5 R&D
investment +9% vs 2015
R&D developed projecs
Projects in collaboration with
MIT
DIGITAL HUB PROJECT
Say on pay Innovation PRESIDENT & CEO REMMUNERATION
13% 20% 67% Variable Fixed Long term incentives
BOARD REMMUNERATION
125% 225% MAXIMUM TARGET
VARIABLE REMUNERATION LONG -TERM REMUNERATION based on delivery of share plans structured into multi-year cycles (3y) overlapping, which turn into shares at the end of the cycle.
Metrics MAX MIN EBITDA/avg earning assets (70%)
≥10,5% <9%
Total shareholder return (30%)
Among top 5
positions
Between position
11th & 18th
Quantitative target metrics 45% Net Result 40% Cash Flow 15% level of compliance with initiatives deriving from strategic plan
Ferrovial compares with IBEX35 members and is in the average compensation of that group
In 2016, a Digital HUB has been created to respond to business opportunities from the digital transformation: an environment to investigate the emerging technologies’ application such as the Internet of Things, Artificial Intelligence, drones, 3D printing, Customer Experience or Big Data initiatives. Currently they are developing more than 20 projects.
>1,400 Ideas presented by FER workers (Zuritanken 2016)

4
FY2016 figures Community
UNITED NATIONS PARTNER IN SUSTAINABLE DEV’T & MEMBER OF PRIVATE SECTOR ADVISORY GROUP
In its commitment to the scope of Sustainable Development Goals (SDG), Ferrovial actively participates in the community through the development and execution of social programs to significantly improve people's lives. The company has a key role in the social and economic development of the countries where it carries out activities.
COMMUNITY INVESTMENT PROGRAMS Social Infrastructures Since 2011, Ferrovial has been working on this development cooperation program, which extends access to water for human consumption and basic sanitation among socially vulnerable risk groups in Africa and Latin America.
Stronger Together This program has been running since 2005 & lets employees choose social project to contribute a monthly amount that Ferrovial matches, thus doubling initial donation. In 2016, three projects were chosen by donating employees.
Community engagement in Spain Ferrovial supports refurbishment & reconditioning of offices set up for distributing food & delivering social aid packages to underprivileged groups. In 2016, Ferrovial provided support with World Vision España to improve conditions in 6 food distribution centers (Madrid, Seville, Mieres, Valencia & Barcelona).
332 COMMUNITY SUPPORT PROJECTS
191,769 BENEFICIARIES IN WATER AND SANITATION
Social Infrastructures Program: Figures & Impact
142,815 BENEFICIARIES
€1,498,126 INVESTED
€497,894 INVESTED
31,417 BENEFICIARIES
€4,565,595 INVESTED
191,769 BENEFICIARIES
18 PROJECTS
Policy Changes:
10% OF ANNUAL BUDGET for
extension of project
Community Commitment
933,152 m3
RECYCLED WATER
Out of which
875,104 m3
TREATED WATER

5
Ferrovial overview & strategy
Ferrovial main assets
Ferrovial FY16 results
Ferrovial 1Q17 results
Appendix: 407ETR toll road Managed Lanes toll roads 407ETR vs Managed Lanes Diversified porftolio Historic consolidated & business units figures
Table of Contents

6
Who we are… A transport infrastructure provider/operator with a strong focus on CF generation, based in Spain, but with c.88% international SOTP.
Pricing power, dynamic tolling & very long duration are our main differential factors vs other toll road operators. 407ETR (downtown Toronto, 43% stake) represents 43% of our value. Open, fully electronic, with +9% 2002-15 tariff CAGR, +9.5% 2016. Our managed lanes in Dallas (US) have an even more flexible tariff structure; prices can change every 5 minutes. We own & operate Heathrow (25%) & 3 regional airports (50%) in UK. Annual dividends received from 407ETR & Airports are above €400mn.
Our Construction unit is a tool to compete for complex infrastructure projects (80% of sales are civil works) present mostly in US, Poland & expanding in Australia. It generates on average c€250mn Operating CF, with c.€30mn capex. Services provides a full range of services to cities (asset management, energy efficiency...). 48% of sales from UK.
Strong financial position: €697mn net cash at parent Co, with infrastructure debt ring-fenced at individual projects. Shareholder remuneration up from €282mn to €544mn (2009-16, +93%) through scrip dividends & share buybacks. c.55% of analysts’ SOTP is consolidated by equity method, distorting any EBITDA multiple comparison versus peers.
How we create value… With our industrial approach in the global infrastructure cycle, and our three differential capabilities:
1. Managing and minimizing risks at the different stages of the project life 2. Offering innovative solutions to our clients 3. Generating operational efficiencies in projects
Objective: to increase CF generation & profitability in Construction & Services, and increase value of Infrastructure projects, to then crystallize it through greater flow of dividends or asset rotation.
Four pillars: profitable growth, selective internationalization, operational excellence and innovation; and financial discipline.
All our activities must be sustainable, from an economic, social and environmental standpoint.
Ferrovial Overview & Strategy In
fras
truc
ture
Co
ntra
ctin
g

7
World leading private infrastructure provider present in toll roads, airports and cities
AIRPORTS CONSTRUCTION TOLL ROADS SERVICES
Design Financing Operating Building Maintaining
CANADA
UK IRELAND
SPAIN
POLAND
USA
Construction Airports
Toll Roads Services
AUSTRALIA
GROUP REVENUES
Note: Airports & 407ETR are Equity Consolidated
COLOMBIA CHILE
FERROVIAL IN THE WORLD MAIN FIGURES
€10.8bn Revenues €0.9bn EBITDA 8.8% EBITDA Margin €33.5bn Backlog* €1bn OCF
2016 RESULTS
* Combined Construction & Services, incl. JVs
• Civil engineering • Industrial construction • Water treatment
• Largest airport private investor • Owns & operates key UK airports (incl.
Heathrow) with a combined 89mn passengers a year
• Leading sponsor of toll roads development worldwide
• 407ETR in Canada & 26 other concessions in 8 different countries
• Leading provider of infrast. Services, such as mgmt & maintenance
• Urban services, waste management, • Focus on intelligent cities • Broadspectrum acquisition opens new
markets in North America & Australia
What is ?
EX-INFRASTRUCTURE PROJECTS
INFRASTRUCTURE PROJECTS
Listed since 1999 Market Cap €14.3bn * 30 April 2017
24%
30%12%12%
15%7%
Spain UKUS & Canada PolandAustralia Others
56%5%
39%
Services Toll Roads
Construction Airports

8
PARENT COMPANY
INFRASTRUCTURE
PROJECTS
EX-INFRASTRUCTURE
PROJECTS
Capital intensive / Inflation protected / LT duration & financing
Non capital intensive / Backlog visibility / EPS accretive
Ring fenced debt
Net cash position
1. Cash Flow generation
€290mn Dividends from Toll roads
€134mn Dividends from Airports
€325mn
€342mn EBITDA from Construction
EBITDA from Services
€ million 2016 figures
64% Institutional & Retail Investors 36% Founder’s family members
(Chairman controls 20%)
…

9
OPERATING CASH FLOW (pre-tax) 2016Construction 245
Services 395Toll Roads (dividends) 290
Airports (dividends) 134Others (69)
TOTAL 995
SOURCES & USES
Ex- Infrastructure Projects
40% DIVIDENDS FROM INFRA PROJECTS CONSTRUCTION SERVICES
* Includes Divestments & Financing
1. Cash Flow generation – Balanced Contribution € million
37%23%27%13%
Dividends
Operating CF
Investments
Other*
Interest Taxes & others
2016 figures
OPERATING CASH FLOW
639
995
(356)
(544)
Operating Cash Flow Organic Investments Activity Cash Flow (pre-tax)
Shareholder remuneration
(pre-tax) Before M&A investment
CF GENERATION vs DIVIDENDS

10
15
526352 256
1,343
2017 2018 2019 2020 >2021
-3,064
-1,987-1,547
-1,172
31
9071,484 1,663 1,632 1,514
697
2006 2007 2008 2009 2010 2011 2012 2013 2014 2015 2016
PARENT COMPANY
2. Profitable growth. Solid Financial Situation
Net debt evolution ex-infrastructure projects EX–INFRASTRUCTURE PROJECTS
TOLL ROADS* €4,426mn
* €641mn related to NTE 35W & I77, toll roads under construction.
INFRASTRUCTURE PROJECTS Debt maturities ex-infrastructure projects
NET CASH €697mn
€mn
€mn
NET DEBT €4,963mn
€ million FY16 figures

11
3. Shareholder remuneration (CF Criteria)
308367
917
477 510 532 544
2010 2011 2012 2013 2014 2015 2016
+2.3%
+77%
SHAREHOLDER REMUNERATION PROPOSAL 2017
Scrip dividend (€/share)
First scrip dividend (equivalent to 2016 complementary dividend) 0.32 0.311
Second scrip dividend (equivalent to 2017 interim dividend) 0.42 0.408 TOTAL 0.74 0.719
Share buyback of up to €275mn or up to 19m shares
2016
of up to €275mn or up to 19m shares

12
Valuation split by currency & asset Analyst consensus valuation
12% 5%
Toll Roads Airports Construction Services UK Rest of Services Cash
Over 70% in CAD, USD & EUR, 17% in GBP
5% from UK Services, 12% from UK airports
Source: Analyst consensus, December 2016
17%
RoW EUR CAD & USD Australia GBP

13
Ferrovial main assets

14
Valuation per asset type
ETR40745%
Man. Lanes7%
Heathrow9%
Rest of Infra7%
Construction12%
Services UK5%
Rest of Services
12%
Net cash at parent
3%
c.50% from 407ETR toll road & Managed Lanes (Canada, US)
68% from Infrastructure assets
Source: Analyst consensus, December 2016
68% INFRASTRUCTURE

15
145 120 135 190300
460600
680 730 750 790
2006
2007
2008
2009
2010
2011
2012
2013
2014
2015
2016
27.0X
6.8x
1999 2016
525
16,110
1999 FY16
407ETR
• 108kms in Greater Toronto • Tariff freedom • Tariff flexibility by segment, direction, time, day… • 81 years to maturity (to 2098) • Alternative routes are strongly congested • Fast & reliable travel times • Free flow, fully electronic system • Strong collection security
Extraordinary operating performance in the past 10 years
Tariffs +9% CAGR (2006-16) EBITDA +10.8% CAGR (2006-16) 100% payback first 10 years
DIVIDEND GROWTH (CADmn)
31x
LOWER LEVERAGE (X EBITDA) EQUITY VALUATION 100% (€mn)
LONG DURATION & PRICING FLEXIBILITY Canada, Ferrovial stake 43%, Equity method

16
Strong EBITDA growth … even with negative traffic and GDP
EBITDA growth 6.8x GDP growth (avg 2010-16)
2016 EBITDA, the highest growth of the past 13 years. annual % growth
18.9
15.4 15.4
14.1
11.7
15.6
1.5
7.2
12.6
10.89.7 9.7
10.3
14.2
17.3
13.2
1.0
7.5
5.4
2.9
6.1
0
-1.7
5.5
-0.5
0.6 0.7
3.4 3.34.1
2.81.9
3.1 3.22.6
2.01.2
-2.7
3.4 3.01.9 2.0
2.5
1.2 1.2
2002 2003 2004 2005 2006 2007 2008 2009 2010 2011 2012 2013 2014 2015 2016
EBITDA growth Traffic growth GDP growth (annual)
407ETR

17
Managed Lanes
• 3 Managed Lanes in Dallas - Fortworth (2 open: NTE & LBJ) • Dynamic tolling: can change tolls every 5 mins • 44 years to maturity (to 2061) • Higher speed allowed (70mph vs 60 on free lanes) • Free flow, fully electronic system • Tariff freedom up to cap (lifted if speed <50mph) • Tariff flexibility by segment, direction, time, day • No collection risk
Strong growth in both Managed Lanes since their opening TRANSACTIONS (mn) EBITDA (USDmn)
2
11
15
Q4
2014
Q4
2015
Q4
2016
7
16
Q4
2015
Q4
2016
3.9
5.76.0
Q4
2014
Q4
2015
Q4
2016
7.0
10.0
Q4
2015
Q4
2016
LONG DURATION & PRICING FLEXIBILITY
+5.1% (4Q’16)
Texas, USA, Global Consolidation. NTE 57%, LBJ 51%
NTE +45.4%
(4Q’16)
LBJ +39.4%
(4Q’16)
NTE +129%
(4Q’16)
LBJ

18
Heathrow Airport
• Best Airport in Western Europe (2nd time) • T5 ‘Best Airport Terminal (5th consecutive Yr) • Best Airport for Shopping (7th consecutive Yr) (Skytrax World Airport Awards) • Best Airport Award Europe, (3nd time) & Best European Airport over 40mn (ACI Awards) • “Operator” & “ Marketing Campaign” of the year (Frontier Awards)
• Traffic growth: +1% vs 2015 • Record passengers: 75,7mn 2016 • Heathrow operates at over 98% capacity • Annual flights 472,067 (1,293 per day) • Connected 183 destinations in 82 countries • Cargo 25% UK exports (1.5mn metric tonnes) • 3rd Runway Government’s green light announced Oct 25th
THE BUSIEST AIRPORT IN THE WORLD
63%79%
2007 2016
Punctuality
48%
84%
2007 2016
% Passengers rating Heathrow as Excellent or Very Good
SERVICE STANDARDS STRONG EBITDA GROWTH (£mn)
756885 967
1,132 1,1541,421
1,559 1,605 1,682
2008 2009 2010 2011 2012 2013 2014 2015 2016
… WITH HIGH SERVICE STANDARDS
2008-2016 CAGR : +10,5%
London, UK, Ferrovial stake 25%, Equity method

19
Source: Company information, December 2016 * Dividends paid in 2016 ** GBP Hedge, December 31st, 2016
325
113UK airports dividends*
GBP Hedge**
Over 3y expected GBP dividends hedged
INFLATION
Ferrovial positively exposed to higher inflation in UK
Macro impact FX
USD, CAD & AUD appreciated vs EUR
Additional GBP155mn 0.85 – 0.9 put spread
INTEREST RATES
15,237
-7,332
Heathrow RAB Heathrow debt linked to RPI
90% FIXED DEBT
+100bps on interest rates
+€8mn financial expenses
GBP million
GBP million

20
Looking ahead
UK turnaround Addressing pipeline in Australia
Services Construction
Additional order book from infra projects
Attractive shareholder remuneration
Scrip dividend Share Buyback
Active pipeline Infra projects
US /Australia /Canada/Poland Monitoring other
markets
High quality assets
Strong traffic trends Higher dividends

21
Ferrovial FY16 Results

22
Traffic growth across the board New awards in core markets (I-66) Total order book increase (+6.3%)
Strong operating growth
Solid cash generation €995mn Operating Cash Flow (pre-tax)
• 40% from infra projects dividends
2016 Highlights
Shareholder remuneration €544mn (€532mn in 2015)
Corporate transactions Broadspectrum acquisition Transchile acquisition Mature toll road asset rotation
• Chicago Skyway (US) • M3 & M4 stakes (Ireland) • Portuguese toll roads stakes (to be completed)
Solid financial position Ex-infra projects
€697mn net cash position €356mn ordinary CAPEX €1bn M&A investment
Environment UK & US
23
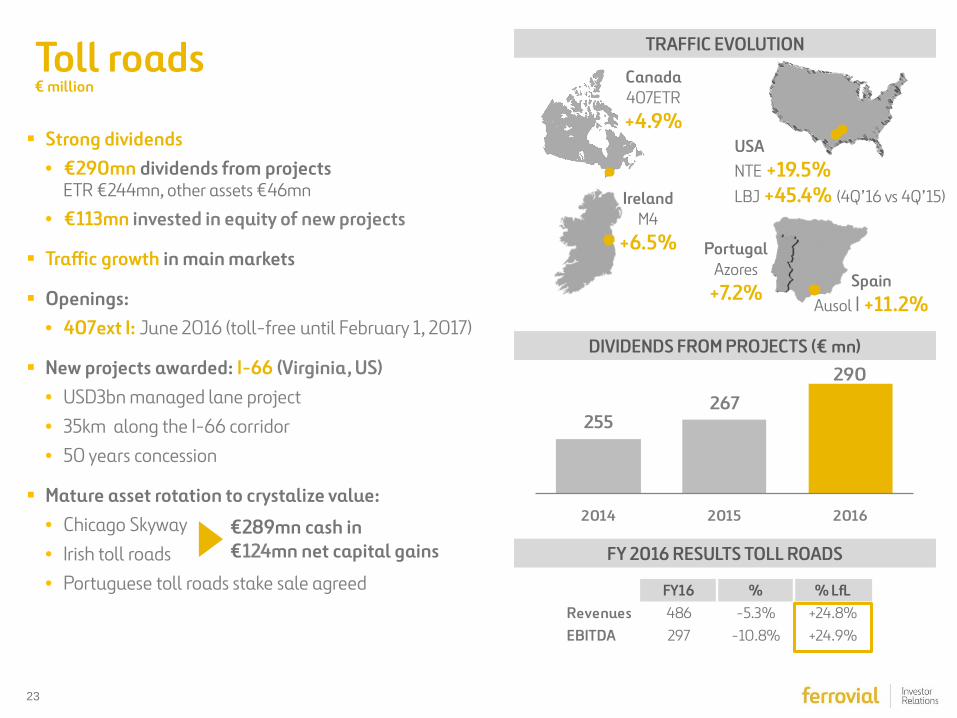
Toll roads
Strong dividends • €290mn dividends from projects
ETR €244mn, other assets €46mn
• €113mn invested in equity of new projects
Traffic growth in main markets
Openings: • 407ext I: June 2016 (toll-free until February 1, 2017)
New projects awarded: I-66 (Virginia, US) • USD3bn managed lane project • 35km along the I-66 corridor • 50 years concession
Mature asset rotation to crystalize value: • Chicago Skyway • Irish toll roads • Portuguese toll roads stake sale agreed
€ million
TRAFFIC EVOLUTION
DIVIDENDS FROM PROJECTS (€ mn)
FY 2016 RESULTS TOLL ROADS
Canada 407ETR +4.9%
USA NTE +19.5% LBJ +45.4% (4Q’16 vs 4Q’15) Ireland
M4 +6.5% Portugal
Azores +7.2%
Spain Ausol I +11.2%
FY16 % % LfLRevenues 486 -5.3% +24.8%EBITDA 297 -10.8% +24.9%
255267
290
2014 2015 2016€289mn cash in €124mn net capital gains

24
407ETR Equity method, Ferrovial stake 43%
407ETR FY 2016 RESULTS (CAD mn)
407ETR Regions includes: Toronto, Durham, Peel, Halton & York Source: Government of Ontario Places to Grow
POPULATION GROWTH (2021 – 2041) EMPLOYMENT GROWTH (2021 – 2041)
407 EAST PHASE I OPENING IMPACT
407 East I opened to traffic on June 20, 2016 407 East I was toll-free until February 1, 2017 Overall traffic impact above +2%
(CADmn) FY16 %Revenues 1,135 +13.2%EBITDA 985 +17.3%
Traffic (VKTs'000) 2,640,770 +4.9%Dividends 790 +5.3%
Highest EBITDA growth over the last 10 years
Growth in population & employment to support traffic

25
Managed Lanes (NTE & LBJ)
SPEEDS AT NTE
GROWTH SINCE OPENING (NTE)
TOLL RATES EVOLUTION (NTE)
GROWTH SINCE OPENING (LBJ)
Eastbound workday on segment 2
CAP linked to inflation
Average toll rate per
transaction (2016):
~USD3.05 +18.2%
Index 100
12am 3am 6am 9am 12pm 3pm 6pm 9pm
2014 2015 2016 Cap
100
120
140
160
180
200
4Q'15 1Q'16 2Q'16 3Q'16 4Q'16Transactions Revenue Rev/Txn
100
150
200
250
300
350
4Q'14 1Q'15 2Q'15 3Q'15 4Q'15 1Q'16 2Q'16 3Q'16 4Q'16
Revenue Txns Rev/Txn
0
10
20
30
40
50
60
70
80
12am 3am 6am 9am 12pm 3pm 6pm 9pm
2011 2016 Non-Tolled Lanes2016 TEXpress Lanes

26
Services
€ 395mn operating cash flow (OCF)
UK Services: Challenging environment
• Budget constrains • Fewer project works (higher margins) • Birmingham contract (legal expenses)
Positive evolution in Spain Profitability remains stable with EBITDA margin at 10.7%
7 months contribution from Broadspectrum
SPAIN UK
Revenues
EBITDA
Order book
€ million
PERFORMANCE BY GEOGRAPHY (LfL)
OPERATING CASH FLOW
FY16 % % LfLRevenues 6,078 +24.1% +2.8%EBITDA 325 +4.2% -12.9%EBITDA % 5.4%Order book 24,431 +7.2% -11.0%
302 289
395
2014 2015 2016
+1%-45%-16%
+5%+5%-6%
Restructuring plan focused on profitability >900 layoffs
-€21mn impact
2017E Sales slightly below 2016 figures
2017E EBITDA margin: 3% - 4%

27
Acquisition rationale:
• Platform for medium and long term growth
• Bought at low point sector cycle
• Leading position in public and infrastructure services in Australia & New Zealand
• Exposure to US
• AUD8bn order book provides revenue visibility
Ongoing strategic review
• No renewal of immigration centres contracts (contracts end October 2017)
Broadspectrum contribution: 7 months in 2016 • Revenues: €1,446mn • EBITDA: €91mn • EBITDA margin: 6.3%
100% acquisition
Broadspectrum delisted
Consolidation from May 31st
Broadspectrum TRANSACTION DETAILS TOTAL PIPELINE
Transaction terms:
• EV €934mn
• Equity €499mn
• Debt €435mn
46%
22%
13%
19%
Government TransportUrban Infrastructure Resources
TOTAL
AUD30.3bn
AUD million

28
Construction
€245mn operation cash flow (OCF)
Profitability remains at high level (EBITDA margin 8.1%) Driven by Budimex (Poland)
Strong growth in Budimex
• Revenues +8.1% (LfL)
• EBITDA +70.8% (LfL)
• Order book +6.0% (LfL)
€ million
OPERATING CASH FLOW
ORDER BOOK BY COUNTRY BUDIMEX ORDER BOOK (PLNbn)
+107%
FY16 % % LfLRevenues 4,194 -2.2% -2.7%EBITDA 342 -13.1% -12.8%EBITDA % 8.1%Order book 9,088 +4.1% +2.6%
4.36.1
8.4 8.9
2013 2014 2015 2016
236
272
245
2014 2015 2016
17% 22% 27% 8% 25%
Spain Poland US UK RotW

29
HAH 100% GBP million
+8.3% dividend increase (GBP325mn vs GBP300mn in 2015 )
All-time high in passenger number for 2016 (75.7mn of passenger; +1% vs. 2015)
RAB: positive impact from higher inflation
Heathrow expansion: Government support confirmed in Oct 2016 & draft NPS released in Feb 2017
AGS (Equity method, FERROVIAL stake 50%):
+6.7% dividend increase (GBP64mn vs GBP60mn in 2015)
Traffic +2.8% (14.4mn pax.) EBITDA +10.8% thanks to cost controls
(PAX million)
AIRPORTS TRAFFIC
OPERATING IMPROVEMENT AT HEATHROW
(Equity method, FERROVIAL stake 25%)
82 Countries
30% Transfer
Share
1% Growth
94% International
471k Flights 75.7m
Passengers
194 Destinations
HAH P&L FY16 % LfL
Revenues 2,809 +1.5%
EBITDA 1,683 +4.7%
EBITDA % 59.9%
Net debt 14,307 +6.5%
63%79%
2007 2016
Punctuality
48%
84%
2007 2016
% Passengers rating Heathrow as Excellent or Very Good
FY16 % LfL
Heathrow 75.7 +1.0%
Glasgow 9.4 +7.4%
Aberdeen 3.1 -12.2%
Southampton 2.0 +9.8%
Record service standards

30
4.19
3.00
3.50
4.00
4.50
LHR
3.20
3.40
3.60
3.80
4.00
4.20
4Q'0
62Q
'07
4Q'0
72Q
'08
4Q'0
82Q
'09
4Q'0
92Q
'104Q
'102Q
'114Q
'112Q
'124Q
'122Q
'134Q
'132Q
'144Q
'142Q
'154Q
'152Q
'164Q
'16
ASQ
scor
e (o
ut o
f 5)
European Average Heathrow European top quartile
Heathrow: Best ever passenger service levels
Passenger satisfaction European ranking
FY16 figures
Quarterly passenger satisfaction
4Q 2006 – 4Q 2016
European competitors European comparators
Baggage performance Departures misconnect rate per 1,000 passengers within 15 minutes of schedule
4Q16
Best Airport in Western Europe
World’s Best Airport Shopping
Terminal 5 – World’s Best Airport Terminal
•2016 Europe’s Best Airport
•(over 40 million passengers)
63%78% 78% 79%
2007 2014 2015 2016
40
19 17 14
2007 2014 2015 2016

31
FY16 Results
Income Statement Revenues
EBITDA
Operating Indicators
€ million
FY16 FY15 Var % LfLConstruction 4,194 4,287 -2.2% -2.7%
Airports 4 8 -49.9% -68.6%
Toll Roads 486 513 -5.3% 24.8%
Services 6,078 4,897 24.1% 2.8%
Other -4 -6 n.a. n.a.
Total 10,759 9,701 10.9% 1.2%
FY16 FY15 Var % LfLConstruction 342 393 -13.1% -12.8%
Airports -18 -13 -45.7% -54.7%
Toll Roads 297 333 -10.8% 24.9%
Services 325 312 4.2% -12.9%
Other -2 1 n.a. n.a.
Total 944 1,027 -8.1% -4.0%
FY16 2015 Var %Construction Backlog 9,088 8,731 4.1%
Services Backlog inc.JVs 24,431 22,800 7.2%
Traffic evolution FY16 FY15 Var % ETR 407 (Kms 000) 2,640,770 2,517,214 4.9%
NTE (IMD) 30,485 25,553 19.3%
LBJ (IMD) 31,582 12,861 145.6%
Ausol I (IMD) 14,637 13,165 11.2%
Heathrow (Mn pax) 75.7 75.0 1.0%
AGS (Mn pax) 14.4 14.0 2.8%
FY16 FY15 Var % LfL
Revenues 10,759 9,701 10.9% 1.2%
EBITDA 944 1,027 -8.1% -4.0%
EBITDA margin 8.8% 10.6%
Period depreciation 342 256
EBIT 602 770 -21.9% -9.7%
EBIT margin 5.6% 7.9%
Disposals & Impairments 324 131
Financial results -391 -637
Equity-accounted affiliates 82 312
EBT 617 577
Corporate income tax -233 54
CONSOLIDATED NET INCOME 383 631
Discontinued operations 0 0
Minorities -7 89
NET INCOME ATTRIBUTED 376 720 -47.7%

32
Ferrovial 1Q17 Results
33
1Q17 Results HIGHLIGHTS
Revenues & EBITDA
€ million
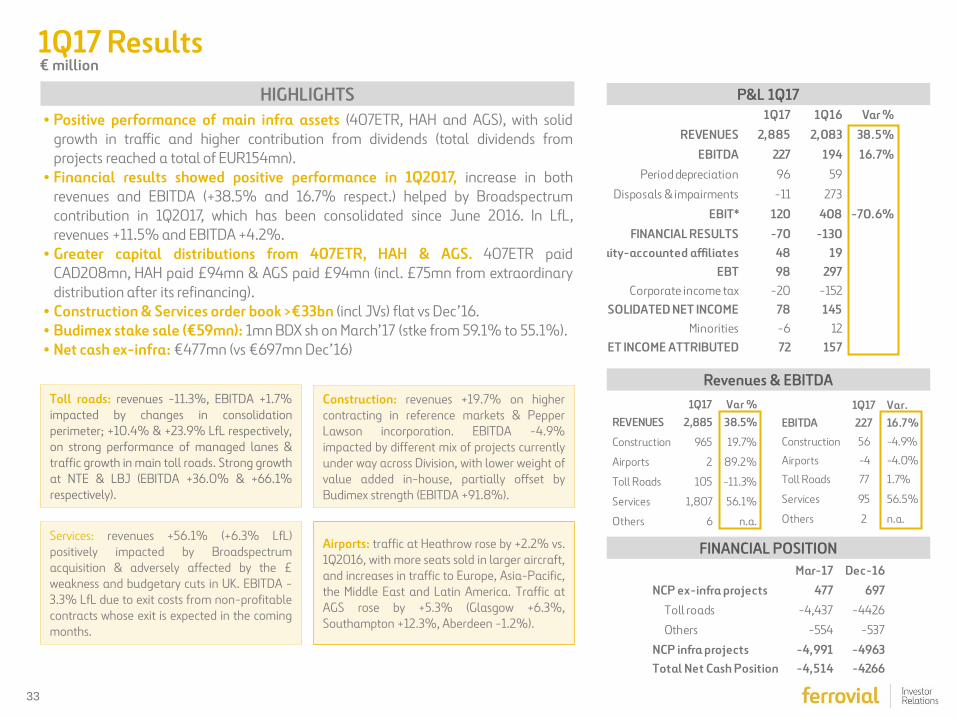
1Q17 Var %REVENUES 2,885 38.5%
Construction 965 19.7%
Airports 2 89.2%
Toll Roads 105 -11.3%
Services 1,807 56.1%
Others 6 n.a.
1Q17 Var.EBITDA 227 16.7%
Construction 56 -4.9%
Airports -4 -4.0%
Toll Roads 77 1.7%
Services 95 56.5%
Others 2 n.a.
P&L 1Q17
• Positive performance of main infra assets (407ETR, HAH and AGS), with solid growth in traffic and higher contribution from dividends (total dividends from projects reached a total of EUR154mn).
• Financial results showed positive performance in 1Q2017, increase in both revenues and EBITDA (+38.5% and 16.7% respect.) helped by Broadspectrum contribution in 1Q2017, which has been consolidated since June 2016. In LfL, revenues +11.5% and EBITDA +4.2%.
• Greater capital distributions from 407ETR, HAH & AGS. 407ETR paid CAD208mn, HAH paid £94mn & AGS paid £94mn (incl. £75mn from extraordinary distribution after its refinancing).
• Construction & Services order book >€33bn (incl JVs) flat vs Dec’16. • Budimex stake sale (€59mn): 1mn BDX sh on March’17 (stke from 59.1% to 55.1%). • Net cash ex-infra: €477mn (vs €697mn Dec’16)
1Q17 1Q16 Var %REVENUES 2,885 2,083 38.5%
EBITDA 227 194 16.7%Period depreciation 96 59
Disposals & impairments -11 273
EBIT* 120 408 -70.6%FINANCIAL RESULTS -70 -130
uity-accounted affiliates 48 19EBT 98 297
Corporate income tax -20 -152NSOLIDATED NET INCOME 78 145
Minorities -6 12NET INCOME ATTRIBUTED 72 157
Mar-17 Dec-16NCP ex-infra projects 477 697
Toll roads -4,437 -4426
Others -554 -537
NCP infra projects -4,991 -4963Total Net Cash Position -4,514 -4266
FINANCIAL POSITION
Toll roads: revenues -11.3%, EBITDA +1.7% impacted by changes in consolidation perimeter; +10.4% & +23.9% LfL respectively, on strong performance of managed lanes & traffic growth in main toll roads. Strong growth at NTE & LBJ (EBITDA +36.0% & +66.1% respectively).
Construction: revenues +19.7% on higher contracting in reference markets & Pepper Lawson incorporation. EBITDA -4.9% impacted by different mix of projects currently under way across Division, with lower weight of value added in-house, partially offset by Budimex strength (EBITDA +91.8%).
Airports: traffic at Heathrow rose by +2.2% vs. 1Q2016, with more seats sold in larger aircraft, and increases in traffic to Europe, Asia-Pacific, the Middle East and Latin America. Traffic at AGS rose by +5.3% (Glasgow +6.3%, Southampton +12.3%, Aberdeen -1.2%).
Services: revenues +56.1% (+6.3% LfL) positively impacted by Broadspectrum acquisition & adversely affected by the £ weakness and budgetary cuts in UK. EBITDA -3.3% LfL due to exit costs from non-profitable contracts whose exit is expected in the coming months.

35
Appendix
Introduction to 407ETR Toll road
Managed Lanes Toll roads
407ETR vs Managed Lanes
Diversified porftolio
Historic consolidated & business units figures

36
High density population area
Ring road of Toronto 108 km
407
407
East extension
Area of expansion
407 ETR
Location

37
407 ETR
All Electronic Roadside Tolling System
Sophisticated electronic toll highway
NO toll-booths, “closed ticket” tolling scheme (on/off ramps)
NO stopping or slow-downs to pay
ALL vehicles able to use highway
Transponder not required. If valid transponder is not detected, digital
images are taken at entry and exit and invoices posted to registered
car owner
Tolls billed monthly

38
407 ETR
LOCATION
Greater Toronto Area 23% of Canada population
TRAFFIC
Alternatives routes are highly congested
HIGH HOUSEHOLD INCOME
46% higher than Canada average
NO REGULATORY REVIEWS
During concession life (99 years)
SPEED
Alternatives routes 40kph
vs 100kph at 407
NON-STOP TOLL FACILITY
Fully electronic with interchanges
every 3km
TOLL RATE HIGH FLEXIBILITY
Including segment, direction, time of
the day
FAST
Reliable travel times
Fast Safe
Reliable

39
525
16,110
1999 FY16
Strong dividend flow
Equity valuation sharp increase
2098
100% pay-back
in first 10 years
Valuation x31
* December 2016 analysts consensus
407 ETR
81 years to maturity
407 ETR
Cash flow and valuation overview
€ million CASH GENERATION (1999 - FY2016) EQUITY VALUATION 100% (€mn)
€ million
MATURITY
31x
Cash GenerationInitial equity invest.(62%) -326 mnDividends 1,761 mn10%Disposal 640 mn
NET CASH IN 2,075 mn

40
353
985
77%79%
76%
80%82%
83% 83% 83% 83% 84%
87%
2006 2016
456
1,135
2006 2016
81 years to maturity
100% pay-back in first 10 years
Free-tariff revision
≅ 9% CAGR 02-15*
* Tariff increase for light Vehicles in Peak hours regular zone (%)
407 ETR
Financial overview ($CAD million)
REVENUES
EBITDA
OPEX
CAPITAL EXPENDITURE
DIVIDENDS
Net Debt / EBITDA X
2016 figures
CAGR: 9.5%
CAGR: 3.8%
103
150
2006 2016
CAGR: 10.8%
97 90
38
72 77 8870 74
5570 72
145 120 135 190300
460600
680 730 750 790
2006
2007
2008
2009
2010
2011
2012
2013
2014
2015
2016
27.0X
6.8x
1999 2016

41
407 ETR
Value creation: EBITDA-GDP-Traffic
Strong EBITDA growth even with negative traffic and GDP
annual % growth
18.9
15.4 15.4
14.1
11.7
15.6
1.5
7.2
12.6
10.89.7 9.7
10.3
14.2
17.3
13.2
1.0
7.5
5.4
2.9
6.1
0
-1.7
5.5
-0.5
0.6 0.7
3.4 3.34.1
2.81.9
3.1 3.22.6
2.01.2
-2.7
3.4 3.01.9 2.0
2.5
1.2 1.2
2002 2003 2004 2005 2006 2007 2008 2009 2010 2011 2012 2013 2014 2015 2016
EBITDA growth Traffic growth GDP growth (annual)

42
Appendix
Introduction to 407ETR Toll road
Managed Lanes Toll roads
407ETR vs Managed Lanes
Diversified porftolio
Historic consolidated & business units figures

43
A solution to congestion on “existing urban corridors”
Active management of “newly added capacity” through tolling
by means of
Free
Lanes
Free
Lanes
Tolled Lanes Speed >50mph
“Express Tollway within an Existing Highway”
Managed Lanes
New assets landmark

44
Time of the day
Eastbound Westbound
00.00 2.00 4.00 6.00 8.00 10.00 12.00 14.00 16.00 18.00 20.00 22.00 24.00 12.00 2.00 4.00 6.00 8.00 10.00 12.00 2.00 4.00 6.00 8.00 10.00 12.00
Time of the day
Peak period
Managed Lanes
Level of demand
NTE (untolled) 407ETR (tolled)

45
LBJ
Dallas and Fort Worth Regional Map Managed Lanes regional map
NTE 1-2
NTE 35W

46
Toll rates – tariff threshold
Toll Rate Cap 0.75 c/mi
Demand threshold 3300 pce/h2-lane sections
Speed Threshold 50 mi/h
12:00 1:00 2:00 3:00 4:00 5:00 6:00 7:00 8:00 9:00 10:00 11:00 12:00Hour startingAnalysis by segment and direction
Freedom under the cap TOTAL FREEDOM Freedom under the cap
Speed
Demand
Toll Rate
Tariff threshold
0.84 $/mi

47
CINTRA MERIDIAM DALLAS
FIRE&POLICE PENSION SCHEME
DESCRIPTION:
LENGTH:
CONCESSION PERIOD:
TARIFF POLICY:
Dallas-Fort Worth Metroplex, Major thoroughfares
between Fort Worth and DFW Airport
13 mile section (IH 820 & SH 183 in Tarrant County)
52 years (since 2009)
Open Road Tolling System (no toll booths) with a dynamic tolling
regime (every 5 minutes) to maintain at all times a minimum speed of
50 mph
● No toll-booths, fully electronic free flow tolling system
● Tollway within a freeway: Motorists will be provided with a choice of
driving in non-tolled GP lanes or paying a toll to bypass such GP
lanes
● Tolls setting to ensure minimum speed on new lanes
● As demand grows and capacity becomes scarce, pricing power
increases
● Physically separated from the GP lanes with controlled access
EQUITY DEBT PUBLIC FUNDS
Managed Lanes
North Tarrant Express Opened on October 2014, 9 months ahead of schedule
KEY CHARACTERISTICS
SHAREHOLDER STRUCTURE
FINANCIAL STRUCTURE
57% 33% 10%
21% 52% 27%

48
CINTRA MERIDIAM DALLAS FIRE&POLICE
PENSION SCHEME
108Km Electronic toll
DESCRIPTION:
LENGTH:
CONCESSION PERIOD:
TARIFF POLICY:
IH 635 (Dallas County), the most populous county in Texas
13 mile section of the IH 635 and IH 35E
52 years (since 2009)
Open Road Tolling System (no toll booths) with a dynamic tolling
regime (every 5 minutes) to maintain at all times a minimum speed of
50 mph
● No toll-booths, fully electronic free flow tolling system
● Tollway within a freeway: Motorists will be provided with a choice of
driving in non-tolled GP lanes or paying a toll to bypass such GP
lanes
● Tolls setting to ensure minimum speed on new lanes
● As demand grows and capacity becomes scarce, pricing power
increases
● Physically separated from the GP lanes with controlled access
For further information on the concession, check the following links: https://youtu.be/9GMj3H5OovA https://youtu.be/pnNFZ8qJY-c
EQUITY DEBT PUBLIC FUNDS
Managed Lanes
Lyndon B Johnson Opened on September 10th 2015, 3 months ahead of schedule
APG
51% 26% 16% 7%
24% 56% 19%
SHAREHOLDER STRUCTURE
FINANCIAL STRUCTURE
KEY CHARACTERISTICS

49
32% 59% 9%
50% 26% 14% 10%
CINTRA MERIDIAM DALLAS FIRE&POLICE PENSION SCHEME
DESCRIPTION:
LENGTH:
CONCESSION PERIOD:
TARIFF POLICY:
2 “managed lanes” in each direction of the IH-35W, segments 3A and
3B (3B segment to be built by TxDOT)
10.2 mile section (segments 3A 6.2 miles and 3B 4 miles)
48 years (since 2013)
Open Road Tolling System (no toll booths) with a dynamic tolling
regime (every 5 minutes) to maintain at all times a minimum speed of
50 mph
● The corridor south to the 3A segment is currently ranked as the most
congested roadway in Texas.
● No toll-booths, fully electronic free flow system
● Tollway within a freeway: Motorists will be provided with a choice of
driving in non-tolled GP lanes or paying a toll to bypass such GP
lanes
● Tolls setting to ensure minimum speed on new lanes
● As demand grows and capacity becomes scarce, pricing power
increases
● Physically separated from the GP lanes with controlled access EQUITY DEBT PUBLIC FUNDS
APG
Managed Lanes
North Tarrant Express 35W Expected to open in mid-2018
SHAREHOLDER STRUCTURE
FINANCIAL STRUCTURE
KEY CHARACTERISTICS

50
• First privately-financed road development project of its kind to reach financial close in 2010.
• Texas’ third big recent road project to reach financial close since 2008.
• First combination of TIFIA and tax exempt PABs.
• First private activity bond issuance for a toll road.
• First time that a U.S.-based pension fund made a direct investment in a highway concession.
21%
51%
28%
26%
56%
18%
Figures in US Dollars
Managed Lanes
Financial Overview
32%
59%
9%
• Very competitive capital structure in spite of the difficult market conditions.
• Strong portion of the debt from TIFIA program with its flexible amortizing structure during the first 25 years.
2.05 bn
426 mn
242 mn (57%) 141 mn (33%) 43 mn (10%)
1,048 mn
398 mn 650 mn
573 mn
2.62 bn
672 mn
343 mn (51%) 107 mn (16%)
44 mn (7%) 178 mn (26%)
1,456 mn
606mn 850 mn
490 mn
1.36 bn
430 mn
215 mn (50%) 60 mn (14%) 43 mn (10%) 112 mn (26%)
805 mn
274 mn 531mn
126 mn
Total Investment: Private Equity:
Cintra: Meridiam: DPFPS: APG:
Total Debt:
PABs: TIFIA:
Public Funds:
Financial structure

51
Appendix
Introduction to 407ETR Toll road
Managed Lanes Toll roads
407ETR vs Managed Lanes
Diversified porftolio
Historic consolidated & business units figures

52
How does the 407ETR compare to the new Managed Lanes? 407ETR Managed Lanes (NTE1-2)
• 56.7%. Global consolidation • Meridiam (33%), Dallas fire & police pension scheme (10%) • 52 years
Opened October 2014 (44 years remaining)
• Dallas-Fort Worth Metroplex, between Fort Worth & DFW Airport • 13 miles. 2 segments.
2 lanes per direction Tollway within a freeway
• Predictability & reliable travel times (minimum speed 50m/hr) Higher speed allowed on NTE (60mph in free lanes, 70mph NTE) Safety & comfort
• Yes. No toll booths, fully electronic, free flow system • Freedom to set tariffs up to cap ($0.84, updated with inflation)
Cap is lifted if av. speed <50m/hr of cars >3,300pce/h (2 lanes) Dynamic tolling (tariffs can be changed every 5 minutes) Different tariffs depending on segment, direction, time, day..
• Not a regulated activity, but a contractual agreement • From TxDOT (who charges the drivers). No collection risk
• 5 initial years lock-up
• 43%. Equity consolidated • SNC Lavalin (17%), CPPIB (40%) • 99 years
Opened 1999 (81 years remaining)
• Greater Toronto Area (Ontario province) • 108kms. 24 segments
From 2+2 lanes up to 5+5 lanes per direction (dep on segment) Separate toll road
• Predictability & reliable travel times Alternative routes are highly congested Average speed: 100km/h vs 40km/h on the alternative Safety & comfort
• Yes. No toll booths, fully electronic, free flow system • Freedom to set tariffs
Penalty paid if traffic falls below threshold Tariffs can be changed every 30 days Different tariffs depending on segment, direction, time, day..
• Not a regulated activity, but a contractual agreement • From drivers. Licence plate not renewed if tolls not paid.
• Strong growth (from CAD85mn 2005 to 750mn 2015)
Participation: Partners: Concession period: Location: Length: Benefits: Open tolling? Tariff Policy: Regulatory risk? Collection: Dividends:
53
Appendix
Introduction to 407ETR Toll road
Managed Lanes Toll roads
407ETR vs Managed Lanes
Diversified porftolio
Historic consolidated & business units figures

54
17%
20%
31%
32%
(1) Proportional: All EBITDA figures are aggregated in a proportional basis to the Ferrovial equity stake in each company or project (mainly ETR 407 toll road in Canada and UK airports).
Diversified portfolio
Services Construction Toll Roads Airports
Non Capital Intensive PROFIT GENERATION CASH GENERATION
Fully consolidated Method
€944Mn Proportional (1)
€1,721Mn
Capital Intensive LONG DURATION
LONG TERM VALUE
EBITDA
Services
Toll Roads
Construction
Airports
Spain UK US & Canada Poland Spain UK US & Canada
€ million 2016 figures
EX – INFRASTRUCTURE PROJECTS INFRASTRUCTURE PROJECTS
36%
34%
31%
-2%
43% 4% 19% 13% 22% 37% 25% 4%
Australia RoW
9% 11%
Poland Australia RoW
5%7%

55
Appendix
Introduction to 407ETR Toll road
Managed Lanes Toll roads
407ETR vs Managed Lanes
Diversified porftolio
Historic consolidated & business units figures

56
2015 2014 Var %
Construction Backlog 8,731 8,091 7.9%
Services Backlog inc.JVs 22,800 22,369 1.9%
Traffic evolution 2015 2014 Var %
ETR 407 (Kms 000) 2,517,214 2,436,888 3.3%
Chicago Skyway (IMD) 25,553 19,845 28.8%
Ausol I (IMD) 13,165 11,711 12.4%
Ausol II (IMD) 15,402 13,989 10.1%
M4 (IMD) 28,512 26,606 7.2%
Heathrow (Mn pax) 75.0 73.4 2.2%
AGS (Mn pax) 14.0 13.3 5.1%
2015 2014 Var % LfLConstruction 393 349 12.8% 2.3%
Airports -13 -12 -1.3% -1.3%
Toll Roads 333 257 29.6% 25.6%
Services 312 387 -19.4% -26.4%
Other 1 2 -59.8% n.s.
Total 1,027 983 4.5% -4.2%
2015 2014 Var % LfLConstruction 4,287 3,942 8.8% 1.2%
Airports 8 9 -9.7% -9.7%
Toll Roads 513 432 18.9% 17.2%
Services 4,897 4,401 11.3% 4.2%
Other -6 18 -133.9% -133.5%
Total 9,701 8,802 10.2% 3.2%
2015 Results
Income Statement Revenues
EBITDA
Operating Indicators
€ million
2015 2014 Var % LfL
Revenues 9,701 8,802 10.2% 3.2%
EBITDA 1,027 983 4.5% -4.2%
EBITDA margin 10.6% 11.2%
Period depreciation 256 244
EBIT 770 738 4.3% -7.0%
EBIT margin 7.9% 8.4%
Disposals & Impairments 131 5
Financial results -637 -377
Equity-accounted affiliates 312 138
EBT 577 504
Corporate income tax 54 -152
CONSOLIDATED NET INCOME 631 352
Discontinued operations 0 0
Minorities 89 50
NET INCOME ATTRIBUTED 720 402 79.1%

57
Historic consolidated figures: 2012-2016 Operating CF ex-infra projects (before tax.)
EBITDA & Margins
mn €
• Net cash at parent company
• Net debt at infra projects level (non recourse to parent company)
Revenues
Net debt
OCF ex-infra ND
-6,595 -7,015 -7,862 -6,057-4,963
1,489 1,663 1,632 1,514 697
2012 2013 2014 2015 2016
N. CASH EX-INFRA
INFRA PROJ.
7,446 7,686 8,1668,802 9,701
45% 38% 32% 31% 28%
55% 62% 68% 69% 72%
2012 2013 2014 2015 2016
Dom estic International
927 934 983 1,027 944
12.1%11.4%
11.2%10.6%
8.8%
7 .0 %
8 .0 %
9 .0 %
1 0. 0%
1 1. 0%
1 2. 0%
0
2 00
4 00
6 00
8 00
1 ,0 00
1 ,2 00
2012 2013 2014 2015 2016
EBITDA Margin
-16 -27 -58 -70 -69
365 461 596399 424
591663 538
560 640
2012 2013 2014 2015 2016
Op. CF (Construction& Services)
Dividens from infra(Toll roads & Airports)
Holding & Others
Op. CF:Construction 100 304 236 272 245Services 491 359 302 289 395
Dividends:Toll Roads 220 242 255 267 290Airports 145 219 341 132 134
Holding & Others -16 -27 -58 -70 -69
939 1,097 1,076 889 995 -5,106 -5,352 -6,230 -4,542 -4,266
mn €
58
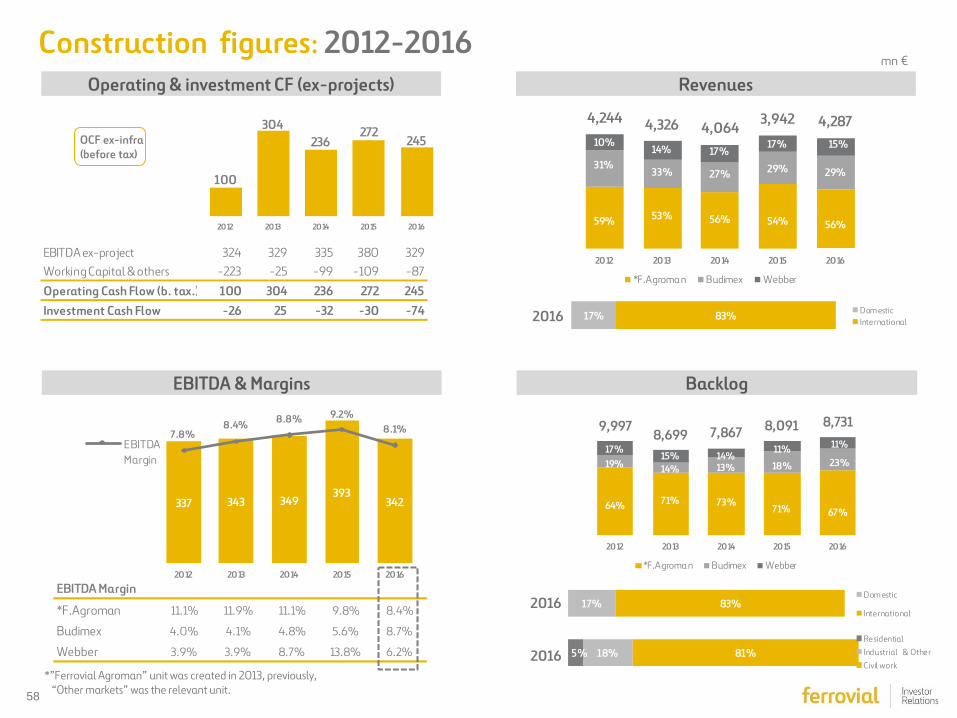
Construction figures: 2012-2016 mn €
2016
2016
Operating & investment CF (ex-projects)
Backlog
Revenues
EBITDA & Margins
100
304236
272245
2012 2013 2014 2015 2016
4,244 4,326 4,064 3,942 4,287
59% 53% 56% 54% 56%
31%33% 27% 29% 29%
10%14% 17%
17% 15%
2012 2013 2014 2015 2016
*F.Agroma n Budimex Webber
337 343 349393
342
7.8%8.4% 8.8% 9.2%
8.1%
0 .0 %
1 .0 %
2 .0 %
3 .0 %
4 .0 %
5 .0 %
6 .0 %
7 .0 %
8 .0 %
9 .0 %
1 0. 0%
0
5 0
1 00
1 50
2 00
2 50
3 00
3 50
4 00
2012 2013 2014 2015 2016
EBITDAMargin
17% 83%Dom estic
International
OCF ex-infra (before tax)
EBITDA Margin
*F.Agroman 11.1% 11.9% 11.1% 9.8% 8.4%
Budimex 4.0% 4.1% 4.8% 5.6% 8.7%
Webber 3.9% 3.9% 8.7% 13.8% 6.2% 2016
9,9978,699 7,867 8,091 8,731
64% 71% 73%71% 67%
19% 14% 13% 18% 23%17%
15% 14%11% 11%
2012 2013 2014 2015 2016
*F.Agroma n Budimex Webber
*”Ferrovial Agroman” unit was created in 2013, previously, “Other markets” was the relevant unit.
EBITDA ex-project 324 329 335 380 329Working Capital & others -223 -25 -99 -109 -87
Operating Cash Flow (b. tax.) 100 304 236 272 245Investment Cash Flow -26 25 -32 -30 -74
5% 18% 81%ResidentialIndustrial ~ & OtherCivil work
17% 83% Dom esticInternational
59
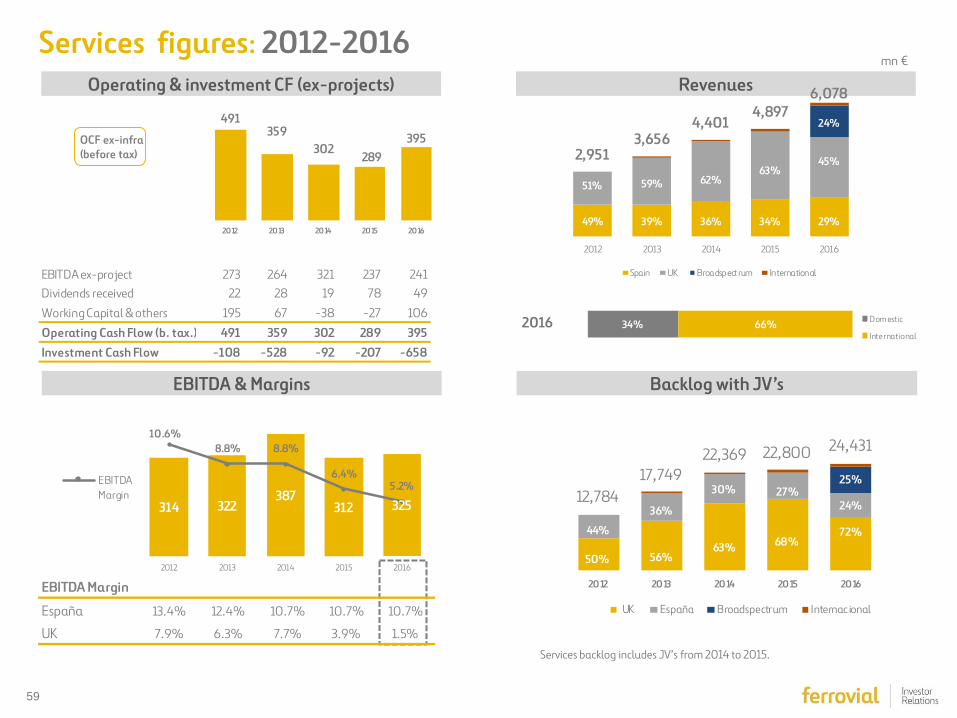
Operating & investment CF (ex-projects)
Backlog with JV’s
Revenues
EBITDA & Margins
2016
491359
302289
395
2012 2013 2014 2015 2016
2,9513,656
4,4014,897
6,078
49% 39% 36% 34% 29%
51% 59% 62%63%
45%
24%
2012 2013 2014 2015 2016
Spain UK Broadspect rum International
314 322387
312 325
10.6%8.8% 8.8%
6.4%5.2%
0 .0 %
1 .0 %
2 .0 %
3 .0 %
4 .0 %
5 .0 %
6 .0 %
7 .0 %
8 .0 %
9 .0 %
1 0. 0%
1 1. 0%
1 2. 0%
0
5 0
1 00
1 50
2 00
2 50
3 00
3 50
4 00
2012 2013 2014 2015 2016
EBITDAMargin 12,784
17,74922,369 22,800 24,431
50% 56%63% 68%
72%44%
36%
30% 27%24%
25%
2012 2013 2014 2015 2016
UK España Broadspectrum Internac ional
Services backlog includes JV’s from 2014 to 2015.
34% 66% Dom estic
International
OCF ex-infra (before tax)
Services figures: 2012-2016 mn €
EBITDA ex-project 273 264 321 237 241Dividends received 22 28 19 78 49
Working Capital & others 195 67 -38 -27 106
Operating Cash Flow (b. tax.) 491 359 302 289 395Investment Cash Flow -108 -528 -92 -207 -658
EBITDA Margin
España 13.4% 12.4% 10.7% 10.7% 10.7%
UK 7.9% 6.3% 7.7% 3.9% 1.5%
60
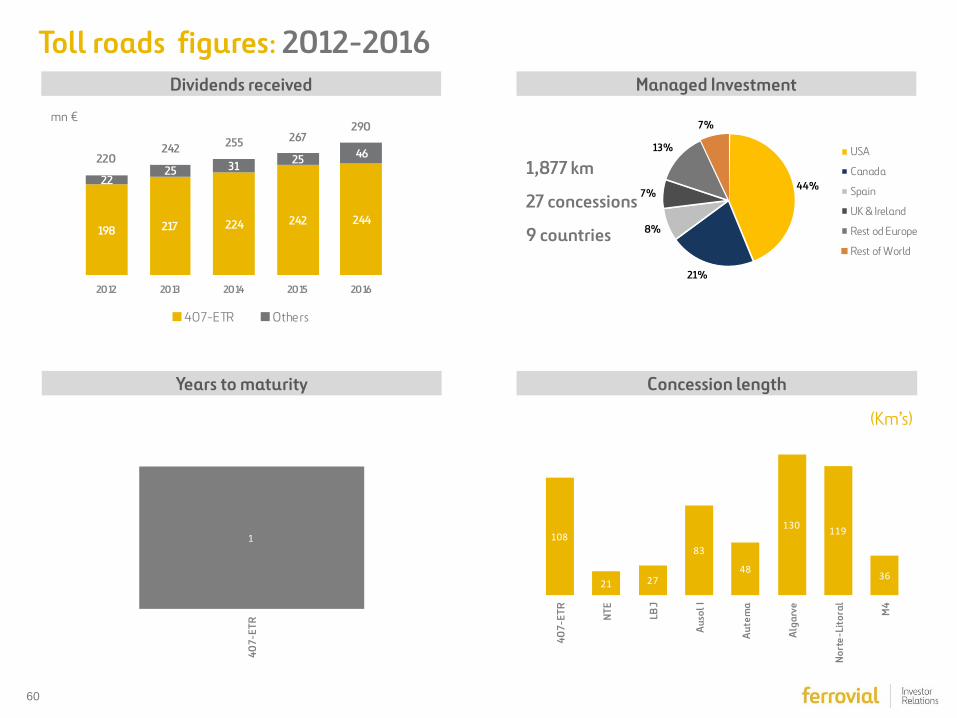
Toll roads figures: 2012-2016
mn €
1,877 km
27 concessions
9 countries
(Km’s)
Dividends received Managed Investment
Concession length Years to maturity
198 217 224 242 244
2225 31 25 46220
242 255 267290
2012 2013 2014 2015 2016
407-ETR Others
44%
21%
8%
7%
13%
7%
USA
Canada
Spain
UK & Ireland
Rest od Europe
Rest of World
1
407-
ETR
108
21 27
83
48
130 119
3640
7-ET
R
NTE
LBJ
Auso
l I
Aute
ma
Alga
rve
Nort
e-Li
tora
l
M4

61
Airports figures: 2012-2016
mn € Dividends received from airports
Heathrow (25% stake)
2 runways 183 destinations 82 Countries 80 Airlines
*AGS (50% stake) Aberdeen Glasgow Southampton
Traffic mn passengers HAH EBITDA (mn £)
Heathrow shareholders Portfolio Heathrow
*Ferrovial increased its stake in AGS from 25% (held through HAH) to 50% in 2014.
Capital expenditure (mn £)
Ferrovial Qatar Brittania GIC CIC Alinda USS
95
38
145
219
341
132
2012 2013 2014 2015
AGS
HA H
844
1,1411,283
853
627
2011 2012 2013 2014 2015
1,2871,355 1,441
1,5411,608
2011 2012 2013 2014 2015
2011 2012 2013 2014 2015
Heathrow 69.4 70.0 72.3 73.4 75.0AGS 11.8 12.3 12.6 13.3 14.0
Glasgow 6.9 7.2 7.4 7.7 8.7
Aberdeen 3.1 3.4 3.5 3.8 3.5
Southampton 1.8 1.7 1.7 1.8 1.8
25% 20% 12.6% 11.2% 11.2% 10% 10%

62
Disclaimer
This document may contain statements that constitute forward looking statements about the Company. These statements are
based on financial projections and estimates and their underlying assumptions, statements regarding plans, objectives and
expectations, which refer to estimates regarding, among others, future growth in the different business lines and the global
business, market share, financial results and other aspects of the activity and situation relating to the Company.
Such forward looking statements, by its nature, are not guarantees of future performance and involve risks and uncertainties, and
other important factors that could cause actual developments or results to differ from those expressed in these forward looking
statements.
Analysts and investors, and any other person or entity that may need to take decisions, or prepare or release opinions about the
securities issued by the Company, are cautioned not to place undue reliance on those forward looking statements which speak only
as of the date of this communication. They are all encouraged to consult the Company’s communications and periodic filings made
with the relevant securities markets regulators and, in particular, with the Spanish Securities Markets Regulator.