FEIR APPENDIX A San Rafael Airport Recreation Facility...
27
FEIR APPENDIX A San Rafael Airport Recreation Facility Project Site Plan San Rafael, CA
Transcript of FEIR APPENDIX A San Rafael Airport Recreation Facility...

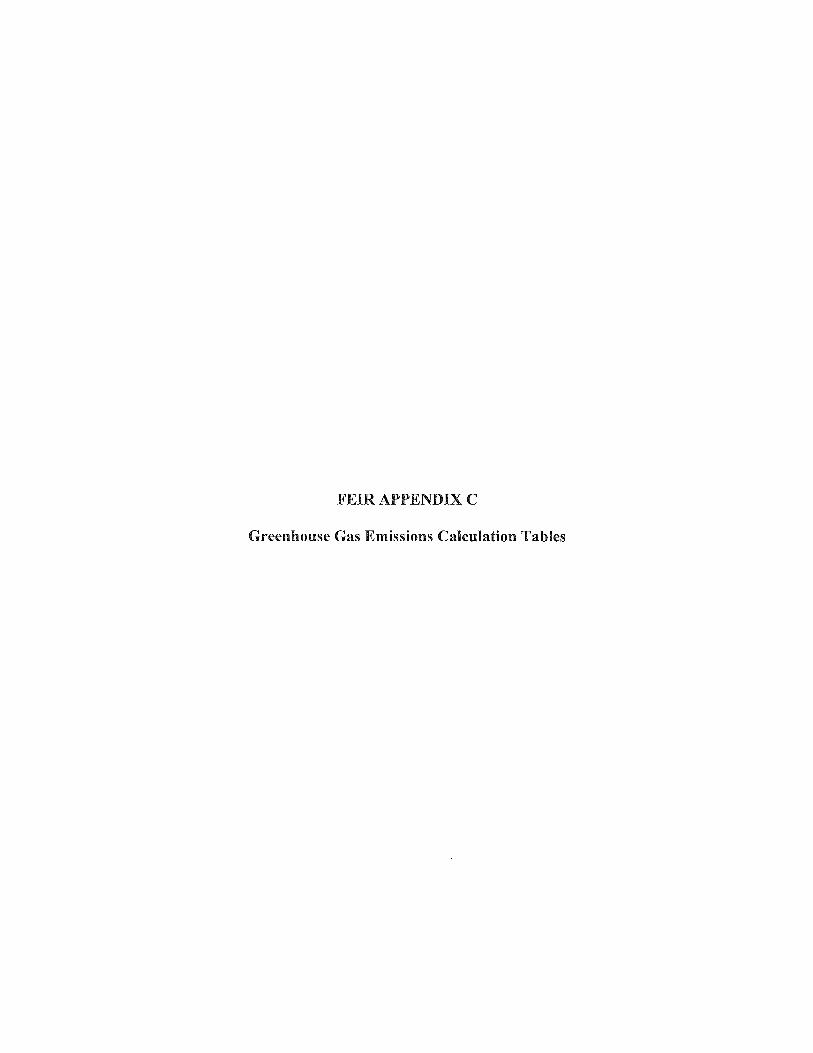
FEIR APPENDIX A
San Rafael Airport Recreation Facility Project Site Plan San Rafael, CA

~--
~-~
, , I
I I
I I ,
I I ,
I
I I
I
MUllillt A)6a)QQk:o< UI'Hl\""of1/1X"Ilbl t.:. .. nulbot. 1136 S-ICIP I\\muc:. s..lle I.) WllinUl Cr«1:. CaJ,t'JIfIO;II ~¥J~ 192!» ..... 7-1867
, r; •
GALLI NA
I
I
---""
\ I)
"" ~ -- -Appendix A. San Rafael Airpon Recreation Facili ty Project Site Plan
San Rafael. C A
Legend
:',:;:'::;.:_ Potential Wetlands (No Impacts)
Existing Eucalyptus Trees to Remain
Top of Creek Bank
-- Drainage OildllSwale
-- Primary water Features
I
I I
./
,A "'tiP PicponlhOIi O::.k! ",,,d J. 200S

FEIR APPENDIX B
Letter from John C. Hom, John C. Hom & Associates, Inc., to Bob Herbst, February 23, 2010
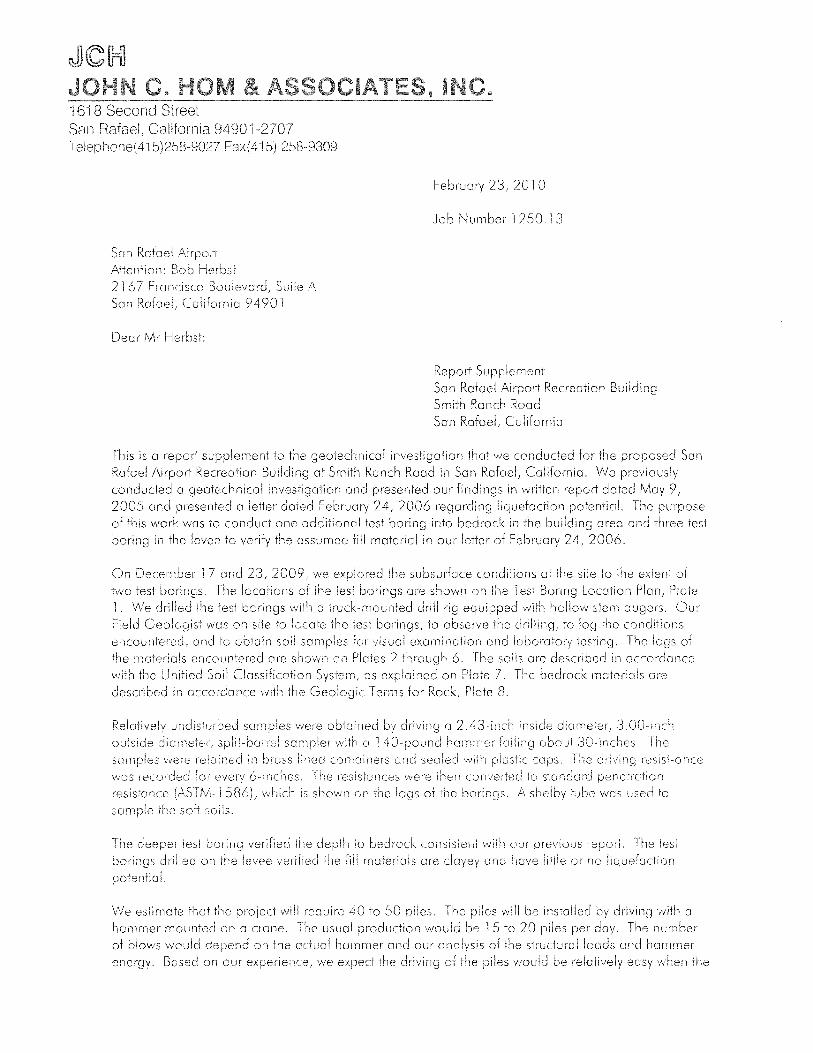
1618 Second Street Sail Rafael, California 94901-2707 Telephone(415) 258-9027 Fax (415) 258-9309
Rafaell\irporl Aiiention: 2167 Fmnciscc A Son Rafael, California 94901
Oem Mr
February 23{ 2010
Job ~~umber 1250.1 J
Report Supplemenl Son Rafael Airport Recreation Building Smith Ranch Rood
San Rafael, California
This is a repod supplement to the geotechnical investigation that we conducted for the proposed Son Rofael Airpor"j Recreation Building at Smith Ranch Rood in SOil Rafoel, California. We previously conducted a geotechnical investigoiioll and presented our findings in writien report doted Mey 9, 2005 and presented a letter doted Februmy 24, 2006 regarding liquefaction potentia!. The purpose of this work was to conduct one additional test boring into bedmck in the budding mea olld three test boring in the levee to verify the ossull1ed fill material in OUI' of February 24,2006.
On December 17 and 23, 2009{ we explored the subsurface conditions 01 the site to the extent of two test borings The locations of the tes1 bmings ore shown on the Test Boring Location Plan! Plate
1. We drilled test borings a iTuck-rnounted drill rig equipped with hollow stem augers. Our Field Geologist was all 5itelo locate the test borings, 10 observe cll-illing! to log the condiiions encountemd, to obtain soil samples for exominCition and lobomtory testing. The logs of
rllOterials encountered are shown on 2 through 6. The soils ore described in with the U Soil os explained on Plate 7. The materials are described in accordance with the Geologic T enm Rock, Picile 8.
potential
liVe estimate that the will require 40 to 50 The piles will installed by n9 with a mounted on a crone. The usual 15 to 20 piles per doy. The
of blows would depend on actuol hommer and our onolysis of the structumlloads and haillmer energy. Based on our we expect the would be eCJsy vvhen

Recreolion Building f continued 2010 Number 1250.13
Page 2
~ip of the pile is in Boy Mud. The hammer would not utilize its full energy poieniiol ond less noisy. The weigh of homlner is usuolly enough to couse the pile 10 sink into Boy Mud. When the tip is in bedrock hClimner would be driving the pile with its full energy Since we
the piles 'Nil I feet inio bedl'Ock t this driving period would be oboui minutes or less.
We trust this informotioll you at
JCH
three copies submitted
time. if you ony questions; coil.
Yours very truly f
JOHf'.~ C HOM & ASSOCli'l.TES f II'-IC
John C Hom Civil Engineer 28877 Geotechnical Engineer 412 Certificotes Expire 3/31/1 1
& ASSOCIATES. ! Geotechnical Consuftants

JCH JOHN C. HOM & ASSOCIATES, INC. Geotechnical Consultants
Job No. : 1250.13
Appr: JCH
Dote: 1/10
EXPLANATION
Test Boring
Reduced from Bose Mop
Prepared by Oberkamper and Associates
Doted: 1 /31 /05
TEST BORING LOCATION PLAN
Smith Ranch Airport Fields Son Rafael, California
PLATE
1

Ql
laboratory Tests "6 "" 8
CONSOL
J~[H] JOHN C. HOM & ASSOCIATES, INC. Geotechnical Consultants
0 * 0 ~::-~ :0 C
3 -v; 2 .- c
0 o 0 co :Eu
17 14.2
17 19.4
Job No: 1250.13
Appr: JCH
Date: 1/10
.;::- Ql
.;;; L Ci ~ t3cn 0. E
Ql 00..,9, 0 0
en
117
109
Log of Boring 1
Equipment: Truck Mounted Drill Rig
Elevation: 0 Date Drilled: 12/17/09
MEDIUM BROWN, ORANGE and GREY Sll1Y CLAY (CH), wet, medium stiff, (Fill)
DARK GREY CLAY (CH), saturated, soft, (BAY MUD)
MOTTLED RED, BROWN and ORANGE GRAVELLY SANDY CLAY (Cl), saturated very stiff, (AllUVIUM)
Water level as measured at time of backfill (12/17/09-12:30pm)
MOTTLED ORANGE and TAN GRAVEllY SANDY CLAY (Cl), saturated, very stiff, (AllUVIUM)
MOTTLED RED, ORANGE and BROWN GRAVEllY SANDY CLAY (Cl), saturated, very stiff, (AllUVIUM)
lOG OF BORING 1
Smith Ranch Airport Fields San Rafael, California
PLATE
2

laboratory Tests
UC = 1868 psf
J~[]={] JOHN C. HOM & ASSOCIATES, INC. Geotechnical Consultants
71
:19
45
55
60
65
70
75
80
Job No: 1250.13
Appr: JCH
Date: 1/10
'" Q. E a
V)
Log of Boring 1
Equipment: Truck Mounted Drill Rig
Elevation: 0 Date Drilled: 12/17/09
MOITlED RED, ORANGE and BROWN GRAVEllY SANDY CLAY (Cl), saturated, very stiff, (AllUVIUM)
DARK GREY SHEARED SHALE, moderately hard, friable, highly weathered, (BEDROCK)
Boltom of Boring
*Blows converted to Standard Penetration Resista nce.
PLATE lOG OF BORING 1
Smith Ranch Airport Fields San Rafael, California 3

Q)
Laboratory Tests 0 "" 0
J~[}={] JOHN C. HOM & ASSOCIATES, INC. Geotechnical Consultants
0 ?1: 0 e~ "S ~~ i: 0 o 0
0:; :::;;;:u
7 29.3
8 37.6
3 101.2
2 94.1
Job No: 1250.13
Appr: JCH
Date: 1/10
-i!' c:--'~~
L a.
Q) U Q)
00-9, 0
0
2 64
4
6
61
8
10
43
12
14 44
16
Q)
a. E a
V>
Log of Boring 2
Equipment: Track Mounted Drill Rig
Elevation: 0 Date Drilled: 12/23/09
LIGHT ORANGE and GREY-BROWN SILTY CLAY (CH), moist, medium stiff, (FILL)
DARK GREY CLAY (CH), wet, medium stiff, (FILL)
DARK GREY CLAY (CH), saturated, soft, (BAY MUD)
Boltom of Boring
No measurable groundwater at time of backfill
LOG OF BORING 2
Smith Ranch Airport Fields San Rafael, California
PLATE
4

Q)
La bora tory Tests 0 "" ~
-#200 Wash = 91.9%
J~[}={] JOHN C. HOM & ASSOCIATES, INC. Geotechnical Consultants
0 * "g ~"i" .c ~ :§-E 'Vi
~ ~ 't 0 o 0 co ~u 00.3
31.1
10 30.7 55
2 93.2 44
109.9 40
Job No: 1250.13
Appr: JCH
Date: 1/10
Q)
..r:: 0. Q. E Q) 0 0 V)
14
16
Log of Boring 3
Equipment: Track Mounted Drill Rig
Elevation: 0 Date Drilled: 12/23/09
LIGHT GREY-BROWN SILTY CLAY (CH), moist, stiff, (FILL)
DARK GREY CLAY (CH), saturated, soft, (BAY MUD)
Bottom of Boring
No groundwater encountered at time of backfill
LOG OF BORING 3
Smith Ranch Airport Fields San Rafael, California
PLATE
5
'" Laboralary T esls 0 0"-
~
J~[H] JOHN C. HOM & ASSOCIATES, INC. Geotechnical Consultants
0 ~
~ ~~ .2 '" 3 <n-.- c
0 o 0 co ::;:;:U
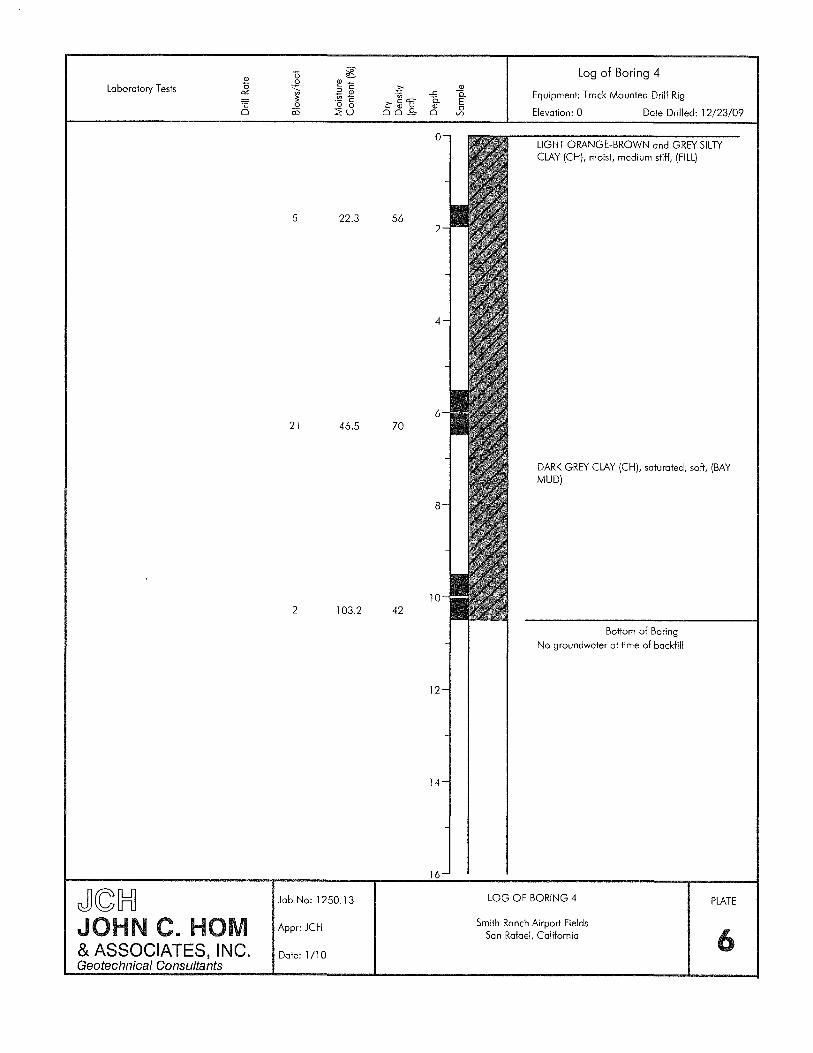
5 22.3
21 46.5
2 103.2
Jab No: 1250.13
Appr: JCH
Dale: 1/10
.?:-'v; -c
o.. c:-c= '" v '" oo.E, 0
56
70
42
12
14
16
'" 0.. E 0
Vl
Log of Boring 4
Equipmenl: Track Mounled Drill Rig
Elevalion: 0 Dale Drilled: 12/23/09
LIGHT ORANGE-BROWN and GREY SILTY CLAY (CH), moisl, medium sfiff, (FILL)
DARK GREY CLAY (CH), saluraled, soft, (BAY MUD)
Bottom of Baring
No groundwaler 01 lime of backfill
LOG OF BORING 4
Smilh Ranch Airport Fields San Rafael, California
PLATE
6

MAJOR DIVISIONS
GRAVELS MORE THAN HALF
COARSE FRACTION IS LARGER THAN NO.4 SIEVE SIZE
SANDS
MORE THAN HALF COARSE FRACTION I
S SMALLER THAN NO.4 SIEVE SIZE
CLEAN GRAVELS WITH LITTLE OR NO FINES
GRAVELS WITH OVER 12% FINES
CLEAN SAN DS WITH LITTLE OR NO FINES
SANDS WITH OVER 12% FINES
SILTS AND CLAYS
LIQUID LIMIT LESS THAN 50
SILTS AND CLAYS
LIQUID LIMIT GREATER THAN 50
HIGHLY ORGANIC SOILS
GP ~;;..: ..
GC ~ SW
SP
SM
SC
ML
CL
OL
MH
CH
OH
PI
• • • • • • • •
I I
TYPICAL NAMES
WELL GRADED GRAVELS, GRAVEL-SAND MIXTURES
POORLY GRADED GRAVELS, GRAVEL-SAND MIXTURES
SILTY GRAVELS, POORLY GRADED GRAVEL-SAND-SILT MIXTURES
CLAYEY GRAVELS, POORLY GRADED GRAVEL-SAND-CLAY MIXTURES
WELL GRADED SANDS, GRAVELLY SANDS
POORLY GRADED SANDS, GRAVELLY SANDS
SILTY SANDS, POORLY GRADED SAND-SILT MIXTURES
CLAYEY SANDS, POORLY GRADED SAND-CLAY MIXTURES
INORGANIC SILTS AND VERY FINE SANDS, SILTY OR CLAYEY FINE SANDS, OR CLAYEY SILTS WITH SLIGHT PLASTICITY
INORGANIC CLAYS OF LOW TO MEDIUM PLASTICITY, GRAVELLY CLAYS, SANDY CLAYS, SILTY CLAYS, LEAN CLAYS
ORGANIC CLAYS AND ORGANIC SILTY CLAYS OF LOW PLASTICITY
INORGANIC SILTS, FINE SANDY OR SILTY SOILS, PLASTIC SILTS
INORGANIC CLAYS OF HIGH PLASTICITY, FAT CLAYS
ORGANIC CLAYS OF MEDIUM TO HIGH PLASTICITY, ORGANIC SILTS
PEAT AND OTHER HIGHLY ORGANIC SOILS
UNIFIED SOIL CLASSIFICATION SYSTEM
Cansol Consolidation
LL Liquid Limit (in %)
PL Plastic Limit (in %)
PI Plastic Index (in %)
Gs Specific Gravity
SA Sieve Analysis
I11III Undisturbed Sample
[l] Auger Sample
Gd Standard Penetration Sample
CZl Excavation Sample
0 Sample Aflempt No Recovery
Tx
TxCU
DS
FVS
UC
LVS
SS
EXP
P
I Shear Strength, psi
~ ~ Confining Pressure, psi
320 (2600) Unconsolidated Undrained Triaxial
320 (2600)
2750 (2000)
470
2000
700
Shrink Swell
Expansion
Permeability
Consolidated Undrained T rimdol
Consolidated Drained Direct Shear
Field Vane Shear
Unconfined Compression
laboratory Vane Shear
Note: All strength tests on 2.8" or 2.4" diameter samples unless olherwise indicated.
JCH JOHN C. HOM & ASSOCIATES, INC. Geotechnical Consultants
job No: 1250.13
Appr: JCH
Date: 1/10
KEY TO TEST DATA
SOIL CLASSIFICATION CHART AND KEY TO TEST DATA
Smilh Ranch Airport Fields San Rafael, California
PLATE
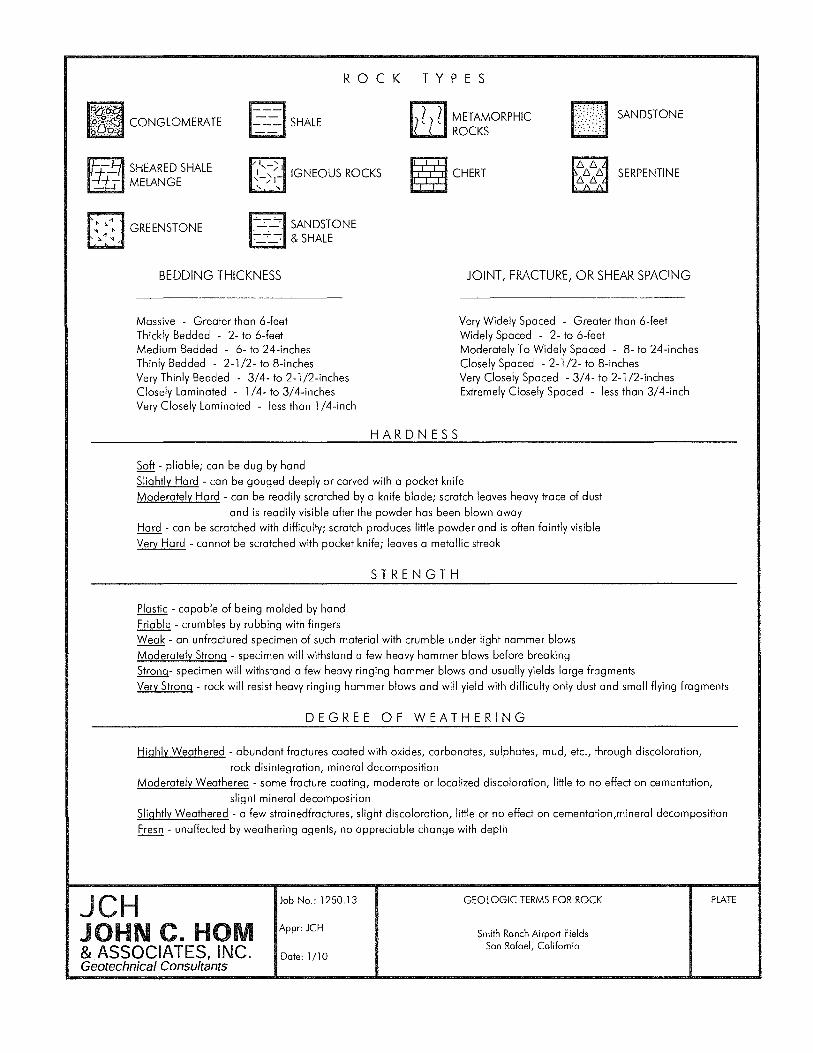
ROC K
I~=~I SHALE
T Y PES
~ METAMORPHIC lLL.I ROCKS
SANDSTONE
II+E) SHEARED SHALE ± - MELANGE
1,_', (_.>;_ IGNEOUS ROCKS , , ~CHERT
t: ::1 GREENSTONE . ~, r'::":'~~'1 SANDSTONE ~...,.....:: & SHALE
BEDDING THICKNESS
Massive - Greater than 6-feet Thickly Bedded - 2- to 6-feet Medium Bedded - 6- to 24-inches Thinly Bedded - 2-1/2- to 8-inches Very Thinly Bedded - 3/4- to 2-1/2-inches Closely Laminated - 1/4- to 3/4-inches Very Closely Laminated - less than 1/4-inch
Soft - pliable; can be dug by hand
HARDNESS
JOINT, FRACTURE, OR SHEAR SPACING
Very Widely Spaced - Greater than 6-feet Widely Spaced - 2- to 6-feet Moderately To Widely Spaced - 8- to 24-inches Closely Spaced - 2-1/2- to 8-inches Very Closely Spaced - 3/4- to 2-1/2-inches Extremely Closely Spaced - less than 3/4-inch
Slightly Hard - can be gouged deeply or carved with a pocket knife
Moderately Hard - can be readily scratched by a knife blade; scratch leaves heavy trace of dust
and is readily visible after the powder has been blown away
Hard - can be scratched with difficulty; scratch produces little powder and is often faintly visible
Very Hard - cannot be scratched with pocket knife; leaves a metallic streak
Plastic - capable of being molded by hand
Friable - crumbles by rubbing with fingers
STRENGTH
Weak - an unfractured specimen of such material with crumble under light hammer blows
Moderately Strong - specimen will withstand a few heavy hammer blows before breaking
Strong- specimen will withstand a few heavy ringing hammer blows and usually yields large fragments
Very Strong - rock will resist heavy ringing hammer blows and will yield with difficulty only dust and small flying fragments
DEGREE OF WEATHERING
Highly Weathered - abundant frodures coated with oxides, carbonates, sulphotes, mud, etc., through discoloration,
rock disintegration, mineral decomposition
Moderately Weathered - some fracture coating, moderate or localized discoloration, little to no effect on cementation,
slight mineral decomposition
Slightly Weathered - a few stroinedfroctures, slight discoloration, little or no effect on cementotion,minerol decomposition
Fresh - unaffected by weathering agents, no appreciable change with depth
JCH JOHN C. HOM & ASSOCIATES, INC. Geotechnical Consultants
Job No.: 1250.13
Appr: JCH
Date: 1/10
GEOLOGIC TERMS FOR ROCK
Smith Ranch Airport Fields San Rafael, California
PLATE

PRESSURE (PSF X 1000)
0.10 0.20 0.30 0.50 0.70 1.00 2.00 3.00 5.00 7.00 10.0 20.0 30.0 40.0 '( i'-- r- U -.
r- -.
~ 4 "',,-
"- I"E) 8
\ 1\
12 \
16 1\ Z i\ 0 ~ \ « 20 0 :::; 0
\ V)
\ Z 24 0 A u I- l.7--. c-- -. 1\ z r- '---. w 28
I 1\ u -. 0<: r- c--
W 0.... r- r-
~ \ 32
:--.
! r--r--~~
36
i
40
44
48 0.10 0.20 0.30 0.50 0.70 1.00 2.00 3.00 5.00 7.00 10.0 20.0 30.0 40.0
Type of Specimen Undisturbed Before Test After Test
Diameter (in.) 2.43 I Height (in.) 0.800 Moisture Content 105.4 67.2
Overburden Pressure, Po 900 psf Void Ratio 2.826 1.869
Preconsolidation Pressure, Pc 900 psf Degree Saturation 100% 100%
Compression Index, Cc 0.28 Dry Density 44 33
Liquid Limit I Plastic Limit Plastic Index Specific Gravity, Gs 2.7, assum d
Classification DARK GRAY CLAY (Cl) I Source Boring 1 @22.5'
JCH Job No. : 1721.1 PLATE CONSOLIDATION TEST REPORT
JOHN C. HOM Appr: JCH Smith Ranch Airport Fields 9 & ASSOCIATES, INC. Dale: 1/10
San Rafael, California
Geotechnical Consultants
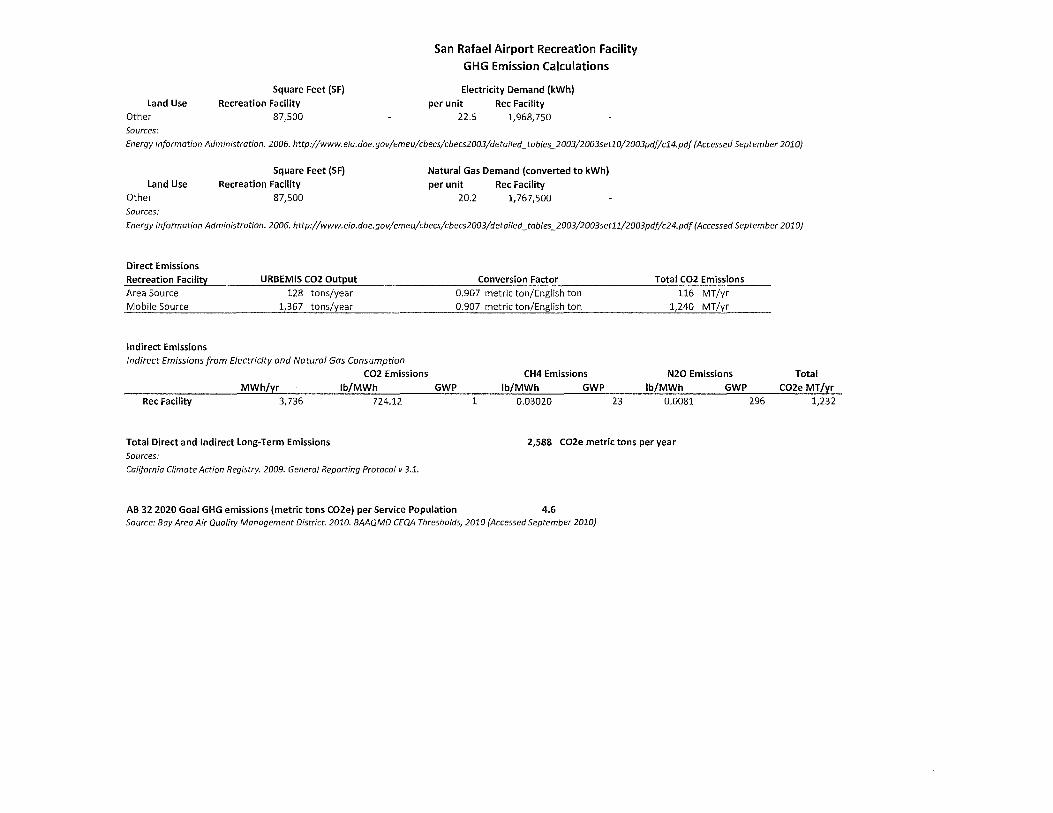
FEIR APPENDIX C
Greenhouse Gas Emissions Calculation Tables
land Use Other Sources:
Square Feet (SF)
Recreation Facility
87,500
San Rafael Airport Recreation Facility
GHG Emission Calculations
Electricity Demand (kWh)
per unit
22.5 Rec Facility
1,968,750
Energy Information Administration. 2006. http://www. eia.doe. gov/emeu/cbecs/cbecs2003/detailed_ tables_ 2003/2003setl0/2003pdf/c14.pdf (Accessed September 2010)
land Use Other Saurces:
Square Feet (SF)
Recreation Facility
87,500
Natural Gas Demand (converted to kWh)
per unit 20.2
Rec Facility 1,767,500
Energy Information Administration. 2006. http://www. eia. doe. gov/emeu/cbec5/cbecs2003/detailed_ tables_2003/2003setll/2003pdf/c24.pdf (Accessed September 2010)
Direct Emissions
Recreation Facility Area Source Mobile Source
Indirect Emissions
URBEMIS C02 Output
128 tons/year 1,367 tons/year
Indirect Emissions from Electricity and Natural Gas Consumption
C02 Emissions
Conversion Factor
0.907 metric ton/English ton 0.907 metric ton/English ton
CH4 Emissions
MWh/yr Ib/MWh GWP Ib/MWh GWP Rec Facility 3,736 724.12 1 0.03020 23
Total C02 Emissions
116 MT/yr 1,240 MT/yr
N20 Emissions
Ib/MWh GWP 0.0081
Total Direct and Indirect long-Term Emissions Sources:
2,S88 C02e metric tons per year
California Climate Action Registry. 2009. General Reporting Protocol v 3.1.
AB 32 2020 Goal GHG emissions (metric tons C02e) per Service Population 4.6 Source: Bay Area Air Quality Management District. 2010. BAAQMD CEQA Thresholds, 2010 (Accessed September 2010)
296
Total
C02e MT/yr 1,232

GHG Reduction SurnlTlary
Construction Phase GHG Emission Reductions
MTC02e C&D Waste Diversion 23 Anti-Idling 53 Equipment Maintenance 51 Construction Worker Carpool 241 Total 367
Annual Project GHG Emission Reductions
MTC02e Photovoltaics 155 Green Building 184 Lighting Efficiency 12 Synthetic Turf 3 Water Conservation 31 Total 386

IEmissIon-Re-cfuctf6-ns (Metric Tons C02e) 231
C&D Waste Reductions
Proposed Squre Footage 85,700
Average C&D Waste Generated (Ibis.!.) 4.34
Total Waste Generated Metric Tons 169
Total,\!\I •• teDhi.~e4 from Landfill (Metne_ 127 Methodology.
Source:
EPA states the weighted average C&D waste generated in nonresidential construction is 4.34 Ib/s.f. Assumed 75% diversion rate. Emission were calculated using EPA's WARM Model coefficients.
EPA Estimating 2003 Building Related Construction and Demolition Malerials Amounts
CalRecycle Detailed Characten"zation of Construction and Demolition Waste, 2006
USA Today March 2009 article based on U.S. Census Data
caD Waste Characterization C&D Waste Characterization Combined
"/(1 ofWast~ Metric Tons Metric Tons wI 75% Diversion Metric Ton Metric Ton Total C02e Reduced {Metric Tom
Composition Roofing 10.2% 17 4 Dimensional Lumber 33 8 15
Remainder Composit
Lg. Asphalt
Dirt & Sand
Other Aggregates Clean Dimensional Lu Lg. Concrete wlo Reb; Painted Wood Clean Gypsum Board Clean Engineered Wo Paper Organic
8.3%
8.1%
6,6%
6.4% 5.9% 5.2% 4.6% 4.5% 4.5% 3.2% 3.0%
14
14
11 11 10 9
Concrete & Asphalt
Paper
Organ·lc
33 nla


Emissions Reduction
I 20201 IEmissions Reduction (MT C02e) 1841
Title 24 Energy Reductions
Title 24 Applied to Project
2008 Standards
Methodology
-Assumed proposed project exceeds Title 24 energy efficiency standards by 15 percent with green building practices.
Sources
-California Energy Commission, Impact Analysis: 2008 Update to the California Energy Efficiency Standards for Residential and Nonresidential Buildings, November 2007

Emission Reductions
IEmission Reductions (Metric Tons C02e) 121
Operation Reductions
Total MWh if Total Total
Lighting Type/Location Total MWh traditional bulbs Electricity Emission
were used Saved (MWh) Reductions IMTC02el
ParkinQ Lot 12.20 23.81 11.61 4 Exterior of Proposed BuildinQ 14.77 34.89 20.12 7 Bollards 9.29 13.80 4.51 1
Methodology:
-Using project specific information provided by the applicant to calculate energy consumption. -Assumed lights will be on 4,280 hours annually
Source -CAPCOA (201 0) <hUp://www.capcoa.org/wp-contentiuploads/downloads/2010/09/CAPCOA-Quantification-Report-9-14-Final.pdf>pg.119

C02e Reductions r----- 20201
IEmiSsIon~Reductions MT C02e 1551
Energy Reductions 2020
kW PV Installed (cumulative)1 259
AveraQe Sun Hours per day 5.00
ArinualElectricitY generated (kWhj 473,040.00
Annu(jIElectrlcitv: generated"(MVVh) 473.04
Methodology:
Source
-Assumed an average 200 watt photovoltaic panel
-Average Sun Hours per day obtained from the National Renewable Energy Lab. Assumes South-facing tilted system. http://www . n rei. g ov/g is/images/map _pv _us_an n u a 11 Okm_ d ec2008 .jpg

Emission Reductions
IEmission-Reductions (Metric Tons C02e) 311
Operation Reductions
Percentagede!:recu,e In 1;innualt1;ihdscaping water consumption " 40%
Total emissionl)~s~Qc;i:.t(,;~Vlfith landscaping 81.3
Methodology:
Source
- Assumed a 40% decrease in annual water consumption for the proposed irrigation system. - Assumed 70% of water consumption per year for the project was for outdoor landscaping
'-Synthetic Turf Council <http://www.syntheticturfcouncil.org/displaycommon.cfm?an=1 &subarticlenbr=228> -Enerov associated with water consumption calculated usino URBEMIS 2007

Emission Reductions
IEmisslon-Reductions (Metric Tons C02~ 31
Operation Reductions
Assumptions
Source
- Assumed annual water savings of a synthetic turf sports field is 750,000 gallons of water.
-Synthetic Turf Council < http://www .synthetictu rfcou n cil. org/d isp laycomm on. cfm? a n= 1 &su ba rti clenbr=228> -California Energy Commission. 2005. California Energy - Water Relationship Staff Report.

rEmission Reductions (Metric Tons C02) 241 I
Emission Reductions
Assumptions
Sources
55% of all construction related emissions were attributed to employee commute. Assumed 14% of construction worker carpool based on 2000 Census data. Assumed an increase in carpool mode share to 20%
EPA Potential for Reducing Greenhouse Gas Emissions in the Construction Sector, February 2009 2000 US Census Data

IEmissiOn Reduction (Metric Tons C02e) 511
Methodology Proper equipment maintenance can reduce construction related C02 emissions by 0.5%
Source EPA Potential for Reducing Greenhouse Gas Emissions in the Construction Sector, February 2009

Emission Reductions
IEmlssionReduclions{MetricTonsC(26) r 531
Operation Reductions
Methodology: - Total construction operations calculated using Urbemis 9.2.4 -Assume heavy trucks idle for one hour per day - According to http://www.cobbcountyga.gov/green/downloads/meassure37-reduction.pdf, vehicles consume 1 gallon of diesel fuel for every hour of idling. Assume 0.5 gallons per hour for passenger cars
Construction Operations
Total number of days Total hours
Total Construction Vehicles
654 5232
13