FedEx Gasoline Hybrid Electric Technical Report · vehicle is powered by a Ford 5.4L gasoline...
49
Technical Report NREL/TP-540-47693 May 2010 FedEx Gasoline Hybrid Electric Delivery Truck Evaluation: 6-Month Interim Report R. Barnitt
Transcript of FedEx Gasoline Hybrid Electric Technical Report · vehicle is powered by a Ford 5.4L gasoline...

Technical Report NREL/TP-540-47693 May 2010
FedEx Gasoline Hybrid Electric Delivery Truck Evaluation: 6-Month Interim Report R. Barnitt

National Renewable Energy Laboratory 1617 Cole Boulevard, Golden, Colorado 80401-3393 303-275-3000 • www.nrel.gov
NREL is a national laboratory of the U.S. Department of Energy Office of Energy Efficiency and Renewable Energy Operated by the Alliance for Sustainable Energy, LLC
Contract No. DE-AC36-08-GO28308
Technical Report NREL/TP-540-47693 May 2010
FedEx Gasoline Hybrid Electric Delivery Truck Evaluation: 6-Month Interim Report R. Barnitt
Prepared under Task No. FC08.3000

NOTICE
This report was prepared as an account of work sponsored by an agency of the United States government. Neither the United States government nor any agency thereof, nor any of their employees, makes any warranty, express or implied, or assumes any legal liability or responsibility for the accuracy, completeness, or usefulness of any information, apparatus, product, or process disclosed, or represents that its use would not infringe privately owned rights. Reference herein to any specific commercial product, process, or service by trade name, trademark, manufacturer, or otherwise does not necessarily constitute or imply its endorsement, recommendation, or favoring by the United States government or any agency thereof. The views and opinions of authors expressed herein do not necessarily state or reflect those of the United States government or any agency thereof.
Available electronically at http://www.osti.gov/bridge
Available for a processing fee to U.S. Department of Energy and its contractors, in paper, from:
U.S. Department of Energy Office of Scientific and Technical Information P.O. Box 62 Oak Ridge, TN 37831-0062 phone: 865.576.8401 fax: 865.576.5728 email: mailto:[email protected]
Available for sale to the public, in paper, from: U.S. Department of Commerce National Technical Information Service 5285 Port Royal Road Springfield, VA 22161 phone: 800.553.6847 fax: 703.605.6900 email: [email protected] online ordering: http://www.ntis.gov/ordering.htm
Printed on paper containing at least 50% wastepaper, including 20% postconsumer waste

iii
Executive Summary
This interim report presents partial (six months) results for a technology evaluation of gasoline hybrid electric parcel delivery trucks operated by FedEx in and around Los Angeles, CA. FedEx is a large commercial fleet that operates more than 22,000 motorized vehicles and has hybrid electric (diesel and gasoline) vehicles currently in service. FedEx has deployed 20 gasoline hybrid electric vehicles (gHEVs) on parcel delivery routes in the Sacramento and Los Angeles areas. A 12 month in-use technology evaluation comparing in-use fuel economy and maintenance costs of GHEVs and comparative diesel parcel delivery trucks was started in April 2009.
Six similar trucks were selected for this in-use evaluation project. Three of the trucks are gHEVs and three are conventional diesel trucks that serve as a control group. Comparison data was collected and analyzed for in-use fuel economy and fuel costs, maintenance costs, total operating costs, and vehicle uptime.
In addition, this interim report presents results of parcel delivery drive cycle collection and analysis activities as well as emissions and fuel economy results of chassis dynamometer testing of a gHEV and a comparative diesel truck at the National Renewable Energy Laboratory’s (NREL) ReFUEL laboratory. The goal of the ReFUEL testing was to quantify the reduction in emissions realized with the gHEV and to compare the fuel economy of a gHEV and a diesel vehicle.
A robust drive cycle data collection and analysis effort framed the selection of study vehicles and routes as well as structured the measurement of vehicle emissions and fuel economy on the chassis dynamometer at NREL’s ReFUEL laboratory. Tailpipe emissions from the gHEV were substantially lower across all tested drive cycles than emissions from the diesel baseline vehicle. Fuel economy was similar between the gHEV and diesel vehicle, except for the highest kinetic intensity drive cycle where the hybrid exhibited ~20% higher fuel economy.
The gHEVs experienced a smooth integration and deployment into commercial service. During the study period, the gHEVs performed well, experienced a minimum of unscheduled maintenance, and met the expectations of FedEx.
This interim report captures only the first six months of study. To account for differences in routes between the gHEV and diesel vehicles, truck routes were exchanged after six months; therefore, the 12-month average fuel economy will be a more accurate comparison between the two vehicle groups. A final report will be issued when 12 months of in-use data have been collected and analyzed.

iv
Acronyms and Abbreviations
AC Air conditioning AQMD Air Quality Management District ATA American Trucking Association AVTA Advanced Vehicle Testing Activity CAN Controller Area Networks CI Compression ignition CO Carbon monoxide DOE U.S. Department of Energy DPF Diesel particulate filter gHEV Gasoline hybrid electric vehicle GVWR Gross vehicle weight rating HP Horsepower HVAC Heating, ventilation and cooling lb-ft Foot pounds mpg Miles per gallon NOx Oxides of nitrogen NREL National Renewable Energy Laboratory PM Particulate matter RPM Revolutions per minute SI Spark ignition THC Total hydrocarbons TWC Three-way catalyst

v
Table of Contents Executive Summary ................................................................................................................................... iiiAcronyms and Abbreviations ................................................................................................................... ivList of Figures ............................................................................................................................................ viList of Tables .............................................................................................................................................. vi1 Background ........................................................................................................................................... 12 Introduction ........................................................................................................................................... 13 Approach ............................................................................................................................................... 2
3.1 Route / Duty-Cycle Selection ..............................................................................................23.2 Vehicle Descriptions ............................................................................................................63.3 Vehicle Emissions and Fuel Economy Measurement ..........................................................73.4 Vehicle Fueling and Data Collection ...................................................................................73.5 Vehicle Maintenance and Data Collection ..........................................................................8
3.5.1 Vehicle Warranty Repairs ...........................................................................................83.6 Vehicle Uptime ....................................................................................................................9
4 Results ................................................................................................................................................... 94.1 Vehicle Emissions and Fuel Economy Measurement ..........................................................9
4.1.1 Vehicle Emissions Comparison ..................................................................................94.1.2 Vehicle Fuel Economy Comparison .........................................................................10
4.2 In-Use Fuel Economy and Costs ........................................................................................114.3 Maintenance Costs .............................................................................................................13
4.3.1 Vehicle Warranty Repairs .........................................................................................184.4 Total Operating Costs ........................................................................................................184.5 Vehicle Uptime ..................................................................................................................19
5 Summary ............................................................................................................................................. 20Acknowledgments .................................................................................................................................... 22Appendix. ReFUEL Test Report ............................................................................................................... 23
Objectives ................................................................................................................................25General Lab Description and Methods ....................................................................................25
Chassis Dynamometer .......................................................................................................25Fuel Storage and Blending .................................................................................................26Fuel Metering & Conditioning ...........................................................................................27Air Handling & Conditioning ............................................................................................27Emissions Measurement ....................................................................................................27
Project Specific Setup and Methods ........................................................................................29Test Vehicles ......................................................................................................................30Fuel ....................................................................................................................................30Air and Exhaust ..................................................................................................................30Vehicle Simulation .............................................................................................................31
Test Description and Results ...................................................................................................31State Of Charge Considerations .........................................................................................32
ReFUEL Test Report Appendix A. Test Cell Instrumentation ................................................33ReFUEL Test Report Appendix B. Fuel Analysis ...................................................................35ReFUEL Test Report Appendix C. Coast Down Data ............................................................37ReFUEL Test Report Appendix D. Test Results .....................................................................38

vi
List of Figures Figure 1. Four gHEV routes at FedEx POC depot .......................................................................... 4Figure 2. Comparison of drive cycle kinetic intensities ................................................................. 6Figure 3. Criteria emissions by drive cycle .................................................................................. 10Figure 4. Fuel economy results ..................................................................................................... 12Figure 5. Fuel and fuel cost/mile results ....................................................................................... 13Figure 6. Total maintenance cost and maintenance cost/mile results ........................................... 14Figure 7. gHEV maintenance costs by system .............................................................................. 16Figure 8. Diesel maintenance costs by system .............................................................................. 16Figure 9. Lower tier maintenance costs per mile by system ......................................................... 17Figure 10. Total operating costs .................................................................................................... 19Figure 11. Vehicle uptime ............................................................................................................. 20Figure A-1. Chassis dynamometer schematic ............................................................................... 26Figure A-2. Pierburg fuel metering system ................................................................................... 27Figure A-3. Venturi nozzles .......................................................................................................... 28Figure A-4. Gaseous and PM sampling benches .......................................................................... 28Figure A-5. Class 1000 clean room, filter housing, and microbalance ......................................... 29Figure A-6. Chassis cell with test vehicle ..................................................................................... 30Figure A-7. Process and instrumentation diagram ........................................................................ 33Figure A-8a. HEV track coast down curves ................................................................................. 37Figure A-8b. Coast down comparison – conducted at ReFUEL .................................................. 37Figure A-9. NYCC drive cycle ..................................................................................................... 38Figure A-10. Orange County Bus drive cycle .............................................................................. 38Figure A-11. HTUF4 drive cycle .................................................................................................. 39 List of Tables Table 1. AZD Balance Hybrid System ........................................................................................... 2Table 2. Drive Cycle Data Collection by Truck-Days .................................................................... 3Table 3. Key Drive Cycle Characteristics – gHEV Routes at POC Depot ..................................... 5Table 4. FedEx Delivery Truck Basic Information ........................................................................ 7Table 5. Summary of Emissions and Fuel Economy Results ......................................................... 9Table 6. gHEV Criteria Emissions Reductions by Drive Cycle ................................................... 10Table 7. gHEV Fuel Economy Comparison by Drive Cycle ........................................................ 11Table 8. Fuel Economy and Costs from Retail Fueling Records .................................................. 12Table 9. Relative Ages of Study Vehicles .................................................................................... 13Table 10. Maintenance Costs by System ...................................................................................... 15Table 11. Vehicle Warranty Repairs ............................................................................................. 18Table 12. Total Operating Costs ................................................................................................... 19Table 13. Vehicle Uptime ............................................................................................................. 20Table A-1. Test Vehicle Information ............................................................................................ 30Table A-2. Instrumentation List .................................................................................................... 34Table A-3. CARB Diesel Fuel Analysis ....................................................................................... 35Table A-4. CARB Phase II Gasoline ............................................................................................ 36Table A-5. Conventional Test Results .......................................................................................... 40Table A-6. Hybrid Test Results .................................................................................................... 41

1
1 Background
The Fleet Test and Evaluation (FT&E) Team at the National Renewable Energy Laboratory (NREL) provides unbiased evaluations of alternative fuel and advanced transportation technologies that reduce U.S. dependence on foreign oil while improving the nation’s air quality. The FT&E team’s role is to bridge the gap between research and development (R&D) and the commercial availability of alternative fuels and advanced vehicle technologies. FT&E supports the U.S. Department of Energy’s (DOE) Vehicle Technologies Program by examining market factors and customer requirements, evaluating the performance and durability of alternative fuel and advanced technology vehicles, and assessing the performance of these vehicles in fleet applications.
The FT&E team supports vehicle research activities at NREL by conducting medium- and heavy-duty vehicle evaluations. The team’s tasks include selecting appropriate technologies to validate, identifying fleets to evaluate, designing test plans, gathering on-site data, preparing technical reports, and communicating results on its Web site and in print publications. NREL has completed numerous medium- and heavy-duty vehicle evaluations based on an established data collection protocol, known as the General Evaluation Plan,1
This technology evaluation project with FedEx is supported and primarily sponsored by DOE. This project is also part of a larger effort funded primarily by South Coast AQMD and managed by Calstart, which will assess the potential for electric drive parcel delivery vehicles in southern California.
developed with and for DOE. This project supports DOE’s Advanced Vehicle Testing Activity (AVTA).
2 Introduction
This document presents interim results for the technology evaluation of gasoline hybrid electric parcel delivery trucks operated by FedEx in and around Los Angeles, CA. FedEx is a large commercial fleet that operates more than 22,000 motorized vehicles and has hybrid electric (diesel and gasoline) vehicles currently in service. FedEx has deployed 20 gasoline hybrid electric vehicles (gHEVs) on parcel delivery routes in the Sacramento and Los Angeles areas. These gHEVs are built upon a Ford E-450 strip chassis, and each vehicle is powered by a Ford 5.4L gasoline engine and Azure Dynamics, Inc. (AZD) Balance Hybrid System. Additional vehicle information is discussed in subsequent sections, while the specifics of the hybrid system evaluated are presented in Table 1.
1 Available on the Web at http://www.nrel.gov/docs/fy02osti/32392.pdf.

2
Table 1. AZD Balance Hybrid System
Model Year 2008
Model Balance Hybrid Electric (Parallel Hybrid)
Motor 100 kW AC induction w/ regenerative braking
Motor Controller 120 kW Inverter
Transmission Elect. 5-Spd Torqshift Auto O/D Transmission
Battery Cobasys 288 V, 60 kW, 8.5 Ah, nickel metal hydride Automatic high-voltage disconnect in case of vehicle collision
System Voltage 288 V DC Nominal
Power Steering/Brakes Engine on – standard engine driven pump
12V System Alternator supplemented by DC/DC converter
Cooling Engine – Ford cooling system with electrified radiator cooling fans Hybrid system – Separate low temp cooling loop
This interim report presents partial (six months) results from a 12 month in-use evaluation comparing in-use fuel economy and maintenance costs of gHEVs and comparative diesel parcel delivery trucks. In addition, this interim report presents results of parcel delivery drive cycle collection and analysis activities as well as emissions and fuel economy results of chassis dynamometer testing of a gHEV and a comparative diesel truck at NREL’s ReFUEL laboratory. A final report will be issued when 12 months of in-use data have been collected and analyzed.
3 Approach
3.1 Route / Duty-Cycle Selection Matching gHEV and diesel trucks to similar routes is important for accurate comparison of in-use fuel economy and maintenance costs. In addition, grouping well matched gHEV and diesel truck routes aids in truck-truck comparisons as well as group-group comparisons. Finally, knowledge of in-use driving characteristics including intensity, speed, and stops per mile allows for the selection of similar stock drive cycles for chassis dynamometer testing. The relevance of chassis dynamometer-derived emissions and fuel economy is dependent upon selecting test cycles that are similar to drive cycles driven in the field.
In order to identify three well matched gHEVs and routes, eight gHEVs deployed from three FedEx depots in southern California were instrumented with GPS-based data loggers, and spatial speed-time data were collected over 61 valid route-days (Table 2). These data were used to confirm daily route consistency and to characterize each route over 55 drive cycle metrics.

3
Table 2. Drive Cycle Data Collection by Truck-Days
Truck Depot Days Logged
Days Valid 1 2 3 4 5 6 7 8 9 10 11
242286 EMT 4 3 OFF ON ON ON NM NM NM NM NM NM NM
242288 EMT 11 8 ON ON ON ON OFF OFF ON ON ON ON OFF
242289 SPQ 8 6 ON ON ON ON OFF OFF ON ON NM NM NM
242290 SPQ 10 8 ON ON ON ON OFF OFF ON ON ON ON NM
242292 POC 10 9 ON ON ON ON ON ON ON ON ON OFF NM
242293 POC 10 9 OFF ON ON ON ON ON ON ON ON ON NM
242294 POC 9 9 ON ON ON ON ON ON ON ON ON NM NM
242295 POC 9 9 ON ON ON ON ON ON ON ON ON NM NM
Totals 71 61 OFF: Vehicle not in service ON: Vehicle in service NM: Data were not measured
Our goal was to assemble a group of three similar routes being driven by gHEVs from a single depot. Two depots had been assigned only two gHEVs each. The third depot (POC) was assigned four gHEVs and was subsequently decided upon as the focus of this analysis.
Daily route consistency was confirmed by filtering and then visualizing GPS-derived latitude and longitude data. Figure 1 depicts the four routes, each with nine or more overlaid days of operation. Table 3 presents the key drive cycle characteristics of these four routes, listed by truck number.

4
Figure 1. Four gHEV routes at FedEx POC depot

5
Table 3. Key Drive Cycle Characteristics – gHEV Routes at POC Depot
Drive Cycle Characteristic Vehicle #
242292 242293 242294 242295
Average Driving Speed (mph) 16.8 17.3 16.9 16.2
Daily VMT (miles) 43.8 25.4 47.2 21.3
Stops per Mile 3.86 5.42 3.80 4.24
Avg. Acceleration (ft/s2 2.27 ) 3.63 2.11 2.10
Avg. Deceleration (ft/s2 -2.61 ) -3.36 -2.58 -2.56
Accelerations per Mile 20.90 27.26 20.88 23.08
Decelerations per Mile 20.36 27.72 19.83 22.81
Kinetic Intensity (ft-1) 0.00059 1 0.00101 0.00055 0.00075
Based upon a statistical comparison of the drive cycle characteristics listed above, gHEV numbers 242292, 242294, and 242295 had the most similar drive cycles, so they were selected as the three gHEV study vehicles for the in-use evaluation.
In the absence of GPS-derived route data, diesel vehicles driving similar routes in terms of daily VMT and traffic patterns were suggested by the POC depot manager. To best negate the likely differences in the gHEV and diesel vehicle routes, after six months of evaluation the vehicle groups will exchange routes. Thus, the 12-month averages for gHEV and diesel groups should be comparable.
Calculated kinetic intensity2
Figure 2
was used to compare real drive cycles to existing stock drive cycles, and aid in chassis dynamometer test cycle selection and vehicle simulation activities. Based upon observed drive cycle kinetic intensities, the Orange County Bus cycle was selected as a cycle that best approximated the average of the routes driven by three study vehicles, while the NYCC and HTUF4 cycles were selected as upper and lower boundaries for vocational kinetic intensity ( ).
2 O’Keefe, M. Duty Cycle Characterization and Evaluation Towards Heavy Hybrid Vehicle Applications. Society of Automotive Engineers Paper No. 2007-01-0302, 2007.

6
Figure 2. Comparison of drive cycle kinetic intensities
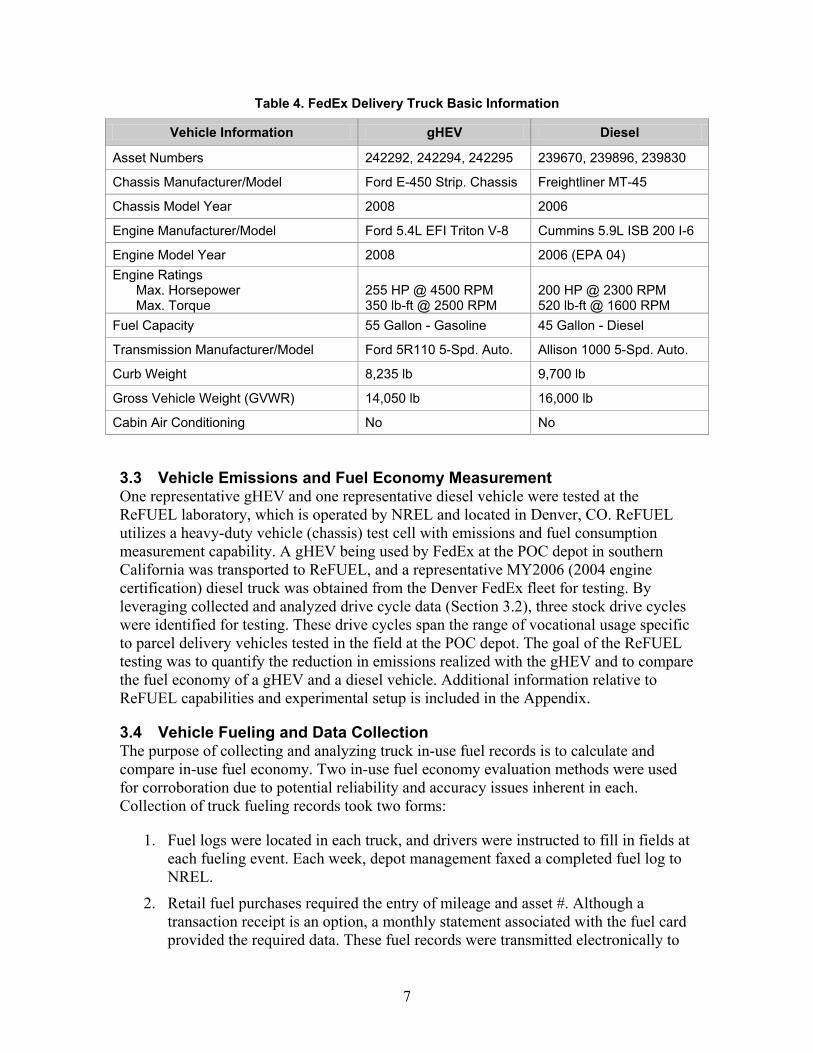
3.2 Vehicle Descriptions Based upon the activities outlined in Section 3.1, six similar trucks were selected for this in-use evaluation project. Three of the trucks are gHEVs and three are conventional diesel trucks that serve as a control group. Basic vehicle attributes are presented in Table 4.
7
Table 4. FedEx Delivery Truck Basic Information
Vehicle Information gHEV Diesel
Asset Numbers 242292, 242294, 242295 239670, 239896, 239830
Chassis Manufacturer/Model Ford E-450 Strip. Chassis Freightliner MT-45
Chassis Model Year 2008 2006
Engine Manufacturer/Model Ford 5.4L EFI Triton V-8 Cummins 5.9L ISB 200 I-6
Engine Model Year 2008 2006 (EPA 04) Engine Ratings
Max. Horsepower Max. Torque
255 HP @ 4500 RPM 350 lb-ft @ 2500 RPM
200 HP @ 2300 RPM 520 lb-ft @ 1600 RPM
Fuel Capacity 55 Gallon - Gasoline 45 Gallon - Diesel
Transmission Manufacturer/Model Ford 5R110 5-Spd. Auto. Allison 1000 5-Spd. Auto.
Curb Weight 8,235 lb 9,700 lb
Gross Vehicle Weight (GVWR) 14,050 lb 16,000 lb
Cabin Air Conditioning No No 3.3 Vehicle Emissions and Fuel Economy Measurement One representative gHEV and one representative diesel vehicle were tested at the ReFUEL laboratory, which is operated by NREL and located in Denver, CO. ReFUEL utilizes a heavy-duty vehicle (chassis) test cell with emissions and fuel consumption measurement capability. A gHEV being used by FedEx at the POC depot in southern California was transported to ReFUEL, and a representative MY2006 (2004 engine certification) diesel truck was obtained from the Denver FedEx fleet for testing. By leveraging collected and analyzed drive cycle data (Section 3.2), three stock drive cycles were identified for testing. These drive cycles span the range of vocational usage specific to parcel delivery vehicles tested in the field at the POC depot. The goal of the ReFUEL testing was to quantify the reduction in emissions realized with the gHEV and to compare the fuel economy of a gHEV and a diesel vehicle. Additional information relative to ReFUEL capabilities and experimental setup is included in the Appendix.
3.4 Vehicle Fueling and Data Collection The purpose of collecting and analyzing truck in-use fuel records is to calculate and compare in-use fuel economy. Two in-use fuel economy evaluation methods were used for corroboration due to potential reliability and accuracy issues inherent in each. Collection of truck fueling records took two forms:
1. Fuel logs were located in each truck, and drivers were instructed to fill in fields at each fueling event. Each week, depot management faxed a completed fuel log to NREL.
2. Retail fuel purchases required the entry of mileage and asset #. Although a transaction receipt is an option, a monthly statement associated with the fuel card provided the required data. These fuel records were transmitted electronically to

8
NREL, reviewed for accuracy, and analyzed to compare fuel economy for the gHEV and diesel groups.
A third method will be implemented later in this project:
3. CAN bus-derived fuel consumption will be measured with ISAAC brand data loggers. Fuel consumption data will be collected on-board the vehicles for a limited period (approx. 1-2 weeks) during the evaluation. CAN-derived fuel consumption data reflects the call for fuel under current operating conditions and is not indicative of the actual mass of fuel consumed. Azure reports +/- 3% error in CAN-derived fuel consumption during simultaneous chassis dynamometer testing. This method will be employed as a spot check of methods 1 and 2.
This overlap and cross-indexing will allow for higher confidence in in-use fuel economy calculations.
3.5 Vehicle Maintenance and Data Collection Scheduled and unscheduled maintenance is performed by FedEx personnel at the POC depot. Preventive maintenance is conducted at 84-day intervals, and the scope is identical for gHEV and diesel trucks.
Repair Orders in the form of labor hours and parts costs are cataloged by ATA code and are captured electronically. Evaluation truck Repair Orders were transmitted electronically to NREL by FedEx, reviewed for accuracy, and analyzed for a maintenance cost per mile comparison of the gHEV and diesel groups. Because several vehicle systems differ between gHEV and diesel groups, or because the common systems may experience different operating conditions, specific maintenance cost per mile figures will be calculated and reported for each of these systems.
These systems and specific components of interest include:
• Vehicle Systems
o Engine
o Hybrid propulsion system
o Brakes
• Vehicle Components
o Brake rotors, pads
o Spark plugs
o Exhaust aftertreatment (TWC and DPF)
3.5.1 Vehicle Warranty Repairs Data on warranty repairs are collected in a similar manner to data on normal maintenance actions. However, the cost data are not included in the operating cost calculation. Labor costs may be included depending on the mechanic (operator or manufacturer) and on whether those hours were reimbursed under the warranty agreement. (Warranty

9
maintenance information is collected primarily for an indication of reliability and durability.)
The MY2006 diesel trucks and pre-production gHEVs are under warranty. When a vendor (or FedEx) makes a warranty repair, the FedEx technician will close out the Repair Order to allow for reimbursement.
3.6 Vehicle Uptime gHEV availability or uptime is tracked by Azure Dynamics and reported to FedEx in a weekly, monthly, and three-monthly format. The FedEx vehicle uptime target is 98%. Azure included NREL in the distribution of this reporting metric. Diesel evaluation truck availability data was transmitted electronically to NREL by FedEx, reviewed for accuracy, and analyzed for comparison of the gHEV and diesel vehicle groups.
4 Results
4.1 Vehicle Emissions and Fuel Economy Measurement A detailed description of experimental setup, vehicle coast down curves, test fuels, tested drive cycles, and gHEV battery state of charge considerations are included in the Appendix. It is worthwhile to note two things related to the drive cycles tested. First, the NYCC drive cycle is relatively short, and to collect adequate particulate matter (PM) mass this cycle was run three times in sequence. Second, reported results for the HTUF4 cycle are specific to an NREL modification of the HTUF Class 4 PDDS drive cycle. The HTUF Class 4 PDDS drive cycle has three distinct phases totaling 55 minutes in duration. Due to scheduling and cost constraints, this cycle was shortened to include only phases 1 and 3 and was designated HTUF4.
4.1.1 Vehicle Emissions Comparison A summary of results is presented in Table 5. Distilled results and discussion are provided in the subsections below.
Table 5. Summary of Emissions and Fuel Economy Results
Drive Cycle Vehicle NOx
(g/mile) CO
(g/mile) THC
(g/mile) PM
(g/mile) Fuel
Economy (mpg)
NYCC gHEV 3.24 0.84 ND 0.0016 a 6.75
Diesel 12.70 7.60 0.80 0.7930 6.08
OC Bus gHEV 1.05 0.29 ND 0.0004 a 8.61
Diesel 7.60 2.90 0.60 0.3000 9.52
HTUF4 gHEV 0.57 1.03 0.04 0.0006 10.45
Diesel 5.20 2.50 0.40 0.2820 11.66 a Figure 3 Measured below laboratory detection limit. Note error bars in .

10
As expected, tailpipe emissions were considerably lower across all drive cycles for the gHEV than for the diesel vehicle. This hybridized, gasoline-fueled vehicle is equipped with a three-way catalyst, which results in very low tailpipe gaseous emissions. The diesel baseline vehicle was not equipped with a diesel particulate filter. For this project, precise measurement of NOx and PM were essential. The laboratory dilution ratio was calibrated to optimize for the precise measurement of NOx
Table 6
, at the expense of some hydrocarbon analyzer precision in measuring CO and HC. Thus, there is higher variability in the CO and HC data than would otherwise occur. Criteria emissions reductions are presented in .
Table 6. gHEV Criteria Emissions Reductions by Drive Cycle
Drive Cycle gHEV Emissions Reductions (%)
NOx CO THC PM
NYCC 74.5 88.9 100 99.8
OC Bus 86.2 90.0 100 99.9
HTUF4 89.0 58.6 89.9 99.8
Figure 3 visually illustrates the emissions reductions realized with the gHEV. Furthermore, the relationship between drive cycle kinetic intensity and tailpipe emissions is demonstrated. With decreasing kinetic intensity, characterized by fewer stops and accelerations per mile, tailpipe emissions are typically lower.
Figure 3. Criteria emissions by drive cycle
4.1.2 Vehicle Fuel Economy Comparison Volumetric fuel economy was measured for each vehicle over three drive cycles. The fuels were analyzed for energy content to enable normalization of volumetric fuel
11
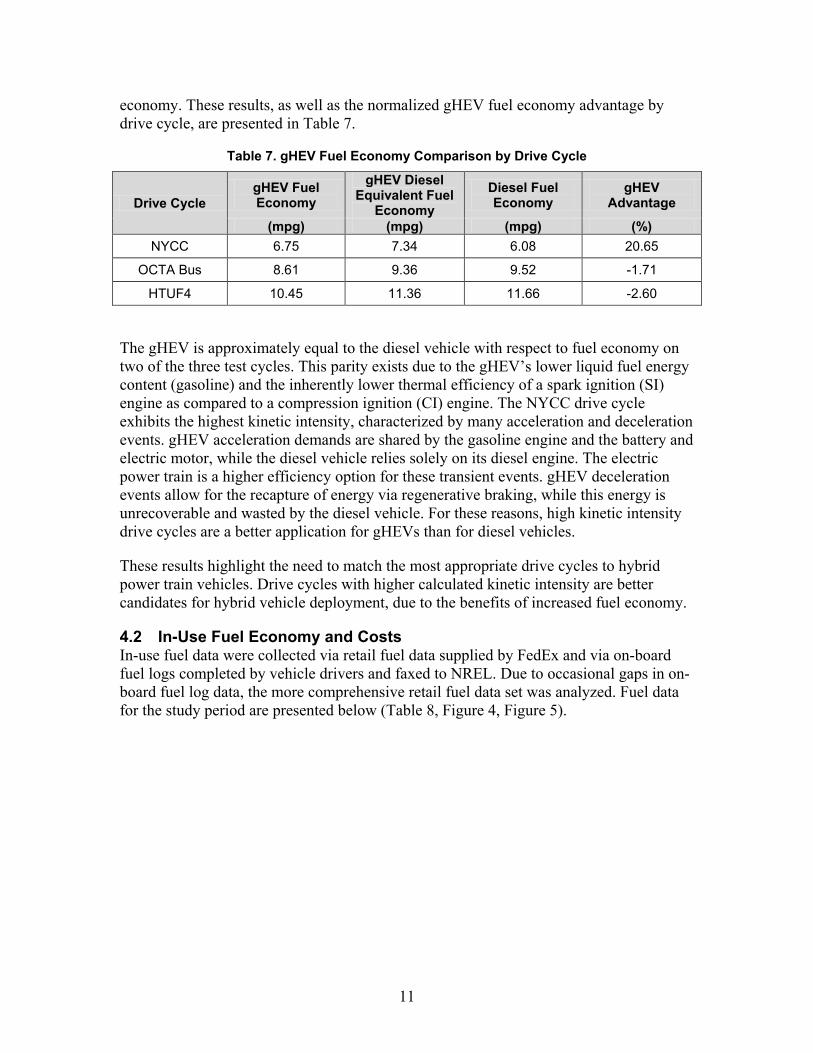
economy. These results, as well as the normalized gHEV fuel economy advantage by drive cycle, are presented in Table 7.
Table 7. gHEV Fuel Economy Comparison by Drive Cycle
Drive Cycle gHEV Fuel Economy
gHEV Diesel Equivalent Fuel
Economy Diesel Fuel Economy
gHEV Advantage
(mpg) (mpg) (mpg) (%) NYCC 6.75 7.34 6.08 20.65
OCTA Bus 8.61 9.36 9.52 -1.71
HTUF4 10.45 11.36 11.66 -2.60
The gHEV is approximately equal to the diesel vehicle with respect to fuel economy on two of the three test cycles. This parity exists due to the gHEV’s lower liquid fuel energy content (gasoline) and the inherently lower thermal efficiency of a spark ignition (SI) engine as compared to a compression ignition (CI) engine. The NYCC drive cycle exhibits the highest kinetic intensity, characterized by many acceleration and deceleration events. gHEV acceleration demands are shared by the gasoline engine and the battery and electric motor, while the diesel vehicle relies solely on its diesel engine. The electric power train is a higher efficiency option for these transient events. gHEV deceleration events allow for the recapture of energy via regenerative braking, while this energy is unrecoverable and wasted by the diesel vehicle. For these reasons, high kinetic intensity drive cycles are a better application for gHEVs than for diesel vehicles.
These results highlight the need to match the most appropriate drive cycles to hybrid power train vehicles. Drive cycles with higher calculated kinetic intensity are better candidates for hybrid vehicle deployment, due to the benefits of increased fuel economy.
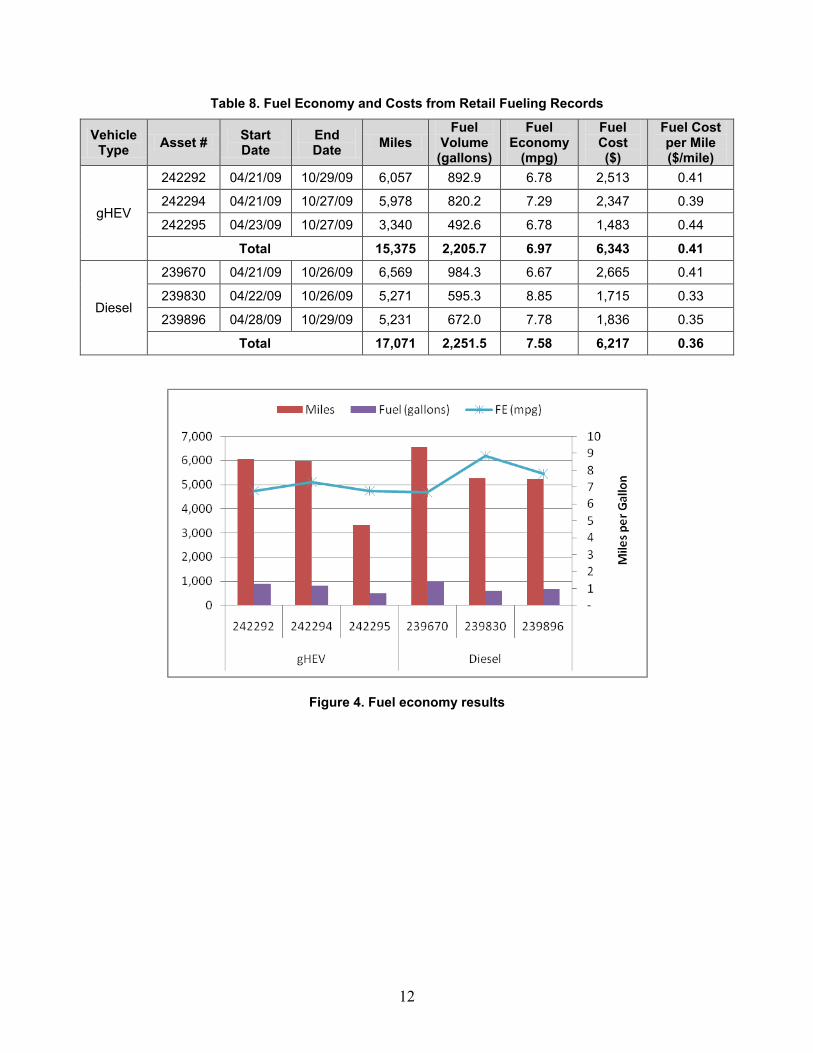
4.2 In-Use Fuel Economy and Costs In-use fuel data were collected via retail fuel data supplied by FedEx and via on-board fuel logs completed by vehicle drivers and faxed to NREL. Due to occasional gaps in on-board fuel log data, the more comprehensive retail fuel data set was analyzed. Fuel data for the study period are presented below (Table 8, Figure 4, Figure 5).
12
Table 8. Fuel Economy and Costs from Retail Fueling Records
Vehicle Type Asset # Start
Date End Date Miles
Fuel Volume (gallons)
Fuel Economy
(mpg)
Fuel Cost ($)
Fuel Cost per Mile ($/mile)
gHEV
242292 04/21/09 10/29/09 6,057 892.9 6.78 2,513 0.41
242294 04/21/09 10/27/09 5,978 820.2 7.29 2,347 0.39
242295 04/23/09 10/27/09 3,340 492.6 6.78 1,483 0.44
Total 15,375 2,205.7 6.97 6,343 0.41
Diesel
239670 04/21/09 10/26/09 6,569 984.3 6.67 2,665 0.41
239830 04/22/09 10/26/09 5,271 595.3 8.85 1,715 0.33
239896 04/28/09 10/29/09 5,231 672.0 7.78 1,836 0.35
Total 17,071 2,251.5 7.58 6,217 0.36
Figure 4. Fuel economy results

13
Figure 5. Fuel and fuel cost/mile results
CAN-based fuel economy will be measured later in the project and included in the Final Report.
4.3 Maintenance Costs Maintenance costs and maintenance costs per mile driven can be a function of vehicle age. Table 9 presents the odometer readings of the study vehicles at the beginning of and at the end of this study period.
Table 9. Relative Ages of Study Vehicles
Vehicle Type Asset # Start Miles End Miles
gHEV
242292 10,807 16,864
242294 11,190 17,168
242295 7,868 11,208
Average 9,955 15,080
Diesel
239670 37,643 44,212
239830 40,130 45,401
239896 42,245 47,476
Average 40,006 45,696
The diesel group is generally older than the gHEV group, which suggests that maintenance costs could be higher. However, the gHEV group represents a new technology, and additional maintenance procedures and/or lack of familiarity on the part of the maintenance personnel could lead to higher maintenance costs. Regardless, in their

14
current usage pattern of approximately 10,000 miles/year per vehicle, the diesel vehicles are on average three truck-years older than the gHEVs.
In-use maintenance data were supplied by FedEx and transmitted to NREL for analysis. Maintenance data for the study period are presented below (Figure 6 and Table 10).
Figure 6. Total maintenance cost and maintenance cost/mile results

15
Table 10. Maintenance Costs by System
ATA Code(s) Description
gHEV Diesel Total Cost
($) Cost per Mile
($/mile) Total Cost
($) Cost per Mile
($/mile)
000 Preventive Maintenance 858.90 0.056 1,546.44 0.091
001
Air Conditioning, Heating, and Ventilation
91.39 0.006 - -
002 Cab 241.20 0.016 203.98 0.012
003 Instruments,
Gauges, Meters
9.14 0.001 111.96 0.007
013 Brakes - - 192.62 0.011
017 Tires 947.75 0.062 923.03 0.054
031, 032 Charging System 136.44 0.009 36.56 0.002
034 Lighting System 9.14 0.001 8.28 0.000
041 Air Intake System - - 35.69 0.002
043 Exhaust 9.14 0.001 3.05 0.000
044 Fuel System - - 18.28 0.001
045 Power Plant 6.09 0.000 18.28 0.001
048 Electric
Propulsion System
18.28 0.001 - -
053 Expendable Items 29.67 0.002 18.28 0.001
066, 071, 072 Body, Doors 118.82 0.008 39.60 0.002
092 Bulk Product
Transfer (compressor)
- - 9.14 0.001
102 Special Body Codes 149.29 0.010 60.94 0.004
153 Misc. Shop Supplies 47.59 0.003 91.70 0.005
156 Back-up Camera - - 193.61 0.011
Total 2,672.84 0.174 3,511.44 0.206
Maintenance costs are dominated by preventive maintenance (PM) activities, tire replacements, and cab repairs (Figure 7 and Figure 8). These three dominant maintenance categories are removed in Figure 9, allowing for better visualization of lower-tier maintenance costs for each study group.

16
Figure 7. gHEV maintenance costs by system
Figure 8. Diesel maintenance costs by system

17
Figure 9. Lower tier maintenance costs per mile by system
Upon examination of Figure 9, there are several obvious differences between the gHEV and diesel groups. Several of them (charging system, special body codes, AC and HVAC) are likely due to “shakedown” activities when integrating the new gHEVs. Key vehicle systems for comparison are the electric propulsion system, exhaust, power plant, brakes, and fuel system; these systems exhibit design or usage differences between the study groups.
Over the six-month study period, there were three records of electric propulsion system maintenance for vehicle 242292 totaling $54.84. These included an inspection following reports of the hybrid system not functioning, followed by the replacement of a fuse by Azure Dynamics personnel. Ultimately, two of the three records were identified as warranty replacements, and FedEx was not charged for replacement parts and was reimbursed for some diagnostic labor. The adjusted labor cost for electric propulsion system maintenance was reduced to one routine inspection event at $18.28.

18
During the study period, no brake repairs were performed on the hybrids; this was an expected result due to their low mileage over six months. Diesel truck 239670 had a two-wheel brake replacement during the study period, for a total cost of $165.20. FedEx examines brakes at every preventive maintenance occurrence and replaces them as necessary. Quantifying any differences in brake maintenance costs between the gHEV and diesel vehicle groups may require a study period in excess of the 12 months currently scheduled. Exhaust, power plant, and fuel system maintenance cost differences between the two groups were insignificant during the study period.
4.3.1 Vehicle Warranty Repairs Vehicle warranty repairs during the study period were few. Only gHEV 242292 experienced vehicle warranty repairs, which are summarized in Table 11.
Table 11. Vehicle Warranty Repairs
Asset # Mileage System Assembly Part Item Description Warranted Cost ($)
242292 11,334 001 001 049 Valve Assembly Expansion Inspection 18.28
242292 11,596 031 000 000 Charging System Inspection 36.56
242292 11,596 031 001 000 Generator/ Alternator
Other Maintenance 6.09
242292 11,596 031 001 000 Generator/ Alternator
Other Maintenance 24.37
242292 11,596 032 000 000 Cranking System Inspection 9.14
242292 11,858 048 001 000 Power Train Assy Hybrid Exchange New 36.56
242292 11,858 048 001 000 Power Train Assy Hybrid Burned Out 36.56
4.4 Total Operating Costs Total operating costs include fuel and maintenance costs. These costs for the study period are summarized and presented below (Table 12, Figure 10).

19
Table 12. Total Operating Costs
Vehicle Type Asset # Miles Fuel Cost
($) Maintenance
Cost ($)
Total Operating Cost ($)
Total Operating Cost per Mile
($/Mile)
gHEV
242292 6,057 2,513 1,109 3,623 0.60
242294 5,978 2,347 671 3,018 0.50
242295 3,340 1,483 885 2,368 0.71
Total 15,375 6,343 2,796 9,139 0.59
Diesel
239670 6,569 2,665 1,598 4,263 0.65
239830 5,271 1,715 811 2,527 0.48
239896 5,231 1,836 1,102 2,939 0.56
Total 17,071 6,217 3,511 9,729 0.57
Figure 10. Total operating costs
4.5 Vehicle Uptime Vehicle uptime is calculated as:
Vehicle and study group uptime for the study period is presented in Table 13 and Figure 11. The uptime goal of 98% is shown as a red dashed line in Figure 11.

20
Table 13. Vehicle Uptime
Vehicle Type
Asset Number
Unplanned Days Out of
Service Total Days in
Period Days in Service Uptime %
gHEV
242292 4 183 179 97.8
242294 19 183 164 89.6
242295 2 183 181 98.9
Total 25 549 524 95.4
Diesel
239670 1 183 182 99.5
239830 2 183 181 98.9
239896 6 183 177 96.7
Total 9 549 540 98.4
Figure 11. Vehicle uptime
It is important to note that none of the gHEVs experienced hybrid system related maintenance issues that resulted in downtime. Thus, vehicle uptime was 100% as related to hybrid system performance. Vehicle 242294 exhibited the most significant departure from uptime goals, driven by 15 days out of service to repair the keyless entry system.
5 Summary
The gHEVs experienced a smooth integration and deployment into commercial service. During the study period, the gHEVs performed well, experienced a minimum of unscheduled maintenance, and met the expectations of FedEx.
A robust drive cycle data collection and analysis effort framed the selection of study vehicles and routes as well as structured the measurement of vehicle emissions and fuel

21
economy on the chassis dynamometer at NREL’s ReFUEL laboratory. Tailpipe emissions from the gHEV were substantially lower across all tested drive cycles than emissions from the diesel baseline vehicle. Fuel economy was similar between the gHEV and diesel vehicle, except for the highest kinetic intensity drive cycle where the hybrid exhibited ~20% higher fuel economy.
This interim report captures only the first six months of study. As noted previously, routes were exchanged between gHEV and diesel trucks after six months. Due to differences in routes, the 12-month average fuel economy will be a more accurate comparison between the two vehicle groups.

22
Acknowledgments
The author wishes to thank Lee Slezak, U.S. DOE Vehicle Technologies Program, for his financial support in conducting this project. In addition, the author wishes to recognize the valued and significant contributions of the following individuals:
• Sam Snyder, Cathy Thomas, Raul Diosdado, Doug Evans, Ralph Hemrick, Raquel Moreno – FedEx Express
• Jim Mancuso, Dave Alef – Azure Dynamics, Inc.
• Jeff Cox – South Coast Air Quality Management District
• Jasna Tomic – Calstart
• John Ireland, Scott Walters, Robert Moore – NREL

23
Appendix. ReFUEL Test Report
This appendix provides additional information related to ReFUEL capabilities and experimental setup.

24
PROJECT SUMMARY REPORT
Dynamometer Testing of FedEx Fleet Hybrid Electric Vehicle October 2, 2009
ReFUEL Laboratory
National Renewable Energy Laboratory 1980 31st
Denver, CO 80216 Street
Test Participants: Name
Organization
John Ireland ReFUEL Lab, NREL Dan Pedersen ReFUEL Lab, NREL Aaron Williams ReFUEL Lab, NREL Robb Barnitt ReFUEL Lab, NREL Kevin Walkowicz ReFUEL Lab, NREL Jasna Tomic CALSTART Sam Snyder FedEx

25
Objectives This work comprises chassis dynamometer testing of two medium-duty FedEx delivery vehicles, a gasoline hybrid electric vehicle (GHEV) and a conventional diesel (baseline) vehicle. Testing was performed to compare the benefits of the GHEV with the baseline vehicle as well as to gather data for model validation, with the primary focus on fuel economy. The remainder of this report serves to describe the experimental setup, outline the test procedures, present the data, and summarize the results from dynamometer testing of each vehicle.
General Lab Description and Methods The vehicles were tested at the ReFUEL laboratory, operated by NREL and located in Denver, Colorado. The lab includes a heavy-duty vehicle (chassis) test cell and an engine dynamometer test cell with emissions measurement capability. The laboratory is designed for the challenge of measuring a variety of engines and vehicles with a range of emissions levels. Regulated emissions measurements are performed using procedures consistent with the Code of Federal Regulations applicable to heavy-duty engine certification for 2007. Extensive data acquisition and combustion analysis equipment can be used to relate the effects of different fuel properties and engine settings to performance and emissions. Other capabilities of the laboratory include power analyzer equipment to perform hybrid-electric research, systems for sampling and analyzing unregulated emissions, on-site fuel storage and fuel blending equipment, high-speed data acquisition hardware and software to support in-cylinder measurements, altitude simulation system, and fuel ignition quality testing. Instrumentation and sensors at the laboratory are maintained with NIST-traceable calibration.
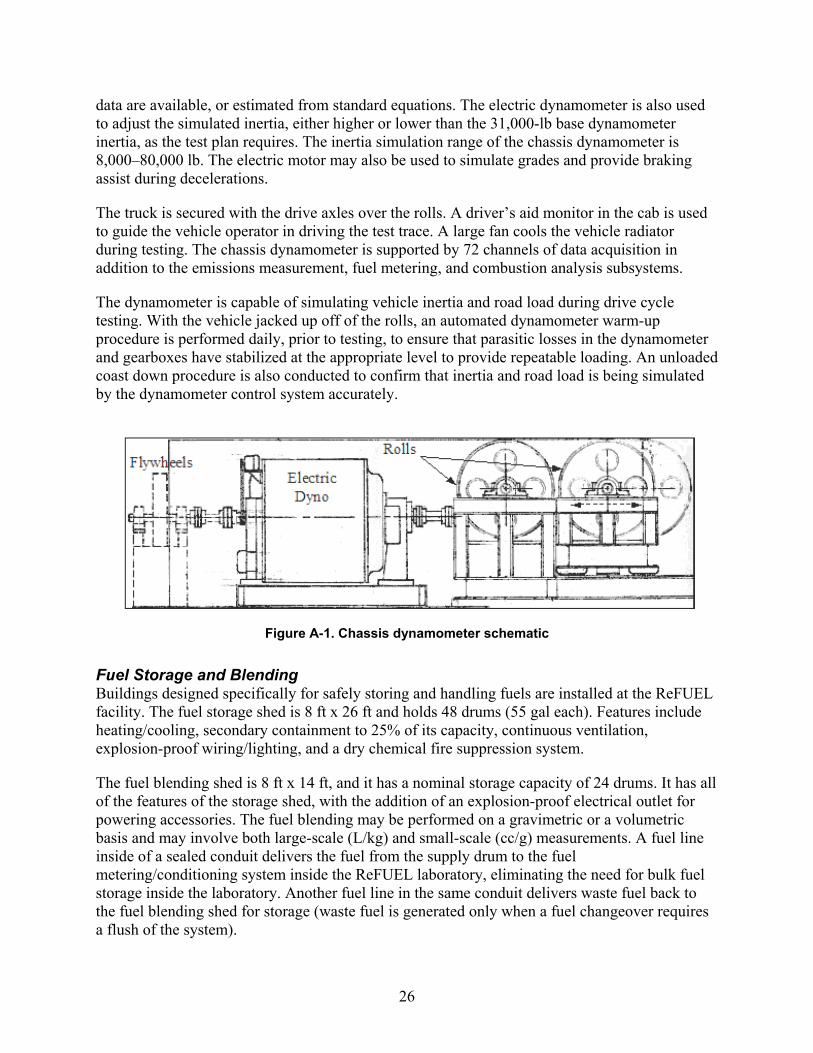
Chassis Dynamometer The ReFUEL Chassis Dynamometer is installed in the main high-bay area of the laboratory. The roll-up door to the high bay is 14 ft x 14 ft, high enough to accept all highway-ready vehicles without modification. The dynamometer is installed in a pit below the ground level, such that the only exposed part of the dynamometer is the top of the 40-in. diameter rolls. Two sets of rolls are used so that twin-axle tractors can be tested. The distance between the rolls can be varied between 42 in. and 56 in. The dynamometer will accommodate vehicles with a wheelbase between 89 in. and 293 in. The dynamometer can simulate up to 80,000 lb vehicles at speeds up to 60 mph.
The chassis dynamometer is composed of three major components: the rolls, which are in direct contact with the vehicle tires during testing; the direct current (DC) electric motor (380 hp absorbing/360 hp motoring) dynamometer; and the flywheels.
The rolls are the means by which power is absorbed from the vehicle. The rolls are attached to gearboxes that increase the speed of the central shaft by a factor of 5. The flywheels, mounted on the back of the dynamometer, provide a mechanical simulation of the vehicle inertia.
The electric motor is mounted on trunnion bearings and therefore is used to measure the shaft torque from the rolls. The absorption capability of the dynamometer is used to apply the “road load,” which is a summation of the aerodynamic drag and friction losses that the vehicle experiences in use, as a function of speed. The road load may be determined experimentally, if
26
data are available, or estimated from standard equations. The electric dynamometer is also used to adjust the simulated inertia, either higher or lower than the 31,000-lb base dynamometer inertia, as the test plan requires. The inertia simulation range of the chassis dynamometer is 8,000–80,000 lb. The electric motor may also be used to simulate grades and provide braking assist during decelerations.
The truck is secured with the drive axles over the rolls. A driver’s aid monitor in the cab is used to guide the vehicle operator in driving the test trace. A large fan cools the vehicle radiator during testing. The chassis dynamometer is supported by 72 channels of data acquisition in addition to the emissions measurement, fuel metering, and combustion analysis subsystems.
The dynamometer is capable of simulating vehicle inertia and road load during drive cycle testing. With the vehicle jacked up off of the rolls, an automated dynamometer warm-up procedure is performed daily, prior to testing, to ensure that parasitic losses in the dynamometer and gearboxes have stabilized at the appropriate level to provide repeatable loading. An unloaded coast down procedure is also conducted to confirm that inertia and road load is being simulated by the dynamometer control system accurately.
Figure A-1. Chassis dynamometer schematic
Fuel Storage and Blending Buildings designed specifically for safely storing and handling fuels are installed at the ReFUEL facility. The fuel storage shed is 8 ft x 26 ft and holds 48 drums (55 gal each). Features include heating/cooling, secondary containment to 25% of its capacity, continuous ventilation, explosion-proof wiring/lighting, and a dry chemical fire suppression system.
The fuel blending shed is 8 ft x 14 ft, and it has a nominal storage capacity of 24 drums. It has all of the features of the storage shed, with the addition of an explosion-proof electrical outlet for powering accessories. The fuel blending may be performed on a gravimetric or a volumetric basis and may involve both large-scale (L/kg) and small-scale (cc/g) measurements. A fuel line inside of a sealed conduit delivers the fuel from the supply drum to the fuel metering/conditioning system inside the ReFUEL laboratory, eliminating the need for bulk fuel storage inside the laboratory. Another fuel line in the same conduit delivers waste fuel back to the fuel blending shed for storage (waste fuel is generated only when a fuel changeover requires a flush of the system).

27
Fuel Metering & Conditioning The fuel metering and conditioning system supports both engine and chassis dynamometers. The meter measures volumetric flow to an accuracy of +/- 0.5% of the reading, with a reproducibility of 0.2%. A sensor measures the density at an accuracy of +/- 0.001 g/cc, allowing an accurate mass measurement in real time even if the density of the fuel blend is not known prior to testing.
Figure A-2. Pierburg fuel metering system
Air Handling & Conditioning Dilution air and the air supplied to the engine or vehicle for combustion are derived from a common source, a roof-mounted system that conditions the temperature of the air and humidifies as needed to meet desired specifications. This air is then passed through a HEPA filter, in accordance with the (2007) CFR specifications, to eliminate background particulate matter as a source of uncertainty in measurements.
Engine intake air flow is metered with a Laminar Flow Element (LFE) that measures air flow to within +/- 0.72% of reading. Inlet and exhaust restrictions can be adjusted with inline valves to meet manufacturers’ specifications or testing requirements.
Emissions Measurement The ReFUEL laboratory’s emissions measurement system supports both the chassis and engine dynamometers. It is based on the full-scale dilution tunnel method with a Constant Volume Sampling (CVS) system for mass flow measurement. The system is designed to comply with the requirements of the 2007 Code of Federal Regulations, title 40, part 86, subpart N. Exhaust from the engine or vehicle flows through insulated piping to the full-scale 18-in. diameter stainless steel dilution tunnel. A static mixer ensures thorough mixing of exhaust with conditioned, filtered, dilution air prior to sampling of the dilute exhaust stream to measure gaseous and particulate emissions.
A system with three Venturi nozzles is employed to maximize the flexibility of the emissions measurement system. Featuring 500 cfm, 1,000 cfm, and 1,500 cfm Venturi nozzles and gas-tight valves, the system flow can be varied from 500 cfm to 3,000 cfm flow rates in 500 cfm increments. This allows the dilution level to be tailored to the engine size being tested (whether on the engine stand or in a vehicle), maximizing the accuracy of the emissions measurement equipment.

28
Figure A-3. Venturi nozzles
The gaseous emissions bench is a Pierburg model AMA-2000. It features continuous analyzers for total hydrocarbons (HC), oxides of nitrogen (NOx), carbon monoxide (CO), carbon dioxide (CO2), and oxygen (O2). The system features auto-ranging, automated calibration, zero check, and span check features as well as integrating functions for calculating cycle emissions. It communicates with the ReFUEL data acquisition systems through a serial interface. There are two sample trains for gaseous emissions measurement: one for HC/NOx and another for the other gaseous emissions. The HC and NOx
sample train is heated to prevent sample loss and water condensation. Both sample probes are in the same plane of the dilution tunnel.
Figure A-4. Gaseous and PM sampling benches
The particulate matter sample control bench is managed by the ReFUEL data acquisition system through a serial connection. It maintains a desired sample flow rate through the particulate matter (PM) filters in proportion to the overall CVS flow, in accordance with the CFR. Stainless steel filter holders, designed to the 2007 CFR requirements, house 47-mm diameter Teflon membrane filters through which the dilute exhaust sample flows. The PM sampling system is capable of drawing a sample directly from the large full-scale dilution tunnel or utilizing secondary dilution
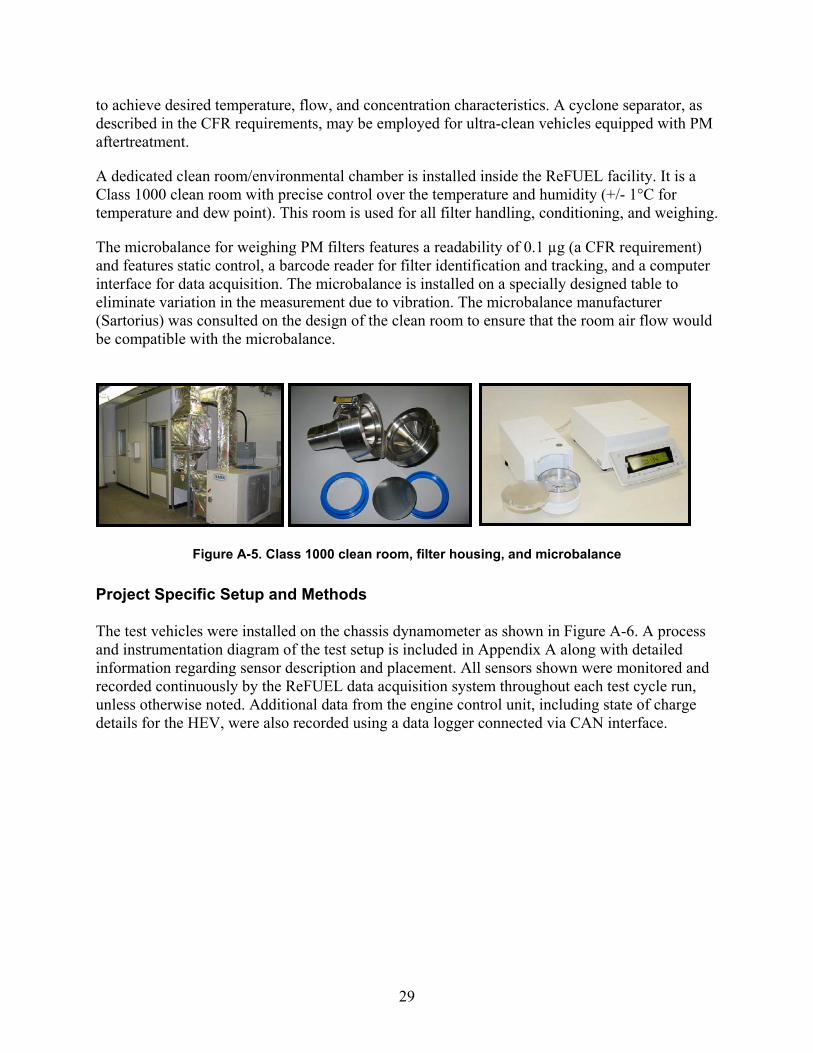
29
to achieve desired temperature, flow, and concentration characteristics. A cyclone separator, as described in the CFR requirements, may be employed for ultra-clean vehicles equipped with PM aftertreatment.
A dedicated clean room/environmental chamber is installed inside the ReFUEL facility. It is a Class 1000 clean room with precise control over the temperature and humidity (+/- 1°C for temperature and dew point). This room is used for all filter handling, conditioning, and weighing.
The microbalance for weighing PM filters features a readability of 0.1 µg (a CFR requirement) and features static control, a barcode reader for filter identification and tracking, and a computer interface for data acquisition. The microbalance is installed on a specially designed table to eliminate variation in the measurement due to vibration. The microbalance manufacturer (Sartorius) was consulted on the design of the clean room to ensure that the room air flow would be compatible with the microbalance.
Figure A-5. Class 1000 clean room, filter housing, and microbalance
Project Specific Setup and Methods The test vehicles were installed on the chassis dynamometer as shown in Figure A-6. A process and instrumentation diagram of the test setup is included in Appendix A along with detailed information regarding sensor description and placement. All sensors shown were monitored and recorded continuously by the ReFUEL data acquisition system throughout each test cycle run, unless otherwise noted. Additional data from the engine control unit, including state of charge details for the HEV, were also recorded using a data logger connected via CAN interface.

30
Figure A-6. Chassis cell with test vehicle
Test Vehicles The hybrid electric and baseline vehicles were both tested for fuel economy and emissions on the chassis dynamometer. The baseline vehicle incorporated a 5.9 Liter, 6 cylinder diesel engine. The hybrid vehicle featured a 5.4 Liter, V8 gasoline engine with a 100kW electric motor. Other vehicle information is outlined in Table A-1.
Table A-1. Test Vehicle Information
GHEV Trucks Vehicle Information Diesel Trucks Chassis Manufacturer/Model Ford E-450 Strip. Chassis Freightliner MT-45 Chassis Model Year 2008 2006 Engine Manufacturer/Model Ford 5.4L EFI Triton V-8 Cummins 5.9L ISB 200 I-
6 Engine Model Year 2008 2006 (EPA 04) Engine Ratings
Max. Horsepower Max. Torque
255 HP @ 4,500 RPM 350 lb-ft @ 2,500 RPM
200 HP @ 2,300 RPM 520 lb-ft @ 1,600 RPM
Fuel Capacity 55 Gallon - Gasoline 45 Gallon - Diesel Transmission Manufacturer/Model Ford 5R110 5-Spd. Auto. Allison 1000 5-Spd. Auto. Curb Weight (Mfg.) 9,300 lb 9,700 lb Gross Vehicle Weight (GVWR) 14,050 lb 16,000 lb
Fuel Tests run on the conventional diesel were run using a California certification diesel. The hybrid gasoline vehicle was tested on CARB phase II certification gasoline. Certificates of analysis for both fuels are included in Appendix B. The fuel supplied to the engine of each test vehicle was conditioned and metered. All fuel measurements for reported fuel economy were from the Pierburg fuel meter.
Air and Exhaust Intake air was conditioned and supplied to each test vehicle by the ReFUEL system with continuous recorded measurements of ambient pressure, inlet restriction, air flow rate, humidity, and temperature of the inlet air.

31
Approximately 20 ft of 6-in. diameter, insulated, stainless steel tubing connected the test vehicle exhaust pipe to the dilution tunnel, with temperatures measured at the outlet of the vehicle exhaust pipe, at the entrance to the dilution tunnel, and at the plane of the emissions sampling probes.
Vehicle Simulation The simulated vehicle inertia test weight for the conventional vehicle was set at 11,500 lb. The 11,500-lb test weight was calculated from the vehicle curb weight plus one half of the usual FedEx payload of 2,000 lb. Since no coast down data for the conventional vehicle was available, ReFUEL conducted crude coast down tests locally to compare the two vehicles (see Figure A-8b in Appendix C). Note: the coast downs provide by Azure and those taken at ReFUEL are not directly comparable due to road surface and grade differences. These data, along with previously published coefficients for this vehicle type, were compared to data for similar vehicles in the ReFUEL software from previous tests and used to derive the road load curve and the following coefficients:
A = 147.70 lb
B = -1.35 lb/mph
C = 0.100 lb/mph2
.
Simulated test weight for the hybrid vehicle was also curb weight plus 1,000 lb (half of the 2,000 lb payload). This sum yielded a 10,860 lb test weight for the hybrid vehicle. Coast down data was delivered with the vehicle (Appendix C, Figure A-8a) and road load curves were generated from this data. The coefficients of the road load curve for the hybrid vehicle are the following:
A = 198.55 lb
B = -3.9389 lb/mph
C = 0.13690 lb/mph2
The appropriate chassis dynamometer road load settings were then derived to simulate the road load for both test vehicles on the rolls to match the track data.
.
Test Description and Results Initially, on each test day the chassis dynamometer was run through a standard automated warm-up procedure to ensure that dynamometer parasitics had stabilized. Periodic unloaded and loaded coast downs were also performed to ensure that inertia and road load were being simulated correctly according to the set inputs.
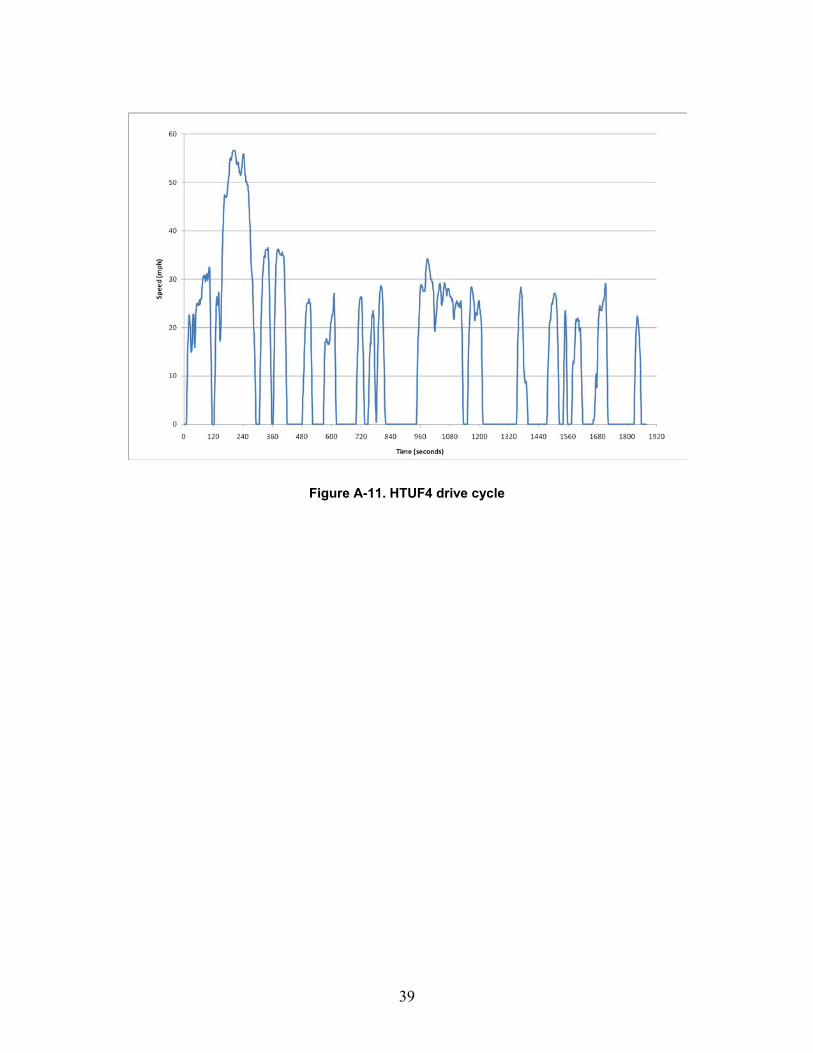
Each vehicle was driven through a variety of test cycles, including repeated hot-start runs: 1) New York City Cycle, 2) Orange County Bus, and 3) HTUF Class 4 Parcel Delivery drive cycles (shown in Appendix D, figures A-9, A-10, and A-11). Both trucks were keyed off during predetermined idle portions of the HTUF Class 4 drive cycle.
The hybrid electric vehicle (HEV) was tested from April 16–24, 2009. The conventional (baseline) vehicle was tested from May 12–18, 2009. Tables A-5 and A-6 in Appendix D

32
summarize the results for testing both vehicles on the New York City (NYCC X3), Orange County Bus, and HTUF Class 4 drive cycles.
The data demonstrates better fuel economy on the Orange County and HTUF Class 4 cycles for the conventional vehicle and a fuel economy penalty on the more aggressive New York City Cycle. Due to the hybrid’s gasoline engine with three-way catalyst, NOx and particulate matter emissions were significantly lower for the hybrid than for the diesel powered vehicle. These values are in comparison to a representative vehicle from the FedEx diesel fleet. However, it is important to note that diesel vehicles built following the 2007 and 2010 model years will have additional emissions equipment and will have significantly lower PM and NOx
State Of Charge Considerations
emissions, respectively.
State of charge was recorded and noted at the start and end of each test drive cycle for the HEV runs. The SAE Recommended Practice J2711 is established to provide an accurate, uniform, and reproducible procedure for simulating use of heavy-duty hybrid-electric vehicles (HEVs) and conventional vehicles on dynamometers for the purpose of measuring emissions and fuel economy. The recommended practice provides a description of state of charge (SOC) correction for charge-sustaining HEVs.
The basic premise of the procedure is to ensure that fuel economy and emissions data for a hybrid-electric vehicle are not unduly increased or decreased due to significant changes in energy storage levels over a single drive cycle. The procedure determines the percent change in state of charge (or energy storage) over each individual test cycle run. The basis for this is the net energy change (change in stored energy) divided by the total energy used during the test cycle run, calculated from the fuel calorific content. If the percentage is < 1% no correction factor is applied; if the percentage is > 5% the results are deemed invalid; and for percentage changes between 1% and 5% a correction factor may be applied to provide the corrected figures for fuel economy and emissions through basic interpolation. The recommendation is to perform this correction if the interpolation relationship can be described by linear regression with an R2
A current clamp was used to measure current during all cycles at 1 Hz. When the total energy was calculated it was found that all cycles had a less than 1% change in the state of charge, so no correction was required. All calculations were done per SAE J2711.
> 0.8.

33
ReFUEL Test Report Appendix A. Test Cell Instrumentation
Figure A-7. Process and instrumentation diagram

34
Table A-2. Instrumentation List

35
ReFUEL Test Report Appendix B. Fuel Analysis
Table A-3. CARB Diesel Fuel Analysis
36
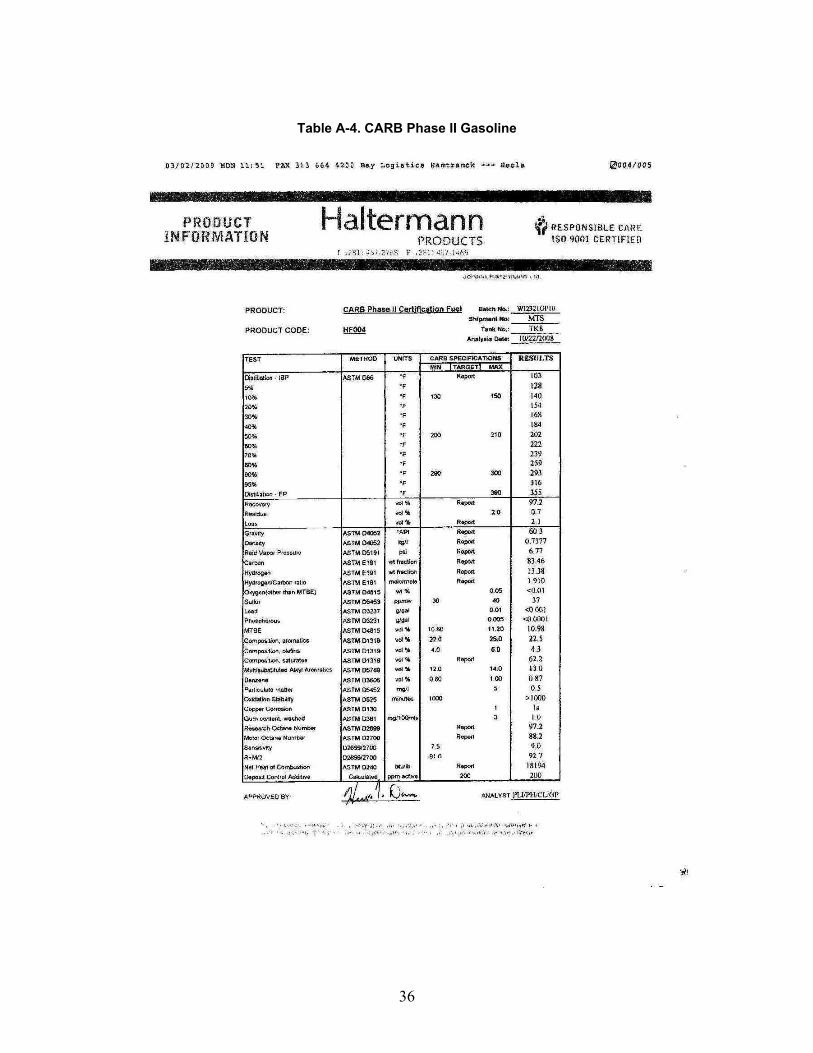
Table A-4. CARB Phase II Gasoline

37
ReFUEL Test Report Appendix C. Coast Down Data
Figure A-8a. HEV track coast down curves
Figure A-8b. Coast down comparison – conducted at ReFUEL
‐20
0
20
40
60
80
100
120
0 50 100 150 200
Vehicle Speed (km
/h)
Time (s)
Coastdown Test: Vehicle Speed vs. Time
FWD1
FWD2
FWD3
REV1
REV2
REV3

38
ReFUEL Test Report Appendix D. Test Results
Figure A-9. NYCC drive cycle
Figure A-10. Orange County Bus drive cycle
0
5
10
15
20
25
30
0 120 240 360 480 600 720 840 960 1080 1200 1320 1440 1560 1680 1800 1920
Spee
d (m
ph)
Time (sec)
NYCC X3
-5
0
5
10
15
20
25
30
35
40
45
0 120 240 360 480 600 720 840 960 1080 1200 1320 1440 1560 1680 1800 1920
Spee
d (m
ph)
Time (sec)
Orange County Bus
39
Figure A-11. HTUF4 drive cycle

40
Table A-5. Conventional Test Results
Date Cycle Run # NOx CO THC CO2 PM Fuel
Economy Distance g/mile g/mile g/mile g/mile g/mile mpg miles
05/13/09 NYCC X3 2056 12.3 7.08 0.94 1430 0.719 6.18 3.55 05/18/09 NYCC X3 2065 13.1 8.01 0.57 1507 0.821 5.93 3.53 05/18/09 NYCC X3 2066 12.6 7.77 0.75 1470 0.839 6.13 3.53 avg 12.7 7.6 0.8 1468.9 0.793 6.08 3.5 stdev 0.42 0.48 0.19 38.92 0.064 0.13 0.01 cov 3% 6% 25% 3% 8% 2.2% 0%
Date Cycle Run # NOx CO THC CO2 PM Fuel
Economy Distance g/mile g/mile g/mile g/mile g/mile mpg miles
05/14/09 OC Bus 2059 7.4 2.87 0.52 956 0.275 9.59 6.57 05/14/09 OC Bus 2060 7.5 3.03 0.60 955 0.319 9.45 6.60 05/14/09 OC Bus 2061 7.8 2.85 0.60 952 0.305 9.53 6.58 avg 7.6 2.9 0.6 954 0.300 9.52 6.6 stdev 0.18 0.10 0.05 2 0.022 0.07 0.02 cov 2% 3% 9% 0% 7% 0.8% 0%
Date Cycle Run # NOx CO THC CO2 PM Fuel
Economy Distance g/mile g/mile g/mile g/mile g/mile mpg miles
05/13/09 HTUF4 2057 5.2 2.38 0.43 759 0.273 11.86 7.34 05/13/09 HTUF4 2058 5.4 2.43 0.40 781 0.292 11.42 7.34 05/13/09 HTUF4 2053 5.1 2.74 0.43 761 N/M 11.68 7.34 avg 5.2 2.5 0.4 767 0.282 11.66 7.3 stdev 0.14 0.20 0.02 13 0.01 0.22 0.00 cov 3% 8% 4% 2% 5% 1.9% 0%

41
Table A-6. Hybrid Test Results
Date Cycle Run # NOx CO THC CO2 PM Fuel Econ Distance SOC
g/mile g/mile g/mile g/mile g/mile mpg miles % 04/22/09 NYCC X3 2037 NM 0.81 NM 1114 N/M 7.03 3.49 -0.64 04/22/09 NYCC X3 2038 3.5 2.25 0.127 1219 0.0016 6.43 3.53 0.96 04/22/09 NYCC X3 2039 3.4 0.16 0.042 1190 0.0017 6.61 3.54 -0.54 04/22/09 NYCC X3 2040 2.8 0.16 0.057 1122 0.0014 6.92 3.51 -0.27 avg 3.2 0.8 0.0 1160.9 0.0016 6.75 3.5 stdev 0.39 0.99 0.21 51.39 0.0002 0.28 0.02 cov 12% 117% -800% 4% 9% 4.1% 1%
Date Cycle Run # NOx CO THC CO2 PM Fuel Econ Distance SOC
g/mile g/mile g/mile g/mile g/mile mpg miles % 04/23/09 OC Bus 2041 1.2 0.29 NM 928 0.0003 8.40 6.54 0.33 04/23/09 OC Bus 2042 0.6 0.17 NM 912 0.0006 8.51 6.49 0.55 04/23/09 OC Bus 2043 1.4 0.41 0.016 872 0.0004 8.92 6.50 -0.47 avg 1.0 0.3 0.0 903.8 0.0004 8.61 6.5 stdev 0.44 0.12 0.08 28.57 0.0002 0.28 0.03 cov 42% 42% -189% 3% 37% 3.2% 0%
Date Cycle Run # NOx CO THC CO2 PM Fuel Econ Distance SOC
g/mile g/mile g/mile g/mile g/mile mpg miles % 04/23/09 HTUF4 2045 0.6 0.58 0.053 770 0.0005 10.22 7.27 0.44 04/23/09 HTUF4 2046 0.5 1.28 0.036 760 0.0008 10.46 7.32 -0.04 04/23/09 HTUF4 2047 0.6 1.24 0.032 745 0.0005 10.66 7.34 -0.25 avg 0.6 1.0 0.0 758.6 0.0006 10.45 7.3 stdev 0.02 0.40 0.01 12.44 0.0002 0.22 0.04 cov 4% 38% 28% 2% 25% 2.1% 0%

F1147-E(10/2008)
REPORT DOCUMENTATION PAGE Form Approved OMB No. 0704-0188
The public reporting burden for this collection of information is estimated to average 1 hour per response, including the time for reviewing instructions, searching existing data sources, gathering and maintaining the data needed, and completing and reviewing the collection of information. Send comments regarding this burden estimate or any other aspect of this collection of information, including suggestions for reducing the burden, to Department of Defense, Executive Services and Communications Directorate (0704-0188). Respondents should be aware that notwithstanding any other provision of law, no person shall be subject to any penalty for failing to comply with a collection of information if it does not display a currently valid OMB control number. PLEASE DO NOT RETURN YOUR FORM TO THE ABOVE ORGANIZATION. 1. REPORT DATE (DD-MM-YYYY)
May 2010 2. REPORT TYPE
Technical Report 3. DATES COVERED (From - To)
4. TITLE AND SUBTITLE
FedEx Gasoline Hybrid Electric Delivery Truck Evaluation: 6-Month Interim Report
5a. CONTRACT NUMBER DE-AC36-08-GO28308
5b. GRANT NUMBER
5c. PROGRAM ELEMENT NUMBER
6. AUTHOR(S) Robb A. Barnitt
5d. PROJECT NUMBER NREL/TP-540-47693
5e. TASK NUMBER FC08.3000
5f. WORK UNIT NUMBER
7. PERFORMING ORGANIZATION NAME(S) AND ADDRESS(ES) National Renewable Energy Laboratory 1617 Cole Blvd. Golden, CO 80401-3393
8. PERFORMING ORGANIZATION REPORT NUMBER NREL/TP-540-47693
9. SPONSORING/MONITORING AGENCY NAME(S) AND ADDRESS(ES)
10. SPONSOR/MONITOR'S ACRONYM(S) NREL
11. SPONSORING/MONITORING AGENCY REPORT NUMBER
12. DISTRIBUTION AVAILABILITY STATEMENT National Technical Information Service U.S. Department of Commerce 5285 Port Royal Road Springfield, VA 22161
13. SUPPLEMENTARY NOTES
14. ABSTRACT (Maximum 200 Words) This interim report presents partial (six months) results for a technology evaluation of gasoline hybrid electric parcel delivery trucks operated by FedEx in and around Los Angeles, CA. A 12 month in-use technology evaluation comparing in-use fuel economy and maintenance costs of GHEVs and comparative diesel parcel delivery trucks was started in April 2009. Comparison data was collected and analyzed for in-use fuel economy and fuel costs, maintenance costs, total operating costs, and vehicle uptime. In addition, this interim report presents results of parcel delivery drive cycle collection and analysis activities as well as emissions and fuel economy results of chassis dynamometer testing of a gHEV and a comparative diesel truck at the National Renewable Energy Laboratory’s (NREL) ReFUEL laboratory. A final report will be issued when 12 months of in-use data have been collected and analyzed.
15. SUBJECT TERMS FedEx; gasoline hybrid electric vehicle; gHEV; ReFUEL; diesel; fuel economy; emissions
16. SECURITY CLASSIFICATION OF: 17. LIMITATION OF ABSTRACT
UL
18. NUMBER OF PAGES
19a. NAME OF RESPONSIBLE PERSON a. REPORT
Unclassified b. ABSTRACT Unclassified
c. THIS PAGE Unclassified 19b. TELEPHONE NUMBER (Include area code)
Standard Form 298 (Rev. 8/98) Prescribed by ANSI Std. Z39.18