Federal Reserve Bank of New York Staff Reports · reflective of views at the Federal Reserve Bank...
37
Federal Reserve Bank of New York Staff Reports Labor Market Pooling and Occupational Agglomeration Todd M. Gabe Jaison R. Abel Staff Report no. 393 September 2009 Revised January 2010 This paper presents preliminary findings and is being distributed to economists and other interested readers solely to stimulate discussion and elicit comments. The views expressed in the paper are those of the authors and are not necessarily reflective of views at the Federal Reserve Bank of New York or the Federal Reserve System. Any errors or omissions are the responsibility of the authors.
Transcript of Federal Reserve Bank of New York Staff Reports · reflective of views at the Federal Reserve Bank...

Federal Reserve Bank of New York
Staff Reports
Labor Market Pooling and Occupational Agglomeration
Todd M. Gabe
Jaison R. Abel
Staff Report no. 393
September 2009
Revised January 2010
This paper presents preliminary findings and is being distributed to economists
and other interested readers solely to stimulate discussion and elicit comments.
The views expressed in the paper are those of the authors and are not necessarily
reflective of views at the Federal Reserve Bank of New York or the Federal
Reserve System. Any errors or omissions are the responsibility of the authors.

Labor Market Pooling and Occupational Agglomeration
Todd M. Gabe and Jaison R. Abel
Federal Reserve Bank of New York Staff Reports, no. 392
September 2009; revised January 2010
JEL classification: R12, J24, R20
Abstract
This paper examines the micro-foundations of occupational agglomeration in U.S.
metropolitan areas, with an emphasis on labor market pooling. Controlling for a wide
range of occupational attributes, including proxies for the use of specialized machinery
and for the importance of knowledge spillovers, we find that jobs characterized by a
unique knowledge base exhibit higher levels of geographic concentration than do
occupations with generic knowledge requirements. Further, by analyzing co-
agglomeration patterns, we find that occupations with similar knowledge requirements
tend to co-agglomerate. Both results provide new evidence on the importance of labor
market pooling as a determinant of occupational agglomeration.
Key words: agglomeration, occupations, labor market pooling, knowledge
Gabe: University of Maine (e-mail: [email protected]). Abel: Federal Reserve Bank
of New York (e-mail: [email protected]). The views expressed in this paper are those of the
authors and do not necessarily reflect the position of the Federal Reserve Bank of New York or
the Federal Reserve System.

1
I. INTRODUCTION
Alfred Marshall’s ideas provide a conceptual foundation for contemporary
research on the determinants of agglomeration: labor market pooling, sharing of
specialized inputs, and knowledge spillovers.1 One important aspect of labor market
pooling is that a high agglomeration of activity provides workers and businesses with a
wide range of options if they possess or require a unique skill set. In their study of co-
agglomeration patterns, Ellison, Glaeser and Kerr (2009) found that industries employing
the same types of workers tend to co-agglomerate. This behavior is advantageous to
workers and firms: people can move among employers without retooling and businesses
have access to a deep pool of labor with the skills they need.
This paper examines the micro-foundations of occupational agglomeration in U.S.
metropolitan areas. Here, we emphasize the importance of labor market pooling as
measured by the extent to which workers possess a specialized knowledge base covering
a wide range of topics. People in jobs with generic knowledge requirements are not
expected to benefit from labor market pooling, whereas individuals in occupations that
need a specialized base of knowledge are apt to seek out a place with a high
agglomeration of activity. With respect to co-agglomeration, we expect occupations with
similar knowledge profiles to co-locate. Such behavior facilitates movement among jobs
with similar types of knowledge and helps to ensure Marshall’s (1920) “constant market
for skill.”
Our analysis of the geographic concentration of occupations provides a new way
to look at the forces of agglomeration. Industry-centric studies focus on where similar 1 For surveys of the literature on agglomeration, see Duranton and Puga (2004) and Rosenthal and
Strange (2004).

2
types of goods and services are made, since sectors are assigned based on a firm’s
primary output. In contrast, recent occupational-based approaches to urban and regional
analysis emphasize what people do in their jobs (Feser 2003; Markusen 2004; Florida,
Mellander and Stolarick 2008; Gabe 2009; Scott 2009; Bacolod, Blum and Strange
2009a, 2009b). For example, Markusen (2004, p. 254) suggests the use of occupational-
level data to examine the “skills and activities of those in a particular neighborhood.”
Here, we use occupations to understand the knowledge required to perform a job, as well
as a worker’s use of specialized equipment and the importance of keeping current with
new information and trends.
For at least two of Marshall’s (1920) micro-foundations of agglomeration, the
benefits of a geographic concentration of activity seem to be more relevant for
occupations (i.e., tasks and activities people perform in their jobs) than industries (i.e.,
goods and services provided). Agglomeration facilitates knowledge spillovers because it
allows individuals to share ideas and tacit knowledge (Kloosterman 2008; Ibrahim, Fallah
and Reilly 2009). A computer programmer, for example, presumably benefits more from
proximity to others involved in similar day-to-day activities (e.g., interacting with
computers, using technology) than he or she gains from working next to others in the
same industry (e.g., a software company’s receptionist, human resources specialist, or
chief executive).
Likewise, the basic idea behind labor market pooling—that agglomeration
provides a thick labor market for those who possess or require a particular skill set—
seems to apply more readily to occupations than industries. In an analysis of industry
agglomeration, Rosenthal and Strange (2001, p. 205) suggest that labor market pooling is

3
the most problematic of the Marshallian micro-foundations to measure because “it is
difficult to identify industry characteristics that are related to the specialization of the
industry’s labor force.”2 This is not the case with occupations. Some jobs require a very
specific knowledge and skill set that is specialized to the task at hand, while other
occupations call for a more generic set of knowledge and skills.
II. AGGLOMERATION OF U.S. OCCUPATIONS
Following Krugman (1991) and Audretsch and Feldman (1996), we begin our
analysis using locational Gini coefficients to measure occupational agglomeration across
U.S. metropolitan areas. The locational Gini coefficient (LGINI) for U.S. Census
occupations, indexed by k, is calculated as (Kim, Barkley and Henry 2000):
(1) LGINIk = Δ / 4 u,
where Δ = {1 / [n (n-1)]} 1
n
i=∑
1
n
j=∑ | xi – xj |
i, j = U.S. metropolitan areas (i ≠ j)
u = mean of xi
xi(j) = (metro area i’s (j’s) share of employment in k / metro area i’s (j’s) share of total employment)
and, n = 324, the number of U.S. metropolitan areas included in the analysis.
Locational Gini values close to zero suggest that employment in the occupation is widely
dispersed across U.S. metropolitan areas and spread out in a manner similar to the
distribution of overall employment. Values close to 0.5 suggest that workers in the
2 Rosenthal and Strange (2001) use three measures (e.g., net productivity, an indicator of “brains to
brawn,” and the percentage of workers with advanced degrees) as proxies for the importance of labor market pooling. Overman and Puga (2009) point out the limitations of these indicators and, instead, focus on the effects of idiosyncratic firm-level employment shocks on industry agglomeration. Their results suggest establishments that expand while the overall industry declines (or vice versa) benefit more from agglomeration than plants in sectors with homogeneous employment shocks.

4
occupation are geographically concentrated in a single metropolitan area, or a very few
places.
A limitation of the locational Gini, when studying industries, is that it could
suggest high levels of concentration in cases where sectors comprised of a few large
companies locate in a dispersed, random pattern (Ellison and Glaeser 1997). The Ellison-
Glaeser concentration measure overcomes this limitation by incorporating information
about the size distribution of firms in the industry (i.e., the Herfindahl index). In the case
of occupations, information needed to calculate Herfindahl indices—namely, firm-level
employment data—is not readily available. Thus, as an alternative measure of
occupational agglomeration, we propose a modified version of the Ellison-Glaeser index
that is based on the distribution of workers in an occupation across major industrial
sectors, relative to total occupational employment, instead of the Herfindahl index. Our
modified Ellison-Glaeser index (INDEX) for U.S. occupations is calculated as:
(2) INDEXk = [G – (1 - ∑=
n
i 1ti
2) I] / [(1 - ∑=
n
i 1ti
2) (1 – I)]
where, G = ∑=
n
i 1(si – ti)2
I = ∑=
m
j 1
yj / ek
ti = metro area’s share of total employment
si = metro area’s share of occupational employment
yj = industry’s share of occupational employment
ek = total occupational employment in U.S. metropolitan areas
and, m = 19, the number of major NAICS industrial categories.

5
The expression G is a measure of an occupation’s geographic concentration,
adjusted to account for differences in total employment across U.S. metropolitan areas,
represented by (1 - ∑=
n
i 1
ti2), as well as the distribution of occupational employment across
major NAICS industrial sectors, represented by I = ∑=
m
j 1yj / ek. Our modified version of the
Ellison-Glaeser concentration index is constructed such that occupations present in only
one (or a few) major industrial categories have lower values than occupations that are
more evenly spread across major NAICS sectors. Likewise, occupations with smaller
numbers of workers exhibit lower concentration index values than those that are more
abundant in U.S. metropolitan areas.
The original Ellison-Glaeser index, as an alternative to measures such as the
locational Gini, is based on the logic that industries with an uneven size distribution of
plants (i.e., large Herfindahl indices) have artificially high levels of geographic
concentration. Thus, the Ellison-Glaeser measure downwardly adjusts the level of
concentration in cases where industries are dominated by a few large plants.3 Our
agglomeration measure is based on the idea that occupations with an uneven distribution
of employment across industrial sectors, or a low number of workers overall, have
overstated concentration levels. Thus, as noted previously, our modified Ellison-Glaeser
measure adjusts the occupational concentration index value using the expression I, which
would have a maximum value of 1.0 in the extreme case where an occupation is made up
3 The Ellison and Glaeser (1997, p. 890) measure is constructed such that positive index values, found in
446 of 459 (97 percent) 4-digit SIC manufacturing industries, indicate that geographic concentration is higher than would be expected if plants had randomly chosen locations by merely “throwing darts at a map.” The sign of our modified occupational agglomeration index, which exceeds zero in all cases, has no such interpretation.

6
of one worker. The Herfindahl index, used in the Ellison-Glaeser industry concentration
measure, would have a maximum value of 1.0 in the extreme case where an industry
consists of a single plant.
Table 1 presents information on the average agglomeration of U.S. occupations,
summarized by major Standard Occupational Classification (SOC) category.
Agglomeration figures are based on an occupation’s location across 324 U.S.
metropolitan areas, included in the Special EEO Tabulation of the 2000 U.S. Census.
Information on the share of occupational employment by major NAICS industrial
category, used to examine the distribution of employment across industrial sectors, is
from the one-percent sample of the 2000 U.S. Census (Ruggles et al. 2008). Using either
measure of agglomeration, we find that the most geographically concentrated jobs are in
the broad categories of Farming, Fishing, and Forestry Occupations; and Life, Physical,
and Social Science Occupations. Other broad categories that exhibit high average levels
of agglomeration include Computer and Mathematical Occupations (third highest ranking
based on locational Gini, sixth highest ranking based on concentration index); Arts,
Design, Entertainment, Sports, and Media Occupations (third highest ranking based on
concentration index, seventh highest ranking based on locational Gini); and Production
Occupations (fourth highest ranking based on locational Gini, fifth highest ranking based
on concentration index).
We ranked the average scores for the broad occupational categories from the most
to least geographically concentrated and found that these rankings exhibit a high
correlation (r = 0.897; Spearman Rank Correlation) between the two measures of
agglomeration. Similarly, the correlation between the actual locational Gini coefficients

7
and agglomeration index values shown in Table 1 is quite high (r = 0.903). Using
information on the 468 individual occupational categories that underlie the aggregate
figures presented in Table 1, we find a lower—although still positive—correlation (r =
0.512) between the two measures of occupational agglomeration.
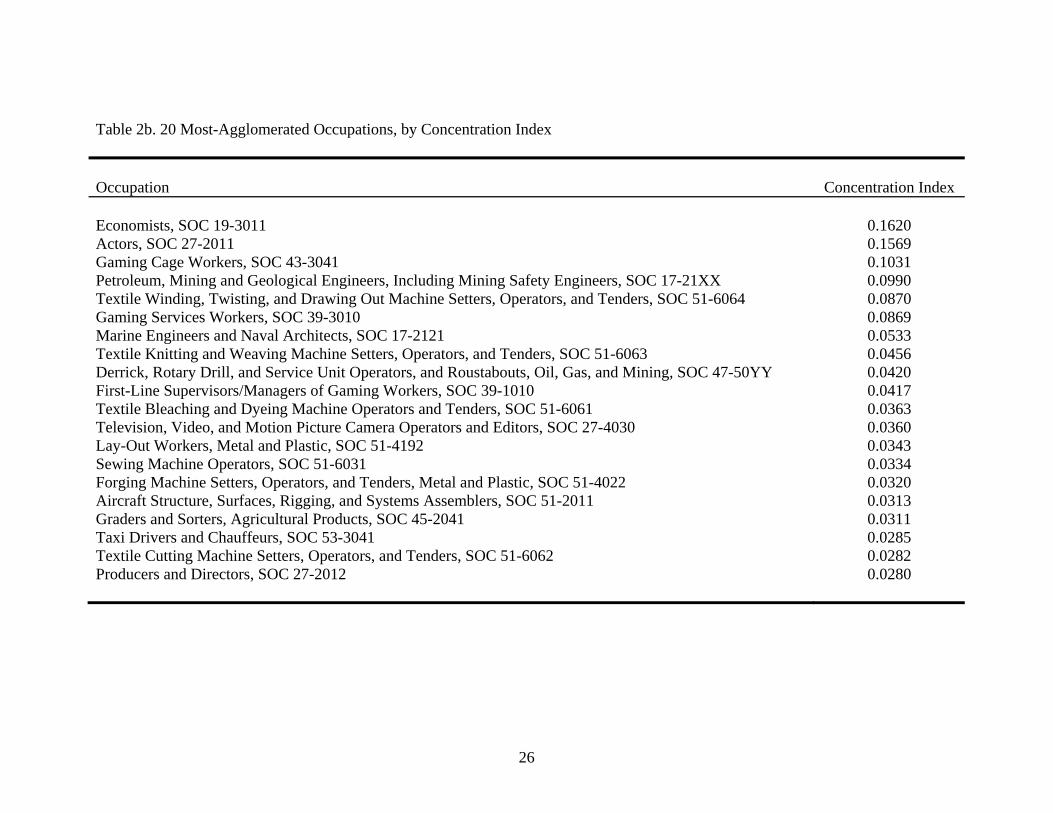
Tables 2a and 2b show the twenty most-agglomerated U.S. occupations based on
the locational Gini coefficients and concentration index values, respectively. Ten
occupations appear in the top twenty lists as determined by both measures of
agglomeration. Jobs that involve aspects of textile manufacturing (e.g., SOC 51-6064,
SOC 51-6061, and SOC 51-6063) exhibit high levels of geographic concentration, similar
to the ranking of textiles among the most agglomerated manufacturing industries reported
by Krugman (1991), Ellison and Glaeser (1997), and Duranton and Overman (2005).
Other occupations that are highly geographically concentrated as ranked by both
agglomeration measures include gaming workers (e.g., SOC 43-3041 and SOC 39-3010),
aircraft assemblers (e.g., SOC 51-2011) and specialized engineers (e.g., SOC 17-2121
and SOC 17-21XX).
It is interesting to note that the two occupations with the high concentration index
values—Economists and Actors—are not included in the list of the most geographically
concentrated jobs based on the locational Gini coefficients. Two other entertainment-
related occupations—Television, Video, and Motion Picture Camera Operators and
Editors; and Producers and Directors—are also among the most agglomerated
occupations based on the concentration indices (but not the locational Gini coefficients).
On the other hand, several marine-related occupations (e.g., SOC 53-5031, SOC 53-5011
and SOC 45-3000) are included in the top twenty list according to locational Gini

8
coefficients, but are not counted among the most agglomerated based on the
concentration indices.
Tables 3a and 3b show the twenty least-agglomerated U.S. occupations. Ten
occupations appear on the lists based on the locational Gini coefficients and
concentration indices. These include retail salespersons, cashiers, secretaries, retail
managers and school teachers. Other jobs that appear to be widely dispersed across U.S.
metropolitan areas include several clerical- (e.g., SOC 43-9061, SOC 43-4071, SOC 43-
9199 and SOC 43-4071), healthcare- (e.g., SOC 29-1111 and SOC 31-909X) and
maintenance-related (e.g., SOC 49-3023 and SOC 49-2011) occupations.
III. WHY PEOPLE AGGLOMERATE
Equation 3 shows the regression model that provides a foundation for our
empirical analysis of the determinants of occupational agglomeration.
(3) Occupational Agglomeration = β0 + β1 Specialized Knowledge +
β2 Specialized Equipment + β3 Update Knowledge +
β4 Interaction with Public + β5 Average Establishment Size +
β6 Agriculture + β7 Mining
This is the same general approach used by Rosenthal and Strange (2001) to examine the
agglomeration of manufacturing industries. Summary statistics of the variables used in
the empirical analysis are presented in Table 4.
As described in the previous section, Occupational Agglomeration is measured
using locational Gini coefficients (LGINI) and concentration index values (INDEX). The
explanatory variable of key interest, used as a proxy for the importance of labor market
pooling, is the extent to which an occupation’s knowledge profile differs from the

9
average U.S. job. This variable, Specialized Knowledge, is constructed using information
from the U.S. Department of Labor’s Occupational Information Network (O*NET) on
the importance and level of knowledge required in 33 subjects (see Table 5).4 The
O*NET, based on employee surveys and input from professional occupational analysts,
asks respondents to rate on a scale of 1 to 5 the importance of these knowledge areas to a
person’s job. For topics that are rated as at least “somewhat important” (i.e., a score of 2
or higher), the respondent is asked to rate on a scale of 1 to 7 the level of knowledge
required.
For each of the 33 areas, we use information on the importance and level to
construct, as the product of the two, a knowledge index (Feser 2003). With these indices
for 468 occupations and 2000 U.S Census data on occupational employment, we
calculated the (weighted) average U.S. occupation’s knowledge requirement in each of
the 33 topics.5 To measure the extent to which an occupation’s knowledge profile differs
from the average U.S. job, we constructed the Specialized Knowledge variable as:
(4) Specialized Knowledgek = ∑=
33
1z(KIk,z – KIave,z)2
where the subscript z indicates the knowledge area, KI is the knowledge index, the
subscript k indicates the occupation, and the subscript ave indicates the average U.S.
occupation. Low values of this variable indicate that the occupation’s knowledge profile
is similar to the average U.S. job, while high values suggest that the occupation requires
specialized knowledge.
4 See Peterson et al. (2001) for a detailed discussion of O*NET. 5 Occupational employment information is from the Special Equal Employment Opportunity (EEO)
Tabulation of the 2000 U.S. Census. It includes employment figures for 471 occupations, three of which were removed from our analysis due to incomplete data.

10
Along with the importance of labor market pooling, Marshall (1920) suggested
that agglomeration facilitates the sharing of intermediate inputs and the flow of
knowledge spillovers. Specialized machinery and equipment, especially items that exhibit
increasing returns to scale in their use, are examples of inputs that workers and firms may
agglomerate around. We use the variable Specialized Equipment as a proxy for the use of
specialized machinery and equipment. It is constructed as an index, similar to the
knowledge variables, using information from O*NET on the importance and level of an
occupational activity titled “Operating Vehicles, Mechanized Devices, or Equipment.”
Of Marshall’s three micro-foundations of agglomeration, knowledge spillovers
have received the most attention in the literature (Jaffe, Trajtenberg and Henderson 1993;
Audretsch and Feldman 1996; Kloosterman 2008; Ibrahim, Fallah and Reilly 2009). The
idea here is that agglomeration allows workers to learn job-specific tasks and stay current
with new developments as if they were “in the air.” The variable Update Knowledge is
used as a proxy for the importance of knowledge spillovers. Constructed as an index
using information from O*NET on the importance and level of an occupational activity
titled “Updating and Using Relevant Information,” this variable captures the idea that
knowledge spillovers are more important in occupations that require workers to keep up
with current information and trends.
In addition to the variable Update Knowledge, we investigate (in separate
regression models) the effects of two other proxies for the importance of knowledge
spillovers (not shown in equation 3). The first variable, Creativity, is an O*NET
occupational-based activity (calculated as an index, similar to the other variables) that
measures the extent to which a job requires creative thinking (McGranahan and Wojan

11
2007). Florida’s (2002, 2008) extensive work on the topic suggests that creative workers
seek out places where they can collaborate and share ideas with others. The second
variable, Years of Education, is the average number of years of education for those in an
occupation, calculated using data from the one-percent sample of the 2000 U.S. Census.
Although Rosenthal and Strange (2001) used the share of industry employment with
advanced degrees as proxies for labor market pooling, Kolko (2009) suggests that
educational attainment is also a suitable proxy for the importance of knowledge
spillovers.
The explanatory variable Interaction with Public represents a sort of transport
cost that is expected to affect agglomeration. Kolko (2009), in an analysis of the
agglomeration of service industries, suggests that transport costs dictate that low-value
services delivered through face-to-face contact should be geographically dispersed.
Moreover, jobs characterized by heavy interaction with the general public typically
require face-to-face contact, which limits an occupation’s tendency to agglomerate
(Storper and Venables 2004). We constructed the Interaction with Public variable as an
index using information from O*NET on the importance and level of an occupational
activity titled “Performing for or Working Directly with the Public.”
To account for the importance of establishment-level economies of scale, the
regression model includes the variable Average Establishment Size. It is constructed by
matching occupations to industries using the one-percent sample of the 2000 U.S. Census
(Ruggles et al. 2008). After determining the sectors that correspond to each of the 468
occupations, we calculated an average employment size using data from County Business
Patterns. The final two explanatory variables, Agriculture and Mining, were also

12
constructed using information from the one-percent sample of the 2000 U.S. Census.
These variables, which measure the percentage of occupational employment in
agricultural- or mining-related industries, account for the importance of natural
advantages and raw material use in the agglomeration process (Kim 1995; Ellison and
Glaeser 1999).
IV. REGRESSION RESULTS
Table 6 presents OLS regression results on the determinants of occupational
agglomeration. The first three models examine locational Gini coefficients (LGINI) as the
measure of geographic concentration, but differ in terms of the variable used to control
for the importance of knowledge spillovers (e.g., Update Knowledge, Creativity or Years
of Education). The final three sets of results focus on agglomeration indices (INDEX) to
represent occupational agglomeration.
Across all six models, the results provide strong evidence on the importance of
labor market pooling to occupational agglomeration. Since the dependent variable and
Specialized Knowledge both enter into the regressions as natural logs, the estimated
coefficients can be interpreted as elasticities. They suggest that a doubling of the
Specialized Knowledge variable, roughly equivalent to a one and one-half standard
deviation increase, is associated with over a 10-percent increase in the locational Gini
coefficient. A doubling of this proxy for the importance of labor market pooling is
associated with about a 40-percent increase in the agglomeration index.
Other regression results shown in Table 6 are generally consistent with
expectations based on Marshall’s ideas and other studies of industry agglomeration. Two
of the three variables used to measure the importance of knowledge spillovers—Update

13
Knowledge and Creativity—have a positive and significant effect on occupational
agglomeration in at least one of the two regression models. These results suggest
occupations that require workers to keep current with new information, and jobs that
involve creative thinking are associated with high levels of geographic concentration.
Empirical results also show that jobs requiring the use of machinery and equipment
(Specialized Equipment), as well as occupations steeped in agriculture- and mining-
related industries (Agriculture and Mining) exhibit a high level of agglomeration. On the
other hand, jobs that involve heavy interaction with the public (Interaction with Public)
tend to be more geographically dispersed.
With respect to variable Average Establishment Size, our results suggest that
establishment-level internal economies of scale do not appear to influence the geographic
concentration of occupations. To explain this somewhat counterintuitive finding, we note
that many of the jobs characterized by the largest average employment size fall in the
major SOC categories of Healthcare Practitioners and Technical Occupations (SOC 29-
0000) and Healthcare Support Occupations (SOC 31-0000). Hospitals—which employ a
large proportion of workers in these occupations—tend to be large in size and
geographically dispersed across metropolitan areas.
V. CO-AGGLOMERATION OF OCCUPATIONS
Another implication of labor market pooling is that workers are likely to seek out
places where they can easily move among jobs that use the same general types of
knowledge. This would result in a high co-agglomeration of occupations with similar
knowledge profiles (or, conversely, a low co-agglomeration of occupations that require

14
different types of knowledge). Following Ellison and Glaeser (1997) and Ellison, Glaeser
and Kerr (2009), we constructed a co-agglomeration index for occupations k and l as:
(5) Occupational Co-Agglomerationk,l = Ω / (1 - ∑=
n
i 1tn
2)
where, Ω = ∑=
n
i 1
(si,k – ti) (si,l – ti)
i = U.S. metropolitan areas (n=324)
sk(l) = metro area’s share of employment in occupation k (l)
t = metro area’s share of total employment.
Table 7 shows the occupational pairs with the highest levels of co-agglomeration
in U.S. metropolitan areas.6 Occupations that are involved in aspects of casino gaming
(e.g., Gaming Service and Cage Workers) and film / television (e.g., Actors, Editors,
Agents and Directors) tend to co-agglomerate, as well as jobs related to textiles (e.g.,
Knitting, Weaving and Machine Operators) and the dismal science (e.g., Economists,
Social Scientists and Budget Analysts). Similarly, in their analysis of the co-location of
manufacturing industries, Ellison, Glaeser and Kerr (2009) report several textile-related
sectors (e.g., Yarn and Thread Mills, Knitting Mills, Textile Finishing) at the top of the
list of the highest pair-wise agglomerations.
We measured the dissimilarity of knowledge profiles for occupations k and l as:
(6) Dissimilar Knowledgek,l = ∑=
33
1z(KIk,z – KIl,z)2
6 Consistent with the findings of Ellison, Glaeser and Kerr (2009), the mean value of the co-
agglomeration index we calculated is “approximately zero.”

15
where the subscript z indicates the knowledge area and KI is the knowledge index. Low
values of this variable suggest that the knowledge profiles of the two occupations are
similar, whereas high values indicate that the jobs are quite distinct in terms of
knowledge requirements. Along with the (dis)similarity of knowledge requirements, the
(dis)similarity of goods and services that workers produce is expected to affect
occupational co-agglomeration patterns. Ellison, Glaeser and Kerr (2009) found that
industries employing workers in the same occupations tend to co-agglomerate. Here, as it
appears to be the case in Table 7, we expect occupations involved in the same industries
to co-agglomerate as well. To measure the extent to which occupations k and l contribute
to (dis)similar types of goods and services, we constructed the Dissimilar Output variable
as:
(7) Dissimilar Outputk,l = ∑=
19
1z|ISk,z – ISl,z|
where IS represents the occupation’s share of employment by industry, and z is a
subscript indicating the major NAICS industrial category.7 Low values of this variable,
constructed using information from the one-percent sample of the 2000 U.S. Census,
suggest that workers in the two occupations make similar goods and services. On the
other hand, high values of Dissimilar Output indicate that workers in the occupations
contribute to different sectors.
Table 8 presents OLS regression results on the relationship between the co-
agglomeration of occupations and the extent to which the knowledge requirements are
similar between the two selected jobs. The dependent variable is the Ellison-Glaeser
7 Krugman (1991) used a similar variable to measure the divergence of industrial structures across
regions.

16
(1997) index of co-agglomeration, calculated for 109,278 occupation pairs (using the
same 468 occupations analyzed in Table 6). Logs are not used, as in the previous
analysis, because the Ellison-Glaeser co-agglomeration index can have non-positive
values. Instead, we normalize the variables to have a mean of zero and a standard
deviation of one, consistent with the approach used by Ellison, Glaeser and Kerr (2009).
The two regression models are the same, with the exception of a set of 22 dummy
variables that indicate whether or not the two occupations are part of the same major
SOC category. The r-squared values shown in Table 8 are close to those reported by
Ellison, Glaeser and Kerr (2009). In univariate regressions that examine the Ellison-
Glaeser co-agglomeration index applied to manufacturing industries, the model goodness
of fit ranges from 0.005 to 0.049 in that study. In multivariate models (with between three
and five explanatory variables), the r-squared values reported by Ellison, Glaeser and
Kerr (2009) range from 0.059 to 0.110.
Our empirical results from both models reveal a negative relationship between the
co-agglomeration of occupations and the variable Dissimilar Knowledge. Specifically, a
one-standard deviation increase in the value of Dissimilar Knowledge is associated with
about a 0.10-standard deviation decrease in the co-agglomeration index. This suggests
that the co-agglomeration measure decreases as the difference in knowledge profiles
among two occupations increases. Put another way, people in jobs with similar
knowledge requirements tend to co-agglomerate. Results also show a negative
relationship between the co-agglomeration index and the variable Dissimilar Output. A
one-standard deviation increase in Disimilar Output is associated with about a 0.13- to
0.16-standard deviation decrease in the co-agglomeration measure. This indicates, as

17
expected, that people in occupations involved in similar industries have higher levels of
co-agglomeration than those in jobs that contribute to different sectors.
VI. CONCLUSIONS
Researchers have long been interested in the causes of agglomeration. Alfred
Marshall’s (1920, p. 225) ideas about labor market pooling, which suggest employers
locate around “workers with the skills which they require” and workers seek out places
“where there are many employers who need such skill as theirs,” emphasize the strong
connection between agglomeration and the specialization of work-related tasks. Focusing
on the knowledge requirements of a wide variety of jobs, this paper presents new
evidence on the importance of labor market pooling as a determinant of occupational
agglomeration. Specifically, our findings suggest jobs that draw from a specialized
knowledge base are geographically concentrated, and occupations with similar
knowledge requirements tend to co-agglomerate.
This first key result—that specialized knowledge requirements lead to an increase
in agglomeration—gets at the heart of Marshall’s argument about the benefits of labor
market pooling. Such behavior is advantageous if firms need and workers possess a
specialized knowledge base, whereas agglomeration is less important in occupations with
generic knowledge requirements where suitable workers and jobs are easy to find. Our
second key result—that co-agglomeration patterns are enhanced by the similarity of
knowledge requirements among two jobs—also suggests that occupational agglomeration
can help ensure Marshall’s (1920) “constant market for skill.”
A limitation of our analysis of occupational co-agglomeration is that the negative
relationship found between the Ellison-Glaeser co-agglomeration index and the similarity

18
of knowledge requirements is consistent with our explanation related to labor market
pooling (as described previously), but also lends support for the importance of knowledge
spillovers. On the one hand, a person might seek out a place where jobs are available that
require similar types of knowledge as a way to minimize the prospects of being out of
work (i.e., a thick labor market argument). However, it is also plausible that a person
would locate in such a place to collaborate and share ideas with others that possess
similar types of knowledge (i.e., a knowledge spillover argument).
The availability of cross-industry information allowed Ellison, Glaeser and Kerr
(2009) to construct different proxies for the importance of labor market pooling (e.g.,
“the extent to which different industries hire the same occupations”) and knowledge
spillovers (e.g., measures of technology flows among industries) as determinants of
industry co-agglomeration. In our analysis of occupations, however, information on the
extent to which knowledge created in a particular occupation is used by individuals in
other jobs is not readily available. This inability to distinguish between labor market
pooling and knowledge spillovers, which is of less concern in our analysis of
occupational agglomeration because we use three proxies to measure the importance of
knowledge spillovers, is hardly new to the literature on agglomeration. As noted
previously, Rosenthal and Strange (2001) used data related to formal education (e.g.,
share of industry workers with a college degree) as a proxy for the importance of labor
market pooling, while Kolko (2009) suggests that education-based variables are equally
well suited to represent the importance of knowledge spillovers.
Despite this caveat, the paper represents what we believe to be one of the first
attempts to examine the agglomeration and co-agglomeration of occupations. As noted

19
throughout, numerous studies have looked at both the causes and consequences of
industry agglomeration. Thus, we have a developed a pretty good understanding about
why similar goods and services are produced within a close geographic proximity, and
what this type of agglomeration means for regional economic growth. What has been
missing is an empirical analysis of the agglomeration patterns of workers involved in
similar job-related tasks and activities. Our work on this topic has helped to illuminate
the importance of labor market pooling as a key determinant of agglomeration, which has
been an illusive task in many past studies focusing on industries.

20
REFERENCES
Audretsch, David and Maryann Feldman. 1996. “R&D Spillovers and the Geography of
Innovation and Production,” American Economic Review, 86, 630-640.
Bacolod, Marigee, Bernardo Blum, and William Strange. 2009a. “Skills in the City,”
Journal of Urban Economics, 65, 136-153.
Bacolod, Marigee, Bernardo Blum, and William Strange. 2009b. “Urban Interactions:
Soft Skills vs. Specialization,” Journal of Economic Geography, 9, 227-262.
Duranton, Gilles and Henry Overman. 2005. “Testing for Localization Using Micro-
Geographic Data,” Review of Economic Studies, 72, 1077-1106.
Duranton, Gilles and Diego Puga. 2004. “Micro-Foundations of Urban Agglomeration
Economies,” Chapter 48 in Henderson, J.V., Thisse, J.F. (eds.), Handbook of
Regional and Urban Economics, Vol. 4, Amsterdam: Elsevier/North-Holland, pp.
2063-2117.
Ellison, Glenn and Edward Glaeser. 1997. “Geographic Concentration in U.S.
Manufacturing Industries: A Dartboard Approach,” Journal of Political Economy,
105, 889-927.
Ellison, Glenn and Edward Glaeser. 1999. “The Geographic Concentration of Industry:
Does Natural Advantage Explain Agglomeration,” American Economic Review,
89, 311-316.

21
Ellison, Glenn, Edward Glaeser, and William Kerr. 2009. “What Causes Industry
Agglomeration? Evidence from Coagglomeration Patterns,” American Economic
Review, forthcoming.
Feser, Edward. 2003. “What Regions Do Rather than Make: A Proposed Set of
Knowledge-Based Occupation Clusters,” Urban Studies, 40, 1937-1958.
Florida, Richard. 2002. The Rise of the Creative Class, New York: Basic Books.
Florida, Richard. 2008. Who’s Your City? New York: Basic Books.
Gabe, Todd. 2009. “Knowledge and Earnings,” Journal of Regional Science, 49, 439-
457.
Ibrahim, Sherwat, M. Hosein Fallah, and Richard Reilly. 2009. “Localized Sources of
Knowledge and the Effect of Knowledge Spillovers: An Empirical Study of
Inventors in the Telecommunications Industry,” Journal of Economic Geography,
9, 405-431.
Jaffe, Adam, Manuel Trajtenberg, and Rebecca Henderson. 1993. “Geographic
Localization of Knowledge Spillovers as Evidenced by Patent Citations,”
Quarterly Journal of Economics, 108, 577-598.
Kim, Sukkoo. 1995. “Expansion of Markets and the Geographic Distribution of
Economic Activities: The Trends in U.S. Regional Manufacturing Structure,
1860-1987,” Quarterly Journal of Economics, 110, 881-908.

22
Kim, Yunsoo, David Barkley, and Mark Henry. 2000. “Industry Characteristics Linked to
Establishment Concentrations in Nonmetropolitan Areas,” Journal of Regional
Science, 40, 231-259.
Kloosterman, Robert. 2008. “Walls and Bridges: Knowledge Spillover between
‘Superdutch’ Architectural Firms,” Journal of Economic Geography, 8, 545-563.
Kolko, Jed. 2009. “Urbanization, Agglomeration, and Co-Agglomeration of Service
Industries,” Chapter 5 in Glaeser, E.L. (ed.), The Economics of Agglomeration,
Chicago: University of Chicago Press for the NBER, forthcoming.
Krugman, Paul. 1991. Geography and Trade, Cambridge, MA: The MIT Press.
Marshall, Alfred. 1920. Principles of Economics, London: Macmillan.
Markusen, Ann. 2004. “Targeting Occupations in Regional and Community Economic
Development,” Journal of the American Planning Association, 70, 253-268.
McGranahan, David and Timothy Wojan. 2007. “Recasting the Creative Class to
Examine Growth Processes in Rural and Urban Counties,” Regional Studies, 41,
197-216.
Overman, Henry and Diego Puga. 2009. “Labour Pooling as a Source of Agglomeration:
An Empirical Investigation,” Chapter 4 in Glaeser, E.L. (ed.), The Economics of
Agglomeration, Chicago: University of Chicago Press for the NBER,
forthcoming.

23
Peterson, Norman, Michael Mumford, Walter Borman, Richard Jeanneret, Edwin
Fleishman, Kerry Levin, Michael Campion, Melinda Mayfield, Frederick
Morgeson, Kenneth Pearlman, Marilyn Gowing, Anita Lancaster, Marilyn Silver,
and Donna Dye. 2001. “Understanding Work Using the Occupational Information
Network (O*NET): Implications for Practice and Research,” Personnel
Psychology, 54, 451-492.
Rosenthal, Stuart and William Strange. 2001. “The Determinants of Agglomeration,”
Journal of Urban Economics, 50, 191-229.
Rosenthal, Stuart and William Strange. 2004. “Evidence on the Nature and Sources of
Agglomeration Economies,” Chapter 49 in Henderson, J.V., Thisse, J.F. (eds.),
Handbook of Regional and Urban Economics, Vol. 4, Amsterdam:
Elsevier/North-Holland, pp. 2119-2171.
Ruggles, Steven, Matthew Sobek, Trent Alexander, Catherine A. Fitch, Ronald Goeken,
Patricia Kelly Hall, Miriam King, and Chad Ronnander. 2008. Integrated Public
Use Microdata Series: Version 4.0 [Machine-readable database]. Minneapolis,
MN: Minnesota Population Center [producer and distributor].
Scott, Allen. 2009. “Human Capital Resources and Requirements across the
Metropolitan Hierarchy of the USA,” Journal of Economic Geography, 9, 207-
226.
Storper, Michael and Anthony Venables. 2004. “Buzz: Face-to-Face Contact and the
Urban Economy,” Journal of Economic Geography, 4, 351-370.

24
Table 1. Agglomeration of Major Occupational Categories
SOC Category Description Average LGINI Average INDEX
11-0000 Management Occupations 0.1045 0.0013 13-0000 Business and Financial Operations Occupations 0.1187 0.0018 15-0000 Computer and Mathematical Occupations 0.1937 0.0043 17-0000 Architecture and Engineering Occupations 0.1731 0.0067 19-0000 Life, Physical, and Social Science Occupations 0.2464 0.0092 21-0000 Community and Social Services Occupations 0.0889 0.0010 23-0000 Legal Occupations 0.1371 0.0032 25-0000 Education, Training, and Library Occupations 0.0874 0.0006 27-0000 Arts, Design, Entertainment, Sports, and Media Occupations 0.1468 0.0083 29-0000 Healthcare Practitioners and Technical Occupations 0.0973 0.0008 31-0000 Healthcare Support Occupations 0.0909 0.0030 33-0000 Protective Service Occupations 0.1767 0.0021 35-0000 Food Preparation and Serving Related Occupations 0.0798 0.0006 37-0000 Building and Grounds Cleaning and Maintenance Occupations 0.0820 0.0009 39-0000 Personal Care and Service Occupations 0.1170 0.0042 41-0000 Sales and Related Occupations 0.0661 0.0006 43-0000 Office and Administrative Support Occupations 0.0832 0.0006 45-0000 Farming, Fishing, and Forestry Occupations 0.3192 0.0171 47-0000 Construction and Extraction Occupations 0.1009 0.0013 49-0000 Installation, Maintenance, and Repair Occupations 0.1162 0.0015 51-0000 Production Occupations 0.1786 0.0051 53-0000 Transportation and Material Moving Occupations 0.1058 0.0022

25
Table 2a. 20 Most-Agglomerated Occupations, by Locational Gini Occupation Locational Gini Textile Winding, Twisting, and Drawing Out Machine Setters, Operators, and Tenders, SOC 51-6064 0.4544 Marine Engineers and Naval Architects, SOC 17-2121 0.4542 Miscellaneous Extraction Workers, Including Roof Bolters and Helpers, SOC 47-50XX 0.4507 Shoe Machine Operators and Tenders, SOC 51-6042 0.4494 Tire Builders, SOC 51-9197 0.4430 Textile Bleaching and Dyeing Machine Operators and Tenders, SOC 51-6061 0.4418 Gaming Cage Workers, SOC 43-3041 0.4372 Textile Knitting and Weaving Machine Setters, Operators, and Tenders, SOC 51-6063 0.4325 Lay-Out Workers, Metal and Plastic, SOC 51-4192 0.4236 Petroleum, Mining and Geological Engineers, Including Mining Safety Engineers, SOC 17-21XX 0.4225 Nuclear Engineers, SOC 17-2161 0.4132 Aircraft Structure, Surfaces, Rigging, and Systems Assemblers, SOC 51-2011 0.4102 Fishing and Hunting Workers, SOC 45-3000 0.4095 Ship Engineers, SOC 53-5031 0.4065 Graders and Sorters, Agricultural Products, SOC 45-2041 0.4018 Mining Machine Operators, SOC 47-5040 0.3967 Gaming Services Workers, SOC 39-3010 0.3953 Sailors and Marine Oilers, SOC 53-5011 0.3924 Explosives Workers, Ordnance Handling Experts, and Blasters, SOC 47-5031 0.3914 Riggers, SOC 49-9096 0.3904
26
Table 2b. 20 Most-Agglomerated Occupations, by Concentration Index Occupation Concentration Index Economists, SOC 19-3011 0.1620 Actors, SOC 27-2011 0.1569 Gaming Cage Workers, SOC 43-3041 0.1031 Petroleum, Mining and Geological Engineers, Including Mining Safety Engineers, SOC 17-21XX 0.0990 Textile Winding, Twisting, and Drawing Out Machine Setters, Operators, and Tenders, SOC 51-6064 0.0870 Gaming Services Workers, SOC 39-3010 0.0869 Marine Engineers and Naval Architects, SOC 17-2121 0.0533 Textile Knitting and Weaving Machine Setters, Operators, and Tenders, SOC 51-6063 0.0456 Derrick, Rotary Drill, and Service Unit Operators, and Roustabouts, Oil, Gas, and Mining, SOC 47-50YY 0.0420 First-Line Supervisors/Managers of Gaming Workers, SOC 39-1010 0.0417 Textile Bleaching and Dyeing Machine Operators and Tenders, SOC 51-6061 0.0363 Television, Video, and Motion Picture Camera Operators and Editors, SOC 27-4030 0.0360 Lay-Out Workers, Metal and Plastic, SOC 51-4192 0.0343 Sewing Machine Operators, SOC 51-6031 0.0334 Forging Machine Setters, Operators, and Tenders, Metal and Plastic, SOC 51-4022 0.0320 Aircraft Structure, Surfaces, Rigging, and Systems Assemblers, SOC 51-2011 0.0313 Graders and Sorters, Agricultural Products, SOC 45-2041 0.0311 Taxi Drivers and Chauffeurs, SOC 53-3041 0.0285 Textile Cutting Machine Setters, Operators, and Tenders, SOC 51-6062 0.0282 Producers and Directors, SOC 27-2012 0.0280

27
Table 3a. 20 Least-Agglomerated Occupations, by Locational Gini Occupation Locational Gini Retail Salespersons, SOC 41-2031 0.0369 Secretaries and Administrative Assistants, SOC 43-6010 0.0409 First-Line Supervisors/Managers of Retail Sales Workers, SOC 41-1011 0.0418 Elementary and Middle School Teachers, SOC 25-2020 0.0465 First-Line Supervisors/Managers of Office and Administrative Support Workers, SOC 43-1011 0.0477 Bookkeeping, Accounting, and Auditing Clerks, SOC 43-3031 0.0484 Human Resources Assistants, Except Payroll and Timekeeping, SOC 43-4161 0.0498 Hairdressers, Hairstylists, and Cosmetologists, SOC 39-5012 0.0509 Maids and Housekeeping Cleaners, SOC 37-2012 0.0521 Cashiers, SOC 41-2010 0.0530 Stock Clerks and Order Fillers, SOC 43-5081 0.0536 Food Service Managers, SOC 11-9051 0.0542 Automotive Service Technicians and Mechanics, SOC 49-3023 0.0542 Office Clerks, General, SOC 43-9061 0.0555 Secondary School Teachers, SOC 25-2030 0.0601 Registered Nurses, SOC 29-1111 0.0636 Cooks, SOC 35-2010 0.0637 General and Operations Managers, SOC 11-1021 0.0641 Medical Assistants and Other Healthcare Support Occupations, SOC 31-909X 0.0648 Carpenters, SOC 47-2031 0.0654

28
Table 3b. 20 Least-Agglomerated Occupations, by Concentration Index Occupation Concentration Index Retail Salespersons, SOC 41-2031 0.0001 Hairdressers, Hairstylists, and Cosmetologists, SOC 39-5012 0.0001 Bookkeeping, Accounting, and Auditing Clerks, SOC 43-3031 0.0001 Receptionists and Information Clerks, SOC 43-4171 0.0001 First-Line Supervisors/Managers of Office and Administrative Support Workers, SOC 43-1011 0.0001 Food Service Managers, SOC 11-9051 0.0001 Elementary and Middle School Teachers, SOC 25-2020 0.0002 Cashiers, SOC 41-2010 0.0002 Office and Administrative Support Workers, All Other, SOC 43-9199 0.0002 Payroll and Timekeeping Clerks, SOC 43-3051 0.0002 First-Line Supervisors/Managers of Retail Sales Workers, SOC 41-1011 0.0002 Postal Service Mail Carriers, SOC 43-5052 0.0002 File Clerks, SOC 43-4071 0.0002 Secretaries and Administrative Assistants, SOC 43-6010 0.0003 Dispatchers, SOC 43-5030 0.0003 First-Line Supervisors/Managers of Personal Service Workers, SOC 39-1021 0.0003 Computer, Automated Teller, and Office Machine Repairers, SOC 49-2011 0.0003 First-Line Supervisors/Managers of Non-Retail Sales Workers, SOC 41-1012 0.0003 Child Care Workers, SOC 39-9011 0.0003 Stock Clerks and Order Fillers, SOC 43-5081 0.0003

29
Table 4. Descriptive Statistics (n=468) Standard Variable Description Mean Deviation LGINI Locational Gini coefficient calculated across 324 U.S. metropolitan 0.1872 0.0962 areas INDEX Modified Ellison-Glaeser concentration index calculated across 324 0.0064 0.0150 U.S. metropolitan areas Specialized Knowledge Variable measuring the difference between an occupation’s 684.5 412.6 knowledge profile and the knowledge profile of the average U.S. occupation Specialized Equipment Index value that measures the importance (scale of 1 to 5) and level 5.479 5.738 (scale of 1 to 7) of occupational activity titled “Operating Vehicles, Mechanized Devices, or Equipment” Update Knowledge Index value that measures the importance (scale of 1 to 5) and level 14.87 5.701 (scale of 1 to 7) of occupational activity titled “Updating and Using Relevant Knowledge” Creativity Index value that measures the importance (scale of 1 to 5) and level 11.24 5.742 (scale of 1 to 7) of occupational activity titled “Thinking Creatively” Years of Education Average years of education of those in occupation 13.18 1.885 Table is continued on the following page.

30
Table 4. Descriptive Statistics (n=468), continued Standard Variable Description Mean Deviation Interaction with Public Index value that measures the importance (scale of 1 to 5) and level 10.12 7.150 (scale of 1 to 7) of occupational activity titled “Performing for or Working Directly with the Public” Average Establishment Size Average size of businesses that employ workers in the occupation 74.47 77.83 Agriculture Share of people in occupation who work in agricultural-related 0.0207 NA industry Mining Share of people in occupation who work in mining-related industry 0.0154 NA

31
Table 5. Knowledge Areas Administration and Management Building and Construction Education and Training Clerical Mechanical English Language Economics and Accounting Mathematics Foreign Language Sales and Marketing Physics Fine Arts Customer and Personal Service Chemistry History and Archeology Personnel and Human Resources Biology Philosophy and Theology Production and Processing Psychology Public Safety and Security Food Production Sociology and Anthropology Law and Government Computers and Electronics Geography Telecommunications Engineering and Technology Medicine and Dentistry Communications and Media Design Therapy and Counseling Transportation

32
Table 6. Regression Results on the Agglomeration of Occupations (n = 468) Estimated Coefficients (t-stats in parentheses) Variable Dependent Variable: LGINI Dependent Variable: INDEX Constant -2.570*** -2.524*** -3.093*** -8.373*** -8.172*** -9.025*** (-9.79) (-9.55) (-6.74) (-12.32) (-12.18) (-7.52) Specialized Knowledge 0.117*** 0.107** 0.116** 0.474*** 0.362*** 0.446*** (2.69) (2.38) (2.35) (4.16) (3.22) (3.49) Specialized Equipment 0.054*** 0.054*** 0.063*** 0.084* 0.088** 0.097* (3.05) (3.13) (3.20) (1.85) (1.98) (1.95) Update Knowledge 0.108** NA NA 0.061 NA NA (2.07) (0.47) Creativity NA 0.102** NA NA 0.287** NA (2.25) (2.42) Years of Education NA NA 0.301 NA NA 0.388 (1.34) (0.65) Interaction with Public -0.179*** -0.177*** -0.176*** -0.406*** -0.435*** -0.413*** (-8.75) (-9.14) (-8.57) (-7.57) (-8.63) (-7.69) Table is continued on the following page.

33
Table 6. Regression Results on the Agglomeration of Occupations (n = 468), continued Estimated Coefficients (t-stats in parentheses) Variable Dependent Variable: LGINI Dependent Variable: INDEX Average Establishment Size -0.001 0.015 0.004 -0.065 -0.049 -0.067 (-0.04) (0.51) (0.14) (-0.89) (-0.70) (-0.93) Agriculture 0.719*** 0.739*** 0.749*** 1.698*** 1.721*** 1.726*** (5.04) (5.37) (5.44) (5.17) (5.21) (5.27) Mining 0.701*** 0.716*** 0.683*** 2.219*** 2.276*** 2.200*** (4.12) (4.34) (4.04) (4.26) (4.88) (4.21) r-squared 0.228 0.231 0.224 0.214 0.225 0.214 Adjusted r-squared 0.216 0.219 0.213 0.202 0.213 0.202 Notes: All variables except Agriculture and Mining are measured in logs. ***, ** and * denote significance at the .01, .05 and .10 levels, respectively. t-statistics in parentheses; computed using robust standard errors.

34
Table 7. 20 Highest Co-Agglomeration Pairs Occupation 1 Occupation 2 Co-Agglomeration Gaming Services Workers Gaming Cage Workers 0.09 Actors Television, Video, and Motion Picture Camera Operators and 0.07 Editors Budget Analysts Economists 0.06 First-Line Supervisors/Managers of Gaming Workers Gaming Cage Workers 0.06 Actors Sewing Machine Operators 0.06 Actors Producers and Directors 0.06 Agents and Business Managers of Artists, Performers, and Athletes Actors 0.06 First-Line Supervisors/Managers of Gaming Workers Gaming Services Workers 0.05 Textile Knitting and Weaving Machine Setters, Operators, and Textile Winding, Twisting, and Drawing Out Machine 0.05 Tenders Setters, Operators, and Tenders Operations Research Analysts Economists 0.05 Miscellaneous Mathematical Science Occupations, Including Economists 0.05 Mathematicians and Statisticians Economists Miscellaneous Social Scientists, Including Sociologists 0.05 Petroleum, Mining and Geological Engineers, Including Mining Geological and Petroleum Technicians 0.04 Safety Engineers Actors Textile Cutting Machine Setters, Operators, and Tenders 0.04 Actors Jewelers and Precious Stone and Metal Workers 0.04 Astronomers and Physicists Economists 0.04 Meeting and Convention Planners Economists 0.04 Petroleum, Mining and Geological Engineers, Including Mining Derrick, Rotary Drill, and Service Unit Operators, and 0.04 Safety Engineers Roustabouts, Oil, Gas, and Mining Textile Bleaching and Dyeing Machine Operators and Tenders Textile Knitting and Weaving Machine Setters, Operators, 0.03 and Tenders Textile Bleaching and Dyeing Machine Operators and Tenders Textile Winding, Twisting, and Drawing Out Machine 0.03 Setters, Operators, and Tenders

35
Table 8. Regression Results on the Co-Agglomeration of Occupations (n = 109,278) Variable Estimated Coefficients Constant -1.40e-10 -0.0152*** (0.000) (-4.89) Dissimilar Knowledge -0.108*** -0.099*** (-38.31) (-34.55) Dissimilar Output -0.157*** -0.132*** (-33.38) (-26.89) Controls for Major SOCs No Yes r-squared 0.043 0.061 Adjusted r-squared 0.043 0.061 Notes: All of the variables are normalized to have a mean of zero and a standard deviation of one. *** denotes significance at the .01 level. t-statistics in parentheses; computed using robust standard errors.