Federal Programs for Addressing Low-Income Housing Needs
32
The Urban Institute Federal Programs for Addressing Low-Income Housing Needs A Policy Primer MARGERY AUSTIN T URNER AND G. T HOMAS KINGSLEY December 2008
Transcript of Federal Programs for Addressing Low-Income Housing Needs

The Urban Institute
Federal Programsfor AddressingLow-IncomeHousing NeedsA Policy Primer
MARGERY AUSTIN TURNER AND
G. THOMAS KINGSLEY
December 2008

The Urban Institute
Federal Programsfor AddressingLow-IncomeHousing NeedsA Policy Primer
MARGERY AUSTIN TURNER AND
G. THOMAS KINGSLEY
December 2008

Copyright © 2008.The Urban Institute.All rights reserved.Except for short quotes, no part of this report maybe reproduced or used in any form or by any means,electronic or mechanical, including photocopying,record-ing, or by information storage or retrieval system, without written permission from the Urban Institute.
The Urban Institute is a nonprofit, nonpartisan policy research and educational organization that examinesthe social, economic,and governance problems facing the nation.The views expressed are those of the authorsand should not be attributed to the Urban Institute, its trustees, or its funders.The authors thank the AnnieE.Casey Foundation for sponsoring the preparation of this primer. Thanks also to Martin Abravanel and SusanPopkin of the Urban Institute, who provided helpful comments and advice.Any errors or omissions are, ofcourse, the responsibility of the authors.

iii
Understanding the Basics 1
Scale and Who Is Served 2
Trends in Program Size and the Location of Assisted Housing 5
Roles of State and Local Housing Agencies 8
Current Public Housing Initiatives 9
Critical Policy Challenges and Choices 12
Notes 19
References 23
Contents

CRITICAL CHALLENGES
• Federal housing assistance only serves about one of every four eligible households, and an estimated12.4 million low-income renters face serious housing problems without any assistance.– The primary problem these unassisted households face is affordability, with rents rising faster than
incomes for low-wage workers.• A disproportionate share of the subsidized stock is concentrated in distressed neighborhoods, where
jobs are scarce, schools perform poorly, and crime and violence are common.• Neither federal policy nor local practice is taking full advantage of opportunities to link housing assistance
with services to improve outcomes for children or encourage family economic success.
OPPORTUNITIES FOR ENGAGEMENT
At the federal level• Help raise the visibility of rental housing issues on the national policy agenda and encourage debate
about the federal role and scale of assistance.• Support legislation that builds on lessons from HOPE VI, targeting resources to replace distressed and
overly concentrated public housing with mixed-income developments, while preserving affordable optionsfor low-income households and protecting the hard to house.
• Ensure that any expansion of the Moving to Work initiative that allows further experimentation withhousing subsidy formulas and occupancy rules requires rigorous evaluation to assess the impacts onfamily well-being and economic success.
• Explore opportunities to expand funding for programs that link housing assistance with support servicesboth for families’ economic success and children’s well-being.
At the state and local levels• Encourage regulatory reforms that permit and encourage more affordable rental housing construction
in opportunity-rich communities.• Support state and local initiatives that make low-wage workers better able to afford housing, including
minimum wage laws and supplemental earned income tax credits.• Support the expansion of state and local funding for affordable housing preservation and production,
including creation of housing trust funds.• Support innovative local strategies for deconcentrating public and assisted housing, including both
project-based and tenant-based strategies.• Help build rigorous monitoring and evaluation into any local experimentation with assisted housing
subsidy formulas or occupancy rules.• Encourage local adoption of best practices for support services that can be linked to assisted housing.
At the neighborhood level• Help improve and expand services for residents of particular projects, including work readiness,
job training, and job retention services.• Support mobility counseling and housing search assistance to enable voucher recipients to move to
safe, opportunity-rich neighborhoods.• Support the development and operation of high-quality supportive housing for the most vulnerable
residents of public and assisted housing.• Participate in the design and implementation of local public housing demolition and redevelopment
projects so they enhance the well-being of current and future residents.

Federal Programs for Addressing Low-Income Housing Needs 1
MONTHLY RENT OR MORTGAGE PAY-ments constitute the single biggest expenditure inmost family budgets, and many low-income familieshave difficulty finding housing they can reasonablyafford. Although most family-strengthening andcommunity change initiatives recognize the urgencyof the housing problems facing low-income families,they often have difficulty figuring out how to con-structively address them. Federal housing programsare numerous and confusing, implementation is balka-nized, funding falls woefully short of needs, and pol-icy debates often focus on narrow technical issues. Thisprimer intends to demystify federal rental assistanceprograms and provide the most current informationavailable on how many (and who) they serve and howtheir scale is changing over time.1 It also summarizeskey challenges facing housing policy today and in thecoming years—challenges that may create opportu-nities for federal, state, and local engagement andinnovation.
Understanding the Basics
The federal government began building subsidizedhousing during the New Deal, and in the decadessince, a complex tangle of federal programs hasevolved to tackle the housing needs of low-incomerenters. Today, federal housing programs fall into threebasic categories: (1) programs that provide deep, gap-filling rent subsidies, earmarked either for particularbuildings or for individual households; (2) tax creditsthat produce new housing with moderate (below-market) rent levels; and (3) block grants that provideflexible support for local affordable housing initiatives.
Understanding all three program types—and thepeople and properties they serve—is essential for iden-tifying community-level opportunities to strengthen,expand, or supplement affordable housing options.2
The most generous and reliable support for low-income households comes from federal housing pro-grams that provide deep, gap-filling rent subsidies.These programs all pay the difference between a rentcontribution that is considered affordable—currentlyset at 30 percent of monthly income—and the actualrent for a house or apartment. Families receive thiskind of “gap-filling” subsidy if they live in publichousing (owned and managed by a local public hous-ing agency) or in privately owned developments thathave long-term subsidy contracts with the federalDepartment of Housing and Urban Development(HUD). In both cases, the subsidy is “project based”—attached to the house or apartment; if the familymoves, it loses its subsidy.
Production of these deeply subsidized rental proj-ects occurred in two overlapping phases. During thefirst phase, extending from the 1930s through theearly 1970s, the federal government contracted withlocal public housing agencies (PHAs) to build andmanage properties, providing funds to cover bothcapital and operating costs.3 In effect, these contractsrequired the PHAs to maintain the affordability ofpublic housing units in perpetuity. During the secondphase, extending from the 1960s to the early 1980s,the federal government executed contracts directlywith for-profit and nonprofit housing developers,rather than with PHAs. The terms of contracts gen-erally guaranteed subsidies and imposed affordabilityrestrictions for up to 30-year terms.
Federal Programsfor Addressing Low-Income Housing Needs

2 A P O L I C Y P R I M E R
Gap-filling subsidies are also available in the formof federal housing vouchers, which allow families torent regular homes and apartments on the privatemarket. Again, a family contributes 30 percent ofits monthly income and the federal governmentpays the rest, up to a locally determined maximum.Vouchers are unique among federal housing assis-tance programs in that they are “tenant based” ratherthan project based, allowing the recipient ratherthan the developer to decide where the low-incomehousehold will live. Voucher recipients can evenreceive their assistance in one jurisdiction and takeit to another as they search for housing that bestmeets their needs.4
Low Income Housing Tax Credits (LIHTC)provide an up-front subsidy to developers of rentalhousing (or their equity investors) in return for acommitment to charge below-market rent levels.Rents for these units must be set at levels that aredeemed affordable for households with moderatelylow income levels for the local area, and the units areset aside for residents at or below this income ceiling.All eligible residents pay the same rent; the LIHTCprogram does not require (nor does it provide suffi-cient subsidies to allow) every unit to be affordablefor the family that lives in it.
Every year, the federal government also providesflexible support for local housing initiatives in the formof block grants. Specifically, the HOME programallocates federal dollars by formula to state and localgovernments, which can use the money to buy,build, or rehabilitate rental housing targeted to low-or moderate-income households. The CommunityDevelopment Block Grant program provides formulafunding to the same jurisdictions, and these dollarscan be used to pay for infrastructure and communityfacilities (like parks, recreation centers, and streetimprovements) that support affordable housing devel-opment. Housing legislation just passed by Congressincludes a new Affordable Housing Trust Fund, which(beginning in 2010) will be distributed by formulato state governments primarily to support the devel-opment of rental housing that is affordable for verylow income households.5
Scale and Who Is Served
Federal housing assistance programs—though large,complex, and costly—fall woefully short of meet-
ing the needs of low-income Americans. The totalnumber of renters facing serious housing hardshiphas been steadily rising, and less than a third of eli-gible households with housing needs actually receiveassistance. In addition, the number of householdsreceiving deep, gap-filling subsidies (from publichousing, privately owned subsidized housing, orvouchers) has remained essentially unchanged sincethe beginning of this decade, while the number ofhomes and apartments with shallower LIHTC sub-sidies has grown. Information on the characteristicsof households served by federal housing assistanceprograms varies considerably across program types,with much more complete and reliable data avail-able for the deep subsidy programs than for the newer(expanding) programs.
Housing Assistance Gap
From 1999 through 2005,6 U.S. housing marketsexperienced an unprecedented boom. Changes inpolicies and market mechanisms, including a vastincrease in subprime lending, substantially expandedthe number of homeowners, while the number ofrenters remained flat. Renters have traditionally expe-rienced more serious and widespread housing prob-lems than owners and, accordingly, have been theintended beneficiaries of the housing assistance pro-grams described in this primer.
For much of the 20th century, inadequate supplyand deteriorated structures were America’s dominanthousing problems. But, for at least the past 40 years,the primary problem for renters has been affordability.By 2005, only 5 percent of renters lived in over-crowded housing and 11 percent lived in housingthat was structurally inadequate, but 22 percent werepaying from 30 to 50 percent of their income for rent,and another 23 percent were paying more than halftheir income for rent (table 1). Altogether, 14.2 mil-lion unassisted renter households (42 percent of allrenters) had one or more of these housing problemsin 2005. Between 1999 and 2005, the number withproblems grew 7.7 percent while the number withno problems declined 9.7 percent.
The fundamental problem is that rents have risenfaster than incomes for a growing segment of theworkforce in almost every part of the country. Thistrend is primarily the result of widening incomeinequality, with incomes rising much more slowly for

Federal Programs for Addressing Low-Income Housing Needs 3
low- and moderate-wage workers than for those inhigh-skill, high-wage jobs. Rising incomes at the topof the wage ladder put upward pressure on housingprices and rents, forcing them beyond the reach ofworkers in lower-wage jobs. Further, in prosperousmetropolitan areas, new housing construction hasnot kept pace with employment and populationgrowth. Local zoning laws, land use controls, andother regulatory barriers limit total housing pro-duction, raise the cost of new units, and prevent theproduction of low-cost units. As population expandsin a market with constrained supply, the increasedcompetition for units causes prices to rise even morerapidly (Katz and Turner 2008).
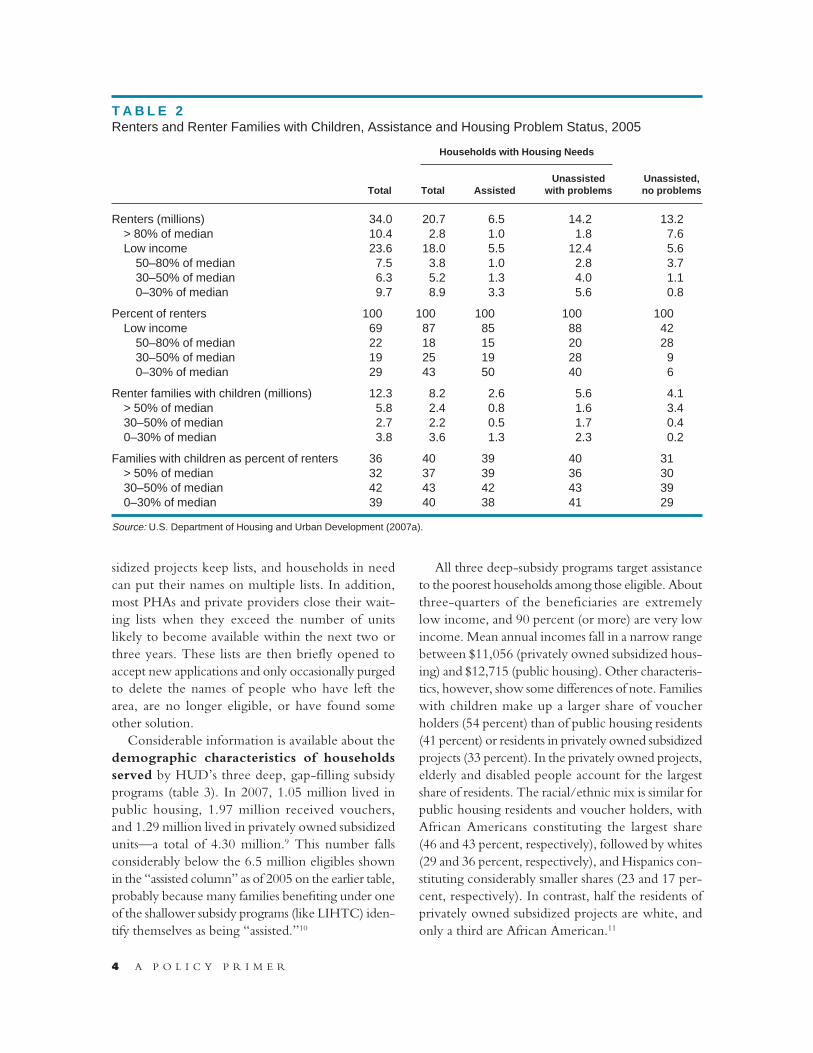
Not surprisingly, the extent of housing prob-lems varies dramatically with income. A household’sincome must fall below 80 percent of the local areamedian to be eligible for HUD’s three deep-subsidyassistance programs.7 In 2005, 23.6 million house-holds (69 percent of all renters) met this standard(table 2). Households “with housing needs” are thosethat either receive housing assistance or have one ormore housing problems. The vast majority of theserenters are low income (87 percent). Moreover, hous-ing problems are much more prevalent at the low-est end of the income ladder. The “extremely lowincome” category (less than 30 percent of area median)is of special importance because it is roughly equiva-lent to the group in poverty and includes particularlyvulnerable families and individuals—those with high
needs for social services and at risk of homelessness.8
More than 90 percent of renters in the extremelylow income range either receive housing assistanceor suffer from housing problems.
Only 5.5 million (31 percent) of the total 18.0 mil-lion eligible households with housing needs actuallyreceive assistance. That number represents just 23 per-cent of the 23.6 million that are eligible, regardlessof whether they have housing problems. Even amongextremely low income renters, only 34 percent ofthose that are eligible receive housing assistance. As of2005, 12.3 million renter households were familieswith children—36 percent of all renters but 40 percentof those with housing needs and 40 percent of theextremely low income renters with housing needs.As of 2005, a total of 1.3 million very low incomefamilies with children were receiving housing assis-tance, while another 2.3 million had housing prob-lems but received no assistance.
Because the availability of housing assistance fallsso far short of needs, waiting lists for public housing,privately owned subsidized projects, and vouchers areall long. In fact, eligible households typically haveto wait years before they reach the top of a waitinglist for subsidized housing. Unfortunately, however,waiting lists do not provide reliable information aboutthe number or characteristics of households in need.Many PHAs maintain separate waiting lists for publichousing and vouchers, neighboring jurisdictions havetheir own lists, the owners of privately owned sub-
T A B L E 1Total U.S. Households, Tenure, and Renter Problems, 1999–2005
1999 2005 % change
Households (millions)Total households 102.8 108.9 5.9Owner households 68.8 75.0 8.9Renter households 34.0 34.0 (0.2)
Assisted 6.2 6.5 5.5Unassisted with problems 13.1 14.2 7.7Unassisted no problems 14.7 13.2 (9.7)
Percent of renters with housing problemsRent burden > 50% of income 19 23 4.7Rent burden 30–50% of income 21 22 1.1Severely inadequate housing 4 3 (0.4)Moderately inadequate housing 8 8 (0.6)Crowded housing 5 5 (0.1)
Source: U.S. Department of Housing and Urban Development (2007a).
4 A P O L I C Y P R I M E R
sidized projects keep lists, and households in needcan put their names on multiple lists. In addition,most PHAs and private providers close their wait-ing lists when they exceed the number of unitslikely to become available within the next two orthree years. These lists are then briefly opened toaccept new applications and only occasionally purgedto delete the names of people who have left thearea, are no longer eligible, or have found someother solution.
Considerable information is available about thedemographic characteristics of householdsserved by HUD’s three deep, gap-filling subsidyprograms (table 3). In 2007, 1.05 million lived inpublic housing, 1.97 million received vouchers,and 1.29 million lived in privately owned subsidizedunits—a total of 4.30 million.9 This number fallsconsiderably below the 6.5 million eligibles shownin the “assisted column” as of 2005 on the earlier table,probably because many families benefiting under oneof the shallower subsidy programs (like LIHTC) iden-tify themselves as being “assisted.”10
All three deep-subsidy programs target assistanceto the poorest households among those eligible. Aboutthree-quarters of the beneficiaries are extremelylow income, and 90 percent (or more) are very lowincome. Mean annual incomes fall in a narrow rangebetween $11,056 (privately owned subsidized hous-ing) and $12,715 (public housing). Other characteris-tics, however, show some differences of note. Familieswith children make up a larger share of voucherholders (54 percent) than of public housing residents(41 percent) or residents in privately owned subsidizedprojects (33 percent). In the privately owned projects,elderly and disabled people account for the largestshare of residents. The racial/ethnic mix is similar forpublic housing residents and voucher holders, withAfrican Americans constituting the largest share(46 and 43 percent, respectively), followed by whites(29 and 36 percent, respectively), and Hispanics con-stituting considerably smaller shares (23 and 17 per-cent, respectively). In contrast, half the residents ofprivately owned subsidized projects are white, andonly a third are African American.11
T A B L E 2Renters and Renter Families with Children, Assistance and Housing Problem Status, 2005
Households with Housing Needs
Unassisted Unassisted, Total Total Assisted with problems no problems
Renters (millions) 34.0 20.7 6.5 14.2 13.2> 80% of median 10.4 2.8 1.0 1.8 7.6Low income 23.6 18.0 5.5 12.4 5.6
50–80% of median 7.5 3.8 1.0 2.8 3.730–50% of median 6.3 5.2 1.3 4.0 1.10–30% of median 9.7 8.9 3.3 5.6 0.8
Percent of renters 100 100 100 100 100Low income 69 87 85 88 42
50–80% of median 22 18 15 20 2830–50% of median 19 25 19 28 90–30% of median 29 43 50 40 6
Renter families with children (millions) 12.3 8.2 2.6 5.6 4.1> 50% of median 5.8 2.4 0.8 1.6 3.430–50% of median 2.7 2.2 0.5 1.7 0.40–30% of median 3.8 3.6 1.3 2.3 0.2
Families with children as percent of renters 36 40 39 40 31> 50% of median 32 37 39 36 3030–50% of median 42 43 42 43 390–30% of median 39 40 38 41 29
Source: U.S. Department of Housing and Urban Development (2007a).

Federal Programs for Addressing Low-Income Housing Needs 5
Many people assume that residents of subsidizedhousing seldom move. But in fact, the median lengthof stay in public housing is only 4.7 years, and themedian voucher household receives assistance for3.1 years. The elderly and disabled groups stay thelongest; the medians for families with children areonly 3.2 years in public housing and 2.6 years inthe voucher program. Interestingly, working families(defined as those with more than half their incomecoming from wages) stay longer on average than thosethat depend primarily on welfare. Despite the relativelyshort average tenures, a sizeable minority of publichousing residents stay much longer. Specifically,20 percent of families with children (nonelderly andnondisabled) in public housing have lived there8.9 years or longer (Lubell 2008).
Trends in Program Size and the Location of Assisted Housing
Public housing was launched in 1937, and most of itsinventory was built by the mid-1970s. The programsoffering deep subsidies in privately owned properties
began producing units in the 1960s, accelerated after1974, when the most generous of these programswas established, but were drastically curtailed by theReagan administration in the early 1980s. Vouchers,also introduced in 1974, have provided the mainvehicle for expanding deep subsidy assistance sincethe early 1980s, but the LIHTC program has growneven more rapidly since it began in 1987. Figure 1shows trends for each group of programs since themid-1990s.
By the 1980s, some of the public housing stockwas deteriorating badly, but little funding was pro-vided for renovation, and a rigid “one-for-one re-placement” rule essentially prevented demolitionand redevelopment by requiring construction of anew public housing unit for every unit removedfrom the stock. Circumstances changed with theintroduction in 1993 of the HOPE VI program,which provides funds to demolish severely distressedprojects and replace them with mixed-income de-velopments.12 Generally, HOPE VI has built fewernew public housing units than were torn down,and associated initiatives have allowed the demolition
T A B L E 3Characteristics of Housing Assistance Recipients
Public housing Vouchers Private subsidized
Total units under lease March 2007 (thousands) 1,045 1,970 1,286
Percent by income relative to area median81% or higher 2 — 151–80% 8 3 331–50% 18 19 2130% or lower 72 77 75
Mean income ($) 12,715 12,411 11,056
Percent by household typeElderly, no children 29 17 49Nonelderly, disabled, no children 16 19 17Other, no children 14 9 1Families with children 41 54 33
Percent by race and ethnicityWhite, non-Hispanic 29 36 50Black, non-Hispanic 46 43 32Hispanic 23 17 13Asian or Pacific Islander 2 3 4Native American — 1 1
Sources: Total units under lease from HUD (2007b). Characteristics of public housing and voucher beneficiaries from HUD ResidentCharacteristics Report for June 2008. Characteristics of residents of privately owned subsidized housing from HUD TRACS report forJune 2008.

6 A P O L I C Y P R I M E R
or sale of other deteriorated projects without re-placement. The estimated result of these changeswas a decline of about 140,000 public housing unitsbetween 1995 and 2007, reducing the total stockfrom 1.33 million to 1.19 million units.13 As figure1 shows, the number of households living in pub-lic housing dropped from 1.14 million in 1993 to1.05 million in 2007.14
The number of households receiving vouchersgrew substantially during the 1990s and through theearly years of this decade, in part because PHAsreceived extra vouchers to relocate public housingresidents displaced by HOPE VI. More recently,however, federal budget pressures have curtailed anyfurther expansion of the voucher program. Altogether,the total number of voucher holders grew from1.20 million in 1993 to 1.97 million in 2007, a 64 per-cent increase in 14 years.
Almost no units have been added to the stockof privately owned subsidized units since the early1980s,15 but units are being removed from this inven-tory. As discussed earlier, these projects receive assis-tance under multiyear contracts between the privateowners and HUD. When those contracts expire, theyare often renewed, but owners can also “opt out” atthat point. Especially in markets where propertyvalues are rising or the surrounding neighborhood isin particular demand, owners may have strong finan-
cial incentives to let their subsidy commitments expire.Estimates indicate that the number of householdsliving in these assisted properties has dropped from1.72 million in 1993 to 1.29 million by 2007, a declineof 25 percent over 14 years.
Taken together, growth in the voucher programover the past decade and a half has been almostcompletely offset by the loss of deep, project-basedsubsidies. The total number of households receivingdeep, gap-filling assistance increased only 6 percent—from 4.06 million in 1993 to 4.30 million in 2007—despite the vast expansion in needs discussed earlier.In contrast, the LIHTC program, which began in1987, reached a cumulative total of 430,000 units in1995 and then expanded to 1.53 million in 2005, anincrease of 356 percent over a decade.
Although federally subsidized housing can be foundin city, suburban, and nonmetropolitan communitiesall over the country, it is disproportionately locatedin central cities. Public housing in particular is con-centrated in poor, inner-city neighborhoods in thenortheast and midwest (table 4).16 When public hous-ing was first introduced, it primarily targeted the olderindustrial cities of the northeast and midwest, wherehousing problems were severe. The younger, grow-ing cities of the west received relatively little publichousing, and California actually banned the construc-tion of public housing. Accordingly, only 9 percent
1.14 1.20
1.72
0.43
1.05
1.97
1.29
1.53
Public housing Tax credit(LIHTC)
1995199319931993
Privately ownedsubsidized
Vouchers
2005200720072007
F I G U R E 1Change in Households Assisted: Major Housing Assistance Programs (millions of assisted households)
Sources: For first three programs, 1993 data from HUD (1997b) and 2007 data from HUD (2007b); for LIHTC, phone interview withMichael Hollar, U.S. Department of Housing and Urban Development, August 2008.

Federal Programs for Addressing Low-Income Housing Needs 7
of the public housing stock is located in the west,compared with 24 percent of all rental units. Vouch-ers and privately owned subsidized housing are moreevenly spread across the regions, more nearly in pro-portion to the rental stock overall. Public housing alsostands out in that it is much more concentrated incentral cities (61 percent) than the other two deep-subsidy programs and is more concentrated than theoverall stock of rental housing.
The distribution of these programs across differ-ent types of neighborhoods highlights what is amongthe most serious flaws in U.S. housing programs.Federal housing policy has actually fueled the prob-lem of concentrated minority poverty, through thesiting of public housing in neighborhoods that arepredominantly black and poor. Today, more thanhalf of public housing residents live in high-povertyneighborhoods (with poverty rates above 30 percent),while only 8 percent live in low-poverty neighbor-hoods (poverty rates below 10 percent). The recordis better for privately owned subsidized projects(22 percent in high-poverty neighborhoods) andbetter yet for vouchers (15 percent in high-povertyneighborhoods), but even these levels raise seriousconcerns given the high cost of concentrated povertyfor families and for the nation as a whole (Ellen andTurner 1997).
Emerging evidence suggests that the newer formsof affordable rental housing production are stillreinforcing concentrated poverty in inner-city neigh-
borhoods, although not to the same degree as publichousing. A recent analysis of the tax credit program’sperformance in the 1990s revealed that central cities(where, again, poverty rates are much higher than thenational or suburban average) received a dispropor-tionate share of the units (Freeman 2004). Centralcities housed 58 percent of all metropolitan tax creditunits built during the 1990s despite the fact that theycontain only 38 percent of metropolitan residents.At the neighborhood level, the spatial distributionof tax credit housing presents a mixed picture. As of2000, the average tax credit unit was located in acensus tract with a poverty rate of 19 percent. Amongcentral-city units, the average tract poverty rate washigher (24 percent)—but not as high as the tractswhere other types of federally subsidized rental unitsare located (average poverty rate of 29 percent).
Comparable detail on the spatial distribution ofHOME units is not available, but the patterns appearto be similar. As of the late 1990s, the average tractpoverty rate for HOME-funded rental projects incities and urban counties was 27 percent. The averagewithin central cities was even higher—31 percent(Walker et al. 1998). These figures should not besurprising. Community development corporationsbuild affordable rental housing in the neighborhoodsthey serve both because that is what the federal gov-ernment pays for and because they believe that hous-ing production stimulates neighborhood revitalization.They rarely question the wisdom of consigning low-
T A B L E 4Location of Housing Assistance Units and All Rental Units, Mid-1990s (%)
Assisted Housing
Public housing Vouchers Private subsidized All rental units
RegionNortheast 31 22 25 22Midwest 21 22 27 22South 39 33 33 33West 9 23 15 24
Location typeCentral city 61 45 47 45Suburbs 19 34 33 38Nonmetropolitan 20 21 20 17
Neighborhood poverty rate< 10 percent 8 28 27 4210–29 percent 39 58 51 4530+ percent 54 15 22 13
Source: Newman and Schnare (1997).

8 A P O L I C Y P R I M E R
income families to neighborhoods that do not offerwhat most middle-class families seek in their housing:good schools, proximity to quality jobs, and qualityservices.
Roles of State and Local Housing Agencies
The administration of federal housing assistance iscomplex and confusing, with funds for various pro-grams flowing independently of one another to statehousing finance agencies (Low Income Housing TaxCredits), local public housing authorities (publichousing and vouchers), private owners (developmentswith federal subsidy contracts), and state and localdepartments of housing and community develop-ment (HOME and CDBG block grants). And citiestypically have distinct agencies for the separate butoverlapping tasks of housing finance, housing pro-duction, housing preservation, housing regulation,public housing administration, community develop-ment, neighborhood redevelopment, planning andzoning, and other special initiatives. This balkani-zation of administration makes it difficult for localcommunities to plan effectively, to allocate scarceresources strategically, or even systematically assessunmet needs.
Typically, the executive director of a local PHA doesnot report directly to the city’s mayor, but ratherto a board of directors, some of whose members areappointed by the mayor. Some jurisdictions havemade their PHAs part of the local housing department,with more explicit accountability to the mayor. How-ever, even in these cases, federal rules control mostaspects of program administration, and local policy-makers often perceive public housing and vouchersas outside their control.
In Washington, D.C., for example, seven sepa-rate organizations are significantly involved inaffordable housing production and administra-tion—the Department of Housing and Commu-nity Development, the Housing Finance Agency,the District of Columbia Housing Authority, theNational Capital Revitalization Corporation, theHousing Production Trust Fund, and the DeputyMayor for Planning and Economic Development—and no single individual or entity has the author-ity to coordinate or hold them all accountable.
In Baltimore, the city’s department of housing andcommunity development and its PHA were con-solidated into a single agency, called BaltimoreHousing, whose director is appointed by themayor. In contrast, Atlanta’s PHA operates inde-pendently of the city’s department of housing andcommunity development, with the chief executiveofficer accountable not to the mayor but to a boardof commissioners composed of local businessand civic leaders.
Public housing is built, owned, and operated bylocal autonomous bodies called public housingauthorities (PHAs), established for the expresspurpose of administering the federal public housingprogram. These PHAs also administer the housingvoucher program. Most PHAs rely primarily (or evenexclusively) on the federal government for fundingand must adhere to federal rules and procedures.17
Because PHAs are agencies of local government,most metropolitan regions have several PHAs, serv-ing different jurisdictions. This complicates voucherprogram operations because (at least in principle)recipients can use their vouchers anywhere, regard-less of which jurisdiction issued them. But voucherportability is hindered by the red tape involved intransferring families (and subsidy resources) from onePHA to another. Finally, not all jurisdictions havePHAs; communities without PHAs have no publichousing, but state-level PHAs generally administerfederal housing vouchers in these areas.
HUD directly funds and monitors the operationof privately owned properties that receive deepfederal subsidies. Each property maintains its ownwaiting lists, selects eligible residents, and reports toHUD. Local government exercises no authority orcontrol over these properties. However, as subsidycontracts with HUD expire, many communities facethe problem of losing affordable housing and helpinglow-income families at risk of displacement. There-fore, local housing departments are getting involved inproviding new subsidies to some of these properties,most often using some combination of HOME funds,the LIHTC, and local resources.

Federal Programs for Addressing Low-Income Housing Needs 9
Low income housing tax credits are distributedamong states by formula and then allocated to partic-ular development projects by state housing financeagencies (HFAs). State HFAs must prepare and pub-lish allocation plans, specifying criteria for awardingcredits, and prospective project developers competeto receive them. LIHTC projects can be developed(and then owned and operated) by for-profit compa-nies, nonprofits, and public agencies, including PHAs.And some states’ allocation plans give priority to pro-posed projects that are endorsed by local governments.However, once tax credits have been awarded, theirdevelopers typically operate them independently,with very limited oversight from the state HFA andthe federal Treasury Department (HUD has no rolein either funding or oversight of LIHTC projects).Like the privately owned properties with deep fed-eral subsidies, LIHTC properties maintain separatewaiting lists and tenant selection procedures. Localgovernment agencies may not even be aware of whereall these properties are.
CDBG and HOME block grants flow from HUDto local housing and community developmentdepartments. Big cities and urban counties are clas-sified as “entitlement jurisdictions” under these pro-grams and receive funding by formula. Typically,responsibility for using HOME and CDBG fundingfalls to the local department of housing and com-munity development, whose director reports to themayor. These agencies use the block grant fundsto support locally designed and operated programs,including programs that provide grants or loans todevelopers of affordable rental housing, often in con-junction with the LIHTC. HUD provides separateallocations of both HOME and CDBG funding to states for distribution among “nonentitlementjurisdictions.”18
HUD requires jurisdictions that receive HOMEfunding to prepare affordable housing plans. Theseplans document the magnitude of housing prob-lems among low- and moderate-income households,describe the distribution of hardship across differentincome levels and household types, and estimate thesize of special needs populations. Jurisdictions thenpresent the city’s strategy for using available resourcesto tackle these housing needs. At its best, this planningmandate (which includes requirements for publicparticipation) creates a real opportunity for engage-ment and strategic thinking. And some jurisdictions
use it very effectively to guide the allocation of fed-eral, state, and city resources. At its worst, however,the planning requirement amounts to little morethan a paper exercise, because HUD does not in factevaluate the local plans or require jurisdictions toadhere to them (Turner et al. 2002).
An assessment of the consolidated planningprocess conducted almost a decade ago foundthat the city of San Francisco was using theprocess effectively by engaging public and private-sector stakeholders to decide strategicallyabout the allocation of federal, state, and localhousing resources in a very challenging marketenvironment. In Atlanta, on the other hand, theHUD-mandated process was conducted sepa-rately from an ongoing local planning process.And San Antonio housing planners were frus-trated that the HUD-mandated plan had no teethand that the real decisions about resource alloca-tion occurred through an entirely separate politi-cal process (Turner et al. 2002).
Current Public Housing Initiatives
Two current initiatives give selected PHAs extraresources and flexibility to better meet the needs ofthe households and communities they serve. HOPEVI funds the demolition and replacement of severelydistressed public housing developments, with the goalof improving outcomes for residents and revitalizingneighborhoods. Moving to Work (MTW) essentiallyderegulates participating PHAs so they can experimentwith new subsidy formulas and occupancy rules thatoffer promise for encouraging and supporting work.Much of the current policy debate about public hous-ing revolves around these two initiatives; both arecontroversial.
The first, and probably best known, is theHOPE VI program, an ambitious effort launchedin the early 1990s to demolish the worst public hous-ing projects in the country and replace them withhousing that is better designed and built, less dense,more economically mixed, and better integratedinto the fabric of surrounding neighborhoods andcity economies. HOPE VI grants are competitivelyawarded to PHAs for the demolition and redevelop-ment of particular projects and include funding for

10 A P O L I C Y P R I M E R
supportive services to help residents make the transi-tion to work as well as supplemental housing vouch-ers for resident relocation.
The new housing developments produced underHOPE VI differ dramatically from earlier genera-tions of public housing. Not only are they generallywell constructed, but the best among them haveapplied the latest thinking on housing and neigh-borhood design. Income mixing is a central feature ofmany HOPE VI sites. The expectation is that prop-erties that have to attract and retain higher-incometenants will be better managed and maintained overtime, and that a mix of income levels creates a health-ier social environment and brings better services—especially schools—to the surrounding neighborhood.Therefore, redeveloped sites typically combine publichousing units (with long-term, gap-filling subsidycommitments) with LIHTC units and market-raterental and for-sale housing. As a consequence, thetotal number of public housing units (affordable forthe poorest households) is usually smaller after re-development than before.
The new developments are leveraging substantialpublic, private, and philanthropic resources—resourcesthat were virtually absent (and, in some cases, pro-hibited) from former public housing developments.PHAs are also experimenting with a range of man-agement approaches: many have employed privateproperty management firms on site (and at risk) ratherthan relying on bureaucratic public agencies. And inmany cities, HOPE VI has led to new (and lasting)partnerships between PHAs, other city agencies, non-profit organizations, and private-sector leaders.
crime and joblessness and substantial increases inincome, property values, and market investment. Inseveral high-profile developments, HOPE VI invest-ments have been accompanied by significant improve-ments in the quality of the local school and theeducational performance of low-income children.With some of these findings, of course, cause andeffect are not entirely clear.
The quality of many of the new HOPE VI devel-opments appears to be helping catalyze significantimprovements in the surrounding neighborhoods.Case studies show substantial declines in neighborhood
Louisville’s Park DuValle involved active mayoralleadership from the outset, leveraged fundingfrom numerous sources, and ultimately engagedmultiple city agencies (as well as private investors)in reconfiguring streets; redeveloping parks, play-grounds, and community centers; reconstitutingpublic schools; and developing new retail shop-ping facilities.
Jefferson Elementary School (located near theMurphy Park housing project) was among theworst in St. Louis, but most children in the projectdid not attend it. Under a court-ordered deseg-regation plan, three-quarters of the neighborhoodchildren were bused to schools elsewhere in thecounty. After the public housing was demolishedand replaced, Jefferson Elementary reopened asa neighborhood-based school with a communityadvisory board that had the authority to hire theprincipal. It has seen significant gains in testscores and is now the school of choice for mostchildren living in the surrounding neighborhood,including those in the redeveloped public housing.It also serves as a neighborhood learning center,offering classes and activities for adults as well aschildren during evenings and weekends.
Relatively few of the original residents from“HOPE-VI’d” projects are returning to live in thenew mixed-income developments. Instead, most arerelocating with housing vouchers or to other, tradi-tional public housing developments. Several factorscontribute to the low rates of return among the orig-inal residents, including reductions in the total num-ber of public housing units, delays in the completionof the new developments, and tougher screeningcriteria and occupancy requirements for residents,but also satisfaction among many voucher recipientswith their private-market homes or apartments. Ingeneral, voucher relocatees enjoy better housing andneighborhood conditions than when they lived inpublic housing and are very satisfied. However, thereis no evidence that they are making significant progresstoward economic security or self-sufficiency. Andhouseholds relocated to other public housing proj-ects generally live in conditions that are as bad—orworse—than their original developments.19
Over the past 15 years, HOPE VI has invested$6.1 billion of federal funding for 235 projects, to

Federal Programs for Addressing Low-Income Housing Needs 11
demolish 96,200 public housing units and produce107,800 new or renovated housing units, 56,800of which will be affordable to the lowest-incomehouseholds (through September 2007, 88,100 unitshad been demolished but only 64,300 new units hadbeen constructed under the HOPE VI program).The Bush administration repeatedly proposed to endthe program, arguing that it is too costly and thatmost of the severely distressed stock has now beendemolished. Advocates for low-income householdshave been especially critical of the program becauseit has displaced original residents and reduced thetotal stock of housing with deep, project-based sub-sidies. Nonetheless, bipartisan congressional supporthas sustained the HOPE VI program, although atmuch lower levels of annual funding than duringearlier years.20
Legislation to reauthorize and revamp HOPE VIhas been under discussion for several years, and in Jan-uary 2008, the House of Representatives approvedthe HOPE VI Improvement and Reauthorization Actof 2007 (H.R. 3524). This bill calls for more help forfamilies using vouchers to relocate (especially thosewith serious personal and health problems), a contin-ued commitment to mixed-income redevelopment,full replacement of all public housing units demolishedwith either public housing or project-based vouchers,and production of some replacement housing in low-poverty areas (Sard and Staub 2008). The Senate ver-sion of reauthorization is similar in many respects, butit does not include the requirement that every unit ofpublic housing demolished must be replaced. Advo-cates for the extension of HOPE VI are divided aboutwhether the 100 percent replacement requirement isnecessary or whether it might make some redevelop-ment projects financially infeasible. As of September2008, HOPE VI reauthorization legislation is notexpected to be enacted in 2008 but will probably bereintroduced in the next Congress.
The Moving to Work demonstration (MTW)was enacted in 1996 to allow a limited number ofPHAs to experiment with “deregulation.” Morespecifically, selected PHAs could request waiversof federal statutes and rules governing both publichousing and vouchers in order to design and test newapproaches for reducing program costs, encouragingeconomic self-sufficiency of residents, and increasingthe housing choices of low-income families. Someparticipating PHAs were also granted the option of
pooling three major streams of funding from HUD—public housing operating funds, public housingmodernization funds, and voucher subsidy funding.
Currently, 27 PHAs participate in MTW.21 Manyhave experimented with strategies for encouragingwork and economic advancement among assistedhouseholds (including both public housing andvoucher families) by imposing work requirements,changing the way rent subsidies are calculated, andeven limiting the number of years a family can receiveassistance.22 Much of this experimentation reflectsan assumption that the standard subsidy calculation(which requires households to contribute 30 percentof their income toward rent) discourages work by“taxing” every additional dollar of income and bybuffering the effects of a drop in earnings. For exam-ple, several PHAs completely severed the link betweenincome and rent contribution, establishing flat rentsor “stepped rents,” whereby a household’s rent con-tribution is set at a flat amount in the first year and thenincreased by predetermined amounts on a schedulethat spans several years. Other PHAs continued tocalculate rent contributions as a percent of incomebut modified their procedures to delay rent increasesor exclude some income from the rent calculation.Many agencies required all households to pay a min-imum rent contribution, regardless of how low theirincomes fell, with minimum rents ranging from$25 to $200. And several PHAs required residents toengage in some kind of work or training activity asa condition of occupancy (Abravanel et al. 2004).
Eight PHAs actually imposed time limits onhousing assistance, arguing that this approach createsthe strongest possible incentive for residents toincrease their work effort and that it also spreads scarceassistance resources to more needy households overtime. The very limited information available about theeffects of these policies on residents suggests that theymotivated some but paralyzed others, and that manyfamilies lacked a clear understanding of what it wouldtake to be able to afford housing in the private mar-ket (Miller et al. 2007).
Unfortunately, although a considerable amount isnow known about what PHAs did with the flexibilityallowed under MTW, almost nothing is known aboutwhether they produced better (or perhaps worse)outcomes for families than standard federal poli-cies. Although MTW is called a demonstration, itwas neither designed nor implemented with rigorous

12 A P O L I C Y P R I M E R
evaluation as an objective so outcomes and impactsof new procedures could credibly be determined.An assessment of the first group of participating sitesfound some evidence of increased employment andrising incomes among affected residents (and no evi-dence of extreme hardship). Interestingly, however,there was no clear relationship between the typesof work incentives and supports introduced and themagnitude of employment gains. This raises ques-tions about whether the employment gains could beattributed to the policy changes, but it also suggeststhat any policies and practices that encourage resi-dents to find and keep jobs have at least some effect(Abravanel et al. 2004).
Provisions that would substantially expand Mov-ing to Work were passed by the House of Represen-tatives in 2007 as part of a larger bill (H.R. 1851)focusing on reforms to the voucher program. Specifi-cally, the House bill would rename MTW the Hous-ing Innovation Program and allow up to 80 PHAs toparticipate, still without any systematic data collectionor rigorous evaluation (Fischer and Sard 2008). Par-allel legislation introduced in the Senate did notinclude this provision. Although the voucher reformlegislation is not expected to be enacted in 2008,pressure from PHAs to expand MTW are likely tocontinue. Some advocacy organizations oppose theexpansion of MTW on the grounds that it putsvulnerable residents at risk of hardship and even dis-placement and that the experimentation by PHAs isunmonitored and unevaluated. They argue that, ifMTW is expanded, the number of PHAs authorizedto participate should be smaller, and more rigorousevaluation should be mandated.
Critical Policy Challenges and Choices
Until the onset of current foreclosure crisis, hous-ing received scant attention on the domestic policyagenda. Even today, the problems of housing avail-ability, adequacy, and affordability facing low-incomerenters are largely neglected. Increasingly, however,practitioners, policymakers, and advocates outsidetraditional housing policy circles are recognizing thatdecent and affordable rental housing is a key ingre-dient essential to other priority goals, including fam-ily economic success, children’s well-being, smartgrowth, and equitable development.
As a consequence, some local and state govern-ments are taking steps to boost incomes among low-wage workers (so more working families can affordprevailing rent levels), address the regulatory barriersthat stand in the way of rental housing production,and raise new funds to subsidize affordable rentalhousing (Katz and Turner 2008). On the income side,a growing number of states are enacting minimumwages higher than the federal standard, some of themsignificantly so.23 And many now have their ownearned income tax credit programs, which—like thefederal program—supplement the incomes of workerswith a refundable year-end tax credit (Nagle andJohnson 2006). On the regulatory side, more than130 localities nationwide have taken steps to man-date the production of affordable housing throughinclusionary zoning ordinances.24 And on the sub-sidy side, 37 states and more than 350 counties andcities have established dedicated sources of publicrevenue (like taxes and fees) to create housing trustfunds for the production and preservation of afford-able housing (Goodno 2002). All these state andlocal initiatives have value, but their potential impactis limited in the absence of federal policy leadership.
New Vision for Federal Housing Policy
Federal rental housing programs can claim creditfor some important accomplishments, but they nowsuffer from serious failures of design, scale, and imple-mentation. Their most significant shortcoming isreflected in the widening gap between housing needsand subsidy resources. In addition, programs thatproduce new rental housing continue to focus oninner-city neighborhoods—further concentratingpoverty rather than expanding access to opportunity.And the federal government offers few incentives forstates and localities to remove the regulatory barriersthat raise housing production costs and distort thelocation of affordable rental housing.
No one level of government can tackle today’scomplex rental housing challenges on its own. But ameaningful strategy would have to start with a morevigorous and systematic federal role, because only thefederal government has the fiscal capacity to addressthe consequences of stagnant wage growth and incomeinequality nationwide. As long as incomes for a sub-stantial segment of the population fall short of whatit takes to cover the costs of producing and operating

Federal Programs for Addressing Low-Income Housing Needs 13
adequate housing, state and local governments sim-ply cannot afford to close the affordability gap forenough households. Therefore, federal policies shouldexpand assistance that addresses the demand side ofthe housing affordability equation—using such toolsas a higher minimum wage, supplements to the earnedincome tax credit, and an expanded housing voucherprogram—so more low-income households havesufficient income to make adequate housing afford-able (Acs and Turner 2008; Dreier 2007; Katz andTurner 2008). Then, state and local jurisdictionscould assume lead responsibility for the remaining,supply-side challenges, providing both regulatory andfinancial inducements for private-market actors (bothfor-profit and nonprofit) to produce and maintainmoderately priced rental housing.
Under this basic framework, the federal govern-ment would still have to create incentives for statesand local jurisdictions to reduce regulatory barriersthat unnecessarily constrain supply and inflate costs.One possible strategy would be to require existingmetropolitan planning organizations (MPOs) to pre-pare regional housing strategies that complementthe regional transportation plans already mandatedby federal law. Local jurisdictions could then berequired to align their expenditures of federal blockgrant funds and their use of LIHTC with theseregional strategies (Katz and Turner 2008).
This vision has not yet garnered wide attention ordiscussion, although it may provide a framework fordebate if a new federal administration focuses seriousattention on the problem of rental housing afford-ability. And whether or not federal policies begin tomove in this direction, major questions remain abouthow existing programs and resources might play amore constructive role in the well-being of assistedfamilies and the vitality of communities. Local practi-tioners, advocates, and philanthropies are increasinglyinterested in exploring strategies that link housingassistance with other high-priority social goals, includ-ing work and earnings, children’s well-being, andenvironmental sustainability.
Housing Assistance and Family Economic Success
A growing body of evidence suggests that living indecent, affordable housing may provide a “platform”from which low-income families can get jobs, build
their incomes, and achieve financial security. Simplyliving in decent, affordable housing constitutes a criti-cal support for work because families living in un-affordable housing are financially insecure, vulnerableto unexpected increases in other costs, and more likelyto move frequently (Mills et al. 2006). This insecuritymay make it more difficult for them to get and keepjobs, work extra hours, or advance to higher wages. Inaddition, the extra income freed up when housing isaffordable may enable families to pay for reliable childcare, transportation to a better job, additional training,or professional clothing—all investments that canenhance employment success. Several recent studiessuggest that people who receive assistance to maketheir housing costs affordable are more likely to bene-fit from workforce or welfare-to-work programs thanpeople without assistance. Thus, affordable housingmay buttress social programs that encourage work andself-sufficiency (Newman and Harkness 2006; Sardand Lubell 2000; Sard and Springer 2002; Sard andWaller 2002). To date, however, there is no evidencethat housing assistance alone leads to greater employ-ment or higher incomes (Mills et al. 2006).
Variations in the design and implementation ofrental assistance programs can enhance their impacton employment and incomes among recipients. TheJobs-Plus Initiative rigorously tested the effective-ness of saturating a public housing development withhigh-quality work supports and changing rent rulesand subsidy formulas to encourage work. Residentearnings rose significantly (compared with residentsliving in comparable public housing developments)from a combination of higher employment ratesand higher wages (Bloom, Riccio, and Verma 2005;Turner and Rawlings 2005). As discussed earlier,PHAs participating in the MTW initiative have alsoexperimented with changes in rent rules, occupancyrequirements, and support services, but insufficientresearch has been conducted to rigorously assess theeffectiveness of these efforts. If MTW is continuedor expanded, adding a rigorous evaluation mandatecould provide a valuable opportunity to learn moreabout what works in this area.
PHAs have traditionally played a very limitedrole in providing supportive services, even thoughtheir residents have some of the greatest serviceneeds of any group in the United States. Many pub-lic housing officials argue that their job is to providedecent housing and that is all they have been funded

14 A P O L I C Y P R I M E R
to do. In principle, PHAs can use part of theiradministrative budgets for services, but their posi-tion has been that the size of those budgets is insuf-ficient to cover their costs in housing management,let alone take on a broader service agenda. Accord-ingly, most services that have been provided havebeen funded through special programs. Importantexamples in the early 1990s were the Drug Elimi-nation Program (now discontinued) and Family Self-Sufficiency, which has operated primarily in thevoucher program.
The Family Self-Sufficiency (FSS) program pro-vides case management that arranges for servicesaimed primarily to help participants find jobs, buildassets, clean up credit histories, and take other stepsto increase their incomes. Participants also have thechance to build savings as their incomes increase.Specifically, their rents go up with their incomes, butthe program places the additional amounts they owein rent into an escrow account for their benefit. Theycan access the funds only after they have successfullygraduated from the program. At least 75,000 house-holds participate in FSS; 67,500 in the voucher pro-gram and 7,500 in public housing. HUD fundingcompensates PHAs for the amounts placed in escrowand provides about $48 million annually for FSScoordinators. And voucher recipients who receiveemployment counseling and case management servicesunder the Family Self-Sufficiency program appear toachieve significant employment and earnings gains(Lubell 2008). Working with HUD or with individ-ual PHAs to identify and implement best practicesin the FSS program could improve outcomes forvoucher families.
Because of its visibility, HOPE VI highlightedthe service needs of the troubled original residentswho had to be relocated. Funding was provided toaddress the need in HOPE VI project budgets, butthis was a new venture for most housing authorities,and the results were mixed at best (Popkin et al. 2004).Still, the HOPE VI experience broadened recogni-tion of the need, particularly for services oriented to“helping families move to self-sufficiency.” Congressexplicitly endorsed this theme in its landmark QualityHousing and Work Responsibility Act of 1998 andauthorized a new grant program, Resident Oppor-tunities for Supportive Services (ROSS) (Solomon2005).
ROSS funding covers several programmatic com-ponents, including an FSS-like program for publichousing residents. However, appropriations have thusfar been quite small (under $50 million annually).25
HUD’s current strategy recognizes that it is unlikelythat funds for all service needs for public housing res-idents will (or should) flow through the HUD budget.Rather, the emphasis should be on using HUD fundsprimarily to hire ROSS service coordinators who willin turn arrange for appropriate packages of serviceswith existing local providers. The services should“enable participating families to increase earnedincome, reduce or eliminate the need for welfareassistance, make progress toward achieving economicself-sufficiency, or, in the case of elderly and disabledresidents, help improve living conditions and enableresidents to age in place.”26 If ROSS is sustained andexpanded, it may offer an opportunity for new localpartnerships that more effectively link public hous-ing residents with high-quality services. The successof this kind of linking strategy depends, however, onthe availability and quality of local services.
Some research suggests that, over time, employ-ment and earnings may increase among familieswho receive a housing vouchers plus housing searchassistance to help them move from high-poverty,distressed neighborhoods to communities of opportu-nity. Over the long term, participants in the ChicagoGautreaux demonstration who moved to majority-white, resource-rich communities in the suburbswere more likely to work, earned more, and wereless reliant on public assistance than similar familieswho remained in city neighborhoods. However,the Moving to Opportunity (MTO) demonstration,which more rigorously tests the impacts of moving
A family with an income of $500 a month pays$150 in rent to live in public housing or a rental unitassisted by a voucher. If the family’s income risesto $750 a month, the monthly rent obligationwould increase to $225. An FSS participantwould still have to pay $225 in rent, but the $75 increase would be deposited each month inan escrow account. If the family maintained thislevel of earnings, its account would have a bal-ance of at least $4,500 after five years. Familiesreceive the full value of their escrow accountsupon successful completion of their FSS actionplan (Cramer 2004).

Federal Programs for Addressing Low-Income Housing Needs 15
out of high-poverty neighborhoods in five cities,so far finds no effects on employment or earnings(Cove et al. 2008). This may be because most MTOfamilies moved to low-poverty central-city jurisdic-tions rather than to job-rich suburban communities,or because few remained in their new neighborhoodslong enough to benefit.27 Future efforts to promoteeconomic success among voucher families shouldfocus on helping them move to locations that offergood access to jobs, supplementing mobility assis-tance with employment counseling and work supports(potentially using FSS resources), and (in MTW sites)experimenting with modifications to the vouchersubsidy formula to explicitly reward work and earn-ings gains.
Housing Assistance and the Well-Being of Poor Children
There are good reasons to think that living in assistedhousing should contribute to improved outcomesfor children in low-income families. In particular,affordable rent payments should increase a family’sresidential stability, reducing the frequency of in-voluntary moves, evictions, and homelessness; res-idential instability is known to undermine children’swell-being (Lovell and Isaacs 2008; Rhodes 2005;Rumberger 2003). And spending less for housing mayenable families to spend more of their very limitedbudgets on food and other necessities for their chil-dren. Indeed, recent evidence confirms that vouchersreduce the likelihood that welfare families will doubleup or experience homelessness and increase familyexpenditures for food (Mills et al. 2006). However,there is no convincing evidence that housing assis-tance alone improves (or undermines) children’seducational success (Mills et al. 2006; Newman andHarkness 2000).
One likely explanation is that the effects of hous-ing assistance on children’s well-being depend uponthe characteristics of the neighborhood where thehousing assistance is provided. Living in public orassisted housing in a distressed neighborhood, withhigh rates of crime and violence and failing schools,probably undermines outcomes for children (Ellenand Turner 1997), while receiving a voucher or liv-ing in an affordable apartment in a safe, well-servedneighborhood may enhance children’s chances forsuccess. Gautreaux research found striking benefits
for children whose families used vouchers to movefrom central-city Chicago to suburban neighbor-hoods. Children were substantially more likely tocomplete high school, take college-track courses,attend college, and enter the workforce than chil-dren from similar families who moved to neighbor-hoods within Chicago (Rosenbaum 1995).
MTO families moved to dramatically safer neigh-borhoods than their original public housing projects,and both mothers and girls are enjoying improvedmental and physical health as a result.28 In addition,moving to a lower-poverty environment appears tohave reduced crime, delinquency, and risky behavioramong teenage girls, though not among boys. Todate, however, there is no evidence that MTO moveshave led to better educational outcomes, possiblybecause so few children are attending significantlybetter schools (Turner and Briggs 2008). Thesefindings suggest that it makes sense to expand themobility counseling and search assistance that encour-ages voucher recipients to move to opportunity-richneighborhoods, but that future mobility initiativesshould focus more explicitly on helping families find,move to, and remain in neighborhoods where thepublic schools are high performing. In addition,service providers should look for ways to help boysadapt successfully to their new neighborhoods, help-ing them overcome the social, emotional, and insti-tutional barriers that stand in their way.
One little-known program explicitly targetshousing assistance to support children’s welfare. TheFamily Unification Program (FUP), launched in 1992,provides special housing vouchers (plus supportiveservices) targeted to prevent children from enteringor remaining in foster care unnecessarily on accountof their families’ housing problems, and to remedythe potential homelessness of children leaving fostercare upon reaching their 18th birthday. Under theprogram, federal funds are competitively awarded tolocal partnerships, consisting of PHAs that providethe vouchers and child welfare agencies that providecase management services. The program is small,totaling only 39,191 vouchers nationwide. Proponentsof the program argue that the cost of foster care farexceeds the cost of housing vouchers, and evidencesuggest that most families that received FUP assistancewere able to remain together.29 In 2008, Congressappropriated $20 million for approximately 2,800 newFUP vouchers.

16 A P O L I C Y P R I M E R
Housing Assistance and Vulnerable,Multi-Problem Families
Some households that rely upon federal housingassistance face serious personal or family challengesthat stand in the way of their long-term stability andadvancement. These include physical and mentaldisabilities, chronic health problems, substance abuse,and criminal records. In a multiyear study of fiveHOPE VI projects, almost half of all the original res-idents had one or more problems that made them“hard to house.” Specifically, 9 percent were elderlywith no children, 30 percent were either disabledor included grandparents with children, 12 percentwere “multi-problem” families (unemployed, no highschool diploma, drug or alcohol problem), and 5 per-cent were large families (who needed apartments withfour or more bedrooms). These categories overlap,so altogether, 48 percent of the original householdsacross the five study sites (and at least 40 percent ineach of the individual sites) fell into one or more ofthese groups (Cunningham, Popkin, and Burt 2005).The share of hard-to-house families in less distressedpublic and assisted housing developments is prob-ably lower.
Clearly, the service needs of these vulnerablefamilies vary dramatically. Work linkage services arelikely inappropriate for the elderly or for many dis-abled adults who need more in the way of healthcare. Younger families with children (probably thebulk of the 12 percent multi-problem group) needservices that will help them stabilize their lives, pro-vide a secure environment for their children, andprepare to engage in at least some work. Trying topush them too quickly toward self-sufficiency couldbe counterproductive. In addition, these householdsmay have difficulty using vouchers to relocate iftheir public housing projects are demolished.
For similar households that have experiencedepisodes of homelessness, permanent supportive hous-ing offers a promising solution (Bassuk et al. 2006).An exploratory pilot project is under way in Chicagoto test the efficacy of providing intensive supportservices in conjunction with vouchers for hard-to-house families being relocated from public housing(Popkin et al. 2008). PHAs will almost certainly needextra resources and well-qualified partners in orderto craft and implement strategies to more effectivelyserve these most vulnerable residents, which could
include expanded services delivered to residents ofexisting projects, enhanced housing vouchers, andthe development of smaller supportive housing devel-opments in conjunction with HOPE VI.
Assisted Housing and ResponsibleNeighborhood Redevelopment
At its inception, public housing was intended not onlyto provide decent and affordable housing for low-income families, but also to eliminate slums and blight,thereby helping to revitalize ailing central cities. Dur-ing the 1960s and ’70s, public housing construction inmany cities went hand in hand with “slum clearance”and urban renewal. Large tracts of rundown housing(mostly in black neighborhoods) were demolished,and displaced residents were relocated to new publichousing projects, often in distant neighborhoods.
These policies have geographically isolated poorfamilies—particularly poor minorities.30 Large sub-sidized housing projects, earmarked exclusively foroccupancy by low-income families, exacerbated pre-vailing patterns of racial segregation, redlining, andwhite flight. And as years passed, poor management,physical deterioration, and runaway crime fed a down-ward spiral of disinvestment and distress in the sur-rounding neighborhoods. One key lesson from thishistory is that building more affordable housing—even high-quality affordable housing—in distressedneighborhoods does not constitute an effectiveneighborhood revitalization strategy.
On the other hand, the HOPE VI experiencedemonstrates that redeveloping distressed publichousing can play a critical role in restoring neighbor-hoods, catalyzing revitalization, and strengtheningthe health of cities. To date, HOPE VI projects havesignificantly reduced concentrations of poverty andcrime in the surrounding neighborhoods, replacedpoorly designed and obsolete structures with high-quality housing that harmonizes with the local archi-tecture, and created communities that serve a mix ofincome levels. In many instances, HOPE VI has beencreatively linked with other public- and private-sectorinvestments so redevelopment extends beyond theimmediate public housing site to upgrade streets andsidewalks, parks, community centers, recreationalfacilities, and public schools.
These investments appear to have helped catalyzereal market turnarounds in central-city neighborhoods

Federal Programs for Addressing Low-Income Housing Needs 17
that had long been given up as hopelessly distressed.Middle- and high-income households—includinghomebuyers—are moving in, market rents and salesprices are rising, and new private-sector investmentin both homes and retail businesses is taking root.However, the magnitude of these neighborhoodimprovements varies widely across sites and, unfortu-nately, not enough research has rigorously addressedthe issue of neighborhood impacts to pinpoint thedeterminants of success. Based on research to date,cities should choose sites for redevelopment wherethe blighting effect of distressed public housing issubstantial, and where conditions seem ripe for achiev-ing spillover benefits. And public housing redevel-opment should be implemented in conjunction withother city investments to capitalize on locational andmarket assets and opportunities. In addition, citiesshould begin experimenting with innovative strategiesfor deconcentrating high-poverty projects that donot necessarily require demolition and replacement,possibly using a combination of income mixing andnew acquisition.
In communities where the housing market ishot—with low vacancy rates and rapidly rising rents—the resurgence of housing demand in a HOPE VIneighborhood may trigger runaway gentrification.Unless deeply subsidized housing units are replaced(either in the redeveloped neighborhood or inother desirable locations), rents in previously afford-able neighborhoods climb out of reach for all butthe most affluent, voucher recipients have difficulty
using their assistance, and an opportunity to achievemeaningful income mixing may be lost. There-fore, the redevelopment of distressed public andassisted housing projects can and should be moreeffectively linked to a larger affordable housingstrategy that expands the availability of low-rentoptions in healthy neighborhoods throughout thecity, using tools such as inclusionary zoning, LIHTCs,HOME and local affordable housing trust fundresources, project-based vouchers, and vouchermobility counseling.
Housing Assistance, Smart Growth,and Environmentally SustainableDevelopment
Historically, policies focused on producing affordablerental housing have paid little attention to environ-mental impacts. However, the clustering of affordablerental housing in central cities contributes to sprawl-ing development patterns on the fringes of manyAmerican metropolitan areas, as middle- and upper-income households—seeking to distance themselvesfrom poverty and distress—move to the outer suburbsand beyond, thus fueling new residential develop-ment on the urban fringe. These sprawling patternsof development yield a host of adverse environmentalconsequences (Katz and Turner 2008).
Thus, efforts to redevelop distressed public hous-ing, create viable mixed-income communities incentral-city neighborhoods, and incorporate afford-able housing into healthy communities throughoutmetropolitan regions all have the potential to con-tribute to larger, smart growth strategies. But policiesthat enable or encourage low-income families tomove to opportunity-rich neighborhoods sometimesgenerate opposition from receiving neighborhoods,because of fears that newcomers may undermine thequality of life there. Some research has raised con-cerns about possible negative effects of subsidizedhousing—for example, where poorly managed build-ings are located in high-value neighborhoods. How-ever, the most careful research conducted to datefinds that smaller-scale, better designed, and bettermanaged subsidized housing does not lead to neigh-borhood decline or resegregation and, indeed, cancontribute to neighborhood upgrading. In contrast,subsidized housing clustered in lower-cost, higher-poverty, minority neighborhoods can be detrimen-
In the neighborhoods surrounding four highlyregarded public housing redevelopment projects,median household incomes and workforce partic-ipation rates rose dramatically, reflecting an influxof higher-income, working people. The market-rate housing successfully attracted and retainedboth renters and homebuyers with choices, andincreases in rents over time indicate that marketdemand is robust. As a result, new, unsubsidizedinvestment is now under way in the surround-ing neighborhoods. For example, once Atlanta’sCentennial Place attracted market-rate renters,developers began investing in loft conversionsand condominium developments nearby, bringingsignificant home ownership back to the neighbor-hood (Turbov and Piper 2005).

18 A P O L I C Y P R I M E R
tal to the receiving communities (Galster, Tatian,and Smith 1999). Therefore, building local partner-ships between advocates for affordable housing andsmart growth, and working together to overcomefears and prejudices about subsidized housing, canhelp expand affordable housing options and combatsprawl.
In addition to mixed income strategies, someaffordable housing developers are explicitly focusingon tools and incentives for incorporating principlesof energy efficiency, conservation, and environmentalsustainability into new projects. Enterprise Commu-nity Partners has led an effort to establish criteria for“green” affordable housing and has created a programof grants and low-interest loans to help offset theadditional development costs associated with meetingthese criteria.31
* * * * *
Many people who are unfamiliar with federal hous-ing programs find their complexity, high cost, anduneven performance daunting, and they may concludethat little can be done to address the limitations ofexisting programs, improve outcomes for householdsalready served, or expand housing help to a largershare of needy families. We hope this primer helpsclarify the policy landscape and highlights opportu-nities for constructive engagement. Such engagementcan occur at many different scales: targeting sup-plemental services and opportunities to residents ofparticular subsidized projects; helping voucher re-cipients make the best possible choices about whereto relocate; expanding the stock of affordable hous-ing options in opportunity-rich or revitalizing neigh-borhoods; promoting regionwide strategies for smart,sustainable, and affordable growth; and perhaps evenreinventing the federal role in meeting the nation’slow-income housing needs.

Federal Programs for Addressing Low-Income Housing Needs 19
Notes
1. For an excellent and more comprehensive historyof both rental and home ownership policies inthe United States, see Schwartz (2006).
2. The federal government also provides funding tosupport emergency shelters, transitional housing,and permanent supportive housing for homelessindividuals and families. These programs arenot covered here. For an excellent overview, seeNational Alliance to End Homelessness (2007).
3. Initially, the federal government only providedfunding for the capital costs of public housing.Operating subsidies were added in the 1960swhen federal legislation (the Brooke Amend-ment) limited tenant rent payments to 25 percentof their income (later increased to 30 percent)and it became clear that these payments were notsufficient to cover the costs of operating publichousing.
4. PHAs are authorized to commit up to 20 percentof the tenant-based vouchers they administer toprojects—in effect converting them into project-based subsidies.
5. Resources for this new Trust Fund would comefrom the profits of two government-sponsoredfinancial intermediaries (Fannie Mae and FreddieMac), and therefore will not be subject to annualappropriations. It is unclear how the recent fed-eral takeover of Fannie Mae and Freddie Macmay affect this arrangement.
6. 2005 is the last year for which comprehensivedata on housing problems and needs are reportedby HUD (see U.S. Department of Housing andUrban Development 2007a). A similar reportwith 2007 data is expected to be published in2009.
7. HUD classifies a household’s income in relationto the median income for the local housing mar-ket area (an approach considered more equitablethan the federal poverty standard since it roughlytakes differences in costs of living into account).According to HUD definitions, low-income isless than 80 percent of median, very low incomeis less than 50 percent of median, and extremelylow income is less than 30 percent of median.
8. Appendix table A1 shows that 16 percent of allU.S. households fall in the extremely low incomegroup, very close to the 14 percent of all house-
holds that fall below the federal poverty level.The table also shows that 29 percent are in thevery low income group (below 50 percent ofmedian), fairly close to the 32 percent nationalshare below 200 percent of the poverty level.
9. These numbers are from HUD’s authoritativereport to Congress on “Assisted Units underLease” (HUD 2007b).
10. This discrepancy has always plagued HUDassessments, but it does not lead to any major dif-ference in interpretation.
11. No national data are available on the character-istics of households served by the LIHTC andother shallow subsidy programs.
12. This program is discussed in more detail later inthis paper.
13. Estimates from Sard (2008).14. The 1993 figure is from HUD (1997b). The
2007 figure is from HUD (2007b).15. Production under most of these programs
was terminated during the early years of theReagan administration. However, a very smallnumber of projects earmarked for the elderlyand disabled have been funded over the inter-vening years.
16. There has been no recent comprehensive reviewof where housing assistance recipients are located,but a mid-1990s database developed by Newmanand Schnare (1997) still offers a helpful pictureof basic locational patterns for the older pro-grams. See also HUD (1997a) and Kingsley andTatian (1999).
17. Some PHAs also own and operate projectsfinanced with state or local resources and, as dis-cussed further below, some now compete forand receive LIHTC allocations.
18. The HOME program also allows local jurisdic-tions to join together to form consortia, whichmay then qualify for formula funding.
19. These families and individuals include a dis-proportionate share with multiple health andpersonal problems, who were unable to relocatewith vouchers.
20. For 2008, HOPE VI was funded at $100 million,compared with $625 million in 1999 (Sard andStaub 2008).
21. These PHAs are Atlanta, GA; Baltimore, MD;Cambridge, MA; Charlotte, NC; Chicago, IL;Delaware (state); District of Columbia; Greene,OH (metropolitan area); High Point, NC; Keene,

20 A P O L I C Y P R I M E R
NH; King County, WA; Lawrence-DouglasCounty, KS; Lincoln, NE; Louisville, KY (metro-politan area); Massachusetts (state); Minneapolis,MN; New Haven, CT; Oakland, CA; Philadel-phia, PA; Pittsburgh, PA; Portage, OH; Portland,OR; San Antonio, TX; San Diego, CA; SanJose, CA; San Mateo County, CA; Santa ClaraCounty, CA; Seattle, WA; Tulare County, CA;and Vancouver, WA.
22. Elderly and disabled residents are not subject tothese changes.
23. The Department of Labor maintains a currentlist of minimum wage laws in each state at http://www.dol.gov/esa/minwage/america.htm.
24. The first such ordinance was passed in Mont-gomery County, Maryland, in the mid-1970s.Today, around 5 percent of the U.S. populationlives in communities that require affordablehousing to be built in any new development.Over 100 of these localities are in California,with most of the others clustered around Bostonand Washington, D.C.
25. The FY 2004 budget for the ROSS programprovided $16 million for services for families,$11.4 million for services for the elderly andpersons with disabilities, $13.2 million for services
to promote home ownership, and $16 millionfor FSS coordinators to serve public housingresidents.
26. Solomon (2005), 47. Also see http://www.hud.gov/offices/pih/programs/ph/ross/about.cfm.
27. For a more complete explanation of theGautreaux and MTO experiments and discus-sion of their differing results, see Turner andBriggs (2008).
28. Mother’s mental health is a critical determinantof healthy development for young children(Hayes et al. 2001; Martins and Gaffan 2000;Olfson et al. 2003). Thus, it is possible thatimprovements in mental health among mothersand adolescent girls will translate into significantlyimproved child well-being over the long term.
29. See Child Welfare League of America, “FamilyUnification Program FAQ,” http://www.cwla.org/PROGRAMS/HOUSING/FUPfaq.htm(accessed August 2008).
30. This isolation was intensified by federal poli-cies that targeted scarce public housing resourcesto the neediest households on the waiting list,significantly reducing the number of moderate-income working families living in public housing.
31. See http://www.greencommunitiesonline.org.
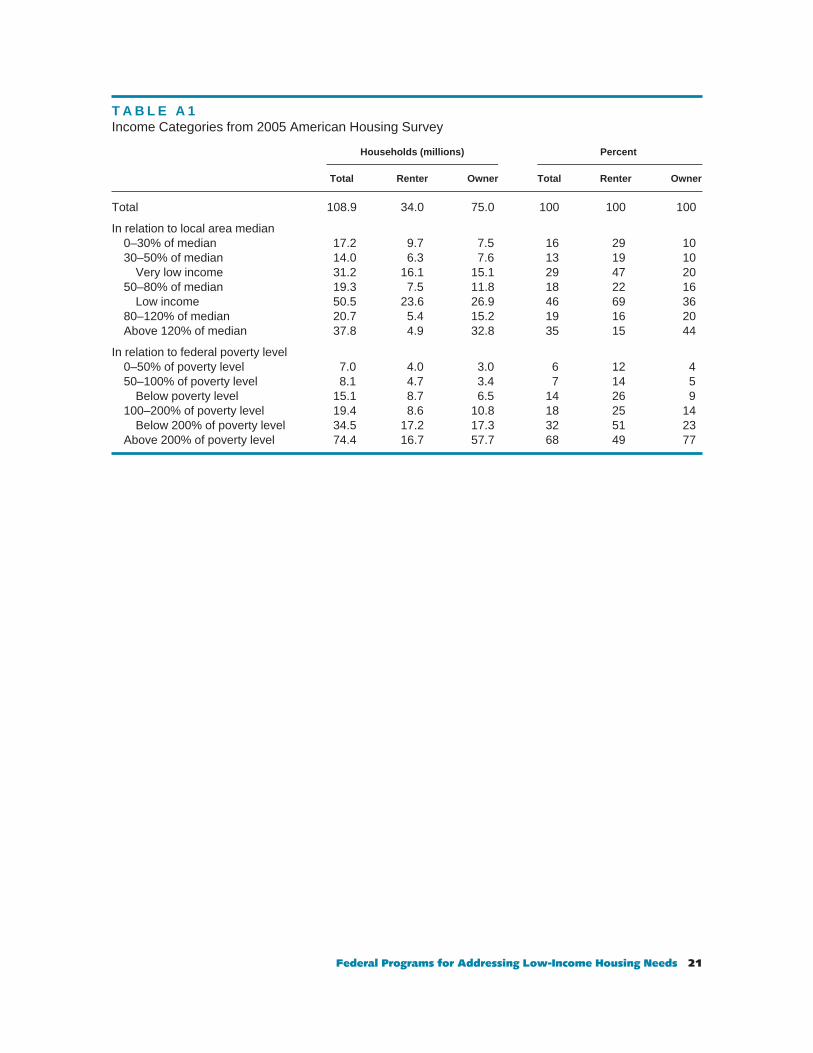
Federal Programs for Addressing Low-Income Housing Needs 21
T A B L E A 1Income Categories from 2005 American Housing Survey
Households (millions) Percent
Total Renter Owner Total Renter Owner
Total 108.9 34.0 75.0 100 100 100
In relation to local area median0–30% of median 17.2 9.7 7.5 16 29 1030–50% of median 14.0 6.3 7.6 13 19 10
Very low income 31.2 16.1 15.1 29 47 2050–80% of median 19.3 7.5 11.8 18 22 16
Low income 50.5 23.6 26.9 46 69 3680–120% of median 20.7 5.4 15.2 19 16 20Above 120% of median 37.8 4.9 32.8 35 15 44
In relation to federal poverty level0–50% of poverty level 7.0 4.0 3.0 6 12 450–100% of poverty level 8.1 4.7 3.4 7 14 5
Below poverty level 15.1 8.7 6.5 14 26 9100–200% of poverty level 19.4 8.6 10.8 18 25 14
Below 200% of poverty level 34.5 17.2 17.3 32 51 23Above 200% of poverty level 74.4 16.7 57.7 68 49 77


Federal Programs for Addressing Low-Income Housing Needs 23
Abravanel, Martin D., Robin E. Smith, MargeryAustin Turner, Elizabeth Cove, Laura Harris, andCarlos A. Manjarrez. 2004. Testing Public HousingDeregulation: A Summary Assessment of HUD’s‘Moving to Work’ Demonstration. Washington, DC:The Urban Institute.
Acs, Gregory, and Margery Austin Turner. 2008.Making Work Pay Enough: A Decent Standard ofLiving for Working Families. Washington, DC:The Urban Institute.
Bassuk, Ellen L., Nicholas Huntington, Cheryl H.Amey, and Kim Lampereur. 2006. Family Perma-nent Supportive Housing—Preliminary Research onFamily Characteristics, Program Models, and Out-comes. Washington, DC: The National Centeron Family Homelessness.
Bloom, Howard S., James A. Riccio, and NanditaVerma. 2005. Promoting Work in Public Housing:The Effectiveness of Jobs-Plus. New York: MDRC.
Cove, Elizabeth, Margery Austin Turner, Xavier deSouza Briggs, and Cynthia Duarte. 2008. “CanEscaping from Poor Neighborhoods IncreaseEmployment and Earnings?” Three-City Studyof MTO Brief 4. Washington, DC: The UrbanInstitute.
Cramer, Reid. 2004. “Family Self-Sufficiency Pro-gram: An Asset-Building Opportunity.” Shelter-force #137 (September/October).
Cunningham, Mary K., Susan J. Popkin, andMartha R. Burt. 2005. “Public Housing Trans-formation and the ‘Hard to House.’ ” A RoofOver Their Heads Brief 9. Washington DC: TheUrban Institute.
Dreier, Peter. 2007. “Housing the Working Poor.”Shelterforce Fall.
Ellen, Ingrid Gould, and Margery Austin Turner.1997. “Does Neighborhood Matter? Assessing
Recent Evidence.” Housing Policy Debate 8(4):833–66.
Fischer, Will, and Barbara Sard. 2008. “Senate BillWould Update and Streamline HousingVoucher Program.” Washington, DC: Centeron Budget and Policy Priorities.
Freeman, Lance. 2004. “Siting Affordable Housing:Location and Neighborhood Trends of Low-Income Housing Tax Credit Developments inthe 1990s.” Washington, DC: The BrookingsInstitution.
Galster, George C., Peter Tatian, and Robin Smith.1999. “The Impact of Neighbors Who UseSection 8 Certificates on Property Values.”Housing Policy Debate 10(4): 879–917.
Goodno, James B. 2002. “Affordable Housing:Who Pays Now?” Planning November.
Hay, Dale F., Paul Asten, Alice Mills, R. Kuman,Susan Pawlby, and Deborah Sharp. 2001.“Intellectual Problems Shown by 11-Year-OldChildren Whose Mothers Had Postnatal De-pression.” Journal of Child Psychology and Psychia-try and Allied Disciplines 42:871–89.
Holin, Mary Joel, Larry Buron, Gretchen Locke,and Alvaro Cortes. 2003. Interim Assessment ofthe HOPE VI Program: Cross-Site Report. Cam-bridge, MA: Abt Associates.
Katz, Bruce, and Margery Austin Turner. 2008.“Rethinking U.S. Rental Housing Policy: ANew Blueprint for Federal, State and LocalAction.” In Revisiting Rental Housing, edited byNicolas P. Retsinas and Eric S. Belsky (319–58).Washington, DC: Brookings Institution Press.
Kingsley, G. Thomas, and Peter A. Tatian. 1999.“Housing and Welfare Reform: GeographyMatters.” In The Home Front: Implications of Wel-fare Reform for Housing Policy, edited by Sandra J.
References

24 A P O L I C Y P R I M E R
Newman (81–122). Washington, DC: UrbanInstitute Press.
Lovell, Phillip, and Julia Isaacs. 2008. “The Impactof the Mortgage Crisis on Children and TheirEducation.” First Focus April.
Lubell, Jeffrey. 2008. “Opportunities for FES/AECFto Strengthen Public Housing Families.” Wash-ington, DC: Center for Housing Policy.
Martins, Carla, and E. A. Gaffan. 2000. “Effects ofEarly Maternal Depression on Patterns of Infant–Mother Attachment: A Meta-analytic Investi-gation.” Journal of Child Psychology and Psychiatryand Allied Disciplines 41:737–46.
Miller, Robert, Helene Berlin, Maria-Alica New-some, Lipi Saikia, Martin D. Abravanel, Eliza-beth C. Cove, Carlos Manjarrez, and Robin E.Smith. 2007. The Experiences of Public HousingAgencies that Established Time Limit Policies underthe MTW Demonstration. Chicago: Applied RealEstate Analysis, Inc.
Mills, Gregory, Daniel Gubits, Larry Orr, David Long,Judie Feins, Bulbul Kaul, Michelle Wood, andAmy Jones. 2006. Effects of Housing Vouchers onWelfare Families. Washington, DC: U.S. Depart-ment of Housing and Urban Development.
Nagle, Ami, and Nicholas Johnson. 2006. “A HandUp: How State Earned Income Tax Credits HelpWorking Families Escape Poverty in 2006.”Washington, DC: Center for Budget and PolicyPriorities. http://www.cbpp.org/3-8-06sfp.htm.
National Alliance to End Homelessness. 2007. PolicyGuide. Washington, DC: National Alliance toEnd Homelessness. http://www.endhomelessness.org/content/general/detail/1723.
Newman, Sandra, and Joseph Harkness. 2000.“Assisted Housing and the Educational Attain-ment of Children.” Journal of Housing Economics9(1-2): 40–63.
Newman, Sandra J., and Ann B. Schnare. 1997.“ ‘. . . And a Suitable Living Environment’: TheFailure of Housing Programs to Deliver onNeighborhood Quality.” Housing Policy Debate8(4): 703–42.
Olfson, Mark, Steven C. Marcus, Benjamin Druss,Harold Alan Pincus, and Myrna Weissman. 2003.“Parental Depression, Child Mental Health Prob-lems, and Health Care Utilization.” Medical Care41(6): 716–21.
Popkin, Susan J., Bruce Katz, Mary K. Cunningham,Karen Brown, Jeremy Gustafson, and MargeryAustin Turner. 2004. A Decade of HOPE VI:Research Findings and Policy Challenges. Wash-ington, DC: The Urban Institute.
Popkin, Susan J., Brett Theodos, Caterina Roman,and Elizabeth Guernsey. 2008. The ChicagoFamily Case Management Demonstration: Devel-oping a New Model for Serving Hard to House Public Housing Residents. Washington, DC: TheUrban Institute. http://www.urban.org/url.cfm?ID=411708.
Rhodes, Virginia. 2005. “Kids on the Move: TheEffects of Student Mobility on NCLB SchoolAccountability Ratings.” Penn GSE Perspectiveson Urban Education 3(3).
Rosenbaum, James E. 1995. “Changing the Geogra-phy of Opportunity by Expanding ResidentialChoice: Lessons from the Gautreaux Program.”Housing Policy Debate 6(1): 231–69.
Rumberger, Russell. 2003. “The Causes and Con-sequences of Student Mobility.” Journal of NegroEducation 72(1): 6–21.
Sard, Barbara. 2008. “Basic Facts on Public Housingand Its Residents.” Washington, DC: Centeron Budget and Policy Priorities.
Sard, Barbara, and Jeff Lubell. 2000. The IncreasingUse of TANF and State Matching Funds to ProvideHousing Assistance to Families Moving from Welfareto Work. Washington, DC: Center on Budgetand Policy Priorities.
Sard, Barbara and John Springer. 2002. “AffordableHousing: One of the Keys to Self-Sufficiency.”Housing Facts and Findings 4(1): 1, 5–7. http://www.knowledgeplex.org/showdoc.html?id=2581.
Sard, Barbara, and Leah Staub. 2008. “House BillMakes Significant Improvements in ‘HOPEVI’ Public Housing Revitalization Program.”Washington, DC: Center on Budget and PolicyPriorities.
Sard, Barbara, and Margy Waller. 2002. “HousingStrategies to Strengthen Welfare Policy and Sup-port Working Families.” Research brief. Wash-ington, DC: The Brookings Institution and theCenter on Budget and Policy Priorities.
Schwartz, Alex. 2006. Housing Policy in the UnitedStates: An Introduction. New York: Routledge.

Federal Programs for Addressing Low-Income Housing Needs 25
Solomon, Rod. 2005. Public Housing Reform andVoucher Success: Progress and Challenges. Wash-ington, DC: The Brookings Institution.
Turbov, Mindy, and Valerie Piper. 2005. “HOPEVI and Mixed-Finance Redevelopments: ACatalyst for Neighborhood Renewal.” Wash-ington, DC: The Brookings Institution.
Turner, Margery Austin, and Xavier de Souza Briggs.2008. “Assisted Housing Mobility and the Suc-cess of Low-Income Minority Families: Lessonsfor Policy, Practice, and Future Research.” Three-City Study of Moving to Opportunity Brief 5. Wash-ington, DC: The Urban Institute.
Turner, Margery Austin, and Lynette A. Rawl-ings. 2005. Overcoming Concentrated Poverty andIsolation: Lessons from Three HUD Demonstra-tion Initiatives. Washington, DC: The UrbanInstitute.
Turner, Margery Austin, G. Thomas Kingsley,Monte L. Franke, Patrick A. Corvington, andElizabeth C. Cove. 2002. Planning to Meet Local
Housing Needs: The Role of HUD’s ConsolidatedPlanning Requirements in the 1990s. Washing-ton, DC: U.S. Department of Housing andUrban Development.
U.S. Department of Housing and Urban Develop-ment (HUD). 1997a. The Geographic Distributionof HUD-Assisted Housing, 1993. Washington,DC: HUD.
———. 1997b. Characteristics of HUD-AssistedRenters and Their Units in 1993. Washington,DC: HUD.
———. 2007a. Affordable Housing Needs 2005:Report to Congress. Washington, DC: HUD.
———. 2007b. The Number of Federally AssistedUnits under Lease and the Costs of Leased Units tothe Department of Housing and Urban Development.Washington, DC: HUD.
Walker, Christopher, et al. 1998. Expanding theNation’s Supply of Affordable Housing: An Evalu-ation of the Home Investment Partnerships Program.Washington, DC: HUD.


The Urban Institute2100 M Street, NWWashington, DC 20037
Phone: 202.833.7200Fax: 202.429.0687http://www.urban.org