Arizona Low Income Housing Tax Credit and Housing Trust ...
23
Arizona Low Income Housing Tax Credit and Housing Trust Fund Economic and Fiscal Impact Report Prepared for: Arizona Department of Housing January 2014 Prepared by: Elliott D. Pollack & Company 7505 East 6 th Avenue, Suite 100 Scottsdale, Arizona 85251
Transcript of Arizona Low Income Housing Tax Credit and Housing Trust ...
Arizona Low Income Housing Tax Credit and Housing Trust Fund Economic and Fiscal Impact Report
Prepared for: Arizona Department of Housing January 2014 Prepared by: Elliott D. Pollack & Company 7505 East 6th Avenue, Suite 100 Scottsdale, Arizona 85251
Elliott D. Pollack & Company TOC www.arizonaeconomy.com
Table of Contents
Key Findings i
1.0 Introduction 1
1.1 Limiting Conditions 1
2.0 Methodology & Assumptions 3 2.1 Project Assumptions 3
2.2 Economic Impact Methodology 3
2.3 Fiscal Impact Methodology 4
3.0 Economic Impact of LIHTC Program 7
3.1 Impacts of Construction 7
3.2 Apartment Operations Impacts 8
4.0 Fiscal Impacts of Arizona LIHTC Program 9
4.1 Fiscal Impacts of Construction 9
4.2 Fiscal Impacts of Ongoing Operations 13
5.0 Incremental Impacts of Housing Trust Fund Gap Financing 16 5.1 Economic Impacts 16
5.2 Fiscal Impacts 17
Arizona LIHTC and Housing Trust Fund Economic and Fiscal Impact Report
Elliott D. Pollack & Company www.arizonaeconomy.com
i
The Arizona Department of Housing’s (ADOH) Low Income Housing Tax Credit (LIHTC) program has been in effect since 1987. Over the past 27 years, the LIHTC program has helped create tens of thousands of affordable housing units for a broad array of Arizona’s population in need. This includes persons with disabilities, veterans, homeless individuals, multiple generation family units, and households earning much less than the median income. During the last economic recession, the State of Arizona removed the ADOH gap financing funding formula and replaced it with a set dollar amount. Elliott D. Pollack & Company was retained to conduct an economic analysis of the effect of the Arizona Department of Housing’s (ADOH) Low Income Housing Tax Credit (LIHTC) program and gap financing activities to estimate overall impacts gained from these programs as well as analyze the net impact from state dollars used in the program. Returning a net positive fiscal impact from state resources would provide justification for further investment from state monies by reinstating the original funding formula. This analysis looks at multiple years of the activities and provides a more macro perspective into economic effects. Additionally, the scope was limited to the LIHTC program and gap financing activity. All other programs and initiatives that the Arizona Department of Housing provides to the state have been excluded. The accompanying approach to the analysis is different than what is considered “standard” by many housing tax credit professionals throughout the country. A typical analysis would include all construction activity as well as all spending by the tax credit housing residents. It is the opinion of this firm that such an approach would tend to overstate the actual economic and fiscal impact of affordable housing. This analysis instead only focuses on new dollars flowing into the state or being retained by the state. When multiple years of economic activity are tabulated, figures tend to grow very large. But, in this case even the incremental annual impacts have been worthy of consideration. The greatest potential for economic benefit arises from retaining or expanding federal dollars for use on programs that require financial leveraging. Simply obtaining federal monies for use on direct expenditures also yields positive impacts for the state. Key Findings
1. Since the LIHTC program began in 1987, it has induced nearly 37,900 multi-family apartment units to be built throughout Arizona. This number continues to grow each year that the program is in place.
2. The total construction value of these projects has reached over $2.2 billion with nearly $3.5 billion in total project costs.
3. Construction activity to date has created nearly 36,000 person-years of employment, $1.3 billion in wages, and nearly $4.0 billion in economic activity. In addition, an estimated $567.9 million in taxes and fees have been collected from construction related activity.

Arizona LIHTC and Housing Trust Fund Economic and Fiscal Impact Report
Elliott D. Pollack & Company www.arizonaeconomy.com
ii
4. With 37,900 apartment units in operation, an estimated 3,300 employees are supported on an ongoing basis from apartment operations and resident spending. This creates over $123.9 million in wages and over $353.1 million in economic output each year and will grow as new apartment communities are built. This creates $65.4 million in tax revenue annually.
5. During the economic downturn, LIHTC multifamily construction was a significant portion of overall construction activity. Nearly 5,500 units within 80 different projects were approved and constructed from 2008 to 2013.
6. Over 92% of the units built were specifically built for low income households. This ranges from public housing units for extremely low income all the way through moderately low income which usually has a maximum of 60% of area median income.
7. A significant source of demand for low income units comes from households who are currently rent-overburdened by their current living arrangement. There are a significant number of Arizona households that spend over 40% of their income on rent. The LIHTC program alleviates this burden by offering units below market rate rents to individuals, families, and seniors who are income restricted. This allows households additional money to provide other household needs such as food, transportation, utilities, and personal services. This is also money spent in the local economy.
8. With an investment of $550,000 in Housing Trust Fund gap financing, a 75-unit apartment complex generates over $1.6 million in taxes related to construction alone. Once operating, this complex would produce an additional $158,500 in taxes each year of stabilized operations. A community of this size would also create 119 construction jobs and support seven ongoing jobs from apartment operations and resident spending.
There are two distinct components to the economic development activities described in ADOH’s LIHTC program details. The first component is activity that strengthens the economy. This is the quantifiable activity that is the subject of this report. The second component is community building activity which can be both quantitative and qualitative. This is an area that should be considered in the debate but which is not addressed within this report.
Arizona LIHTC and Housing Trust Fund Economic and Fiscal Impact Report
Elliott D. Pollack & Company 1 www.arizonaeconomy.com
1.0 Introduction
The following study estimates the historical economic and fiscal impacts of the LIHTC and Housing Trust Fund programs since 1987. In addition to the historical analysis, an incremental impact of a prototypical project receiving Housing Trust Fund gap financing was modeled. The economic and fiscal impact portion of the study focuses on the economic and fiscal impacts of the following:
1. Construction of the projects.
2. Impact from the apartment complex operations.
3. Impact from increased expenditures by project residents at stabilized occupancy due to more affordable housing expenses.
Economic impact analysis examines the regional implications of an activity in terms of three basic measures: output, earnings and job creation. Fiscal impact analysis evaluates the public revenues generated by a particular activity. In fiscal impact analysis, the main revenue sources of a city, county or state government are analyzed to determine how the activity may financially affect them. 1.1 Limiting Conditions This study prepared by Elliott D. Pollack & Company is subject to the following considerations and limiting conditions.
• It is our understanding that this study is for the client’s due diligence and other planning purposes. Neither our report, nor its contents, nor any of our work are intended to be included in any registration statement, prospectus, public filing, private offering memorandum, or loan agreement without our prior written approval and, therefore, may not be referred to or quoted in whole or in part.
• The reported recommendation(s) represent the considered judgment of Elliott D.
Pollack and Company based on the facts, analyses and methodologies described in the report.
• Except as specifically stated to the contrary, this study does not give consideration to
the following matters to the extent they exist: (i) matters of a legal nature, including issues of legal title and compliance with federal, state and local laws and ordinances; and (ii) environmental and engineering issues, and the costs associated with their correction. The user of this study will be responsible for making his/her own determination about the impact, if any, of these matters.
• This study is intended to be read and used as a whole and not in parts.

Arizona LIHTC and Housing Trust Fund Economic and Fiscal Impact Report
Elliott D. Pollack & Company 2 www.arizonaeconomy.com
• This study has not evaluated the feasibility or marketability of any site for planned uses.
• All estimates regarding units constructed, project costs, and Housing Trust Fund
loans were provided by the Arizona Department of Housing. This data has been reviewed and verified to determine its reasonableness and applicability to the proposed project. Data is current as of December, 2013.
• This economic and fiscal impact study evaluates the potential “gross impacts” of the
construction and operations. The term “gross impacts” as used in this study refers to the total revenue, jobs and economic output that would be generated by the project.
• This analysis does not consider the costs to any government associated with providing
services to the projects. Such analysis is beyond the scope of this study. In addition, the analysis is based on the current tax structure and rates imposed by the State, counties, and municipalities. Changes in those rates would alter the findings of this study. All dollar amounts are stated in constant 2013 dollars and, unless indicated, do not take into account the effects of inflation.
• Our analysis is based on currently available information and estimates and
assumptions about long-term future development trends. Such estimates and assumptions are subject to uncertainty and variation. Accordingly, we do not represent them as results that will be achieved. Some assumptions inevitably will not materialize and unanticipated events and circumstances may occur; therefore, the actual results achieved may vary materially from the forecasted results. The assumptions disclosed in this market study are those that are believed to be significant to the projections of future results.

Arizona LIHTC and Housing Trust Fund Economic and Fiscal Impact Report
Elliott D. Pollack & Company 3 www.arizonaeconomy.com
2.0 Methodology & Assumptions 2.1 Project Assumptions The assumptions for evaluation of the economic and fiscal impacts of the Arizona LIHTC and Housing Trust Fund programs include construction cost values, permit and impact fee revenue, utilities and rent, vacancy, and average household income, among others. These assumptions were developed using past project information, rent and income limits, utility allowance schedules, and historical vacancy performance. In terms of assumptions used in the formulation of tax revenue estimates, a conservative approach was utilized.
Construction Cost as % of Project Cost 65%
Permit/Impact Fees per Unit $5,000
FF&E as % of Project Cost 1.5%
Monthly Utilities per unit $90
Monthly Rent per Unit $600
Vacancy 5.0%
Average HH Income $30,000
% of Income Saved 20%
Source: AZ Dept. of Housing; RealData, Inc.; Elliott D. Pollack & Co.
Arizona LIHTC ProgramPrimary Assumptions
2.2 Economic Impact Methodology Economic impact analysis examines the economic implications of an activity in terms of output, earnings, and employment. The different types of economic impacts are known as direct, indirect, and induced, according to the manner in which the impacts are generated. For instance, direct employment consists of permanent jobs held by apartment employees. Indirect employment is those jobs created by businesses that provide goods and services essential to the operation. These businesses range from manufacturers (who make goods) to wholesalers (who deliver goods). Finally, the spending of the wages and salaries of the direct and indirect employees on items such as food, housing, transportation and medical services creates induced employment in all sectors of the economy, throughout the region. These secondary effects are captured in the analysis conducted in this study.
Arizona LIHTC and Housing Trust Fund Economic and Fiscal Impact Report
Elliott D. Pollack & Company 4 www.arizonaeconomy.com
Multipliers have been developed to estimate the indirect and induced impacts of various direct economic activities. The Minnesota IMPLAN Group (also known as MIG, Inc.), a nationally recognized company which is the sole-source provider of the IMPLAN economic impact modeling system, developed the multipliers used in this study. Founded in 1993, the IMPLAN system was formed as an outgrowth of research work by professors from the University of Minnesota. The data from this system allows our analysts to examine and model complex multiplier models of local economies. In this case, the economy of the State of Arizona has been selected. The economic impact is categorized into three types of impacts:
(1) Employment Impact – the total wage and salary and self-employed jobs in a region. Jobs include both part time and full time workers.
(2) Earnings Impact – the personal income, earnings or wages, of the direct, indirect and
induced employees. Earnings include total wage and salary payments as well as benefits of health and life insurance, retirement payments and any other non-cash compensation.
(3) Economic Output – also referred to as economic activity, relates to the gross receipts for
goods or services generated by the company’s operations. Economic impacts are by their nature regional in character. Such impacts are best illustrated when not assigned to a specific locality, although clearly the primary impact of job creation would be on the local region where a project is located. However, many other communities throughout the state would also benefit from the construction and operation of each project. Therefore, the economic impact is expressed in this report as a statewide benefit. All dollar figures, unless otherwise stated, are expressed in 2013 dollars. 2.3 Fiscal Impact Methodology Fiscal impact analysis studies the public revenues associated with a particular economic activity. The main revenue sources of local, county, and state governments (i.e., taxes) are analyzed to determine how an activity may affect the various jurisdictions. This report evaluates the impact of the apartment projects on the State, local counties, and municipalities. Due to the wide range of projects in all areas of the state, this report will calculate total county-level and city-level fiscal impacts. The fiscal impact figures cited in this report have been generated from information provided by a variety of sources including the U.S. Bureau of the Census; the U.S. Department of Labor; the Internal Revenue Service; the State of Arizona; the Arizona Tax Research Association; and the U.S. Consumer Expenditure Survey. Fiscal impacts are categorized by type in this study, similar to the economic impact analysis. The major sources of revenue generation for governmental entities are related to construction of the project and ongoing impact from operations and resident spending.

Arizona LIHTC and Housing Trust Fund Economic and Fiscal Impact Report
Elliott D. Pollack & Company 5 www.arizonaeconomy.com
Construction impacts relate to the revenues generated from development of each project and include the local sales taxes levied on construction materials as well as building permit fees and development impact fees. Once projects are completed, the ongoing fiscal impacts of the apartment complex and apartment residents will be creating revenue for the state. Following is a description of the applicable tax revenue sources of the various jurisdictions that will be considered for this analysis.
• Construction Sales Tax The state, counties and cities in Arizona levy a sales tax on materials used in the construction of buildings or development of land improvements. That tax is calculated by state law under the assumption that 65% of the construction cost of the facility and its land improvements are related to construction materials with the remaining 35% devoted to labor. The sales tax rate is then applied to the 65% materials figure. The sales tax on construction materials is a one-time collection by the governmental entity. Construction sales tax is generated during any new building construction as well as from improvements.
• Use Tax The State and local cities charge a use tax that is assessed on items purchased outside the jurisdiction and brought in for storage, use or consumption. This tax rate will be applied to the FF&E (furniture, fixture and equipment) estimate of the projects. No exemptions are given for this tax category.
• Sales Tax The state, counties, and incorporated cities and towns charge sales tax on utilities, retail goods and services. These tax rates are applied to the estimated utilities used by the apartment residents as well as taxable spending of the projects’ employees and residents.
• Lease Tax Cities and towns typically charge a lease tax on residential rental property. These tax rates are applied to the taxable rent that is collected by the owner of each rental property.
• Property Taxes Property taxes will be collected on the dwelling units. The taxable value for the residences was based on the construction value of the apartment projects. Dwelling units are considered residential property and assessed at a 10% rate.
• State Shared Revenues Each county in Arizona receives a portion of State revenues from four different sources - state sales tax (described above), state income tax, vehicle license tax (VLT) and highway user revenue fund (HURF) tax. The formulas for allocating these revenues are primarily based on population.

Arizona LIHTC and Housing Trust Fund Economic and Fiscal Impact Report
Elliott D. Pollack & Company 6 www.arizonaeconomy.com
• State Income Tax The State of Arizona collects taxes on personal income. The tax rate used in the analysis averages about 1.6% for earnings. These percentages are based on the most recently available income tax data from the State and the projected wage levels of jobs created by the construction and operations impact. This tax is applied to the wages and earnings of direct, indirect and induced employment. Portions of this tax are redistributed through revenue sharing to cities and towns throughout Arizona based on population.
• HURF Taxes The State of Arizona collects specific taxes for the Highway User Revenue Fund (HURF). Both the registration fees and the motor vehicle fuel tax (gas tax) are considered in this analysis. The motor vehicle fuel tax is $0.18 per gallon and is calculated based on a vehicle traveling 12,000 miles per year at 20 miles per gallon. Registration fees average $66 per employee in the State of Arizona. These factors are applied to the projected direct, indirect and induced employee count. Portions of these taxes are distributed to counties and cities throughout Arizona based on a formula that includes population and the origin of gasoline sales.
• Vehicle License Tax
The vehicle license tax is a personal property tax placed on vehicles at the time of annual registration. This factor is applied to the projected direct, indirect and induced employee count. The average tax used in this analysis is $325 and portions of the total collections are distributed through the Highway User Revenue Fund. The remaining funds are shared between counties and cities in accordance with population based formulas.
The above tax categories represent the largest sources of revenues that will be generated for the State of Arizona, counties, and municipalities. This analysis considers gross tax collections and does not differentiate among dedicated purposes or uses of such gross tax collections.

Arizona LIHTC and Housing Trust Fund Economic and Fiscal Impact Report
Elliott D. Pollack & Company 7 www.arizonaeconomy.com
3.0 Economic Impacts of the Arizona LIHTC Program 3.1 Impacts from Construction Over the last 27 years of the program, an average of 657 direct jobs have been created each year earning $30.9 million in wages and producing $83.1 million in annual economic output. Direct construction creates a ripple effect throughout the economy by demanding support services and suppliers (indirect effects) as well as goods and services related employment (induced jobs) stemming from employee demand. These spin-off jobs are estimated at approximately 767 employees annually since 1987. These employees cumulatively earned over $25.9 million each year and annual economic activity is expected to total an additional $64.0 million. All totaled, annual LIHTC apartment construction has created 1,318 jobs which equates to nearly $47.4 million in annual wages and $147.1 million in annual economic output.
Economic Impact of Apartment ConstructionAverage Annual ImpactState of ArizonaImpact EconomicType Jobs Wages Output
Direct 657 $30,908,963 $83,099,794
Indirect 313 $12,965,130 $31,899,407
Induced 383 $13,810,996 $36,408,519
Total 1,353 $57,685,089 $151,407,720Source: Elliott D. Pollack & Company; IMPLAN; Arizona Department of Housing Over the entire program’s life, a total of 36,514 person years of employment have been created. A person-year of employment refers to one year of employment. Each year that a job extends beyond the year prior, a person-year accumulates. Construction activity has generated nearly $1.6 billion in wages and nearly $4.1 billion in economic output for the State of Arizona.
Total Economic Impact from Apartment ConstructionState of ArizonaImpact Person Years of EconomicType Employment Wages Output
Direct 17,726 $834,542,000 $2,243,694,447
Indirect 8,441 $350,058,509 $861,284,000
Induced 10,347 $372,896,896 $983,030,000
Total 36,514 $1,557,497,405 $4,088,008,447
Source: Elliott D. Pollack & Company; IMPLAN; Arizona Department of Housing
Arizona LIHTC and Housing Trust Fund Economic and Fiscal Impact Report
Elliott D. Pollack & Company 8 www.arizonaeconomy.com
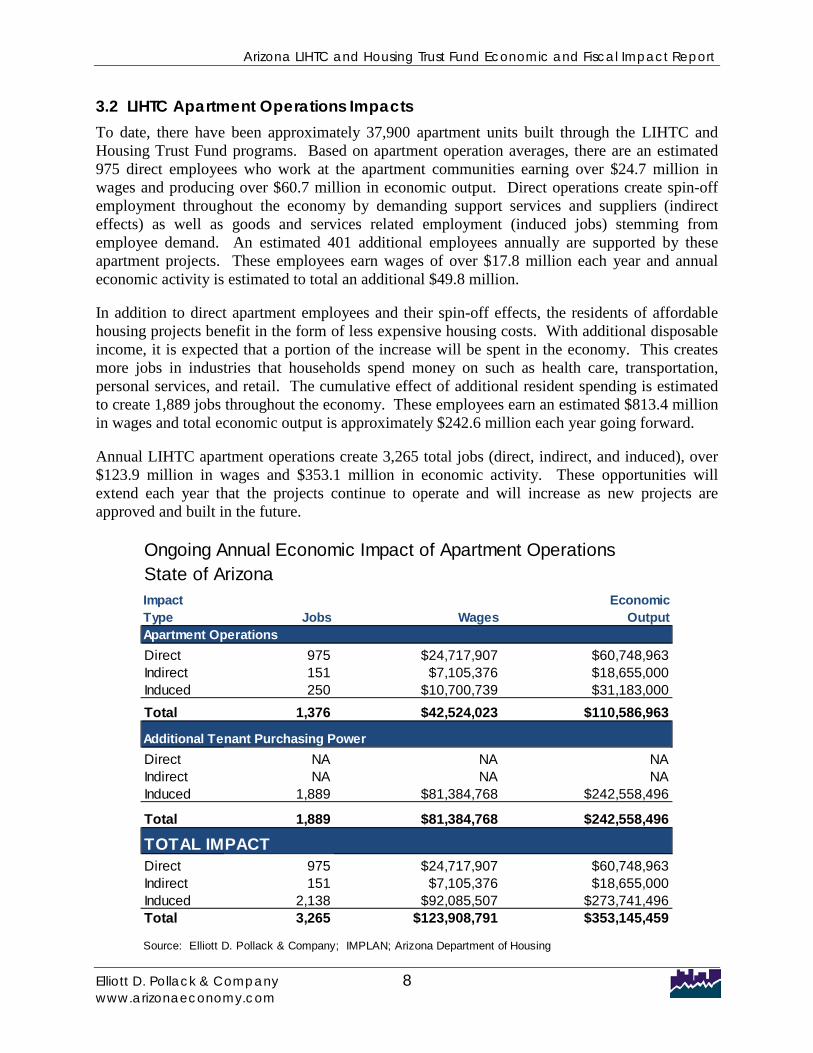
3.2 LIHTC Apartment Operations Impacts To date, there have been approximately 37,900 apartment units built through the LIHTC and Housing Trust Fund programs. Based on apartment operation averages, there are an estimated 975 direct employees who work at the apartment communities earning over $24.7 million in wages and producing over $60.7 million in economic output. Direct operations create spin-off employment throughout the economy by demanding support services and suppliers (indirect effects) as well as goods and services related employment (induced jobs) stemming from employee demand. An estimated 401 additional employees annually are supported by these apartment projects. These employees earn wages of over $17.8 million each year and annual economic activity is estimated to total an additional $49.8 million. In addition to direct apartment employees and their spin-off effects, the residents of affordable housing projects benefit in the form of less expensive housing costs. With additional disposable income, it is expected that a portion of the increase will be spent in the economy. This creates more jobs in industries that households spend money on such as health care, transportation, personal services, and retail. The cumulative effect of additional resident spending is estimated to create 1,889 jobs throughout the economy. These employees earn an estimated $813.4 million in wages and total economic output is approximately $242.6 million each year going forward. Annual LIHTC apartment operations create 3,265 total jobs (direct, indirect, and induced), over $123.9 million in wages and $353.1 million in economic activity. These opportunities will extend each year that the projects continue to operate and will increase as new projects are approved and built in the future.
Ongoing Annual Economic Impact of Apartment OperationsState of ArizonaImpact EconomicType Jobs Wages OutputApartment OperationsDirect 975 $24,717,907 $60,748,963Indirect 151 $7,105,376 $18,655,000Induced 250 $10,700,739 $31,183,000Total 1,376 $42,524,023 $110,586,963
Additional Tenant Purchasing PowerDirect NA NA NAIndirect NA NA NAInduced 1,889 $81,384,768 $242,558,496
Total 1,889 $81,384,768 $242,558,496
TOTAL IMPACTDirect 975 $24,717,907 $60,748,963Indirect 151 $7,105,376 $18,655,000Induced 2,138 $92,085,507 $273,741,496Total 3,265 $123,908,791 $353,145,459
Source: Elliott D. Pollack & Company; IMPLAN; Arizona Department of Housing

Arizona LIHTC and Housing Trust Fund Economic and Fiscal Impact Report
Elliott D. Pollack & Company 9 www.arizonaeconomy.com
4.0 Fiscal Impact of Arizona LIHTC Program The LIHTC and Housing Trust Fund programs have created significant fiscal benefits for many governments in the State of Arizona. For perspective the following table details the number of apartment units that have been built and their project costs by county in Arizona. This provides perspective on the relative distribution of both economic and fiscal benefits throughout the state.
Arizona LIHTC ProgramApartment Construction by County
2010 Population
% of Total Units
% of Total
Project Costs (mil)
% of Total
Apache 71,518 1.1% 208 0.5% $17.5 0.5%Cochise 131,346 2.1% 1,553 4.1% $150.9 4.4%Coconino 134,421 2.1% 978 2.6% $112.2 3.3%Gila 53,597 0.8% 618 1.6% $82.4 2.4%Graham 37,220 0.6% 376 1.0% $42.5 1.2%Greenlee 8,437 0.1% 0 0.0% NA NALa Paz 20,489 0.3% 130 0.3% $16.1 0.5%Maricopa 3,817,117 59.7% 20,393 53.8% $1,842.8 53.4%Mohave 200,186 3.1% 1,643 4.3% $164.3 4.8%Navajo 107,449 1.7% 1,139 3.0% $123.9 3.6%Pima 980,263 15.3% 5,322 14.0% $398.6 11.5%Pinal 375,770 5.9% 1,811 4.8% $131.5 3.8%Santa Cruz 47,420 0.7% 753 2.0% $78.2 2.3%Yavapai 211,033 3.3% 1,459 3.8% $178.8 5.2%Yuma 195,751 3.1% 1,515 4.0% $112.1 3.2%Grand Total 6,392,017 37,898 $3,451.8
Source: Arizona Dept. of Housing; Elliott D. Pollack & Co.; U.S. Census 4.1 Fiscal Impacts of Construction The construction of LIHTC apartment communities has created significant tax revenues for the state. These impacts cover the entire construction period and are not annualized. The following table outlines the fiscal impact of historical construction of projects on the state, counties, and municipalities. Revenues have been defined in this analysis as either primary or secondary, depending on their source and how the dollars flow through the economy into government tax accounts. For instance, some revenues, such as construction sales taxes, are straightforward calculations based on the cost of construction. These revenues are described in this study as primary revenues and include construction sales taxes, use taxes, building permit fees and impact fees. Secondary revenues, on the other hand, flow from the wages of those

Arizona LIHTC and Housing Trust Fund Economic and Fiscal Impact Report
Elliott D. Pollack & Company 10 www.arizonaeconomy.com
direct, indirect and induced employees who are supported by the project. Revenue projections are based on typical wages of the employees working in the project and their spending patterns. 4.1.1 Primary Impacts
Primary revenues generated to the State, counties, and municipalities from the construction sales tax, building and impact fees, and use tax has totaled over $313.6 million over the 27 years of construction activity.
Primary Fiscal Impact from New ConstructionState of Arizona(2013 Dollars)
Impact Construction FF&E Building Permit/ TotalType Sales Tax Use Tax Impact Fees Revenues
State $72,116,000 $1,885,000 N/A $74,001,000
County $14,925,000 $208,000 N/A $15,133,000
Local $34,328,000 $675,000 $189,490,000 $224,493,000
Total Revenues1/ $121,369,000 $2,768,000 $189,490,000 $313,627,000_______________
Source: Elliott D. Pollack & Company; IMPLAN; Arizona Department of Revenue; Arizona Tax Research Association
1/ The figures for the State of Arizona do not include revenues distributed to counties, cities, and towns. The figures are intended only as a general guideline as to how the State, counties, and municipalities have been impacted by the projects. The above figures are based on the current economic structure and tax rates within the state of Arizona.
4.1.2 Secondary Impacts
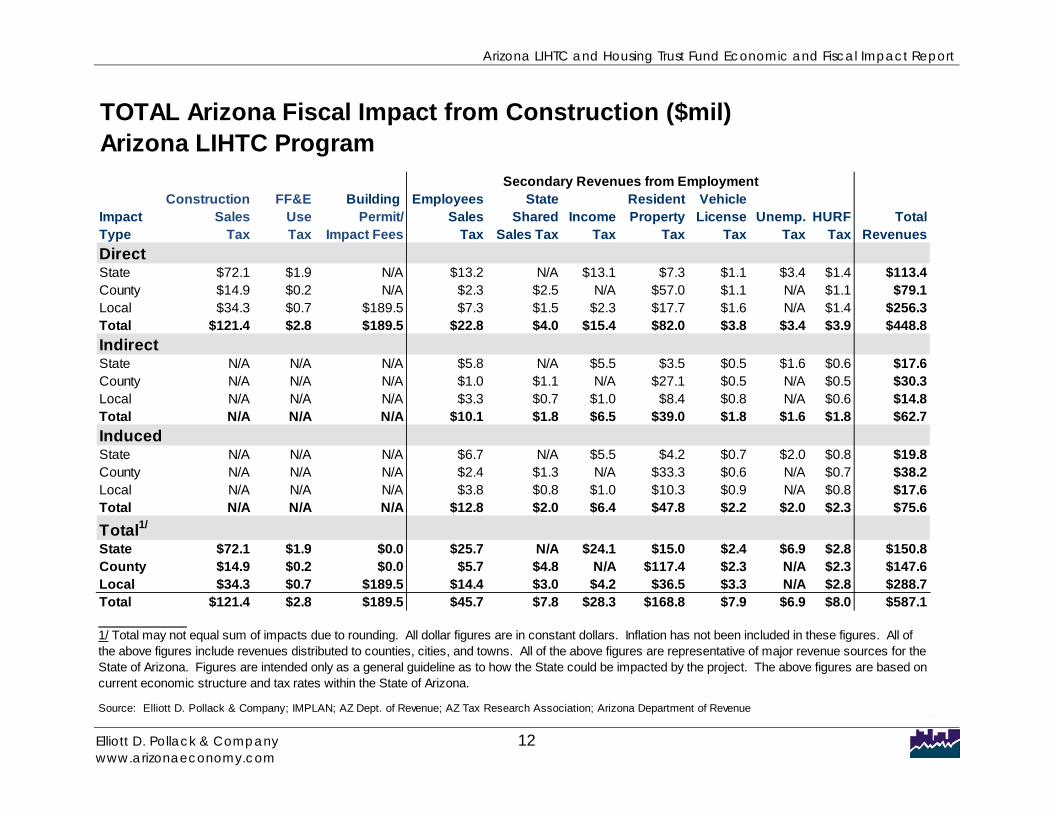
The secondary revenue sources generated by employees in the fiscal impact analysis below include sales taxes, personal income taxes, property taxes, vehicle license taxes, highway user fees, and unemployment taxes. The Secondary Fiscal Impact table illustrates the estimated secondary fiscal impacts of operations on Arizona, counties, and municipalities, respectively. Tax revenue has further been categorized into direct, indirect, and induced effects. Taxes collected within the State of Arizona related to construction employees have been estimated at over $273.4 million. Property taxes and sales taxes comprise two of the largest revenue categories at $168.8 million and $45.7 million, respectively. Personal income taxes of nearly $28.3 million represent the next largest revenue source. These figures represent impacts over the estimated 27-year study period. 4.1.3 Total Impacts The Total Fiscal Impact table represents the combined primary and secondary impacts of the LIHTC and Housing Trust Fund Programs within the State of Arizona, estimated at approximately $587.1 million.

Arizona LIHTC and Housing Trust Fund Economic and Fiscal Impact Report
Elliott D. Pollack & Company 11 www.arizonaeconomy.com
Secondary Fiscal Impact from ConstructionArizona LIHTC Program
Employees State Resident VehicleSales Shared Income Property License Unemp. HURF
Tax Sales Tax Tax Tax Tax Tax Tax TOTALDIRECTState $13,165,722 N/A $13,123,173 $7,258,620 $1,145,205 $3,350,157 $1,361,607 $39,404,484County $2,259,993 $2,486,565 N/A $56,988,135 $1,095,523 N/A $1,134,534 $63,964,751Local $7,332,418 $1,534,538 $2,315,854 $17,703,682 $1,585,625 N/A $1,364,322 $31,836,440Total $22,758,133 $4,021,103 $15,439,027 $81,950,437 $3,826,353 $3,350,157 $3,860,463 $135,205,674INDIRECTState $5,847,391 N/A $5,504,670 $3,456,718 $545,372 $1,595,420 $648,428 $17,597,999County $1,010,314 $1,104,377 N/A $27,139,029 $521,713 N/A $540,291 $30,315,724Local $3,277,906 $681,546 $971,412 $8,430,891 $755,110 N/A $649,721 $14,766,587Total $10,135,611 $1,785,923 $6,476,082 $39,026,638 $1,822,195 $1,595,420 $1,838,439 $62,680,309INDUCEDState $6,666,322 N/A $5,451,753 $4,236,999 $668,479 $1,955,553 $794,797 $19,773,902County $2,396,902 $1,259,046 N/A $33,265,092 $639,478 N/A $662,250 $38,222,767Local $3,764,073 $776,997 $962,074 $10,333,986 $925,561 N/A $796,381 $17,559,072Total $12,827,297 $2,036,043 $6,413,827 $47,836,077 $2,233,517 $1,955,553 $2,253,428 $75,555,741TOTALState $25,679,435 N/A $24,079,596 $14,952,336 $2,359,056 $6,901,130 $2,804,832 $76,776,384County $5,667,209 $4,849,988 N/A $117,392,257 $2,256,714 N/A $2,337,075 $132,503,242Local $14,374,397 $2,993,081 $4,249,340 $36,468,560 $3,266,296 N/A $2,810,424 $64,162,098Grand Total $45,721,041 $7,843,069 $28,328,936 $168,813,153 $7,882,066 $6,901,130 $7,952,330 $273,441,724_______________
Source: Elliott D. Pollack & Company; IMPLAN; AZ Dept. of Revenue; AZ Tax Research Association; Arizona Department of Revenue
1/ Total may not equal sum of impacts due to rounding. All dollar figures are in constant dollars. Inflation has not been included in these figures. All of the above figures include revenues distributed to counties, cities, and towns. All of the above figures are representative of major revenue sources for the State of Arizona. Figures are intended only as a general guideline as to how the State could be impacted by the project. The above figures are based on current economic structure and tax rates within the State of Arizona.
Arizona LIHTC and Housing Trust Fund Economic and Fiscal Impact Report
Elliott D. Pollack & Company 12 www.arizonaeconomy.com
TOTAL Arizona Fiscal Impact from Construction ($mil)Arizona LIHTC Program
Construction FF&E Building Employees State Resident VehicleImpact Sales Use Permit/ Sales Shared Income Property License Unemp. HURF TotalType Tax Tax Impact Fees Tax Sales Tax Tax Tax Tax Tax Tax RevenuesDirectState $72.1 $1.9 N/A $13.2 N/A $13.1 $7.3 $1.1 $3.4 $1.4 $113.4County $14.9 $0.2 N/A $2.3 $2.5 N/A $57.0 $1.1 N/A $1.1 $79.1Local $34.3 $0.7 $189.5 $7.3 $1.5 $2.3 $17.7 $1.6 N/A $1.4 $256.3Total $121.4 $2.8 $189.5 $22.8 $4.0 $15.4 $82.0 $3.8 $3.4 $3.9 $448.8IndirectState N/A N/A N/A $5.8 N/A $5.5 $3.5 $0.5 $1.6 $0.6 $17.6County N/A N/A N/A $1.0 $1.1 N/A $27.1 $0.5 N/A $0.5 $30.3Local N/A N/A N/A $3.3 $0.7 $1.0 $8.4 $0.8 N/A $0.6 $14.8Total N/A N/A N/A $10.1 $1.8 $6.5 $39.0 $1.8 $1.6 $1.8 $62.7InducedState N/A N/A N/A $6.7 N/A $5.5 $4.2 $0.7 $2.0 $0.8 $19.8County N/A N/A N/A $2.4 $1.3 N/A $33.3 $0.6 N/A $0.7 $38.2Local N/A N/A N/A $3.8 $0.8 $1.0 $10.3 $0.9 N/A $0.8 $17.6Total N/A N/A N/A $12.8 $2.0 $6.4 $47.8 $2.2 $2.0 $2.3 $75.6
Total1/
State $72.1 $1.9 $0.0 $25.7 N/A $24.1 $15.0 $2.4 $6.9 $2.8 $150.8County $14.9 $0.2 $0.0 $5.7 $4.8 N/A $117.4 $2.3 N/A $2.3 $147.6Local $34.3 $0.7 $189.5 $14.4 $3.0 $4.2 $36.5 $3.3 N/A $2.8 $288.7Total $121.4 $2.8 $189.5 $45.7 $7.8 $28.3 $168.8 $7.9 $6.9 $8.0 $587.1_______________
Source: Elliott D. Pollack & Company; IMPLAN; AZ Dept. of Revenue; AZ Tax Research Association; Arizona Department of Revenue
1/ Total may not equal sum of impacts due to rounding. All dollar figures are in constant dollars. Inflation has not been included in these figures. All of the above figures include revenues distributed to counties, cities, and towns. All of the above figures are representative of major revenue sources for the State of Arizona. Figures are intended only as a general guideline as to how the State could be impacted by the project. The above figures are based on current economic structure and tax rates within the State of Arizona.
Secondary Revenues from Employment

Arizona LIHTC and Housing Trust Fund Economic and Fiscal Impact Report
Elliott D. Pollack & Company 13 www.arizonaeconomy.com
4.2 Fiscal Impacts of Ongoing Operations Once apartment projects are completed, the commercial operations and residents with additional purchasing power would increase tax revenue for the state. 4.1.1 Primary Impacts
The following table shows the ongoing primary tax revenue that Arizona governments are estimated to collect based on the revenues generated by apartment complex operations and increased resident spending. In total, approximately $42.0 million in primary taxes is collected each year. Utility taxes are the largest revenue source, but significant monies are collected each year from resident spending, lease taxes and property taxes as well.
Resident AnnualImpact Spending Lease Utility PropertyType Sales Tax Tax Tax Tax TOTAL
State $7,420,667 NA $1,922,743 $1,628,232 $10,971,641County $2,668,706 NA $397,928 $12,783,408 $15,850,042Local $4,976,245 $5,200,000 $984,921 $3,971,237 $15,132,403Total $15,065,618 $5,200,000 $18,382,876 $3,305,592 $41,954,086
Source: Elliott D. Pollack & Co.; IMPLAN; AZ Dept. of Revenue; AZ Tax Research Association; AZ Dept of Hous
(2013 Dollars)Arizona LIHTC ProgramPrimary Fiscal Impact of Operations
4.1.2 Secondary Impacts
Secondary revenue generated by direct, indirect and induced employment would also accrue to the state governments. Employees directly employed by an apartment complex as well as employees supported by the supplier industries to the projects earn wages which are spent on a variety of products and services in the local economy. Residents of the subsidized units are also able to spend more in the economy which produces a significant number of local jobs. The following Secondary Fiscal Impact of Operations table illustrates the fiscal impact of this spending on an annual basis. Nearly $23.5 million is expected to be collected by Arizona governments in the form of sales tax, property tax, and various state shared revenues. 4.1.3 Total Impacts
In total, the LIHTC projects completed to date will create an estimated $65.4 million in revenue for Arizona governments on an ongoing, annual basis (assuming stabilized operations).

Arizona LIHTC and Housing Trust Fund Economic and Fiscal Impact Report
Elliott D. Pollack & Company 14 www.arizonaeconomy.com
Secondary Fiscal Impact of OperationsArizona LIHTC Program(2013 Dollars)
Employees State Resident VehicleSales Shared Income Property License Unemp. HURF
Tax Sales Tax Tax Tax Tax Tax Tax TOTALDIRECTState $535,207 N/A $329,860 $399,206 $62,983 $184,250 $74,885 $1,586,391County $94,808 $101,083 N/A $3,134,202 $60,251 N/A $62,396 $3,452,740Local $307,600 $62,381 $58,211 $973,657 $87,205 N/A $75,034 $1,564,089Total $937,615 $163,464 $388,071 $4,507,064 $210,440 $184,250 $212,316 $6,603,220INDIRECTState $112,232 N/A $94,821 $61,976 $9,778 $28,604 $11,626 $319,038County $19,268 $21,197 N/A $486,579 $9,354 N/A $9,687 $546,085Local $62,515 $13,081 $16,733 $151,158 $13,538 N/A $11,649 $268,675Total $194,016 $34,278 $111,554 $699,713 $32,670 $28,604 $32,962 $1,133,797INDUCEDState $1,511,647 N/A $1,228,881 $875,641 $138,151 $404,145 $164,257 $4,322,722County $260,676 $285,500 N/A $6,874,741 $132,158 N/A $136,864 $7,689,939Local $845,748 $176,191 $216,861 $2,135,677 $191,281 N/A $164,584 $3,730,343Total $2,618,071 $461,690 $1,445,742 $9,886,059 $461,591 $404,145 $465,705 $15,743,003TOTALState $2,159,086 N/A $1,653,563 $1,336,822 $210,913 $616,999 $250,768 $6,228,151County $374,753 $407,779 N/A $10,495,521 $201,763 N/A $208,947 $11,688,763Local $1,215,863 $251,653 $291,805 $3,260,492 $292,025 N/A $251,268 $5,563,107Grand Total $3,749,702 $659,433 $1,945,368 $15,092,836 $704,701 $616,999 $710,983 $23,480,021_______________
Source: Elliott D. Pollack & Co.; IMPLAN; AZ Dept. of Revenue; AZ Tax Research Association; AZ Dept of Housing
1/ Total may not equal sum of impacts due to rounding. All dollar figures are in constant dollars. Inflation has not been included in these figures. All of the above figures include revenues distributed to counties, cities, and towns. All of the above figures are representative of major revenue sources for the State of Arizona. Figures are intended only as a general guideline as to how the State could be impacted by the project. The above figures are based on current economic structure and tax rates within the State of Arizona.

Arizona LIHTC and Housing Trust Fund Economic and Fiscal Impact Report
Elliott D. Pollack & Company 15 www.arizonaeconomy.com
TOTAL Arizona Fiscal Impact of Operations ($mil)Arizona LIHTC Program(2013 Dollars)
Resident Annual Employees State Resident VehicleImpact Spending Lease Utility Property Sales Shared Income Property License Unemp. HURF TotalType Sales Tax Tax Tax Tax Tax Sales Tax Tax Tax Tax Tax Tax RevenuesDirectState $7.4 NA $1.9 $1.6 $0.5 N/A $0.3 $0.4 $0.1 $0.2 $0.1 $12.6County $2.7 NA $0.4 $12.8 $0.1 $0.1 N/A $3.1 $0.1 N/A $0.1 $19.3Local $5.0 $5.2 $1.0 $4.0 $0.3 $0.1 $0.1 $1.0 $0.1 N/A $0.1 $16.7Total $15.1 $5.2 $3.3 $18.4 $0.9 $0.2 $0.4 $4.5 $0.2 $0.2 $0.2 $48.6IndirectState N/A N/A N/A N/A $0.1 N/A $0.1 $0.1 $0.0 $0.0 $0.0 $0.3County N/A N/A N/A N/A $0.0 $0.0 N/A $0.5 $0.0 N/A $0.0 $0.5Local N/A N/A N/A N/A $0.1 $0.0 $0.0 $0.2 $0.0 N/A $0.0 $0.3Total N/A N/A N/A N/A $0.2 $0.0 $0.1 $0.7 $0.0 $0.0 $0.0 $1.1InducedState N/A N/A N/A N/A $1.5 N/A $1.2 $0.9 $0.1 $0.4 $0.2 $4.3County N/A N/A N/A N/A $0.3 $0.3 N/A $6.9 $0.1 N/A $0.1 $7.7Local N/A N/A N/A N/A $0.8 $0.2 $0.2 $2.1 $0.2 N/A $0.2 $3.7Total N/A N/A N/A N/A $2.6 $0.5 $1.4 $9.9 $0.5 $0.4 $0.5 $15.7
Total1/
State $7.4 $0.0 $1.9 $1.6 $2.2 N/A $1.7 $1.3 $0.2 $0.6 $0.3 $17.2County N/A $0.0 $0.4 $12.8 $0.4 $0.4 N/A $10.5 $0.2 N/A $0.2 $27.5Local $5.0 $5.2 $1.0 $4.0 $1.2 $0.3 $0.3 $3.3 $0.3 N/A $0.3 $20.7Total $15.1 $5.2 $3.3 $18.4 $3.7 $0.7 $1.9 $15.1 $0.7 $0.6 $0.7 $65.4_______________
Source: Elliott D. Pollack & Co.; IMPLAN; AZ Dept. of Revenue; AZ Tax Research Association; AZ Dept of Housing
1/ Total may not equal sum of impacts due to rounding. All dollar figures are in constant dollars. Inflation has not been included in these figures. All of the above figures include revenues distributed to counties, cities, and towns. All of the above figures are representative of major revenue sources for the State of Arizona. Figures are intended only as a general guideline as to how the State could be impacted by the project. The above figures are based on current economic structure and tax rates within the State of Arizona.
Secondary Revenues from Employment

Arizona LIHTC and Housing Trust Fund Economic and Fiscal Impact Report
Elliott D. Pollack & Company 16 www.arizonaeconomy.com
5.0 Incremental Impacts of Housing Trust Fund Gap Financing In addition to the cumulative and ongoing benefits of the LIHTC and Housing Trust Fund program since its inception, a forward looking analysis is provided on a per-project basis. The Arizona Department of Housing is concerned that an increasing number of projects seeking federal tax credits will also require state gap financing to be able to achieve financial feasibility. The following impact analysis assumes an average project receiving $550,000 in Housing Trust Fund gap financing will build a 75-unit project. This is consistent with the past three years of Arizona Department of Housing approved projects. Consistent with the previous analysis, a prototypical LIHTC apartment project will create impacts from construction, operations, and increased resident spending. 5.1 Economic Impacts 5.1.1 Economic Impact of Construction It is estimated that an apartment project of this size would create an estimated 63 direct construction jobs and an additional 50 indirect and induced employees related to the construction activity. A total of $6.1 million in wages would be earned and $18.3 million in economic activity would be created in the State. Economic Impact from 75-Unit Apartment ConstructionState of Arizona
Impact EconomicType Jobs Wages Output
Direct 63 $3,696,000 $11,500,000
Indirect 18 $1,017,020 $2,606,000
Induced 32 $1,412,254 $4,177,000
Total 113 $6,125,274 $18,283,000
Source: Elliott D. Pollack & Company; IMPLAN; Arizona Department of Housing 5.1.2 Economic Impact of Operations Annual operations of this 75-unit community would create 6.7 total jobs (direct, indirect, and induced), nearly $258,500 in wages and over $738,700 in economic activity. These opportunities will extend each year that the project continues to operate.

Arizona LIHTC and Housing Trust Fund Economic and Fiscal Impact Report
Elliott D. Pollack & Company 17 www.arizonaeconomy.com
Ongoing Annual Economic Impact of Apartment OperationsState of Arizona(2013 Dollars)
Impact EconomicType Jobs Wages OutputApartment Operations
Direct 1.9 $48,917 $120,222
Indirect 0.3 $14,062 $37,000
Induced 0.5 $21,177 $62,000Total 2.7 $84,155 $219,222Additional Tenant Purchasing Power
Direct NA NA NA
Indirect NA NA NA
Induced 4.0 $174,311 $519,516
Total 4.0 $174,311 $519,516
TOTAL IMPACTDirect 1.9 $48,917 $120,222
Indirect 0.3 $14,062 $37,000
Induced 4.5 $195,488 $581,516
Total 6.7 $258,466 $738,738
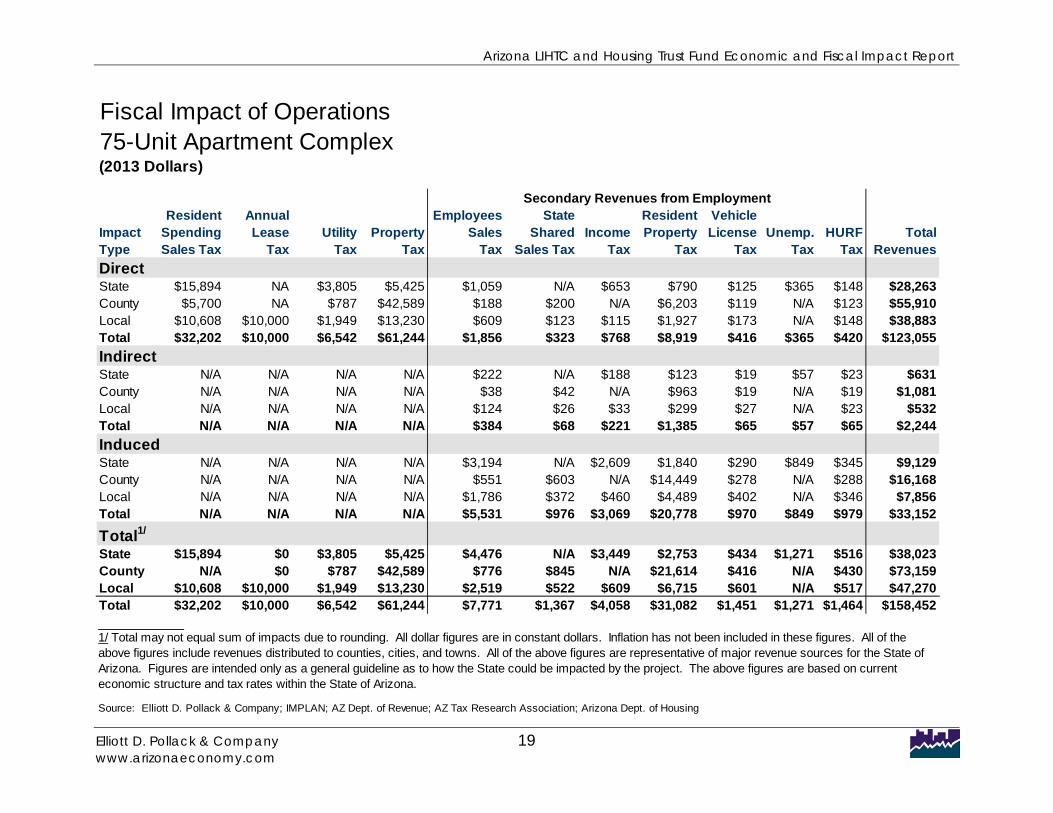
Source: Elliott D. Pollack & Company; IMPLAN; Arizona Department of Housing 5.2 Fiscal Impacts 5.2.1 Fiscal Impact of Construction This example apartment project would create nearly $1.7 million dollars in construction related revenue to the state, county and city it is located in. Of the total, over $523,300 would accrue to the State of Arizona through construction sales tax, use tax, and employee generated taxes. 5.2.2 Fiscal Impact of Operations Once completed, a project of this size would begin generating nearly $158,500 each year after project stabilization. Of the total, over $38,000 would accrue to the Arizona State government. These revenues would be collected on an annual, ongoing basis.

Arizona LIHTC and Housing Trust Fund Economic and Fiscal Impact Report
Elliott D. Pollack & Company 18 www.arizonaeconomy.com
Fiscal Impact from Construction75-Unit Apartment Complex(2013 Dollars)
Construction FF&E Building Employees State Resident VehicleImpact Sales Use Permit/ Sales Shared Income Property License Unemp. HURF TotalType Tax Tax Impact Fees Tax Sales Tax Tax Tax Tax Tax Tax RevenuesDirectState $240,000 $6,000 N/A $53,357 N/A $63,146 $25,868 $4,081 $11,939 $4,852 $409,244County $50,000 $1,000 N/A $9,059 $10,077 N/A $203,091 $3,904 N/A $4,043 $281,174Local $114,000 $2,000 $375,000 $29,392 $6,219 $11,143 $63,091 $5,651 N/A $4,862 $611,358Total $404,000 $9,000 $375,000 $91,807 $16,296 $74,290 $292,050 $13,636 $11,939 $13,758 $1,301,776IndirectState N/A N/A N/A $14,760 N/A $17,376 $7,217 $1,139 $3,331 $1,354 $45,177County N/A N/A N/A $2,508 $2,788 N/A $56,664 $1,089 N/A $1,128 $64,177Local N/A N/A N/A $8,136 $1,720 $3,066 $17,603 $1,577 N/A $1,357 $33,459Total N/A N/A N/A $25,405 $4,508 $20,442 $81,484 $3,805 $3,331 $3,838 $142,813InducedState N/A N/A N/A $22,958 N/A $22,208 $13,144 $2,074 $6,067 $2,466 $68,916County N/A N/A N/A $8,170 $4,336 N/A $103,197 $1,984 N/A $2,054 $119,742Local N/A N/A N/A $12,831 $2,676 $3,919 $32,059 $2,871 N/A $2,471 $56,826Total N/A N/A N/A $43,960 $7,012 $26,127 $148,400 $6,929 $6,067 $6,991 $245,484
Total1/
State $240,000 $6,000 $0 $91,076 N/A $102,730 $46,229 $7,294 $21,337 $8,672 $523,337County $50,000 $1,000 $0 $19,737 $17,201 N/A $362,951 $6,977 N/A $7,226 $465,093Local $114,000 $2,000 $375,000 $50,359 $10,615 $18,129 $112,753 $10,099 N/A $8,689 $701,644Total $404,000 $9,000 $375,000 $161,172 $27,817 $120,858 $521,934 $24,370 $21,337 $24,587 $1,690,074_______________
Source: Elliott D. Pollack & Company; IMPLAN; AZ Dept. of Revenue; AZ Tax Research Association; Arizona Department of Revenue
1/ Total may not equal sum of impacts due to rounding. All dollar figures are in constant dollars. Inflation has not been included in these figures. All of the above figures include revenues distributed to counties, cities, and towns. All of the above figures are representative of major revenue sources for the State of Arizona. Figures are intended only as a general guideline as to how the State could be impacted by the project. The above figures are based on current economic structure and tax rates within the State of Arizona.
Secondary Revenues from Employment
Arizona LIHTC and Housing Trust Fund Economic and Fiscal Impact Report
Elliott D. Pollack & Company 19 www.arizonaeconomy.com
Fiscal Impact of Operations75-Unit Apartment Complex(2013 Dollars)
Resident Annual Employees State Resident VehicleImpact Spending Lease Utility Property Sales Shared Income Property License Unemp. HURF TotalType Sales Tax Tax Tax Tax Tax Sales Tax Tax Tax Tax Tax Tax RevenuesDirectState $15,894 NA $3,805 $5,425 $1,059 N/A $653 $790 $125 $365 $148 $28,263County $5,700 NA $787 $42,589 $188 $200 N/A $6,203 $119 N/A $123 $55,910Local $10,608 $10,000 $1,949 $13,230 $609 $123 $115 $1,927 $173 N/A $148 $38,883Total $32,202 $10,000 $6,542 $61,244 $1,856 $323 $768 $8,919 $416 $365 $420 $123,055IndirectState N/A N/A N/A N/A $222 N/A $188 $123 $19 $57 $23 $631County N/A N/A N/A N/A $38 $42 N/A $963 $19 N/A $19 $1,081Local N/A N/A N/A N/A $124 $26 $33 $299 $27 N/A $23 $532Total N/A N/A N/A N/A $384 $68 $221 $1,385 $65 $57 $65 $2,244InducedState N/A N/A N/A N/A $3,194 N/A $2,609 $1,840 $290 $849 $345 $9,129County N/A N/A N/A N/A $551 $603 N/A $14,449 $278 N/A $288 $16,168Local N/A N/A N/A N/A $1,786 $372 $460 $4,489 $402 N/A $346 $7,856Total N/A N/A N/A N/A $5,531 $976 $3,069 $20,778 $970 $849 $979 $33,152
Total1/
State $15,894 $0 $3,805 $5,425 $4,476 N/A $3,449 $2,753 $434 $1,271 $516 $38,023County N/A $0 $787 $42,589 $776 $845 N/A $21,614 $416 N/A $430 $73,159Local $10,608 $10,000 $1,949 $13,230 $2,519 $522 $609 $6,715 $601 N/A $517 $47,270Total $32,202 $10,000 $6,542 $61,244 $7,771 $1,367 $4,058 $31,082 $1,451 $1,271 $1,464 $158,452_______________
Source: Elliott D. Pollack & Company; IMPLAN; AZ Dept. of Revenue; AZ Tax Research Association; Arizona Dept. of Housing
1/ Total may not equal sum of impacts due to rounding. All dollar figures are in constant dollars. Inflation has not been included in these figures. All of the above figures include revenues distributed to counties, cities, and towns. All of the above figures are representative of major revenue sources for the State of Arizona. Figures are intended only as a general guideline as to how the State could be impacted by the project. The above figures are based on current economic structure and tax rates within the State of Arizona.
Secondary Revenues from Employment