Federal Crop Insurance Corporation Crop Year … RBUP 4 3 1 6 1 851 82,130 17,826 2,560 0 3,054...
106
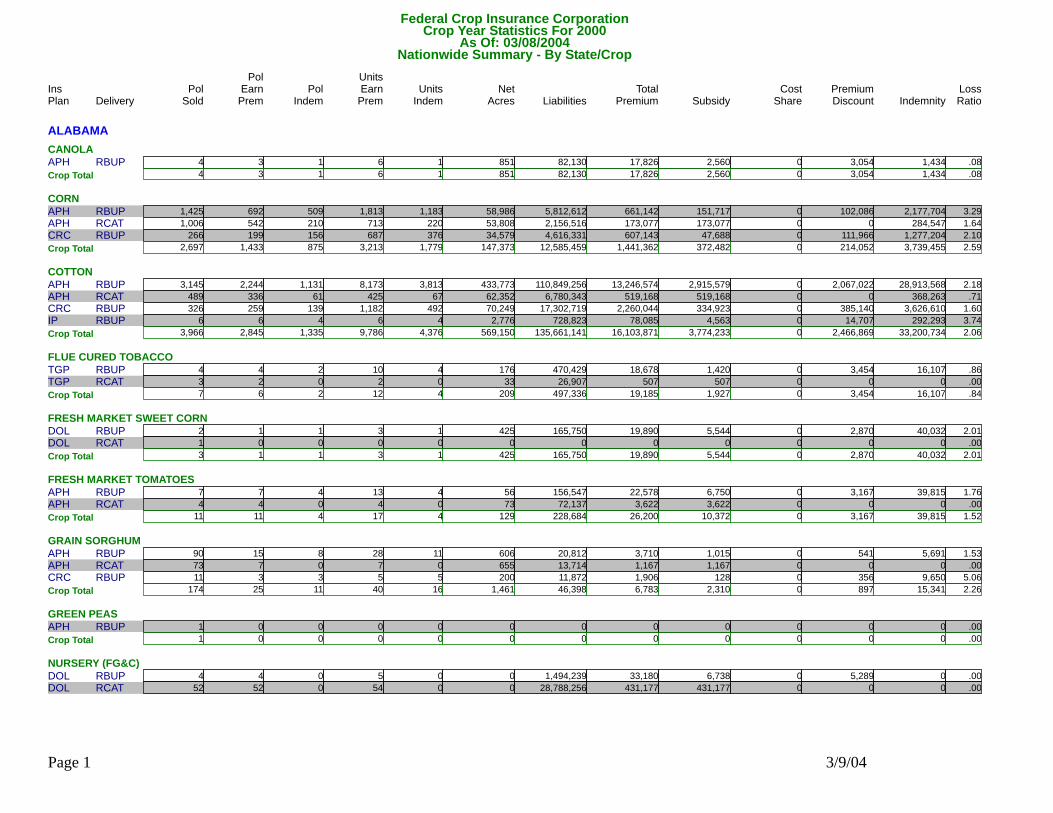
Federal Crop Insurance Corporation Nationwide Summary - By State/Crop Delivery Pol Units Units Net Liabilities Total Subsidy Premium Indemnity Pol Indem Earn Prem Indem Acres Premium Discount Loss Ratio Sold Earn Prem Ins Pol Plan Share Cost Crop Year Statistics For 2000 As Of: 03/08/2004 ALABAMA CANOLA RBUP APH 4 3 1 82,130 6 1 851 17,826 2,560 3,054 1,434 .08 0 4 Crop Total 3 1 6 1 851 82,130 17,826 2,560 3,054 1,434 .08 0 CORN RBUP APH 1,425 692 509 5,812,612 1,813 1,183 58,986 661,142 151,717 102,086 2,177,704 3.29 0 RCAT APH 1,006 542 210 2,156,516 713 220 53,808 173,077 173,077 0 284,547 1.64 0 RBUP CRC 266 199 156 4,616,331 687 376 34,579 607,143 47,688 111,966 1,277,204 2.10 0 2,697 Crop Total 1,433 875 3,213 1,779 147,373 12,585,459 1,441,362 372,482 214,052 3,739,455 2.59 0 COTTON RBUP APH 3,145 2,244 1,131 110,849,256 8,173 3,813 433,773 13,246,574 2,915,579 2,067,022 28,913,568 2.18 0 RCAT APH 489 336 61 6,780,343 425 67 62,352 519,168 519,168 0 368,263 .71 0 RBUP CRC 326 259 139 17,302,719 1,182 492 70,249 2,260,044 334,923 385,140 3,626,610 1.60 0 RBUP IP 6 6 4 728,823 6 4 2,776 78,085 4,563 14,707 292,293 3.74 0 3,966 Crop Total 2,845 1,335 9,786 4,376 569,150 135,661,141 16,103,871 3,774,233 2,466,869 33,200,734 2.06 0 FLUE CURED TOBACCO RBUP TGP 4 4 2 470,429 10 4 176 18,678 1,420 3,454 16,107 .86 0 RCAT TGP 3 2 0 26,907 2 0 33 507 507 0 0 .00 0 7 Crop Total 6 2 12 4 209 497,336 19,185 1,927 3,454 16,107 .84 0 FRESH MARKET SWEET CORN RBUP DOL 2 1 1 165,750 3 1 425 19,890 5,544 2,870 40,032 2.01 0 RCAT DOL 1 0 0 0 0 0 0 0 0 0 0 .00 0 3 Crop Total 1 1 3 1 425 165,750 19,890 5,544 2,870 40,032 2.01 0 FRESH MARKET TOMATOES RBUP APH 7 7 4 156,547 13 4 56 22,578 6,750 3,167 39,815 1.76 0 RCAT APH 4 4 0 72,137 4 0 73 3,622 3,622 0 0 .00 0 11 Crop Total 11 4 17 4 129 228,684 26,200 10,372 3,167 39,815 1.52 0 GRAIN SORGHUM RBUP APH 90 15 8 20,812 28 11 606 3,710 1,015 541 5,691 1.53 0 RCAT APH 73 7 0 13,714 7 0 655 1,167 1,167 0 0 .00 0 RBUP CRC 11 3 3 11,872 5 5 200 1,906 128 356 9,650 5.06 0 174 Crop Total 25 11 40 16 1,461 46,398 6,783 2,310 897 15,341 2.26 0 GREEN PEAS RBUP APH 1 0 0 0 0 0 0 0 0 0 0 .00 0 1 Crop Total 0 0 0 0 0 0 0 0 0 0 .00 0 NURSERY (FG&C) RBUP DOL 4 4 0 1,494,239 5 0 0 33,180 6,738 5,289 0 .00 0 RCAT DOL 52 52 0 28,788,256 54 0 0 431,177 431,177 0 0 .00 0 Page 1 3/9/04
-
Upload
nguyentruc -
Category
Documents
-
view
215 -
download
2
Transcript of Federal Crop Insurance Corporation Crop Year … RBUP 4 3 1 6 1 851 82,130 17,826 2,560 0 3,054...
Federal Crop Insurance CorporationNationwide Summary - By State/Crop
Delivery Pol Units Units Net Liabilities Total Subsidy Premium IndemnityPol
Indem EarnPrem Indem Acres Premium Discount LossRatioSold EarnPremIns PolPlan ShareCost
Crop Year Statistics For 2000As Of: 03/08/2004
ALABAMACANOLA
RBUPAPH 4 3 1 82,1306 1 851 17,826 2,560 3,054 1,434 .0804Crop Total 3 1 6 1 851 82,130 17,826 2,560 3,054 1,434 .080
CORNRBUPAPH 1,425 692 509 5,812,6121,813 1,183 58,986 661,142 151,717 102,086 2,177,704 3.290RCATAPH 1,006 542 210 2,156,516713 220 53,808 173,077 173,077 0 284,547 1.640RBUPCRC 266 199 156 4,616,331687 376 34,579 607,143 47,688 111,966 1,277,204 2.100
2,697Crop Total 1,433 875 3,213 1,779 147,373 12,585,459 1,441,362 372,482 214,052 3,739,455 2.590COTTON
RBUPAPH 3,145 2,244 1,131 110,849,2568,173 3,813 433,773 13,246,574 2,915,579 2,067,022 28,913,568 2.180RCATAPH 489 336 61 6,780,343425 67 62,352 519,168 519,168 0 368,263 .710RBUPCRC 326 259 139 17,302,7191,182 492 70,249 2,260,044 334,923 385,140 3,626,610 1.600RBUPIP 6 6 4 728,8236 4 2,776 78,085 4,563 14,707 292,293 3.7403,966Crop Total 2,845 1,335 9,786 4,376 569,150 135,661,141 16,103,871 3,774,233 2,466,869 33,200,734 2.060
FLUE CURED TOBACCORBUPTGP 4 4 2 470,42910 4 176 18,678 1,420 3,454 16,107 .860RCATTGP 3 2 0 26,9072 0 33 507 507 0 0 .000
7Crop Total 6 2 12 4 209 497,336 19,185 1,927 3,454 16,107 .840FRESH MARKET SWEET CORN
RBUPDOL 2 1 1 165,7503 1 425 19,890 5,544 2,870 40,032 2.010RCATDOL 1 0 0 00 0 0 0 0 0 0 .0003Crop Total 1 1 3 1 425 165,750 19,890 5,544 2,870 40,032 2.010
FRESH MARKET TOMATOESRBUPAPH 7 7 4 156,54713 4 56 22,578 6,750 3,167 39,815 1.760RCATAPH 4 4 0 72,1374 0 73 3,622 3,622 0 0 .000
11Crop Total 11 4 17 4 129 228,684 26,200 10,372 3,167 39,815 1.520GRAIN SORGHUM
RBUPAPH 90 15 8 20,81228 11 606 3,710 1,015 541 5,691 1.530RCATAPH 73 7 0 13,7147 0 655 1,167 1,167 0 0 .000RBUPCRC 11 3 3 11,8725 5 200 1,906 128 356 9,650 5.060174Crop Total 25 11 40 16 1,461 46,398 6,783 2,310 897 15,341 2.260
GREEN PEASRBUPAPH 1 0 0 00 0 0 0 0 0 0 .000
1Crop Total 0 0 0 0 0 0 0 0 0 0 .000NURSERY (FG&C)
RBUPDOL 4 4 0 1,494,2395 0 0 33,180 6,738 5,289 0 .000RCATDOL 52 52 0 28,788,25654 0 0 431,177 431,177 0 0 .000
Page 1 3/9/04
Federal Crop Insurance CorporationNationwide Summary - By State/Crop
Delivery Pol Units Units Net Liabilities Total Subsidy Premium IndemnityPol
Indem EarnPrem Indem Acres Premium Discount LossRatioSold EarnPremIns PolPlan ShareCost
Crop Year Statistics For 2000As Of: 03/08/2004
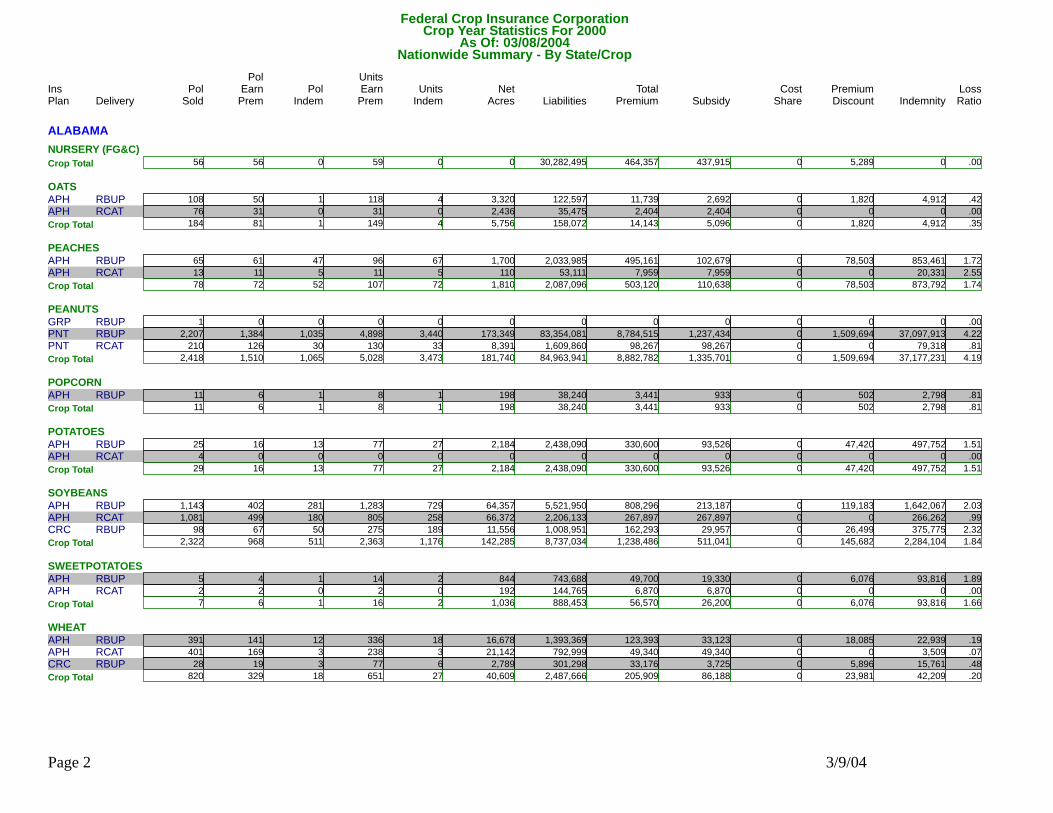
ALABAMANURSERY (FG&C)
56Crop Total 56 0 59 0 0 30,282,495 464,357 437,915 5,289 0 .000OATS
RBUPAPH 108 50 1 122,597118 4 3,320 11,739 2,692 1,820 4,912 .420RCATAPH 76 31 0 35,47531 0 2,436 2,404 2,404 0 0 .000184Crop Total 81 1 149 4 5,756 158,072 14,143 5,096 1,820 4,912 .350
PEACHESRBUPAPH 65 61 47 2,033,98596 67 1,700 495,161 102,679 78,503 853,461 1.720RCATAPH 13 11 5 53,11111 5 110 7,959 7,959 0 20,331 2.550
78Crop Total 72 52 107 72 1,810 2,087,096 503,120 110,638 78,503 873,792 1.740PEANUTS
RBUPGRP 1 0 0 00 0 0 0 0 0 0 .000RBUPPNT 2,207 1,384 1,035 83,354,0814,898 3,440 173,349 8,784,515 1,237,434 1,509,694 37,097,913 4.220RCATPNT 210 126 30 1,609,860130 33 8,391 98,267 98,267 0 79,318 .8102,418Crop Total 1,510 1,065 5,028 3,473 181,740 84,963,941 8,882,782 1,335,701 1,509,694 37,177,231 4.190
POPCORNRBUPAPH 11 6 1 38,2408 1 198 3,441 933 502 2,798 .810
11Crop Total 6 1 8 1 198 38,240 3,441 933 502 2,798 .810POTATOES
RBUPAPH 25 16 13 2,438,09077 27 2,184 330,600 93,526 47,420 497,752 1.510RCATAPH 4 0 0 00 0 0 0 0 0 0 .00029Crop Total 16 13 77 27 2,184 2,438,090 330,600 93,526 47,420 497,752 1.510
SOYBEANSRBUPAPH 1,143 402 281 5,521,9501,283 729 64,357 808,296 213,187 119,183 1,642,067 2.030RCATAPH 1,081 499 180 2,206,133805 258 66,372 267,897 267,897 0 266,262 .990RBUPCRC 98 67 50 1,008,951275 189 11,556 162,293 29,957 26,499 375,775 2.320
2,322Crop Total 968 511 2,363 1,176 142,285 8,737,034 1,238,486 511,041 145,682 2,284,104 1.840SWEETPOTATOES
RBUPAPH 5 4 1 743,68814 2 844 49,700 19,330 6,076 93,816 1.890RCATAPH 2 2 0 144,7652 0 192 6,870 6,870 0 0 .0007Crop Total 6 1 16 2 1,036 888,453 56,570 26,200 6,076 93,816 1.660
WHEATRBUPAPH 391 141 12 1,393,369336 18 16,678 123,393 33,123 18,085 22,939 .190RCATAPH 401 169 3 792,999238 3 21,142 49,340 49,340 0 3,509 .070RBUPCRC 28 19 3 301,29877 6 2,789 33,176 3,725 5,896 15,761 .480
820Crop Total 329 18 651 27 40,609 2,487,666 205,909 86,188 23,981 42,209 .200
Page 2 3/9/04
Federal Crop Insurance CorporationNationwide Summary - By State/Crop
Delivery Pol Units Units Net Liabilities Total Subsidy Premium IndemnityPol
Indem EarnPrem Indem Acres Premium Discount LossRatioSold EarnPremIns PolPlan ShareCost
Crop Year Statistics For 2000As Of: 03/08/2004
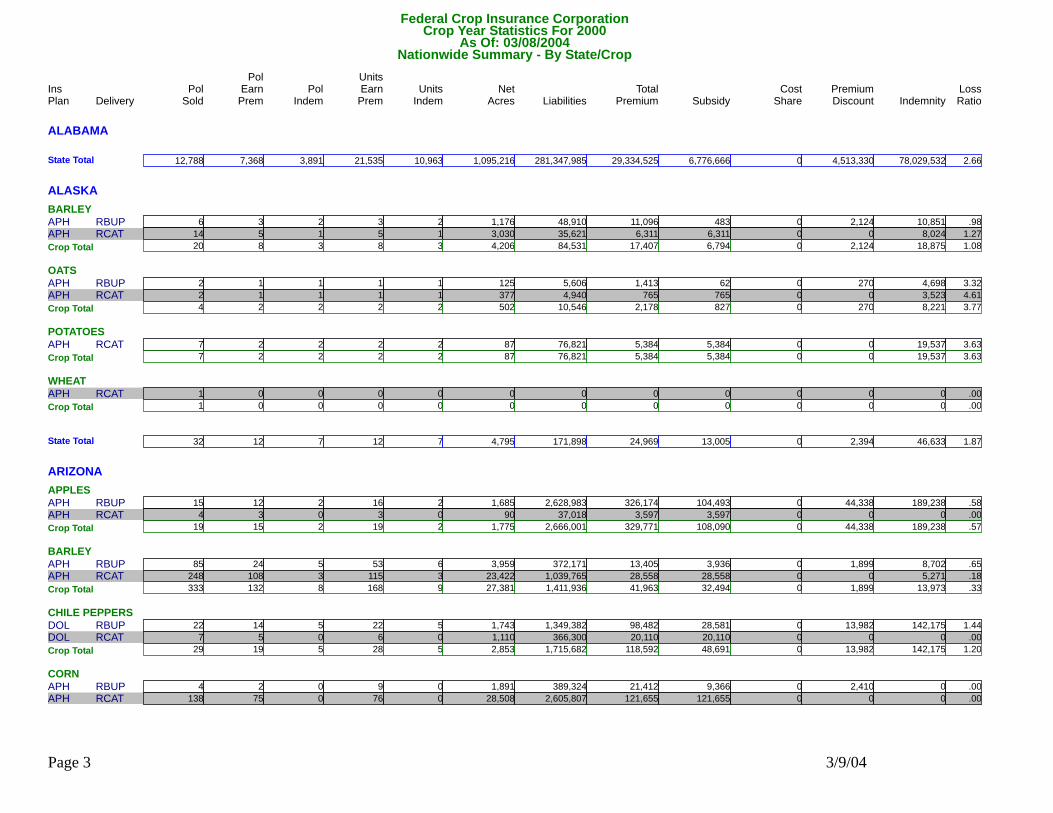
ALABAMA12,788State Total 7,368 3,891 21,535 10,963 1,095,216 281,347,985 29,334,525 6,776,666 4,513,330 78,029,532 2.660
ALASKABARLEY
RBUPAPH 6 3 2 48,9103 2 1,176 11,096 483 2,124 10,851 .980RCATAPH 14 5 1 35,6215 1 3,030 6,311 6,311 0 8,024 1.27020Crop Total 8 3 8 3 4,206 84,531 17,407 6,794 2,124 18,875 1.080
OATSRBUPAPH 2 1 1 5,6061 1 125 1,413 62 270 4,698 3.320RCATAPH 2 1 1 4,9401 1 377 765 765 0 3,523 4.610
4Crop Total 2 2 2 2 502 10,546 2,178 827 270 8,221 3.770POTATOES
RCATAPH 7 2 2 76,8212 2 87 5,384 5,384 0 19,537 3.6307Crop Total 2 2 2 2 87 76,821 5,384 5,384 0 19,537 3.630
WHEATRCATAPH 1 0 0 00 0 0 0 0 0 0 .000
1Crop Total 0 0 0 0 0 0 0 0 0 0 .000
32State Total 12 7 12 7 4,795 171,898 24,969 13,005 2,394 46,633 1.870
ARIZONAAPPLES
RBUPAPH 15 12 2 2,628,98316 2 1,685 326,174 104,493 44,338 189,238 .580RCATAPH 4 3 0 37,0183 0 90 3,597 3,597 0 0 .00019Crop Total 15 2 19 2 1,775 2,666,001 329,771 108,090 44,338 189,238 .570
BARLEYRBUPAPH 85 24 5 372,17153 6 3,959 13,405 3,936 1,899 8,702 .650RCATAPH 248 108 3 1,039,765115 3 23,422 28,558 28,558 0 5,271 .180
333Crop Total 132 8 168 9 27,381 1,411,936 41,963 32,494 1,899 13,973 .330CHILE PEPPERS
RBUPDOL 22 14 5 1,349,38222 5 1,743 98,482 28,581 13,982 142,175 1.440RCATDOL 7 5 0 366,3006 0 1,110 20,110 20,110 0 0 .00029Crop Total 19 5 28 5 2,853 1,715,682 118,592 48,691 13,982 142,175 1.200
CORNRBUPAPH 4 2 0 389,3249 0 1,891 21,412 9,366 2,410 0 .000RCATAPH 138 75 0 2,605,80776 0 28,508 121,655 121,655 0 0 .000
Page 3 3/9/04
Federal Crop Insurance CorporationNationwide Summary - By State/Crop
Delivery Pol Units Units Net Liabilities Total Subsidy Premium IndemnityPol
Indem EarnPrem Indem Acres Premium Discount LossRatioSold EarnPremIns PolPlan ShareCost
Crop Year Statistics For 2000As Of: 03/08/2004
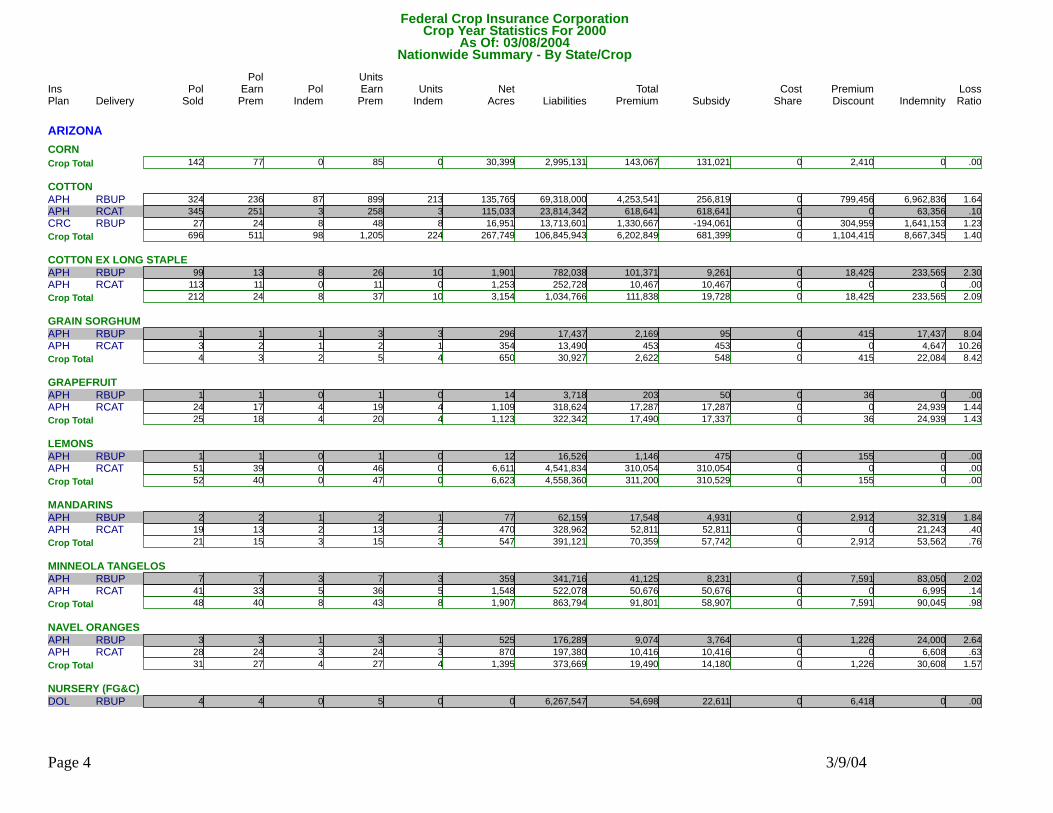
ARIZONACORN
142Crop Total 77 0 85 0 30,399 2,995,131 143,067 131,021 2,410 0 .000COTTON
RBUPAPH 324 236 87 69,318,000899 213 135,765 4,253,541 256,819 799,456 6,962,836 1.640RCATAPH 345 251 3 23,814,342258 3 115,033 618,641 618,641 0 63,356 .100RBUPCRC 27 24 8 13,713,60148 8 16,951 1,330,667 -194,061 304,959 1,641,153 1.230696Crop Total 511 98 1,205 224 267,749 106,845,943 6,202,849 681,399 1,104,415 8,667,345 1.400
COTTON EX LONG STAPLERBUPAPH 99 13 8 782,03826 10 1,901 101,371 9,261 18,425 233,565 2.300RCATAPH 113 11 0 252,72811 0 1,253 10,467 10,467 0 0 .000
212Crop Total 24 8 37 10 3,154 1,034,766 111,838 19,728 18,425 233,565 2.090GRAIN SORGHUM
RBUPAPH 1 1 1 17,4373 3 296 2,169 95 415 17,437 8.040RCATAPH 3 2 1 13,4902 1 354 453 453 0 4,647 10.2604Crop Total 3 2 5 4 650 30,927 2,622 548 415 22,084 8.420
GRAPEFRUITRBUPAPH 1 1 0 3,7181 0 14 203 50 36 0 .000RCATAPH 24 17 4 318,62419 4 1,109 17,287 17,287 0 24,939 1.440
25Crop Total 18 4 20 4 1,123 322,342 17,490 17,337 36 24,939 1.430LEMONS
RBUPAPH 1 1 0 16,5261 0 12 1,146 475 155 0 .000RCATAPH 51 39 0 4,541,83446 0 6,611 310,054 310,054 0 0 .00052Crop Total 40 0 47 0 6,623 4,558,360 311,200 310,529 155 0 .000
MANDARINSRBUPAPH 2 2 1 62,1592 1 77 17,548 4,931 2,912 32,319 1.840RCATAPH 19 13 2 328,96213 2 470 52,811 52,811 0 21,243 .400
21Crop Total 15 3 15 3 547 391,121 70,359 57,742 2,912 53,562 .760MINNEOLA TANGELOS
RBUPAPH 7 7 3 341,7167 3 359 41,125 8,231 7,591 83,050 2.020RCATAPH 41 33 5 522,07836 5 1,548 50,676 50,676 0 6,995 .14048Crop Total 40 8 43 8 1,907 863,794 91,801 58,907 7,591 90,045 .980
NAVEL ORANGESRBUPAPH 3 3 1 176,2893 1 525 9,074 3,764 1,226 24,000 2.640RCATAPH 28 24 3 197,38024 3 870 10,416 10,416 0 6,608 .630
31Crop Total 27 4 27 4 1,395 373,669 19,490 14,180 1,226 30,608 1.570NURSERY (FG&C)
RBUPDOL 4 4 0 6,267,5475 0 0 54,698 22,611 6,418 0 .000
Page 4 3/9/04
Federal Crop Insurance CorporationNationwide Summary - By State/Crop
Delivery Pol Units Units Net Liabilities Total Subsidy Premium IndemnityPol
Indem EarnPrem Indem Acres Premium Discount LossRatioSold EarnPremIns PolPlan ShareCost
Crop Year Statistics For 2000As Of: 03/08/2004
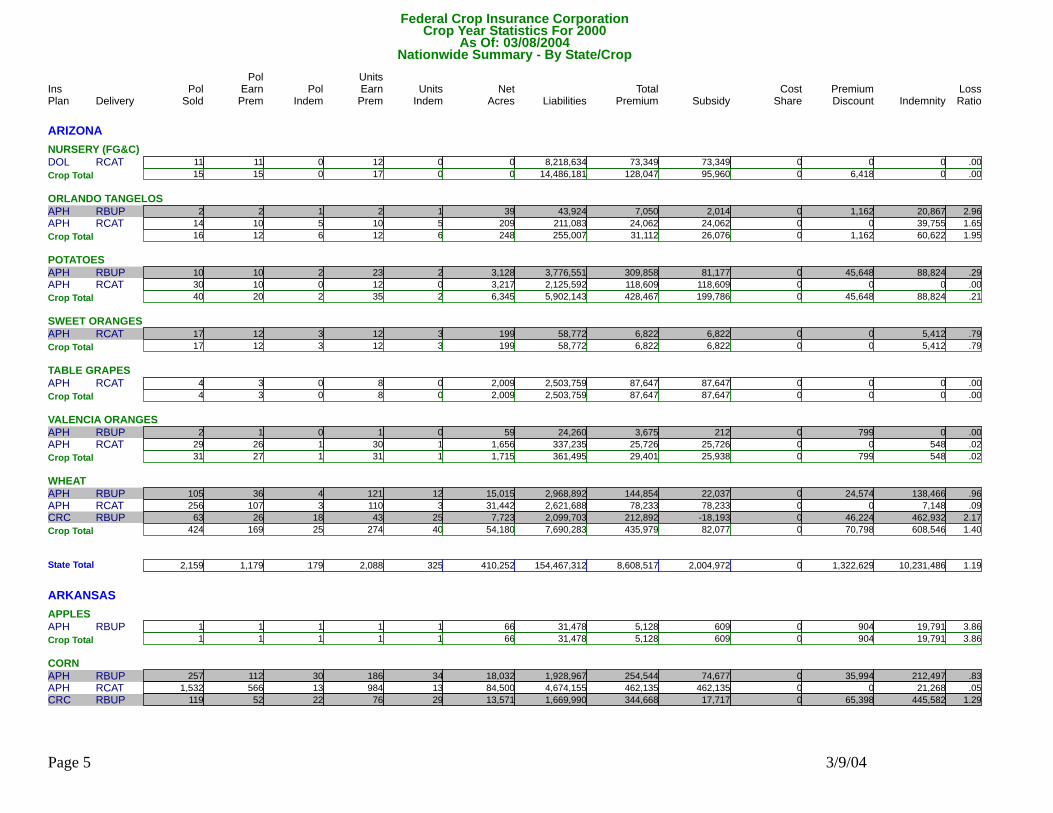
ARIZONANURSERY (FG&C)
RCATDOL 11 11 0 8,218,63412 0 0 73,349 73,349 0 0 .00015Crop Total 15 0 17 0 0 14,486,181 128,047 95,960 6,418 0 .000
ORLANDO TANGELOSRBUPAPH 2 2 1 43,9242 1 39 7,050 2,014 1,162 20,867 2.960RCATAPH 14 10 5 211,08310 5 209 24,062 24,062 0 39,755 1.650
16Crop Total 12 6 12 6 248 255,007 31,112 26,076 1,162 60,622 1.950POTATOES
RBUPAPH 10 10 2 3,776,55123 2 3,128 309,858 81,177 45,648 88,824 .290RCATAPH 30 10 0 2,125,59212 0 3,217 118,609 118,609 0 0 .00040Crop Total 20 2 35 2 6,345 5,902,143 428,467 199,786 45,648 88,824 .210
SWEET ORANGESRCATAPH 17 12 3 58,77212 3 199 6,822 6,822 0 5,412 .790
17Crop Total 12 3 12 3 199 58,772 6,822 6,822 0 5,412 .790TABLE GRAPES
RCATAPH 4 3 0 2,503,7598 0 2,009 87,647 87,647 0 0 .0004Crop Total 3 0 8 0 2,009 2,503,759 87,647 87,647 0 0 .000
VALENCIA ORANGESRBUPAPH 2 1 0 24,2601 0 59 3,675 212 799 0 .000RCATAPH 29 26 1 337,23530 1 1,656 25,726 25,726 0 548 .020
31Crop Total 27 1 31 1 1,715 361,495 29,401 25,938 799 548 .020WHEAT
RBUPAPH 105 36 4 2,968,892121 12 15,015 144,854 22,037 24,574 138,466 .960RCATAPH 256 107 3 2,621,688110 3 31,442 78,233 78,233 0 7,148 .090RBUPCRC 63 26 18 2,099,70343 25 7,723 212,892 -18,193 46,224 462,932 2.170424Crop Total 169 25 274 40 54,180 7,690,283 435,979 82,077 70,798 608,546 1.400
2,159State Total 1,179 179 2,088 325 410,252 154,467,312 8,608,517 2,004,972 1,322,629 10,231,486 1.190
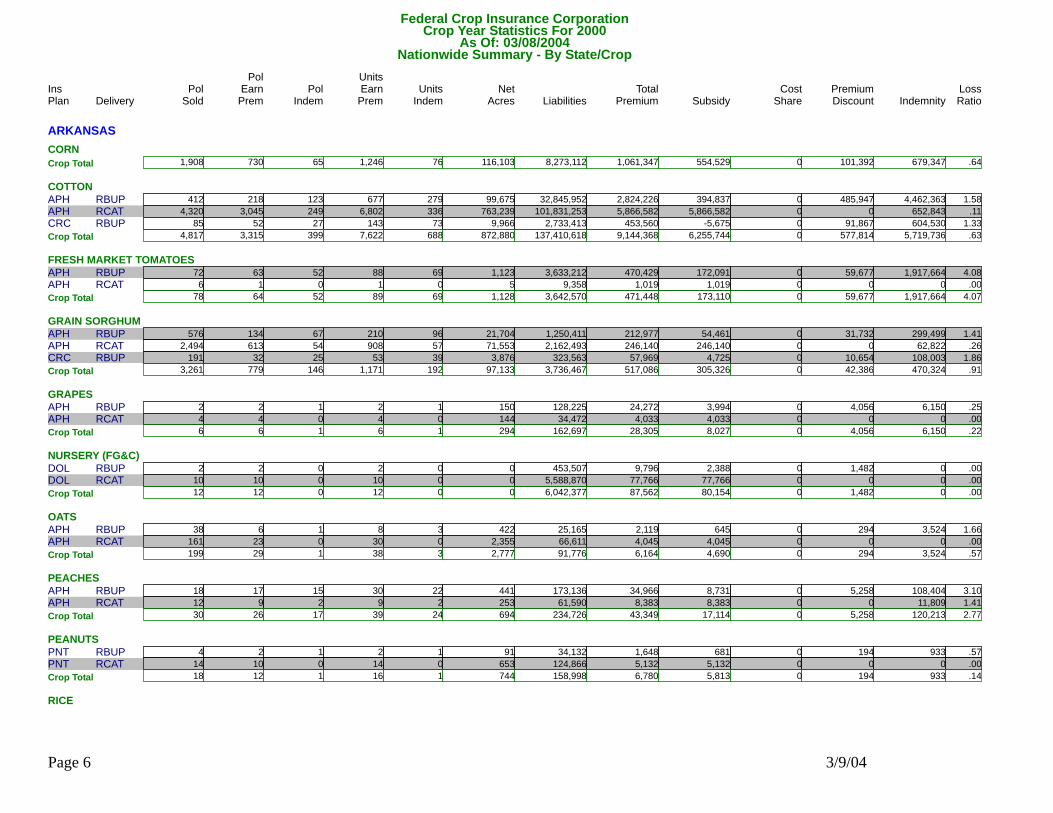
ARKANSASAPPLES
RBUPAPH 1 1 1 31,4781 1 66 5,128 609 904 19,791 3.8601Crop Total 1 1 1 1 66 31,478 5,128 609 904 19,791 3.860
CORNRBUPAPH 257 112 30 1,928,967186 34 18,032 254,544 74,677 35,994 212,497 .830RCATAPH 1,532 566 13 4,674,155984 13 84,500 462,135 462,135 0 21,268 .050RBUPCRC 119 52 22 1,669,99076 29 13,571 344,668 17,717 65,398 445,582 1.290
Page 5 3/9/04
Federal Crop Insurance CorporationNationwide Summary - By State/Crop
Delivery Pol Units Units Net Liabilities Total Subsidy Premium IndemnityPol
Indem EarnPrem Indem Acres Premium Discount LossRatioSold EarnPremIns PolPlan ShareCost
Crop Year Statistics For 2000As Of: 03/08/2004
ARKANSASCORN
1,908Crop Total 730 65 1,246 76 116,103 8,273,112 1,061,347 554,529 101,392 679,347 .640COTTON
RBUPAPH 412 218 123 32,845,952677 279 99,675 2,824,226 394,837 485,947 4,462,363 1.580RCATAPH 4,320 3,045 249 101,831,2536,802 336 763,239 5,866,582 5,866,582 0 652,843 .110RBUPCRC 85 52 27 2,733,413143 73 9,966 453,560 -5,675 91,867 604,530 1.3304,817Crop Total 3,315 399 7,622 688 872,880 137,410,618 9,144,368 6,255,744 577,814 5,719,736 .630
FRESH MARKET TOMATOESRBUPAPH 72 63 52 3,633,21288 69 1,123 470,429 172,091 59,677 1,917,664 4.080RCATAPH 6 1 0 9,3581 0 5 1,019 1,019 0 0 .000
78Crop Total 64 52 89 69 1,128 3,642,570 471,448 173,110 59,677 1,917,664 4.070GRAIN SORGHUM
RBUPAPH 576 134 67 1,250,411210 96 21,704 212,977 54,461 31,732 299,499 1.410RCATAPH 2,494 613 54 2,162,493908 57 71,553 246,140 246,140 0 62,822 .260RBUPCRC 191 32 25 323,56353 39 3,876 57,969 4,725 10,654 108,003 1.8603,261Crop Total 779 146 1,171 192 97,133 3,736,467 517,086 305,326 42,386 470,324 .910
GRAPESRBUPAPH 2 2 1 128,2252 1 150 24,272 3,994 4,056 6,150 .250RCATAPH 4 4 0 34,4724 0 144 4,033 4,033 0 0 .000
6Crop Total 6 1 6 1 294 162,697 28,305 8,027 4,056 6,150 .220NURSERY (FG&C)
RBUPDOL 2 2 0 453,5072 0 0 9,796 2,388 1,482 0 .000RCATDOL 10 10 0 5,588,87010 0 0 77,766 77,766 0 0 .00012Crop Total 12 0 12 0 0 6,042,377 87,562 80,154 1,482 0 .000
OATSRBUPAPH 38 6 1 25,1658 3 422 2,119 645 294 3,524 1.660RCATAPH 161 23 0 66,61130 0 2,355 4,045 4,045 0 0 .000
199Crop Total 29 1 38 3 2,777 91,776 6,164 4,690 294 3,524 .570PEACHES
RBUPAPH 18 17 15 173,13630 22 441 34,966 8,731 5,258 108,404 3.100RCATAPH 12 9 2 61,5909 2 253 8,383 8,383 0 11,809 1.41030Crop Total 26 17 39 24 694 234,726 43,349 17,114 5,258 120,213 2.770
PEANUTSRBUPPNT 4 2 1 34,1322 1 91 1,648 681 194 933 .570RCATPNT 14 10 0 124,86614 0 653 5,132 5,132 0 0 .000
18Crop Total 12 1 16 1 744 158,998 6,780 5,813 194 933 .140RICE
Page 6 3/9/04
Federal Crop Insurance CorporationNationwide Summary - By State/Crop
Delivery Pol Units Units Net Liabilities Total Subsidy Premium IndemnityPol
Indem EarnPrem Indem Acres Premium Discount LossRatioSold EarnPremIns PolPlan ShareCost
Crop Year Statistics For 2000As Of: 03/08/2004
ARKANSASRICE
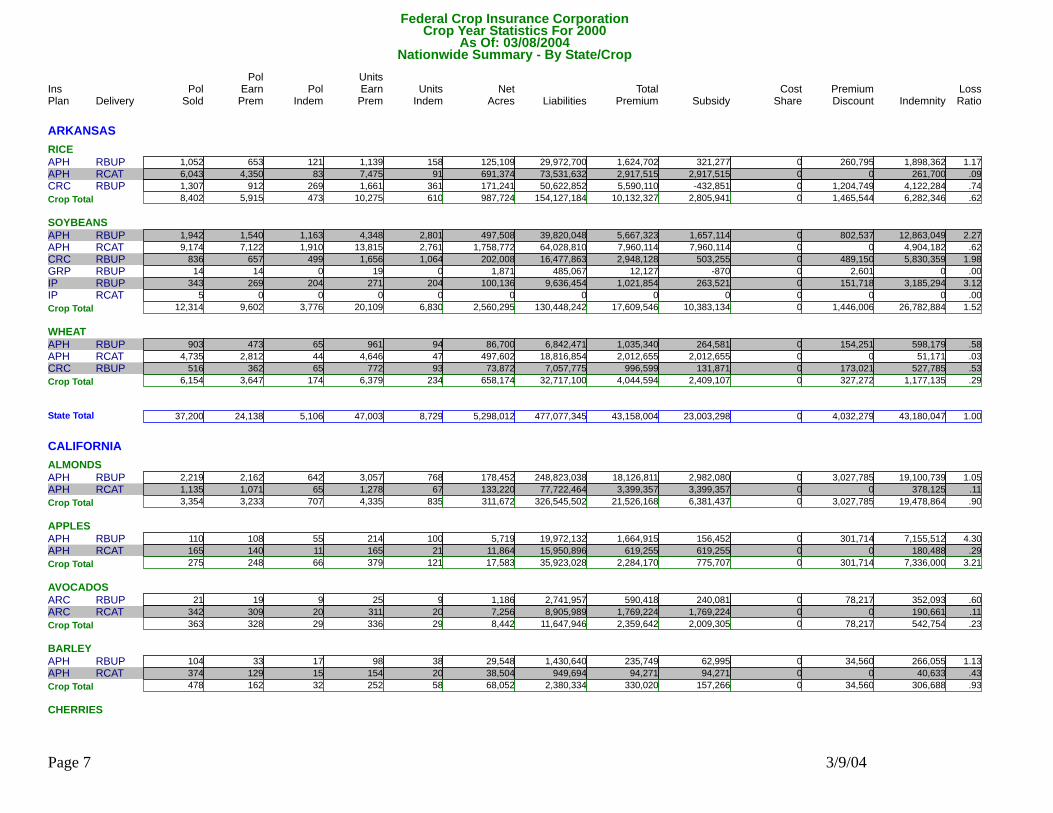
RBUPAPH 1,052 653 121 29,972,7001,139 158 125,109 1,624,702 321,277 260,795 1,898,362 1.170RCATAPH 6,043 4,350 83 73,531,6327,475 91 691,374 2,917,515 2,917,515 0 261,700 .090RBUPCRC 1,307 912 269 50,622,8521,661 361 171,241 5,590,110 -432,851 1,204,749 4,122,284 .7408,402Crop Total 5,915 473 10,275 610 987,724 154,127,184 10,132,327 2,805,941 1,465,544 6,282,346 .620
SOYBEANSRBUPAPH 1,942 1,540 1,163 39,820,0484,348 2,801 497,508 5,667,323 1,657,114 802,537 12,863,049 2.270RCATAPH 9,174 7,122 1,910 64,028,81013,815 2,761 1,758,772 7,960,114 7,960,114 0 4,904,182 .620RBUPCRC 836 657 499 16,477,8631,656 1,064 202,008 2,948,128 503,255 489,150 5,830,359 1.980RBUPGRP 14 14 0 485,06719 0 1,871 12,127 -870 2,601 0 .000RBUPIP 343 269 204 9,636,454271 204 100,136 1,021,854 263,521 151,718 3,185,294 3.120RCATIP 5 0 0 00 0 0 0 0 0 0 .000
12,314Crop Total 9,602 3,776 20,109 6,830 2,560,295 130,448,242 17,609,546 10,383,134 1,446,006 26,782,884 1.520WHEAT
RBUPAPH 903 473 65 6,842,471961 94 86,700 1,035,340 264,581 154,251 598,179 .580RCATAPH 4,735 2,812 44 18,816,8544,646 47 497,602 2,012,655 2,012,655 0 51,171 .030RBUPCRC 516 362 65 7,057,775772 93 73,872 996,599 131,871 173,021 527,785 .5306,154Crop Total 3,647 174 6,379 234 658,174 32,717,100 4,044,594 2,409,107 327,272 1,177,135 .290
37,200State Total 24,138 5,106 47,003 8,729 5,298,012 477,077,345 43,158,004 23,003,298 4,032,279 43,180,047 1.000
CALIFORNIAALMONDS
RBUPAPH 2,219 2,162 642 248,823,0383,057 768 178,452 18,126,811 2,982,080 3,027,785 19,100,739 1.050RCATAPH 1,135 1,071 65 77,722,4641,278 67 133,220 3,399,357 3,399,357 0 378,125 .1103,354Crop Total 3,233 707 4,335 835 311,672 326,545,502 21,526,168 6,381,437 3,027,785 19,478,864 .900
APPLESRBUPAPH 110 108 55 19,972,132214 100 5,719 1,664,915 156,452 301,714 7,155,512 4.300RCATAPH 165 140 11 15,950,896165 21 11,864 619,255 619,255 0 180,488 .290
275Crop Total 248 66 379 121 17,583 35,923,028 2,284,170 775,707 301,714 7,336,000 3.210AVOCADOS
RBUPARC 21 19 9 2,741,95725 9 1,186 590,418 240,081 78,217 352,093 .600RCATARC 342 309 20 8,905,989311 20 7,256 1,769,224 1,769,224 0 190,661 .110363Crop Total 328 29 336 29 8,442 11,647,946 2,359,642 2,009,305 78,217 542,754 .230
BARLEYRBUPAPH 104 33 17 1,430,64098 38 29,548 235,749 62,995 34,560 266,055 1.130RCATAPH 374 129 15 949,694154 20 38,504 94,271 94,271 0 40,633 .430
478Crop Total 162 32 252 58 68,052 2,380,334 330,020 157,266 34,560 306,688 .930CHERRIES
Page 7 3/9/04
Federal Crop Insurance CorporationNationwide Summary - By State/Crop
Delivery Pol Units Units Net Liabilities Total Subsidy Premium IndemnityPol
Indem EarnPrem Indem Acres Premium Discount LossRatioSold EarnPremIns PolPlan ShareCost
Crop Year Statistics For 2000As Of: 03/08/2004
CALIFORNIACHERRIES
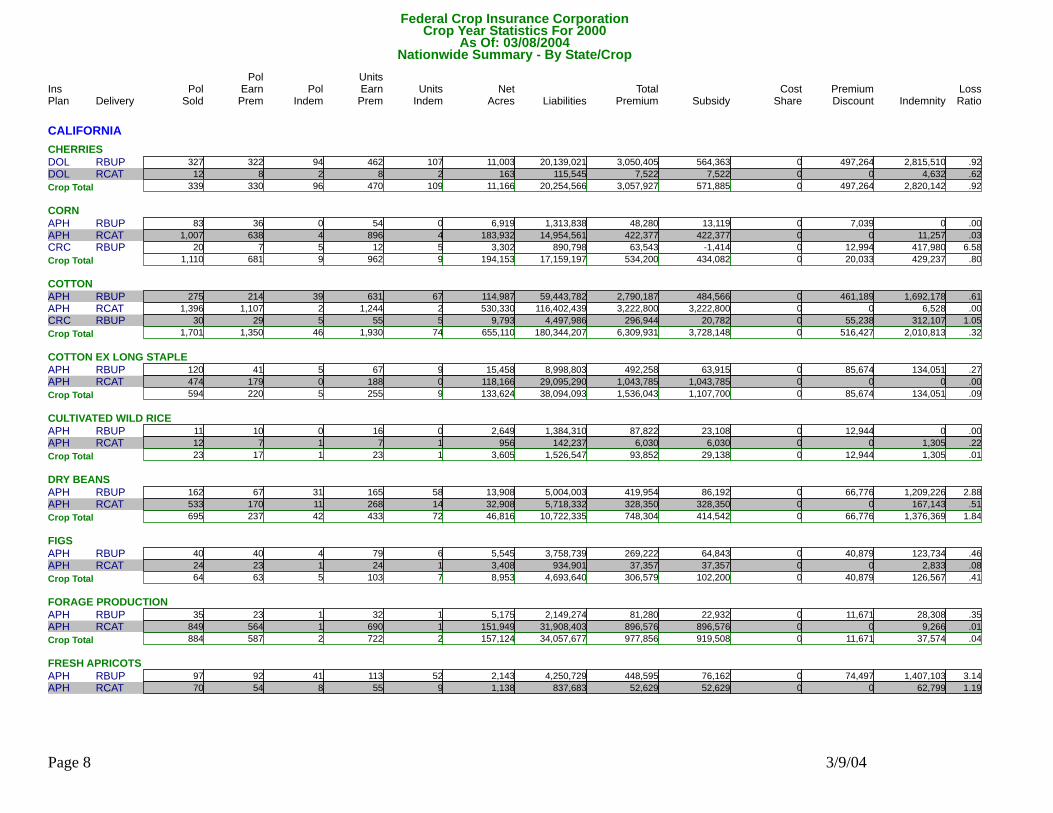
RBUPDOL 327 322 94 20,139,021462 107 11,003 3,050,405 564,363 497,264 2,815,510 .920RCATDOL 12 8 2 115,5458 2 163 7,522 7,522 0 4,632 .620339Crop Total 330 96 470 109 11,166 20,254,566 3,057,927 571,885 497,264 2,820,142 .920
CORNRBUPAPH 83 36 0 1,313,83854 0 6,919 48,280 13,119 7,039 0 .000RCATAPH 1,007 638 4 14,954,561896 4 183,932 422,377 422,377 0 11,257 .030RBUPCRC 20 7 5 890,79812 5 3,302 63,543 -1,414 12,994 417,980 6.580
1,110Crop Total 681 9 962 9 194,153 17,159,197 534,200 434,082 20,033 429,237 .800COTTON
RBUPAPH 275 214 39 59,443,782631 67 114,987 2,790,187 484,566 461,189 1,692,178 .610RCATAPH 1,396 1,107 2 116,402,4391,244 2 530,330 3,222,800 3,222,800 0 6,528 .000RBUPCRC 30 29 5 4,497,98655 5 9,793 296,944 20,782 55,238 312,107 1.0501,701Crop Total 1,350 46 1,930 74 655,110 180,344,207 6,309,931 3,728,148 516,427 2,010,813 .320
COTTON EX LONG STAPLERBUPAPH 120 41 5 8,998,80367 9 15,458 492,258 63,915 85,674 134,051 .270RCATAPH 474 179 0 29,095,290188 0 118,166 1,043,785 1,043,785 0 0 .000
594Crop Total 220 5 255 9 133,624 38,094,093 1,536,043 1,107,700 85,674 134,051 .090CULTIVATED WILD RICE
RBUPAPH 11 10 0 1,384,31016 0 2,649 87,822 23,108 12,944 0 .000RCATAPH 12 7 1 142,2377 1 956 6,030 6,030 0 1,305 .22023Crop Total 17 1 23 1 3,605 1,526,547 93,852 29,138 12,944 1,305 .010
DRY BEANSRBUPAPH 162 67 31 5,004,003165 58 13,908 419,954 86,192 66,776 1,209,226 2.880RCATAPH 533 170 11 5,718,332268 14 32,908 328,350 328,350 0 167,143 .510
695Crop Total 237 42 433 72 46,816 10,722,335 748,304 414,542 66,776 1,376,369 1.840FIGS
RBUPAPH 40 40 4 3,758,73979 6 5,545 269,222 64,843 40,879 123,734 .460RCATAPH 24 23 1 934,90124 1 3,408 37,357 37,357 0 2,833 .08064Crop Total 63 5 103 7 8,953 4,693,640 306,579 102,200 40,879 126,567 .410
FORAGE PRODUCTIONRBUPAPH 35 23 1 2,149,27432 1 5,175 81,280 22,932 11,671 28,308 .350RCATAPH 849 564 1 31,908,403690 1 151,949 896,576 896,576 0 9,266 .010
884Crop Total 587 2 722 2 157,124 34,057,677 977,856 919,508 11,671 37,574 .040FRESH APRICOTS
RBUPAPH 97 92 41 4,250,729113 52 2,143 448,595 76,162 74,497 1,407,103 3.140RCATAPH 70 54 8 837,68355 9 1,138 52,629 52,629 0 62,799 1.190
Page 8 3/9/04
Federal Crop Insurance CorporationNationwide Summary - By State/Crop
Delivery Pol Units Units Net Liabilities Total Subsidy Premium IndemnityPol
Indem EarnPrem Indem Acres Premium Discount LossRatioSold EarnPremIns PolPlan ShareCost
Crop Year Statistics For 2000As Of: 03/08/2004
CALIFORNIAFRESH APRICOTS
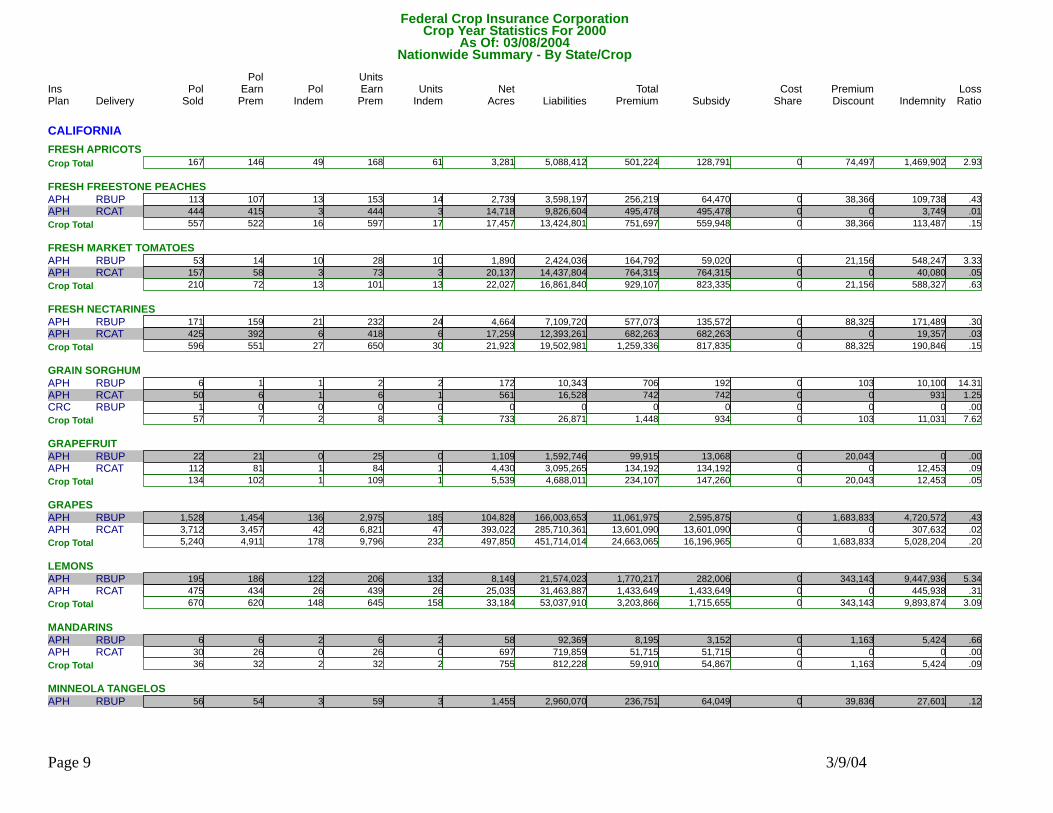
167Crop Total 146 49 168 61 3,281 5,088,412 501,224 128,791 74,497 1,469,902 2.930FRESH FREESTONE PEACHES
RBUPAPH 113 107 13 3,598,197153 14 2,739 256,219 64,470 38,366 109,738 .430RCATAPH 444 415 3 9,826,604444 3 14,718 495,478 495,478 0 3,749 .010557Crop Total 522 16 597 17 17,457 13,424,801 751,697 559,948 38,366 113,487 .150
FRESH MARKET TOMATOESRBUPAPH 53 14 10 2,424,03628 10 1,890 164,792 59,020 21,156 548,247 3.330RCATAPH 157 58 3 14,437,80473 3 20,137 764,315 764,315 0 40,080 .050
210Crop Total 72 13 101 13 22,027 16,861,840 929,107 823,335 21,156 588,327 .630FRESH NECTARINES
RBUPAPH 171 159 21 7,109,720232 24 4,664 577,073 135,572 88,325 171,489 .300RCATAPH 425 392 6 12,393,261418 6 17,259 682,263 682,263 0 19,357 .030596Crop Total 551 27 650 30 21,923 19,502,981 1,259,336 817,835 88,325 190,846 .150
GRAIN SORGHUMRBUPAPH 6 1 1 10,3432 2 172 706 192 103 10,100 14.310RCATAPH 50 6 1 16,5286 1 561 742 742 0 931 1.250RBUPCRC 1 0 0 00 0 0 0 0 0 0 .000
57Crop Total 7 2 8 3 733 26,871 1,448 934 103 11,031 7.620GRAPEFRUIT
RBUPAPH 22 21 0 1,592,74625 0 1,109 99,915 13,068 20,043 0 .000RCATAPH 112 81 1 3,095,26584 1 4,430 134,192 134,192 0 12,453 .090134Crop Total 102 1 109 1 5,539 4,688,011 234,107 147,260 20,043 12,453 .050
GRAPESRBUPAPH 1,528 1,454 136 166,003,6532,975 185 104,828 11,061,975 2,595,875 1,683,833 4,720,572 .430RCATAPH 3,712 3,457 42 285,710,3616,821 47 393,022 13,601,090 13,601,090 0 307,632 .020
5,240Crop Total 4,911 178 9,796 232 497,850 451,714,014 24,663,065 16,196,965 1,683,833 5,028,204 .200LEMONS
RBUPAPH 195 186 122 21,574,023206 132 8,149 1,770,217 282,006 343,143 9,447,936 5.340RCATAPH 475 434 26 31,463,887439 26 25,035 1,433,649 1,433,649 0 445,938 .310670Crop Total 620 148 645 158 33,184 53,037,910 3,203,866 1,715,655 343,143 9,893,874 3.090
MANDARINSRBUPAPH 6 6 2 92,3696 2 58 8,195 3,152 1,163 5,424 .660RCATAPH 30 26 0 719,85926 0 697 51,715 51,715 0 0 .000
36Crop Total 32 2 32 2 755 812,228 59,910 54,867 1,163 5,424 .090MINNEOLA TANGELOS
RBUPAPH 56 54 3 2,960,07059 3 1,455 236,751 64,049 39,836 27,601 .120
Page 9 3/9/04
Federal Crop Insurance CorporationNationwide Summary - By State/Crop
Delivery Pol Units Units Net Liabilities Total Subsidy Premium IndemnityPol
Indem EarnPrem Indem Acres Premium Discount LossRatioSold EarnPremIns PolPlan ShareCost
Crop Year Statistics For 2000As Of: 03/08/2004
CALIFORNIAMINNEOLA TANGELOS
RCATAPH 55 51 1 687,10451 1 917 45,089 45,089 0 2,059 .050111Crop Total 105 4 110 4 2,372 3,647,174 281,840 109,138 39,836 29,660 .110
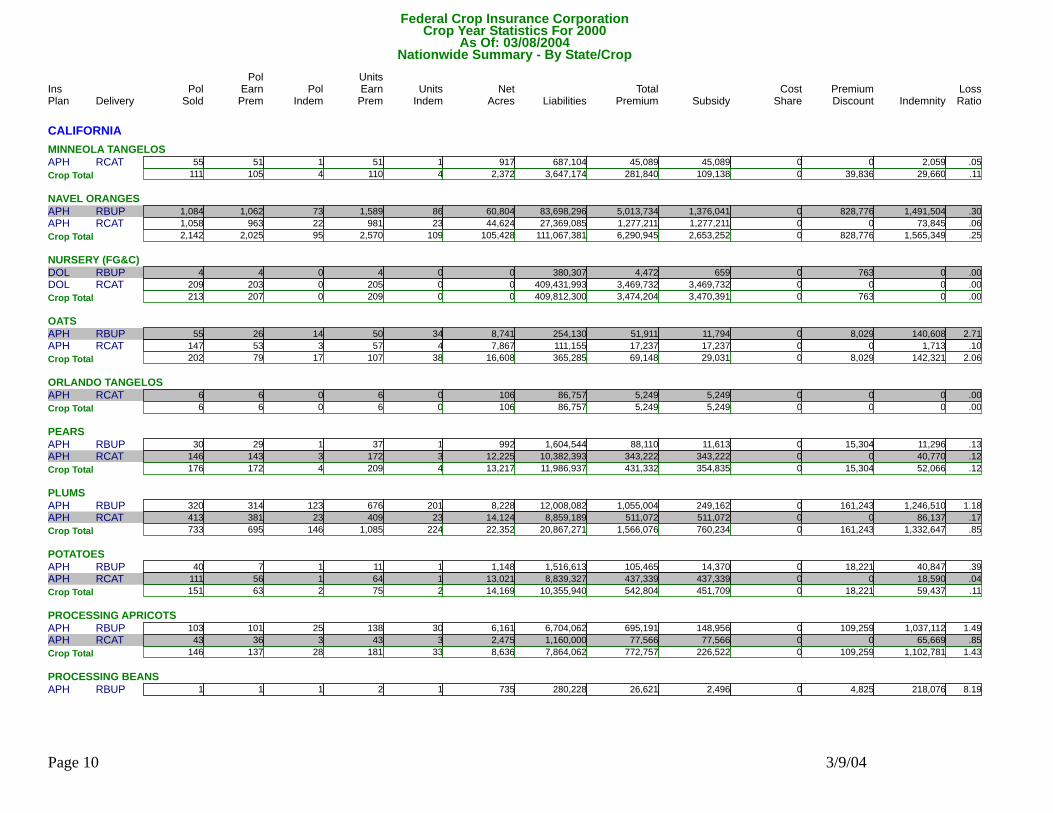
NAVEL ORANGESRBUPAPH 1,084 1,062 73 83,698,2961,589 86 60,804 5,013,734 1,376,041 828,776 1,491,504 .300RCATAPH 1,058 963 22 27,369,085981 23 44,624 1,277,211 1,277,211 0 73,845 .060
2,142Crop Total 2,025 95 2,570 109 105,428 111,067,381 6,290,945 2,653,252 828,776 1,565,349 .250NURSERY (FG&C)
RBUPDOL 4 4 0 380,3074 0 0 4,472 659 763 0 .000RCATDOL 209 203 0 409,431,993205 0 0 3,469,732 3,469,732 0 0 .000213Crop Total 207 0 209 0 0 409,812,300 3,474,204 3,470,391 763 0 .000
OATSRBUPAPH 55 26 14 254,13050 34 8,741 51,911 11,794 8,029 140,608 2.710RCATAPH 147 53 3 111,15557 4 7,867 17,237 17,237 0 1,713 .100
202Crop Total 79 17 107 38 16,608 365,285 69,148 29,031 8,029 142,321 2.060ORLANDO TANGELOS
RCATAPH 6 6 0 86,7576 0 106 5,249 5,249 0 0 .0006Crop Total 6 0 6 0 106 86,757 5,249 5,249 0 0 .000
PEARSRBUPAPH 30 29 1 1,604,54437 1 992 88,110 11,613 15,304 11,296 .130RCATAPH 146 143 3 10,382,393172 3 12,225 343,222 343,222 0 40,770 .120
176Crop Total 172 4 209 4 13,217 11,986,937 431,332 354,835 15,304 52,066 .120PLUMS
RBUPAPH 320 314 123 12,008,082676 201 8,228 1,055,004 249,162 161,243 1,246,510 1.180RCATAPH 413 381 23 8,859,189409 23 14,124 511,072 511,072 0 86,137 .170733Crop Total 695 146 1,085 224 22,352 20,867,271 1,566,076 760,234 161,243 1,332,647 .850
POTATOESRBUPAPH 40 7 1 1,516,61311 1 1,148 105,465 14,370 18,221 40,847 .390RCATAPH 111 56 1 8,839,32764 1 13,021 437,339 437,339 0 18,590 .040
151Crop Total 63 2 75 2 14,169 10,355,940 542,804 451,709 18,221 59,437 .110PROCESSING APRICOTS
RBUPAPH 103 101 25 6,704,062138 30 6,161 695,191 148,956 109,259 1,037,112 1.490RCATAPH 43 36 3 1,160,00043 3 2,475 77,566 77,566 0 65,669 .850146Crop Total 137 28 181 33 8,636 7,864,062 772,757 226,522 109,259 1,102,781 1.430
PROCESSING BEANSRBUPAPH 1 1 1 280,2282 1 735 26,621 2,496 4,825 218,076 8.190
Page 10 3/9/04
Federal Crop Insurance CorporationNationwide Summary - By State/Crop
Delivery Pol Units Units Net Liabilities Total Subsidy Premium IndemnityPol
Indem EarnPrem Indem Acres Premium Discount LossRatioSold EarnPremIns PolPlan ShareCost
Crop Year Statistics For 2000As Of: 03/08/2004
CALIFORNIAPROCESSING BEANS
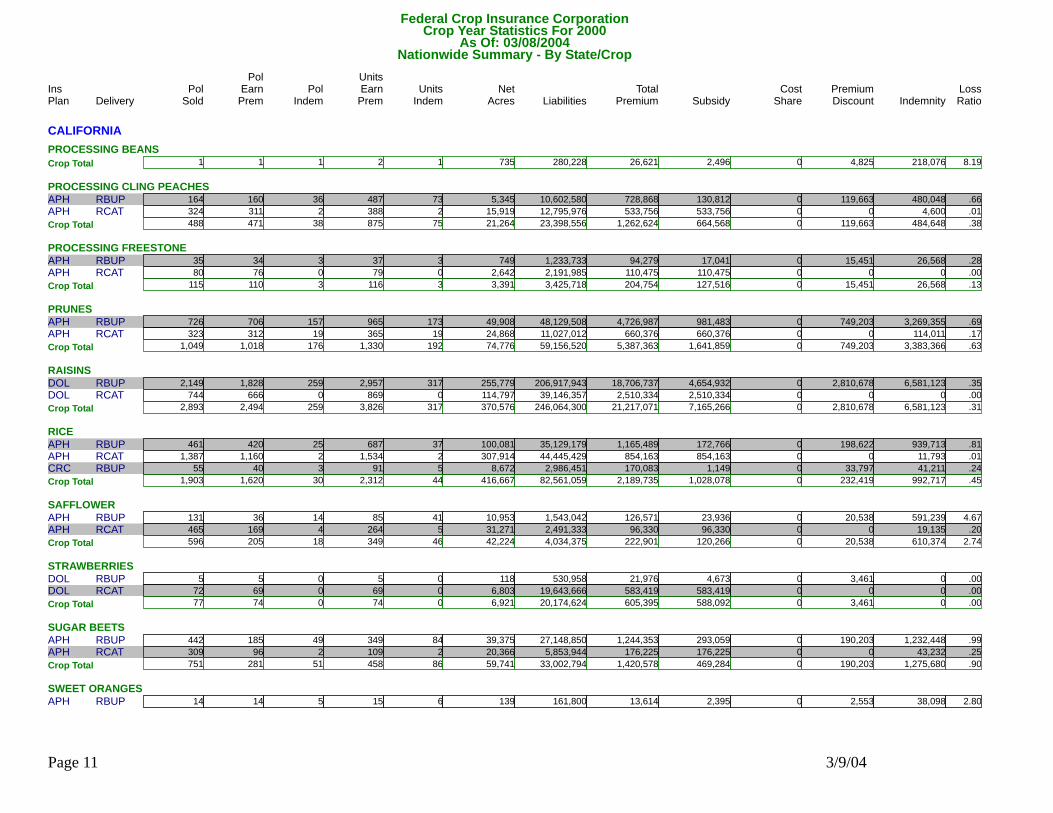
1Crop Total 1 1 2 1 735 280,228 26,621 2,496 4,825 218,076 8.190PROCESSING CLING PEACHES
RBUPAPH 164 160 36 10,602,580487 73 5,345 728,868 130,812 119,663 480,048 .660RCATAPH 324 311 2 12,795,976388 2 15,919 533,756 533,756 0 4,600 .010488Crop Total 471 38 875 75 21,264 23,398,556 1,262,624 664,568 119,663 484,648 .380
PROCESSING FREESTONERBUPAPH 35 34 3 1,233,73337 3 749 94,279 17,041 15,451 26,568 .280RCATAPH 80 76 0 2,191,98579 0 2,642 110,475 110,475 0 0 .000
115Crop Total 110 3 116 3 3,391 3,425,718 204,754 127,516 15,451 26,568 .130PRUNES
RBUPAPH 726 706 157 48,129,508965 173 49,908 4,726,987 981,483 749,203 3,269,355 .690RCATAPH 323 312 19 11,027,012365 19 24,868 660,376 660,376 0 114,011 .1701,049Crop Total 1,018 176 1,330 192 74,776 59,156,520 5,387,363 1,641,859 749,203 3,383,366 .630
RAISINSRBUPDOL 2,149 1,828 259 206,917,9432,957 317 255,779 18,706,737 4,654,932 2,810,678 6,581,123 .350RCATDOL 744 666 0 39,146,357869 0 114,797 2,510,334 2,510,334 0 0 .000
2,893Crop Total 2,494 259 3,826 317 370,576 246,064,300 21,217,071 7,165,266 2,810,678 6,581,123 .310RICE
RBUPAPH 461 420 25 35,129,179687 37 100,081 1,165,489 172,766 198,622 939,713 .810RCATAPH 1,387 1,160 2 44,445,4291,534 2 307,914 854,163 854,163 0 11,793 .010RBUPCRC 55 40 3 2,986,45191 5 8,672 170,083 1,149 33,797 41,211 .2401,903Crop Total 1,620 30 2,312 44 416,667 82,561,059 2,189,735 1,028,078 232,419 992,717 .450
SAFFLOWERRBUPAPH 131 36 14 1,543,04285 41 10,953 126,571 23,936 20,538 591,239 4.670RCATAPH 465 169 4 2,491,333264 5 31,271 96,330 96,330 0 19,135 .200
596Crop Total 205 18 349 46 42,224 4,034,375 222,901 120,266 20,538 610,374 2.740STRAWBERRIES
RBUPDOL 5 5 0 530,9585 0 118 21,976 4,673 3,461 0 .000RCATDOL 72 69 0 19,643,66669 0 6,803 583,419 583,419 0 0 .00077Crop Total 74 0 74 0 6,921 20,174,624 605,395 588,092 3,461 0 .000
SUGAR BEETSRBUPAPH 442 185 49 27,148,850349 84 39,375 1,244,353 293,059 190,203 1,232,448 .990RCATAPH 309 96 2 5,853,944109 2 20,366 176,225 176,225 0 43,232 .250
751Crop Total 281 51 458 86 59,741 33,002,794 1,420,578 469,284 190,203 1,275,680 .900SWEET ORANGES
RBUPAPH 14 14 5 161,80015 6 139 13,614 2,395 2,553 38,098 2.800
Page 11 3/9/04
Federal Crop Insurance CorporationNationwide Summary - By State/Crop
Delivery Pol Units Units Net Liabilities Total Subsidy Premium IndemnityPol
Indem EarnPrem Indem Acres Premium Discount LossRatioSold EarnPremIns PolPlan ShareCost
Crop Year Statistics For 2000As Of: 03/08/2004
CALIFORNIASWEET ORANGES
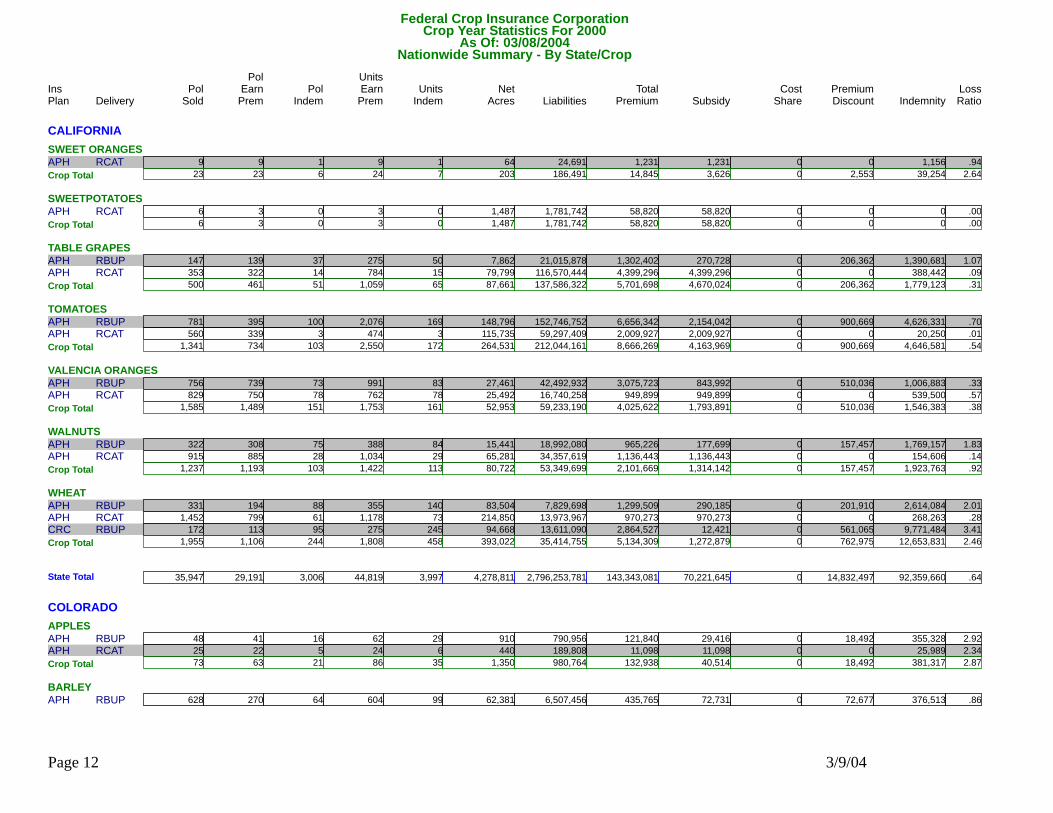
RCATAPH 9 9 1 24,6919 1 64 1,231 1,231 0 1,156 .94023Crop Total 23 6 24 7 203 186,491 14,845 3,626 2,553 39,254 2.640
SWEETPOTATOESRCATAPH 6 3 0 1,781,7423 0 1,487 58,820 58,820 0 0 .000
6Crop Total 3 0 3 0 1,487 1,781,742 58,820 58,820 0 0 .000TABLE GRAPES
RBUPAPH 147 139 37 21,015,878275 50 7,862 1,302,402 270,728 206,362 1,390,681 1.070RCATAPH 353 322 14 116,570,444784 15 79,799 4,399,296 4,399,296 0 388,442 .090500Crop Total 461 51 1,059 65 87,661 137,586,322 5,701,698 4,670,024 206,362 1,779,123 .310
TOMATOESRBUPAPH 781 395 100 152,746,7522,076 169 148,796 6,656,342 2,154,042 900,669 4,626,331 .700RCATAPH 560 339 3 59,297,409474 3 115,735 2,009,927 2,009,927 0 20,250 .010
1,341Crop Total 734 103 2,550 172 264,531 212,044,161 8,666,269 4,163,969 900,669 4,646,581 .540VALENCIA ORANGES
RBUPAPH 756 739 73 42,492,932991 83 27,461 3,075,723 843,992 510,036 1,006,883 .330RCATAPH 829 750 78 16,740,258762 78 25,492 949,899 949,899 0 539,500 .5701,585Crop Total 1,489 151 1,753 161 52,953 59,233,190 4,025,622 1,793,891 510,036 1,546,383 .380
WALNUTSRBUPAPH 322 308 75 18,992,080388 84 15,441 965,226 177,699 157,457 1,769,157 1.830RCATAPH 915 885 28 34,357,6191,034 29 65,281 1,136,443 1,136,443 0 154,606 .140
1,237Crop Total 1,193 103 1,422 113 80,722 53,349,699 2,101,669 1,314,142 157,457 1,923,763 .920WHEAT
RBUPAPH 331 194 88 7,829,698355 140 83,504 1,299,509 290,185 201,910 2,614,084 2.010RCATAPH 1,452 799 61 13,973,9671,178 73 214,850 970,273 970,273 0 268,263 .280RBUPCRC 172 113 95 13,611,090275 245 94,668 2,864,527 12,421 561,065 9,771,484 3.4101,955Crop Total 1,106 244 1,808 458 393,022 35,414,755 5,134,309 1,272,879 762,975 12,653,831 2.460
35,947State Total 29,191 3,006 44,819 3,997 4,278,811 2,796,253,781 143,343,081 70,221,645 14,832,497 92,359,660 .640
COLORADOAPPLES
RBUPAPH 48 41 16 790,95662 29 910 121,840 29,416 18,492 355,328 2.920RCATAPH 25 22 5 189,80824 6 440 11,098 11,098 0 25,989 2.34073Crop Total 63 21 86 35 1,350 980,764 132,938 40,514 18,492 381,317 2.870
BARLEYRBUPAPH 628 270 64 6,507,456604 99 62,381 435,765 72,731 72,677 376,513 .860
Page 12 3/9/04
Federal Crop Insurance CorporationNationwide Summary - By State/Crop
Delivery Pol Units Units Net Liabilities Total Subsidy Premium IndemnityPol
Indem EarnPrem Indem Acres Premium Discount LossRatioSold EarnPremIns PolPlan ShareCost
Crop Year Statistics For 2000As Of: 03/08/2004
COLORADOBARLEY
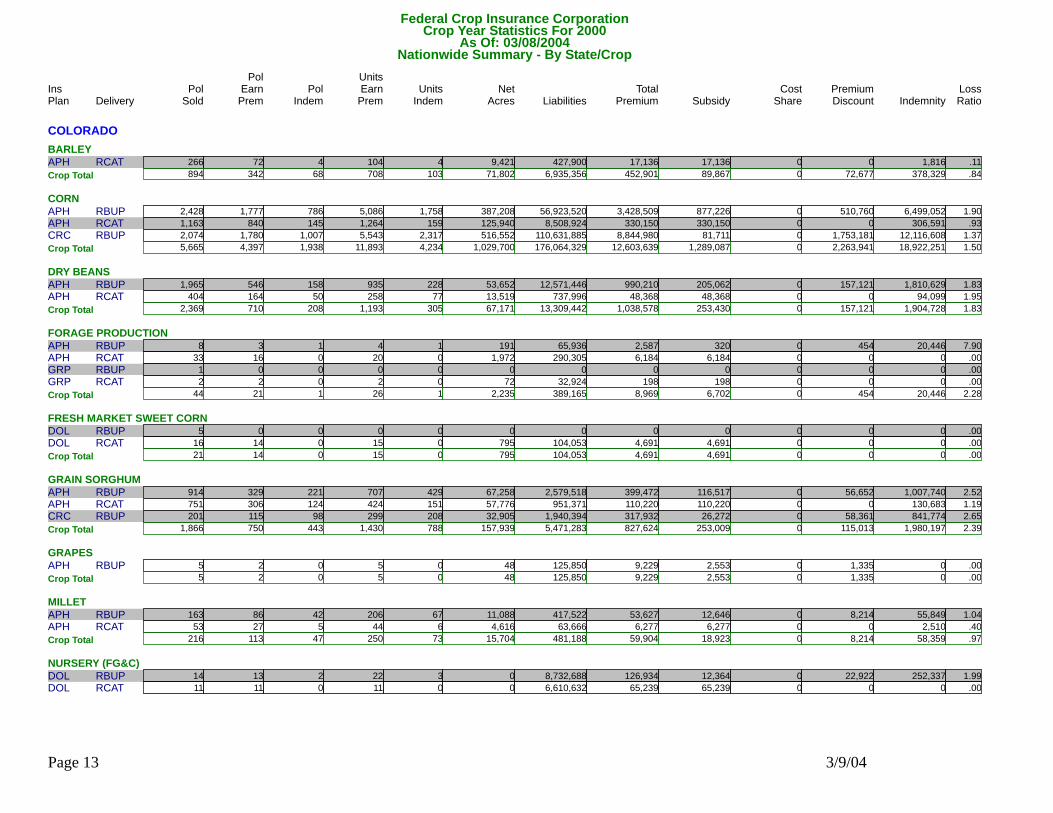
RCATAPH 266 72 4 427,900104 4 9,421 17,136 17,136 0 1,816 .110894Crop Total 342 68 708 103 71,802 6,935,356 452,901 89,867 72,677 378,329 .840
CORNRBUPAPH 2,428 1,777 786 56,923,5205,086 1,758 387,208 3,428,509 877,226 510,760 6,499,052 1.900RCATAPH 1,163 840 145 8,508,9241,264 159 125,940 330,150 330,150 0 306,591 .930RBUPCRC 2,074 1,780 1,007 110,631,8855,543 2,317 516,552 8,844,980 81,711 1,753,181 12,116,608 1.370
5,665Crop Total 4,397 1,938 11,893 4,234 1,029,700 176,064,329 12,603,639 1,289,087 2,263,941 18,922,251 1.500DRY BEANS
RBUPAPH 1,965 546 158 12,571,446935 228 53,652 990,210 205,062 157,121 1,810,629 1.830RCATAPH 404 164 50 737,996258 77 13,519 48,368 48,368 0 94,099 1.9502,369Crop Total 710 208 1,193 305 67,171 13,309,442 1,038,578 253,430 157,121 1,904,728 1.830
FORAGE PRODUCTIONRBUPAPH 8 3 1 65,9364 1 191 2,587 320 454 20,446 7.900RCATAPH 33 16 0 290,30520 0 1,972 6,184 6,184 0 0 .000RBUPGRP 1 0 0 00 0 0 0 0 0 0 .000RCATGRP 2 2 0 32,9242 0 72 198 198 0 0 .000
44Crop Total 21 1 26 1 2,235 389,165 8,969 6,702 454 20,446 2.280FRESH MARKET SWEET CORN
RBUPDOL 5 0 0 00 0 0 0 0 0 0 .000RCATDOL 16 14 0 104,05315 0 795 4,691 4,691 0 0 .00021Crop Total 14 0 15 0 795 104,053 4,691 4,691 0 0 .000
GRAIN SORGHUMRBUPAPH 914 329 221 2,579,518707 429 67,258 399,472 116,517 56,652 1,007,740 2.520RCATAPH 751 306 124 951,371424 151 57,776 110,220 110,220 0 130,683 1.190RBUPCRC 201 115 98 1,940,394299 208 32,905 317,932 26,272 58,361 841,774 2.650
1,866Crop Total 750 443 1,430 788 157,939 5,471,283 827,624 253,009 115,013 1,980,197 2.390GRAPES
RBUPAPH 5 2 0 125,8505 0 48 9,229 2,553 1,335 0 .0005Crop Total 2 0 5 0 48 125,850 9,229 2,553 1,335 0 .000
MILLETRBUPAPH 163 86 42 417,522206 67 11,088 53,627 12,646 8,214 55,849 1.040RCATAPH 53 27 5 63,66644 6 4,616 6,277 6,277 0 2,510 .400
216Crop Total 113 47 250 73 15,704 481,188 59,904 18,923 8,214 58,359 .970NURSERY (FG&C)
RBUPDOL 14 13 2 8,732,68822 3 0 126,934 12,364 22,922 252,337 1.990RCATDOL 11 11 0 6,610,63211 0 0 65,239 65,239 0 0 .000
Page 13 3/9/04
Federal Crop Insurance CorporationNationwide Summary - By State/Crop
Delivery Pol Units Units Net Liabilities Total Subsidy Premium IndemnityPol
Indem EarnPrem Indem Acres Premium Discount LossRatioSold EarnPremIns PolPlan ShareCost
Crop Year Statistics For 2000As Of: 03/08/2004
COLORADONURSERY (FG&C)
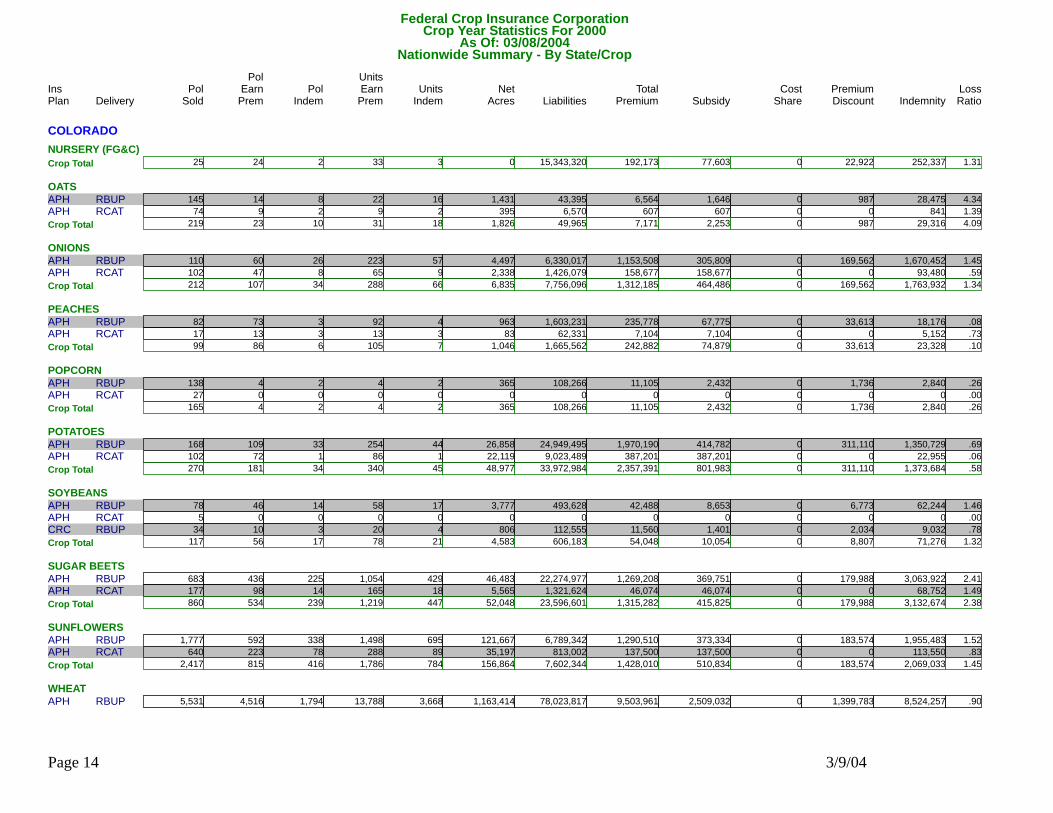
25Crop Total 24 2 33 3 0 15,343,320 192,173 77,603 22,922 252,337 1.310OATS
RBUPAPH 145 14 8 43,39522 16 1,431 6,564 1,646 987 28,475 4.340RCATAPH 74 9 2 6,5709 2 395 607 607 0 841 1.390219Crop Total 23 10 31 18 1,826 49,965 7,171 2,253 987 29,316 4.090
ONIONSRBUPAPH 110 60 26 6,330,017223 57 4,497 1,153,508 305,809 169,562 1,670,452 1.450RCATAPH 102 47 8 1,426,07965 9 2,338 158,677 158,677 0 93,480 .590
212Crop Total 107 34 288 66 6,835 7,756,096 1,312,185 464,486 169,562 1,763,932 1.340PEACHES
RBUPAPH 82 73 3 1,603,23192 4 963 235,778 67,775 33,613 18,176 .080RCATAPH 17 13 3 62,33113 3 83 7,104 7,104 0 5,152 .73099Crop Total 86 6 105 7 1,046 1,665,562 242,882 74,879 33,613 23,328 .100
POPCORNRBUPAPH 138 4 2 108,2664 2 365 11,105 2,432 1,736 2,840 .260RCATAPH 27 0 0 00 0 0 0 0 0 0 .000
165Crop Total 4 2 4 2 365 108,266 11,105 2,432 1,736 2,840 .260POTATOES
RBUPAPH 168 109 33 24,949,495254 44 26,858 1,970,190 414,782 311,110 1,350,729 .690RCATAPH 102 72 1 9,023,48986 1 22,119 387,201 387,201 0 22,955 .060270Crop Total 181 34 340 45 48,977 33,972,984 2,357,391 801,983 311,110 1,373,684 .580
SOYBEANSRBUPAPH 78 46 14 493,62858 17 3,777 42,488 8,653 6,773 62,244 1.460RCATAPH 5 0 0 00 0 0 0 0 0 0 .000RBUPCRC 34 10 3 112,55520 4 806 11,560 1,401 2,034 9,032 .780
117Crop Total 56 17 78 21 4,583 606,183 54,048 10,054 8,807 71,276 1.320SUGAR BEETS
RBUPAPH 683 436 225 22,274,9771,054 429 46,483 1,269,208 369,751 179,988 3,063,922 2.410RCATAPH 177 98 14 1,321,624165 18 5,565 46,074 46,074 0 68,752 1.490860Crop Total 534 239 1,219 447 52,048 23,596,601 1,315,282 415,825 179,988 3,132,674 2.380
SUNFLOWERSRBUPAPH 1,777 592 338 6,789,3421,498 695 121,667 1,290,510 373,334 183,574 1,955,483 1.520RCATAPH 640 223 78 813,002288 89 35,197 137,500 137,500 0 113,550 .830
2,417Crop Total 815 416 1,786 784 156,864 7,602,344 1,428,010 510,834 183,574 2,069,033 1.450WHEAT
RBUPAPH 5,531 4,516 1,794 78,023,81713,788 3,668 1,163,414 9,503,961 2,509,032 1,399,783 8,524,257 .900
Page 14 3/9/04

Federal Crop Insurance CorporationNationwide Summary - By State/Crop
Delivery Pol Units Units Net Liabilities Total Subsidy Premium IndemnityPol
Indem EarnPrem Indem Acres Premium Discount LossRatioSold EarnPremIns PolPlan ShareCost
Crop Year Statistics For 2000As Of: 03/08/2004
COLORADOWHEAT
RCATAPH 2,684 1,973 250 9,101,6552,778 292 333,728 810,168 810,168 0 322,837 .400RBUPCRC 1,492 1,289 691 27,148,8704,241 1,584 337,830 3,706,158 468,741 647,702 3,826,844 1.0309,707Crop Total 7,778 2,735 20,807 5,544 1,834,972 114,274,342 14,020,287 3,787,941 2,047,485 12,673,938 .900
25,244State Total 16,020 6,221 40,297 12,476 3,454,260 408,837,093 36,079,007 8,107,066 5,597,031 45,037,985 1.250
CONNECTICUTADJUSTED GROSS REVENUE
RBUPAGR 3 3 1 81,9323 1 0 2,382 892 298 1,647 .6903Crop Total 3 1 3 1 0 81,932 2,382 892 298 1,647 .690
APPLESRBUPAPH 14 14 7 898,71527 9 626 82,718 33,712 9,804 54,919 .660RCATAPH 14 13 0 222,99613 0 373 10,385 10,385 0 0 .000
28Crop Total 27 7 40 9 999 1,121,711 93,103 44,097 9,804 54,919 .590CIGAR BINDER TOBACCO
RBUPAPH 97 75 55 8,861,448169 120 1,414 544,468 140,199 80,873 6,002,729 11.020RCATAPH 16 11 6 314,58011 6 123 12,549 12,549 0 77,059 6.140113Crop Total 86 61 180 126 1,537 9,176,028 557,017 152,748 80,873 6,079,788 10.910
CIGAR WRAPPER TOBACCORBUPAPH 15 10 2 13,674,02325 2 562 840,560 161,436 135,830 1,995,909 2.370RCATAPH 2 2 0 1,451,4812 0 186 50,135 50,135 0 0 .000
17Crop Total 12 2 27 2 748 15,125,504 890,695 211,571 135,830 1,995,909 2.240CORN
RBUPAPH 20 18 3 215,68058 11 1,775 12,436 3,932 1,711 22,289 1.790RCATAPH 152 127 5 1,236,452127 5 20,580 60,255 60,255 0 10,240 .170RBUPCRC 4 4 3 80,88720 4 496 5,024 773 852 709 .140176Crop Total 149 11 205 20 22,851 1,533,019 77,715 64,960 2,563 33,238 .430
FRESH MARKET SWEET CORNRBUPDOL 2 1 1 7,6111 1 14 1,267 353 183 5,011 3.960RCATDOL 40 31 0 395,64031 0 1,744 48,071 48,071 0 0 .000
42Crop Total 32 1 32 1 1,758 403,251 49,338 48,424 183 5,011 .100NURSERY (FG&C)
RBUPDOL 2 2 0 1,507,0002 0 0 14,426 6,303 1,625 0 .000RCATDOL 19 17 0 28,416,96317 0 0 298,891 298,891 0 0 .00021Crop Total 19 0 19 0 0 29,923,963 313,317 305,194 1,625 0 .000
POTATOES
Page 15 3/9/04

Federal Crop Insurance CorporationNationwide Summary - By State/Crop
Delivery Pol Units Units Net Liabilities Total Subsidy Premium IndemnityPol
Indem EarnPrem Indem Acres Premium Discount LossRatioSold EarnPremIns PolPlan ShareCost
Crop Year Statistics For 2000As Of: 03/08/2004
CONNECTICUTPOTATOES
RCATAPH 5 3 0 6,1113 0 17 443 443 0 0 .0005Crop Total 3 0 3 0 17 6,111 443 443 0 0 .000
WINTER SQUASHRBUPDOL 1 1 1 2,4001 1 4 334 31 61 2,037 6.100RCATDOL 11 6 0 10,3406 0 47 788 788 0 0 .000
12Crop Total 7 1 7 1 51 12,740 1,122 819 61 2,037 1.820
417State Total 338 84 516 160 27,961 57,384,259 1,985,132 829,148 231,237 8,172,549 4.120
DELAWAREBARLEY
RBUPAPH 36 19 0 155,30651 0 2,064 5,511 1,108 884 0 .000RCATAPH 41 22 0 161,77827 0 4,726 3,099 3,099 0 0 .00077Crop Total 41 0 78 0 6,790 317,084 8,610 4,207 884 0 .000
CORNRBUPAPH 282 214 3 5,382,401719 4 40,019 358,182 84,887 54,734 1,758 .000RCATAPH 145 117 1 1,607,405168 1 28,409 71,102 71,102 0 958 .010RBUPCRC 38 37 1 2,353,840148 1 12,563 182,033 8,597 34,704 2,169 .010
465Crop Total 368 5 1,035 6 80,991 9,343,646 611,317 164,586 89,438 4,885 .010GRAIN SORGHUM
RBUPAPH 50 8 2 28,79510 2 408 2,440 505 387 3,803 1.560RCATAPH 23 5 0 7,3425 0 304 435 435 0 0 .00073Crop Total 13 2 15 2 712 36,137 2,875 940 387 3,803 1.320
GREEN PEASRBUPAPH 42 16 3 607,06924 3 2,348 44,807 17,050 5,554 4,889 .110RCATAPH 7 6 0 58,9266 0 691 3,996 3,996 0 0 .000
49Crop Total 22 3 30 3 3,039 665,995 48,803 21,046 5,554 4,889 .100NURSERY (FG&C)
RCATDOL 7 7 0 3,100,6257 0 0 41,822 41,822 0 0 .0007Crop Total 7 0 7 0 0 3,100,625 41,822 41,822 0 0 .000
POTATOESRCATAPH 4 4 0 1,166,2054 0 2,209 85,593 85,593 0 0 .000
4Crop Total 4 0 4 0 2,209 1,166,205 85,593 85,593 0 0 .000PROCESSING BEANS
RBUPAPH 27 18 6 1,002,50871 15 5,810 86,575 33,649 10,595 92,936 1.070RCATAPH 23 10 2 244,58711 2 2,728 20,900 20,900 0 24,681 1.180
Page 16 3/9/04
Federal Crop Insurance CorporationNationwide Summary - By State/Crop
Delivery Pol Units Units Net Liabilities Total Subsidy Premium IndemnityPol
Indem EarnPrem Indem Acres Premium Discount LossRatioSold EarnPremIns PolPlan ShareCost
Crop Year Statistics For 2000As Of: 03/08/2004
DELAWAREPROCESSING BEANS
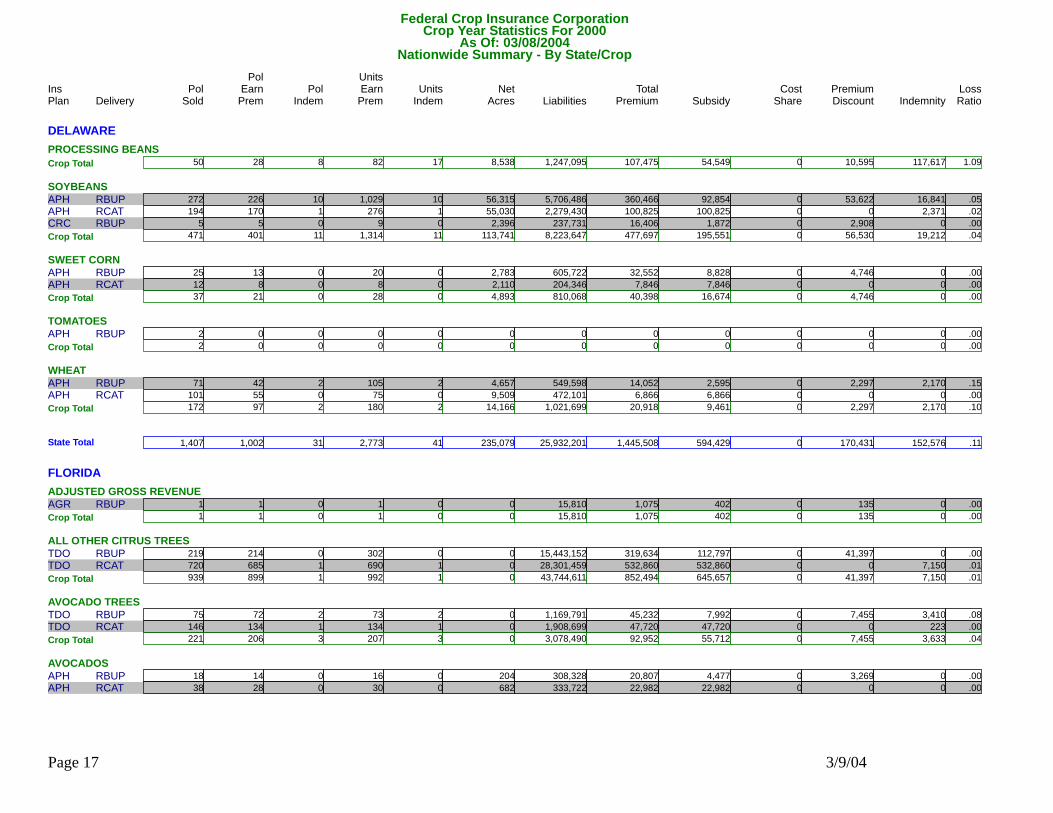
50Crop Total 28 8 82 17 8,538 1,247,095 107,475 54,549 10,595 117,617 1.090SOYBEANS
RBUPAPH 272 226 10 5,706,4861,029 10 56,315 360,466 92,854 53,622 16,841 .050RCATAPH 194 170 1 2,279,430276 1 55,030 100,825 100,825 0 2,371 .020RBUPCRC 5 5 0 237,7319 0 2,396 16,406 1,872 2,908 0 .000471Crop Total 401 11 1,314 11 113,741 8,223,647 477,697 195,551 56,530 19,212 .040
SWEET CORNRBUPAPH 25 13 0 605,72220 0 2,783 32,552 8,828 4,746 0 .000RCATAPH 12 8 0 204,3468 0 2,110 7,846 7,846 0 0 .000
37Crop Total 21 0 28 0 4,893 810,068 40,398 16,674 4,746 0 .000TOMATOES
RBUPAPH 2 0 0 00 0 0 0 0 0 0 .0002Crop Total 0 0 0 0 0 0 0 0 0 0 .000
WHEATRBUPAPH 71 42 2 549,598105 2 4,657 14,052 2,595 2,297 2,170 .150RCATAPH 101 55 0 472,10175 0 9,509 6,866 6,866 0 0 .000
172Crop Total 97 2 180 2 14,166 1,021,699 20,918 9,461 2,297 2,170 .100
1,407State Total 1,002 31 2,773 41 235,079 25,932,201 1,445,508 594,429 170,431 152,576 .110
FLORIDAADJUSTED GROSS REVENUE
RBUPAGR 1 1 0 15,8101 0 0 1,075 402 135 0 .0001Crop Total 1 0 1 0 0 15,810 1,075 402 135 0 .000
ALL OTHER CITRUS TREESRBUPTDO 219 214 0 15,443,152302 0 0 319,634 112,797 41,397 0 .000RCATTDO 720 685 1 28,301,459690 1 0 532,860 532,860 0 7,150 .010
939Crop Total 899 1 992 1 0 43,744,611 852,494 645,657 41,397 7,150 .010AVOCADO TREES
RBUPTDO 75 72 2 1,169,79173 2 0 45,232 7,992 7,455 3,410 .080RCATTDO 146 134 1 1,908,699134 1 0 47,720 47,720 0 223 .000221Crop Total 206 3 207 3 0 3,078,490 92,952 55,712 7,455 3,633 .040
AVOCADOSRBUPAPH 18 14 0 308,32816 0 204 20,807 4,477 3,269 0 .000RCATAPH 38 28 0 333,72230 0 682 22,982 22,982 0 0 .000
Page 17 3/9/04
Federal Crop Insurance CorporationNationwide Summary - By State/Crop
Delivery Pol Units Units Net Liabilities Total Subsidy Premium IndemnityPol
Indem EarnPrem Indem Acres Premium Discount LossRatioSold EarnPremIns PolPlan ShareCost
Crop Year Statistics For 2000As Of: 03/08/2004
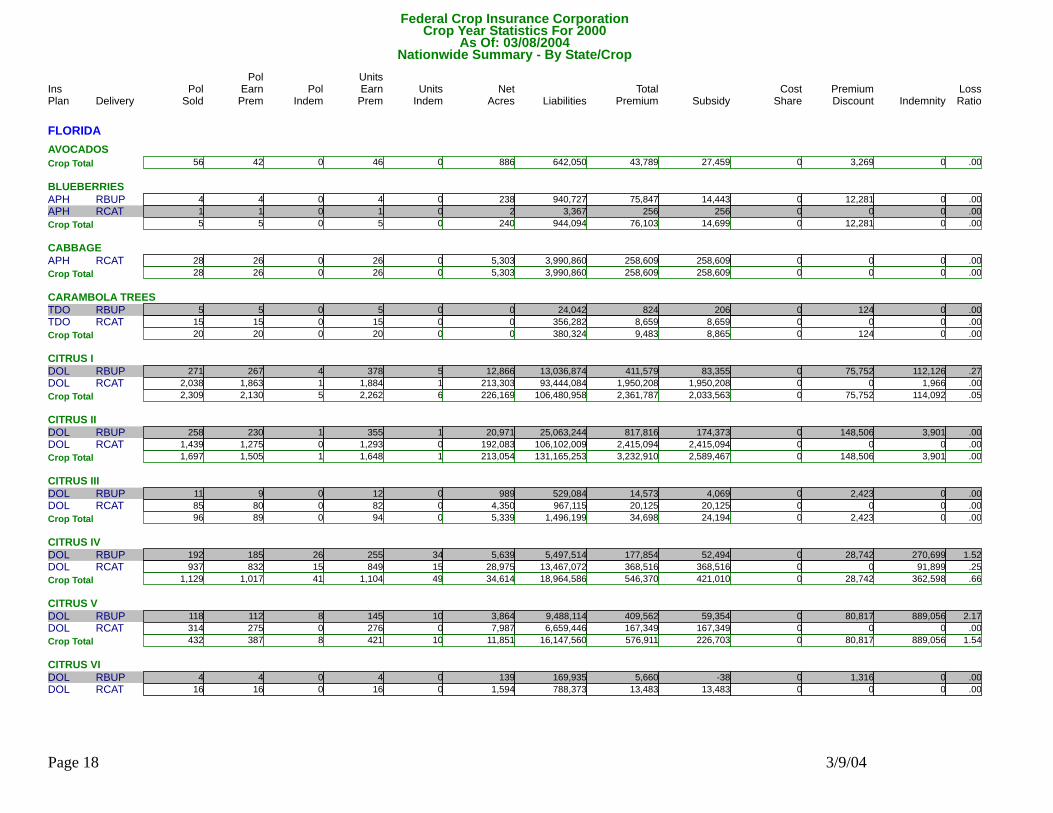
FLORIDAAVOCADOS
56Crop Total 42 0 46 0 886 642,050 43,789 27,459 3,269 0 .000BLUEBERRIES
RBUPAPH 4 4 0 940,7274 0 238 75,847 14,443 12,281 0 .000RCATAPH 1 1 0 3,3671 0 2 256 256 0 0 .0005Crop Total 5 0 5 0 240 944,094 76,103 14,699 12,281 0 .000
CABBAGERCATAPH 28 26 0 3,990,86026 0 5,303 258,609 258,609 0 0 .000
28Crop Total 26 0 26 0 5,303 3,990,860 258,609 258,609 0 0 .000CARAMBOLA TREES
RBUPTDO 5 5 0 24,0425 0 0 824 206 124 0 .000RCATTDO 15 15 0 356,28215 0 0 8,659 8,659 0 0 .00020Crop Total 20 0 20 0 0 380,324 9,483 8,865 124 0 .000
CITRUS IRBUPDOL 271 267 4 13,036,874378 5 12,866 411,579 83,355 75,752 112,126 .270RCATDOL 2,038 1,863 1 93,444,0841,884 1 213,303 1,950,208 1,950,208 0 1,966 .000
2,309Crop Total 2,130 5 2,262 6 226,169 106,480,958 2,361,787 2,033,563 75,752 114,092 .050CITRUS II
RBUPDOL 258 230 1 25,063,244355 1 20,971 817,816 174,373 148,506 3,901 .000RCATDOL 1,439 1,275 0 106,102,0091,293 0 192,083 2,415,094 2,415,094 0 0 .0001,697Crop Total 1,505 1 1,648 1 213,054 131,165,253 3,232,910 2,589,467 148,506 3,901 .000
CITRUS IIIRBUPDOL 11 9 0 529,08412 0 989 14,573 4,069 2,423 0 .000RCATDOL 85 80 0 967,11582 0 4,350 20,125 20,125 0 0 .000
96Crop Total 89 0 94 0 5,339 1,496,199 34,698 24,194 2,423 0 .000CITRUS IV
RBUPDOL 192 185 26 5,497,514255 34 5,639 177,854 52,494 28,742 270,699 1.520RCATDOL 937 832 15 13,467,072849 15 28,975 368,516 368,516 0 91,899 .2501,129Crop Total 1,017 41 1,104 49 34,614 18,964,586 546,370 421,010 28,742 362,598 .660
CITRUS VRBUPDOL 118 112 8 9,488,114145 10 3,864 409,562 59,354 80,817 889,056 2.170RCATDOL 314 275 0 6,659,446276 0 7,987 167,349 167,349 0 0 .000
432Crop Total 387 8 421 10 11,851 16,147,560 576,911 226,703 80,817 889,056 1.540CITRUS VI
RBUPDOL 4 4 0 169,9354 0 139 5,660 -38 1,316 0 .000RCATDOL 16 16 0 788,37316 0 1,594 13,483 13,483 0 0 .000
Page 18 3/9/04
Federal Crop Insurance CorporationNationwide Summary - By State/Crop
Delivery Pol Units Units Net Liabilities Total Subsidy Premium IndemnityPol
Indem EarnPrem Indem Acres Premium Discount LossRatioSold EarnPremIns PolPlan ShareCost
Crop Year Statistics For 2000As Of: 03/08/2004
FLORIDACITRUS VI
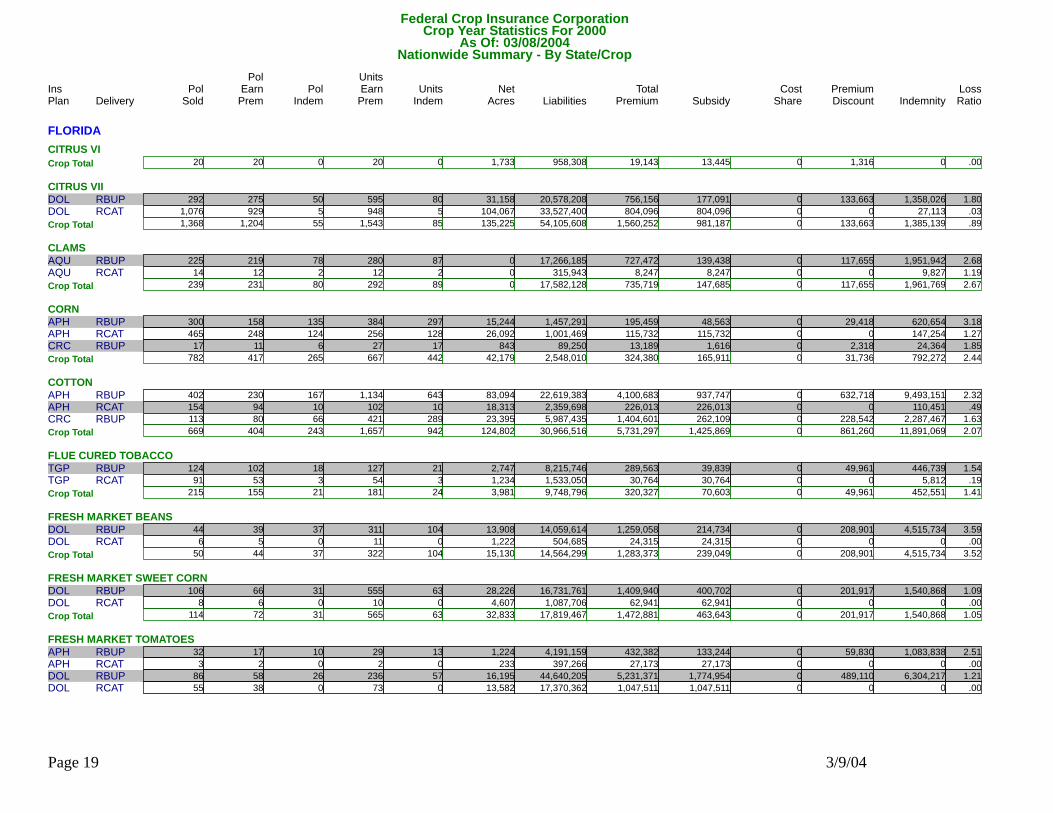
20Crop Total 20 0 20 0 1,733 958,308 19,143 13,445 1,316 0 .000CITRUS VII
RBUPDOL 292 275 50 20,578,208595 80 31,158 756,156 177,091 133,663 1,358,026 1.800RCATDOL 1,076 929 5 33,527,400948 5 104,067 804,096 804,096 0 27,113 .0301,368Crop Total 1,204 55 1,543 85 135,225 54,105,608 1,560,252 981,187 133,663 1,385,139 .890
CLAMSRBUPAQU 225 219 78 17,266,185280 87 0 727,472 139,438 117,655 1,951,942 2.680RCATAQU 14 12 2 315,94312 2 0 8,247 8,247 0 9,827 1.190
239Crop Total 231 80 292 89 0 17,582,128 735,719 147,685 117,655 1,961,769 2.670CORN
RBUPAPH 300 158 135 1,457,291384 297 15,244 195,459 48,563 29,418 620,654 3.180RCATAPH 465 248 124 1,001,469256 128 26,092 115,732 115,732 0 147,254 1.270RBUPCRC 17 11 6 89,25027 17 843 13,189 1,616 2,318 24,364 1.850782Crop Total 417 265 667 442 42,179 2,548,010 324,380 165,911 31,736 792,272 2.440
COTTONRBUPAPH 402 230 167 22,619,3831,134 643 83,094 4,100,683 937,747 632,718 9,493,151 2.320RCATAPH 154 94 10 2,359,698102 10 18,313 226,013 226,013 0 110,451 .490RBUPCRC 113 80 66 5,987,435421 289 23,395 1,404,601 262,109 228,542 2,287,467 1.630
669Crop Total 404 243 1,657 942 124,802 30,966,516 5,731,297 1,425,869 861,260 11,891,069 2.070FLUE CURED TOBACCO
RBUPTGP 124 102 18 8,215,746127 21 2,747 289,563 39,839 49,961 446,739 1.540RCATTGP 91 53 3 1,533,05054 3 1,234 30,764 30,764 0 5,812 .190215Crop Total 155 21 181 24 3,981 9,748,796 320,327 70,603 49,961 452,551 1.410
FRESH MARKET BEANSRBUPDOL 44 39 37 14,059,614311 104 13,908 1,259,058 214,734 208,901 4,515,734 3.590RCATDOL 6 5 0 504,68511 0 1,222 24,315 24,315 0 0 .000
50Crop Total 44 37 322 104 15,130 14,564,299 1,283,373 239,049 208,901 4,515,734 3.520FRESH MARKET SWEET CORN
RBUPDOL 106 66 31 16,731,761555 63 28,226 1,409,940 400,702 201,917 1,540,868 1.090RCATDOL 8 6 0 1,087,70610 0 4,607 62,941 62,941 0 0 .000114Crop Total 72 31 565 63 32,833 17,819,467 1,472,881 463,643 201,917 1,540,868 1.050
FRESH MARKET TOMATOESRBUPAPH 32 17 10 4,191,15929 13 1,224 432,382 133,244 59,830 1,083,838 2.510RCATAPH 3 2 0 397,2662 0 233 27,173 27,173 0 0 .000RBUPDOL 86 58 26 44,640,205236 57 16,195 5,231,371 1,774,954 489,110 6,304,217 1.210RCATDOL 55 38 0 17,370,36273 0 13,582 1,047,511 1,047,511 0 0 .000
Page 19 3/9/04
Federal Crop Insurance CorporationNationwide Summary - By State/Crop
Delivery Pol Units Units Net Liabilities Total Subsidy Premium IndemnityPol
Indem EarnPrem Indem Acres Premium Discount LossRatioSold EarnPremIns PolPlan ShareCost
Crop Year Statistics For 2000As Of: 03/08/2004
FLORIDAFRESH MARKET TOMATOES
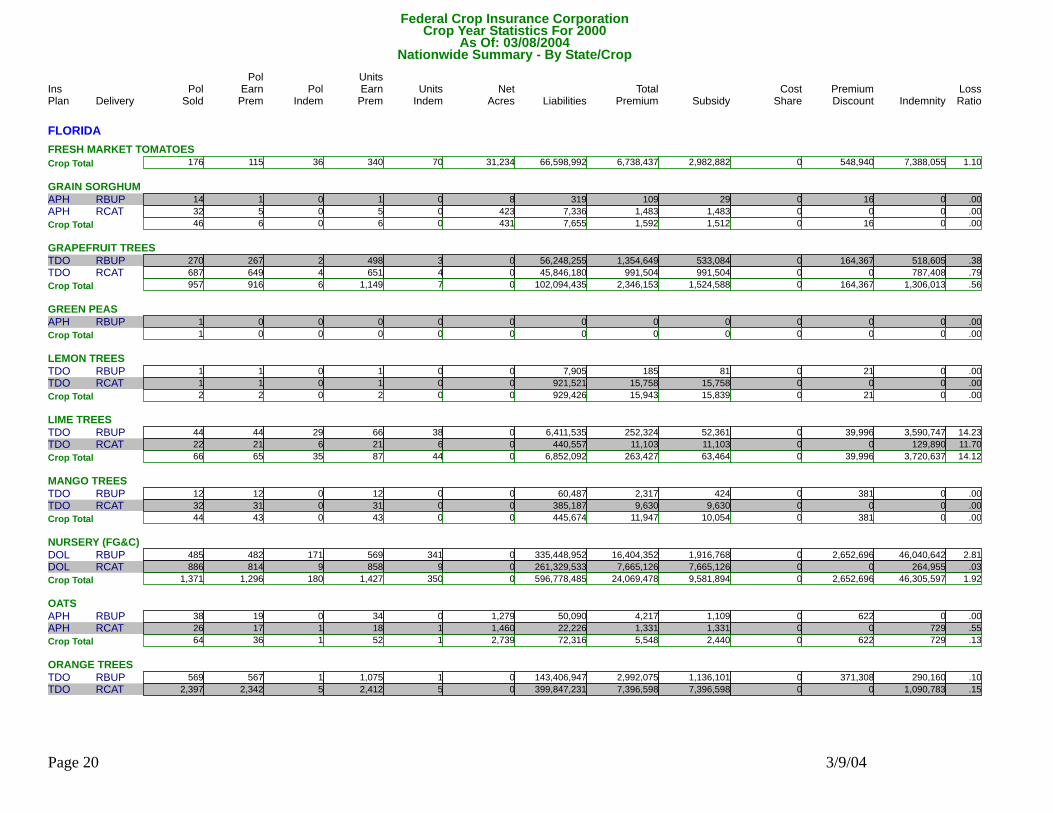
176Crop Total 115 36 340 70 31,234 66,598,992 6,738,437 2,982,882 548,940 7,388,055 1.100GRAIN SORGHUM
RBUPAPH 14 1 0 3191 0 8 109 29 16 0 .000RCATAPH 32 5 0 7,3365 0 423 1,483 1,483 0 0 .00046Crop Total 6 0 6 0 431 7,655 1,592 1,512 16 0 .000
GRAPEFRUIT TREESRBUPTDO 270 267 2 56,248,255498 3 0 1,354,649 533,084 164,367 518,605 .380RCATTDO 687 649 4 45,846,180651 4 0 991,504 991,504 0 787,408 .790
957Crop Total 916 6 1,149 7 0 102,094,435 2,346,153 1,524,588 164,367 1,306,013 .560GREEN PEAS
RBUPAPH 1 0 0 00 0 0 0 0 0 0 .0001Crop Total 0 0 0 0 0 0 0 0 0 0 .000
LEMON TREESRBUPTDO 1 1 0 7,9051 0 0 185 81 21 0 .000RCATTDO 1 1 0 921,5211 0 0 15,758 15,758 0 0 .000
2Crop Total 2 0 2 0 0 929,426 15,943 15,839 21 0 .000LIME TREES
RBUPTDO 44 44 29 6,411,53566 38 0 252,324 52,361 39,996 3,590,747 14.230RCATTDO 22 21 6 440,55721 6 0 11,103 11,103 0 129,890 11.70066Crop Total 65 35 87 44 0 6,852,092 263,427 63,464 39,996 3,720,637 14.120
MANGO TREESRBUPTDO 12 12 0 60,48712 0 0 2,317 424 381 0 .000RCATTDO 32 31 0 385,18731 0 0 9,630 9,630 0 0 .000
44Crop Total 43 0 43 0 0 445,674 11,947 10,054 381 0 .000NURSERY (FG&C)
RBUPDOL 485 482 171 335,448,952569 341 0 16,404,352 1,916,768 2,652,696 46,040,642 2.810RCATDOL 886 814 9 261,329,533858 9 0 7,665,126 7,665,126 0 264,955 .0301,371Crop Total 1,296 180 1,427 350 0 596,778,485 24,069,478 9,581,894 2,652,696 46,305,597 1.920
OATSRBUPAPH 38 19 0 50,09034 0 1,279 4,217 1,109 622 0 .000RCATAPH 26 17 1 22,22618 1 1,460 1,331 1,331 0 729 .550
64Crop Total 36 1 52 1 2,739 72,316 5,548 2,440 622 729 .130ORANGE TREES
RBUPTDO 569 567 1 143,406,9471,075 1 0 2,992,075 1,136,101 371,308 290,160 .100RCATTDO 2,397 2,342 5 399,847,2312,412 5 0 7,396,598 7,396,598 0 1,090,783 .150
Page 20 3/9/04
Federal Crop Insurance CorporationNationwide Summary - By State/Crop
Delivery Pol Units Units Net Liabilities Total Subsidy Premium IndemnityPol
Indem EarnPrem Indem Acres Premium Discount LossRatioSold EarnPremIns PolPlan ShareCost
Crop Year Statistics For 2000As Of: 03/08/2004
FLORIDAORANGE TREES
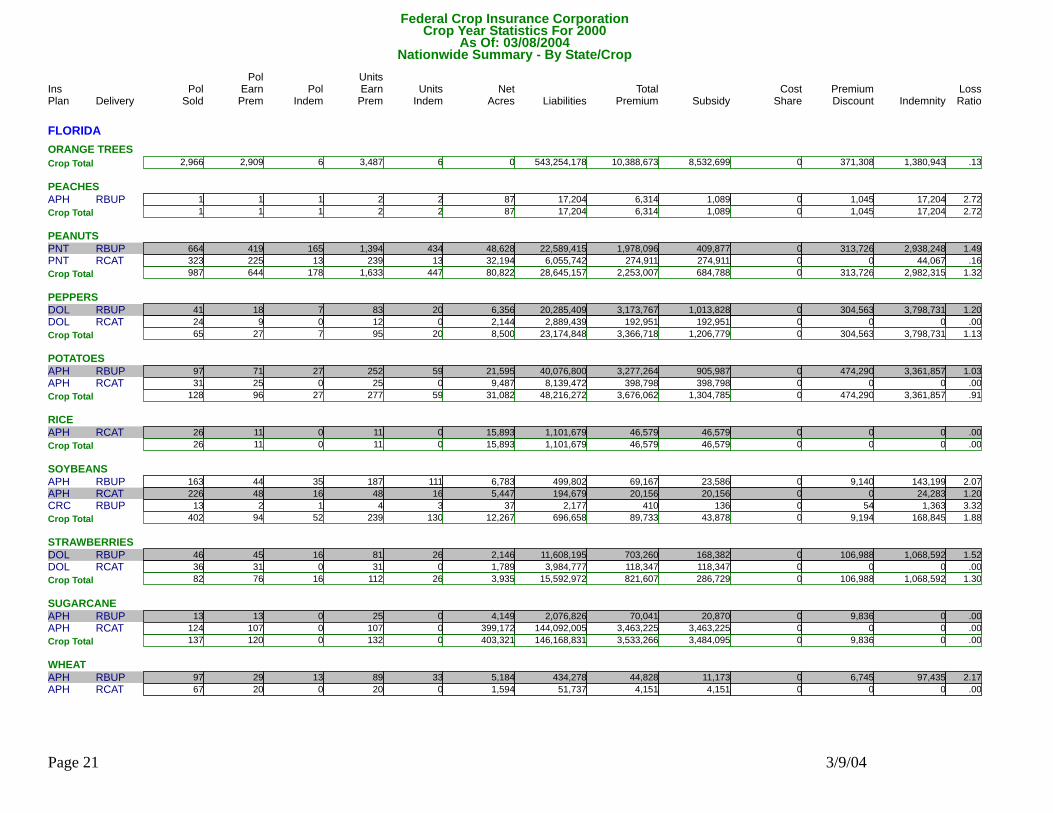
2,966Crop Total 2,909 6 3,487 6 0 543,254,178 10,388,673 8,532,699 371,308 1,380,943 .130PEACHES
RBUPAPH 1 1 1 17,2042 2 87 6,314 1,089 1,045 17,204 2.7201Crop Total 1 1 2 2 87 17,204 6,314 1,089 1,045 17,204 2.720
PEANUTSRBUPPNT 664 419 165 22,589,4151,394 434 48,628 1,978,096 409,877 313,726 2,938,248 1.490RCATPNT 323 225 13 6,055,742239 13 32,194 274,911 274,911 0 44,067 .160
987Crop Total 644 178 1,633 447 80,822 28,645,157 2,253,007 684,788 313,726 2,982,315 1.320PEPPERS
RBUPDOL 41 18 7 20,285,40983 20 6,356 3,173,767 1,013,828 304,563 3,798,731 1.200RCATDOL 24 9 0 2,889,43912 0 2,144 192,951 192,951 0 0 .00065Crop Total 27 7 95 20 8,500 23,174,848 3,366,718 1,206,779 304,563 3,798,731 1.130
POTATOESRBUPAPH 97 71 27 40,076,800252 59 21,595 3,277,264 905,987 474,290 3,361,857 1.030RCATAPH 31 25 0 8,139,47225 0 9,487 398,798 398,798 0 0 .000
128Crop Total 96 27 277 59 31,082 48,216,272 3,676,062 1,304,785 474,290 3,361,857 .910RICE
RCATAPH 26 11 0 1,101,67911 0 15,893 46,579 46,579 0 0 .00026Crop Total 11 0 11 0 15,893 1,101,679 46,579 46,579 0 0 .000
SOYBEANSRBUPAPH 163 44 35 499,802187 111 6,783 69,167 23,586 9,140 143,199 2.070RCATAPH 226 48 16 194,67948 16 5,447 20,156 20,156 0 24,283 1.200RBUPCRC 13 2 1 2,1774 3 37 410 136 54 1,363 3.320
402Crop Total 94 52 239 130 12,267 696,658 89,733 43,878 9,194 168,845 1.880STRAWBERRIES
RBUPDOL 46 45 16 11,608,19581 26 2,146 703,260 168,382 106,988 1,068,592 1.520RCATDOL 36 31 0 3,984,77731 0 1,789 118,347 118,347 0 0 .00082Crop Total 76 16 112 26 3,935 15,592,972 821,607 286,729 106,988 1,068,592 1.300
SUGARCANERBUPAPH 13 13 0 2,076,82625 0 4,149 70,041 20,870 9,836 0 .000RCATAPH 124 107 0 144,092,005107 0 399,172 3,463,225 3,463,225 0 0 .000
137Crop Total 120 0 132 0 403,321 146,168,831 3,533,266 3,484,095 9,836 0 .000WHEAT
RBUPAPH 97 29 13 434,27889 33 5,184 44,828 11,173 6,745 97,435 2.170RCATAPH 67 20 0 51,73720 0 1,594 4,151 4,151 0 0 .000
Page 21 3/9/04
Federal Crop Insurance CorporationNationwide Summary - By State/Crop
Delivery Pol Units Units Net Liabilities Total Subsidy Premium IndemnityPol
Indem EarnPrem Indem Acres Premium Discount LossRatioSold EarnPremIns PolPlan ShareCost
Crop Year Statistics For 2000As Of: 03/08/2004
FLORIDAWHEAT
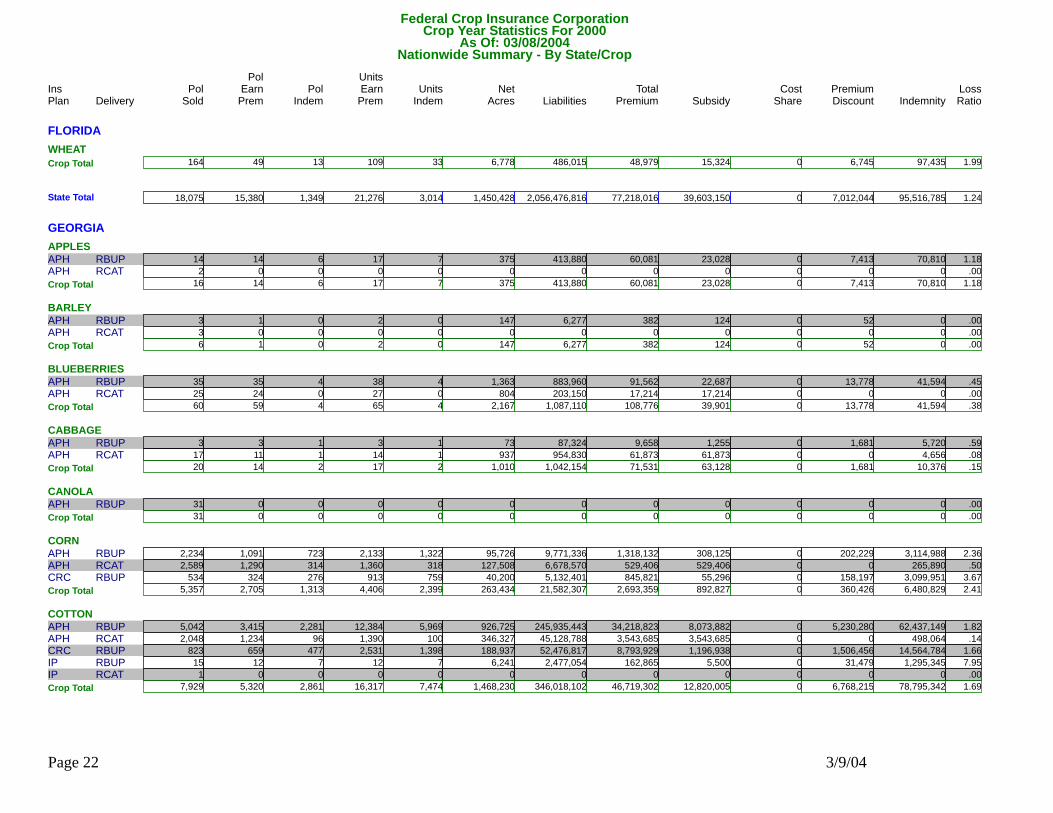
164Crop Total 49 13 109 33 6,778 486,015 48,979 15,324 6,745 97,435 1.990
18,075State Total 15,380 1,349 21,276 3,014 1,450,428 2,056,476,816 77,218,016 39,603,150 7,012,044 95,516,785 1.240
GEORGIAAPPLES
RBUPAPH 14 14 6 413,88017 7 375 60,081 23,028 7,413 70,810 1.180RCATAPH 2 0 0 00 0 0 0 0 0 0 .00016Crop Total 14 6 17 7 375 413,880 60,081 23,028 7,413 70,810 1.180
BARLEYRBUPAPH 3 1 0 6,2772 0 147 382 124 52 0 .000RCATAPH 3 0 0 00 0 0 0 0 0 0 .000
6Crop Total 1 0 2 0 147 6,277 382 124 52 0 .000BLUEBERRIES
RBUPAPH 35 35 4 883,96038 4 1,363 91,562 22,687 13,778 41,594 .450RCATAPH 25 24 0 203,15027 0 804 17,214 17,214 0 0 .00060Crop Total 59 4 65 4 2,167 1,087,110 108,776 39,901 13,778 41,594 .380
CABBAGERBUPAPH 3 3 1 87,3243 1 73 9,658 1,255 1,681 5,720 .590RCATAPH 17 11 1 954,83014 1 937 61,873 61,873 0 4,656 .080
20Crop Total 14 2 17 2 1,010 1,042,154 71,531 63,128 1,681 10,376 .150CANOLA
RBUPAPH 31 0 0 00 0 0 0 0 0 0 .00031Crop Total 0 0 0 0 0 0 0 0 0 0 .000
CORNRBUPAPH 2,234 1,091 723 9,771,3362,133 1,322 95,726 1,318,132 308,125 202,229 3,114,988 2.360RCATAPH 2,589 1,290 314 6,678,5701,360 318 127,508 529,406 529,406 0 265,890 .500RBUPCRC 534 324 276 5,132,401913 759 40,200 845,821 55,296 158,197 3,099,951 3.670
5,357Crop Total 2,705 1,313 4,406 2,399 263,434 21,582,307 2,693,359 892,827 360,426 6,480,829 2.410COTTON
RBUPAPH 5,042 3,415 2,281 245,935,44312,384 5,969 926,725 34,218,823 8,073,882 5,230,280 62,437,149 1.820RCATAPH 2,048 1,234 96 45,128,7881,390 100 346,327 3,543,685 3,543,685 0 498,064 .140RBUPCRC 823 659 477 52,476,8172,531 1,398 188,937 8,793,929 1,196,938 1,506,456 14,564,784 1.660RBUPIP 15 12 7 2,477,05412 7 6,241 162,865 5,500 31,479 1,295,345 7.950RCATIP 1 0 0 00 0 0 0 0 0 0 .0007,929Crop Total 5,320 2,861 16,317 7,474 1,468,230 346,018,102 46,719,302 12,820,005 6,768,215 78,795,342 1.690
Page 22 3/9/04
Federal Crop Insurance CorporationNationwide Summary - By State/Crop
Delivery Pol Units Units Net Liabilities Total Subsidy Premium IndemnityPol
Indem EarnPrem Indem Acres Premium Discount LossRatioSold EarnPremIns PolPlan ShareCost
Crop Year Statistics For 2000As Of: 03/08/2004
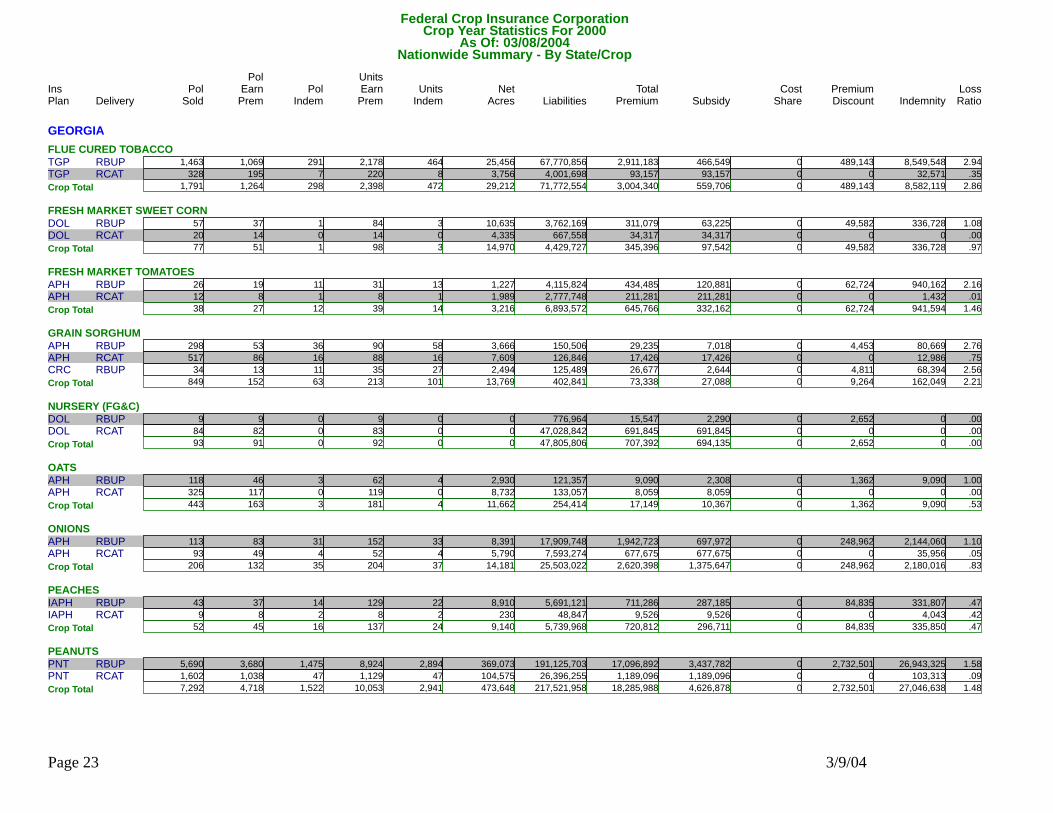
GEORGIAFLUE CURED TOBACCO
RBUPTGP 1,463 1,069 291 67,770,8562,178 464 25,456 2,911,183 466,549 489,143 8,549,548 2.940RCATTGP 328 195 7 4,001,698220 8 3,756 93,157 93,157 0 32,571 .3501,791Crop Total 1,264 298 2,398 472 29,212 71,772,554 3,004,340 559,706 489,143 8,582,119 2.860
FRESH MARKET SWEET CORNRBUPDOL 57 37 1 3,762,16984 3 10,635 311,079 63,225 49,582 336,728 1.080RCATDOL 20 14 0 667,55814 0 4,335 34,317 34,317 0 0 .000
77Crop Total 51 1 98 3 14,970 4,429,727 345,396 97,542 49,582 336,728 .970FRESH MARKET TOMATOES
RBUPAPH 26 19 11 4,115,82431 13 1,227 434,485 120,881 62,724 940,162 2.160RCATAPH 12 8 1 2,777,7488 1 1,989 211,281 211,281 0 1,432 .01038Crop Total 27 12 39 14 3,216 6,893,572 645,766 332,162 62,724 941,594 1.460
GRAIN SORGHUMRBUPAPH 298 53 36 150,50690 58 3,666 29,235 7,018 4,453 80,669 2.760RCATAPH 517 86 16 126,84688 16 7,609 17,426 17,426 0 12,986 .750RBUPCRC 34 13 11 125,48935 27 2,494 26,677 2,644 4,811 68,394 2.560
849Crop Total 152 63 213 101 13,769 402,841 73,338 27,088 9,264 162,049 2.210NURSERY (FG&C)
RBUPDOL 9 9 0 776,9649 0 0 15,547 2,290 2,652 0 .000RCATDOL 84 82 0 47,028,84283 0 0 691,845 691,845 0 0 .00093Crop Total 91 0 92 0 0 47,805,806 707,392 694,135 2,652 0 .000
OATSRBUPAPH 118 46 3 121,35762 4 2,930 9,090 2,308 1,362 9,090 1.000RCATAPH 325 117 0 133,057119 0 8,732 8,059 8,059 0 0 .000
443Crop Total 163 3 181 4 11,662 254,414 17,149 10,367 1,362 9,090 .530ONIONS
RBUPAPH 113 83 31 17,909,748152 33 8,391 1,942,723 697,972 248,962 2,144,060 1.100RCATAPH 93 49 4 7,593,27452 4 5,790 677,675 677,675 0 35,956 .050206Crop Total 132 35 204 37 14,181 25,503,022 2,620,398 1,375,647 248,962 2,180,016 .830
PEACHESRBUPIAPH 43 37 14 5,691,121129 22 8,910 711,286 287,185 84,835 331,807 .470RCATIAPH 9 8 2 48,8478 2 230 9,526 9,526 0 4,043 .420
52Crop Total 45 16 137 24 9,140 5,739,968 720,812 296,711 84,835 335,850 .470PEANUTS
RBUPPNT 5,690 3,680 1,475 191,125,7038,924 2,894 369,073 17,096,892 3,437,782 2,732,501 26,943,325 1.580RCATPNT 1,602 1,038 47 26,396,2551,129 47 104,575 1,189,096 1,189,096 0 103,313 .0907,292Crop Total 4,718 1,522 10,053 2,941 473,648 217,521,958 18,285,988 4,626,878 2,732,501 27,046,638 1.480
Page 23 3/9/04

Federal Crop Insurance CorporationNationwide Summary - By State/Crop
Delivery Pol Units Units Net Liabilities Total Subsidy Premium IndemnityPol
Indem EarnPrem Indem Acres Premium Discount LossRatioSold EarnPremIns PolPlan ShareCost
Crop Year Statistics For 2000As Of: 03/08/2004
GEORGIAPECANS
RBUPPRV 39 35 6 6,284,80435 6 12,071 597,449 128,682 93,760 119,509 .200RCATPRV 75 57 7 1,407,54757 7 12,444 211,762 211,762 0 40,337 .190114Crop Total 92 13 92 13 24,515 7,692,351 809,211 340,444 93,760 159,846 .200
PEPPERSRBUPDOL 3 3 0 599,0754 0 258 55,887 24,333 6,311 0 .000
3Crop Total 3 0 4 0 258 599,075 55,887 24,333 6,311 0 .000RYE
RBUPAPH 1 1 0 1,3061 0 31 139 6 27 0 .0001Crop Total 1 0 1 0 31 1,306 139 6 27 0 .000
SOYBEANSRBUPAPH 1,647 470 263 4,339,6511,060 515 60,895 745,118 191,865 110,757 1,221,227 1.640RCATAPH 2,176 625 146 1,760,264653 148 62,701 212,474 212,474 0 150,328 .710RBUPCRC 126 38 23 313,19297 40 4,573 66,181 9,044 11,438 79,034 1.190RBUPGRP 12 4 4 143,7524 4 963 11,441 1,786 1,932 26,594 2.320
3,961Crop Total 1,137 436 1,814 707 129,132 6,556,859 1,035,214 415,169 124,127 1,477,183 1.430WHEAT
RBUPAPH 920 369 56 4,640,095778 107 56,446 449,594 98,053 70,343 691,998 1.540RCATAPH 1,307 479 5 2,423,830492 5 71,344 146,345 146,345 0 17,019 .120RBUPCRC 105 55 5 882,527109 5 9,070 98,386 6,479 18,392 7,487 .0802,332Crop Total 903 66 1,379 117 136,860 7,946,452 694,325 250,877 88,735 716,504 1.030
30,671State Total 16,892 6,651 37,529 14,319 2,595,957 773,269,735 78,668,786 22,890,078 11,145,550 127,346,568 1.620
HAWAIIMACADAMIA NUTS
RBUPAPH 22 21 7 12,175,08864 9 8,093 175,343 33,003 32,847 305,238 1.740RCATAPH 13 12 0 2,850,75116 0 6,128 25,668 25,668 0 0 .00035Crop Total 33 7 80 9 14,221 15,025,839 201,011 58,671 32,847 305,238 1.520
MACADAMIA TREESRBUPDOL 20 19 1 70,982,439105 4 10,024 775,187 285,242 98,010 303,901 .390RCATDOL 21 20 0 9,446,95126 0 4,379 85,021 85,021 0 0 .000
41Crop Total 39 1 131 4 14,403 80,429,390 860,208 370,263 98,010 303,901 .350NURSERY (FG&C)
RBUPDOL 9 9 0 2,117,1949 0 0 21,880 7,541 2,869 0 .000RCATDOL 46 45 0 15,007,42246 0 0 133,338 133,338 0 0 .00055Crop Total 54 0 55 0 0 17,124,616 155,218 140,879 2,869 0 .000
Page 24 3/9/04
Federal Crop Insurance CorporationNationwide Summary - By State/Crop
Delivery Pol Units Units Net Liabilities Total Subsidy Premium IndemnityPol
Indem EarnPrem Indem Acres Premium Discount LossRatioSold EarnPremIns PolPlan ShareCost
Crop Year Statistics For 2000As Of: 03/08/2004
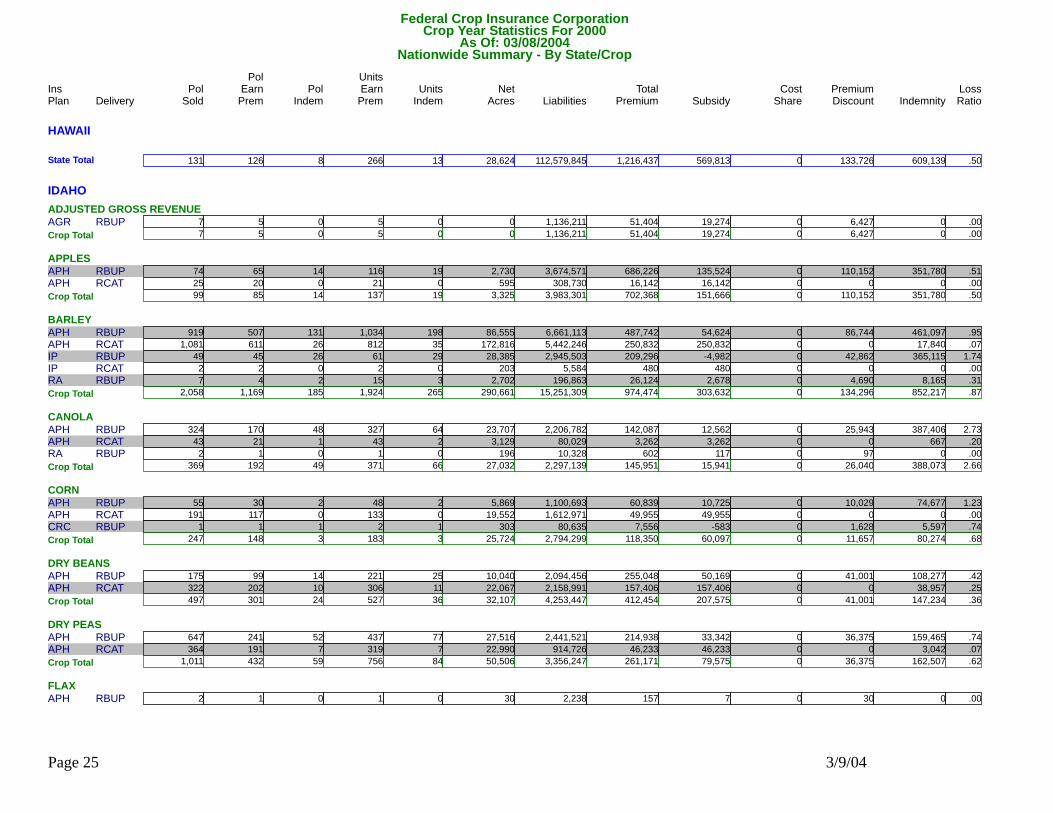
HAWAII131State Total 126 8 266 13 28,624 112,579,845 1,216,437 569,813 133,726 609,139 .500
IDAHOADJUSTED GROSS REVENUE
RBUPAGR 7 5 0 1,136,2115 0 0 51,404 19,274 6,427 0 .0007Crop Total 5 0 5 0 0 1,136,211 51,404 19,274 6,427 0 .000
APPLESRBUPAPH 74 65 14 3,674,571116 19 2,730 686,226 135,524 110,152 351,780 .510RCATAPH 25 20 0 308,73021 0 595 16,142 16,142 0 0 .000
99Crop Total 85 14 137 19 3,325 3,983,301 702,368 151,666 110,152 351,780 .500BARLEY
RBUPAPH 919 507 131 6,661,1131,034 198 86,555 487,742 54,624 86,744 461,097 .950RCATAPH 1,081 611 26 5,442,246812 35 172,816 250,832 250,832 0 17,840 .070RBUPIP 49 45 26 2,945,50361 29 28,385 209,296 -4,982 42,862 365,115 1.740RCATIP 2 2 0 5,5842 0 203 480 480 0 0 .000RBUPRA 7 4 2 196,86315 3 2,702 26,124 2,678 4,690 8,165 .3102,058Crop Total 1,169 185 1,924 265 290,661 15,251,309 974,474 303,632 134,296 852,217 .870
CANOLARBUPAPH 324 170 48 2,206,782327 64 23,707 142,087 12,562 25,943 387,406 2.730RCATAPH 43 21 1 80,02943 2 3,129 3,262 3,262 0 667 .200RBUPRA 2 1 0 10,3281 0 196 602 117 97 0 .000
369Crop Total 192 49 371 66 27,032 2,297,139 145,951 15,941 26,040 388,073 2.660CORN
RBUPAPH 55 30 2 1,100,69348 2 5,869 60,839 10,725 10,029 74,677 1.230RCATAPH 191 117 0 1,612,971133 0 19,552 49,955 49,955 0 0 .000RBUPCRC 1 1 1 80,6352 1 303 7,556 -583 1,628 5,597 .740247Crop Total 148 3 183 3 25,724 2,794,299 118,350 60,097 11,657 80,274 .680
DRY BEANSRBUPAPH 175 99 14 2,094,456221 25 10,040 255,048 50,169 41,001 108,277 .420RCATAPH 322 202 10 2,158,991306 11 22,067 157,406 157,406 0 38,957 .250
497Crop Total 301 24 527 36 32,107 4,253,447 412,454 207,575 41,001 147,234 .360DRY PEAS
RBUPAPH 647 241 52 2,441,521437 77 27,516 214,938 33,342 36,375 159,465 .740RCATAPH 364 191 7 914,726319 7 22,990 46,233 46,233 0 3,042 .0701,011Crop Total 432 59 756 84 50,506 3,356,247 261,171 79,575 36,375 162,507 .620
FLAXRBUPAPH 2 1 0 2,2381 0 30 157 7 30 0 .000
Page 25 3/9/04
Federal Crop Insurance CorporationNationwide Summary - By State/Crop
Delivery Pol Units Units Net Liabilities Total Subsidy Premium IndemnityPol
Indem EarnPrem Indem Acres Premium Discount LossRatioSold EarnPremIns PolPlan ShareCost
Crop Year Statistics For 2000As Of: 03/08/2004
IDAHOFLAX
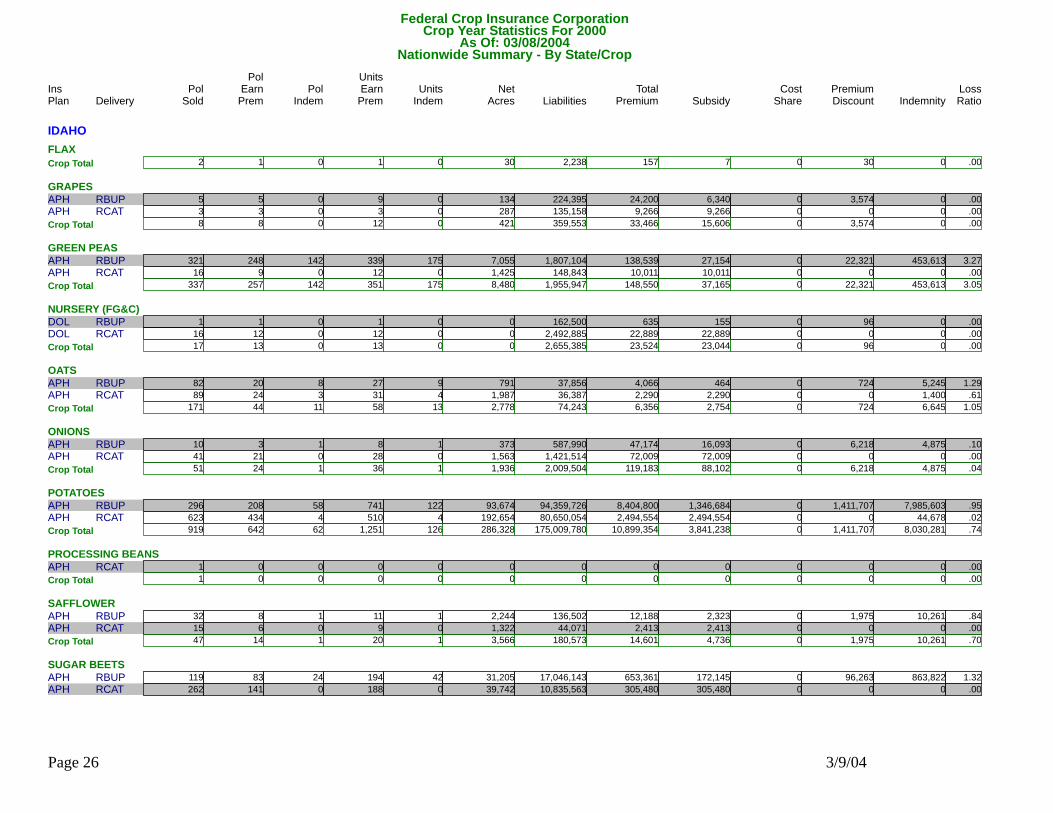
2Crop Total 1 0 1 0 30 2,238 157 7 30 0 .000GRAPES
RBUPAPH 5 5 0 224,3959 0 134 24,200 6,340 3,574 0 .000RCATAPH 3 3 0 135,1583 0 287 9,266 9,266 0 0 .0008Crop Total 8 0 12 0 421 359,553 33,466 15,606 3,574 0 .000
GREEN PEASRBUPAPH 321 248 142 1,807,104339 175 7,055 138,539 27,154 22,321 453,613 3.270RCATAPH 16 9 0 148,84312 0 1,425 10,011 10,011 0 0 .000
337Crop Total 257 142 351 175 8,480 1,955,947 148,550 37,165 22,321 453,613 3.050NURSERY (FG&C)
RBUPDOL 1 1 0 162,5001 0 0 635 155 96 0 .000RCATDOL 16 12 0 2,492,88512 0 0 22,889 22,889 0 0 .00017Crop Total 13 0 13 0 0 2,655,385 23,524 23,044 96 0 .000
OATSRBUPAPH 82 20 8 37,85627 9 791 4,066 464 724 5,245 1.290RCATAPH 89 24 3 36,38731 4 1,987 2,290 2,290 0 1,400 .610
171Crop Total 44 11 58 13 2,778 74,243 6,356 2,754 724 6,645 1.050ONIONS
RBUPAPH 10 3 1 587,9908 1 373 47,174 16,093 6,218 4,875 .100RCATAPH 41 21 0 1,421,51428 0 1,563 72,009 72,009 0 0 .00051Crop Total 24 1 36 1 1,936 2,009,504 119,183 88,102 6,218 4,875 .040
POTATOESRBUPAPH 296 208 58 94,359,726741 122 93,674 8,404,800 1,346,684 1,411,707 7,985,603 .950RCATAPH 623 434 4 80,650,054510 4 192,654 2,494,554 2,494,554 0 44,678 .020
919Crop Total 642 62 1,251 126 286,328 175,009,780 10,899,354 3,841,238 1,411,707 8,030,281 .740PROCESSING BEANS
RCATAPH 1 0 0 00 0 0 0 0 0 0 .0001Crop Total 0 0 0 0 0 0 0 0 0 0 .000
SAFFLOWERRBUPAPH 32 8 1 136,50211 1 2,244 12,188 2,323 1,975 10,261 .840RCATAPH 15 6 0 44,0719 0 1,322 2,413 2,413 0 0 .000
47Crop Total 14 1 20 1 3,566 180,573 14,601 4,736 1,975 10,261 .700SUGAR BEETS
RBUPAPH 119 83 24 17,046,143194 42 31,205 653,361 172,145 96,263 863,822 1.320RCATAPH 262 141 0 10,835,563188 0 39,742 305,480 305,480 0 0 .000
Page 26 3/9/04
Federal Crop Insurance CorporationNationwide Summary - By State/Crop
Delivery Pol Units Units Net Liabilities Total Subsidy Premium IndemnityPol
Indem EarnPrem Indem Acres Premium Discount LossRatioSold EarnPremIns PolPlan ShareCost
Crop Year Statistics For 2000As Of: 03/08/2004
IDAHOSUGAR BEETS
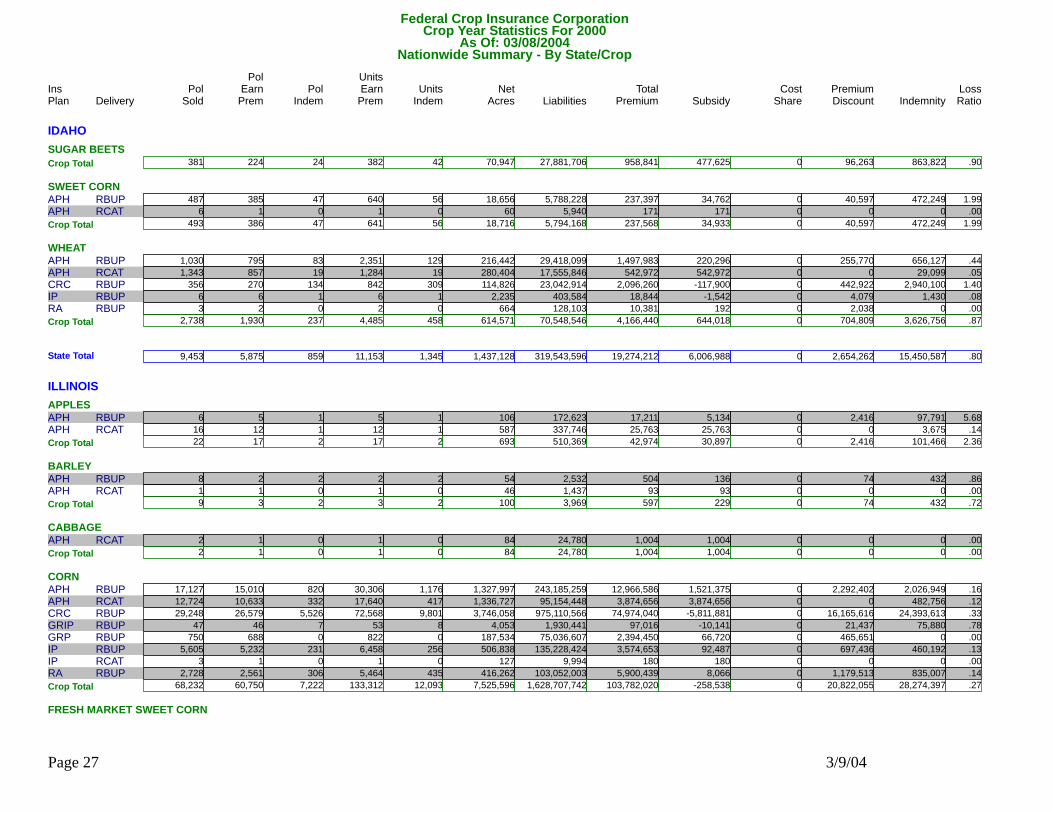
381Crop Total 224 24 382 42 70,947 27,881,706 958,841 477,625 96,263 863,822 .900SWEET CORN
RBUPAPH 487 385 47 5,788,228640 56 18,656 237,397 34,762 40,597 472,249 1.990RCATAPH 6 1 0 5,9401 0 60 171 171 0 0 .000493Crop Total 386 47 641 56 18,716 5,794,168 237,568 34,933 40,597 472,249 1.990
WHEATRBUPAPH 1,030 795 83 29,418,0992,351 129 216,442 1,497,983 220,296 255,770 656,127 .440RCATAPH 1,343 857 19 17,555,8461,284 19 280,404 542,972 542,972 0 29,099 .050RBUPCRC 356 270 134 23,042,914842 309 114,826 2,096,260 -117,900 442,922 2,940,100 1.400RBUPIP 6 6 1 403,5846 1 2,235 18,844 -1,542 4,079 1,430 .080RBUPRA 3 2 0 128,1032 0 664 10,381 192 2,038 0 .000
2,738Crop Total 1,930 237 4,485 458 614,571 70,548,546 4,166,440 644,018 704,809 3,626,756 .870
9,453State Total 5,875 859 11,153 1,345 1,437,128 319,543,596 19,274,212 6,006,988 2,654,262 15,450,587 .800
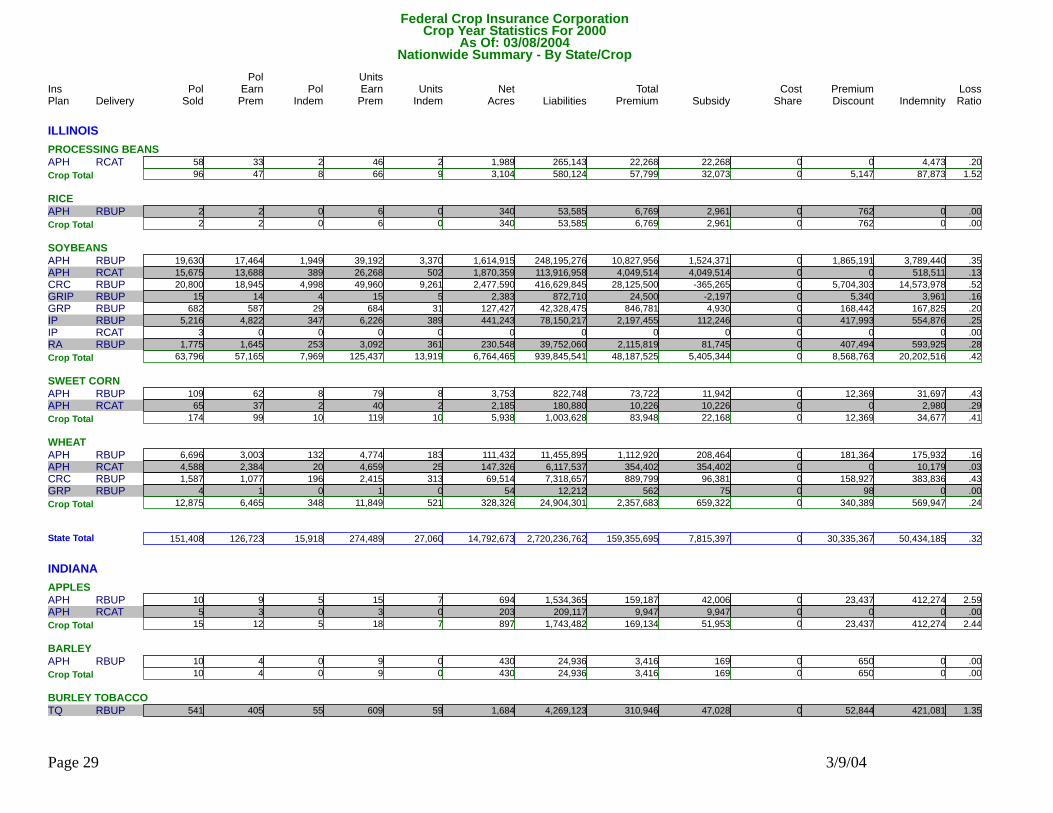
ILLINOISAPPLES
RBUPAPH 6 5 1 172,6235 1 106 17,211 5,134 2,416 97,791 5.680RCATAPH 16 12 1 337,74612 1 587 25,763 25,763 0 3,675 .14022Crop Total 17 2 17 2 693 510,369 42,974 30,897 2,416 101,466 2.360
BARLEYRBUPAPH 8 2 2 2,5322 2 54 504 136 74 432 .860RCATAPH 1 1 0 1,4371 0 46 93 93 0 0 .000
9Crop Total 3 2 3 2 100 3,969 597 229 74 432 .720CABBAGE
RCATAPH 2 1 0 24,7801 0 84 1,004 1,004 0 0 .0002Crop Total 1 0 1 0 84 24,780 1,004 1,004 0 0 .000
CORNRBUPAPH 17,127 15,010 820 243,185,25930,306 1,176 1,327,997 12,966,586 1,521,375 2,292,402 2,026,949 .160RCATAPH 12,724 10,633 332 95,154,44817,640 417 1,336,727 3,874,656 3,874,656 0 482,756 .120RBUPCRC 29,248 26,579 5,526 975,110,56672,568 9,801 3,746,058 74,974,040 -5,811,881 16,165,616 24,393,613 .330RBUPGRIP 47 46 7 1,930,44153 8 4,053 97,016 -10,141 21,437 75,880 .780RBUPGRP 750 688 0 75,036,607822 0 187,534 2,394,450 66,720 465,651 0 .000RBUPIP 5,605 5,232 231 135,228,4246,458 256 506,838 3,574,653 92,487 697,436 460,192 .130RCATIP 3 1 0 9,9941 0 127 180 180 0 0 .000RBUPRA 2,728 2,561 306 103,052,0035,464 435 416,262 5,900,439 8,066 1,179,513 835,007 .140
68,232Crop Total 60,750 7,222 133,312 12,093 7,525,596 1,628,707,742 103,782,020 -258,538 20,822,055 28,274,397 .270FRESH MARKET SWEET CORN
Page 27 3/9/04
Federal Crop Insurance CorporationNationwide Summary - By State/Crop
Delivery Pol Units Units Net Liabilities Total Subsidy Premium IndemnityPol
Indem EarnPrem Indem Acres Premium Discount LossRatioSold EarnPremIns PolPlan ShareCost
Crop Year Statistics For 2000As Of: 03/08/2004
ILLINOISFRESH MARKET SWEET CORN
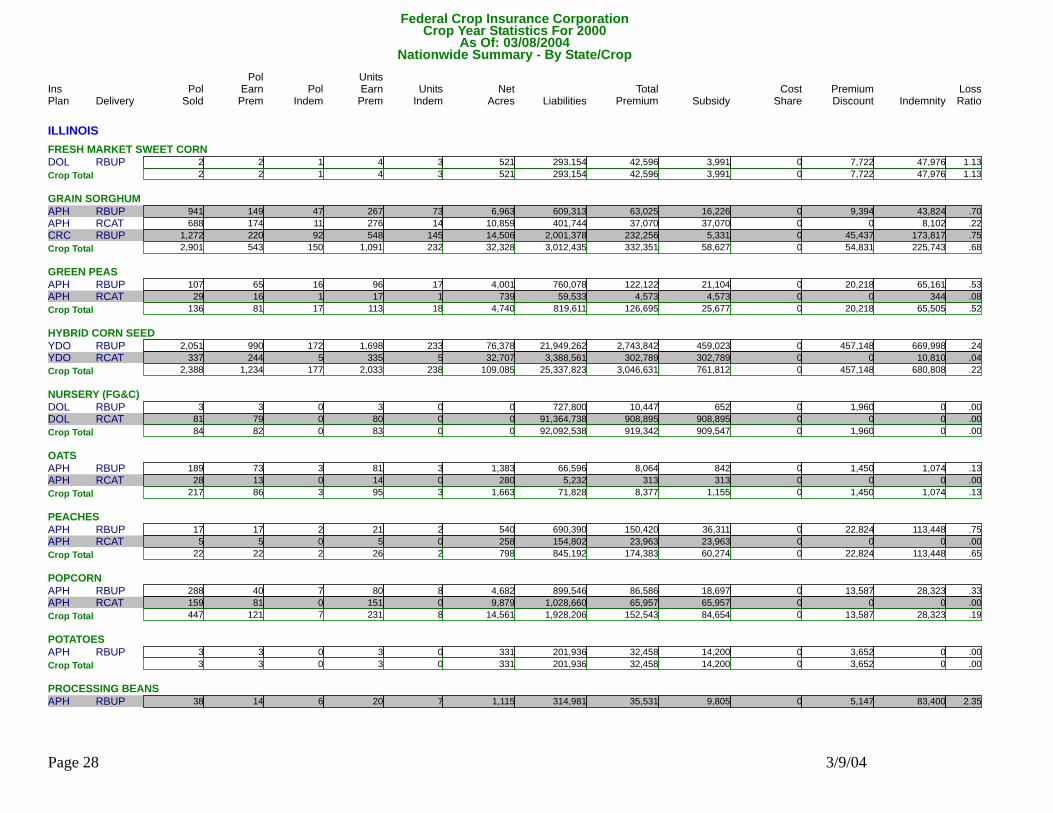
RBUPDOL 2 2 1 293,1544 3 521 42,596 3,991 7,722 47,976 1.1302Crop Total 2 1 4 3 521 293,154 42,596 3,991 7,722 47,976 1.130
GRAIN SORGHUMRBUPAPH 941 149 47 609,313267 73 6,963 63,025 16,226 9,394 43,824 .700RCATAPH 688 174 11 401,744276 14 10,859 37,070 37,070 0 8,102 .220RBUPCRC 1,272 220 92 2,001,378548 145 14,506 232,256 5,331 45,437 173,817 .750
2,901Crop Total 543 150 1,091 232 32,328 3,012,435 332,351 58,627 54,831 225,743 .680GREEN PEAS
RBUPAPH 107 65 16 760,07896 17 4,001 122,122 21,104 20,218 65,161 .530RCATAPH 29 16 1 59,53317 1 739 4,573 4,573 0 344 .080136Crop Total 81 17 113 18 4,740 819,611 126,695 25,677 20,218 65,505 .520
HYBRID CORN SEEDRBUPYDO 2,051 990 172 21,949,2621,698 233 76,378 2,743,842 459,023 457,148 669,998 .240RCATYDO 337 244 5 3,388,561335 5 32,707 302,789 302,789 0 10,810 .040
2,388Crop Total 1,234 177 2,033 238 109,085 25,337,823 3,046,631 761,812 457,148 680,808 .220NURSERY (FG&C)
RBUPDOL 3 3 0 727,8003 0 0 10,447 652 1,960 0 .000RCATDOL 81 79 0 91,364,73880 0 0 908,895 908,895 0 0 .00084Crop Total 82 0 83 0 0 92,092,538 919,342 909,547 1,960 0 .000
OATSRBUPAPH 189 73 3 66,59681 3 1,383 8,064 842 1,450 1,074 .130RCATAPH 28 13 0 5,23214 0 280 313 313 0 0 .000
217Crop Total 86 3 95 3 1,663 71,828 8,377 1,155 1,450 1,074 .130PEACHES
RBUPAPH 17 17 2 690,39021 2 540 150,420 36,311 22,824 113,448 .750RCATAPH 5 5 0 154,8025 0 258 23,963 23,963 0 0 .00022Crop Total 22 2 26 2 798 845,192 174,383 60,274 22,824 113,448 .650
POPCORNRBUPAPH 288 40 7 899,54680 8 4,682 86,586 18,697 13,587 28,323 .330RCATAPH 159 81 0 1,028,660151 0 9,879 65,957 65,957 0 0 .000
447Crop Total 121 7 231 8 14,561 1,928,206 152,543 84,654 13,587 28,323 .190POTATOES
RBUPAPH 3 3 0 201,9363 0 331 32,458 14,200 3,652 0 .0003Crop Total 3 0 3 0 331 201,936 32,458 14,200 3,652 0 .000
PROCESSING BEANSRBUPAPH 38 14 6 314,98120 7 1,115 35,531 9,805 5,147 83,400 2.350
Page 28 3/9/04
Federal Crop Insurance CorporationNationwide Summary - By State/Crop
Delivery Pol Units Units Net Liabilities Total Subsidy Premium IndemnityPol
Indem EarnPrem Indem Acres Premium Discount LossRatioSold EarnPremIns PolPlan ShareCost
Crop Year Statistics For 2000As Of: 03/08/2004
ILLINOISPROCESSING BEANS
RCATAPH 58 33 2 265,14346 2 1,989 22,268 22,268 0 4,473 .20096Crop Total 47 8 66 9 3,104 580,124 57,799 32,073 5,147 87,873 1.520
RICERBUPAPH 2 2 0 53,5856 0 340 6,769 2,961 762 0 .000
2Crop Total 2 0 6 0 340 53,585 6,769 2,961 762 0 .000SOYBEANS
RBUPAPH 19,630 17,464 1,949 248,195,27639,192 3,370 1,614,915 10,827,956 1,524,371 1,865,191 3,789,440 .350RCATAPH 15,675 13,688 389 113,916,95826,268 502 1,870,359 4,049,514 4,049,514 0 518,511 .130RBUPCRC 20,800 18,945 4,998 416,629,84549,960 9,261 2,477,590 28,125,500 -365,265 5,704,303 14,573,978 .520RBUPGRIP 15 14 4 872,71015 5 2,383 24,500 -2,197 5,340 3,961 .160RBUPGRP 682 587 29 42,328,475684 31 127,427 846,781 4,930 168,442 167,825 .200RBUPIP 5,216 4,822 347 78,150,2176,226 389 441,243 2,197,455 112,246 417,993 554,876 .250RCATIP 3 0 0 00 0 0 0 0 0 0 .000RBUPRA 1,775 1,645 253 39,752,0603,092 361 230,548 2,115,819 81,745 407,494 593,925 .28063,796Crop Total 57,165 7,969 125,437 13,919 6,764,465 939,845,541 48,187,525 5,405,344 8,568,763 20,202,516 .420
SWEET CORNRBUPAPH 109 62 8 822,74879 8 3,753 73,722 11,942 12,369 31,697 .430RCATAPH 65 37 2 180,88040 2 2,185 10,226 10,226 0 2,980 .290
174Crop Total 99 10 119 10 5,938 1,003,628 83,948 22,168 12,369 34,677 .410WHEAT
RBUPAPH 6,696 3,003 132 11,455,8954,774 183 111,432 1,112,920 208,464 181,364 175,932 .160RCATAPH 4,588 2,384 20 6,117,5374,659 25 147,326 354,402 354,402 0 10,179 .030RBUPCRC 1,587 1,077 196 7,318,6572,415 313 69,514 889,799 96,381 158,927 383,836 .430RBUPGRP 4 1 0 12,2121 0 54 562 75 98 0 .00012,875Crop Total 6,465 348 11,849 521 328,326 24,904,301 2,357,683 659,322 340,389 569,947 .240
151,408State Total 126,723 15,918 274,489 27,060 14,792,673 2,720,236,762 159,355,695 7,815,397 30,335,367 50,434,185 .320
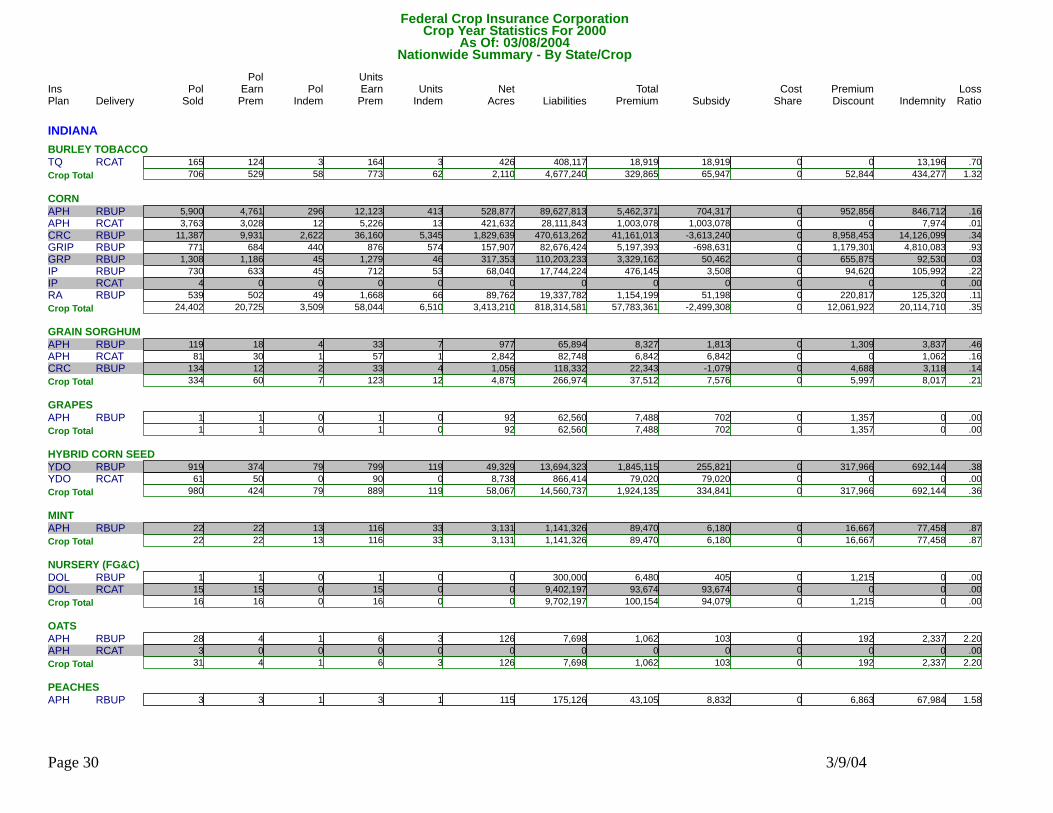
INDIANAAPPLES
RBUPAPH 10 9 5 1,534,36515 7 694 159,187 42,006 23,437 412,274 2.590RCATAPH 5 3 0 209,1173 0 203 9,947 9,947 0 0 .00015Crop Total 12 5 18 7 897 1,743,482 169,134 51,953 23,437 412,274 2.440
BARLEYRBUPAPH 10 4 0 24,9369 0 430 3,416 169 650 0 .000
10Crop Total 4 0 9 0 430 24,936 3,416 169 650 0 .000BURLEY TOBACCO
RBUPTQ 541 405 55 4,269,123609 59 1,684 310,946 47,028 52,844 421,081 1.350
Page 29 3/9/04
Federal Crop Insurance CorporationNationwide Summary - By State/Crop
Delivery Pol Units Units Net Liabilities Total Subsidy Premium IndemnityPol
Indem EarnPrem Indem Acres Premium Discount LossRatioSold EarnPremIns PolPlan ShareCost
Crop Year Statistics For 2000As Of: 03/08/2004
INDIANABURLEY TOBACCO
RCATTQ 165 124 3 408,117164 3 426 18,919 18,919 0 13,196 .700706Crop Total 529 58 773 62 2,110 4,677,240 329,865 65,947 52,844 434,277 1.320
CORNRBUPAPH 5,900 4,761 296 89,627,81312,123 413 528,877 5,462,371 704,317 952,856 846,712 .160RCATAPH 3,763 3,028 12 28,111,8435,226 13 421,632 1,003,078 1,003,078 0 7,974 .010RBUPCRC 11,387 9,931 2,622 470,613,26236,160 5,345 1,829,639 41,161,013 -3,613,240 8,958,453 14,126,099 .340RBUPGRIP 771 684 440 82,676,424876 574 157,907 5,197,393 -698,631 1,179,301 4,810,083 .930RBUPGRP 1,308 1,186 45 110,203,2331,279 46 317,353 3,329,162 50,462 655,875 92,530 .030RBUPIP 730 633 45 17,744,224712 53 68,040 476,145 3,508 94,620 105,992 .220RCATIP 4 0 0 00 0 0 0 0 0 0 .000RBUPRA 539 502 49 19,337,7821,668 66 89,762 1,154,199 51,198 220,817 125,320 .110
24,402Crop Total 20,725 3,509 58,044 6,510 3,413,210 818,314,581 57,783,361 -2,499,308 12,061,922 20,114,710 .350GRAIN SORGHUM
RBUPAPH 119 18 4 65,89433 7 977 8,327 1,813 1,309 3,837 .460RCATAPH 81 30 1 82,74857 1 2,842 6,842 6,842 0 1,062 .160RBUPCRC 134 12 2 118,33233 4 1,056 22,343 -1,079 4,688 3,118 .140334Crop Total 60 7 123 12 4,875 266,974 37,512 7,576 5,997 8,017 .210
GRAPESRBUPAPH 1 1 0 62,5601 0 92 7,488 702 1,357 0 .000
1Crop Total 1 0 1 0 92 62,560 7,488 702 1,357 0 .000HYBRID CORN SEED
RBUPYDO 919 374 79 13,694,323799 119 49,329 1,845,115 255,821 317,966 692,144 .380RCATYDO 61 50 0 866,41490 0 8,738 79,020 79,020 0 0 .000980Crop Total 424 79 889 119 58,067 14,560,737 1,924,135 334,841 317,966 692,144 .360
MINTRBUPAPH 22 22 13 1,141,326116 33 3,131 89,470 6,180 16,667 77,458 .870
22Crop Total 22 13 116 33 3,131 1,141,326 89,470 6,180 16,667 77,458 .870NURSERY (FG&C)
RBUPDOL 1 1 0 300,0001 0 0 6,480 405 1,215 0 .000RCATDOL 15 15 0 9,402,19715 0 0 93,674 93,674 0 0 .00016Crop Total 16 0 16 0 0 9,702,197 100,154 94,079 1,215 0 .000
OATSRBUPAPH 28 4 1 7,6986 3 126 1,062 103 192 2,337 2.200RCATAPH 3 0 0 00 0 0 0 0 0 0 .000
31Crop Total 4 1 6 3 126 7,698 1,062 103 192 2,337 2.200PEACHES
RBUPAPH 3 3 1 175,1263 1 115 43,105 8,832 6,863 67,984 1.580
Page 30 3/9/04

Federal Crop Insurance CorporationNationwide Summary - By State/Crop
Delivery Pol Units Units Net Liabilities Total Subsidy Premium IndemnityPol
Indem EarnPrem Indem Acres Premium Discount LossRatioSold EarnPremIns PolPlan ShareCost
Crop Year Statistics For 2000As Of: 03/08/2004
INDIANAPEACHES
3Crop Total 3 1 3 1 115 175,126 43,105 8,832 6,863 67,984 1.580POPCORN
RBUPAPH 543 185 26 7,078,140464 60 29,638 685,298 74,733 122,156 291,370 .430RCATAPH 65 26 0 477,36940 0 5,099 27,944 27,944 0 0 .000608Crop Total 211 26 504 60 34,737 7,555,509 713,242 102,677 122,156 291,370 .410
POTATOESRBUPAPH 8 3 0 239,3889 0 260 39,842 13,319 5,306 0 .000RCATAPH 1 0 0 00 0 0 0 0 0 0 .000
9Crop Total 3 0 9 0 260 239,388 39,842 13,319 5,306 0 .000PROCESSING BEANS
RBUPAPH 9 6 1 55,01410 1 230 7,033 1,803 1,047 5,408 .7709Crop Total 6 1 10 1 230 55,014 7,033 1,803 1,047 5,408 .770
SOYBEANSRBUPAPH 6,289 5,266 943 97,887,25514,942 1,602 659,034 5,503,012 782,778 945,700 2,050,276 .370RCATAPH 4,555 3,804 42 34,467,2567,319 49 591,752 1,173,408 1,173,408 0 39,592 .030RBUPCRC 9,359 8,192 2,870 246,164,85329,772 6,090 1,402,452 19,840,699 -859,073 4,143,029 9,516,238 .480RBUPGRIP 596 531 40 39,326,400683 44 112,274 2,015,017 -302,004 463,482 51,791 .030RBUPGRP 1,408 1,292 61 106,625,5441,428 61 336,989 2,511,964 -101,108 522,786 191,321 .080RBUPIP 648 587 73 11,771,965632 74 67,230 332,604 -804 66,771 86,337 .260RCATIP 7 3 0 77,9425 0 1,022 832 832 0 0 .000RBUPRA 326 290 57 7,083,9391,007 111 49,392 501,951 47,762 90,976 234,252 .470
23,188Crop Total 19,965 4,086 55,788 8,031 3,220,145 543,405,154 31,879,487 741,791 6,232,744 12,169,807 .380TOMATOES
RBUPAPH 48 30 8 4,546,12270 8 3,944 429,466 96,312 66,641 145,235 .340RCATAPH 6 4 0 210,0084 0 407 14,612 14,612 0 0 .00054Crop Total 34 8 74 8 4,351 4,756,130 444,078 110,924 66,641 145,235 .330
WHEATRBUPAPH 3,003 1,373 49 7,160,8782,293 93 62,175 457,653 67,050 78,270 422,957 .920RCATAPH 1,248 624 8 1,738,7341,019 9 38,769 65,996 65,996 0 3,494 .050RBUPCRC 722 463 67 3,424,334905 109 27,741 307,731 9,381 59,715 155,446 .510RBUPGRP 3 2 0 3,3282 0 13 116 17 20 0 .000
4,976Crop Total 2,462 124 4,219 211 128,698 12,327,274 831,496 142,444 138,005 581,897 .700
55,364State Total 44,481 7,918 120,602 15,058 6,871,474 1,419,015,326 94,403,880 -815,968 19,055,009 35,002,918 .370
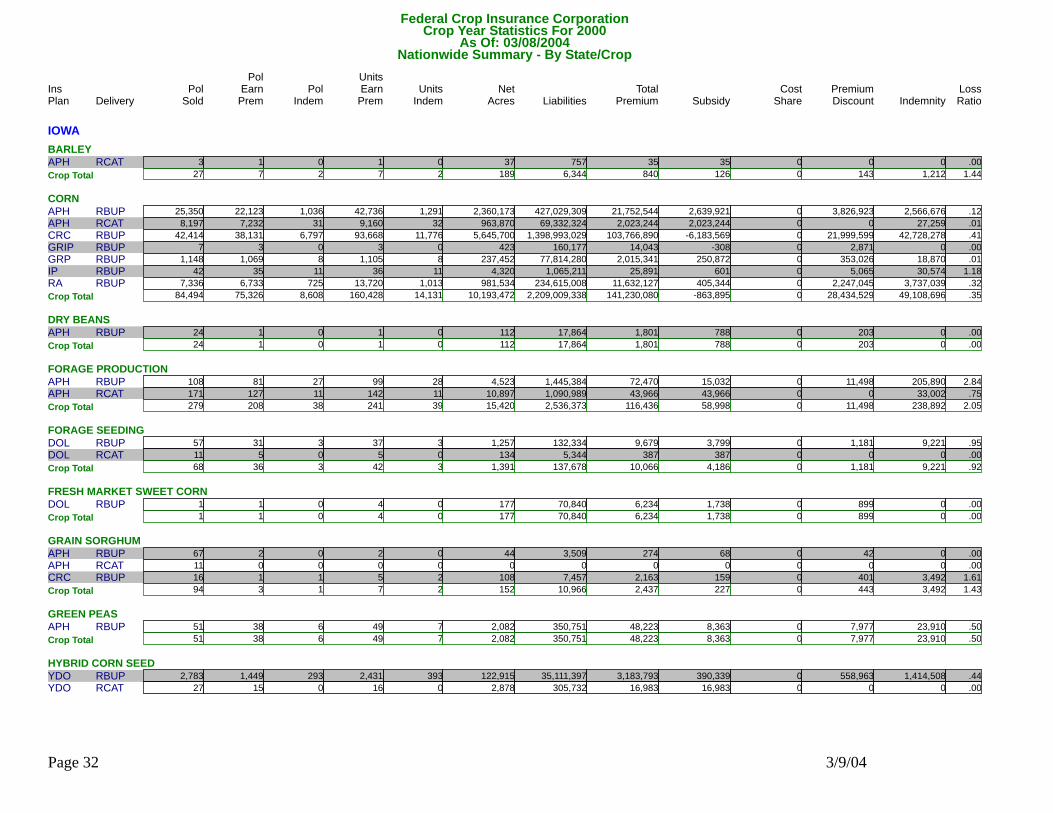
IOWABARLEY
RBUPAPH 24 6 2 5,5876 2 152 805 91 143 1,212 1.510
Page 31 3/9/04
Federal Crop Insurance CorporationNationwide Summary - By State/Crop
Delivery Pol Units Units Net Liabilities Total Subsidy Premium IndemnityPol
Indem EarnPrem Indem Acres Premium Discount LossRatioSold EarnPremIns PolPlan ShareCost
Crop Year Statistics For 2000As Of: 03/08/2004
IOWABARLEY
RCATAPH 3 1 0 7571 0 37 35 35 0 0 .00027Crop Total 7 2 7 2 189 6,344 840 126 143 1,212 1.440
CORNRBUPAPH 25,350 22,123 1,036 427,029,30942,736 1,291 2,360,173 21,752,544 2,639,921 3,826,923 2,566,676 .120RCATAPH 8,197 7,232 31 69,332,3249,160 32 963,870 2,023,244 2,023,244 0 27,259 .010RBUPCRC 42,414 38,131 6,797 1,398,993,02993,668 11,776 5,645,700 103,766,890 -6,183,569 21,999,599 42,728,278 .410RBUPGRIP 7 3 0 160,1773 0 423 14,043 -308 2,871 0 .000RBUPGRP 1,148 1,069 8 77,814,2801,105 8 237,452 2,015,341 250,872 353,026 18,870 .010RBUPIP 42 35 11 1,065,21136 11 4,320 25,891 601 5,065 30,574 1.180RBUPRA 7,336 6,733 725 234,615,00813,720 1,013 981,534 11,632,127 405,344 2,247,045 3,737,039 .320
84,494Crop Total 75,326 8,608 160,428 14,131 10,193,472 2,209,009,338 141,230,080 -863,895 28,434,529 49,108,696 .350DRY BEANS
RBUPAPH 24 1 0 17,8641 0 112 1,801 788 203 0 .00024Crop Total 1 0 1 0 112 17,864 1,801 788 203 0 .000
FORAGE PRODUCTIONRBUPAPH 108 81 27 1,445,38499 28 4,523 72,470 15,032 11,498 205,890 2.840RCATAPH 171 127 11 1,090,989142 11 10,897 43,966 43,966 0 33,002 .750
279Crop Total 208 38 241 39 15,420 2,536,373 116,436 58,998 11,498 238,892 2.050FORAGE SEEDING
RBUPDOL 57 31 3 132,33437 3 1,257 9,679 3,799 1,181 9,221 .950RCATDOL 11 5 0 5,3445 0 134 387 387 0 0 .00068Crop Total 36 3 42 3 1,391 137,678 10,066 4,186 1,181 9,221 .920
FRESH MARKET SWEET CORNRBUPDOL 1 1 0 70,8404 0 177 6,234 1,738 899 0 .000
1Crop Total 1 0 4 0 177 70,840 6,234 1,738 899 0 .000GRAIN SORGHUM
RBUPAPH 67 2 0 3,5092 0 44 274 68 42 0 .000RCATAPH 11 0 0 00 0 0 0 0 0 0 .000RBUPCRC 16 1 1 7,4575 2 108 2,163 159 401 3,492 1.61094Crop Total 3 1 7 2 152 10,966 2,437 227 443 3,492 1.430
GREEN PEASRBUPAPH 51 38 6 350,75149 7 2,082 48,223 8,363 7,977 23,910 .500
51Crop Total 38 6 49 7 2,082 350,751 48,223 8,363 7,977 23,910 .500HYBRID CORN SEED
RBUPYDO 2,783 1,449 293 35,111,3972,431 393 122,915 3,183,793 390,339 558,963 1,414,508 .440RCATYDO 27 15 0 305,73216 0 2,878 16,983 16,983 0 0 .000
Page 32 3/9/04

Federal Crop Insurance CorporationNationwide Summary - By State/Crop
Delivery Pol Units Units Net Liabilities Total Subsidy Premium IndemnityPol
Indem EarnPrem Indem Acres Premium Discount LossRatioSold EarnPremIns PolPlan ShareCost
Crop Year Statistics For 2000As Of: 03/08/2004
IOWAHYBRID CORN SEED
2,810Crop Total 1,464 293 2,447 393 125,793 35,417,129 3,200,776 407,322 558,963 1,414,508 .440NURSERY (FG&C)
RBUPDOL 3 3 0 1,268,4733 0 0 19,362 4,713 2,930 0 .000RCATDOL 20 20 0 10,409,26020 0 0 104,634 104,634 0 0 .00023Crop Total 23 0 23 0 0 11,677,733 123,996 109,347 2,930 0 .000
OATSRBUPAPH 2,628 888 71 765,5551,026 81 16,308 73,911 9,962 12,885 40,632 .550RCATAPH 163 74 1 43,68882 2 2,321 2,260 2,260 0 32 .010
2,791Crop Total 962 72 1,108 83 18,629 809,243 76,171 12,222 12,885 40,664 .530POPCORN
RBUPAPH 292 120 18 2,315,726181 21 10,180 193,979 22,379 34,344 84,751 .440RCATAPH 17 4 0 46,6464 0 466 1,934 1,934 0 0 .000309Crop Total 124 18 185 21 10,646 2,362,372 195,913 24,313 34,344 84,751 .430
POTATOESRBUPAPH 7 1 0 27,1521 0 47 1,308 572 147 0 .000RCATAPH 4 2 0 40,9022 0 97 1,877 1,877 0 0 .000
11Crop Total 3 0 3 0 144 68,054 3,185 2,449 147 0 .000SOYBEANS
RBUPAPH 30,167 26,497 2,661 482,214,41754,501 3,842 2,933,483 18,437,125 1,948,750 3,303,215 7,794,061 .420RCATAPH 10,596 9,356 55 86,022,03112,830 57 1,308,333 1,746,816 1,746,816 0 55,320 .030RBUPCRC 34,261 30,539 7,801 728,624,37471,626 13,814 4,157,530 42,666,931 -1,034,693 8,747,679 34,351,053 .810RBUPGRIP 6 4 0 141,5854 0 596 8,476 -887 1,873 0 .000RBUPGRP 947 865 27 49,646,629900 27 167,327 733,478 90,532 128,685 303,708 .410RBUPIP 33 28 6 628,42928 6 3,665 14,419 553 2,778 29,458 2.040RBUPRA 4,316 3,901 549 80,552,1076,756 743 476,905 3,396,971 238,082 632,749 1,652,611 .49080,326Crop Total 71,190 11,099 146,645 18,489 9,047,839 1,427,829,572 67,004,216 2,989,153 12,816,979 44,186,211 .660
SWEET CORNRBUPAPH 120 57 0 784,11069 0 4,179 67,810 10,177 11,534 0 .000RCATAPH 13 5 0 100,4355 0 1,338 5,079 5,079 0 0 .000
133Crop Total 62 0 74 0 5,517 884,545 72,889 15,256 11,534 0 .000WHEAT
RBUPAPH 332 68 7 144,42288 7 2,160 26,532 3,487 4,613 4,288 .160RCATAPH 48 19 1 14,07920 1 621 1,883 1,883 0 819 .430RBUPCRC 32 13 4 47,94921 6 733 9,506 876 1,727 7,786 .820412Crop Total 100 12 129 14 3,514 206,450 37,921 6,246 6,340 12,893 .340
171,853State Total 149,548 20,152 311,393 33,184 19,425,077 3,691,395,252 212,131,184 2,776,839 41,900,995 95,124,450 .450
Page 33 3/9/04
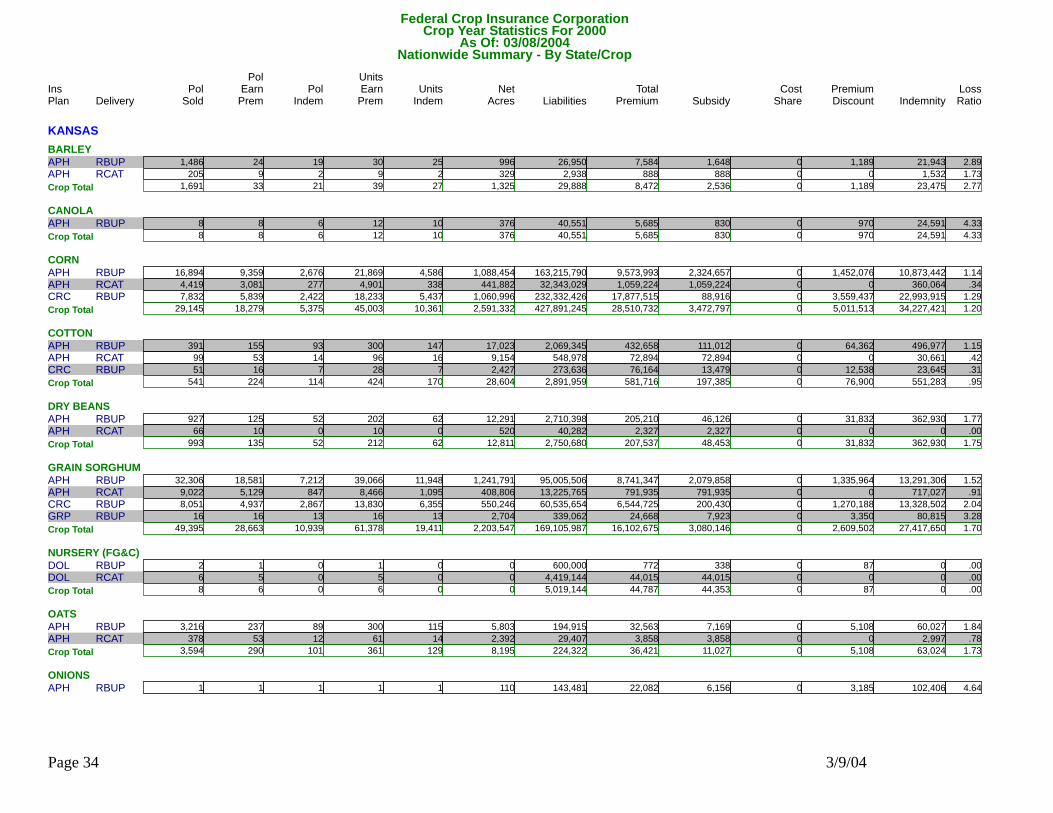
Federal Crop Insurance CorporationNationwide Summary - By State/Crop
Delivery Pol Units Units Net Liabilities Total Subsidy Premium IndemnityPol
Indem EarnPrem Indem Acres Premium Discount LossRatioSold EarnPremIns PolPlan ShareCost
Crop Year Statistics For 2000As Of: 03/08/2004
KANSASBARLEY
RBUPAPH 1,486 24 19 26,95030 25 996 7,584 1,648 1,189 21,943 2.890RCATAPH 205 9 2 2,9389 2 329 888 888 0 1,532 1.7301,691Crop Total 33 21 39 27 1,325 29,888 8,472 2,536 1,189 23,475 2.770
CANOLARBUPAPH 8 8 6 40,55112 10 376 5,685 830 970 24,591 4.330
8Crop Total 8 6 12 10 376 40,551 5,685 830 970 24,591 4.330CORN
RBUPAPH 16,894 9,359 2,676 163,215,79021,869 4,586 1,088,454 9,573,993 2,324,657 1,452,076 10,873,442 1.140RCATAPH 4,419 3,081 277 32,343,0294,901 338 441,882 1,059,224 1,059,224 0 360,064 .340RBUPCRC 7,832 5,839 2,422 232,332,42618,233 5,437 1,060,996 17,877,515 88,916 3,559,437 22,993,915 1.29029,145Crop Total 18,279 5,375 45,003 10,361 2,591,332 427,891,245 28,510,732 3,472,797 5,011,513 34,227,421 1.200
COTTONRBUPAPH 391 155 93 2,069,345300 147 17,023 432,658 111,012 64,362 496,977 1.150RCATAPH 99 53 14 548,97896 16 9,154 72,894 72,894 0 30,661 .420RBUPCRC 51 16 7 273,63628 7 2,427 76,164 13,479 12,538 23,645 .310
541Crop Total 224 114 424 170 28,604 2,891,959 581,716 197,385 76,900 551,283 .950DRY BEANS
RBUPAPH 927 125 52 2,710,398202 62 12,291 205,210 46,126 31,832 362,930 1.770RCATAPH 66 10 0 40,28210 0 520 2,327 2,327 0 0 .000993Crop Total 135 52 212 62 12,811 2,750,680 207,537 48,453 31,832 362,930 1.750
GRAIN SORGHUMRBUPAPH 32,306 18,581 7,212 95,005,50639,066 11,948 1,241,791 8,741,347 2,079,858 1,335,964 13,291,306 1.520RCATAPH 9,022 5,129 847 13,225,7658,466 1,095 408,806 791,935 791,935 0 717,027 .910RBUPCRC 8,051 4,937 2,867 60,535,65413,830 6,355 550,246 6,544,725 200,430 1,270,188 13,328,502 2.040RBUPGRP 16 16 13 339,06216 13 2,704 24,668 7,923 3,350 80,815 3.280
49,395Crop Total 28,663 10,939 61,378 19,411 2,203,547 169,105,987 16,102,675 3,080,146 2,609,502 27,417,650 1.700NURSERY (FG&C)
RBUPDOL 2 1 0 600,0001 0 0 772 338 87 0 .000RCATDOL 6 5 0 4,419,1445 0 0 44,015 44,015 0 0 .0008Crop Total 6 0 6 0 0 5,019,144 44,787 44,353 87 0 .000
OATSRBUPAPH 3,216 237 89 194,915300 115 5,803 32,563 7,169 5,108 60,027 1.840RCATAPH 378 53 12 29,40761 14 2,392 3,858 3,858 0 2,997 .780
3,594Crop Total 290 101 361 129 8,195 224,322 36,421 11,027 5,108 63,024 1.730ONIONS
RBUPAPH 1 1 1 143,4811 1 110 22,082 6,156 3,185 102,406 4.640
Page 34 3/9/04
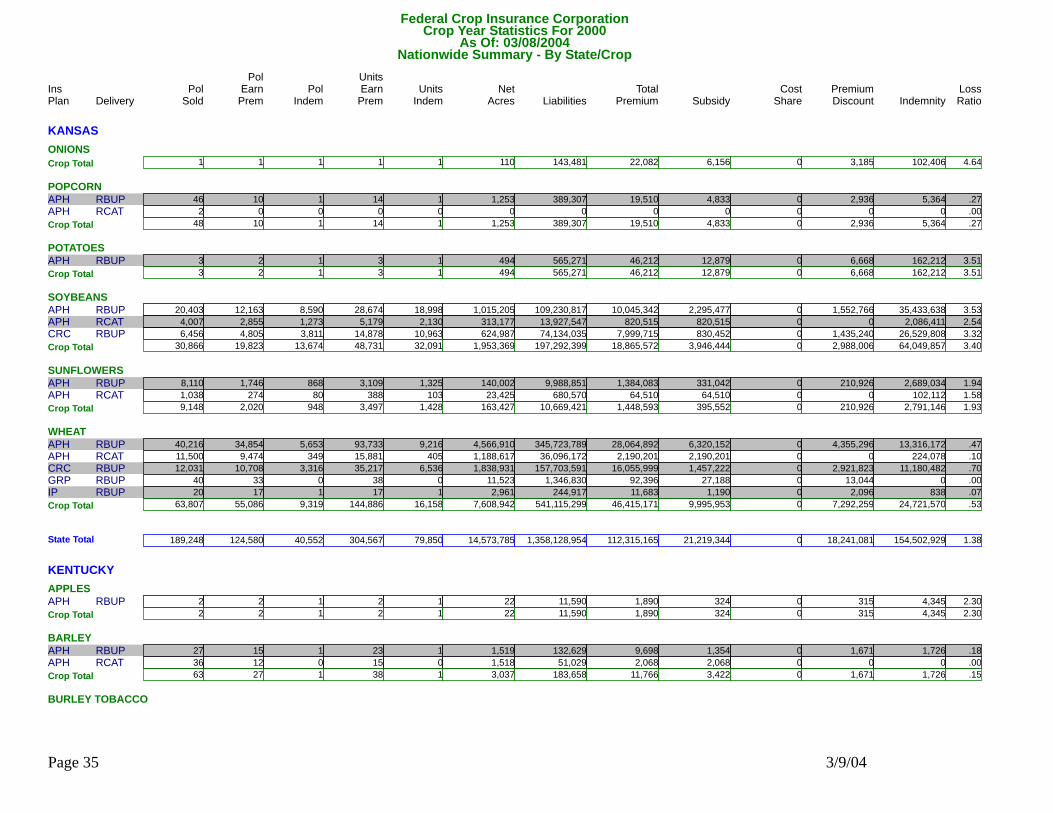
Federal Crop Insurance CorporationNationwide Summary - By State/Crop
Delivery Pol Units Units Net Liabilities Total Subsidy Premium IndemnityPol
Indem EarnPrem Indem Acres Premium Discount LossRatioSold EarnPremIns PolPlan ShareCost
Crop Year Statistics For 2000As Of: 03/08/2004
KANSASONIONS
1Crop Total 1 1 1 1 110 143,481 22,082 6,156 3,185 102,406 4.640POPCORN
RBUPAPH 46 10 1 389,30714 1 1,253 19,510 4,833 2,936 5,364 .270RCATAPH 2 0 0 00 0 0 0 0 0 0 .00048Crop Total 10 1 14 1 1,253 389,307 19,510 4,833 2,936 5,364 .270
POTATOESRBUPAPH 3 2 1 565,2713 1 494 46,212 12,879 6,668 162,212 3.510
3Crop Total 2 1 3 1 494 565,271 46,212 12,879 6,668 162,212 3.510SOYBEANS
RBUPAPH 20,403 12,163 8,590 109,230,81728,674 18,998 1,015,205 10,045,342 2,295,477 1,552,766 35,433,638 3.530RCATAPH 4,007 2,855 1,273 13,927,5475,179 2,130 313,177 820,515 820,515 0 2,086,411 2.540RBUPCRC 6,456 4,805 3,811 74,134,03514,878 10,963 624,987 7,999,715 830,452 1,435,240 26,529,808 3.32030,866Crop Total 19,823 13,674 48,731 32,091 1,953,369 197,292,399 18,865,572 3,946,444 2,988,006 64,049,857 3.400
SUNFLOWERSRBUPAPH 8,110 1,746 868 9,988,8513,109 1,325 140,002 1,384,083 331,042 210,926 2,689,034 1.940RCATAPH 1,038 274 80 680,570388 103 23,425 64,510 64,510 0 102,112 1.580
9,148Crop Total 2,020 948 3,497 1,428 163,427 10,669,421 1,448,593 395,552 210,926 2,791,146 1.930WHEAT
RBUPAPH 40,216 34,854 5,653 345,723,78993,733 9,216 4,566,910 28,064,892 6,320,152 4,355,296 13,316,172 .470RCATAPH 11,500 9,474 349 36,096,17215,881 405 1,188,617 2,190,201 2,190,201 0 224,078 .100RBUPCRC 12,031 10,708 3,316 157,703,59135,217 6,536 1,838,931 16,055,999 1,457,222 2,921,823 11,180,482 .700RBUPGRP 40 33 0 1,346,83038 0 11,523 92,396 27,188 13,044 0 .000RBUPIP 20 17 1 244,91717 1 2,961 11,683 1,190 2,096 838 .07063,807Crop Total 55,086 9,319 144,886 16,158 7,608,942 541,115,299 46,415,171 9,995,953 7,292,259 24,721,570 .530
189,248State Total 124,580 40,552 304,567 79,850 14,573,785 1,358,128,954 112,315,165 21,219,344 18,241,081 154,502,929 1.380
KENTUCKYAPPLES
RBUPAPH 2 2 1 11,5902 1 22 1,890 324 315 4,345 2.3002Crop Total 2 1 2 1 22 11,590 1,890 324 315 4,345 2.300
BARLEYRBUPAPH 27 15 1 132,62923 1 1,519 9,698 1,354 1,671 1,726 .180RCATAPH 36 12 0 51,02915 0 1,518 2,068 2,068 0 0 .000
63Crop Total 27 1 38 1 3,037 183,658 11,766 3,422 1,671 1,726 .150BURLEY TOBACCO
Page 35 3/9/04
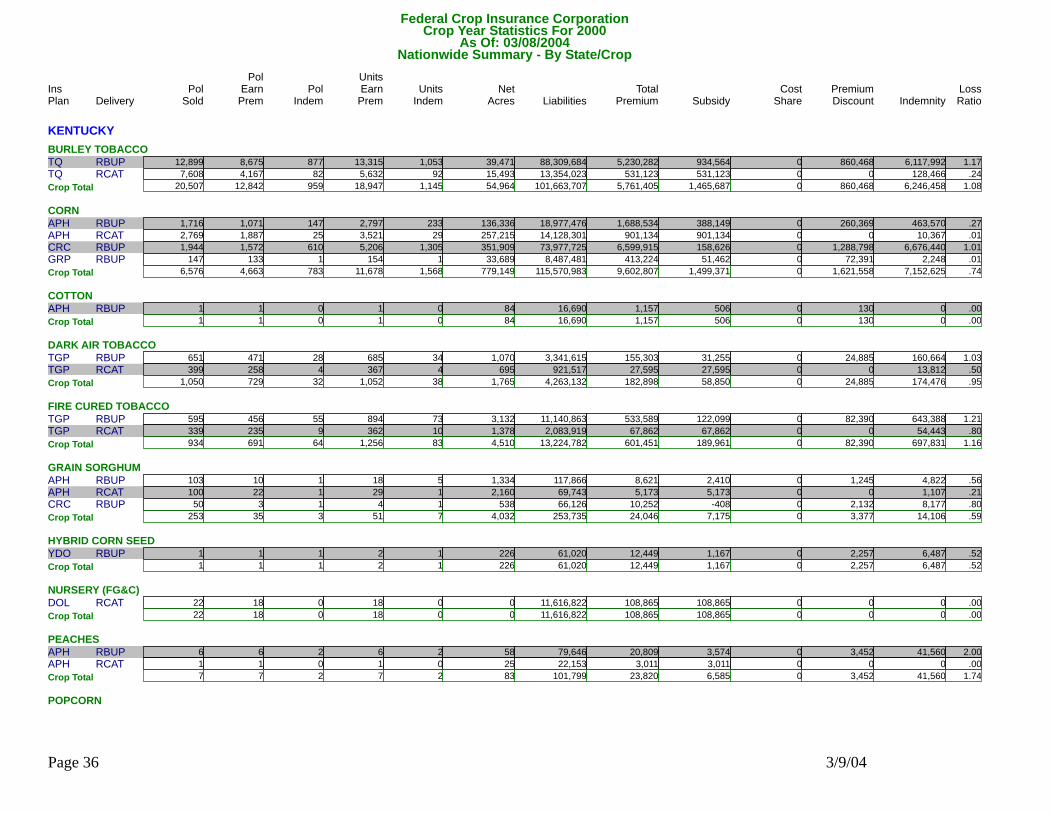
Federal Crop Insurance CorporationNationwide Summary - By State/Crop
Delivery Pol Units Units Net Liabilities Total Subsidy Premium IndemnityPol
Indem EarnPrem Indem Acres Premium Discount LossRatioSold EarnPremIns PolPlan ShareCost
Crop Year Statistics For 2000As Of: 03/08/2004
KENTUCKYBURLEY TOBACCO
RBUPTQ 12,899 8,675 877 88,309,68413,315 1,053 39,471 5,230,282 934,564 860,468 6,117,992 1.170RCATTQ 7,608 4,167 82 13,354,0235,632 92 15,493 531,123 531,123 0 128,466 .24020,507Crop Total 12,842 959 18,947 1,145 54,964 101,663,707 5,761,405 1,465,687 860,468 6,246,458 1.080
CORNRBUPAPH 1,716 1,071 147 18,977,4762,797 233 136,336 1,688,534 388,149 260,369 463,570 .270RCATAPH 2,769 1,887 25 14,128,3013,521 29 257,215 901,134 901,134 0 10,367 .010RBUPCRC 1,944 1,572 610 73,977,7255,206 1,305 351,909 6,599,915 158,626 1,288,798 6,676,440 1.010RBUPGRP 147 133 1 8,487,481154 1 33,689 413,224 51,462 72,391 2,248 .010
6,576Crop Total 4,663 783 11,678 1,568 779,149 115,570,983 9,602,807 1,499,371 1,621,558 7,152,625 .740COTTON
RBUPAPH 1 1 0 16,6901 0 84 1,157 506 130 0 .0001Crop Total 1 0 1 0 84 16,690 1,157 506 130 0 .000
DARK AIR TOBACCORBUPTGP 651 471 28 3,341,615685 34 1,070 155,303 31,255 24,885 160,664 1.030RCATTGP 399 258 4 921,517367 4 695 27,595 27,595 0 13,812 .500
1,050Crop Total 729 32 1,052 38 1,765 4,263,132 182,898 58,850 24,885 174,476 .950FIRE CURED TOBACCO
RBUPTGP 595 456 55 11,140,863894 73 3,132 533,589 122,099 82,390 643,388 1.210RCATTGP 339 235 9 2,083,919362 10 1,378 67,862 67,862 0 54,443 .800934Crop Total 691 64 1,256 83 4,510 13,224,782 601,451 189,961 82,390 697,831 1.160
GRAIN SORGHUMRBUPAPH 103 10 1 117,86618 5 1,334 8,621 2,410 1,245 4,822 .560RCATAPH 100 22 1 69,74329 1 2,160 5,173 5,173 0 1,107 .210RBUPCRC 50 3 1 66,1264 1 538 10,252 -408 2,132 8,177 .800
253Crop Total 35 3 51 7 4,032 253,735 24,046 7,175 3,377 14,106 .590HYBRID CORN SEED
RBUPYDO 1 1 1 61,0202 1 226 12,449 1,167 2,257 6,487 .5201Crop Total 1 1 2 1 226 61,020 12,449 1,167 2,257 6,487 .520
NURSERY (FG&C)RCATDOL 22 18 0 11,616,82218 0 0 108,865 108,865 0 0 .000
22Crop Total 18 0 18 0 0 11,616,822 108,865 108,865 0 0 .000PEACHES
RBUPAPH 6 6 2 79,6466 2 58 20,809 3,574 3,452 41,560 2.000RCATAPH 1 1 0 22,1531 0 25 3,011 3,011 0 0 .0007Crop Total 7 2 7 2 83 101,799 23,820 6,585 3,452 41,560 1.740
POPCORN
Page 36 3/9/04
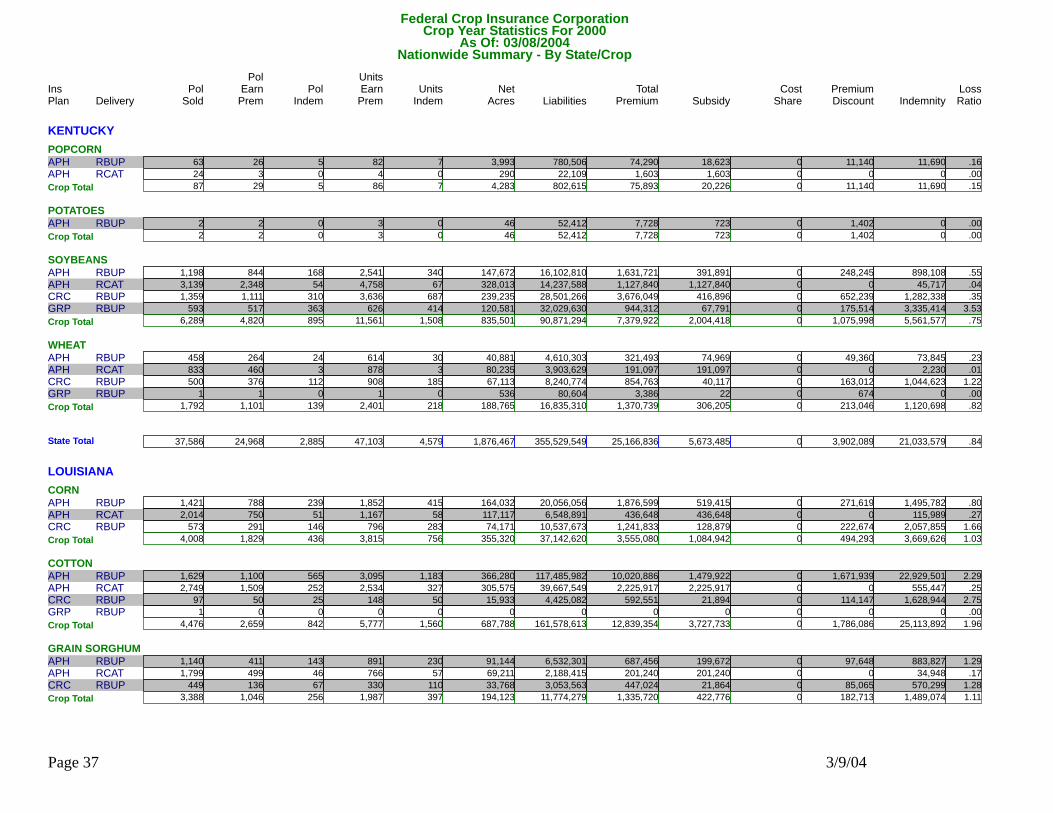
Federal Crop Insurance CorporationNationwide Summary - By State/Crop
Delivery Pol Units Units Net Liabilities Total Subsidy Premium IndemnityPol
Indem EarnPrem Indem Acres Premium Discount LossRatioSold EarnPremIns PolPlan ShareCost
Crop Year Statistics For 2000As Of: 03/08/2004
KENTUCKYPOPCORN
RBUPAPH 63 26 5 780,50682 7 3,993 74,290 18,623 11,140 11,690 .160RCATAPH 24 3 0 22,1094 0 290 1,603 1,603 0 0 .00087Crop Total 29 5 86 7 4,283 802,615 75,893 20,226 11,140 11,690 .150
POTATOESRBUPAPH 2 2 0 52,4123 0 46 7,728 723 1,402 0 .000
2Crop Total 2 0 3 0 46 52,412 7,728 723 1,402 0 .000SOYBEANS
RBUPAPH 1,198 844 168 16,102,8102,541 340 147,672 1,631,721 391,891 248,245 898,108 .550RCATAPH 3,139 2,348 54 14,237,5884,758 67 328,013 1,127,840 1,127,840 0 45,717 .040RBUPCRC 1,359 1,111 310 28,501,2663,636 687 239,235 3,676,049 416,896 652,239 1,282,338 .350RBUPGRP 593 517 363 32,029,630626 414 120,581 944,312 67,791 175,514 3,335,414 3.5306,289Crop Total 4,820 895 11,561 1,508 835,501 90,871,294 7,379,922 2,004,418 1,075,998 5,561,577 .750
WHEATRBUPAPH 458 264 24 4,610,303614 30 40,881 321,493 74,969 49,360 73,845 .230RCATAPH 833 460 3 3,903,629878 3 80,235 191,097 191,097 0 2,230 .010RBUPCRC 500 376 112 8,240,774908 185 67,113 854,763 40,117 163,012 1,044,623 1.220RBUPGRP 1 1 0 80,6041 0 536 3,386 22 674 0 .000
1,792Crop Total 1,101 139 2,401 218 188,765 16,835,310 1,370,739 306,205 213,046 1,120,698 .820
37,586State Total 24,968 2,885 47,103 4,579 1,876,467 355,529,549 25,166,836 5,673,485 3,902,089 21,033,579 .840
LOUISIANACORN
RBUPAPH 1,421 788 239 20,056,0561,852 415 164,032 1,876,599 519,415 271,619 1,495,782 .800RCATAPH 2,014 750 51 6,548,8911,167 58 117,117 436,648 436,648 0 115,989 .270RBUPCRC 573 291 146 10,537,673796 283 74,171 1,241,833 128,879 222,674 2,057,855 1.6604,008Crop Total 1,829 436 3,815 756 355,320 37,142,620 3,555,080 1,084,942 494,293 3,669,626 1.030
COTTONRBUPAPH 1,629 1,100 565 117,485,9823,095 1,183 366,280 10,020,886 1,479,922 1,671,939 22,929,501 2.290RCATAPH 2,749 1,509 252 39,667,5492,534 327 305,575 2,225,917 2,225,917 0 555,447 .250RBUPCRC 97 50 25 4,425,082148 50 15,933 592,551 21,894 114,147 1,628,944 2.750RBUPGRP 1 0 0 00 0 0 0 0 0 0 .000
4,476Crop Total 2,659 842 5,777 1,560 687,788 161,578,613 12,839,354 3,727,733 1,786,086 25,113,892 1.960GRAIN SORGHUM
RBUPAPH 1,140 411 143 6,532,301891 230 91,144 687,456 199,672 97,648 883,827 1.290RCATAPH 1,799 499 46 2,188,415766 57 69,211 201,240 201,240 0 34,948 .170RBUPCRC 449 136 67 3,053,563330 110 33,768 447,024 21,864 85,065 570,299 1.2803,388Crop Total 1,046 256 1,987 397 194,123 11,774,279 1,335,720 422,776 182,713 1,489,074 1.110
Page 37 3/9/04
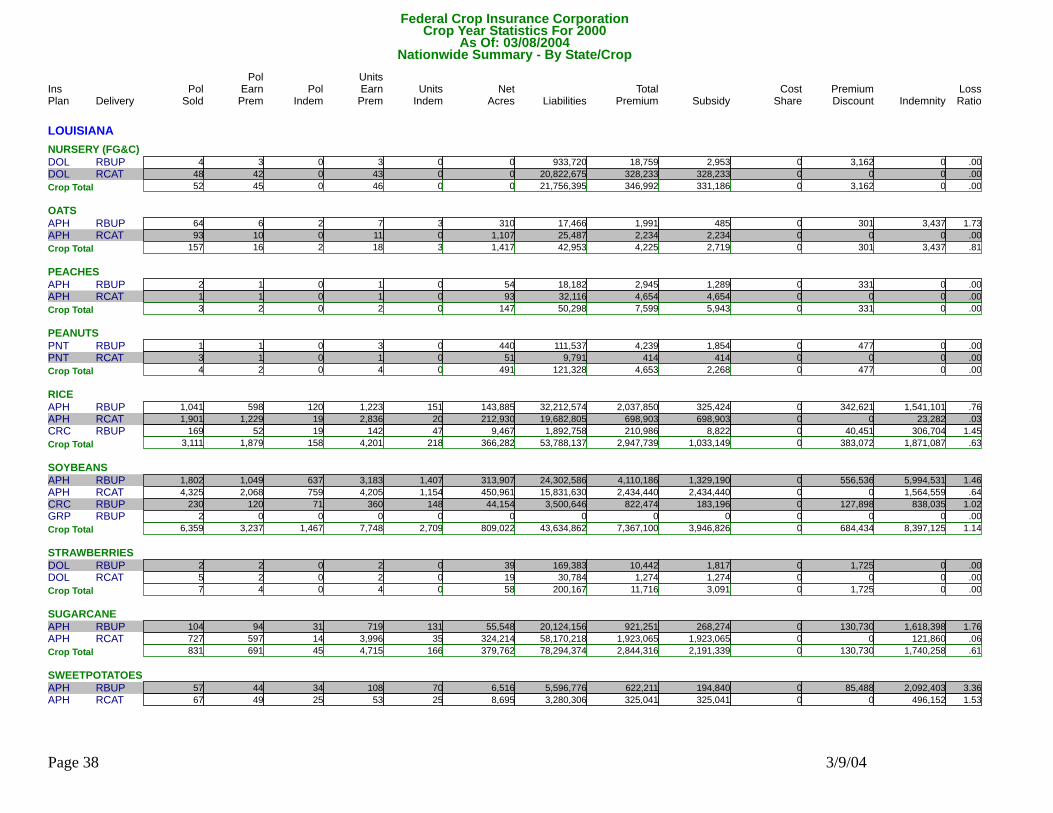
Federal Crop Insurance CorporationNationwide Summary - By State/Crop
Delivery Pol Units Units Net Liabilities Total Subsidy Premium IndemnityPol
Indem EarnPrem Indem Acres Premium Discount LossRatioSold EarnPremIns PolPlan ShareCost
Crop Year Statistics For 2000As Of: 03/08/2004
LOUISIANANURSERY (FG&C)
RBUPDOL 4 3 0 933,7203 0 0 18,759 2,953 3,162 0 .000RCATDOL 48 42 0 20,822,67543 0 0 328,233 328,233 0 0 .00052Crop Total 45 0 46 0 0 21,756,395 346,992 331,186 3,162 0 .000
OATSRBUPAPH 64 6 2 17,4667 3 310 1,991 485 301 3,437 1.730RCATAPH 93 10 0 25,48711 0 1,107 2,234 2,234 0 0 .000
157Crop Total 16 2 18 3 1,417 42,953 4,225 2,719 301 3,437 .810PEACHES
RBUPAPH 2 1 0 18,1821 0 54 2,945 1,289 331 0 .000RCATAPH 1 1 0 32,1161 0 93 4,654 4,654 0 0 .0003Crop Total 2 0 2 0 147 50,298 7,599 5,943 331 0 .000
PEANUTSRBUPPNT 1 1 0 111,5373 0 440 4,239 1,854 477 0 .000RCATPNT 3 1 0 9,7911 0 51 414 414 0 0 .000
4Crop Total 2 0 4 0 491 121,328 4,653 2,268 477 0 .000RICE
RBUPAPH 1,041 598 120 32,212,5741,223 151 143,885 2,037,850 325,424 342,621 1,541,101 .760RCATAPH 1,901 1,229 19 19,682,8052,836 20 212,930 698,903 698,903 0 23,282 .030RBUPCRC 169 52 19 1,892,758142 47 9,467 210,986 8,822 40,451 306,704 1.4503,111Crop Total 1,879 158 4,201 218 366,282 53,788,137 2,947,739 1,033,149 383,072 1,871,087 .630
SOYBEANSRBUPAPH 1,802 1,049 637 24,302,5863,183 1,407 313,907 4,110,186 1,329,190 556,536 5,994,531 1.460RCATAPH 4,325 2,068 759 15,831,6304,205 1,154 450,961 2,434,440 2,434,440 0 1,564,559 .640RBUPCRC 230 120 71 3,500,646360 148 44,154 822,474 183,196 127,898 838,035 1.020RBUPGRP 2 0 0 00 0 0 0 0 0 0 .000
6,359Crop Total 3,237 1,467 7,748 2,709 809,022 43,634,862 7,367,100 3,946,826 684,434 8,397,125 1.140STRAWBERRIES
RBUPDOL 2 2 0 169,3832 0 39 10,442 1,817 1,725 0 .000RCATDOL 5 2 0 30,7842 0 19 1,274 1,274 0 0 .0007Crop Total 4 0 4 0 58 200,167 11,716 3,091 1,725 0 .000
SUGARCANERBUPAPH 104 94 31 20,124,156719 131 55,548 921,251 268,274 130,730 1,618,398 1.760RCATAPH 727 597 14 58,170,2183,996 35 324,214 1,923,065 1,923,065 0 121,860 .060
831Crop Total 691 45 4,715 166 379,762 78,294,374 2,844,316 2,191,339 130,730 1,740,258 .610SWEETPOTATOES
RBUPAPH 57 44 34 5,596,776108 70 6,516 622,211 194,840 85,488 2,092,403 3.360RCATAPH 67 49 25 3,280,30653 25 8,695 325,041 325,041 0 496,152 1.530
Page 38 3/9/04
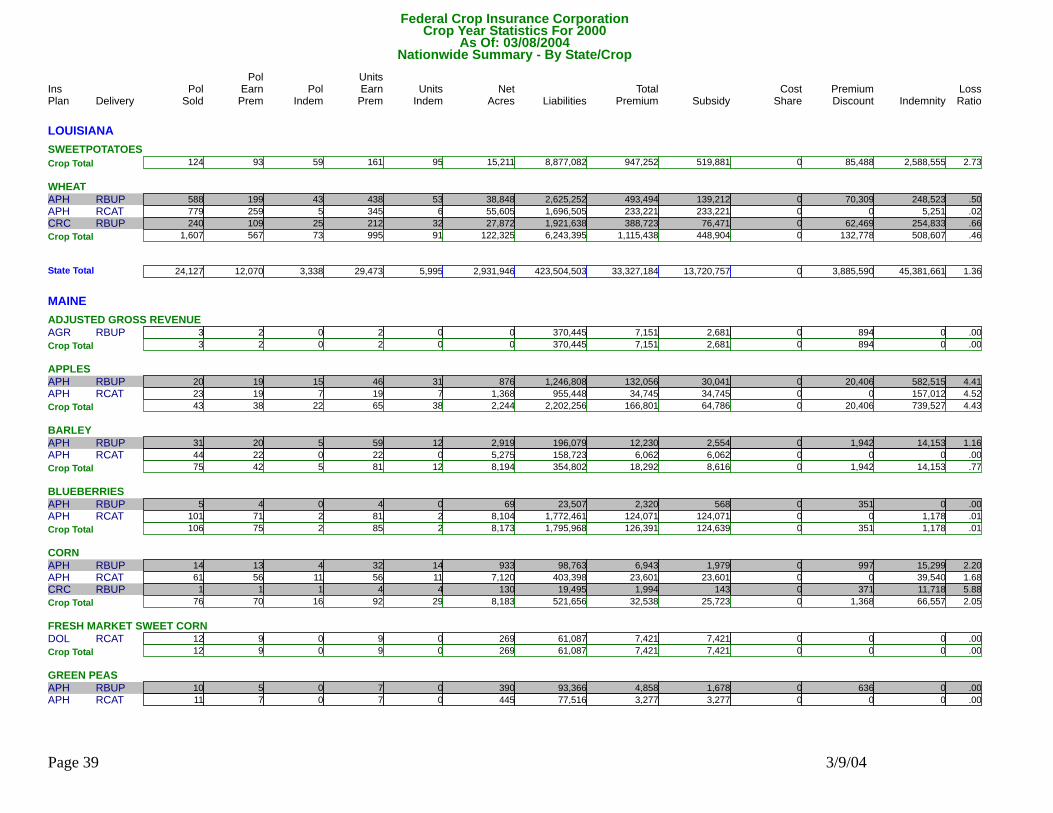
Federal Crop Insurance CorporationNationwide Summary - By State/Crop
Delivery Pol Units Units Net Liabilities Total Subsidy Premium IndemnityPol
Indem EarnPrem Indem Acres Premium Discount LossRatioSold EarnPremIns PolPlan ShareCost
Crop Year Statistics For 2000As Of: 03/08/2004
LOUISIANASWEETPOTATOES
124Crop Total 93 59 161 95 15,211 8,877,082 947,252 519,881 85,488 2,588,555 2.730WHEAT
RBUPAPH 588 199 43 2,625,252438 53 38,848 493,494 139,212 70,309 248,523 .500RCATAPH 779 259 5 1,696,505345 6 55,605 233,221 233,221 0 5,251 .020RBUPCRC 240 109 25 1,921,638212 32 27,872 388,723 76,471 62,469 254,833 .6601,607Crop Total 567 73 995 91 122,325 6,243,395 1,115,438 448,904 132,778 508,607 .460
24,127State Total 12,070 3,338 29,473 5,995 2,931,946 423,504,503 33,327,184 13,720,757 3,885,590 45,381,661 1.360
MAINEADJUSTED GROSS REVENUE
RBUPAGR 3 2 0 370,4452 0 0 7,151 2,681 894 0 .0003Crop Total 2 0 2 0 0 370,445 7,151 2,681 894 0 .000
APPLESRBUPAPH 20 19 15 1,246,80846 31 876 132,056 30,041 20,406 582,515 4.410RCATAPH 23 19 7 955,44819 7 1,368 34,745 34,745 0 157,012 4.520
43Crop Total 38 22 65 38 2,244 2,202,256 166,801 64,786 20,406 739,527 4.430BARLEY
RBUPAPH 31 20 5 196,07959 12 2,919 12,230 2,554 1,942 14,153 1.160RCATAPH 44 22 0 158,72322 0 5,275 6,062 6,062 0 0 .00075Crop Total 42 5 81 12 8,194 354,802 18,292 8,616 1,942 14,153 .770
BLUEBERRIESRBUPAPH 5 4 0 23,5074 0 69 2,320 568 351 0 .000RCATAPH 101 71 2 1,772,46181 2 8,104 124,071 124,071 0 1,178 .010
106Crop Total 75 2 85 2 8,173 1,795,968 126,391 124,639 351 1,178 .010CORN
RBUPAPH 14 13 4 98,76332 14 933 6,943 1,979 997 15,299 2.200RCATAPH 61 56 11 403,39856 11 7,120 23,601 23,601 0 39,540 1.680RBUPCRC 1 1 1 19,4954 4 130 1,994 143 371 11,718 5.88076Crop Total 70 16 92 29 8,183 521,656 32,538 25,723 1,368 66,557 2.050
FRESH MARKET SWEET CORNRCATDOL 12 9 0 61,0879 0 269 7,421 7,421 0 0 .000
12Crop Total 9 0 9 0 269 61,087 7,421 7,421 0 0 .000GREEN PEAS
RBUPAPH 10 5 0 93,3667 0 390 4,858 1,678 636 0 .000RCATAPH 11 7 0 77,5167 0 445 3,277 3,277 0 0 .000
Page 39 3/9/04
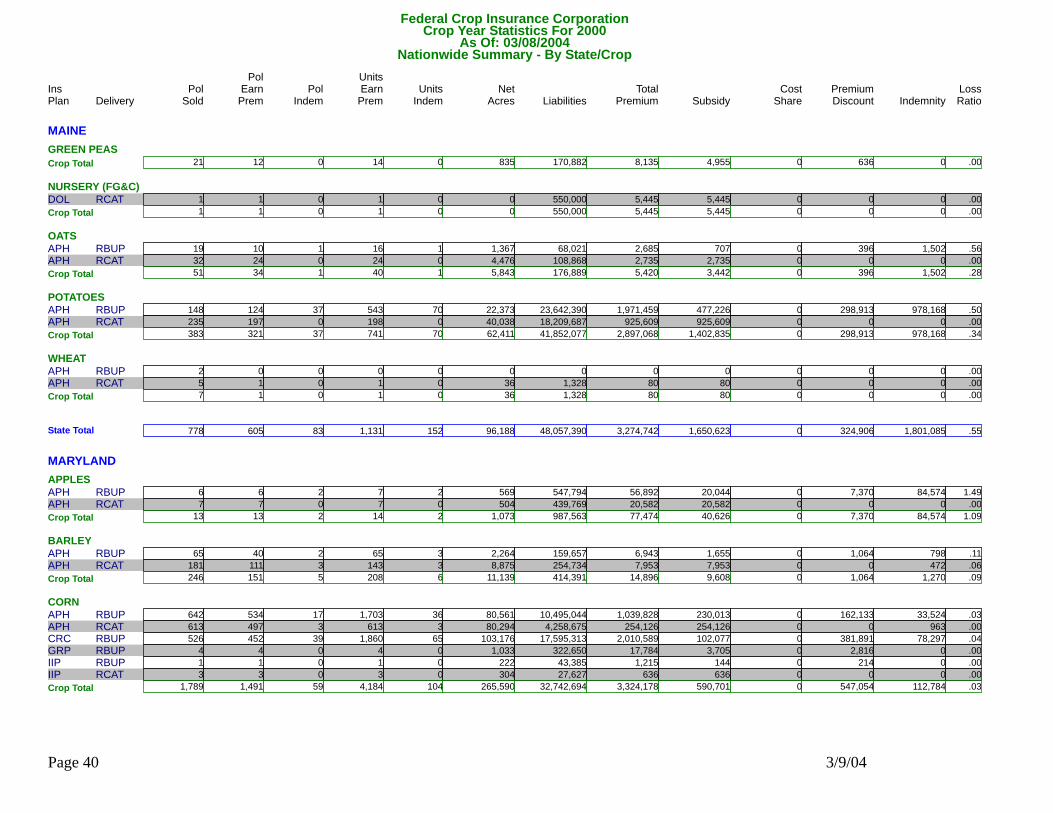
Federal Crop Insurance CorporationNationwide Summary - By State/Crop
Delivery Pol Units Units Net Liabilities Total Subsidy Premium IndemnityPol
Indem EarnPrem Indem Acres Premium Discount LossRatioSold EarnPremIns PolPlan ShareCost
Crop Year Statistics For 2000As Of: 03/08/2004
MAINEGREEN PEAS
21Crop Total 12 0 14 0 835 170,882 8,135 4,955 636 0 .000NURSERY (FG&C)
RCATDOL 1 1 0 550,0001 0 0 5,445 5,445 0 0 .0001Crop Total 1 0 1 0 0 550,000 5,445 5,445 0 0 .000
OATSRBUPAPH 19 10 1 68,02116 1 1,367 2,685 707 396 1,502 .560RCATAPH 32 24 0 108,86824 0 4,476 2,735 2,735 0 0 .000
51Crop Total 34 1 40 1 5,843 176,889 5,420 3,442 396 1,502 .280POTATOES
RBUPAPH 148 124 37 23,642,390543 70 22,373 1,971,459 477,226 298,913 978,168 .500RCATAPH 235 197 0 18,209,687198 0 40,038 925,609 925,609 0 0 .000383Crop Total 321 37 741 70 62,411 41,852,077 2,897,068 1,402,835 298,913 978,168 .340
WHEATRBUPAPH 2 0 0 00 0 0 0 0 0 0 .000RCATAPH 5 1 0 1,3281 0 36 80 80 0 0 .000
7Crop Total 1 0 1 0 36 1,328 80 80 0 0 .000
778State Total 605 83 1,131 152 96,188 48,057,390 3,274,742 1,650,623 324,906 1,801,085 .550
MARYLANDAPPLES
RBUPAPH 6 6 2 547,7947 2 569 56,892 20,044 7,370 84,574 1.490RCATAPH 7 7 0 439,7697 0 504 20,582 20,582 0 0 .00013Crop Total 13 2 14 2 1,073 987,563 77,474 40,626 7,370 84,574 1.090
BARLEYRBUPAPH 65 40 2 159,65765 3 2,264 6,943 1,655 1,064 798 .110RCATAPH 181 111 3 254,734143 3 8,875 7,953 7,953 0 472 .060
246Crop Total 151 5 208 6 11,139 414,391 14,896 9,608 1,064 1,270 .090CORN
RBUPAPH 642 534 17 10,495,0441,703 36 80,561 1,039,828 230,013 162,133 33,524 .030RCATAPH 613 497 3 4,258,675613 3 80,294 254,126 254,126 0 963 .000RBUPCRC 526 452 39 17,595,3131,860 65 103,176 2,010,589 102,077 381,891 78,297 .040RBUPGRP 4 4 0 322,6504 0 1,033 17,784 3,705 2,816 0 .000RBUPIIP 1 1 0 43,3851 0 222 1,215 144 214 0 .000RCATIIP 3 3 0 27,6273 0 304 636 636 0 0 .0001,789Crop Total 1,491 59 4,184 104 265,590 32,742,694 3,324,178 590,701 547,054 112,784 .030
Page 40 3/9/04
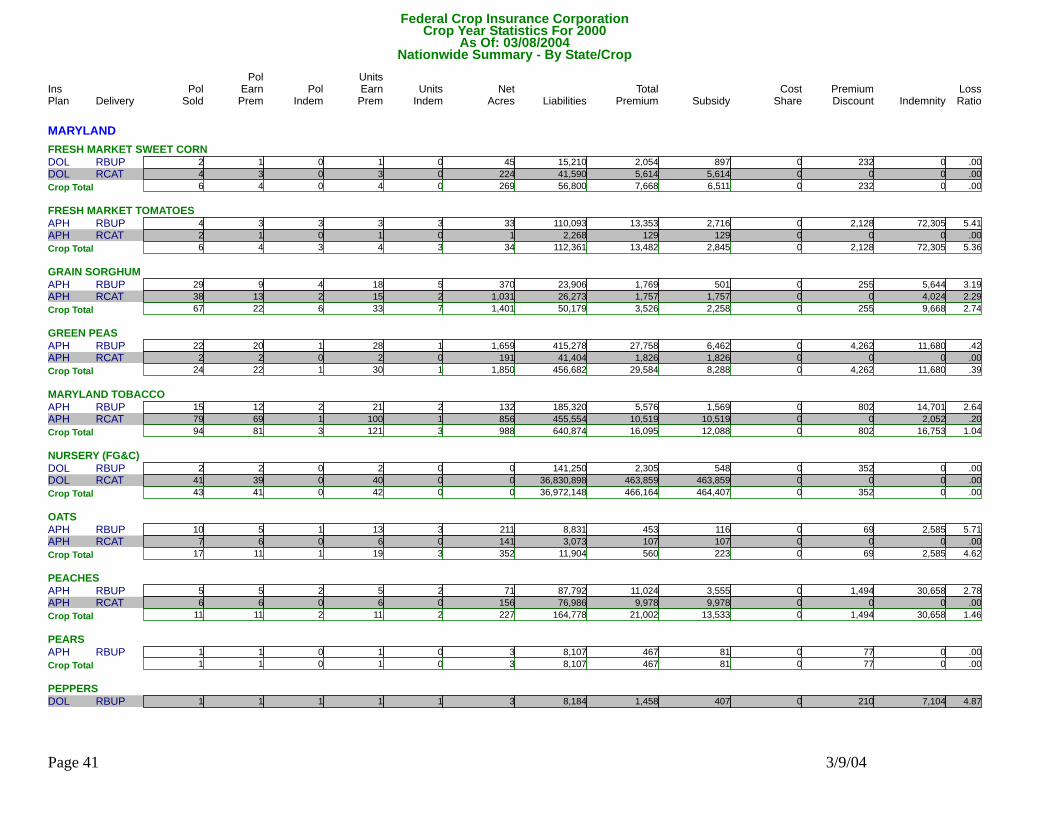
Federal Crop Insurance CorporationNationwide Summary - By State/Crop
Delivery Pol Units Units Net Liabilities Total Subsidy Premium IndemnityPol
Indem EarnPrem Indem Acres Premium Discount LossRatioSold EarnPremIns PolPlan ShareCost
Crop Year Statistics For 2000As Of: 03/08/2004
MARYLANDFRESH MARKET SWEET CORN
RBUPDOL 2 1 0 15,2101 0 45 2,054 897 232 0 .000RCATDOL 4 3 0 41,5903 0 224 5,614 5,614 0 0 .0006Crop Total 4 0 4 0 269 56,800 7,668 6,511 232 0 .000
FRESH MARKET TOMATOESRBUPAPH 4 3 3 110,0933 3 33 13,353 2,716 2,128 72,305 5.410RCATAPH 2 1 0 2,2681 0 1 129 129 0 0 .000
6Crop Total 4 3 4 3 34 112,361 13,482 2,845 2,128 72,305 5.360GRAIN SORGHUM
RBUPAPH 29 9 4 23,90618 5 370 1,769 501 255 5,644 3.190RCATAPH 38 13 2 26,27315 2 1,031 1,757 1,757 0 4,024 2.29067Crop Total 22 6 33 7 1,401 50,179 3,526 2,258 255 9,668 2.740
GREEN PEASRBUPAPH 22 20 1 415,27828 1 1,659 27,758 6,462 4,262 11,680 .420RCATAPH 2 2 0 41,4042 0 191 1,826 1,826 0 0 .000
24Crop Total 22 1 30 1 1,850 456,682 29,584 8,288 4,262 11,680 .390MARYLAND TOBACCO
RBUPAPH 15 12 2 185,32021 2 132 5,576 1,569 802 14,701 2.640RCATAPH 79 69 1 455,554100 1 856 10,519 10,519 0 2,052 .20094Crop Total 81 3 121 3 988 640,874 16,095 12,088 802 16,753 1.040
NURSERY (FG&C)RBUPDOL 2 2 0 141,2502 0 0 2,305 548 352 0 .000RCATDOL 41 39 0 36,830,89840 0 0 463,859 463,859 0 0 .000
43Crop Total 41 0 42 0 0 36,972,148 466,164 464,407 352 0 .000OATS
RBUPAPH 10 5 1 8,83113 3 211 453 116 69 2,585 5.710RCATAPH 7 6 0 3,0736 0 141 107 107 0 0 .00017Crop Total 11 1 19 3 352 11,904 560 223 69 2,585 4.620
PEACHESRBUPAPH 5 5 2 87,7925 2 71 11,024 3,555 1,494 30,658 2.780RCATAPH 6 6 0 76,9866 0 156 9,978 9,978 0 0 .000
11Crop Total 11 2 11 2 227 164,778 21,002 13,533 1,494 30,658 1.460PEARS
RBUPAPH 1 1 0 8,1071 0 3 467 81 77 0 .0001Crop Total 1 0 1 0 3 8,107 467 81 77 0 .000
PEPPERSRBUPDOL 1 1 1 8,1841 1 3 1,458 407 210 7,104 4.870
Page 41 3/9/04
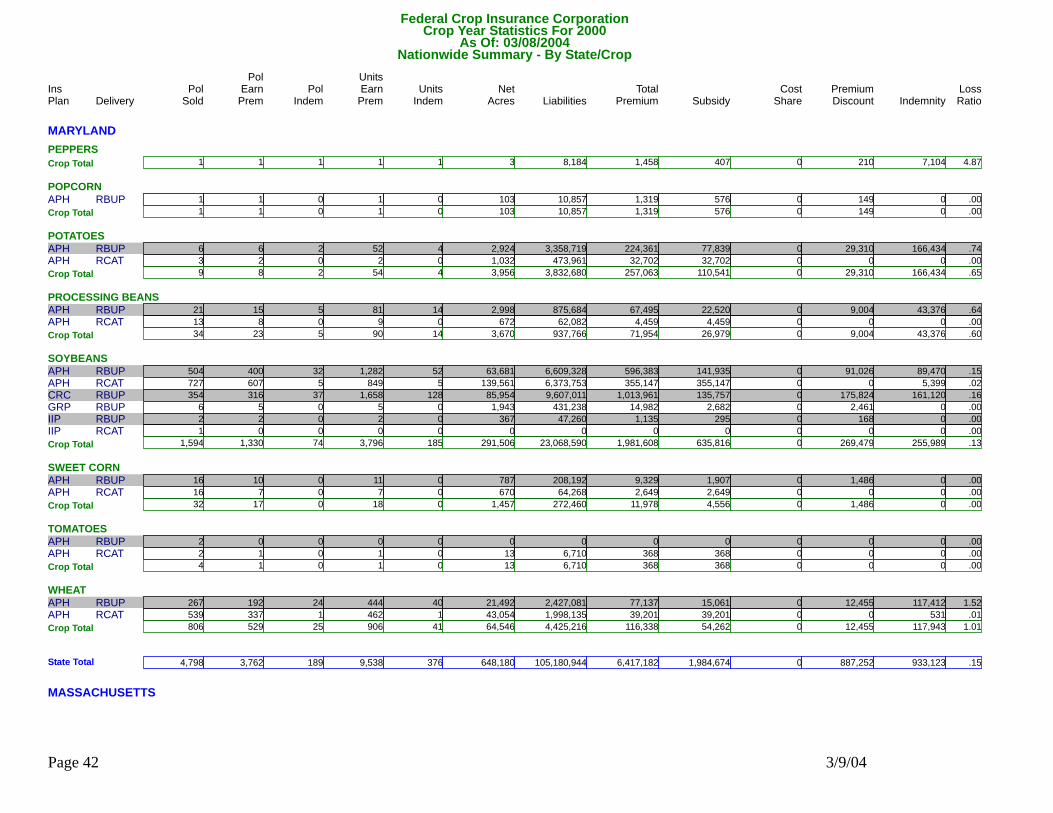
Federal Crop Insurance CorporationNationwide Summary - By State/Crop
Delivery Pol Units Units Net Liabilities Total Subsidy Premium IndemnityPol
Indem EarnPrem Indem Acres Premium Discount LossRatioSold EarnPremIns PolPlan ShareCost
Crop Year Statistics For 2000As Of: 03/08/2004
MARYLANDPEPPERS
1Crop Total 1 1 1 1 3 8,184 1,458 407 210 7,104 4.870POPCORN
RBUPAPH 1 1 0 10,8571 0 103 1,319 576 149 0 .0001Crop Total 1 0 1 0 103 10,857 1,319 576 149 0 .000
POTATOESRBUPAPH 6 6 2 3,358,71952 4 2,924 224,361 77,839 29,310 166,434 .740RCATAPH 3 2 0 473,9612 0 1,032 32,702 32,702 0 0 .000
9Crop Total 8 2 54 4 3,956 3,832,680 257,063 110,541 29,310 166,434 .650PROCESSING BEANS
RBUPAPH 21 15 5 875,68481 14 2,998 67,495 22,520 9,004 43,376 .640RCATAPH 13 8 0 62,0829 0 672 4,459 4,459 0 0 .00034Crop Total 23 5 90 14 3,670 937,766 71,954 26,979 9,004 43,376 .600
SOYBEANSRBUPAPH 504 400 32 6,609,3281,282 52 63,681 596,383 141,935 91,026 89,470 .150RCATAPH 727 607 5 6,373,753849 5 139,561 355,147 355,147 0 5,399 .020RBUPCRC 354 316 37 9,607,0111,658 128 85,954 1,013,961 135,757 175,824 161,120 .160RBUPGRP 6 5 0 431,2385 0 1,943 14,982 2,682 2,461 0 .000RBUPIIP 2 2 0 47,2602 0 367 1,135 295 168 0 .000RCATIIP 1 0 0 00 0 0 0 0 0 0 .000
1,594Crop Total 1,330 74 3,796 185 291,506 23,068,590 1,981,608 635,816 269,479 255,989 .130SWEET CORN
RBUPAPH 16 10 0 208,19211 0 787 9,329 1,907 1,486 0 .000RCATAPH 16 7 0 64,2687 0 670 2,649 2,649 0 0 .00032Crop Total 17 0 18 0 1,457 272,460 11,978 4,556 1,486 0 .000
TOMATOESRBUPAPH 2 0 0 00 0 0 0 0 0 0 .000RCATAPH 2 1 0 6,7101 0 13 368 368 0 0 .000
4Crop Total 1 0 1 0 13 6,710 368 368 0 0 .000WHEAT
RBUPAPH 267 192 24 2,427,081444 40 21,492 77,137 15,061 12,455 117,412 1.520RCATAPH 539 337 1 1,998,135462 1 43,054 39,201 39,201 0 531 .010806Crop Total 529 25 906 41 64,546 4,425,216 116,338 54,262 12,455 117,943 1.010
4,798State Total 3,762 189 9,538 376 648,180 105,180,944 6,417,182 1,984,674 887,252 933,123 .150
MASSACHUSETTS
Page 42 3/9/04
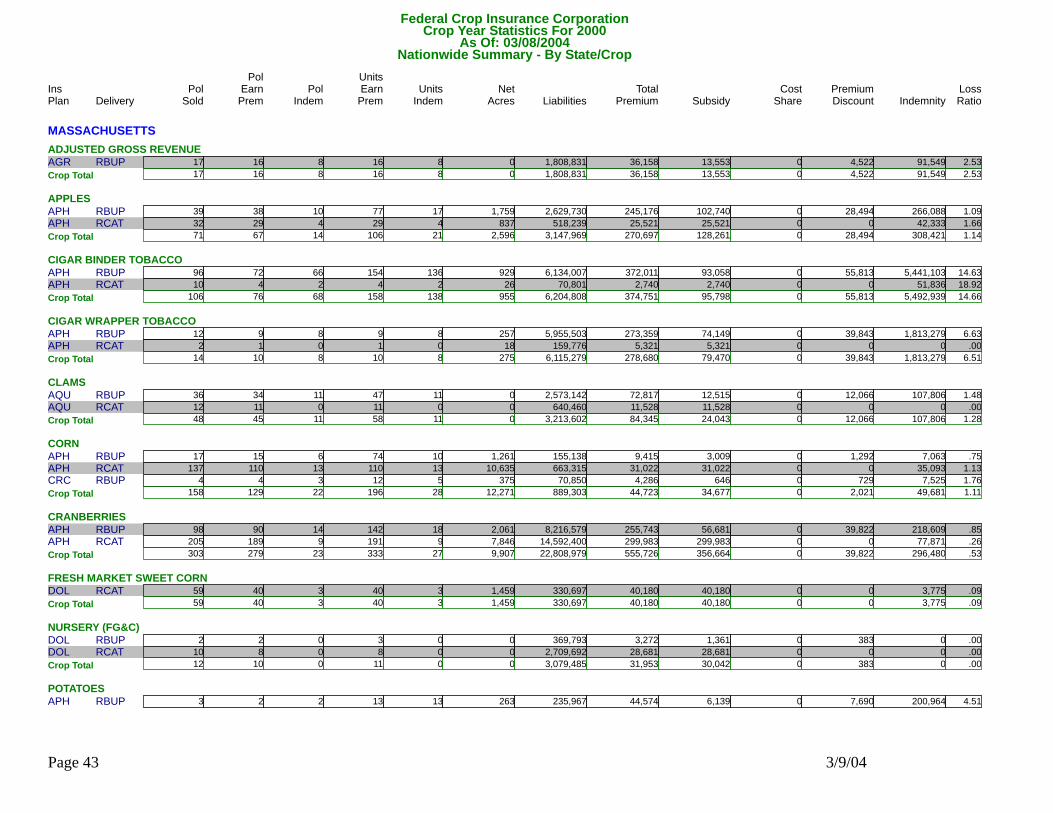
Federal Crop Insurance CorporationNationwide Summary - By State/Crop
Delivery Pol Units Units Net Liabilities Total Subsidy Premium IndemnityPol
Indem EarnPrem Indem Acres Premium Discount LossRatioSold EarnPremIns PolPlan ShareCost
Crop Year Statistics For 2000As Of: 03/08/2004
MASSACHUSETTSADJUSTED GROSS REVENUE
RBUPAGR 17 16 8 1,808,83116 8 0 36,158 13,553 4,522 91,549 2.53017Crop Total 16 8 16 8 0 1,808,831 36,158 13,553 4,522 91,549 2.530
APPLESRBUPAPH 39 38 10 2,629,73077 17 1,759 245,176 102,740 28,494 266,088 1.090RCATAPH 32 29 4 518,23929 4 837 25,521 25,521 0 42,333 1.660
71Crop Total 67 14 106 21 2,596 3,147,969 270,697 128,261 28,494 308,421 1.140CIGAR BINDER TOBACCO
RBUPAPH 96 72 66 6,134,007154 136 929 372,011 93,058 55,813 5,441,103 14.630RCATAPH 10 4 2 70,8014 2 26 2,740 2,740 0 51,836 18.920106Crop Total 76 68 158 138 955 6,204,808 374,751 95,798 55,813 5,492,939 14.660
CIGAR WRAPPER TOBACCORBUPAPH 12 9 8 5,955,5039 8 257 273,359 74,149 39,843 1,813,279 6.630RCATAPH 2 1 0 159,7761 0 18 5,321 5,321 0 0 .000
14Crop Total 10 8 10 8 275 6,115,279 278,680 79,470 39,843 1,813,279 6.510CLAMS
RBUPAQU 36 34 11 2,573,14247 11 0 72,817 12,515 12,066 107,806 1.480RCATAQU 12 11 0 640,46011 0 0 11,528 11,528 0 0 .00048Crop Total 45 11 58 11 0 3,213,602 84,345 24,043 12,066 107,806 1.280
CORNRBUPAPH 17 15 6 155,13874 10 1,261 9,415 3,009 1,292 7,063 .750RCATAPH 137 110 13 663,315110 13 10,635 31,022 31,022 0 35,093 1.130RBUPCRC 4 4 3 70,85012 5 375 4,286 646 729 7,525 1.760
158Crop Total 129 22 196 28 12,271 889,303 44,723 34,677 2,021 49,681 1.110CRANBERRIES
RBUPAPH 98 90 14 8,216,579142 18 2,061 255,743 56,681 39,822 218,609 .850RCATAPH 205 189 9 14,592,400191 9 7,846 299,983 299,983 0 77,871 .260303Crop Total 279 23 333 27 9,907 22,808,979 555,726 356,664 39,822 296,480 .530
FRESH MARKET SWEET CORNRCATDOL 59 40 3 330,69740 3 1,459 40,180 40,180 0 3,775 .090
59Crop Total 40 3 40 3 1,459 330,697 40,180 40,180 0 3,775 .090NURSERY (FG&C)
RBUPDOL 2 2 0 369,7933 0 0 3,272 1,361 383 0 .000RCATDOL 10 8 0 2,709,6928 0 0 28,681 28,681 0 0 .00012Crop Total 10 0 11 0 0 3,079,485 31,953 30,042 383 0 .000
POTATOESRBUPAPH 3 2 2 235,96713 13 263 44,574 6,139 7,690 200,964 4.510
Page 43 3/9/04
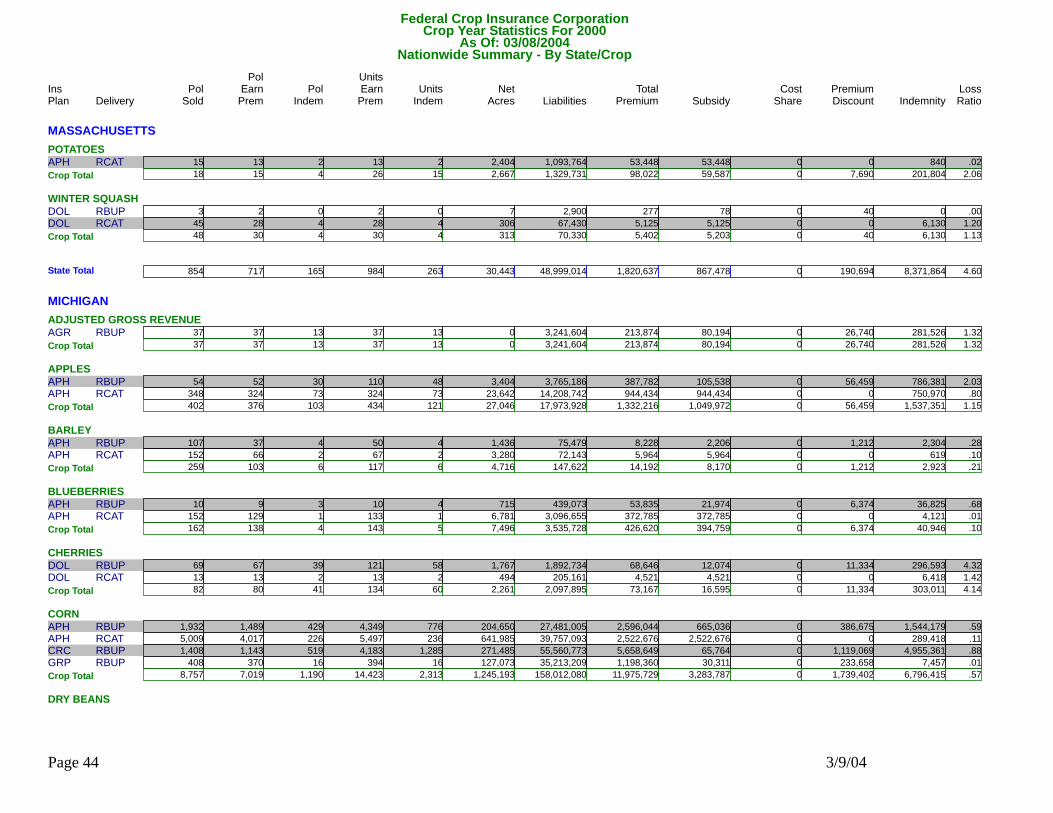
Federal Crop Insurance CorporationNationwide Summary - By State/Crop
Delivery Pol Units Units Net Liabilities Total Subsidy Premium IndemnityPol
Indem EarnPrem Indem Acres Premium Discount LossRatioSold EarnPremIns PolPlan ShareCost
Crop Year Statistics For 2000As Of: 03/08/2004
MASSACHUSETTSPOTATOES
RCATAPH 15 13 2 1,093,76413 2 2,404 53,448 53,448 0 840 .02018Crop Total 15 4 26 15 2,667 1,329,731 98,022 59,587 7,690 201,804 2.060
WINTER SQUASHRBUPDOL 3 2 0 2,9002 0 7 277 78 40 0 .000RCATDOL 45 28 4 67,43028 4 306 5,125 5,125 0 6,130 1.200
48Crop Total 30 4 30 4 313 70,330 5,402 5,203 40 6,130 1.130
854State Total 717 165 984 263 30,443 48,999,014 1,820,637 867,478 190,694 8,371,864 4.600
MICHIGANADJUSTED GROSS REVENUE
RBUPAGR 37 37 13 3,241,60437 13 0 213,874 80,194 26,740 281,526 1.32037Crop Total 37 13 37 13 0 3,241,604 213,874 80,194 26,740 281,526 1.320
APPLESRBUPAPH 54 52 30 3,765,186110 48 3,404 387,782 105,538 56,459 786,381 2.030RCATAPH 348 324 73 14,208,742324 73 23,642 944,434 944,434 0 750,970 .800
402Crop Total 376 103 434 121 27,046 17,973,928 1,332,216 1,049,972 56,459 1,537,351 1.150BARLEY
RBUPAPH 107 37 4 75,47950 4 1,436 8,228 2,206 1,212 2,304 .280RCATAPH 152 66 2 72,14367 2 3,280 5,964 5,964 0 619 .100259Crop Total 103 6 117 6 4,716 147,622 14,192 8,170 1,212 2,923 .210
BLUEBERRIESRBUPAPH 10 9 3 439,07310 4 715 53,835 21,974 6,374 36,825 .680RCATAPH 152 129 1 3,096,655133 1 6,781 372,785 372,785 0 4,121 .010
162Crop Total 138 4 143 5 7,496 3,535,728 426,620 394,759 6,374 40,946 .100CHERRIES
RBUPDOL 69 67 39 1,892,734121 58 1,767 68,646 12,074 11,334 296,593 4.320RCATDOL 13 13 2 205,16113 2 494 4,521 4,521 0 6,418 1.42082Crop Total 80 41 134 60 2,261 2,097,895 73,167 16,595 11,334 303,011 4.140
CORNRBUPAPH 1,932 1,489 429 27,481,0054,349 776 204,650 2,596,044 665,036 386,675 1,544,179 .590RCATAPH 5,009 4,017 226 39,757,0935,497 236 641,985 2,522,676 2,522,676 0 289,418 .110RBUPCRC 1,408 1,143 519 55,560,7734,183 1,285 271,485 5,658,649 65,764 1,119,069 4,955,361 .880RBUPGRP 408 370 16 35,213,209394 16 127,073 1,198,360 30,311 233,658 7,457 .010
8,757Crop Total 7,019 1,190 14,423 2,313 1,245,193 158,012,080 11,975,729 3,283,787 1,739,402 6,796,415 .570DRY BEANS
Page 44 3/9/04
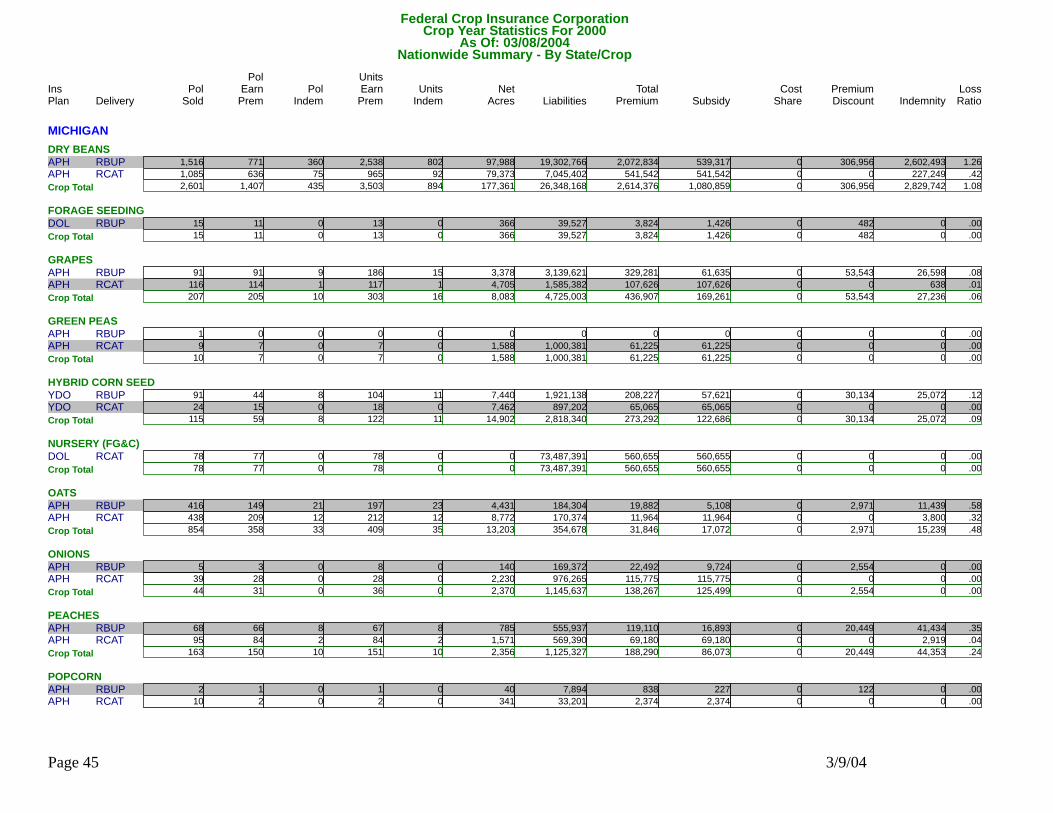
Federal Crop Insurance CorporationNationwide Summary - By State/Crop
Delivery Pol Units Units Net Liabilities Total Subsidy Premium IndemnityPol
Indem EarnPrem Indem Acres Premium Discount LossRatioSold EarnPremIns PolPlan ShareCost
Crop Year Statistics For 2000As Of: 03/08/2004
MICHIGANDRY BEANS
RBUPAPH 1,516 771 360 19,302,7662,538 802 97,988 2,072,834 539,317 306,956 2,602,493 1.260RCATAPH 1,085 636 75 7,045,402965 92 79,373 541,542 541,542 0 227,249 .4202,601Crop Total 1,407 435 3,503 894 177,361 26,348,168 2,614,376 1,080,859 306,956 2,829,742 1.080
FORAGE SEEDINGRBUPDOL 15 11 0 39,52713 0 366 3,824 1,426 482 0 .000
15Crop Total 11 0 13 0 366 39,527 3,824 1,426 482 0 .000GRAPES
RBUPAPH 91 91 9 3,139,621186 15 3,378 329,281 61,635 53,543 26,598 .080RCATAPH 116 114 1 1,585,382117 1 4,705 107,626 107,626 0 638 .010207Crop Total 205 10 303 16 8,083 4,725,003 436,907 169,261 53,543 27,236 .060
GREEN PEASRBUPAPH 1 0 0 00 0 0 0 0 0 0 .000RCATAPH 9 7 0 1,000,3817 0 1,588 61,225 61,225 0 0 .000
10Crop Total 7 0 7 0 1,588 1,000,381 61,225 61,225 0 0 .000HYBRID CORN SEED
RBUPYDO 91 44 8 1,921,138104 11 7,440 208,227 57,621 30,134 25,072 .120RCATYDO 24 15 0 897,20218 0 7,462 65,065 65,065 0 0 .000115Crop Total 59 8 122 11 14,902 2,818,340 273,292 122,686 30,134 25,072 .090
NURSERY (FG&C)RCATDOL 78 77 0 73,487,39178 0 0 560,655 560,655 0 0 .000
78Crop Total 77 0 78 0 0 73,487,391 560,655 560,655 0 0 .000OATS
RBUPAPH 416 149 21 184,304197 23 4,431 19,882 5,108 2,971 11,439 .580RCATAPH 438 209 12 170,374212 12 8,772 11,964 11,964 0 3,800 .320854Crop Total 358 33 409 35 13,203 354,678 31,846 17,072 2,971 15,239 .480
ONIONSRBUPAPH 5 3 0 169,3728 0 140 22,492 9,724 2,554 0 .000RCATAPH 39 28 0 976,26528 0 2,230 115,775 115,775 0 0 .000
44Crop Total 31 0 36 0 2,370 1,145,637 138,267 125,499 2,554 0 .000PEACHES
RBUPAPH 68 66 8 555,93767 8 785 119,110 16,893 20,449 41,434 .350RCATAPH 95 84 2 569,39084 2 1,571 69,180 69,180 0 2,919 .040163Crop Total 150 10 151 10 2,356 1,125,327 188,290 86,073 20,449 44,353 .240
POPCORNRBUPAPH 2 1 0 7,8941 0 40 838 227 122 0 .000RCATAPH 10 2 0 33,2012 0 341 2,374 2,374 0 0 .000
Page 45 3/9/04
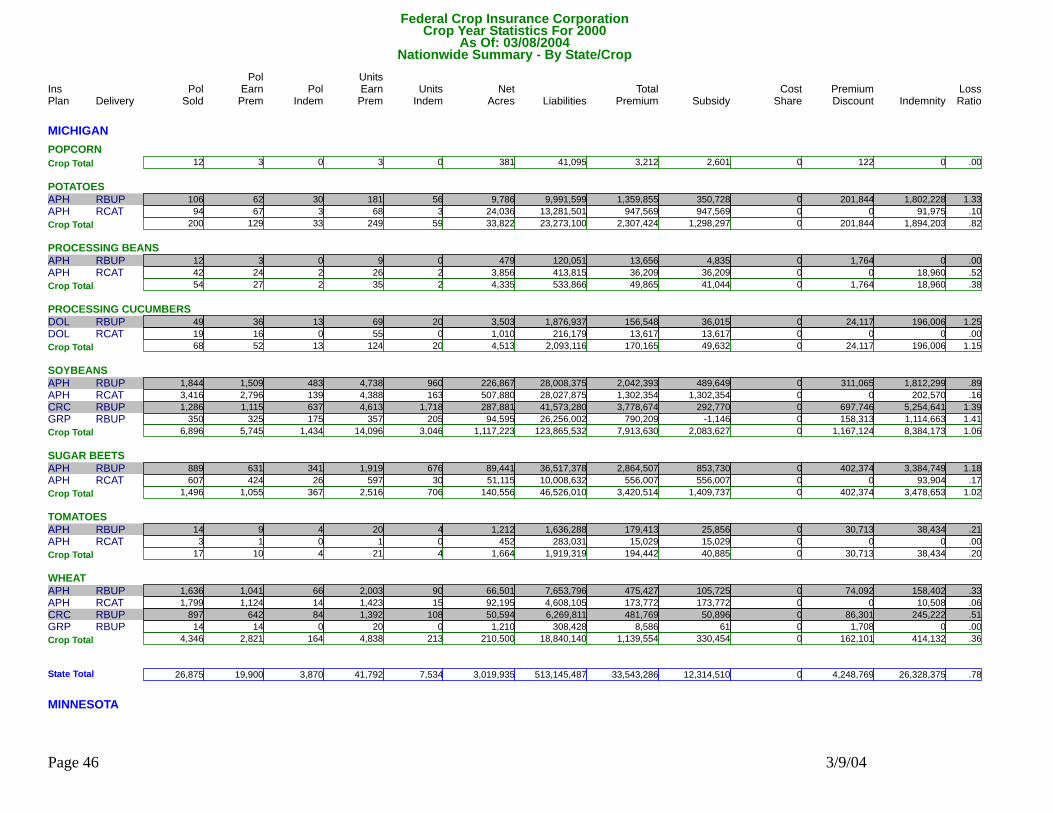
Federal Crop Insurance CorporationNationwide Summary - By State/Crop
Delivery Pol Units Units Net Liabilities Total Subsidy Premium IndemnityPol
Indem EarnPrem Indem Acres Premium Discount LossRatioSold EarnPremIns PolPlan ShareCost
Crop Year Statistics For 2000As Of: 03/08/2004
MICHIGANPOPCORN
12Crop Total 3 0 3 0 381 41,095 3,212 2,601 122 0 .000POTATOES
RBUPAPH 106 62 30 9,991,599181 56 9,786 1,359,855 350,728 201,844 1,802,228 1.330RCATAPH 94 67 3 13,281,50168 3 24,036 947,569 947,569 0 91,975 .100200Crop Total 129 33 249 59 33,822 23,273,100 2,307,424 1,298,297 201,844 1,894,203 .820
PROCESSING BEANSRBUPAPH 12 3 0 120,0519 0 479 13,656 4,835 1,764 0 .000RCATAPH 42 24 2 413,81526 2 3,856 36,209 36,209 0 18,960 .520
54Crop Total 27 2 35 2 4,335 533,866 49,865 41,044 1,764 18,960 .380PROCESSING CUCUMBERS
RBUPDOL 49 36 13 1,876,93769 20 3,503 156,548 36,015 24,117 196,006 1.250RCATDOL 19 16 0 216,17955 0 1,010 13,617 13,617 0 0 .00068Crop Total 52 13 124 20 4,513 2,093,116 170,165 49,632 24,117 196,006 1.150
SOYBEANSRBUPAPH 1,844 1,509 483 28,008,3754,738 960 226,867 2,042,393 489,649 311,065 1,812,299 .890RCATAPH 3,416 2,796 139 28,027,8754,388 163 507,880 1,302,354 1,302,354 0 202,570 .160RBUPCRC 1,286 1,115 637 41,573,2804,613 1,718 287,881 3,778,674 292,770 697,746 5,254,641 1.390RBUPGRP 350 325 175 26,256,002357 205 94,595 790,209 -1,146 158,313 1,114,663 1.410
6,896Crop Total 5,745 1,434 14,096 3,046 1,117,223 123,865,532 7,913,630 2,083,627 1,167,124 8,384,173 1.060SUGAR BEETS
RBUPAPH 889 631 341 36,517,3781,919 676 89,441 2,864,507 853,730 402,374 3,384,749 1.180RCATAPH 607 424 26 10,008,632597 30 51,115 556,007 556,007 0 93,904 .1701,496Crop Total 1,055 367 2,516 706 140,556 46,526,010 3,420,514 1,409,737 402,374 3,478,653 1.020
TOMATOESRBUPAPH 14 9 4 1,636,28820 4 1,212 179,413 25,856 30,713 38,434 .210RCATAPH 3 1 0 283,0311 0 452 15,029 15,029 0 0 .000
17Crop Total 10 4 21 4 1,664 1,919,319 194,442 40,885 30,713 38,434 .200WHEAT
RBUPAPH 1,636 1,041 66 7,653,7962,003 90 66,501 475,427 105,725 74,092 158,402 .330RCATAPH 1,799 1,124 14 4,608,1051,423 15 92,195 173,772 173,772 0 10,508 .060RBUPCRC 897 642 84 6,269,8111,392 108 50,594 481,769 50,896 86,301 245,222 .510RBUPGRP 14 14 0 308,42820 0 1,210 8,586 61 1,708 0 .0004,346Crop Total 2,821 164 4,838 213 210,500 18,840,140 1,139,554 330,454 162,101 414,132 .360
26,875State Total 19,900 3,870 41,792 7,534 3,019,935 513,145,487 33,543,286 12,314,510 4,248,769 26,328,375 .780
MINNESOTA
Page 46 3/9/04
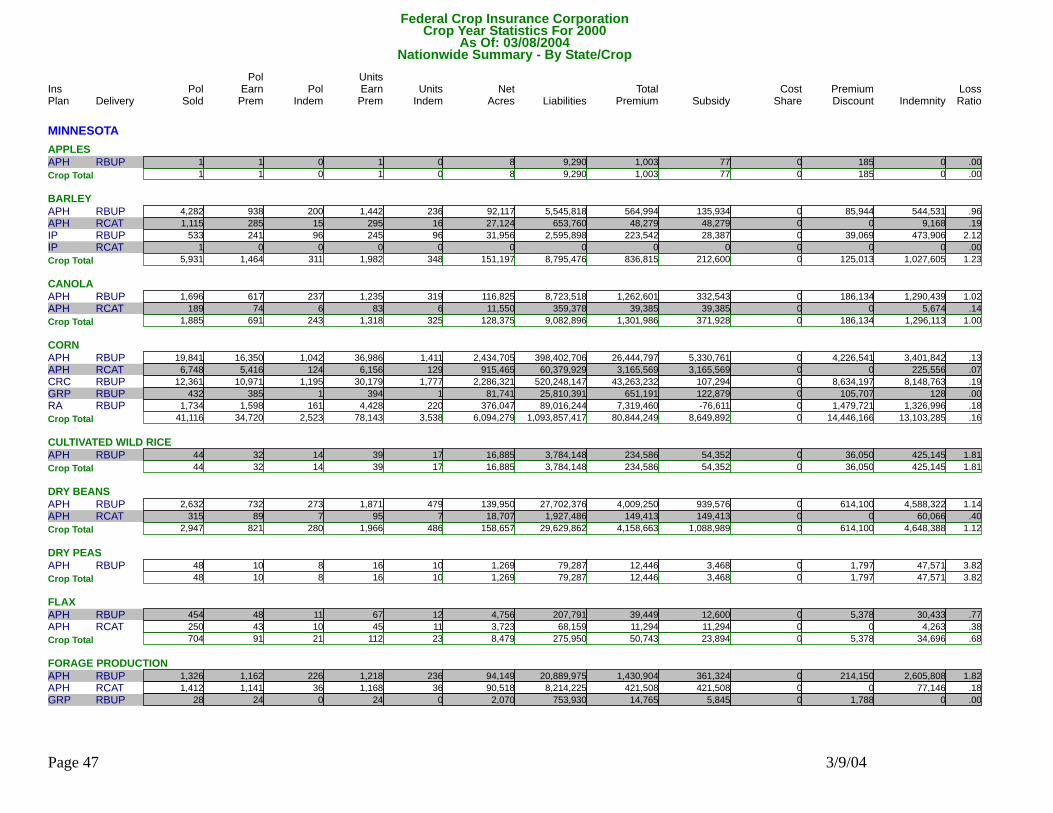
Federal Crop Insurance CorporationNationwide Summary - By State/Crop
Delivery Pol Units Units Net Liabilities Total Subsidy Premium IndemnityPol
Indem EarnPrem Indem Acres Premium Discount LossRatioSold EarnPremIns PolPlan ShareCost
Crop Year Statistics For 2000As Of: 03/08/2004
MINNESOTAAPPLES
RBUPAPH 1 1 0 9,2901 0 8 1,003 77 185 0 .0001Crop Total 1 0 1 0 8 9,290 1,003 77 185 0 .000
BARLEYRBUPAPH 4,282 938 200 5,545,8181,442 236 92,117 564,994 135,934 85,944 544,531 .960RCATAPH 1,115 285 15 653,760295 16 27,124 48,279 48,279 0 9,168 .190RBUPIP 533 241 96 2,595,898245 96 31,956 223,542 28,387 39,069 473,906 2.120RCATIP 1 0 0 00 0 0 0 0 0 0 .000
5,931Crop Total 1,464 311 1,982 348 151,197 8,795,476 836,815 212,600 125,013 1,027,605 1.230CANOLA
RBUPAPH 1,696 617 237 8,723,5181,235 319 116,825 1,262,601 332,543 186,134 1,290,439 1.020RCATAPH 189 74 6 359,37883 6 11,550 39,385 39,385 0 5,674 .1401,885Crop Total 691 243 1,318 325 128,375 9,082,896 1,301,986 371,928 186,134 1,296,113 1.000
CORNRBUPAPH 19,841 16,350 1,042 398,402,70636,986 1,411 2,434,705 26,444,797 5,330,761 4,226,541 3,401,842 .130RCATAPH 6,748 5,416 124 60,379,9296,156 129 915,465 3,165,569 3,165,569 0 225,556 .070RBUPCRC 12,361 10,971 1,195 520,248,14730,179 1,777 2,286,321 43,263,232 107,294 8,634,197 8,148,763 .190RBUPGRP 432 385 1 25,810,391394 1 81,741 651,191 122,879 105,707 128 .000RBUPRA 1,734 1,598 161 89,016,2444,428 220 376,047 7,319,460 -76,611 1,479,721 1,326,996 .180
41,116Crop Total 34,720 2,523 78,143 3,538 6,094,279 1,093,857,417 80,844,249 8,649,892 14,446,166 13,103,285 .160CULTIVATED WILD RICE
RBUPAPH 44 32 14 3,784,14839 17 16,885 234,586 54,352 36,050 425,145 1.81044Crop Total 32 14 39 17 16,885 3,784,148 234,586 54,352 36,050 425,145 1.810
DRY BEANSRBUPAPH 2,632 732 273 27,702,3761,871 479 139,950 4,009,250 939,576 614,100 4,588,322 1.140RCATAPH 315 89 7 1,927,48695 7 18,707 149,413 149,413 0 60,066 .400
2,947Crop Total 821 280 1,966 486 158,657 29,629,862 4,158,663 1,088,989 614,100 4,648,388 1.120DRY PEAS
RBUPAPH 48 10 8 79,28716 10 1,269 12,446 3,468 1,797 47,571 3.82048Crop Total 10 8 16 10 1,269 79,287 12,446 3,468 1,797 47,571 3.820
FLAXRBUPAPH 454 48 11 207,79167 12 4,756 39,449 12,600 5,378 30,433 .770RCATAPH 250 43 10 68,15945 11 3,723 11,294 11,294 0 4,263 .380
704Crop Total 91 21 112 23 8,479 275,950 50,743 23,894 5,378 34,696 .680FORAGE PRODUCTION
RBUPAPH 1,326 1,162 226 20,889,9751,218 236 94,149 1,430,904 361,324 214,150 2,605,808 1.820RCATAPH 1,412 1,141 36 8,214,2251,168 36 90,518 421,508 421,508 0 77,146 .180RBUPGRP 28 24 0 753,93024 0 2,070 14,765 5,845 1,788 0 .000
Page 47 3/9/04
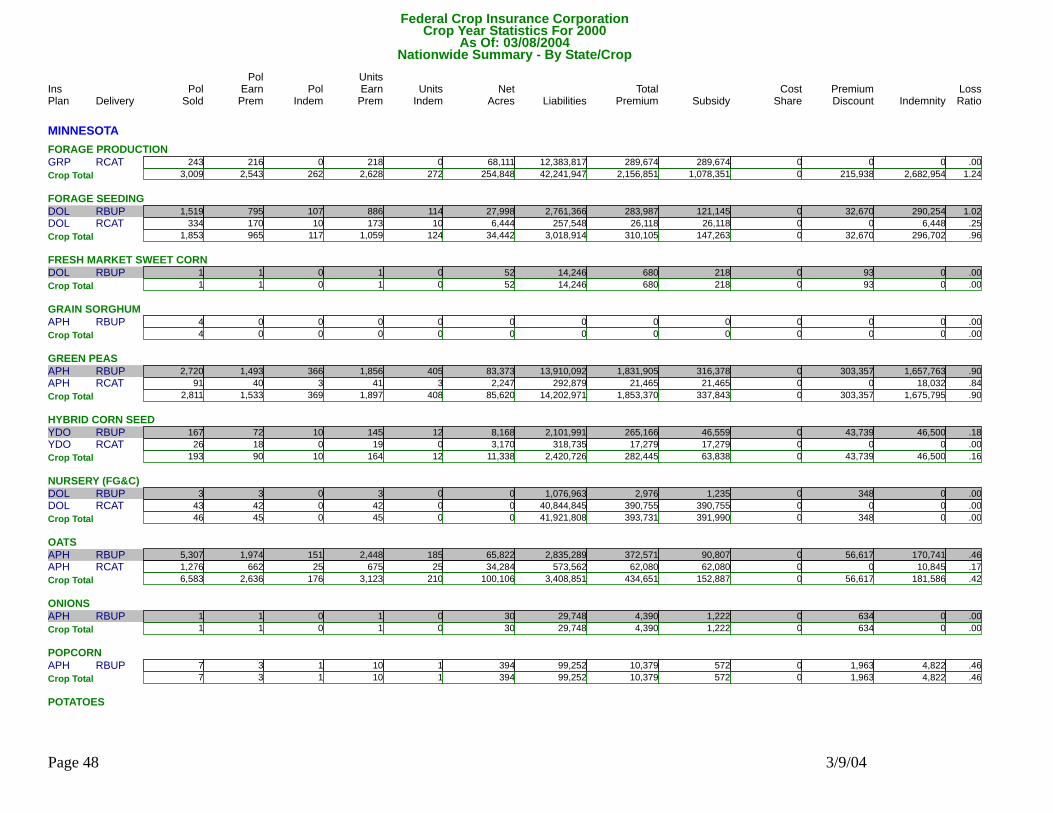
Federal Crop Insurance CorporationNationwide Summary - By State/Crop
Delivery Pol Units Units Net Liabilities Total Subsidy Premium IndemnityPol
Indem EarnPrem Indem Acres Premium Discount LossRatioSold EarnPremIns PolPlan ShareCost
Crop Year Statistics For 2000As Of: 03/08/2004
MINNESOTAFORAGE PRODUCTION
RCATGRP 243 216 0 12,383,817218 0 68,111 289,674 289,674 0 0 .0003,009Crop Total 2,543 262 2,628 272 254,848 42,241,947 2,156,851 1,078,351 215,938 2,682,954 1.240
FORAGE SEEDINGRBUPDOL 1,519 795 107 2,761,366886 114 27,998 283,987 121,145 32,670 290,254 1.020RCATDOL 334 170 10 257,548173 10 6,444 26,118 26,118 0 6,448 .250
1,853Crop Total 965 117 1,059 124 34,442 3,018,914 310,105 147,263 32,670 296,702 .960FRESH MARKET SWEET CORN
RBUPDOL 1 1 0 14,2461 0 52 680 218 93 0 .0001Crop Total 1 0 1 0 52 14,246 680 218 93 0 .000
GRAIN SORGHUMRBUPAPH 4 0 0 00 0 0 0 0 0 0 .000
4Crop Total 0 0 0 0 0 0 0 0 0 0 .000GREEN PEAS
RBUPAPH 2,720 1,493 366 13,910,0921,856 405 83,373 1,831,905 316,378 303,357 1,657,763 .900RCATAPH 91 40 3 292,87941 3 2,247 21,465 21,465 0 18,032 .8402,811Crop Total 1,533 369 1,897 408 85,620 14,202,971 1,853,370 337,843 303,357 1,675,795 .900
HYBRID CORN SEEDRBUPYDO 167 72 10 2,101,991145 12 8,168 265,166 46,559 43,739 46,500 .180RCATYDO 26 18 0 318,73519 0 3,170 17,279 17,279 0 0 .000
193Crop Total 90 10 164 12 11,338 2,420,726 282,445 63,838 43,739 46,500 .160NURSERY (FG&C)
RBUPDOL 3 3 0 1,076,9633 0 0 2,976 1,235 348 0 .000RCATDOL 43 42 0 40,844,84542 0 0 390,755 390,755 0 0 .00046Crop Total 45 0 45 0 0 41,921,808 393,731 391,990 348 0 .000
OATSRBUPAPH 5,307 1,974 151 2,835,2892,448 185 65,822 372,571 90,807 56,617 170,741 .460RCATAPH 1,276 662 25 573,562675 25 34,284 62,080 62,080 0 10,845 .170
6,583Crop Total 2,636 176 3,123 210 100,106 3,408,851 434,651 152,887 56,617 181,586 .420ONIONS
RBUPAPH 1 1 0 29,7481 0 30 4,390 1,222 634 0 .0001Crop Total 1 0 1 0 30 29,748 4,390 1,222 634 0 .000
POPCORNRBUPAPH 7 3 1 99,25210 1 394 10,379 572 1,963 4,822 .460
7Crop Total 3 1 10 1 394 99,252 10,379 572 1,963 4,822 .460POTATOES
Page 48 3/9/04
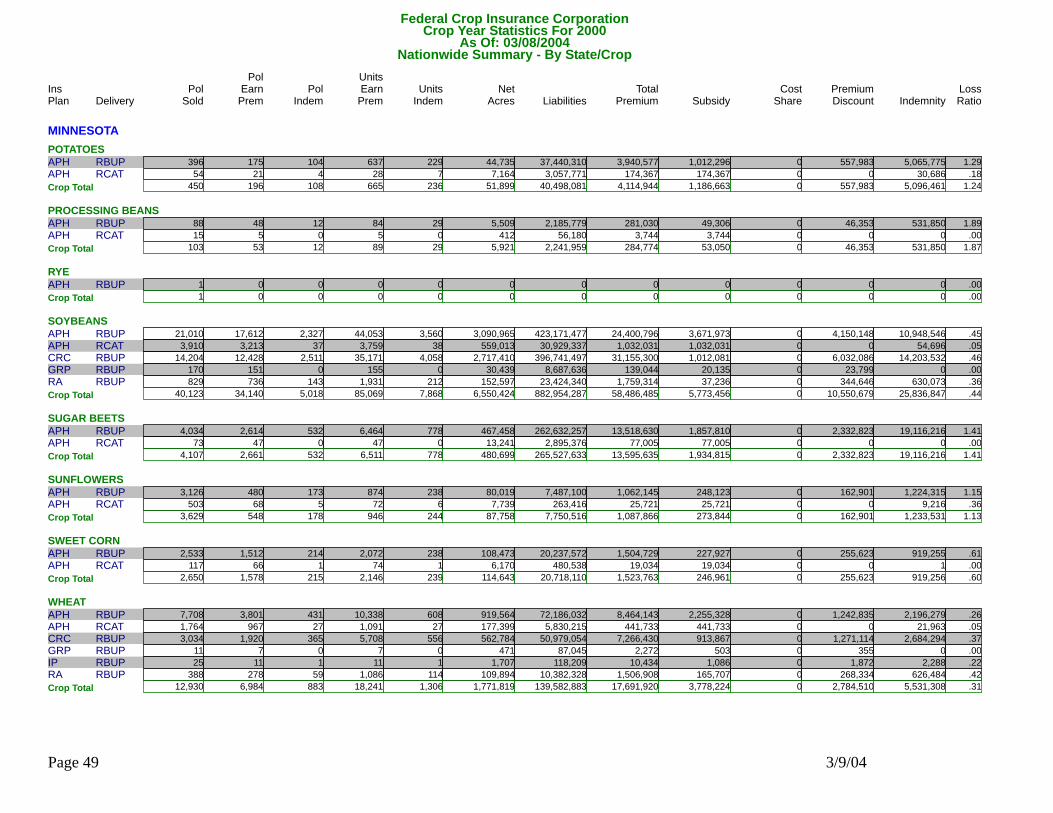
Federal Crop Insurance CorporationNationwide Summary - By State/Crop
Delivery Pol Units Units Net Liabilities Total Subsidy Premium IndemnityPol
Indem EarnPrem Indem Acres Premium Discount LossRatioSold EarnPremIns PolPlan ShareCost
Crop Year Statistics For 2000As Of: 03/08/2004
MINNESOTAPOTATOES
RBUPAPH 396 175 104 37,440,310637 229 44,735 3,940,577 1,012,296 557,983 5,065,775 1.290RCATAPH 54 21 4 3,057,77128 7 7,164 174,367 174,367 0 30,686 .180450Crop Total 196 108 665 236 51,899 40,498,081 4,114,944 1,186,663 557,983 5,096,461 1.240
PROCESSING BEANSRBUPAPH 88 48 12 2,185,77984 29 5,509 281,030 49,306 46,353 531,850 1.890RCATAPH 15 5 0 56,1805 0 412 3,744 3,744 0 0 .000
103Crop Total 53 12 89 29 5,921 2,241,959 284,774 53,050 46,353 531,850 1.870RYE
RBUPAPH 1 0 0 00 0 0 0 0 0 0 .0001Crop Total 0 0 0 0 0 0 0 0 0 0 .000
SOYBEANSRBUPAPH 21,010 17,612 2,327 423,171,47744,053 3,560 3,090,965 24,400,796 3,671,973 4,150,148 10,948,546 .450RCATAPH 3,910 3,213 37 30,929,3373,759 38 559,013 1,032,031 1,032,031 0 54,696 .050RBUPCRC 14,204 12,428 2,511 396,741,49735,171 4,058 2,717,410 31,155,300 1,012,081 6,032,086 14,203,532 .460RBUPGRP 170 151 0 8,687,636155 0 30,439 139,044 20,135 23,799 0 .000RBUPRA 829 736 143 23,424,3401,931 212 152,597 1,759,314 37,236 344,646 630,073 .360
40,123Crop Total 34,140 5,018 85,069 7,868 6,550,424 882,954,287 58,486,485 5,773,456 10,550,679 25,836,847 .440SUGAR BEETS
RBUPAPH 4,034 2,614 532 262,632,2576,464 778 467,458 13,518,630 1,857,810 2,332,823 19,116,216 1.410RCATAPH 73 47 0 2,895,37647 0 13,241 77,005 77,005 0 0 .0004,107Crop Total 2,661 532 6,511 778 480,699 265,527,633 13,595,635 1,934,815 2,332,823 19,116,216 1.410
SUNFLOWERSRBUPAPH 3,126 480 173 7,487,100874 238 80,019 1,062,145 248,123 162,901 1,224,315 1.150RCATAPH 503 68 5 263,41672 6 7,739 25,721 25,721 0 9,216 .360
3,629Crop Total 548 178 946 244 87,758 7,750,516 1,087,866 273,844 162,901 1,233,531 1.130SWEET CORN
RBUPAPH 2,533 1,512 214 20,237,5722,072 238 108,473 1,504,729 227,927 255,623 919,255 .610RCATAPH 117 66 1 480,53874 1 6,170 19,034 19,034 0 1 .0002,650Crop Total 1,578 215 2,146 239 114,643 20,718,110 1,523,763 246,961 255,623 919,256 .600
WHEATRBUPAPH 7,708 3,801 431 72,186,03210,338 608 919,564 8,464,143 2,255,328 1,242,835 2,196,279 .260RCATAPH 1,764 967 27 5,830,2151,091 27 177,399 441,733 441,733 0 21,963 .050RBUPCRC 3,034 1,920 365 50,979,0545,708 556 562,784 7,266,430 913,867 1,271,114 2,684,294 .370RBUPGRP 11 7 0 87,0457 0 471 2,272 503 355 0 .000RBUPIP 25 11 1 118,20911 1 1,707 10,434 1,086 1,872 2,288 .220RBUPRA 388 278 59 10,382,3281,086 114 109,894 1,506,908 165,707 268,334 626,484 .420
12,930Crop Total 6,984 883 18,241 1,306 1,771,819 139,582,883 17,691,920 3,778,224 2,784,510 5,531,308 .310
Page 49 3/9/04

Federal Crop Insurance CorporationNationwide Summary - By State/Crop
Delivery Pol Units Units Net Liabilities Total Subsidy Premium IndemnityPol
Indem EarnPrem Indem Acres Premium Discount LossRatioSold EarnPremIns PolPlan ShareCost
Crop Year Statistics For 2000As Of: 03/08/2004
MINNESOTA131,177State Total 91,807 11,281 206,172 16,474 16,109,142 2,612,146,258 189,672,480 25,826,397 32,761,054 83,736,631 .440
MISSISSIPPIBLUEBERRIES
RBUPAPH 19 16 4 180,52816 4 273 16,951 2,158 2,961 44,993 2.650RCATAPH 7 6 2 39,3726 2 98 2,162 2,162 0 5,137 2.38026Crop Total 22 6 22 6 371 219,900 19,113 4,320 2,961 50,130 2.620
CORNRBUPAPH 733 345 187 8,683,9171,048 387 79,279 1,032,474 267,004 153,192 971,454 .940RCATAPH 1,853 809 75 9,944,3881,010 81 190,059 829,063 829,063 0 113,626 .140RBUPCRC 294 124 85 3,596,034377 218 27,681 586,707 43,195 108,737 1,059,122 1.810
2,880Crop Total 1,278 347 2,435 686 297,019 22,224,339 2,448,244 1,139,262 261,929 2,144,202 .880COTTON
RBUPAPH 1,431 929 634 251,811,6123,346 1,913 604,514 23,586,218 -115,964 4,512,776 61,922,549 2.630RCATAPH 2,355 1,500 122 83,973,6512,231 149 590,303 3,410,130 3,410,130 0 337,779 .100RBUPCRC 163 107 76 23,950,213464 260 58,645 4,207,140 -456,042 928,230 7,564,072 1.8003,949Crop Total 2,536 832 6,041 2,322 1,253,462 359,735,476 31,203,488 2,838,124 5,441,006 69,824,400 2.240
GRAIN SORGHUMRBUPAPH 188 32 12 530,61956 19 7,620 56,025 12,217 8,767 63,814 1.140RCATAPH 654 195 15 1,528,578212 15 47,155 108,212 108,212 0 30,471 .280RBUPCRC 119 31 21 641,90254 31 7,321 98,208 6,527 18,343 193,204 1.970
961Crop Total 258 48 322 65 62,096 2,701,099 262,445 126,956 27,110 287,489 1.100GRAPES
RCATAPH 1 1 0 96,2501 0 200 4,821 4,821 0 0 .0001Crop Total 1 0 1 0 200 96,250 4,821 4,821 0 0 .000
NURSERY (FG&C)RBUPDOL 1 1 0 25,3501 0 0 548 133 83 0 .000RCATDOL 20 19 0 5,420,99519 0 0 81,897 81,897 0 0 .000
21Crop Total 20 0 20 0 0 5,446,345 82,445 82,030 83 0 .000OATS
RBUPAPH 6 1 0 4,0371 0 100 429 116 63 0 .000RCATAPH 9 1 0 3961 0 35 57 57 0 0 .00015Crop Total 2 0 2 0 135 4,433 486 173 63 0 .000
PEACHESRBUPAPH 9 7 2 109,9257 2 75 23,159 5,415 3,550 18,819 .810RCATAPH 2 1 0 17,6361 0 49 2,524 2,524 0 0 .000
11Crop Total 8 2 8 2 124 127,561 25,683 7,939 3,550 18,819 .730
Page 50 3/9/04
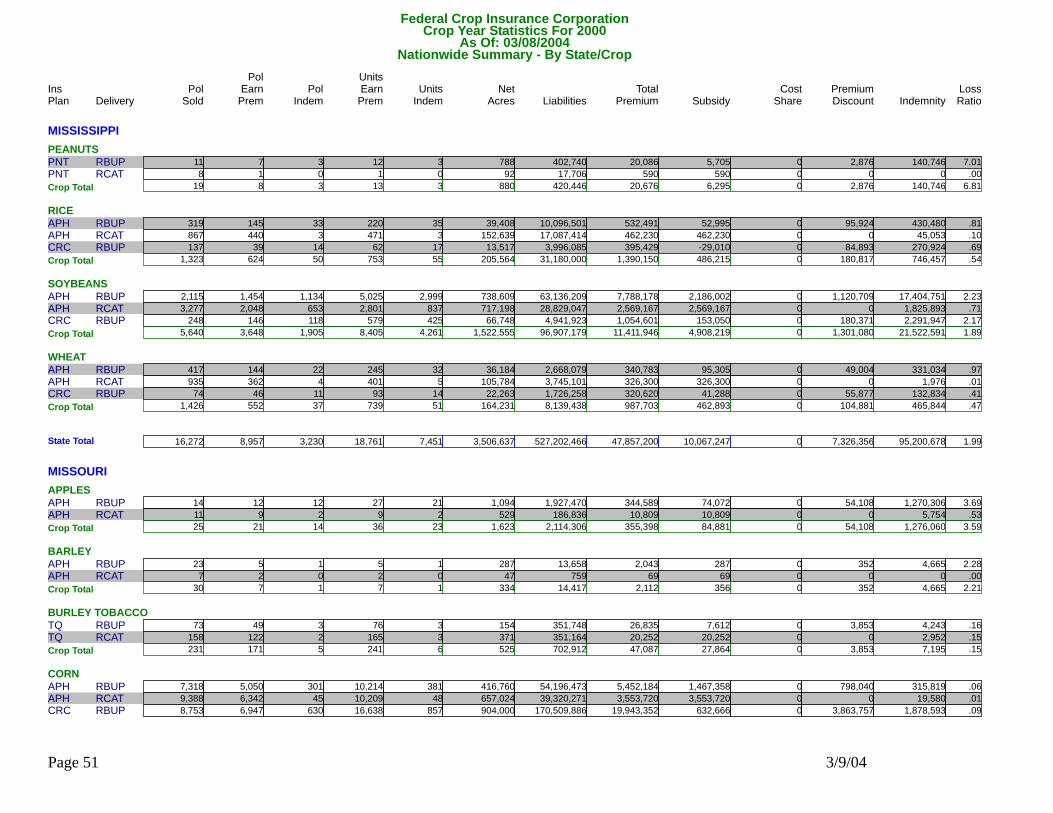
Federal Crop Insurance CorporationNationwide Summary - By State/Crop
Delivery Pol Units Units Net Liabilities Total Subsidy Premium IndemnityPol
Indem EarnPrem Indem Acres Premium Discount LossRatioSold EarnPremIns PolPlan ShareCost
Crop Year Statistics For 2000As Of: 03/08/2004
MISSISSIPPIPEANUTS
RBUPPNT 11 7 3 402,74012 3 788 20,086 5,705 2,876 140,746 7.010RCATPNT 8 1 0 17,7061 0 92 590 590 0 0 .00019Crop Total 8 3 13 3 880 420,446 20,676 6,295 2,876 140,746 6.810
RICERBUPAPH 319 145 33 10,096,501220 35 39,408 532,491 52,995 95,924 430,480 .810RCATAPH 867 440 3 17,087,414471 3 152,639 462,230 462,230 0 45,053 .100RBUPCRC 137 39 14 3,996,08562 17 13,517 395,429 -29,010 84,893 270,924 .690
1,323Crop Total 624 50 753 55 205,564 31,180,000 1,390,150 486,215 180,817 746,457 .540SOYBEANS
RBUPAPH 2,115 1,454 1,134 63,136,2095,025 2,999 738,609 7,788,178 2,186,002 1,120,709 17,404,751 2.230RCATAPH 3,277 2,048 653 28,829,0472,801 837 717,198 2,569,167 2,569,167 0 1,825,893 .710RBUPCRC 248 146 118 4,941,923579 425 66,748 1,054,601 153,050 180,371 2,291,947 2.1705,640Crop Total 3,648 1,905 8,405 4,261 1,522,555 96,907,179 11,411,946 4,908,219 1,301,080 21,522,591 1.890
WHEATRBUPAPH 417 144 22 2,668,079245 32 36,184 340,783 95,305 49,004 331,034 .970RCATAPH 935 362 4 3,745,101401 5 105,784 326,300 326,300 0 1,976 .010RBUPCRC 74 46 11 1,726,25893 14 22,263 320,620 41,288 55,877 132,834 .410
1,426Crop Total 552 37 739 51 164,231 8,139,438 987,703 462,893 104,881 465,844 .470
16,272State Total 8,957 3,230 18,761 7,451 3,506,637 527,202,466 47,857,200 10,067,247 7,326,356 95,200,678 1.990
MISSOURIAPPLES
RBUPAPH 14 12 12 1,927,47027 21 1,094 344,589 74,072 54,108 1,270,306 3.690RCATAPH 11 9 2 186,8369 2 529 10,809 10,809 0 5,754 .53025Crop Total 21 14 36 23 1,623 2,114,306 355,398 84,881 54,108 1,276,060 3.590
BARLEYRBUPAPH 23 5 1 13,6585 1 287 2,043 287 352 4,665 2.280RCATAPH 7 2 0 7592 0 47 69 69 0 0 .000
30Crop Total 7 1 7 1 334 14,417 2,112 356 352 4,665 2.210BURLEY TOBACCO
RBUPTQ 73 49 3 351,74876 3 154 26,835 7,612 3,853 4,243 .160RCATTQ 158 122 2 351,164165 3 371 20,252 20,252 0 2,952 .150231Crop Total 171 5 241 6 525 702,912 47,087 27,864 3,853 7,195 .150
CORNRBUPAPH 7,318 5,050 301 54,196,47310,214 381 416,760 5,452,184 1,467,358 798,040 315,819 .060RCATAPH 9,388 6,342 45 39,320,27110,209 48 657,024 3,553,720 3,553,720 0 19,580 .010RBUPCRC 8,753 6,947 630 170,509,88616,638 857 904,000 19,943,352 632,666 3,863,757 1,878,593 .090
Page 51 3/9/04

Federal Crop Insurance CorporationNationwide Summary - By State/Crop
Delivery Pol Units Units Net Liabilities Total Subsidy Premium IndemnityPol
Indem EarnPrem Indem Acres Premium Discount LossRatioSold EarnPremIns PolPlan ShareCost
Crop Year Statistics For 2000As Of: 03/08/2004
MISSOURICORN
RBUPGRP 24 20 0 1,613,80921 0 5,542 99,804 10,108 17,941 0 .00025,483Crop Total 18,359 976 37,082 1,286 1,983,326 265,640,439 29,049,060 5,663,852 4,679,738 2,213,992 .080
COTTONRBUPAPH 163 112 46 8,073,737504 132 31,895 678,374 168,060 102,114 800,199 1.180RCATAPH 2,439 1,837 119 35,026,8254,629 156 313,615 2,113,066 2,113,066 0 437,806 .210RBUPCRC 58 43 20 2,576,960142 30 9,658 296,610 47,433 49,847 220,616 .740
2,660Crop Total 1,992 185 5,275 318 355,168 45,677,522 3,088,050 2,328,559 151,961 1,458,621 .470GRAIN SORGHUM
RBUPAPH 2,690 442 53 2,259,251708 75 26,011 257,832 72,699 37,103 69,999 .270RCATAPH 4,244 1,302 41 3,086,3991,920 46 81,269 295,947 295,947 0 17,280 .060RBUPCRC 1,300 380 84 4,041,803698 122 28,286 494,586 25,635 93,848 166,074 .3408,234Crop Total 2,124 178 3,326 243 135,566 9,387,453 1,048,365 394,281 130,951 253,353 .240
GRAPESRBUPAPH 3 3 0 6,8203 0 19 1,122 313 162 0 .000RCATAPH 3 3 0 24,0073 0 96 2,338 2,338 0 0 .000
6Crop Total 6 0 6 0 115 30,827 3,460 2,651 162 0 .000HYBRID CORN SEED
RBUPYDO 32 17 0 302,96424 0 1,303 63,018 18,655 8,876 0 .000RCATYDO 8 0 0 00 0 0 0 0 0 0 .00040Crop Total 17 0 24 0 1,303 302,964 63,018 18,655 8,876 0 .000
NURSERY (FG&C)RBUPDOL 3 3 0 170,7383 0 0 3,540 301 648 0 .000RCATDOL 29 27 0 13,392,16527 0 0 92,039 92,039 0 0 .000
32Crop Total 30 0 30 0 0 13,562,903 95,579 92,340 648 0 .000OATS
RBUPAPH 97 17 8 19,54620 8 646 2,781 807 396 4,333 1.560RCATAPH 62 11 1 5,58012 1 423 625 625 0 393 .630159Crop Total 28 9 32 9 1,069 25,126 3,406 1,432 396 4,726 1.390
PEACHESRBUPAPH 3 2 0 709,2239 0 559 80,523 35,228 9,060 0 .000RCATAPH 1 1 0 3,5071 0 12 359 359 0 0 .000
4Crop Total 3 0 10 0 571 712,730 80,882 35,587 9,060 0 .000POPCORN
RBUPAPH 80 31 2 619,52152 2 3,372 57,145 14,993 8,435 4,257 .070RCATAPH 37 6 0 72,5439 0 656 4,247 4,247 0 0 .000117Crop Total 37 2 61 2 4,028 692,064 61,392 19,240 8,435 4,257 .070
Page 52 3/9/04
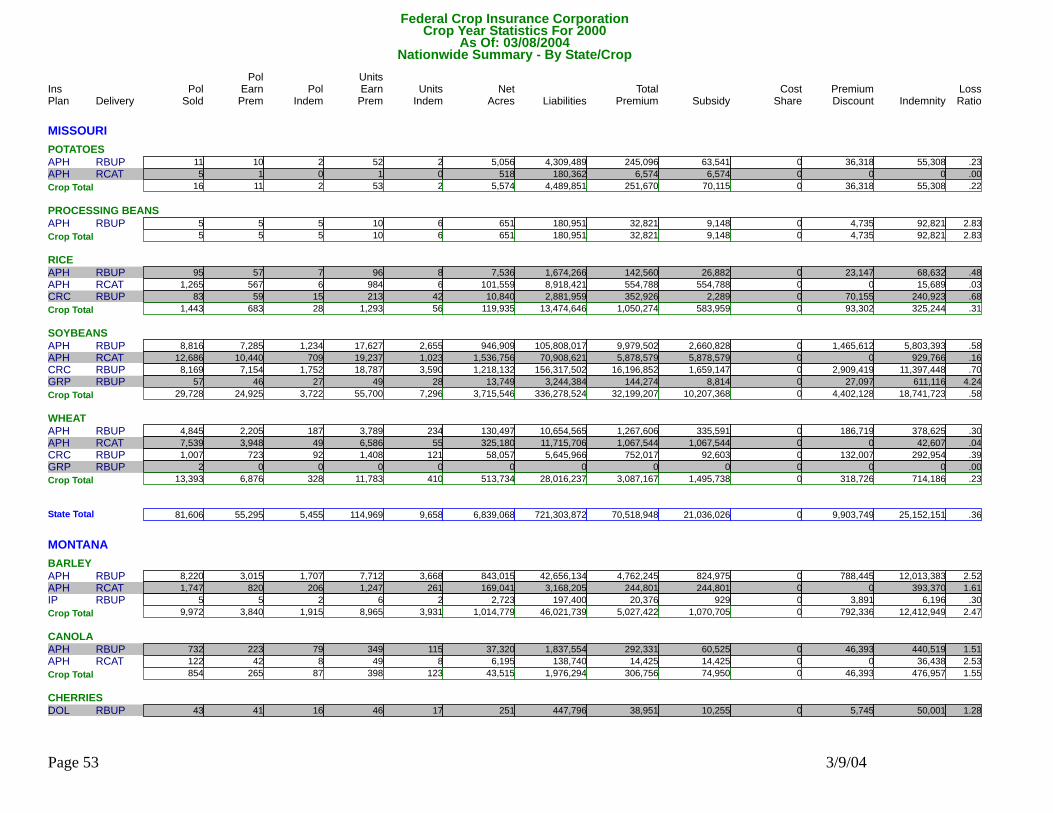
Federal Crop Insurance CorporationNationwide Summary - By State/Crop
Delivery Pol Units Units Net Liabilities Total Subsidy Premium IndemnityPol
Indem EarnPrem Indem Acres Premium Discount LossRatioSold EarnPremIns PolPlan ShareCost
Crop Year Statistics For 2000As Of: 03/08/2004
MISSOURIPOTATOES
RBUPAPH 11 10 2 4,309,48952 2 5,056 245,096 63,541 36,318 55,308 .230RCATAPH 5 1 0 180,3621 0 518 6,574 6,574 0 0 .00016Crop Total 11 2 53 2 5,574 4,489,851 251,670 70,115 36,318 55,308 .220
PROCESSING BEANSRBUPAPH 5 5 5 180,95110 6 651 32,821 9,148 4,735 92,821 2.830
5Crop Total 5 5 10 6 651 180,951 32,821 9,148 4,735 92,821 2.830RICE
RBUPAPH 95 57 7 1,674,26696 8 7,536 142,560 26,882 23,147 68,632 .480RCATAPH 1,265 567 6 8,918,421984 6 101,559 554,788 554,788 0 15,689 .030RBUPCRC 83 59 15 2,881,959213 42 10,840 352,926 2,289 70,155 240,923 .6801,443Crop Total 683 28 1,293 56 119,935 13,474,646 1,050,274 583,959 93,302 325,244 .310
SOYBEANSRBUPAPH 8,816 7,285 1,234 105,808,01717,627 2,655 946,909 9,979,502 2,660,828 1,465,612 5,803,393 .580RCATAPH 12,686 10,440 709 70,908,62119,237 1,023 1,536,756 5,878,579 5,878,579 0 929,766 .160RBUPCRC 8,169 7,154 1,752 156,317,50218,787 3,590 1,218,132 16,196,852 1,659,147 2,909,419 11,397,448 .700RBUPGRP 57 46 27 3,244,38449 28 13,749 144,274 8,814 27,097 611,116 4.240
29,728Crop Total 24,925 3,722 55,700 7,296 3,715,546 336,278,524 32,199,207 10,207,368 4,402,128 18,741,723 .580WHEAT
RBUPAPH 4,845 2,205 187 10,654,5653,789 234 130,497 1,267,606 335,591 186,719 378,625 .300RCATAPH 7,539 3,948 49 11,715,7066,586 55 325,180 1,067,544 1,067,544 0 42,607 .040RBUPCRC 1,007 723 92 5,645,9661,408 121 58,057 752,017 92,603 132,007 292,954 .390RBUPGRP 2 0 0 00 0 0 0 0 0 0 .00013,393Crop Total 6,876 328 11,783 410 513,734 28,016,237 3,087,167 1,495,738 318,726 714,186 .230
81,606State Total 55,295 5,455 114,969 9,658 6,839,068 721,303,872 70,518,948 21,036,026 9,903,749 25,152,151 .360
MONTANABARLEY
RBUPAPH 8,220 3,015 1,707 42,656,1347,712 3,668 843,015 4,762,245 824,975 788,445 12,013,383 2.520RCATAPH 1,747 820 206 3,168,2051,247 261 169,041 244,801 244,801 0 393,370 1.610RBUPIP 5 5 2 197,4006 2 2,723 20,376 929 3,891 6,196 .3009,972Crop Total 3,840 1,915 8,965 3,931 1,014,779 46,021,739 5,027,422 1,070,705 792,336 12,412,949 2.470
CANOLARBUPAPH 732 223 79 1,837,554349 115 37,320 292,331 60,525 46,393 440,519 1.510RCATAPH 122 42 8 138,74049 8 6,195 14,425 14,425 0 36,438 2.530
854Crop Total 265 87 398 123 43,515 1,976,294 306,756 74,950 46,393 476,957 1.550CHERRIES
RBUPDOL 43 41 16 447,79646 17 251 38,951 10,255 5,745 50,001 1.280
Page 53 3/9/04
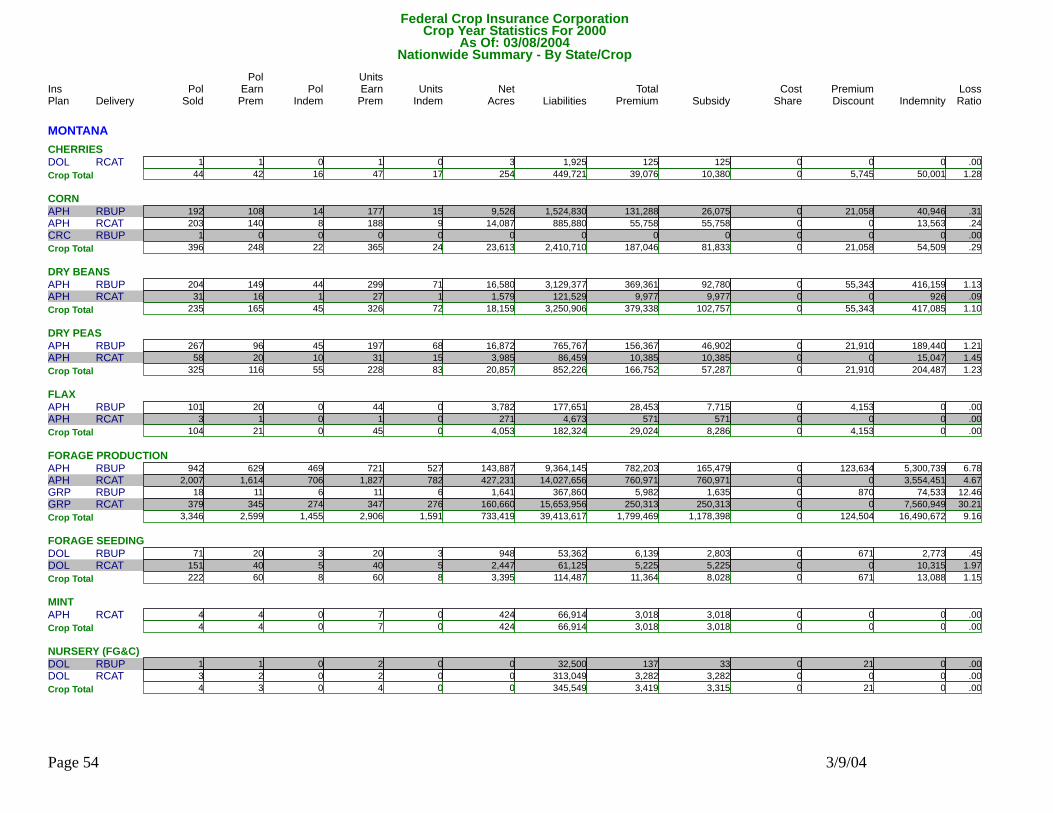
Federal Crop Insurance CorporationNationwide Summary - By State/Crop
Delivery Pol Units Units Net Liabilities Total Subsidy Premium IndemnityPol
Indem EarnPrem Indem Acres Premium Discount LossRatioSold EarnPremIns PolPlan ShareCost
Crop Year Statistics For 2000As Of: 03/08/2004
MONTANACHERRIES
RCATDOL 1 1 0 1,9251 0 3 125 125 0 0 .00044Crop Total 42 16 47 17 254 449,721 39,076 10,380 5,745 50,001 1.280
CORNRBUPAPH 192 108 14 1,524,830177 15 9,526 131,288 26,075 21,058 40,946 .310RCATAPH 203 140 8 885,880188 9 14,087 55,758 55,758 0 13,563 .240RBUPCRC 1 0 0 00 0 0 0 0 0 0 .000
396Crop Total 248 22 365 24 23,613 2,410,710 187,046 81,833 21,058 54,509 .290DRY BEANS
RBUPAPH 204 149 44 3,129,377299 71 16,580 369,361 92,780 55,343 416,159 1.130RCATAPH 31 16 1 121,52927 1 1,579 9,977 9,977 0 926 .090235Crop Total 165 45 326 72 18,159 3,250,906 379,338 102,757 55,343 417,085 1.100
DRY PEASRBUPAPH 267 96 45 765,767197 68 16,872 156,367 46,902 21,910 189,440 1.210RCATAPH 58 20 10 86,45931 15 3,985 10,385 10,385 0 15,047 1.450
325Crop Total 116 55 228 83 20,857 852,226 166,752 57,287 21,910 204,487 1.230FLAX
RBUPAPH 101 20 0 177,65144 0 3,782 28,453 7,715 4,153 0 .000RCATAPH 3 1 0 4,6731 0 271 571 571 0 0 .000104Crop Total 21 0 45 0 4,053 182,324 29,024 8,286 4,153 0 .000
FORAGE PRODUCTIONRBUPAPH 942 629 469 9,364,145721 527 143,887 782,203 165,479 123,634 5,300,739 6.780RCATAPH 2,007 1,614 706 14,027,6561,827 782 427,231 760,971 760,971 0 3,554,451 4.670RBUPGRP 18 11 6 367,86011 6 1,641 5,982 1,635 870 74,533 12.460RCATGRP 379 345 274 15,653,956347 276 160,660 250,313 250,313 0 7,560,949 30.210
3,346Crop Total 2,599 1,455 2,906 1,591 733,419 39,413,617 1,799,469 1,178,398 124,504 16,490,672 9.160FORAGE SEEDING
RBUPDOL 71 20 3 53,36220 3 948 6,139 2,803 671 2,773 .450RCATDOL 151 40 5 61,12540 5 2,447 5,225 5,225 0 10,315 1.970222Crop Total 60 8 60 8 3,395 114,487 11,364 8,028 671 13,088 1.150
MINTRCATAPH 4 4 0 66,9147 0 424 3,018 3,018 0 0 .000
4Crop Total 4 0 7 0 424 66,914 3,018 3,018 0 0 .000NURSERY (FG&C)
RBUPDOL 1 1 0 32,5002 0 0 137 33 21 0 .000RCATDOL 3 2 0 313,0492 0 0 3,282 3,282 0 0 .0004Crop Total 3 0 4 0 0 345,549 3,419 3,315 21 0 .000
Page 54 3/9/04
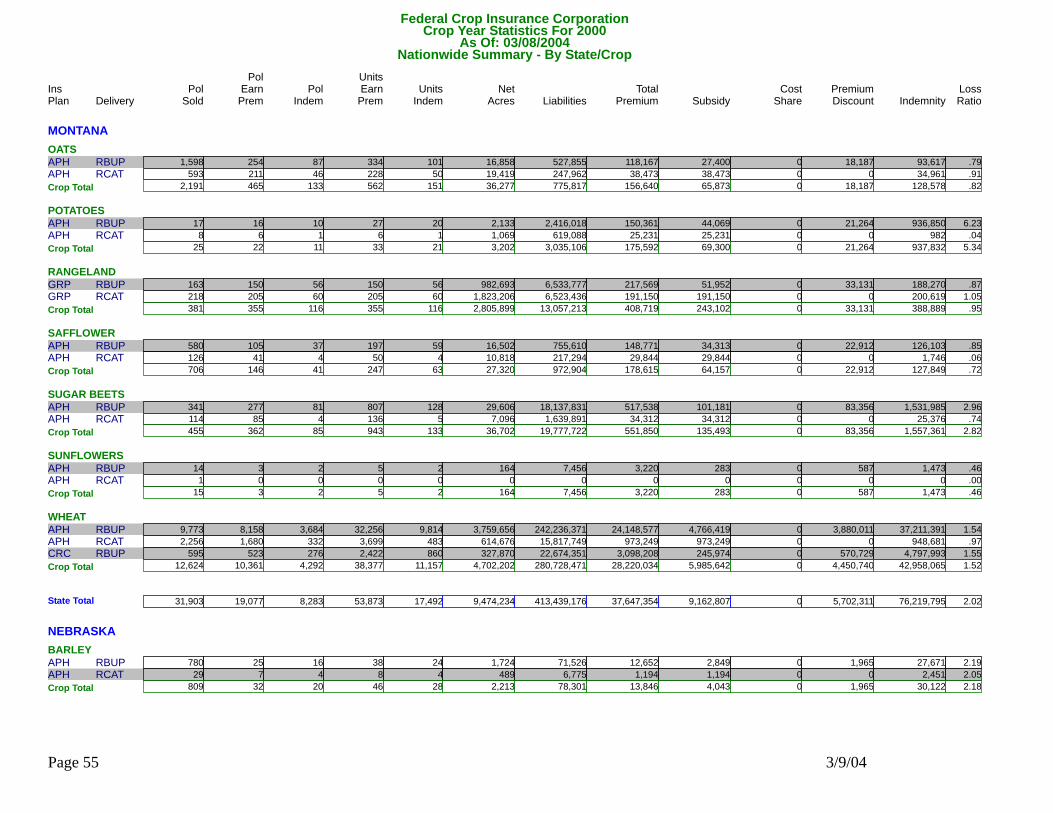
Federal Crop Insurance CorporationNationwide Summary - By State/Crop
Delivery Pol Units Units Net Liabilities Total Subsidy Premium IndemnityPol
Indem EarnPrem Indem Acres Premium Discount LossRatioSold EarnPremIns PolPlan ShareCost
Crop Year Statistics For 2000As Of: 03/08/2004
MONTANAOATS
RBUPAPH 1,598 254 87 527,855334 101 16,858 118,167 27,400 18,187 93,617 .790RCATAPH 593 211 46 247,962228 50 19,419 38,473 38,473 0 34,961 .9102,191Crop Total 465 133 562 151 36,277 775,817 156,640 65,873 18,187 128,578 .820
POTATOESRBUPAPH 17 16 10 2,416,01827 20 2,133 150,361 44,069 21,264 936,850 6.230RCATAPH 8 6 1 619,0886 1 1,069 25,231 25,231 0 982 .040
25Crop Total 22 11 33 21 3,202 3,035,106 175,592 69,300 21,264 937,832 5.340RANGELAND
RBUPGRP 163 150 56 6,533,777150 56 982,693 217,569 51,952 33,131 188,270 .870RCATGRP 218 205 60 6,523,436205 60 1,823,206 191,150 191,150 0 200,619 1.050381Crop Total 355 116 355 116 2,805,899 13,057,213 408,719 243,102 33,131 388,889 .950
SAFFLOWERRBUPAPH 580 105 37 755,610197 59 16,502 148,771 34,313 22,912 126,103 .850RCATAPH 126 41 4 217,29450 4 10,818 29,844 29,844 0 1,746 .060
706Crop Total 146 41 247 63 27,320 972,904 178,615 64,157 22,912 127,849 .720SUGAR BEETS
RBUPAPH 341 277 81 18,137,831807 128 29,606 517,538 101,181 83,356 1,531,985 2.960RCATAPH 114 85 4 1,639,891136 5 7,096 34,312 34,312 0 25,376 .740455Crop Total 362 85 943 133 36,702 19,777,722 551,850 135,493 83,356 1,557,361 2.820
SUNFLOWERSRBUPAPH 14 3 2 7,4565 2 164 3,220 283 587 1,473 .460RCATAPH 1 0 0 00 0 0 0 0 0 0 .000
15Crop Total 3 2 5 2 164 7,456 3,220 283 587 1,473 .460WHEAT
RBUPAPH 9,773 8,158 3,684 242,236,37132,256 9,814 3,759,656 24,148,577 4,766,419 3,880,011 37,211,391 1.540RCATAPH 2,256 1,680 332 15,817,7493,699 483 614,676 973,249 973,249 0 948,681 .970RBUPCRC 595 523 276 22,674,3512,422 860 327,870 3,098,208 245,974 570,729 4,797,993 1.55012,624Crop Total 10,361 4,292 38,377 11,157 4,702,202 280,728,471 28,220,034 5,985,642 4,450,740 42,958,065 1.520
31,903State Total 19,077 8,283 53,873 17,492 9,474,234 413,439,176 37,647,354 9,162,807 5,702,311 76,219,795 2.020
NEBRASKABARLEY
RBUPAPH 780 25 16 71,52638 24 1,724 12,652 2,849 1,965 27,671 2.190RCATAPH 29 7 4 6,7758 4 489 1,194 1,194 0 2,451 2.050809Crop Total 32 20 46 28 2,213 78,301 13,846 4,043 1,965 30,122 2.180
Page 55 3/9/04
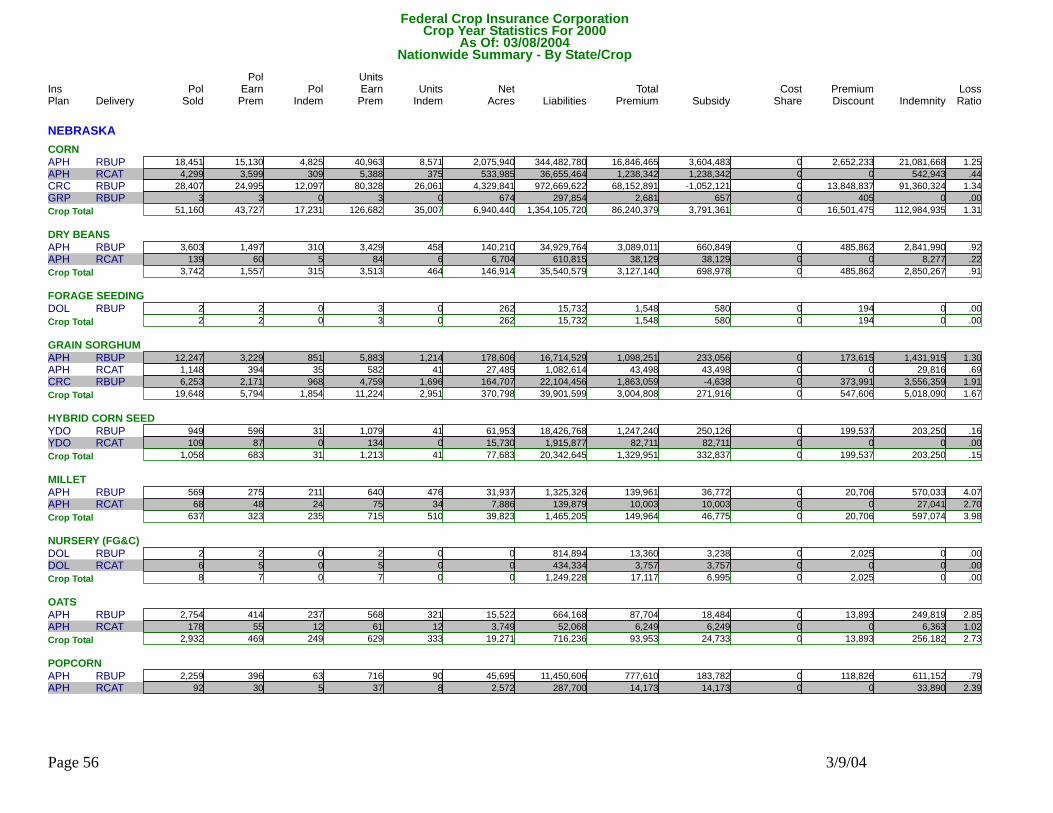
Federal Crop Insurance CorporationNationwide Summary - By State/Crop
Delivery Pol Units Units Net Liabilities Total Subsidy Premium IndemnityPol
Indem EarnPrem Indem Acres Premium Discount LossRatioSold EarnPremIns PolPlan ShareCost
Crop Year Statistics For 2000As Of: 03/08/2004
NEBRASKACORN
RBUPAPH 18,451 15,130 4,825 344,482,78040,963 8,571 2,075,940 16,846,465 3,604,483 2,652,233 21,081,668 1.250RCATAPH 4,299 3,599 309 36,655,4645,388 375 533,985 1,238,342 1,238,342 0 542,943 .440RBUPCRC 28,407 24,995 12,097 972,669,62280,328 26,061 4,329,841 68,152,891 -1,052,121 13,848,837 91,360,324 1.340RBUPGRP 3 3 0 297,8543 0 674 2,681 657 405 0 .00051,160Crop Total 43,727 17,231 126,682 35,007 6,940,440 1,354,105,720 86,240,379 3,791,361 16,501,475 112,984,935 1.310
DRY BEANSRBUPAPH 3,603 1,497 310 34,929,7643,429 458 140,210 3,089,011 660,849 485,862 2,841,990 .920RCATAPH 139 60 5 610,81584 6 6,704 38,129 38,129 0 8,277 .220
3,742Crop Total 1,557 315 3,513 464 146,914 35,540,579 3,127,140 698,978 485,862 2,850,267 .910FORAGE SEEDING
RBUPDOL 2 2 0 15,7323 0 262 1,548 580 194 0 .0002Crop Total 2 0 3 0 262 15,732 1,548 580 194 0 .000
GRAIN SORGHUMRBUPAPH 12,247 3,229 851 16,714,5295,883 1,214 178,606 1,098,251 233,056 173,615 1,431,915 1.300RCATAPH 1,148 394 35 1,082,614582 41 27,485 43,498 43,498 0 29,816 .690RBUPCRC 6,253 2,171 968 22,104,4564,759 1,696 164,707 1,863,059 -4,638 373,991 3,556,359 1.910
19,648Crop Total 5,794 1,854 11,224 2,951 370,798 39,901,599 3,004,808 271,916 547,606 5,018,090 1.670HYBRID CORN SEED
RBUPYDO 949 596 31 18,426,7681,079 41 61,953 1,247,240 250,126 199,537 203,250 .160RCATYDO 109 87 0 1,915,877134 0 15,730 82,711 82,711 0 0 .0001,058Crop Total 683 31 1,213 41 77,683 20,342,645 1,329,951 332,837 199,537 203,250 .150
MILLETRBUPAPH 569 275 211 1,325,326640 476 31,937 139,961 36,772 20,706 570,033 4.070RCATAPH 68 48 24 139,87975 34 7,886 10,003 10,003 0 27,041 2.700
637Crop Total 323 235 715 510 39,823 1,465,205 149,964 46,775 20,706 597,074 3.980NURSERY (FG&C)
RBUPDOL 2 2 0 814,8942 0 0 13,360 3,238 2,025 0 .000RCATDOL 6 5 0 434,3345 0 0 3,757 3,757 0 0 .0008Crop Total 7 0 7 0 0 1,249,228 17,117 6,995 2,025 0 .000
OATSRBUPAPH 2,754 414 237 664,168568 321 15,522 87,704 18,484 13,893 249,819 2.850RCATAPH 178 55 12 52,06861 12 3,749 6,249 6,249 0 6,363 1.020
2,932Crop Total 469 249 629 333 19,271 716,236 93,953 24,733 13,893 256,182 2.730POPCORN
RBUPAPH 2,259 396 63 11,450,606716 90 45,695 777,610 183,782 118,826 611,152 .790RCATAPH 92 30 5 287,70037 8 2,572 14,173 14,173 0 33,890 2.390
Page 56 3/9/04
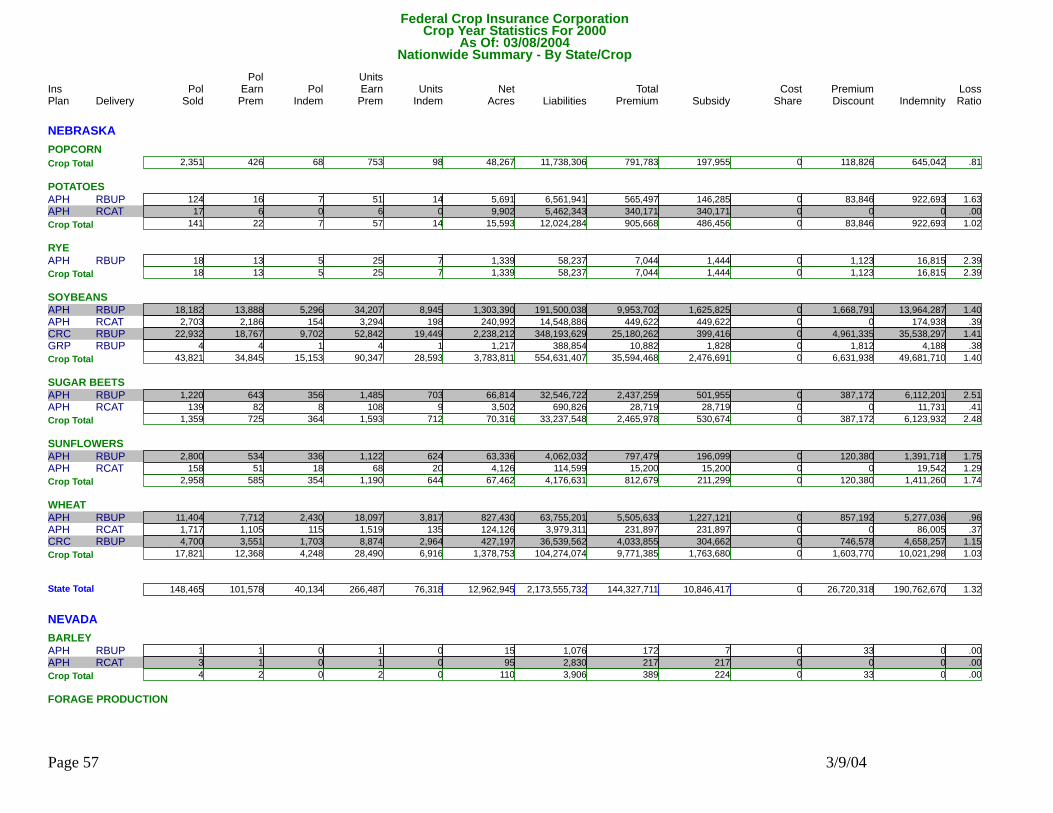
Federal Crop Insurance CorporationNationwide Summary - By State/Crop
Delivery Pol Units Units Net Liabilities Total Subsidy Premium IndemnityPol
Indem EarnPrem Indem Acres Premium Discount LossRatioSold EarnPremIns PolPlan ShareCost
Crop Year Statistics For 2000As Of: 03/08/2004
NEBRASKAPOPCORN
2,351Crop Total 426 68 753 98 48,267 11,738,306 791,783 197,955 118,826 645,042 .810POTATOES
RBUPAPH 124 16 7 6,561,94151 14 5,691 565,497 146,285 83,846 922,693 1.630RCATAPH 17 6 0 5,462,3436 0 9,902 340,171 340,171 0 0 .000141Crop Total 22 7 57 14 15,593 12,024,284 905,668 486,456 83,846 922,693 1.020
RYERBUPAPH 18 13 5 58,23725 7 1,339 7,044 1,444 1,123 16,815 2.390
18Crop Total 13 5 25 7 1,339 58,237 7,044 1,444 1,123 16,815 2.390SOYBEANS
RBUPAPH 18,182 13,888 5,296 191,500,03834,207 8,945 1,303,390 9,953,702 1,625,825 1,668,791 13,964,287 1.400RCATAPH 2,703 2,186 154 14,548,8863,294 198 240,992 449,622 449,622 0 174,938 .390RBUPCRC 22,932 18,767 9,702 348,193,62952,842 19,449 2,238,212 25,180,262 399,416 4,961,335 35,538,297 1.410RBUPGRP 4 4 1 388,8544 1 1,217 10,882 1,828 1,812 4,188 .38043,821Crop Total 34,845 15,153 90,347 28,593 3,783,811 554,631,407 35,594,468 2,476,691 6,631,938 49,681,710 1.400
SUGAR BEETSRBUPAPH 1,220 643 356 32,546,7221,485 703 66,814 2,437,259 501,955 387,172 6,112,201 2.510RCATAPH 139 82 8 690,826108 9 3,502 28,719 28,719 0 11,731 .410
1,359Crop Total 725 364 1,593 712 70,316 33,237,548 2,465,978 530,674 387,172 6,123,932 2.480SUNFLOWERS
RBUPAPH 2,800 534 336 4,062,0321,122 624 63,336 797,479 196,099 120,380 1,391,718 1.750RCATAPH 158 51 18 114,59968 20 4,126 15,200 15,200 0 19,542 1.2902,958Crop Total 585 354 1,190 644 67,462 4,176,631 812,679 211,299 120,380 1,411,260 1.740
WHEATRBUPAPH 11,404 7,712 2,430 63,755,20118,097 3,817 827,430 5,505,633 1,227,121 857,192 5,277,036 .960RCATAPH 1,717 1,105 115 3,979,3111,519 135 124,126 231,897 231,897 0 86,005 .370RBUPCRC 4,700 3,551 1,703 36,539,5628,874 2,964 427,197 4,033,855 304,662 746,578 4,658,257 1.150
17,821Crop Total 12,368 4,248 28,490 6,916 1,378,753 104,274,074 9,771,385 1,763,680 1,603,770 10,021,298 1.030
148,465State Total 101,578 40,134 266,487 76,318 12,962,945 2,173,555,732 144,327,711 10,846,417 26,720,318 190,762,670 1.320
NEVADABARLEY
RBUPAPH 1 1 0 1,0761 0 15 172 7 33 0 .000RCATAPH 3 1 0 2,8301 0 95 217 217 0 0 .0004Crop Total 2 0 2 0 110 3,906 389 224 33 0 .000
FORAGE PRODUCTION
Page 57 3/9/04
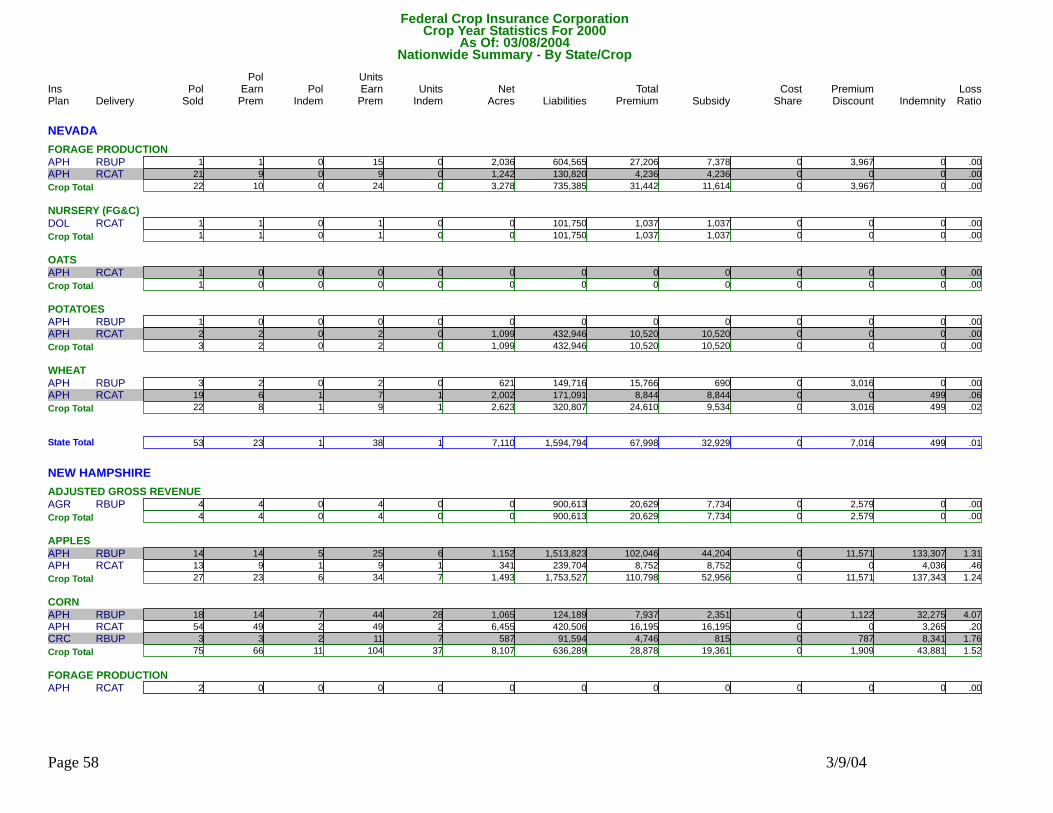
Federal Crop Insurance CorporationNationwide Summary - By State/Crop
Delivery Pol Units Units Net Liabilities Total Subsidy Premium IndemnityPol
Indem EarnPrem Indem Acres Premium Discount LossRatioSold EarnPremIns PolPlan ShareCost
Crop Year Statistics For 2000As Of: 03/08/2004
NEVADAFORAGE PRODUCTION
RBUPAPH 1 1 0 604,56515 0 2,036 27,206 7,378 3,967 0 .000RCATAPH 21 9 0 130,8209 0 1,242 4,236 4,236 0 0 .00022Crop Total 10 0 24 0 3,278 735,385 31,442 11,614 3,967 0 .000
NURSERY (FG&C)RCATDOL 1 1 0 101,7501 0 0 1,037 1,037 0 0 .000
1Crop Total 1 0 1 0 0 101,750 1,037 1,037 0 0 .000OATS
RCATAPH 1 0 0 00 0 0 0 0 0 0 .0001Crop Total 0 0 0 0 0 0 0 0 0 0 .000
POTATOESRBUPAPH 1 0 0 00 0 0 0 0 0 0 .000RCATAPH 2 2 0 432,9462 0 1,099 10,520 10,520 0 0 .000
3Crop Total 2 0 2 0 1,099 432,946 10,520 10,520 0 0 .000WHEAT
RBUPAPH 3 2 0 149,7162 0 621 15,766 690 3,016 0 .000RCATAPH 19 6 1 171,0917 1 2,002 8,844 8,844 0 499 .06022Crop Total 8 1 9 1 2,623 320,807 24,610 9,534 3,016 499 .020
53State Total 23 1 38 1 7,110 1,594,794 67,998 32,929 7,016 499 .010
NEW HAMPSHIREADJUSTED GROSS REVENUE
RBUPAGR 4 4 0 900,6134 0 0 20,629 7,734 2,579 0 .0004Crop Total 4 0 4 0 0 900,613 20,629 7,734 2,579 0 .000
APPLESRBUPAPH 14 14 5 1,513,82325 6 1,152 102,046 44,204 11,571 133,307 1.310RCATAPH 13 9 1 239,7049 1 341 8,752 8,752 0 4,036 .460
27Crop Total 23 6 34 7 1,493 1,753,527 110,798 52,956 11,571 137,343 1.240CORN
RBUPAPH 18 14 7 124,18944 28 1,065 7,937 2,351 1,122 32,275 4.070RCATAPH 54 49 2 420,50649 2 6,455 16,195 16,195 0 3,265 .200RBUPCRC 3 3 2 91,59411 7 587 4,746 815 787 8,341 1.76075Crop Total 66 11 104 37 8,107 636,289 28,878 19,361 1,909 43,881 1.520
FORAGE PRODUCTIONRCATAPH 2 0 0 00 0 0 0 0 0 0 .000
Page 58 3/9/04
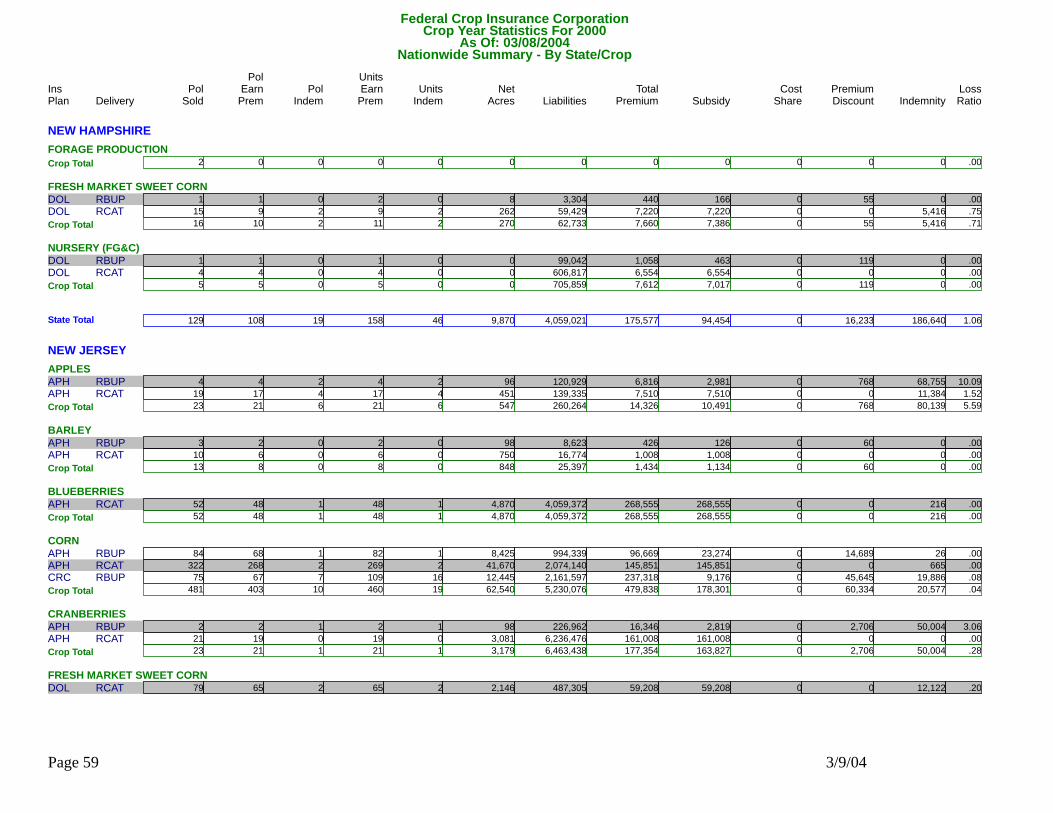
Federal Crop Insurance CorporationNationwide Summary - By State/Crop
Delivery Pol Units Units Net Liabilities Total Subsidy Premium IndemnityPol
Indem EarnPrem Indem Acres Premium Discount LossRatioSold EarnPremIns PolPlan ShareCost
Crop Year Statistics For 2000As Of: 03/08/2004
NEW HAMPSHIREFORAGE PRODUCTION
2Crop Total 0 0 0 0 0 0 0 0 0 0 .000FRESH MARKET SWEET CORN
RBUPDOL 1 1 0 3,3042 0 8 440 166 55 0 .000RCATDOL 15 9 2 59,4299 2 262 7,220 7,220 0 5,416 .75016Crop Total 10 2 11 2 270 62,733 7,660 7,386 55 5,416 .710
NURSERY (FG&C)RBUPDOL 1 1 0 99,0421 0 0 1,058 463 119 0 .000RCATDOL 4 4 0 606,8174 0 0 6,554 6,554 0 0 .000
5Crop Total 5 0 5 0 0 705,859 7,612 7,017 119 0 .000
129State Total 108 19 158 46 9,870 4,059,021 175,577 94,454 16,233 186,640 1.060
NEW JERSEYAPPLES
RBUPAPH 4 4 2 120,9294 2 96 6,816 2,981 768 68,755 10.090RCATAPH 19 17 4 139,33517 4 451 7,510 7,510 0 11,384 1.52023Crop Total 21 6 21 6 547 260,264 14,326 10,491 768 80,139 5.590
BARLEYRBUPAPH 3 2 0 8,6232 0 98 426 126 60 0 .000RCATAPH 10 6 0 16,7746 0 750 1,008 1,008 0 0 .000
13Crop Total 8 0 8 0 848 25,397 1,434 1,134 60 0 .000BLUEBERRIES
RCATAPH 52 48 1 4,059,37248 1 4,870 268,555 268,555 0 216 .00052Crop Total 48 1 48 1 4,870 4,059,372 268,555 268,555 0 216 .000
CORNRBUPAPH 84 68 1 994,33982 1 8,425 96,669 23,274 14,689 26 .000RCATAPH 322 268 2 2,074,140269 2 41,670 145,851 145,851 0 665 .000RBUPCRC 75 67 7 2,161,597109 16 12,445 237,318 9,176 45,645 19,886 .080
481Crop Total 403 10 460 19 62,540 5,230,076 479,838 178,301 60,334 20,577 .040CRANBERRIES
RBUPAPH 2 2 1 226,9622 1 98 16,346 2,819 2,706 50,004 3.060RCATAPH 21 19 0 6,236,47619 0 3,081 161,008 161,008 0 0 .00023Crop Total 21 1 21 1 3,179 6,463,438 177,354 163,827 2,706 50,004 .280
FRESH MARKET SWEET CORNRCATDOL 79 65 2 487,30565 2 2,146 59,208 59,208 0 12,122 .200
Page 59 3/9/04
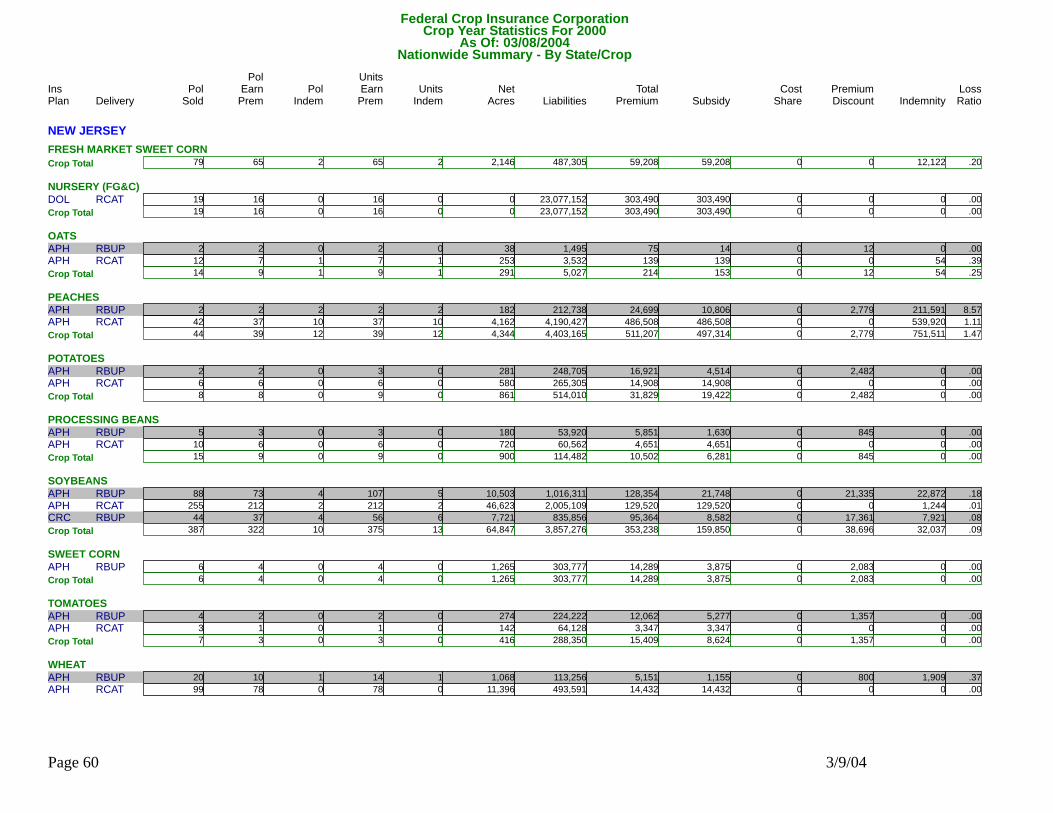
Federal Crop Insurance CorporationNationwide Summary - By State/Crop
Delivery Pol Units Units Net Liabilities Total Subsidy Premium IndemnityPol
Indem EarnPrem Indem Acres Premium Discount LossRatioSold EarnPremIns PolPlan ShareCost
Crop Year Statistics For 2000As Of: 03/08/2004
NEW JERSEYFRESH MARKET SWEET CORN
79Crop Total 65 2 65 2 2,146 487,305 59,208 59,208 0 12,122 .200NURSERY (FG&C)
RCATDOL 19 16 0 23,077,15216 0 0 303,490 303,490 0 0 .00019Crop Total 16 0 16 0 0 23,077,152 303,490 303,490 0 0 .000
OATSRBUPAPH 2 2 0 1,4952 0 38 75 14 12 0 .000RCATAPH 12 7 1 3,5327 1 253 139 139 0 54 .390
14Crop Total 9 1 9 1 291 5,027 214 153 12 54 .250PEACHES
RBUPAPH 2 2 2 212,7382 2 182 24,699 10,806 2,779 211,591 8.570RCATAPH 42 37 10 4,190,42737 10 4,162 486,508 486,508 0 539,920 1.11044Crop Total 39 12 39 12 4,344 4,403,165 511,207 497,314 2,779 751,511 1.470
POTATOESRBUPAPH 2 2 0 248,7053 0 281 16,921 4,514 2,482 0 .000RCATAPH 6 6 0 265,3056 0 580 14,908 14,908 0 0 .000
8Crop Total 8 0 9 0 861 514,010 31,829 19,422 2,482 0 .000PROCESSING BEANS
RBUPAPH 5 3 0 53,9203 0 180 5,851 1,630 845 0 .000RCATAPH 10 6 0 60,5626 0 720 4,651 4,651 0 0 .00015Crop Total 9 0 9 0 900 114,482 10,502 6,281 845 0 .000
SOYBEANSRBUPAPH 88 73 4 1,016,311107 5 10,503 128,354 21,748 21,335 22,872 .180RCATAPH 255 212 2 2,005,109212 2 46,623 129,520 129,520 0 1,244 .010RBUPCRC 44 37 4 835,85656 6 7,721 95,364 8,582 17,361 7,921 .080
387Crop Total 322 10 375 13 64,847 3,857,276 353,238 159,850 38,696 32,037 .090SWEET CORN
RBUPAPH 6 4 0 303,7774 0 1,265 14,289 3,875 2,083 0 .0006Crop Total 4 0 4 0 1,265 303,777 14,289 3,875 2,083 0 .000
TOMATOESRBUPAPH 4 2 0 224,2222 0 274 12,062 5,277 1,357 0 .000RCATAPH 3 1 0 64,1281 0 142 3,347 3,347 0 0 .000
7Crop Total 3 0 3 0 416 288,350 15,409 8,624 1,357 0 .000WHEAT
RBUPAPH 20 10 1 113,25614 1 1,068 5,151 1,155 800 1,909 .370RCATAPH 99 78 0 493,59178 0 11,396 14,432 14,432 0 0 .000
Page 60 3/9/04
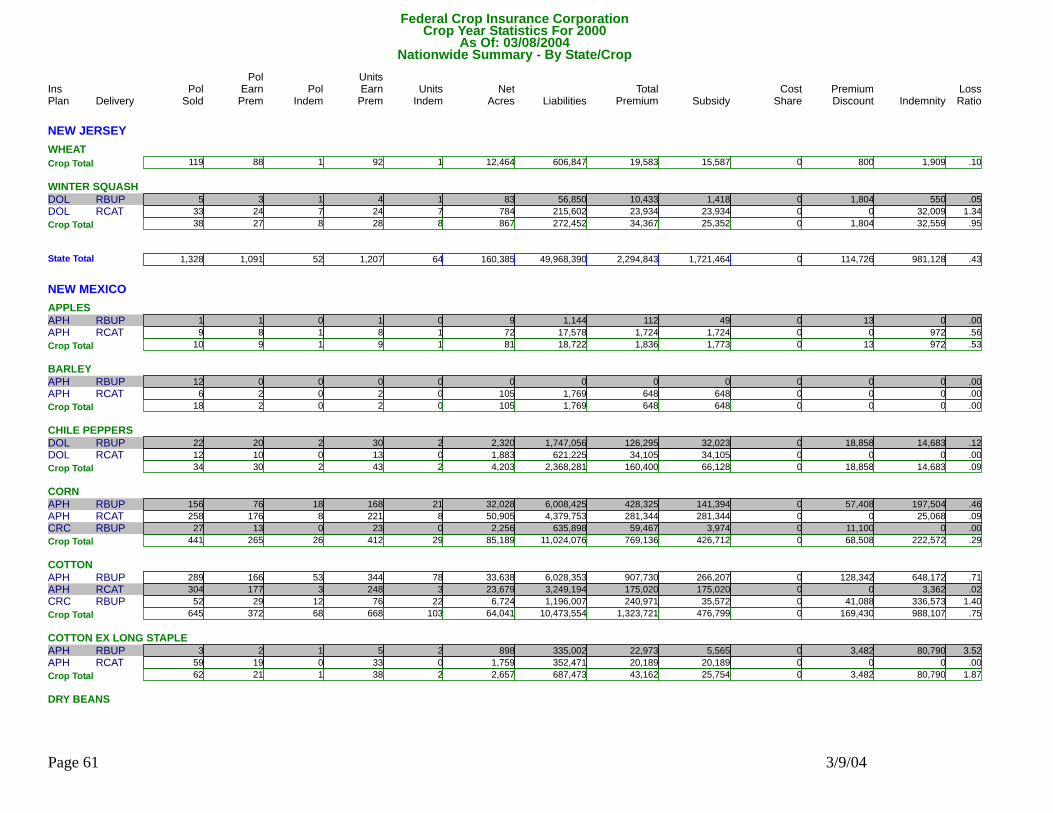
Federal Crop Insurance CorporationNationwide Summary - By State/Crop
Delivery Pol Units Units Net Liabilities Total Subsidy Premium IndemnityPol
Indem EarnPrem Indem Acres Premium Discount LossRatioSold EarnPremIns PolPlan ShareCost
Crop Year Statistics For 2000As Of: 03/08/2004
NEW JERSEYWHEAT
119Crop Total 88 1 92 1 12,464 606,847 19,583 15,587 800 1,909 .100WINTER SQUASH
RBUPDOL 5 3 1 56,8504 1 83 10,433 1,418 1,804 550 .050RCATDOL 33 24 7 215,60224 7 784 23,934 23,934 0 32,009 1.34038Crop Total 27 8 28 8 867 272,452 34,367 25,352 1,804 32,559 .950
1,328State Total 1,091 52 1,207 64 160,385 49,968,390 2,294,843 1,721,464 114,726 981,128 .430
NEW MEXICOAPPLES
RBUPAPH 1 1 0 1,1441 0 9 112 49 13 0 .000RCATAPH 9 8 1 17,5788 1 72 1,724 1,724 0 972 .56010Crop Total 9 1 9 1 81 18,722 1,836 1,773 13 972 .530
BARLEYRBUPAPH 12 0 0 00 0 0 0 0 0 0 .000RCATAPH 6 2 0 1,7692 0 105 648 648 0 0 .000
18Crop Total 2 0 2 0 105 1,769 648 648 0 0 .000CHILE PEPPERS
RBUPDOL 22 20 2 1,747,05630 2 2,320 126,295 32,023 18,858 14,683 .120RCATDOL 12 10 0 621,22513 0 1,883 34,105 34,105 0 0 .00034Crop Total 30 2 43 2 4,203 2,368,281 160,400 66,128 18,858 14,683 .090
CORNRBUPAPH 156 76 18 6,008,425168 21 32,028 428,325 141,394 57,408 197,504 .460RCATAPH 258 176 8 4,379,753221 8 50,905 281,344 281,344 0 25,068 .090RBUPCRC 27 13 0 635,89823 0 2,256 59,467 3,974 11,100 0 .000
441Crop Total 265 26 412 29 85,189 11,024,076 769,136 426,712 68,508 222,572 .290COTTON
RBUPAPH 289 166 53 6,028,353344 78 33,638 907,730 266,207 128,342 648,172 .710RCATAPH 304 177 3 3,249,194248 3 23,679 175,020 175,020 0 3,362 .020RBUPCRC 52 29 12 1,196,00776 22 6,724 240,971 35,572 41,088 336,573 1.400645Crop Total 372 68 668 103 64,041 10,473,554 1,323,721 476,799 169,430 988,107 .750
COTTON EX LONG STAPLERBUPAPH 3 2 1 335,0025 2 898 22,973 5,565 3,482 80,790 3.520RCATAPH 59 19 0 352,47133 0 1,759 20,189 20,189 0 0 .000
62Crop Total 21 1 38 2 2,657 687,473 43,162 25,754 3,482 80,790 1.870DRY BEANS
Page 61 3/9/04

Federal Crop Insurance CorporationNationwide Summary - By State/Crop
Delivery Pol Units Units Net Liabilities Total Subsidy Premium IndemnityPol
Indem EarnPrem Indem Acres Premium Discount LossRatioSold EarnPremIns PolPlan ShareCost
Crop Year Statistics For 2000As Of: 03/08/2004
NEW MEXICODRY BEANS
RBUPAPH 33 10 7 1,075,03415 8 5,641 117,165 32,352 16,969 98,895 .840RCATAPH 6 3 1 16,8703 1 200 1,277 1,277 0 9,750 7.64039Crop Total 13 8 18 9 5,841 1,091,904 118,442 33,629 16,969 108,645 .920
GRAIN SORGHUMRBUPAPH 385 213 196 3,056,376596 534 83,023 827,556 256,255 114,328 2,399,695 2.900RCATAPH 411 166 114 446,246196 136 21,882 76,025 76,025 0 181,711 2.390RBUPCRC 102 75 68 1,155,519160 142 21,378 259,587 32,647 45,404 852,365 3.280
898Crop Total 454 378 952 812 126,283 4,658,141 1,163,168 364,927 159,732 3,433,771 2.950HYBRID SORGHUM SEED
RBUPYDO 23 0 0 00 0 0 0 0 0 0 .000RCATYDO 8 1 0 10,0121 0 81 1,604 1,604 0 0 .00031Crop Total 1 0 1 0 81 10,012 1,604 1,604 0 0 .000
NURSERY (FG&C)RCATDOL 3 2 0 440,0002 0 0 4,517 4,517 0 0 .000
3Crop Total 2 0 2 0 0 440,000 4,517 4,517 0 0 .000ONIONS
RBUPAPH 1 1 0 73,3821 0 60 9,180 2,559 1,324 0 .0001Crop Total 1 0 1 0 60 73,382 9,180 2,559 1,324 0 .000
PEANUTSRBUPPNT 50 23 8 1,752,80126 8 5,992 103,328 28,508 14,968 752,281 7.280RCATPNT 114 55 9 2,249,95064 10 12,682 96,227 96,227 0 79,391 .830
164Crop Total 78 17 90 18 18,674 4,002,751 199,555 124,735 14,968 831,672 4.170PECANS
RBUPPRV 58 52 4 9,642,45552 4 7,112 458,096 167,272 58,172 224,068 .490RCATPRV 33 26 0 3,696,87526 0 6,166 202,794 202,794 0 0 .00091Crop Total 78 4 78 4 13,278 13,339,330 660,890 370,066 58,172 224,068 .340
POTATOESRBUPAPH 32 9 4 10,746,51719 10 8,019 802,949 293,350 101,926 951,910 1.190RCATAPH 19 3 0 210,5673 0 245 18,761 18,761 0 0 .000
51Crop Total 12 4 22 10 8,264 10,957,084 821,710 312,111 101,926 951,910 1.160PROCESSING BEANS
RBUPAPH 7 7 4 194,56011 4 579 22,495 9,396 2,620 32,928 1.4607Crop Total 7 4 11 4 579 194,560 22,495 9,396 2,620 32,928 1.460
RYERBUPAPH 1 1 0 7,6981 0 129 672 182 98 0 .000
Page 62 3/9/04
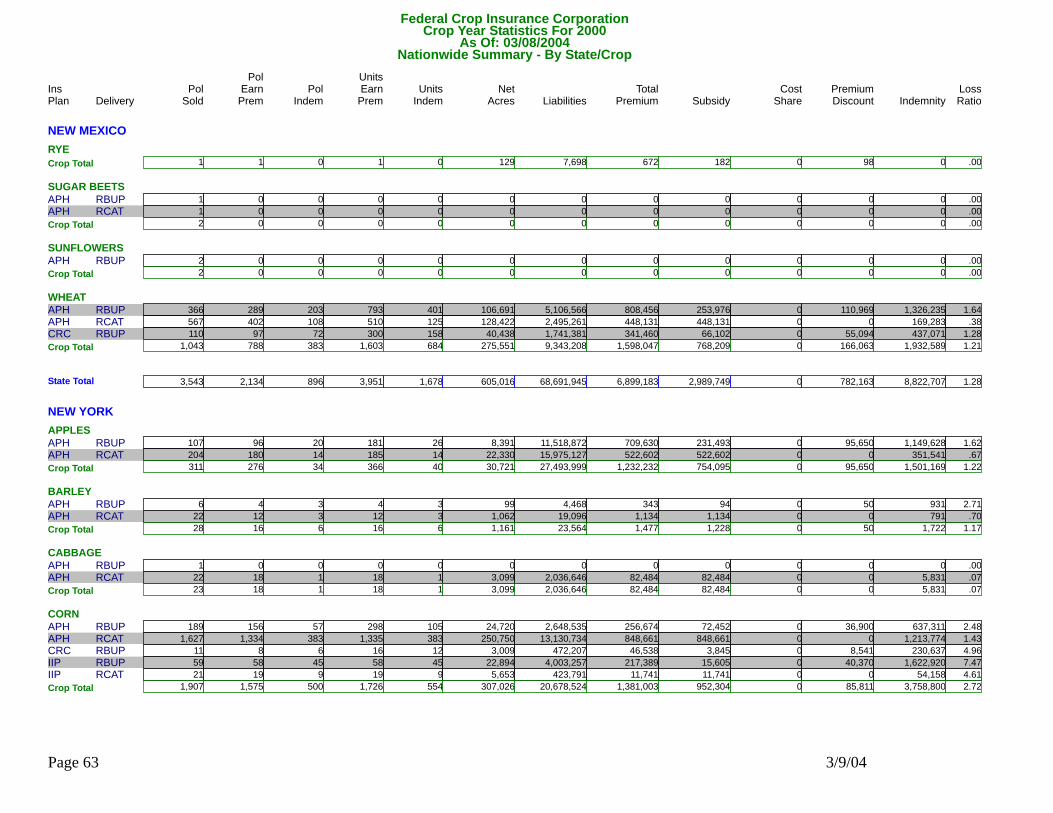
Federal Crop Insurance CorporationNationwide Summary - By State/Crop
Delivery Pol Units Units Net Liabilities Total Subsidy Premium IndemnityPol
Indem EarnPrem Indem Acres Premium Discount LossRatioSold EarnPremIns PolPlan ShareCost
Crop Year Statistics For 2000As Of: 03/08/2004
NEW MEXICORYE
1Crop Total 1 0 1 0 129 7,698 672 182 98 0 .000SUGAR BEETS
RBUPAPH 1 0 0 00 0 0 0 0 0 0 .000RCATAPH 1 0 0 00 0 0 0 0 0 0 .0002Crop Total 0 0 0 0 0 0 0 0 0 0 .000
SUNFLOWERSRBUPAPH 2 0 0 00 0 0 0 0 0 0 .000
2Crop Total 0 0 0 0 0 0 0 0 0 0 .000WHEAT
RBUPAPH 366 289 203 5,106,566793 401 106,691 808,456 253,976 110,969 1,326,235 1.640RCATAPH 567 402 108 2,495,261510 125 128,422 448,131 448,131 0 169,283 .380RBUPCRC 110 97 72 1,741,381300 158 40,438 341,460 66,102 55,094 437,071 1.2801,043Crop Total 788 383 1,603 684 275,551 9,343,208 1,598,047 768,209 166,063 1,932,589 1.210
3,543State Total 2,134 896 3,951 1,678 605,016 68,691,945 6,899,183 2,989,749 782,163 8,822,707 1.280
NEW YORKAPPLES
RBUPAPH 107 96 20 11,518,872181 26 8,391 709,630 231,493 95,650 1,149,628 1.620RCATAPH 204 180 14 15,975,127185 14 22,330 522,602 522,602 0 351,541 .670311Crop Total 276 34 366 40 30,721 27,493,999 1,232,232 754,095 95,650 1,501,169 1.220
BARLEYRBUPAPH 6 4 3 4,4684 3 99 343 94 50 931 2.710RCATAPH 22 12 3 19,09612 3 1,062 1,134 1,134 0 791 .700
28Crop Total 16 6 16 6 1,161 23,564 1,477 1,228 50 1,722 1.170CABBAGE
RBUPAPH 1 0 0 00 0 0 0 0 0 0 .000RCATAPH 22 18 1 2,036,64618 1 3,099 82,484 82,484 0 5,831 .07023Crop Total 18 1 18 1 3,099 2,036,646 82,484 82,484 0 5,831 .070
CORNRBUPAPH 189 156 57 2,648,535298 105 24,720 256,674 72,452 36,900 637,311 2.480RCATAPH 1,627 1,334 383 13,130,7341,335 383 250,750 848,661 848,661 0 1,213,774 1.430RBUPCRC 11 8 6 472,20716 12 3,009 46,538 3,845 8,541 230,637 4.960RBUPIIP 59 58 45 4,003,25758 45 22,894 217,389 15,605 40,370 1,622,920 7.470RCATIIP 21 19 9 423,79119 9 5,653 11,741 11,741 0 54,158 4.610
1,907Crop Total 1,575 500 1,726 554 307,026 20,678,524 1,381,003 952,304 85,811 3,758,800 2.720
Page 63 3/9/04
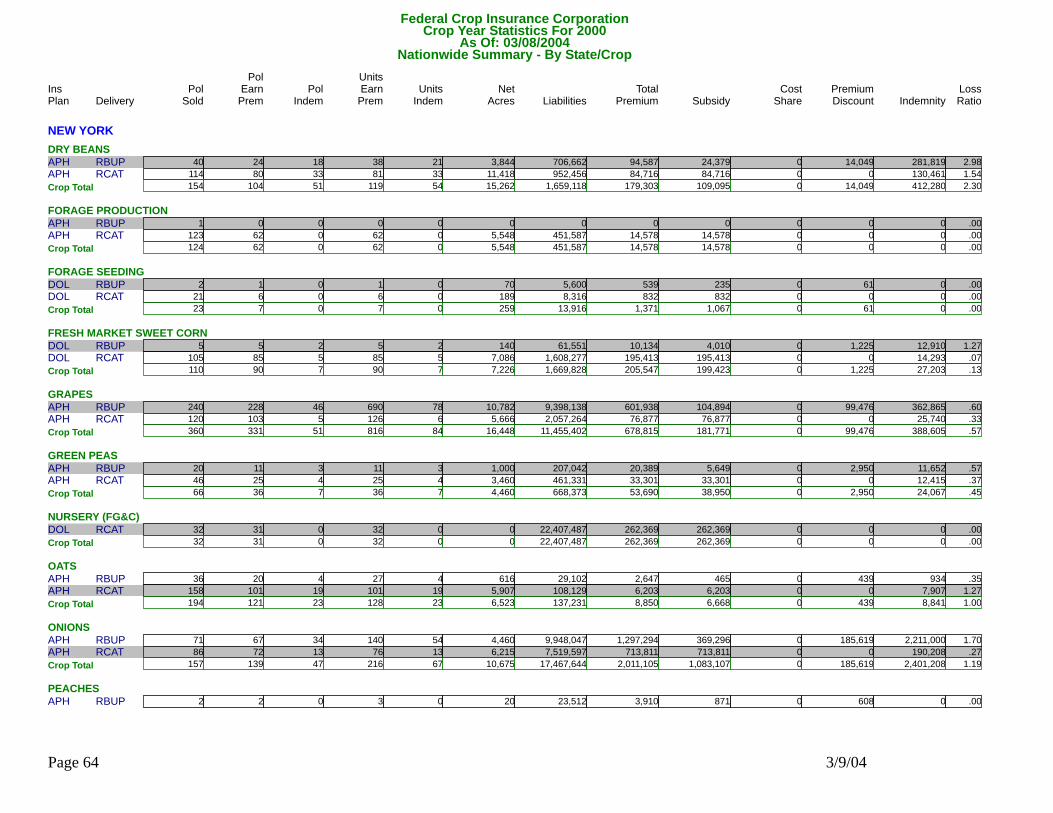
Federal Crop Insurance CorporationNationwide Summary - By State/Crop
Delivery Pol Units Units Net Liabilities Total Subsidy Premium IndemnityPol
Indem EarnPrem Indem Acres Premium Discount LossRatioSold EarnPremIns PolPlan ShareCost
Crop Year Statistics For 2000As Of: 03/08/2004
NEW YORKDRY BEANS
RBUPAPH 40 24 18 706,66238 21 3,844 94,587 24,379 14,049 281,819 2.980RCATAPH 114 80 33 952,45681 33 11,418 84,716 84,716 0 130,461 1.540154Crop Total 104 51 119 54 15,262 1,659,118 179,303 109,095 14,049 412,280 2.300
FORAGE PRODUCTIONRBUPAPH 1 0 0 00 0 0 0 0 0 0 .000RCATAPH 123 62 0 451,58762 0 5,548 14,578 14,578 0 0 .000
124Crop Total 62 0 62 0 5,548 451,587 14,578 14,578 0 0 .000FORAGE SEEDING
RBUPDOL 2 1 0 5,6001 0 70 539 235 61 0 .000RCATDOL 21 6 0 8,3166 0 189 832 832 0 0 .00023Crop Total 7 0 7 0 259 13,916 1,371 1,067 61 0 .000
FRESH MARKET SWEET CORNRBUPDOL 5 5 2 61,5515 2 140 10,134 4,010 1,225 12,910 1.270RCATDOL 105 85 5 1,608,27785 5 7,086 195,413 195,413 0 14,293 .070
110Crop Total 90 7 90 7 7,226 1,669,828 205,547 199,423 1,225 27,203 .130GRAPES
RBUPAPH 240 228 46 9,398,138690 78 10,782 601,938 104,894 99,476 362,865 .600RCATAPH 120 103 5 2,057,264126 6 5,666 76,877 76,877 0 25,740 .330360Crop Total 331 51 816 84 16,448 11,455,402 678,815 181,771 99,476 388,605 .570
GREEN PEASRBUPAPH 20 11 3 207,04211 3 1,000 20,389 5,649 2,950 11,652 .570RCATAPH 46 25 4 461,33125 4 3,460 33,301 33,301 0 12,415 .370
66Crop Total 36 7 36 7 4,460 668,373 53,690 38,950 2,950 24,067 .450NURSERY (FG&C)
RCATDOL 32 31 0 22,407,48732 0 0 262,369 262,369 0 0 .00032Crop Total 31 0 32 0 0 22,407,487 262,369 262,369 0 0 .000
OATSRBUPAPH 36 20 4 29,10227 4 616 2,647 465 439 934 .350RCATAPH 158 101 19 108,129101 19 5,907 6,203 6,203 0 7,907 1.270
194Crop Total 121 23 128 23 6,523 137,231 8,850 6,668 439 8,841 1.000ONIONS
RBUPAPH 71 67 34 9,948,047140 54 4,460 1,297,294 369,296 185,619 2,211,000 1.700RCATAPH 86 72 13 7,519,59776 13 6,215 713,811 713,811 0 190,208 .270157Crop Total 139 47 216 67 10,675 17,467,644 2,011,105 1,083,107 185,619 2,401,208 1.190
PEACHESRBUPAPH 2 2 0 23,5123 0 20 3,910 871 608 0 .000
Page 64 3/9/04
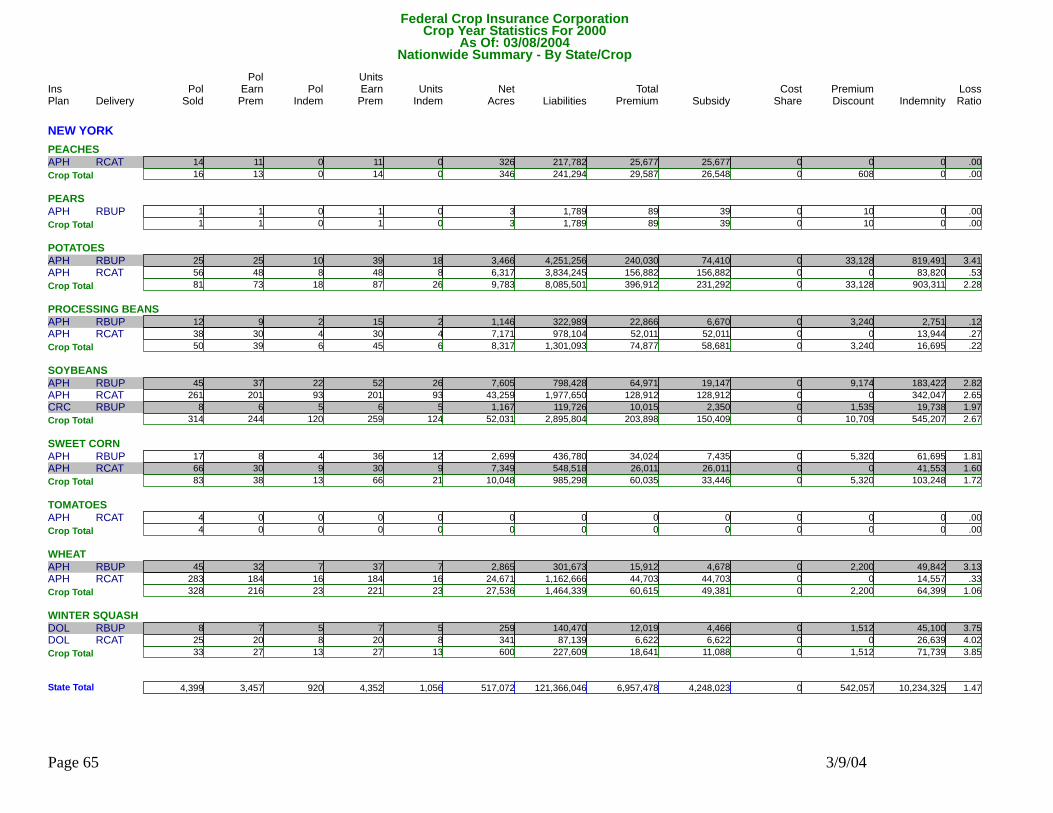
Federal Crop Insurance CorporationNationwide Summary - By State/Crop
Delivery Pol Units Units Net Liabilities Total Subsidy Premium IndemnityPol
Indem EarnPrem Indem Acres Premium Discount LossRatioSold EarnPremIns PolPlan ShareCost
Crop Year Statistics For 2000As Of: 03/08/2004
NEW YORKPEACHES
RCATAPH 14 11 0 217,78211 0 326 25,677 25,677 0 0 .00016Crop Total 13 0 14 0 346 241,294 29,587 26,548 608 0 .000
PEARSRBUPAPH 1 1 0 1,7891 0 3 89 39 10 0 .000
1Crop Total 1 0 1 0 3 1,789 89 39 10 0 .000POTATOES
RBUPAPH 25 25 10 4,251,25639 18 3,466 240,030 74,410 33,128 819,491 3.410RCATAPH 56 48 8 3,834,24548 8 6,317 156,882 156,882 0 83,820 .53081Crop Total 73 18 87 26 9,783 8,085,501 396,912 231,292 33,128 903,311 2.280
PROCESSING BEANSRBUPAPH 12 9 2 322,98915 2 1,146 22,866 6,670 3,240 2,751 .120RCATAPH 38 30 4 978,10430 4 7,171 52,011 52,011 0 13,944 .270
50Crop Total 39 6 45 6 8,317 1,301,093 74,877 58,681 3,240 16,695 .220SOYBEANS
RBUPAPH 45 37 22 798,42852 26 7,605 64,971 19,147 9,174 183,422 2.820RCATAPH 261 201 93 1,977,650201 93 43,259 128,912 128,912 0 342,047 2.650RBUPCRC 8 6 5 119,7266 5 1,167 10,015 2,350 1,535 19,738 1.970314Crop Total 244 120 259 124 52,031 2,895,804 203,898 150,409 10,709 545,207 2.670
SWEET CORNRBUPAPH 17 8 4 436,78036 12 2,699 34,024 7,435 5,320 61,695 1.810RCATAPH 66 30 9 548,51830 9 7,349 26,011 26,011 0 41,553 1.600
83Crop Total 38 13 66 21 10,048 985,298 60,035 33,446 5,320 103,248 1.720TOMATOES
RCATAPH 4 0 0 00 0 0 0 0 0 0 .0004Crop Total 0 0 0 0 0 0 0 0 0 0 .000
WHEATRBUPAPH 45 32 7 301,67337 7 2,865 15,912 4,678 2,200 49,842 3.130RCATAPH 283 184 16 1,162,666184 16 24,671 44,703 44,703 0 14,557 .330
328Crop Total 216 23 221 23 27,536 1,464,339 60,615 49,381 2,200 64,399 1.060WINTER SQUASH
RBUPDOL 8 7 5 140,4707 5 259 12,019 4,466 1,512 45,100 3.750RCATDOL 25 20 8 87,13920 8 341 6,622 6,622 0 26,639 4.02033Crop Total 27 13 27 13 600 227,609 18,641 11,088 1,512 71,739 3.850
4,399State Total 3,457 920 4,352 1,056 517,072 121,366,046 6,957,478 4,248,023 542,057 10,234,325 1.470
Page 65 3/9/04
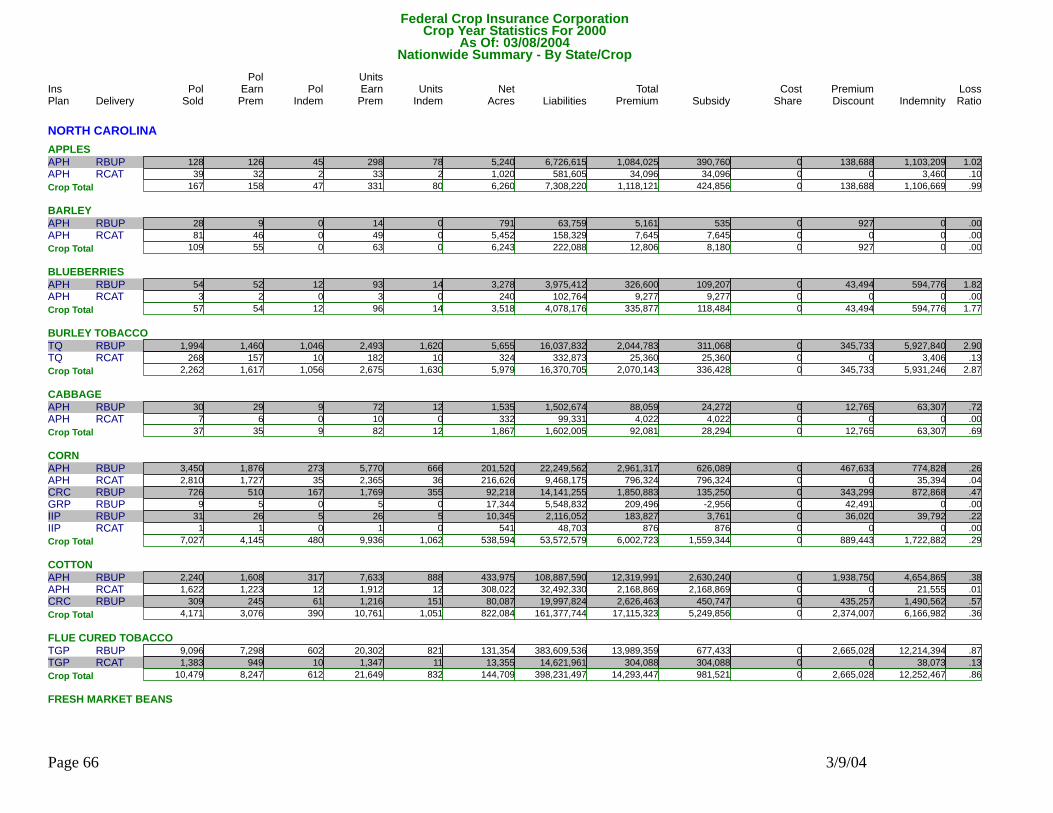
Federal Crop Insurance CorporationNationwide Summary - By State/Crop
Delivery Pol Units Units Net Liabilities Total Subsidy Premium IndemnityPol
Indem EarnPrem Indem Acres Premium Discount LossRatioSold EarnPremIns PolPlan ShareCost
Crop Year Statistics For 2000As Of: 03/08/2004
NORTH CAROLINAAPPLES
RBUPAPH 128 126 45 6,726,615298 78 5,240 1,084,025 390,760 138,688 1,103,209 1.020RCATAPH 39 32 2 581,60533 2 1,020 34,096 34,096 0 3,460 .100167Crop Total 158 47 331 80 6,260 7,308,220 1,118,121 424,856 138,688 1,106,669 .990
BARLEYRBUPAPH 28 9 0 63,75914 0 791 5,161 535 927 0 .000RCATAPH 81 46 0 158,32949 0 5,452 7,645 7,645 0 0 .000
109Crop Total 55 0 63 0 6,243 222,088 12,806 8,180 927 0 .000BLUEBERRIES
RBUPAPH 54 52 12 3,975,41293 14 3,278 326,600 109,207 43,494 594,776 1.820RCATAPH 3 2 0 102,7643 0 240 9,277 9,277 0 0 .00057Crop Total 54 12 96 14 3,518 4,078,176 335,877 118,484 43,494 594,776 1.770
BURLEY TOBACCORBUPTQ 1,994 1,460 1,046 16,037,8322,493 1,620 5,655 2,044,783 311,068 345,733 5,927,840 2.900RCATTQ 268 157 10 332,873182 10 324 25,360 25,360 0 3,406 .130
2,262Crop Total 1,617 1,056 2,675 1,630 5,979 16,370,705 2,070,143 336,428 345,733 5,931,246 2.870CABBAGE
RBUPAPH 30 29 9 1,502,67472 12 1,535 88,059 24,272 12,765 63,307 .720RCATAPH 7 6 0 99,33110 0 332 4,022 4,022 0 0 .00037Crop Total 35 9 82 12 1,867 1,602,005 92,081 28,294 12,765 63,307 .690
CORNRBUPAPH 3,450 1,876 273 22,249,5625,770 666 201,520 2,961,317 626,089 467,633 774,828 .260RCATAPH 2,810 1,727 35 9,468,1752,365 36 216,626 796,324 796,324 0 35,394 .040RBUPCRC 726 510 167 14,141,2551,769 355 92,218 1,850,883 135,250 343,299 872,868 .470RBUPGRP 9 5 0 5,548,8325 0 17,344 209,496 -2,956 42,491 0 .000RBUPIIP 31 26 5 2,116,05226 5 10,345 183,827 3,761 36,020 39,792 .220RCATIIP 1 1 0 48,7031 0 541 876 876 0 0 .000
7,027Crop Total 4,145 480 9,936 1,062 538,594 53,572,579 6,002,723 1,559,344 889,443 1,722,882 .290COTTON
RBUPAPH 2,240 1,608 317 108,887,5907,633 888 433,975 12,319,991 2,630,240 1,938,750 4,654,865 .380RCATAPH 1,622 1,223 12 32,492,3301,912 12 308,022 2,168,869 2,168,869 0 21,555 .010RBUPCRC 309 245 61 19,997,8241,216 151 80,087 2,626,463 450,747 435,257 1,490,562 .5704,171Crop Total 3,076 390 10,761 1,051 822,084 161,377,744 17,115,323 5,249,856 2,374,007 6,166,982 .360
FLUE CURED TOBACCORBUPTGP 9,096 7,298 602 383,609,53620,302 821 131,354 13,989,359 677,433 2,665,028 12,214,394 .870RCATTGP 1,383 949 10 14,621,9611,347 11 13,355 304,088 304,088 0 38,073 .130
10,479Crop Total 8,247 612 21,649 832 144,709 398,231,497 14,293,447 981,521 2,665,028 12,252,467 .860FRESH MARKET BEANS
Page 66 3/9/04
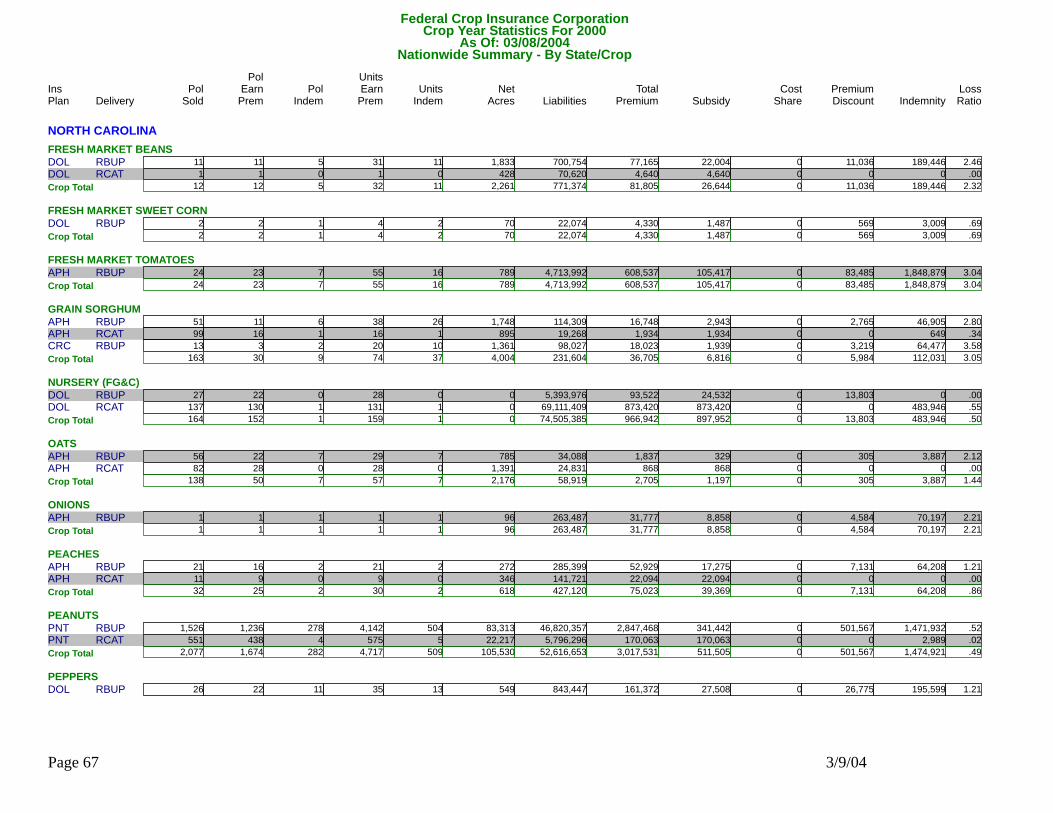
Federal Crop Insurance CorporationNationwide Summary - By State/Crop
Delivery Pol Units Units Net Liabilities Total Subsidy Premium IndemnityPol
Indem EarnPrem Indem Acres Premium Discount LossRatioSold EarnPremIns PolPlan ShareCost
Crop Year Statistics For 2000As Of: 03/08/2004
NORTH CAROLINAFRESH MARKET BEANS
RBUPDOL 11 11 5 700,75431 11 1,833 77,165 22,004 11,036 189,446 2.460RCATDOL 1 1 0 70,6201 0 428 4,640 4,640 0 0 .00012Crop Total 12 5 32 11 2,261 771,374 81,805 26,644 11,036 189,446 2.320
FRESH MARKET SWEET CORNRBUPDOL 2 2 1 22,0744 2 70 4,330 1,487 569 3,009 .690
2Crop Total 2 1 4 2 70 22,074 4,330 1,487 569 3,009 .690FRESH MARKET TOMATOES
RBUPAPH 24 23 7 4,713,99255 16 789 608,537 105,417 83,485 1,848,879 3.04024Crop Total 23 7 55 16 789 4,713,992 608,537 105,417 83,485 1,848,879 3.040
GRAIN SORGHUMRBUPAPH 51 11 6 114,30938 26 1,748 16,748 2,943 2,765 46,905 2.800RCATAPH 99 16 1 19,26816 1 895 1,934 1,934 0 649 .340RBUPCRC 13 3 2 98,02720 10 1,361 18,023 1,939 3,219 64,477 3.580
163Crop Total 30 9 74 37 4,004 231,604 36,705 6,816 5,984 112,031 3.050NURSERY (FG&C)
RBUPDOL 27 22 0 5,393,97628 0 0 93,522 24,532 13,803 0 .000RCATDOL 137 130 1 69,111,409131 1 0 873,420 873,420 0 483,946 .550164Crop Total 152 1 159 1 0 74,505,385 966,942 897,952 13,803 483,946 .500
OATSRBUPAPH 56 22 7 34,08829 7 785 1,837 329 305 3,887 2.120RCATAPH 82 28 0 24,83128 0 1,391 868 868 0 0 .000
138Crop Total 50 7 57 7 2,176 58,919 2,705 1,197 305 3,887 1.440ONIONS
RBUPAPH 1 1 1 263,4871 1 96 31,777 8,858 4,584 70,197 2.2101Crop Total 1 1 1 1 96 263,487 31,777 8,858 4,584 70,197 2.210
PEACHESRBUPAPH 21 16 2 285,39921 2 272 52,929 17,275 7,131 64,208 1.210RCATAPH 11 9 0 141,7219 0 346 22,094 22,094 0 0 .000
32Crop Total 25 2 30 2 618 427,120 75,023 39,369 7,131 64,208 .860PEANUTS
RBUPPNT 1,526 1,236 278 46,820,3574,142 504 83,313 2,847,468 341,442 501,567 1,471,932 .520RCATPNT 551 438 4 5,796,296575 5 22,217 170,063 170,063 0 2,989 .0202,077Crop Total 1,674 282 4,717 509 105,530 52,616,653 3,017,531 511,505 501,567 1,474,921 .490
PEPPERSRBUPDOL 26 22 11 843,44735 13 549 161,372 27,508 26,775 195,599 1.210
Page 67 3/9/04
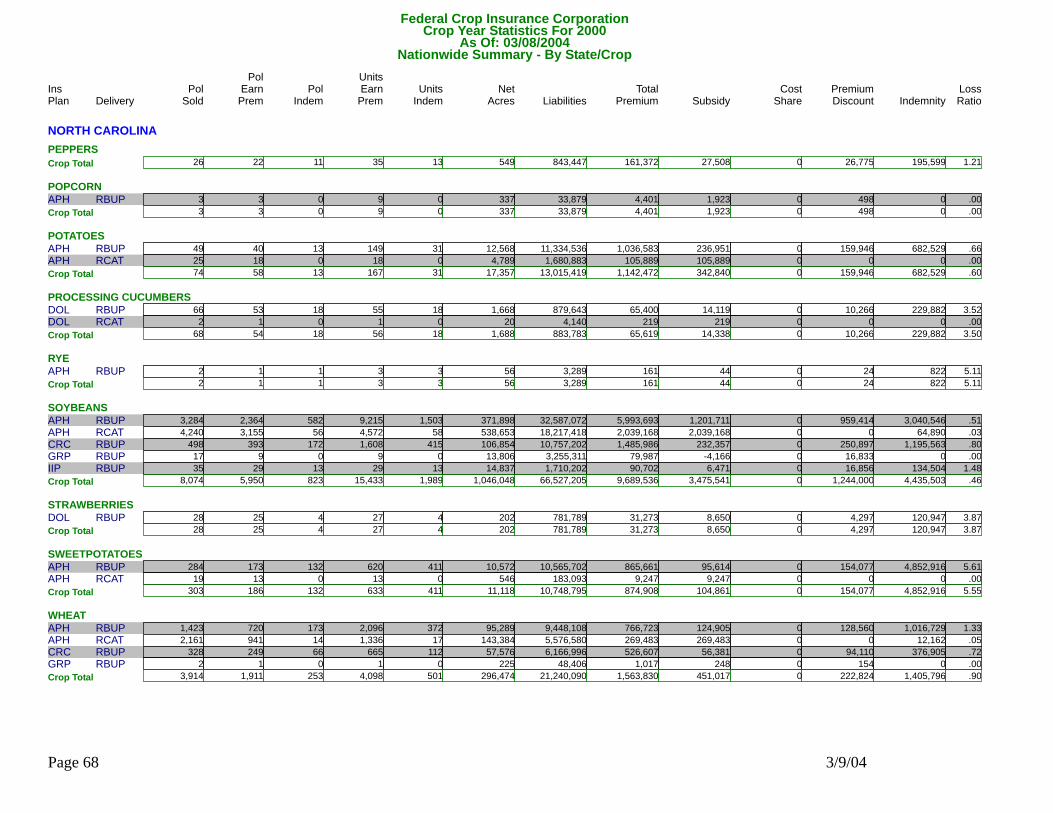
Federal Crop Insurance CorporationNationwide Summary - By State/Crop
Delivery Pol Units Units Net Liabilities Total Subsidy Premium IndemnityPol
Indem EarnPrem Indem Acres Premium Discount LossRatioSold EarnPremIns PolPlan ShareCost
Crop Year Statistics For 2000As Of: 03/08/2004
NORTH CAROLINAPEPPERS
26Crop Total 22 11 35 13 549 843,447 161,372 27,508 26,775 195,599 1.210POPCORN
RBUPAPH 3 3 0 33,8799 0 337 4,401 1,923 498 0 .0003Crop Total 3 0 9 0 337 33,879 4,401 1,923 498 0 .000
POTATOESRBUPAPH 49 40 13 11,334,536149 31 12,568 1,036,583 236,951 159,946 682,529 .660RCATAPH 25 18 0 1,680,88318 0 4,789 105,889 105,889 0 0 .000
74Crop Total 58 13 167 31 17,357 13,015,419 1,142,472 342,840 159,946 682,529 .600PROCESSING CUCUMBERS
RBUPDOL 66 53 18 879,64355 18 1,668 65,400 14,119 10,266 229,882 3.520RCATDOL 2 1 0 4,1401 0 20 219 219 0 0 .00068Crop Total 54 18 56 18 1,688 883,783 65,619 14,338 10,266 229,882 3.500
RYERBUPAPH 2 1 1 3,2893 3 56 161 44 24 822 5.110
2Crop Total 1 1 3 3 56 3,289 161 44 24 822 5.110SOYBEANS
RBUPAPH 3,284 2,364 582 32,587,0729,215 1,503 371,898 5,993,693 1,201,711 959,414 3,040,546 .510RCATAPH 4,240 3,155 56 18,217,4184,572 58 538,653 2,039,168 2,039,168 0 64,890 .030RBUPCRC 498 393 172 10,757,2021,608 415 106,854 1,485,986 232,357 250,897 1,195,563 .800RBUPGRP 17 9 0 3,255,3119 0 13,806 79,987 -4,166 16,833 0 .000RBUPIIP 35 29 13 1,710,20229 13 14,837 90,702 6,471 16,856 134,504 1.4808,074Crop Total 5,950 823 15,433 1,989 1,046,048 66,527,205 9,689,536 3,475,541 1,244,000 4,435,503 .460
STRAWBERRIESRBUPDOL 28 25 4 781,78927 4 202 31,273 8,650 4,297 120,947 3.870
28Crop Total 25 4 27 4 202 781,789 31,273 8,650 4,297 120,947 3.870SWEETPOTATOES
RBUPAPH 284 173 132 10,565,702620 411 10,572 865,661 95,614 154,077 4,852,916 5.610RCATAPH 19 13 0 183,09313 0 546 9,247 9,247 0 0 .000303Crop Total 186 132 633 411 11,118 10,748,795 874,908 104,861 154,077 4,852,916 5.550
WHEATRBUPAPH 1,423 720 173 9,448,1082,096 372 95,289 766,723 124,905 128,560 1,016,729 1.330RCATAPH 2,161 941 14 5,576,5801,336 17 143,384 269,483 269,483 0 12,162 .050RBUPCRC 328 249 66 6,166,996665 112 57,576 526,607 56,381 94,110 376,905 .720RBUPGRP 2 1 0 48,4061 0 225 1,017 248 154 0 .000
3,914Crop Total 1,911 253 4,098 501 296,474 21,240,090 1,563,830 451,017 222,824 1,405,796 .900
Page 68 3/9/04

Federal Crop Insurance CorporationNationwide Summary - By State/Crop
Delivery Pol Units Units Net Liabilities Total Subsidy Premium IndemnityPol
Indem EarnPrem Indem Acres Premium Discount LossRatioSold EarnPremIns PolPlan ShareCost
Crop Year Statistics For 2000As Of: 03/08/2004
NORTH CAROLINA39,414State Total 27,566 4,176 71,183 8,237 3,018,627 890,451,318 59,399,448 14,732,930 8,921,256 44,012,847 .740
NORTH DAKOTABARLEY
RBUPAPH 20,593 8,550 2,358 63,705,76619,651 3,589 1,281,879 6,438,984 1,575,790 974,666 6,316,835 .980RCATAPH 3,297 1,463 163 4,077,3661,837 170 207,398 308,203 308,203 0 94,400 .310RBUPIP 1,295 763 395 11,157,485828 422 137,290 1,056,529 13,630 208,720 2,459,646 2.330RBUPRA 1,103 740 286 11,145,0152,083 542 161,609 1,260,869 82,254 234,677 1,327,408 1.05026,288Crop Total 11,516 3,202 24,399 4,723 1,788,176 90,085,632 9,064,585 1,979,877 1,418,063 10,198,289 1.130
CANOLARBUPAPH 11,552 5,905 1,904 88,406,43214,300 2,942 1,046,269 10,215,054 1,841,782 1,676,135 7,809,971 .760RCATAPH 917 456 44 1,693,518594 47 65,193 147,367 147,367 0 27,483 .190RBUPRA 89 59 21 1,000,834110 28 13,541 96,876 10,342 17,324 -1,110 -.010
12,558Crop Total 6,420 1,969 15,004 3,017 1,125,003 91,100,784 10,459,297 1,999,491 1,693,459 7,836,344 .750CORN
RBUPAPH 6,525 2,798 648 43,813,5566,225 955 463,026 5,611,943 1,644,375 794,143 2,372,127 .420RCATAPH 2,507 1,453 102 8,999,7901,656 102 224,173 816,142 816,142 0 78,688 .100RBUPCRC 1,280 802 332 39,055,9732,565 696 252,157 6,049,486 333,907 1,143,409 5,393,618 .890RBUPRA 170 111 59 6,555,658387 106 40,863 909,187 62,829 169,330 921,633 1.01010,482Crop Total 5,164 1,141 10,833 1,859 980,219 98,424,977 13,386,758 2,857,253 2,106,882 8,766,066 .650
CRAMBERBUPAPH 376 109 20 1,401,943215 32 16,803 173,123 43,213 26,003 87,299 .500RCATAPH 34 8 0 51,4419 0 1,500 5,528 5,528 0 0 .000
410Crop Total 117 20 224 32 18,303 1,453,384 178,651 48,741 26,003 87,299 .490DRY BEANS
RBUPAPH 7,583 2,809 1,376 94,268,9808,960 3,073 601,396 15,412,485 3,634,977 2,334,732 22,706,313 1.470RCATAPH 568 207 33 1,761,591279 38 28,657 209,726 209,726 0 72,703 .3508,151Crop Total 3,016 1,409 9,239 3,111 630,053 96,030,571 15,622,211 3,844,703 2,334,732 22,779,016 1.460
DRY PEASRBUPAPH 1,648 400 80 3,675,219884 117 61,497 551,462 159,434 78,518 270,315 .490RCATAPH 186 83 6 422,748117 6 15,130 47,310 47,310 0 9,960 .210
1,834Crop Total 483 86 1,001 123 76,627 4,097,967 598,772 206,744 78,518 280,275 .470FLAX
RBUPAPH 10,199 2,849 659 17,709,3565,394 896 328,548 2,235,740 584,705 330,734 1,316,766 .590RCATAPH 1,359 510 42 1,519,580641 47 70,346 142,075 142,075 0 30,942 .22011,558Crop Total 3,359 701 6,035 943 398,894 19,228,936 2,377,815 726,780 330,734 1,347,708 .570
FORAGE PRODUCTIONRBUPAPH 236 131 29 1,908,549147 31 22,723 159,481 40,809 23,763 282,107 1.770
Page 69 3/9/04
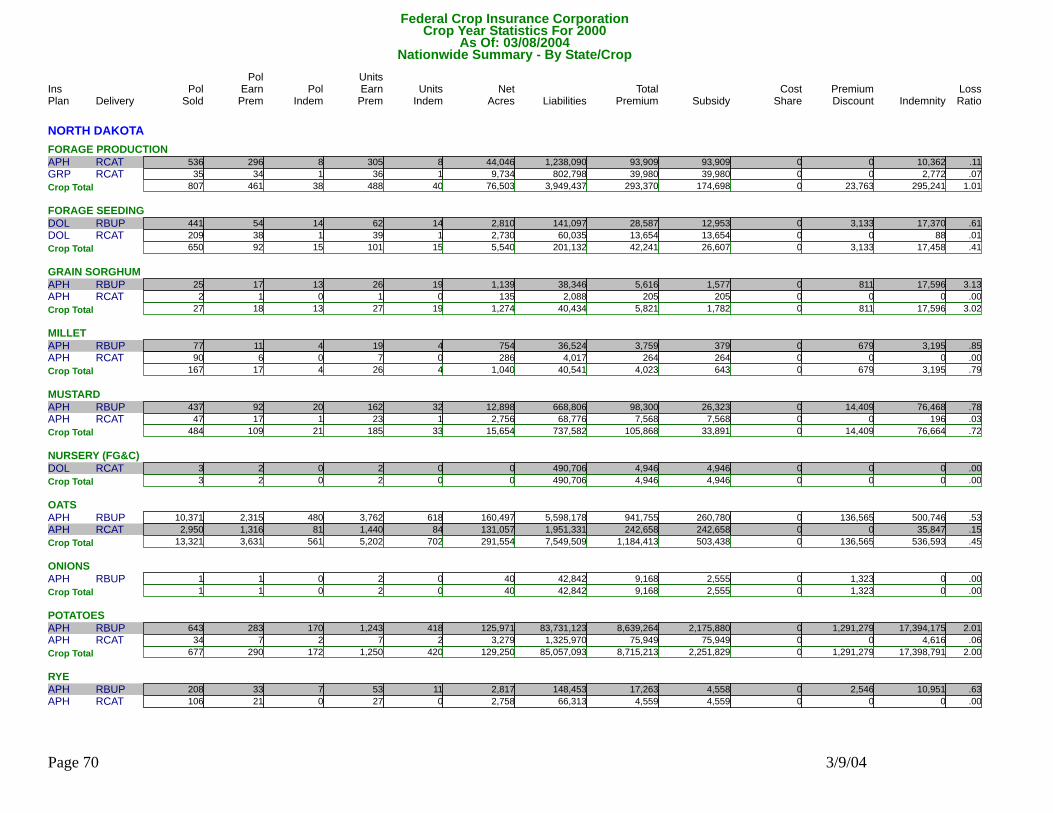
Federal Crop Insurance CorporationNationwide Summary - By State/Crop
Delivery Pol Units Units Net Liabilities Total Subsidy Premium IndemnityPol
Indem EarnPrem Indem Acres Premium Discount LossRatioSold EarnPremIns PolPlan ShareCost
Crop Year Statistics For 2000As Of: 03/08/2004
NORTH DAKOTAFORAGE PRODUCTION
RCATAPH 536 296 8 1,238,090305 8 44,046 93,909 93,909 0 10,362 .110RCATGRP 35 34 1 802,79836 1 9,734 39,980 39,980 0 2,772 .070807Crop Total 461 38 488 40 76,503 3,949,437 293,370 174,698 23,763 295,241 1.010
FORAGE SEEDINGRBUPDOL 441 54 14 141,09762 14 2,810 28,587 12,953 3,133 17,370 .610RCATDOL 209 38 1 60,03539 1 2,730 13,654 13,654 0 88 .010
650Crop Total 92 15 101 15 5,540 201,132 42,241 26,607 3,133 17,458 .410GRAIN SORGHUM
RBUPAPH 25 17 13 38,34626 19 1,139 5,616 1,577 811 17,596 3.130RCATAPH 2 1 0 2,0881 0 135 205 205 0 0 .00027Crop Total 18 13 27 19 1,274 40,434 5,821 1,782 811 17,596 3.020
MILLETRBUPAPH 77 11 4 36,52419 4 754 3,759 379 679 3,195 .850RCATAPH 90 6 0 4,0177 0 286 264 264 0 0 .000
167Crop Total 17 4 26 4 1,040 40,541 4,023 643 679 3,195 .790MUSTARD
RBUPAPH 437 92 20 668,806162 32 12,898 98,300 26,323 14,409 76,468 .780RCATAPH 47 17 1 68,77623 1 2,756 7,568 7,568 0 196 .030484Crop Total 109 21 185 33 15,654 737,582 105,868 33,891 14,409 76,664 .720
NURSERY (FG&C)RCATDOL 3 2 0 490,7062 0 0 4,946 4,946 0 0 .000
3Crop Total 2 0 2 0 0 490,706 4,946 4,946 0 0 .000OATS
RBUPAPH 10,371 2,315 480 5,598,1783,762 618 160,497 941,755 260,780 136,565 500,746 .530RCATAPH 2,950 1,316 81 1,951,3311,440 84 131,057 242,658 242,658 0 35,847 .15013,321Crop Total 3,631 561 5,202 702 291,554 7,549,509 1,184,413 503,438 136,565 536,593 .450
ONIONSRBUPAPH 1 1 0 42,8422 0 40 9,168 2,555 1,323 0 .000
1Crop Total 1 0 2 0 40 42,842 9,168 2,555 1,323 0 .000POTATOES
RBUPAPH 643 283 170 83,731,1231,243 418 125,971 8,639,264 2,175,880 1,291,279 17,394,175 2.010RCATAPH 34 7 2 1,325,9707 2 3,279 75,949 75,949 0 4,616 .060677Crop Total 290 172 1,250 420 129,250 85,057,093 8,715,213 2,251,829 1,291,279 17,398,791 2.000
RYERBUPAPH 208 33 7 148,45353 11 2,817 17,263 4,558 2,546 10,951 .630RCATAPH 106 21 0 66,31327 0 2,758 4,559 4,559 0 0 .000
Page 70 3/9/04
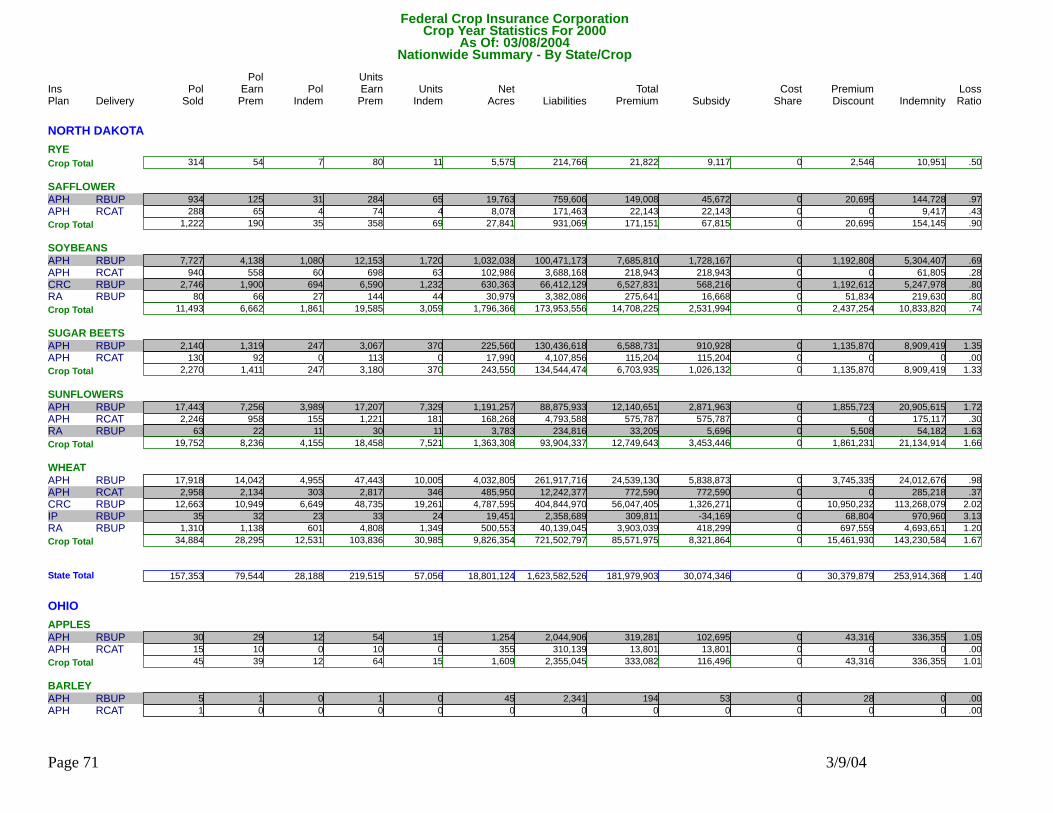
Federal Crop Insurance CorporationNationwide Summary - By State/Crop
Delivery Pol Units Units Net Liabilities Total Subsidy Premium IndemnityPol
Indem EarnPrem Indem Acres Premium Discount LossRatioSold EarnPremIns PolPlan ShareCost
Crop Year Statistics For 2000As Of: 03/08/2004
NORTH DAKOTARYE
314Crop Total 54 7 80 11 5,575 214,766 21,822 9,117 2,546 10,951 .500SAFFLOWER
RBUPAPH 934 125 31 759,606284 65 19,763 149,008 45,672 20,695 144,728 .970RCATAPH 288 65 4 171,46374 4 8,078 22,143 22,143 0 9,417 .4301,222Crop Total 190 35 358 69 27,841 931,069 171,151 67,815 20,695 154,145 .900
SOYBEANSRBUPAPH 7,727 4,138 1,080 100,471,17312,153 1,720 1,032,038 7,685,810 1,728,167 1,192,808 5,304,407 .690RCATAPH 940 558 60 3,688,168698 63 102,986 218,943 218,943 0 61,805 .280RBUPCRC 2,746 1,900 694 66,412,1296,590 1,232 630,363 6,527,831 568,216 1,192,612 5,247,978 .800RBUPRA 80 66 27 3,382,086144 44 30,979 275,641 16,668 51,834 219,630 .800
11,493Crop Total 6,662 1,861 19,585 3,059 1,796,366 173,953,556 14,708,225 2,531,994 2,437,254 10,833,820 .740SUGAR BEETS
RBUPAPH 2,140 1,319 247 130,436,6183,067 370 225,560 6,588,731 910,928 1,135,870 8,909,419 1.350RCATAPH 130 92 0 4,107,856113 0 17,990 115,204 115,204 0 0 .0002,270Crop Total 1,411 247 3,180 370 243,550 134,544,474 6,703,935 1,026,132 1,135,870 8,909,419 1.330
SUNFLOWERSRBUPAPH 17,443 7,256 3,989 88,875,93317,207 7,329 1,191,257 12,140,651 2,871,963 1,855,723 20,905,615 1.720RCATAPH 2,246 958 155 4,793,5881,221 181 168,268 575,787 575,787 0 175,117 .300RBUPRA 63 22 11 234,81630 11 3,783 33,205 5,696 5,508 54,182 1.630
19,752Crop Total 8,236 4,155 18,458 7,521 1,363,308 93,904,337 12,749,643 3,453,446 1,861,231 21,134,914 1.660WHEAT
RBUPAPH 17,918 14,042 4,955 261,917,71647,443 10,005 4,032,805 24,539,130 5,838,873 3,745,335 24,012,676 .980RCATAPH 2,958 2,134 303 12,242,3772,817 346 485,950 772,590 772,590 0 285,218 .370RBUPCRC 12,663 10,949 6,649 404,844,97048,735 19,261 4,787,595 56,047,405 1,326,271 10,950,232 113,268,079 2.020RBUPIP 35 32 23 2,358,68933 24 19,451 309,811 -34,169 68,804 970,960 3.130RBUPRA 1,310 1,138 601 40,139,0454,808 1,349 500,553 3,903,039 418,299 697,559 4,693,651 1.20034,884Crop Total 28,295 12,531 103,836 30,985 9,826,354 721,502,797 85,571,975 8,321,864 15,461,930 143,230,584 1.670
157,353State Total 79,544 28,188 219,515 57,056 18,801,124 1,623,582,526 181,979,903 30,074,346 30,379,879 253,914,368 1.400
OHIOAPPLES
RBUPAPH 30 29 12 2,044,90654 15 1,254 319,281 102,695 43,316 336,355 1.050RCATAPH 15 10 0 310,13910 0 355 13,801 13,801 0 0 .00045Crop Total 39 12 64 15 1,609 2,355,045 333,082 116,496 43,316 336,355 1.010
BARLEYRBUPAPH 5 1 0 2,3411 0 45 194 53 28 0 .000RCATAPH 1 0 0 00 0 0 0 0 0 0 .000
Page 71 3/9/04
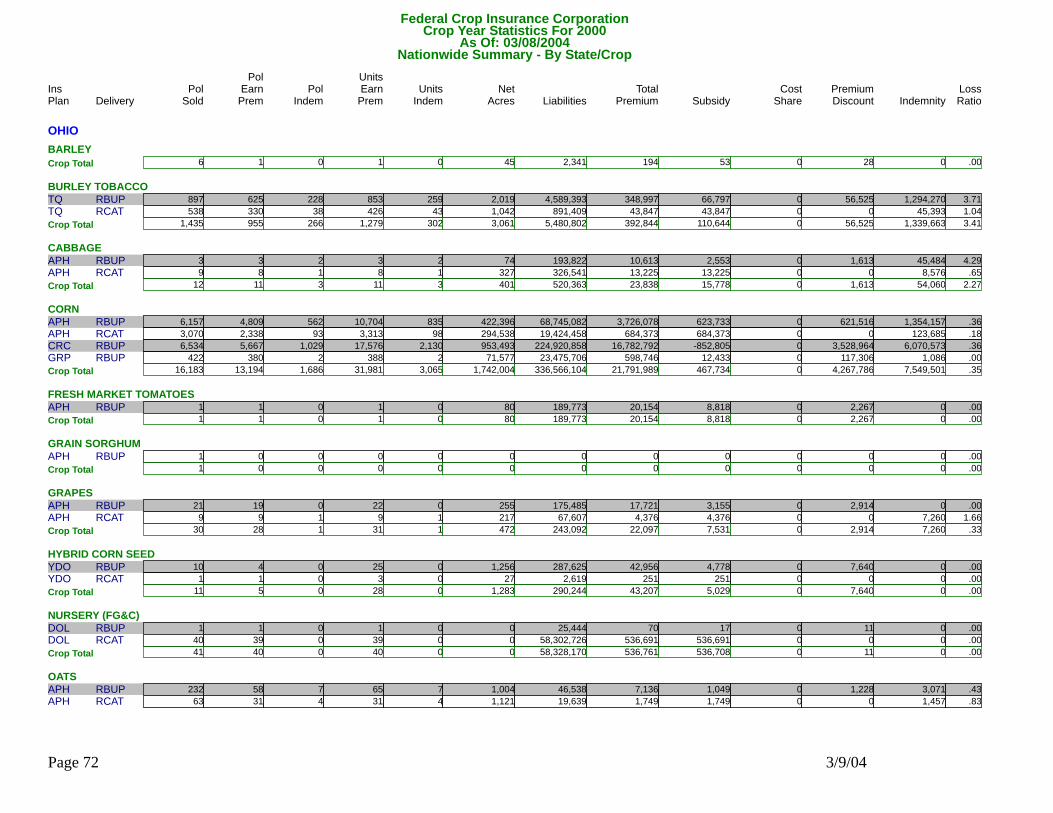
Federal Crop Insurance CorporationNationwide Summary - By State/Crop
Delivery Pol Units Units Net Liabilities Total Subsidy Premium IndemnityPol
Indem EarnPrem Indem Acres Premium Discount LossRatioSold EarnPremIns PolPlan ShareCost
Crop Year Statistics For 2000As Of: 03/08/2004
OHIOBARLEY
6Crop Total 1 0 1 0 45 2,341 194 53 28 0 .000BURLEY TOBACCO
RBUPTQ 897 625 228 4,589,393853 259 2,019 348,997 66,797 56,525 1,294,270 3.710RCATTQ 538 330 38 891,409426 43 1,042 43,847 43,847 0 45,393 1.0401,435Crop Total 955 266 1,279 302 3,061 5,480,802 392,844 110,644 56,525 1,339,663 3.410
CABBAGERBUPAPH 3 3 2 193,8223 2 74 10,613 2,553 1,613 45,484 4.290RCATAPH 9 8 1 326,5418 1 327 13,225 13,225 0 8,576 .650
12Crop Total 11 3 11 3 401 520,363 23,838 15,778 1,613 54,060 2.270CORN
RBUPAPH 6,157 4,809 562 68,745,08210,704 835 422,396 3,726,078 623,733 621,516 1,354,157 .360RCATAPH 3,070 2,338 93 19,424,4583,313 98 294,538 684,373 684,373 0 123,685 .180RBUPCRC 6,534 5,667 1,029 224,920,85817,576 2,130 953,493 16,782,792 -852,805 3,528,964 6,070,573 .360RBUPGRP 422 380 2 23,475,706388 2 71,577 598,746 12,433 117,306 1,086 .00016,183Crop Total 13,194 1,686 31,981 3,065 1,742,004 336,566,104 21,791,989 467,734 4,267,786 7,549,501 .350
FRESH MARKET TOMATOESRBUPAPH 1 1 0 189,7731 0 80 20,154 8,818 2,267 0 .000
1Crop Total 1 0 1 0 80 189,773 20,154 8,818 2,267 0 .000GRAIN SORGHUM
RBUPAPH 1 0 0 00 0 0 0 0 0 0 .0001Crop Total 0 0 0 0 0 0 0 0 0 0 .000
GRAPESRBUPAPH 21 19 0 175,48522 0 255 17,721 3,155 2,914 0 .000RCATAPH 9 9 1 67,6079 1 217 4,376 4,376 0 7,260 1.660
30Crop Total 28 1 31 1 472 243,092 22,097 7,531 2,914 7,260 .330HYBRID CORN SEED
RBUPYDO 10 4 0 287,62525 0 1,256 42,956 4,778 7,640 0 .000RCATYDO 1 1 0 2,6193 0 27 251 251 0 0 .00011Crop Total 5 0 28 0 1,283 290,244 43,207 5,029 7,640 0 .000
NURSERY (FG&C)RBUPDOL 1 1 0 25,4441 0 0 70 17 11 0 .000RCATDOL 40 39 0 58,302,72639 0 0 536,691 536,691 0 0 .000
41Crop Total 40 0 40 0 0 58,328,170 536,761 536,708 11 0 .000OATS
RBUPAPH 232 58 7 46,53865 7 1,004 7,136 1,049 1,228 3,071 .430RCATAPH 63 31 4 19,63931 4 1,121 1,749 1,749 0 1,457 .830
Page 72 3/9/04
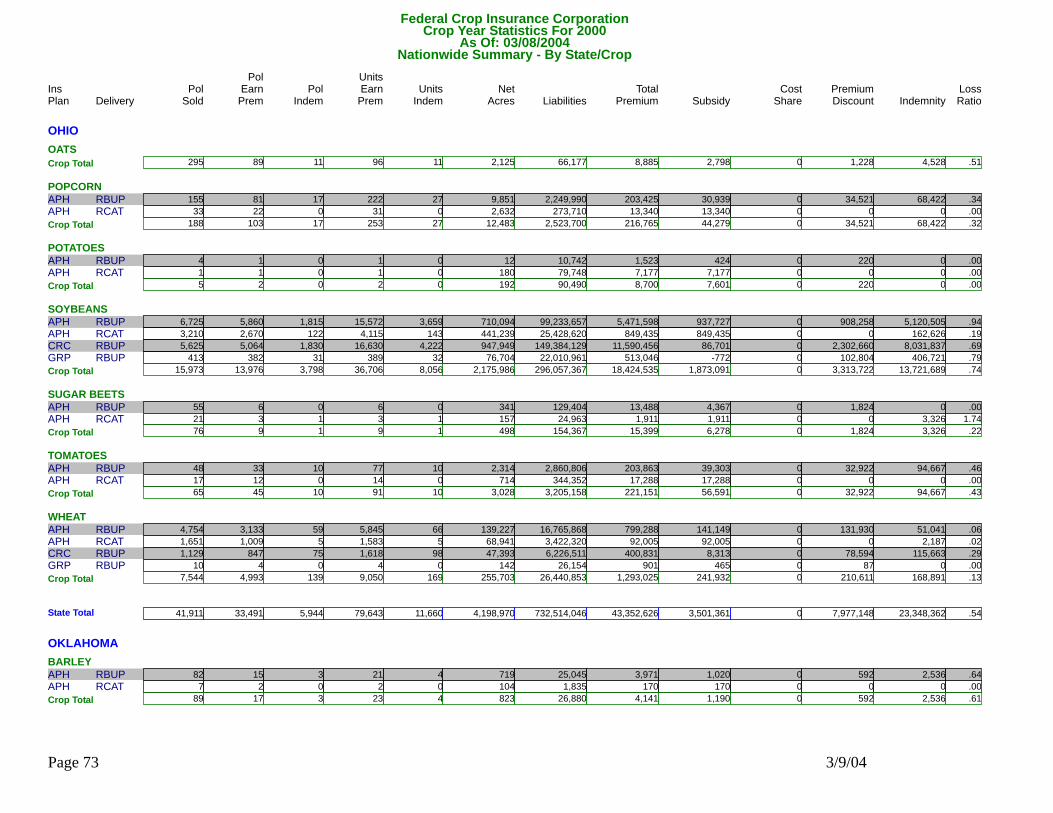
Federal Crop Insurance CorporationNationwide Summary - By State/Crop
Delivery Pol Units Units Net Liabilities Total Subsidy Premium IndemnityPol
Indem EarnPrem Indem Acres Premium Discount LossRatioSold EarnPremIns PolPlan ShareCost
Crop Year Statistics For 2000As Of: 03/08/2004
OHIOOATS
295Crop Total 89 11 96 11 2,125 66,177 8,885 2,798 1,228 4,528 .510POPCORN
RBUPAPH 155 81 17 2,249,990222 27 9,851 203,425 30,939 34,521 68,422 .340RCATAPH 33 22 0 273,71031 0 2,632 13,340 13,340 0 0 .000188Crop Total 103 17 253 27 12,483 2,523,700 216,765 44,279 34,521 68,422 .320
POTATOESRBUPAPH 4 1 0 10,7421 0 12 1,523 424 220 0 .000RCATAPH 1 1 0 79,7481 0 180 7,177 7,177 0 0 .000
5Crop Total 2 0 2 0 192 90,490 8,700 7,601 220 0 .000SOYBEANS
RBUPAPH 6,725 5,860 1,815 99,233,65715,572 3,659 710,094 5,471,598 937,727 908,258 5,120,505 .940RCATAPH 3,210 2,670 122 25,428,6204,115 143 441,239 849,435 849,435 0 162,626 .190RBUPCRC 5,625 5,064 1,830 149,384,12916,630 4,222 947,949 11,590,456 86,701 2,302,660 8,031,837 .690RBUPGRP 413 382 31 22,010,961389 32 76,704 513,046 -772 102,804 406,721 .79015,973Crop Total 13,976 3,798 36,706 8,056 2,175,986 296,057,367 18,424,535 1,873,091 3,313,722 13,721,689 .740
SUGAR BEETSRBUPAPH 55 6 0 129,4046 0 341 13,488 4,367 1,824 0 .000RCATAPH 21 3 1 24,9633 1 157 1,911 1,911 0 3,326 1.740
76Crop Total 9 1 9 1 498 154,367 15,399 6,278 1,824 3,326 .220TOMATOES
RBUPAPH 48 33 10 2,860,80677 10 2,314 203,863 39,303 32,922 94,667 .460RCATAPH 17 12 0 344,35214 0 714 17,288 17,288 0 0 .00065Crop Total 45 10 91 10 3,028 3,205,158 221,151 56,591 32,922 94,667 .430
WHEATRBUPAPH 4,754 3,133 59 16,765,8685,845 66 139,227 799,288 141,149 131,930 51,041 .060RCATAPH 1,651 1,009 5 3,422,3201,583 5 68,941 92,005 92,005 0 2,187 .020RBUPCRC 1,129 847 75 6,226,5111,618 98 47,393 400,831 8,313 78,594 115,663 .290RBUPGRP 10 4 0 26,1544 0 142 901 465 87 0 .000
7,544Crop Total 4,993 139 9,050 169 255,703 26,440,853 1,293,025 241,932 210,611 168,891 .130
41,911State Total 33,491 5,944 79,643 11,660 4,198,970 732,514,046 43,352,626 3,501,361 7,977,148 23,348,362 .540
OKLAHOMABARLEY
RBUPAPH 82 15 3 25,04521 4 719 3,971 1,020 592 2,536 .640RCATAPH 7 2 0 1,8352 0 104 170 170 0 0 .00089Crop Total 17 3 23 4 823 26,880 4,141 1,190 592 2,536 .610
Page 73 3/9/04
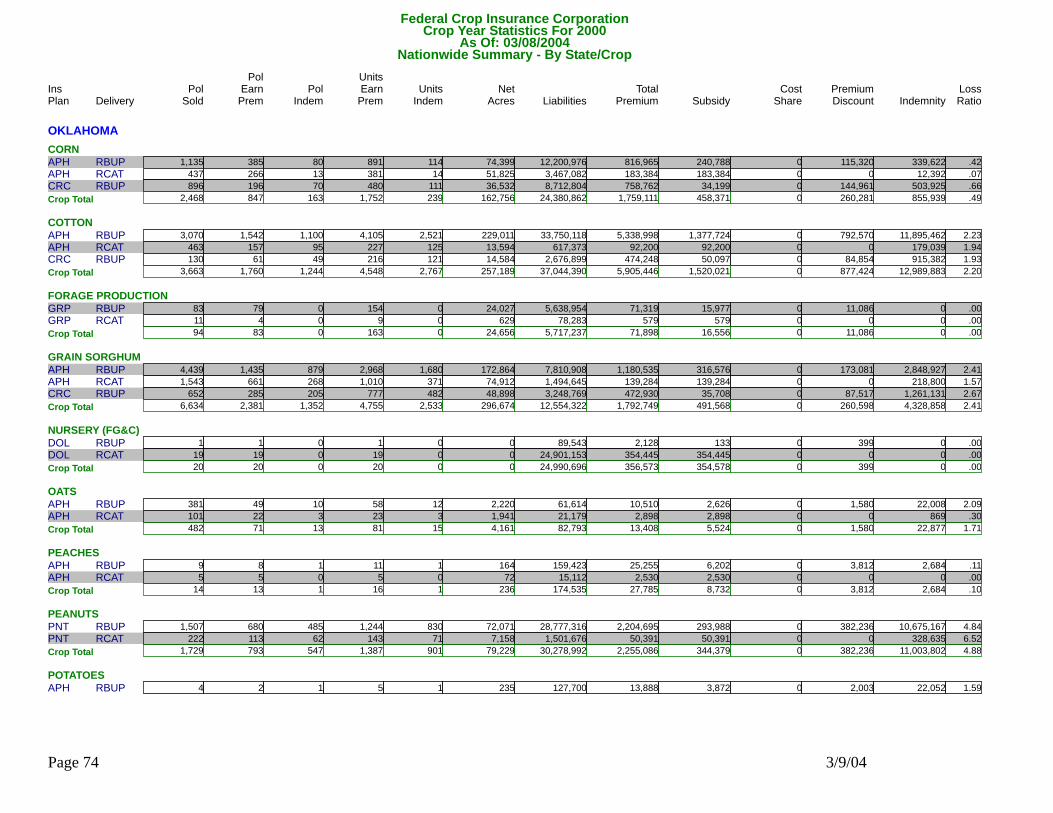
Federal Crop Insurance CorporationNationwide Summary - By State/Crop
Delivery Pol Units Units Net Liabilities Total Subsidy Premium IndemnityPol
Indem EarnPrem Indem Acres Premium Discount LossRatioSold EarnPremIns PolPlan ShareCost
Crop Year Statistics For 2000As Of: 03/08/2004
OKLAHOMACORN
RBUPAPH 1,135 385 80 12,200,976891 114 74,399 816,965 240,788 115,320 339,622 .420RCATAPH 437 266 13 3,467,082381 14 51,825 183,384 183,384 0 12,392 .070RBUPCRC 896 196 70 8,712,804480 111 36,532 758,762 34,199 144,961 503,925 .6602,468Crop Total 847 163 1,752 239 162,756 24,380,862 1,759,111 458,371 260,281 855,939 .490
COTTONRBUPAPH 3,070 1,542 1,100 33,750,1184,105 2,521 229,011 5,338,998 1,377,724 792,570 11,895,462 2.230RCATAPH 463 157 95 617,373227 125 13,594 92,200 92,200 0 179,039 1.940RBUPCRC 130 61 49 2,676,899216 121 14,584 474,248 50,097 84,854 915,382 1.930
3,663Crop Total 1,760 1,244 4,548 2,767 257,189 37,044,390 5,905,446 1,520,021 877,424 12,989,883 2.200FORAGE PRODUCTION
RBUPGRP 83 79 0 5,638,954154 0 24,027 71,319 15,977 11,086 0 .000RCATGRP 11 4 0 78,2839 0 629 579 579 0 0 .00094Crop Total 83 0 163 0 24,656 5,717,237 71,898 16,556 11,086 0 .000
GRAIN SORGHUMRBUPAPH 4,439 1,435 879 7,810,9082,968 1,680 172,864 1,180,535 316,576 173,081 2,848,927 2.410RCATAPH 1,543 661 268 1,494,6451,010 371 74,912 139,284 139,284 0 218,800 1.570RBUPCRC 652 285 205 3,248,769777 482 48,898 472,930 35,708 87,517 1,261,131 2.670
6,634Crop Total 2,381 1,352 4,755 2,533 296,674 12,554,322 1,792,749 491,568 260,598 4,328,858 2.410NURSERY (FG&C)
RBUPDOL 1 1 0 89,5431 0 0 2,128 133 399 0 .000RCATDOL 19 19 0 24,901,15319 0 0 354,445 354,445 0 0 .00020Crop Total 20 0 20 0 0 24,990,696 356,573 354,578 399 0 .000
OATSRBUPAPH 381 49 10 61,61458 12 2,220 10,510 2,626 1,580 22,008 2.090RCATAPH 101 22 3 21,17923 3 1,941 2,898 2,898 0 869 .300
482Crop Total 71 13 81 15 4,161 82,793 13,408 5,524 1,580 22,877 1.710PEACHES
RBUPAPH 9 8 1 159,42311 1 164 25,255 6,202 3,812 2,684 .110RCATAPH 5 5 0 15,1125 0 72 2,530 2,530 0 0 .00014Crop Total 13 1 16 1 236 174,535 27,785 8,732 3,812 2,684 .100
PEANUTSRBUPPNT 1,507 680 485 28,777,3161,244 830 72,071 2,204,695 293,988 382,236 10,675,167 4.840RCATPNT 222 113 62 1,501,676143 71 7,158 50,391 50,391 0 328,635 6.520
1,729Crop Total 793 547 1,387 901 79,229 30,278,992 2,255,086 344,379 382,236 11,003,802 4.880POTATOES
RBUPAPH 4 2 1 127,7005 1 235 13,888 3,872 2,003 22,052 1.590
Page 74 3/9/04
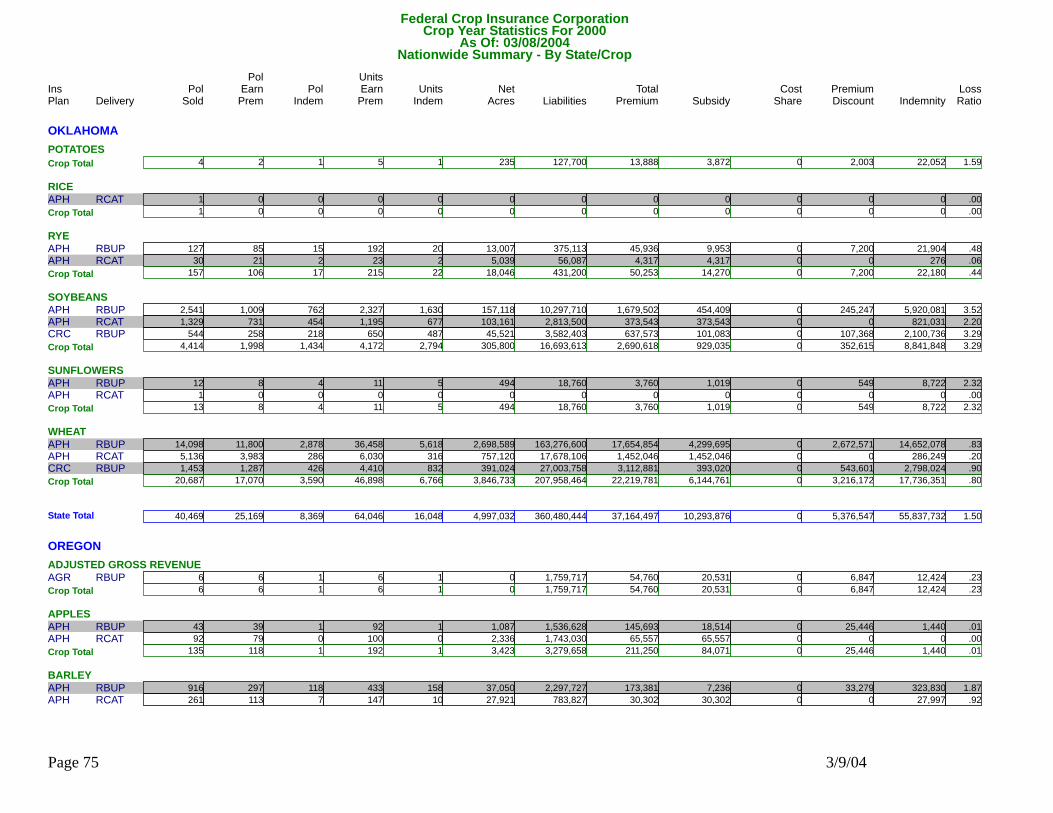
Federal Crop Insurance CorporationNationwide Summary - By State/Crop
Delivery Pol Units Units Net Liabilities Total Subsidy Premium IndemnityPol
Indem EarnPrem Indem Acres Premium Discount LossRatioSold EarnPremIns PolPlan ShareCost
Crop Year Statistics For 2000As Of: 03/08/2004
OKLAHOMAPOTATOES
4Crop Total 2 1 5 1 235 127,700 13,888 3,872 2,003 22,052 1.590RICE
RCATAPH 1 0 0 00 0 0 0 0 0 0 .0001Crop Total 0 0 0 0 0 0 0 0 0 0 .000
RYERBUPAPH 127 85 15 375,113192 20 13,007 45,936 9,953 7,200 21,904 .480RCATAPH 30 21 2 56,08723 2 5,039 4,317 4,317 0 276 .060
157Crop Total 106 17 215 22 18,046 431,200 50,253 14,270 7,200 22,180 .440SOYBEANS
RBUPAPH 2,541 1,009 762 10,297,7102,327 1,630 157,118 1,679,502 454,409 245,247 5,920,081 3.520RCATAPH 1,329 731 454 2,813,5001,195 677 103,161 373,543 373,543 0 821,031 2.200RBUPCRC 544 258 218 3,582,403650 487 45,521 637,573 101,083 107,368 2,100,736 3.2904,414Crop Total 1,998 1,434 4,172 2,794 305,800 16,693,613 2,690,618 929,035 352,615 8,841,848 3.290
SUNFLOWERSRBUPAPH 12 8 4 18,76011 5 494 3,760 1,019 549 8,722 2.320RCATAPH 1 0 0 00 0 0 0 0 0 0 .000
13Crop Total 8 4 11 5 494 18,760 3,760 1,019 549 8,722 2.320WHEAT
RBUPAPH 14,098 11,800 2,878 163,276,60036,458 5,618 2,698,589 17,654,854 4,299,695 2,672,571 14,652,078 .830RCATAPH 5,136 3,983 286 17,678,1066,030 316 757,120 1,452,046 1,452,046 0 286,249 .200RBUPCRC 1,453 1,287 426 27,003,7584,410 832 391,024 3,112,881 393,020 543,601 2,798,024 .90020,687Crop Total 17,070 3,590 46,898 6,766 3,846,733 207,958,464 22,219,781 6,144,761 3,216,172 17,736,351 .800
40,469State Total 25,169 8,369 64,046 16,048 4,997,032 360,480,444 37,164,497 10,293,876 5,376,547 55,837,732 1.500
OREGONADJUSTED GROSS REVENUE
RBUPAGR 6 6 1 1,759,7176 1 0 54,760 20,531 6,847 12,424 .2306Crop Total 6 1 6 1 0 1,759,717 54,760 20,531 6,847 12,424 .230
APPLESRBUPAPH 43 39 1 1,536,62892 1 1,087 145,693 18,514 25,446 1,440 .010RCATAPH 92 79 0 1,743,030100 0 2,336 65,557 65,557 0 0 .000
135Crop Total 118 1 192 1 3,423 3,279,658 211,250 84,071 25,446 1,440 .010BARLEY
RBUPAPH 916 297 118 2,297,727433 158 37,050 173,381 7,236 33,279 323,830 1.870RCATAPH 261 113 7 783,827147 10 27,921 30,302 30,302 0 27,997 .920
Page 75 3/9/04
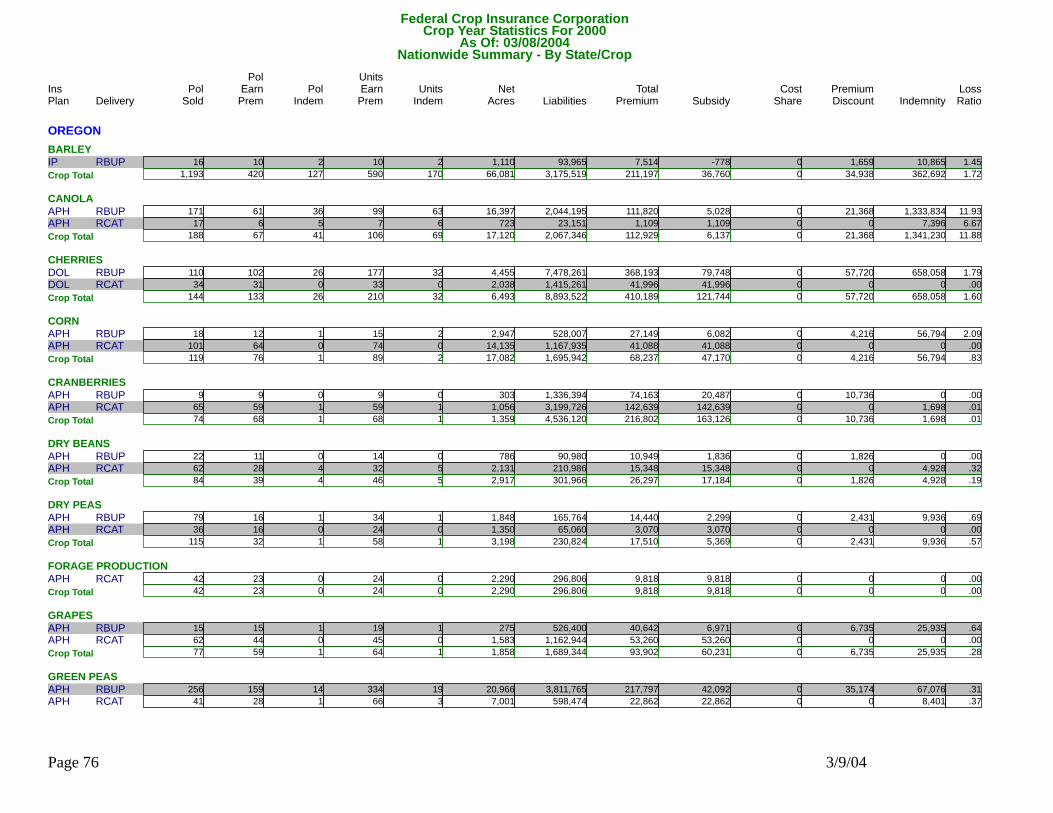
Federal Crop Insurance CorporationNationwide Summary - By State/Crop
Delivery Pol Units Units Net Liabilities Total Subsidy Premium IndemnityPol
Indem EarnPrem Indem Acres Premium Discount LossRatioSold EarnPremIns PolPlan ShareCost
Crop Year Statistics For 2000As Of: 03/08/2004
OREGONBARLEY
RBUPIP 16 10 2 93,96510 2 1,110 7,514 -778 1,659 10,865 1.4501,193Crop Total 420 127 590 170 66,081 3,175,519 211,197 36,760 34,938 362,692 1.720
CANOLARBUPAPH 171 61 36 2,044,19599 63 16,397 111,820 5,028 21,368 1,333,834 11.930RCATAPH 17 6 5 23,1517 6 723 1,109 1,109 0 7,396 6.670
188Crop Total 67 41 106 69 17,120 2,067,346 112,929 6,137 21,368 1,341,230 11.880CHERRIES
RBUPDOL 110 102 26 7,478,261177 32 4,455 368,193 79,748 57,720 658,058 1.790RCATDOL 34 31 0 1,415,26133 0 2,038 41,996 41,996 0 0 .000144Crop Total 133 26 210 32 6,493 8,893,522 410,189 121,744 57,720 658,058 1.600
CORNRBUPAPH 18 12 1 528,00715 2 2,947 27,149 6,082 4,216 56,794 2.090RCATAPH 101 64 0 1,167,93574 0 14,135 41,088 41,088 0 0 .000
119Crop Total 76 1 89 2 17,082 1,695,942 68,237 47,170 4,216 56,794 .830CRANBERRIES
RBUPAPH 9 9 0 1,336,3949 0 303 74,163 20,487 10,736 0 .000RCATAPH 65 59 1 3,199,72659 1 1,056 142,639 142,639 0 1,698 .01074Crop Total 68 1 68 1 1,359 4,536,120 216,802 163,126 10,736 1,698 .010
DRY BEANSRBUPAPH 22 11 0 90,98014 0 786 10,949 1,836 1,826 0 .000RCATAPH 62 28 4 210,98632 5 2,131 15,348 15,348 0 4,928 .320
84Crop Total 39 4 46 5 2,917 301,966 26,297 17,184 1,826 4,928 .190DRY PEAS
RBUPAPH 79 16 1 165,76434 1 1,848 14,440 2,299 2,431 9,936 .690RCATAPH 36 16 0 65,06024 0 1,350 3,070 3,070 0 0 .000115Crop Total 32 1 58 1 3,198 230,824 17,510 5,369 2,431 9,936 .570
FORAGE PRODUCTIONRCATAPH 42 23 0 296,80624 0 2,290 9,818 9,818 0 0 .000
42Crop Total 23 0 24 0 2,290 296,806 9,818 9,818 0 0 .000GRAPES
RBUPAPH 15 15 1 526,40019 1 275 40,642 6,971 6,735 25,935 .640RCATAPH 62 44 0 1,162,94445 0 1,583 53,260 53,260 0 0 .00077Crop Total 59 1 64 1 1,858 1,689,344 93,902 60,231 6,735 25,935 .280
GREEN PEASRBUPAPH 256 159 14 3,811,765334 19 20,966 217,797 42,092 35,174 67,076 .310RCATAPH 41 28 1 598,47466 3 7,001 22,862 22,862 0 8,401 .370
Page 76 3/9/04

Federal Crop Insurance CorporationNationwide Summary - By State/Crop
Delivery Pol Units Units Net Liabilities Total Subsidy Premium IndemnityPol
Indem EarnPrem Indem Acres Premium Discount LossRatioSold EarnPremIns PolPlan ShareCost
Crop Year Statistics For 2000As Of: 03/08/2004
OREGONGREEN PEAS
297Crop Total 187 15 400 22 27,967 4,410,239 240,659 64,954 35,174 75,477 .310NURSERY (FG&C)
RBUPDOL 1 1 0 6,9991 0 0 100 6 19 0 .000RCATDOL 161 154 0 206,808,923155 0 0 2,139,536 2,139,536 0 0 .000162Crop Total 155 0 156 0 0 206,815,922 2,139,636 2,139,542 19 0 .000
OATSRBUPAPH 68 16 6 66,47219 6 1,374 4,732 614 827 3,995 .840RCATAPH 41 17 3 73,32725 3 2,862 3,646 3,646 0 539 .150
109Crop Total 33 9 44 9 4,236 139,799 8,378 4,260 827 4,534 .540ONIONS
RBUPAPH 18 12 1 809,43540 1 522 64,512 23,216 8,262 10,111 .160RCATAPH 104 68 1 4,851,22894 1 6,520 305,951 305,951 0 3,109 .010122Crop Total 80 2 134 2 7,042 5,660,663 370,463 329,167 8,262 13,220 .040
PEARSRBUPAPH 21 20 6 4,756,889149 8 3,269 210,695 56,909 30,777 194,961 .930RCATAPH 91 80 1 7,240,488100 1 7,587 177,897 177,897 0 1,183 .010
112Crop Total 100 7 249 9 10,856 11,997,377 388,592 234,806 30,777 196,144 .500POTATOES
RBUPAPH 29 20 6 4,406,06168 7 3,416 265,064 77,904 37,441 333,460 1.260RCATAPH 120 84 0 13,343,447107 0 24,800 293,808 293,808 0 0 .000149Crop Total 104 6 175 7 28,216 17,749,508 558,872 371,712 37,441 333,460 .600
PROCESSING BEANSRBUPAPH 1 0 0 00 0 0 0 0 0 0 .000RCATAPH 16 9 0 228,4609 0 795 8,019 8,019 0 0 .000
17Crop Total 9 0 9 0 795 228,460 8,019 8,019 0 0 .000SUGAR BEETS
RBUPAPH 44 16 7 1,526,88741 14 2,909 97,872 17,081 16,162 225,452 2.300RCATAPH 65 38 1 1,335,78558 1 4,860 41,737 41,737 0 40,196 .960109Crop Total 54 8 99 15 7,769 2,862,672 139,609 58,818 16,162 265,648 1.900
SWEET CORNRBUPAPH 7 1 0 77,0642 0 247 3,160 856 461 0 .000RCATAPH 20 7 0 92,4767 0 693 2,580 2,580 0 0 .000
27Crop Total 8 0 9 0 940 169,540 5,740 3,436 461 0 .000WHEAT
RBUPAPH 1,683 1,410 395 55,679,6082,951 640 448,221 3,789,225 -166,406 791,458 6,720,332 1.770RCATAPH 541 379 3 4,163,629522 5 74,802 98,807 98,807 0 4,084 .040
Page 77 3/9/04
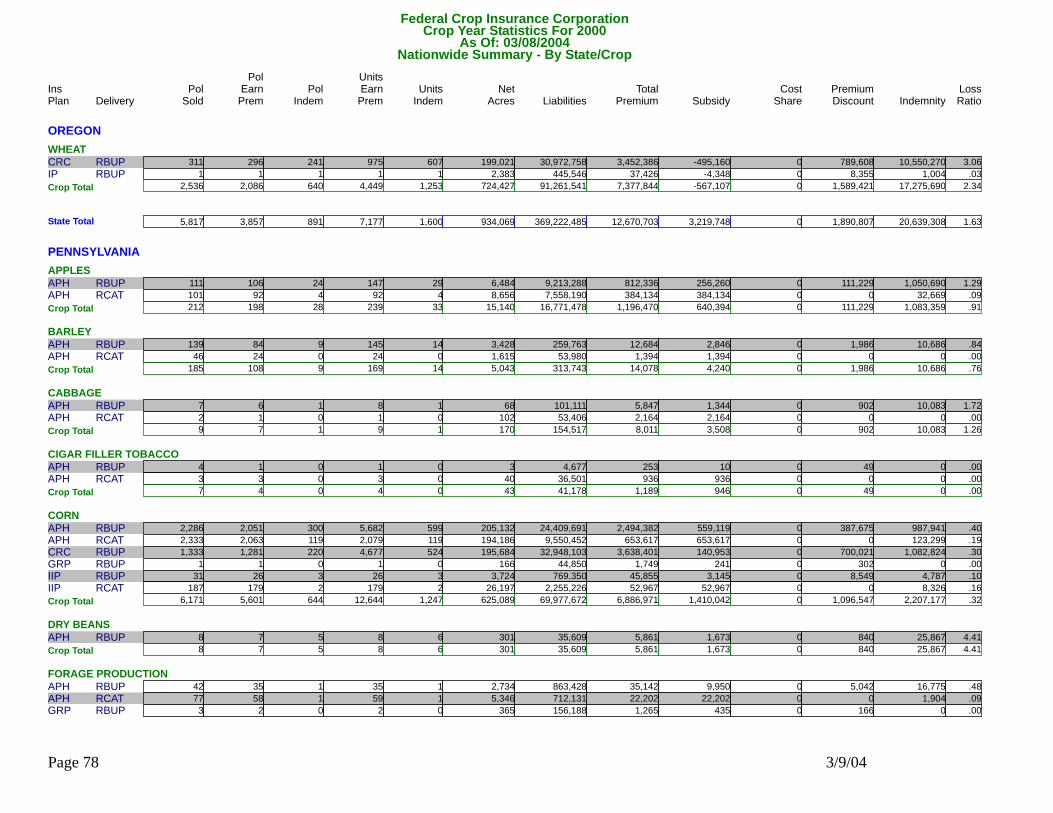
Federal Crop Insurance CorporationNationwide Summary - By State/Crop
Delivery Pol Units Units Net Liabilities Total Subsidy Premium IndemnityPol
Indem EarnPrem Indem Acres Premium Discount LossRatioSold EarnPremIns PolPlan ShareCost
Crop Year Statistics For 2000As Of: 03/08/2004
OREGONWHEAT
RBUPCRC 311 296 241 30,972,758975 607 199,021 3,452,386 -495,160 789,608 10,550,270 3.060RBUPIP 1 1 1 445,5461 1 2,383 37,426 -4,348 8,355 1,004 .0302,536Crop Total 2,086 640 4,449 1,253 724,427 91,261,541 7,377,844 -567,107 1,589,421 17,275,690 2.340
5,817State Total 3,857 891 7,177 1,600 934,069 369,222,485 12,670,703 3,219,748 1,890,807 20,639,308 1.630
PENNSYLVANIAAPPLES
RBUPAPH 111 106 24 9,213,288147 29 6,484 812,336 256,260 111,229 1,050,690 1.290RCATAPH 101 92 4 7,558,19092 4 8,656 384,134 384,134 0 32,669 .090212Crop Total 198 28 239 33 15,140 16,771,478 1,196,470 640,394 111,229 1,083,359 .910
BARLEYRBUPAPH 139 84 9 259,763145 14 3,428 12,684 2,846 1,986 10,686 .840RCATAPH 46 24 0 53,98024 0 1,615 1,394 1,394 0 0 .000
185Crop Total 108 9 169 14 5,043 313,743 14,078 4,240 1,986 10,686 .760CABBAGE
RBUPAPH 7 6 1 101,1118 1 68 5,847 1,344 902 10,083 1.720RCATAPH 2 1 0 53,4061 0 102 2,164 2,164 0 0 .0009Crop Total 7 1 9 1 170 154,517 8,011 3,508 902 10,083 1.260
CIGAR FILLER TOBACCORBUPAPH 4 1 0 4,6771 0 3 253 10 49 0 .000RCATAPH 3 3 0 36,5013 0 40 936 936 0 0 .000
7Crop Total 4 0 4 0 43 41,178 1,189 946 49 0 .000CORN
RBUPAPH 2,286 2,051 300 24,409,6915,682 599 205,132 2,494,382 559,119 387,675 987,941 .400RCATAPH 2,333 2,063 119 9,550,4522,079 119 194,186 653,617 653,617 0 123,299 .190RBUPCRC 1,333 1,281 220 32,948,1034,677 524 195,684 3,638,401 140,953 700,021 1,082,824 .300RBUPGRP 1 1 0 44,8501 0 166 1,749 241 302 0 .000RBUPIIP 31 26 3 769,35026 3 3,724 45,855 3,145 8,549 4,787 .100RCATIIP 187 179 2 2,255,226179 2 26,197 52,967 52,967 0 8,326 .1606,171Crop Total 5,601 644 12,644 1,247 625,089 69,977,672 6,886,971 1,410,042 1,096,547 2,207,177 .320
DRY BEANSRBUPAPH 8 7 5 35,6098 6 301 5,861 1,673 840 25,867 4.410
8Crop Total 7 5 8 6 301 35,609 5,861 1,673 840 25,867 4.410FORAGE PRODUCTION
RBUPAPH 42 35 1 863,42835 1 2,734 35,142 9,950 5,042 16,775 .480RCATAPH 77 58 1 712,13159 1 5,346 22,202 22,202 0 1,904 .090RBUPGRP 3 2 0 156,1882 0 365 1,265 435 166 0 .000
Page 78 3/9/04

Federal Crop Insurance CorporationNationwide Summary - By State/Crop
Delivery Pol Units Units Net Liabilities Total Subsidy Premium IndemnityPol
Indem EarnPrem Indem Acres Premium Discount LossRatioSold EarnPremIns PolPlan ShareCost
Crop Year Statistics For 2000As Of: 03/08/2004
PENNSYLVANIAFORAGE PRODUCTION
RCATGRP 129 102 0 3,429,016102 0 14,687 32,991 32,991 0 0 .000251Crop Total 197 2 198 2 23,132 5,160,763 91,600 65,578 5,208 18,679 .200
FORAGE SEEDINGRBUPDOL 92 53 13 163,54971 15 1,097 14,985 6,712 1,664 21,176 1.410RCATDOL 54 29 0 116,60529 0 1,795 10,587 10,587 0 0 .000
146Crop Total 82 13 100 15 2,892 280,154 25,572 17,299 1,664 21,176 .830FRESH MARKET SWEET CORN
RBUPDOL 150 133 34 1,023,618152 39 2,091 159,243 48,722 22,121 159,133 1.000RCATDOL 177 157 7 597,450157 7 2,635 72,495 72,495 0 4,710 .060327Crop Total 290 41 309 46 4,726 1,621,068 231,738 121,217 22,121 163,843 .710
FRESH MARKET TOMATOESRBUPAPH 17 14 3 367,76830 4 421 47,436 17,213 6,050 7,178 .150RCATAPH 6 5 0 104,9275 0 202 11,031 11,031 0 0 .000
23Crop Total 19 3 35 4 623 472,695 58,467 28,244 6,050 7,178 .120GRAIN SORGHUM
RBUPAPH 24 11 3 33,49028 6 526 6,276 1,301 997 3,372 .540RCATAPH 19 9 0 7,4729 0 300 995 995 0 0 .00043Crop Total 20 3 37 6 826 40,962 7,271 2,296 997 3,372 .460
GRAPESRBUPAPH 56 55 32 3,827,540173 78 3,643 203,096 52,012 30,233 571,285 2.810RCATAPH 73 70 6 2,157,60599 6 4,920 76,383 76,383 0 84,106 1.100
129Crop Total 125 38 272 84 8,563 5,985,145 279,479 128,395 30,233 655,391 2.350GREEN PEAS
RBUPAPH 18 10 3 88,92115 3 441 6,396 1,462 988 10,044 1.57018Crop Total 10 3 15 3 441 88,921 6,396 1,462 988 10,044 1.570
MARYLAND TOBACCORBUPAPH 1 1 0 2,3201 0 2 72 19 11 0 .000
1Crop Total 1 0 1 0 2 2,320 72 19 11 0 .000NURSERY (FG&C)
RBUPDOL 12 10 0 1,101,73510 0 0 6,412 1,647 953 0 .000RCATDOL 38 30 0 27,934,32831 0 0 268,111 268,111 0 0 .00050Crop Total 40 0 41 0 0 29,036,063 274,523 269,758 953 0 .000
OATSRBUPAPH 467 314 62 370,657553 110 8,046 31,201 5,817 5,135 39,715 1.270RCATAPH 256 193 14 119,644194 14 6,870 6,715 6,715 0 1,858 .280
Page 79 3/9/04
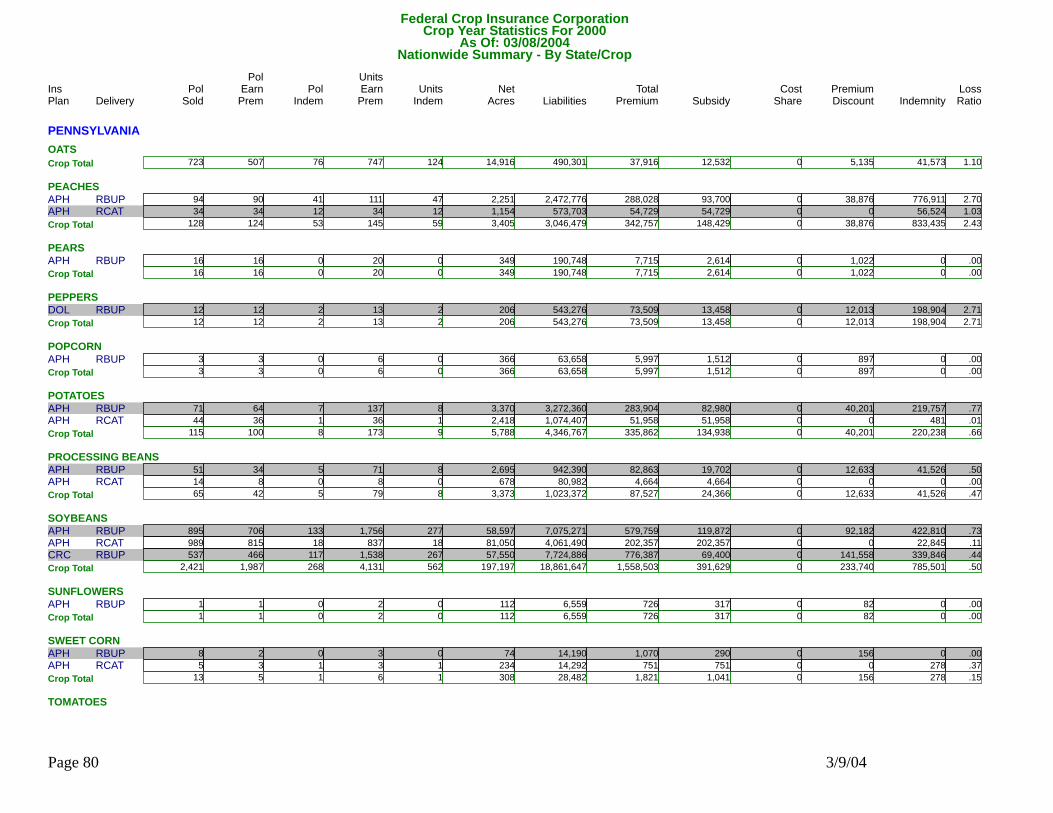
Federal Crop Insurance CorporationNationwide Summary - By State/Crop
Delivery Pol Units Units Net Liabilities Total Subsidy Premium IndemnityPol
Indem EarnPrem Indem Acres Premium Discount LossRatioSold EarnPremIns PolPlan ShareCost
Crop Year Statistics For 2000As Of: 03/08/2004
PENNSYLVANIAOATS
723Crop Total 507 76 747 124 14,916 490,301 37,916 12,532 5,135 41,573 1.100PEACHES
RBUPAPH 94 90 41 2,472,776111 47 2,251 288,028 93,700 38,876 776,911 2.700RCATAPH 34 34 12 573,70334 12 1,154 54,729 54,729 0 56,524 1.030128Crop Total 124 53 145 59 3,405 3,046,479 342,757 148,429 38,876 833,435 2.430
PEARSRBUPAPH 16 16 0 190,74820 0 349 7,715 2,614 1,022 0 .000
16Crop Total 16 0 20 0 349 190,748 7,715 2,614 1,022 0 .000PEPPERS
RBUPDOL 12 12 2 543,27613 2 206 73,509 13,458 12,013 198,904 2.71012Crop Total 12 2 13 2 206 543,276 73,509 13,458 12,013 198,904 2.710
POPCORNRBUPAPH 3 3 0 63,6586 0 366 5,997 1,512 897 0 .000
3Crop Total 3 0 6 0 366 63,658 5,997 1,512 897 0 .000POTATOES
RBUPAPH 71 64 7 3,272,360137 8 3,370 283,904 82,980 40,201 219,757 .770RCATAPH 44 36 1 1,074,40736 1 2,418 51,958 51,958 0 481 .010115Crop Total 100 8 173 9 5,788 4,346,767 335,862 134,938 40,201 220,238 .660
PROCESSING BEANSRBUPAPH 51 34 5 942,39071 8 2,695 82,863 19,702 12,633 41,526 .500RCATAPH 14 8 0 80,9828 0 678 4,664 4,664 0 0 .000
65Crop Total 42 5 79 8 3,373 1,023,372 87,527 24,366 12,633 41,526 .470SOYBEANS
RBUPAPH 895 706 133 7,075,2711,756 277 58,597 579,759 119,872 92,182 422,810 .730RCATAPH 989 815 18 4,061,490837 18 81,050 202,357 202,357 0 22,845 .110RBUPCRC 537 466 117 7,724,8861,538 267 57,550 776,387 69,400 141,558 339,846 .4402,421Crop Total 1,987 268 4,131 562 197,197 18,861,647 1,558,503 391,629 233,740 785,501 .500
SUNFLOWERSRBUPAPH 1 1 0 6,5592 0 112 726 317 82 0 .000
1Crop Total 1 0 2 0 112 6,559 726 317 82 0 .000SWEET CORN
RBUPAPH 8 2 0 14,1903 0 74 1,070 290 156 0 .000RCATAPH 5 3 1 14,2923 1 234 751 751 0 278 .37013Crop Total 5 1 6 1 308 28,482 1,821 1,041 156 278 .150
TOMATOES
Page 80 3/9/04
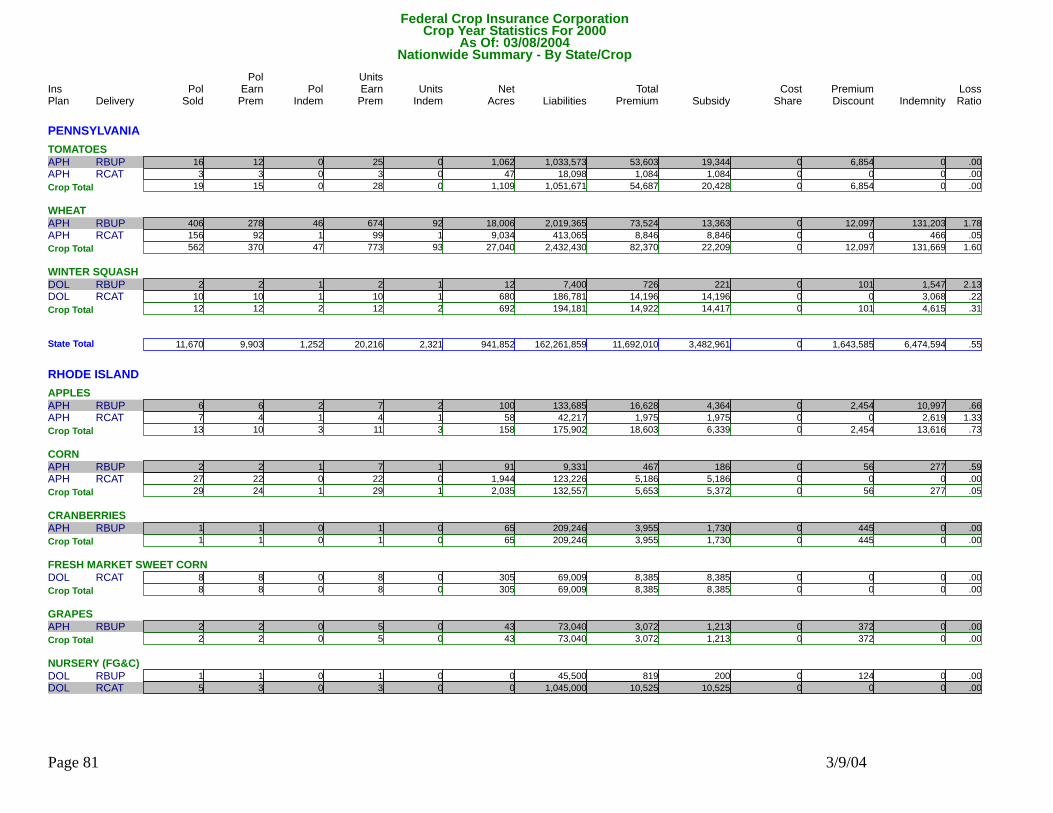
Federal Crop Insurance CorporationNationwide Summary - By State/Crop
Delivery Pol Units Units Net Liabilities Total Subsidy Premium IndemnityPol
Indem EarnPrem Indem Acres Premium Discount LossRatioSold EarnPremIns PolPlan ShareCost
Crop Year Statistics For 2000As Of: 03/08/2004
PENNSYLVANIATOMATOES
RBUPAPH 16 12 0 1,033,57325 0 1,062 53,603 19,344 6,854 0 .000RCATAPH 3 3 0 18,0983 0 47 1,084 1,084 0 0 .00019Crop Total 15 0 28 0 1,109 1,051,671 54,687 20,428 6,854 0 .000
WHEATRBUPAPH 406 278 46 2,019,365674 92 18,006 73,524 13,363 12,097 131,203 1.780RCATAPH 156 92 1 413,06599 1 9,034 8,846 8,846 0 466 .050
562Crop Total 370 47 773 93 27,040 2,432,430 82,370 22,209 12,097 131,669 1.600WINTER SQUASH
RBUPDOL 2 2 1 7,4002 1 12 726 221 101 1,547 2.130RCATDOL 10 10 1 186,78110 1 680 14,196 14,196 0 3,068 .22012Crop Total 12 2 12 2 692 194,181 14,922 14,417 101 4,615 .310
11,670State Total 9,903 1,252 20,216 2,321 941,852 162,261,859 11,692,010 3,482,961 1,643,585 6,474,594 .550
RHODE ISLANDAPPLES
RBUPAPH 6 6 2 133,6857 2 100 16,628 4,364 2,454 10,997 .660RCATAPH 7 4 1 42,2174 1 58 1,975 1,975 0 2,619 1.33013Crop Total 10 3 11 3 158 175,902 18,603 6,339 2,454 13,616 .730
CORNRBUPAPH 2 2 1 9,3317 1 91 467 186 56 277 .590RCATAPH 27 22 0 123,22622 0 1,944 5,186 5,186 0 0 .000
29Crop Total 24 1 29 1 2,035 132,557 5,653 5,372 56 277 .050CRANBERRIES
RBUPAPH 1 1 0 209,2461 0 65 3,955 1,730 445 0 .0001Crop Total 1 0 1 0 65 209,246 3,955 1,730 445 0 .000
FRESH MARKET SWEET CORNRCATDOL 8 8 0 69,0098 0 305 8,385 8,385 0 0 .000
8Crop Total 8 0 8 0 305 69,009 8,385 8,385 0 0 .000GRAPES
RBUPAPH 2 2 0 73,0405 0 43 3,072 1,213 372 0 .0002Crop Total 2 0 5 0 43 73,040 3,072 1,213 372 0 .000
NURSERY (FG&C)RBUPDOL 1 1 0 45,5001 0 0 819 200 124 0 .000RCATDOL 5 3 0 1,045,0003 0 0 10,525 10,525 0 0 .000
Page 81 3/9/04
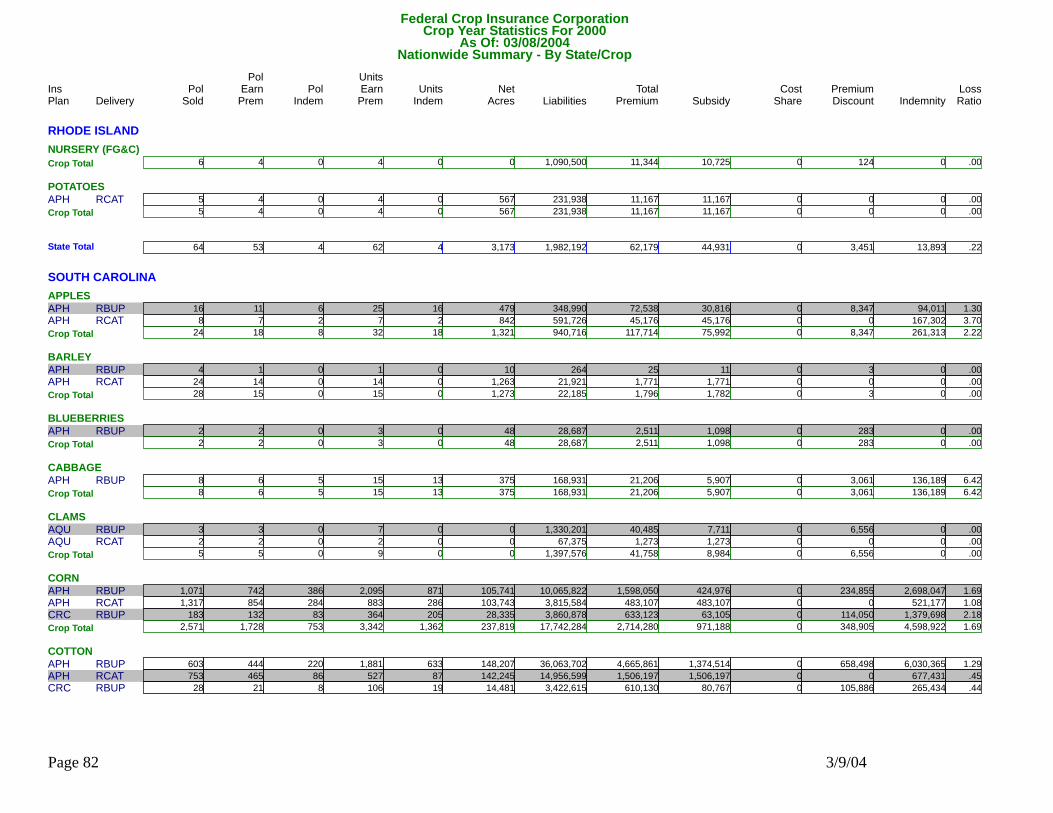
Federal Crop Insurance CorporationNationwide Summary - By State/Crop
Delivery Pol Units Units Net Liabilities Total Subsidy Premium IndemnityPol
Indem EarnPrem Indem Acres Premium Discount LossRatioSold EarnPremIns PolPlan ShareCost
Crop Year Statistics For 2000As Of: 03/08/2004
RHODE ISLANDNURSERY (FG&C)
6Crop Total 4 0 4 0 0 1,090,500 11,344 10,725 124 0 .000POTATOES
RCATAPH 5 4 0 231,9384 0 567 11,167 11,167 0 0 .0005Crop Total 4 0 4 0 567 231,938 11,167 11,167 0 0 .000
64State Total 53 4 62 4 3,173 1,982,192 62,179 44,931 3,451 13,893 .220
SOUTH CAROLINAAPPLES
RBUPAPH 16 11 6 348,99025 16 479 72,538 30,816 8,347 94,011 1.300RCATAPH 8 7 2 591,7267 2 842 45,176 45,176 0 167,302 3.70024Crop Total 18 8 32 18 1,321 940,716 117,714 75,992 8,347 261,313 2.220
BARLEYRBUPAPH 4 1 0 2641 0 10 25 11 3 0 .000RCATAPH 24 14 0 21,92114 0 1,263 1,771 1,771 0 0 .000
28Crop Total 15 0 15 0 1,273 22,185 1,796 1,782 3 0 .000BLUEBERRIES
RBUPAPH 2 2 0 28,6873 0 48 2,511 1,098 283 0 .0002Crop Total 2 0 3 0 48 28,687 2,511 1,098 283 0 .000
CABBAGERBUPAPH 8 6 5 168,93115 13 375 21,206 5,907 3,061 136,189 6.420
8Crop Total 6 5 15 13 375 168,931 21,206 5,907 3,061 136,189 6.420CLAMS
RBUPAQU 3 3 0 1,330,2017 0 0 40,485 7,711 6,556 0 .000RCATAQU 2 2 0 67,3752 0 0 1,273 1,273 0 0 .0005Crop Total 5 0 9 0 0 1,397,576 41,758 8,984 6,556 0 .000
CORNRBUPAPH 1,071 742 386 10,065,8222,095 871 105,741 1,598,050 424,976 234,855 2,698,047 1.690RCATAPH 1,317 854 284 3,815,584883 286 103,743 483,107 483,107 0 521,177 1.080RBUPCRC 183 132 83 3,860,878364 205 28,335 633,123 63,105 114,050 1,379,698 2.180
2,571Crop Total 1,728 753 3,342 1,362 237,819 17,742,284 2,714,280 971,188 348,905 4,598,922 1.690COTTON
RBUPAPH 603 444 220 36,063,7021,881 633 148,207 4,665,861 1,374,514 658,498 6,030,365 1.290RCATAPH 753 465 86 14,956,599527 87 142,245 1,506,197 1,506,197 0 677,431 .450RBUPCRC 28 21 8 3,422,615106 19 14,481 610,130 80,767 105,886 265,434 .440
Page 82 3/9/04
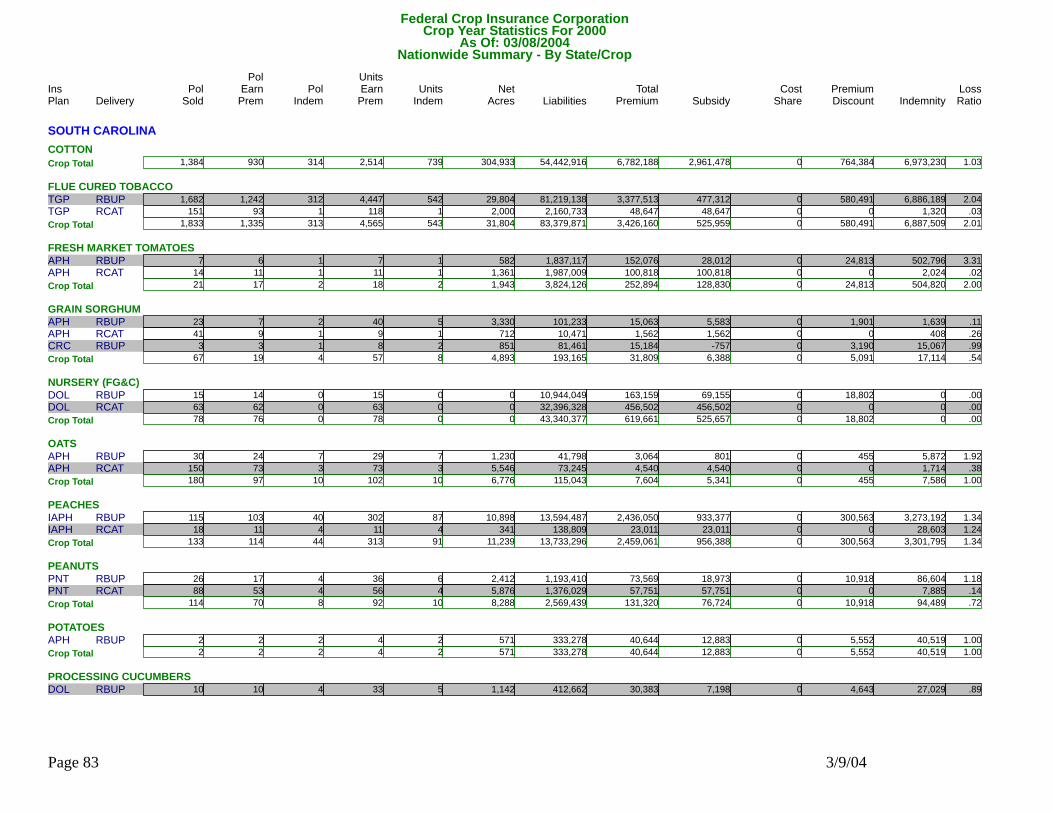
Federal Crop Insurance CorporationNationwide Summary - By State/Crop
Delivery Pol Units Units Net Liabilities Total Subsidy Premium IndemnityPol
Indem EarnPrem Indem Acres Premium Discount LossRatioSold EarnPremIns PolPlan ShareCost
Crop Year Statistics For 2000As Of: 03/08/2004
SOUTH CAROLINACOTTON
1,384Crop Total 930 314 2,514 739 304,933 54,442,916 6,782,188 2,961,478 764,384 6,973,230 1.030FLUE CURED TOBACCO
RBUPTGP 1,682 1,242 312 81,219,1384,447 542 29,804 3,377,513 477,312 580,491 6,886,189 2.040RCATTGP 151 93 1 2,160,733118 1 2,000 48,647 48,647 0 1,320 .0301,833Crop Total 1,335 313 4,565 543 31,804 83,379,871 3,426,160 525,959 580,491 6,887,509 2.010
FRESH MARKET TOMATOESRBUPAPH 7 6 1 1,837,1177 1 582 152,076 28,012 24,813 502,796 3.310RCATAPH 14 11 1 1,987,00911 1 1,361 100,818 100,818 0 2,024 .020
21Crop Total 17 2 18 2 1,943 3,824,126 252,894 128,830 24,813 504,820 2.000GRAIN SORGHUM
RBUPAPH 23 7 2 101,23340 5 3,330 15,063 5,583 1,901 1,639 .110RCATAPH 41 9 1 10,4719 1 712 1,562 1,562 0 408 .260RBUPCRC 3 3 1 81,4618 2 851 15,184 -757 3,190 15,067 .99067Crop Total 19 4 57 8 4,893 193,165 31,809 6,388 5,091 17,114 .540
NURSERY (FG&C)RBUPDOL 15 14 0 10,944,04915 0 0 163,159 69,155 18,802 0 .000RCATDOL 63 62 0 32,396,32863 0 0 456,502 456,502 0 0 .000
78Crop Total 76 0 78 0 0 43,340,377 619,661 525,657 18,802 0 .000OATS
RBUPAPH 30 24 7 41,79829 7 1,230 3,064 801 455 5,872 1.920RCATAPH 150 73 3 73,24573 3 5,546 4,540 4,540 0 1,714 .380180Crop Total 97 10 102 10 6,776 115,043 7,604 5,341 455 7,586 1.000
PEACHESRBUPIAPH 115 103 40 13,594,487302 87 10,898 2,436,050 933,377 300,563 3,273,192 1.340RCATIAPH 18 11 4 138,80911 4 341 23,011 23,011 0 28,603 1.240
133Crop Total 114 44 313 91 11,239 13,733,296 2,459,061 956,388 300,563 3,301,795 1.340PEANUTS
RBUPPNT 26 17 4 1,193,41036 6 2,412 73,569 18,973 10,918 86,604 1.180RCATPNT 88 53 4 1,376,02956 4 5,876 57,751 57,751 0 7,885 .140114Crop Total 70 8 92 10 8,288 2,569,439 131,320 76,724 10,918 94,489 .720
POTATOESRBUPAPH 2 2 2 333,2784 2 571 40,644 12,883 5,552 40,519 1.000
2Crop Total 2 2 4 2 571 333,278 40,644 12,883 5,552 40,519 1.000PROCESSING CUCUMBERS
RBUPDOL 10 10 4 412,66233 5 1,142 30,383 7,198 4,643 27,029 .890
Page 83 3/9/04
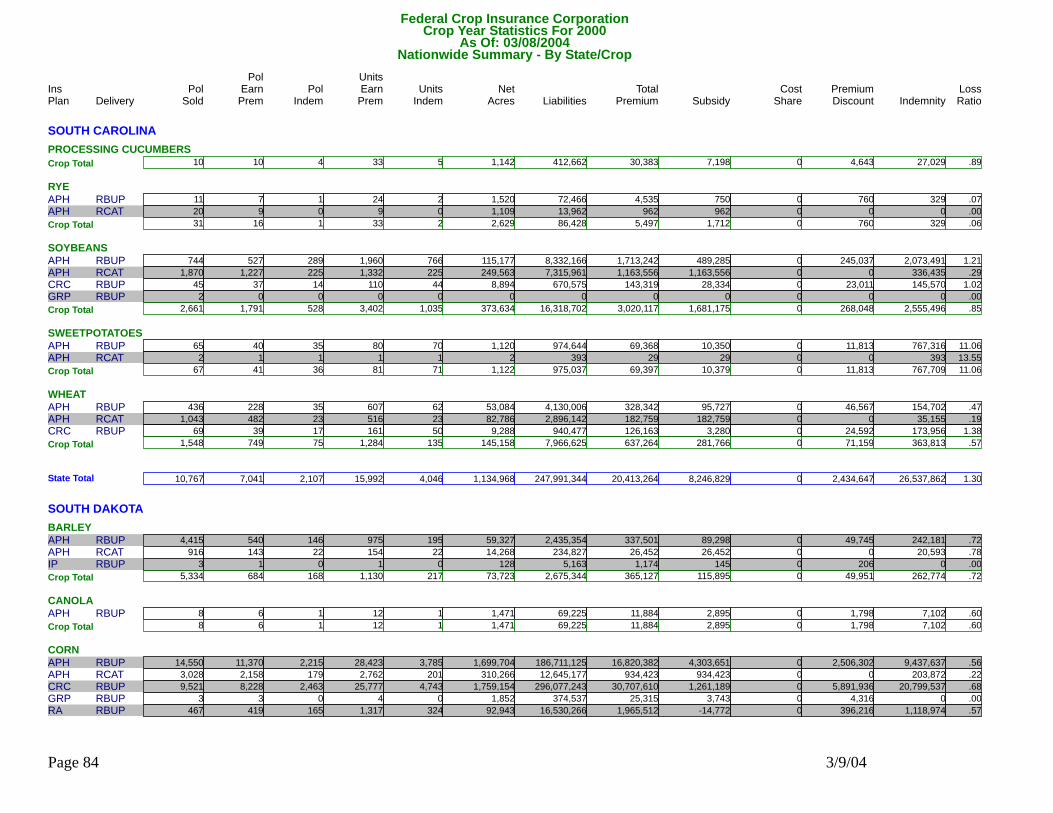
Federal Crop Insurance CorporationNationwide Summary - By State/Crop
Delivery Pol Units Units Net Liabilities Total Subsidy Premium IndemnityPol
Indem EarnPrem Indem Acres Premium Discount LossRatioSold EarnPremIns PolPlan ShareCost
Crop Year Statistics For 2000As Of: 03/08/2004
SOUTH CAROLINAPROCESSING CUCUMBERS
10Crop Total 10 4 33 5 1,142 412,662 30,383 7,198 4,643 27,029 .890RYE
RBUPAPH 11 7 1 72,46624 2 1,520 4,535 750 760 329 .070RCATAPH 20 9 0 13,9629 0 1,109 962 962 0 0 .00031Crop Total 16 1 33 2 2,629 86,428 5,497 1,712 760 329 .060
SOYBEANSRBUPAPH 744 527 289 8,332,1661,960 766 115,177 1,713,242 489,285 245,037 2,073,491 1.210RCATAPH 1,870 1,227 225 7,315,9611,332 225 249,563 1,163,556 1,163,556 0 336,435 .290RBUPCRC 45 37 14 670,575110 44 8,894 143,319 28,334 23,011 145,570 1.020RBUPGRP 2 0 0 00 0 0 0 0 0 0 .000
2,661Crop Total 1,791 528 3,402 1,035 373,634 16,318,702 3,020,117 1,681,175 268,048 2,555,496 .850SWEETPOTATOES
RBUPAPH 65 40 35 974,64480 70 1,120 69,368 10,350 11,813 767,316 11.060RCATAPH 2 1 1 3931 1 2 29 29 0 393 13.55067Crop Total 41 36 81 71 1,122 975,037 69,397 10,379 11,813 767,709 11.060
WHEATRBUPAPH 436 228 35 4,130,006607 62 53,084 328,342 95,727 46,567 154,702 .470RCATAPH 1,043 482 23 2,896,142516 23 82,786 182,759 182,759 0 35,155 .190RBUPCRC 69 39 17 940,477161 50 9,288 126,163 3,280 24,592 173,956 1.380
1,548Crop Total 749 75 1,284 135 145,158 7,966,625 637,264 281,766 71,159 363,813 .570
10,767State Total 7,041 2,107 15,992 4,046 1,134,968 247,991,344 20,413,264 8,246,829 2,434,647 26,537,862 1.300
SOUTH DAKOTABARLEY
RBUPAPH 4,415 540 146 2,435,354975 195 59,327 337,501 89,298 49,745 242,181 .720RCATAPH 916 143 22 234,827154 22 14,268 26,452 26,452 0 20,593 .780RBUPIP 3 1 0 5,1631 0 128 1,174 145 206 0 .0005,334Crop Total 684 168 1,130 217 73,723 2,675,344 365,127 115,895 49,951 262,774 .720
CANOLARBUPAPH 8 6 1 69,22512 1 1,471 11,884 2,895 1,798 7,102 .600
8Crop Total 6 1 12 1 1,471 69,225 11,884 2,895 1,798 7,102 .600CORN
RBUPAPH 14,550 11,370 2,215 186,711,12528,423 3,785 1,699,704 16,820,382 4,303,651 2,506,302 9,437,637 .560RCATAPH 3,028 2,158 179 12,645,1772,762 201 310,266 934,423 934,423 0 203,872 .220RBUPCRC 9,521 8,228 2,463 296,077,24325,777 4,743 1,759,154 30,707,610 1,261,189 5,891,936 20,799,537 .680RBUPGRP 3 3 0 374,5374 0 1,852 25,315 3,743 4,316 0 .000RBUPRA 467 419 165 16,530,2661,317 324 92,943 1,965,512 -14,772 396,216 1,118,974 .570
Page 84 3/9/04
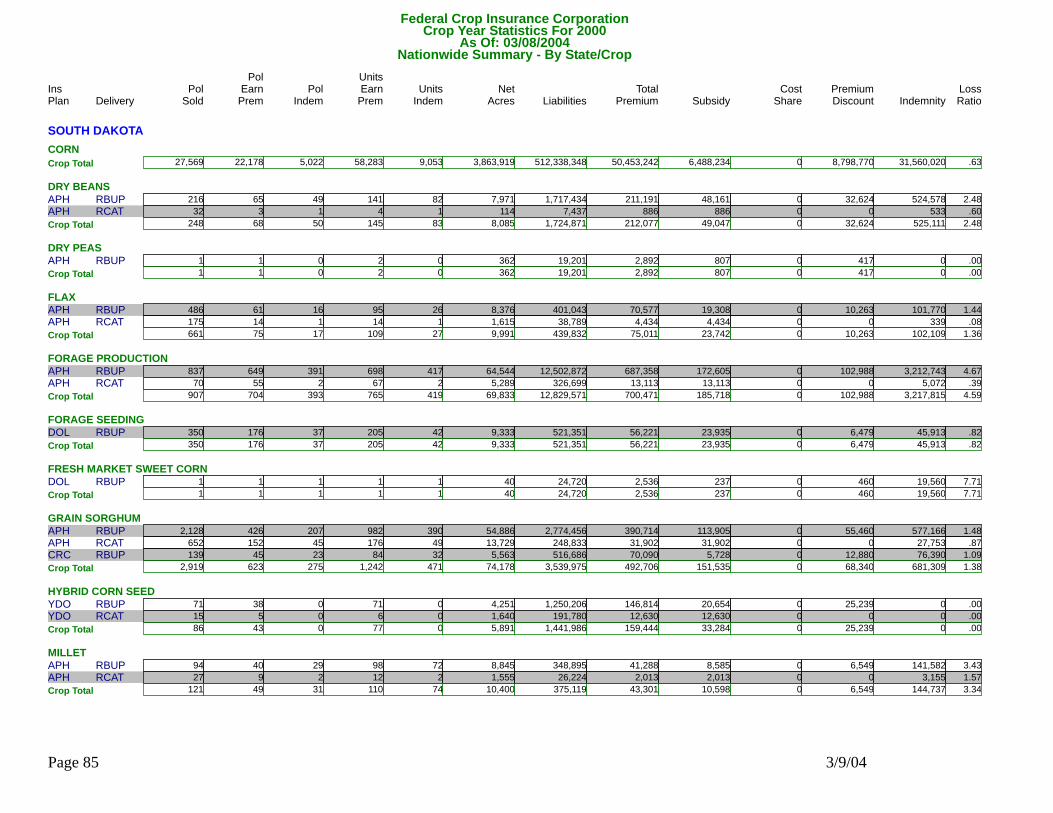
Federal Crop Insurance CorporationNationwide Summary - By State/Crop
Delivery Pol Units Units Net Liabilities Total Subsidy Premium IndemnityPol
Indem EarnPrem Indem Acres Premium Discount LossRatioSold EarnPremIns PolPlan ShareCost
Crop Year Statistics For 2000As Of: 03/08/2004
SOUTH DAKOTACORN
27,569Crop Total 22,178 5,022 58,283 9,053 3,863,919 512,338,348 50,453,242 6,488,234 8,798,770 31,560,020 .630DRY BEANS
RBUPAPH 216 65 49 1,717,434141 82 7,971 211,191 48,161 32,624 524,578 2.480RCATAPH 32 3 1 7,4374 1 114 886 886 0 533 .600248Crop Total 68 50 145 83 8,085 1,724,871 212,077 49,047 32,624 525,111 2.480
DRY PEASRBUPAPH 1 1 0 19,2012 0 362 2,892 807 417 0 .000
1Crop Total 1 0 2 0 362 19,201 2,892 807 417 0 .000FLAX
RBUPAPH 486 61 16 401,04395 26 8,376 70,577 19,308 10,263 101,770 1.440RCATAPH 175 14 1 38,78914 1 1,615 4,434 4,434 0 339 .080661Crop Total 75 17 109 27 9,991 439,832 75,011 23,742 10,263 102,109 1.360
FORAGE PRODUCTIONRBUPAPH 837 649 391 12,502,872698 417 64,544 687,358 172,605 102,988 3,212,743 4.670RCATAPH 70 55 2 326,69967 2 5,289 13,113 13,113 0 5,072 .390
907Crop Total 704 393 765 419 69,833 12,829,571 700,471 185,718 102,988 3,217,815 4.590FORAGE SEEDING
RBUPDOL 350 176 37 521,351205 42 9,333 56,221 23,935 6,479 45,913 .820350Crop Total 176 37 205 42 9,333 521,351 56,221 23,935 6,479 45,913 .820
FRESH MARKET SWEET CORNRBUPDOL 1 1 1 24,7201 1 40 2,536 237 460 19,560 7.710
1Crop Total 1 1 1 1 40 24,720 2,536 237 460 19,560 7.710GRAIN SORGHUM
RBUPAPH 2,128 426 207 2,774,456982 390 54,886 390,714 113,905 55,460 577,166 1.480RCATAPH 652 152 45 248,833176 49 13,729 31,902 31,902 0 27,753 .870RBUPCRC 139 45 23 516,68684 32 5,563 70,090 5,728 12,880 76,390 1.0902,919Crop Total 623 275 1,242 471 74,178 3,539,975 492,706 151,535 68,340 681,309 1.380
HYBRID CORN SEEDRBUPYDO 71 38 0 1,250,20671 0 4,251 146,814 20,654 25,239 0 .000RCATYDO 15 5 0 191,7806 0 1,640 12,630 12,630 0 0 .000
86Crop Total 43 0 77 0 5,891 1,441,986 159,444 33,284 25,239 0 .000MILLET
RBUPAPH 94 40 29 348,89598 72 8,845 41,288 8,585 6,549 141,582 3.430RCATAPH 27 9 2 26,22412 2 1,555 2,013 2,013 0 3,155 1.570121Crop Total 49 31 110 74 10,400 375,119 43,301 10,598 6,549 144,737 3.340
Page 85 3/9/04
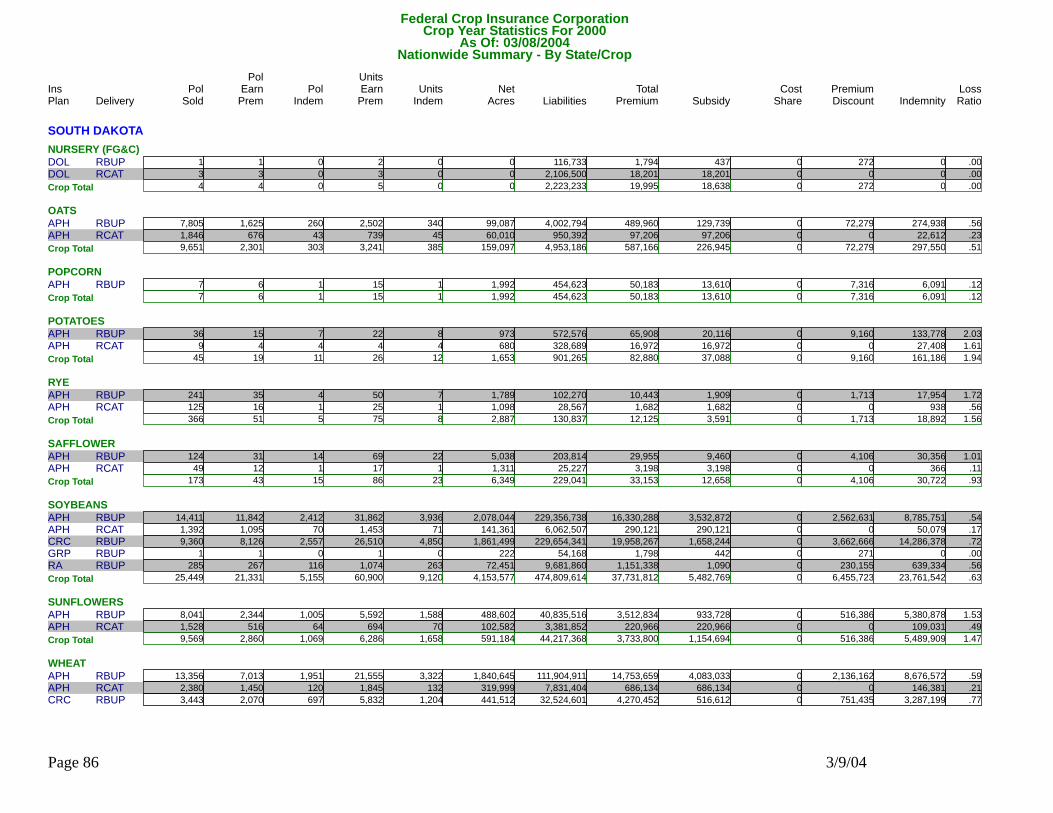
Federal Crop Insurance CorporationNationwide Summary - By State/Crop
Delivery Pol Units Units Net Liabilities Total Subsidy Premium IndemnityPol
Indem EarnPrem Indem Acres Premium Discount LossRatioSold EarnPremIns PolPlan ShareCost
Crop Year Statistics For 2000As Of: 03/08/2004
SOUTH DAKOTANURSERY (FG&C)
RBUPDOL 1 1 0 116,7332 0 0 1,794 437 272 0 .000RCATDOL 3 3 0 2,106,5003 0 0 18,201 18,201 0 0 .0004Crop Total 4 0 5 0 0 2,223,233 19,995 18,638 272 0 .000
OATSRBUPAPH 7,805 1,625 260 4,002,7942,502 340 99,087 489,960 129,739 72,279 274,938 .560RCATAPH 1,846 676 43 950,392739 45 60,010 97,206 97,206 0 22,612 .230
9,651Crop Total 2,301 303 3,241 385 159,097 4,953,186 587,166 226,945 72,279 297,550 .510POPCORN
RBUPAPH 7 6 1 454,62315 1 1,992 50,183 13,610 7,316 6,091 .1207Crop Total 6 1 15 1 1,992 454,623 50,183 13,610 7,316 6,091 .120
POTATOESRBUPAPH 36 15 7 572,57622 8 973 65,908 20,116 9,160 133,778 2.030RCATAPH 9 4 4 328,6894 4 680 16,972 16,972 0 27,408 1.610
45Crop Total 19 11 26 12 1,653 901,265 82,880 37,088 9,160 161,186 1.940RYE
RBUPAPH 241 35 4 102,27050 7 1,789 10,443 1,909 1,713 17,954 1.720RCATAPH 125 16 1 28,56725 1 1,098 1,682 1,682 0 938 .560366Crop Total 51 5 75 8 2,887 130,837 12,125 3,591 1,713 18,892 1.560
SAFFLOWERRBUPAPH 124 31 14 203,81469 22 5,038 29,955 9,460 4,106 30,356 1.010RCATAPH 49 12 1 25,22717 1 1,311 3,198 3,198 0 366 .110
173Crop Total 43 15 86 23 6,349 229,041 33,153 12,658 4,106 30,722 .930SOYBEANS
RBUPAPH 14,411 11,842 2,412 229,356,73831,862 3,936 2,078,044 16,330,288 3,532,872 2,562,631 8,785,751 .540RCATAPH 1,392 1,095 70 6,062,5071,453 71 141,361 290,121 290,121 0 50,079 .170RBUPCRC 9,360 8,126 2,557 229,654,34126,510 4,850 1,861,499 19,958,267 1,658,244 3,662,666 14,286,378 .720RBUPGRP 1 1 0 54,1681 0 222 1,798 442 271 0 .000RBUPRA 285 267 116 9,681,8601,074 263 72,451 1,151,338 1,090 230,155 639,334 .56025,449Crop Total 21,331 5,155 60,900 9,120 4,153,577 474,809,614 37,731,812 5,482,769 6,455,723 23,761,542 .630
SUNFLOWERSRBUPAPH 8,041 2,344 1,005 40,835,5165,592 1,588 488,602 3,512,834 933,728 516,386 5,380,878 1.530RCATAPH 1,528 516 64 3,381,852694 70 102,582 220,966 220,966 0 109,031 .490
9,569Crop Total 2,860 1,069 6,286 1,658 591,184 44,217,368 3,733,800 1,154,694 516,386 5,489,909 1.470WHEAT
RBUPAPH 13,356 7,013 1,951 111,904,91121,555 3,322 1,840,645 14,753,659 4,083,033 2,136,162 8,676,572 .590RCATAPH 2,380 1,450 120 7,831,4041,845 132 319,999 686,134 686,134 0 146,381 .210RBUPCRC 3,443 2,070 697 32,524,6015,832 1,204 441,512 4,270,452 516,612 751,435 3,287,199 .770
Page 86 3/9/04
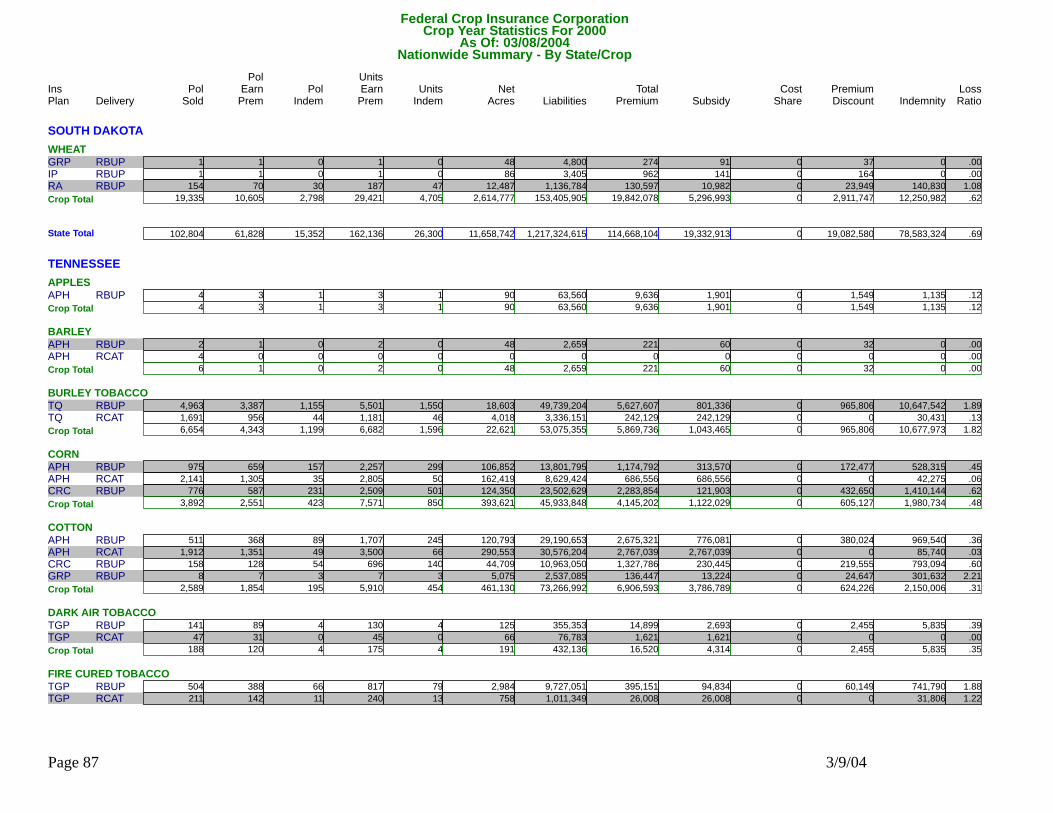
Federal Crop Insurance CorporationNationwide Summary - By State/Crop
Delivery Pol Units Units Net Liabilities Total Subsidy Premium IndemnityPol
Indem EarnPrem Indem Acres Premium Discount LossRatioSold EarnPremIns PolPlan ShareCost
Crop Year Statistics For 2000As Of: 03/08/2004
SOUTH DAKOTAWHEAT
RBUPGRP 1 1 0 4,8001 0 48 274 91 37 0 .000RBUPIP 1 1 0 3,4051 0 86 962 141 164 0 .000RBUPRA 154 70 30 1,136,784187 47 12,487 130,597 10,982 23,949 140,830 1.08019,335Crop Total 10,605 2,798 29,421 4,705 2,614,777 153,405,905 19,842,078 5,296,993 2,911,747 12,250,982 .620
102,804State Total 61,828 15,352 162,136 26,300 11,658,742 1,217,324,615 114,668,104 19,332,913 19,082,580 78,583,324 .690
TENNESSEEAPPLES
RBUPAPH 4 3 1 63,5603 1 90 9,636 1,901 1,549 1,135 .1204Crop Total 3 1 3 1 90 63,560 9,636 1,901 1,549 1,135 .120
BARLEYRBUPAPH 2 1 0 2,6592 0 48 221 60 32 0 .000RCATAPH 4 0 0 00 0 0 0 0 0 0 .000
6Crop Total 1 0 2 0 48 2,659 221 60 32 0 .000BURLEY TOBACCO
RBUPTQ 4,963 3,387 1,155 49,739,2045,501 1,550 18,603 5,627,607 801,336 965,806 10,647,542 1.890RCATTQ 1,691 956 44 3,336,1511,181 46 4,018 242,129 242,129 0 30,431 .1306,654Crop Total 4,343 1,199 6,682 1,596 22,621 53,075,355 5,869,736 1,043,465 965,806 10,677,973 1.820
CORNRBUPAPH 975 659 157 13,801,7952,257 299 106,852 1,174,792 313,570 172,477 528,315 .450RCATAPH 2,141 1,305 35 8,629,4242,805 50 162,419 686,556 686,556 0 42,275 .060RBUPCRC 776 587 231 23,502,6292,509 501 124,350 2,283,854 121,903 432,650 1,410,144 .620
3,892Crop Total 2,551 423 7,571 850 393,621 45,933,848 4,145,202 1,122,029 605,127 1,980,734 .480COTTON
RBUPAPH 511 368 89 29,190,6531,707 245 120,793 2,675,321 776,081 380,024 969,540 .360RCATAPH 1,912 1,351 49 30,576,2043,500 66 290,553 2,767,039 2,767,039 0 85,740 .030RBUPCRC 158 128 54 10,963,050696 140 44,709 1,327,786 230,445 219,555 793,094 .600RBUPGRP 8 7 3 2,537,0857 3 5,075 136,447 13,224 24,647 301,632 2.2102,589Crop Total 1,854 195 5,910 454 461,130 73,266,992 6,906,593 3,786,789 624,226 2,150,006 .310
DARK AIR TOBACCORBUPTGP 141 89 4 355,353130 4 125 14,899 2,693 2,455 5,835 .390RCATTGP 47 31 0 76,78345 0 66 1,621 1,621 0 0 .000
188Crop Total 120 4 175 4 191 432,136 16,520 4,314 2,455 5,835 .350FIRE CURED TOBACCO
RBUPTGP 504 388 66 9,727,051817 79 2,984 395,151 94,834 60,149 741,790 1.880RCATTGP 211 142 11 1,011,349240 13 758 26,008 26,008 0 31,806 1.220
Page 87 3/9/04
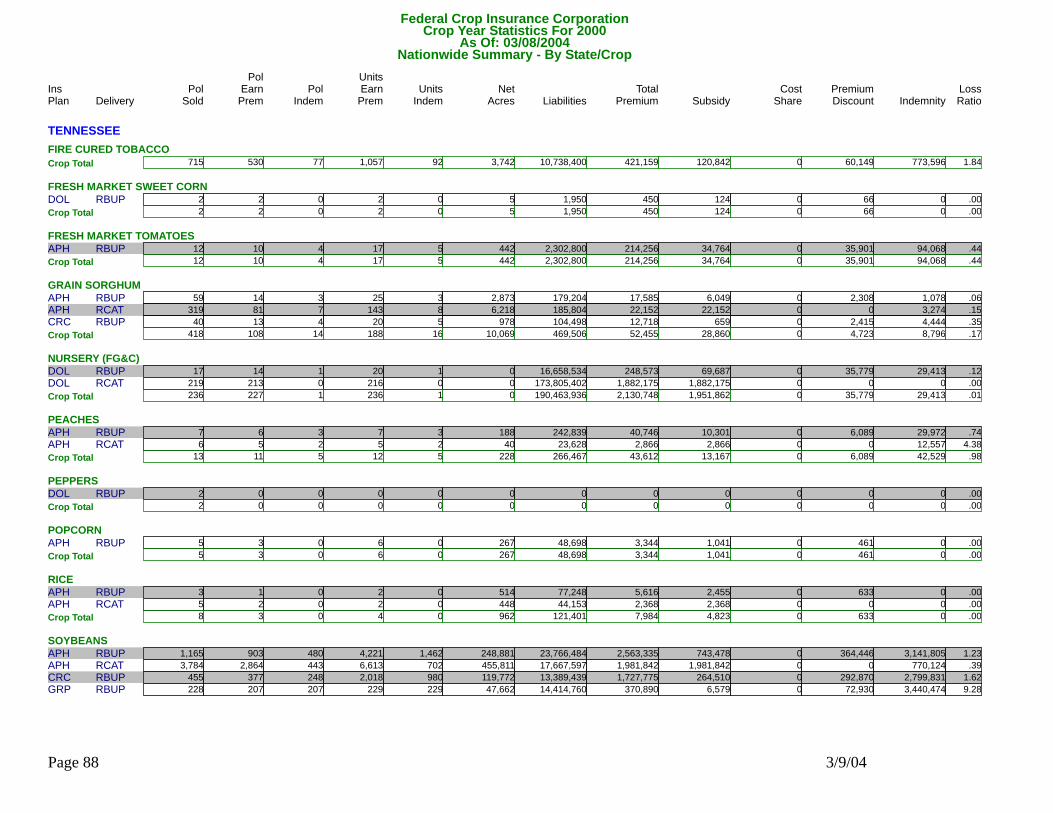
Federal Crop Insurance CorporationNationwide Summary - By State/Crop
Delivery Pol Units Units Net Liabilities Total Subsidy Premium IndemnityPol
Indem EarnPrem Indem Acres Premium Discount LossRatioSold EarnPremIns PolPlan ShareCost
Crop Year Statistics For 2000As Of: 03/08/2004
TENNESSEEFIRE CURED TOBACCO
715Crop Total 530 77 1,057 92 3,742 10,738,400 421,159 120,842 60,149 773,596 1.840FRESH MARKET SWEET CORN
RBUPDOL 2 2 0 1,9502 0 5 450 124 66 0 .0002Crop Total 2 0 2 0 5 1,950 450 124 66 0 .000
FRESH MARKET TOMATOESRBUPAPH 12 10 4 2,302,80017 5 442 214,256 34,764 35,901 94,068 .440
12Crop Total 10 4 17 5 442 2,302,800 214,256 34,764 35,901 94,068 .440GRAIN SORGHUM
RBUPAPH 59 14 3 179,20425 3 2,873 17,585 6,049 2,308 1,078 .060RCATAPH 319 81 7 185,804143 8 6,218 22,152 22,152 0 3,274 .150RBUPCRC 40 13 4 104,49820 5 978 12,718 659 2,415 4,444 .350418Crop Total 108 14 188 16 10,069 469,506 52,455 28,860 4,723 8,796 .170
NURSERY (FG&C)RBUPDOL 17 14 1 16,658,53420 1 0 248,573 69,687 35,779 29,413 .120RCATDOL 219 213 0 173,805,402216 0 0 1,882,175 1,882,175 0 0 .000
236Crop Total 227 1 236 1 0 190,463,936 2,130,748 1,951,862 35,779 29,413 .010PEACHES
RBUPAPH 7 6 3 242,8397 3 188 40,746 10,301 6,089 29,972 .740RCATAPH 6 5 2 23,6285 2 40 2,866 2,866 0 12,557 4.38013Crop Total 11 5 12 5 228 266,467 43,612 13,167 6,089 42,529 .980
PEPPERSRBUPDOL 2 0 0 00 0 0 0 0 0 0 .000
2Crop Total 0 0 0 0 0 0 0 0 0 0 .000POPCORN
RBUPAPH 5 3 0 48,6986 0 267 3,344 1,041 461 0 .0005Crop Total 3 0 6 0 267 48,698 3,344 1,041 461 0 .000
RICERBUPAPH 3 1 0 77,2482 0 514 5,616 2,455 633 0 .000RCATAPH 5 2 0 44,1532 0 448 2,368 2,368 0 0 .000
8Crop Total 3 0 4 0 962 121,401 7,984 4,823 633 0 .000SOYBEANS
RBUPAPH 1,165 903 480 23,766,4844,221 1,462 248,881 2,563,335 743,478 364,446 3,141,805 1.230RCATAPH 3,784 2,864 443 17,667,5976,613 702 455,811 1,981,842 1,981,842 0 770,124 .390RBUPCRC 455 377 248 13,389,4392,018 980 119,772 1,727,775 264,510 292,870 2,799,831 1.620RBUPGRP 228 207 207 14,414,760229 229 47,662 370,890 6,579 72,930 3,440,474 9.280
Page 88 3/9/04
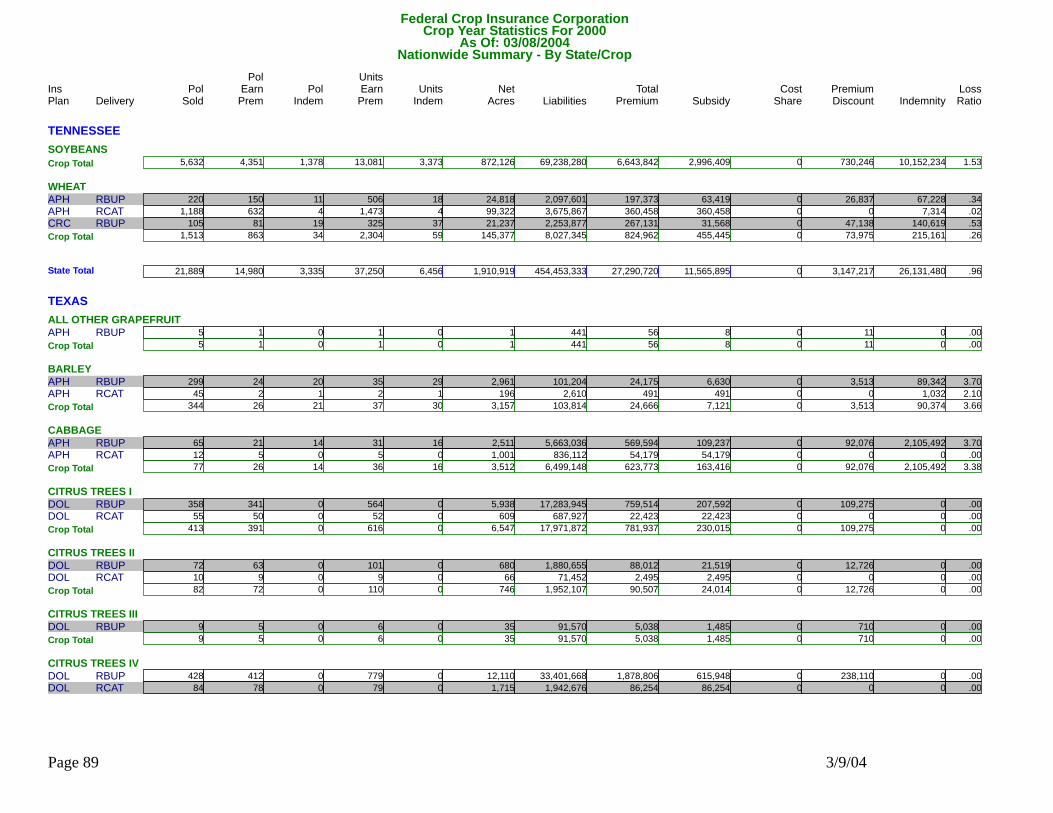
Federal Crop Insurance CorporationNationwide Summary - By State/Crop
Delivery Pol Units Units Net Liabilities Total Subsidy Premium IndemnityPol
Indem EarnPrem Indem Acres Premium Discount LossRatioSold EarnPremIns PolPlan ShareCost
Crop Year Statistics For 2000As Of: 03/08/2004
TENNESSEESOYBEANS
5,632Crop Total 4,351 1,378 13,081 3,373 872,126 69,238,280 6,643,842 2,996,409 730,246 10,152,234 1.530WHEAT
RBUPAPH 220 150 11 2,097,601506 18 24,818 197,373 63,419 26,837 67,228 .340RCATAPH 1,188 632 4 3,675,8671,473 4 99,322 360,458 360,458 0 7,314 .020RBUPCRC 105 81 19 2,253,877325 37 21,237 267,131 31,568 47,138 140,619 .5301,513Crop Total 863 34 2,304 59 145,377 8,027,345 824,962 455,445 73,975 215,161 .260
21,889State Total 14,980 3,335 37,250 6,456 1,910,919 454,453,333 27,290,720 11,565,895 3,147,217 26,131,480 .960
TEXASALL OTHER GRAPEFRUIT
RBUPAPH 5 1 0 4411 0 1 56 8 11 0 .0005Crop Total 1 0 1 0 1 441 56 8 11 0 .000
BARLEYRBUPAPH 299 24 20 101,20435 29 2,961 24,175 6,630 3,513 89,342 3.700RCATAPH 45 2 1 2,6102 1 196 491 491 0 1,032 2.100
344Crop Total 26 21 37 30 3,157 103,814 24,666 7,121 3,513 90,374 3.660CABBAGE
RBUPAPH 65 21 14 5,663,03631 16 2,511 569,594 109,237 92,076 2,105,492 3.700RCATAPH 12 5 0 836,1125 0 1,001 54,179 54,179 0 0 .00077Crop Total 26 14 36 16 3,512 6,499,148 623,773 163,416 92,076 2,105,492 3.380
CITRUS TREES IRBUPDOL 358 341 0 17,283,945564 0 5,938 759,514 207,592 109,275 0 .000RCATDOL 55 50 0 687,92752 0 609 22,423 22,423 0 0 .000
413Crop Total 391 0 616 0 6,547 17,971,872 781,937 230,015 109,275 0 .000CITRUS TREES II
RBUPDOL 72 63 0 1,880,655101 0 680 88,012 21,519 12,726 0 .000RCATDOL 10 9 0 71,4529 0 66 2,495 2,495 0 0 .00082Crop Total 72 0 110 0 746 1,952,107 90,507 24,014 12,726 0 .000
CITRUS TREES IIIRBUPDOL 9 5 0 91,5706 0 35 5,038 1,485 710 0 .000
9Crop Total 5 0 6 0 35 91,570 5,038 1,485 710 0 .000CITRUS TREES IV
RBUPDOL 428 412 0 33,401,668779 0 12,110 1,878,806 615,948 238,110 0 .000RCATDOL 84 78 0 1,942,67679 0 1,715 86,254 86,254 0 0 .000
Page 89 3/9/04

Federal Crop Insurance CorporationNationwide Summary - By State/Crop
Delivery Pol Units Units Net Liabilities Total Subsidy Premium IndemnityPol
Indem EarnPrem Indem Acres Premium Discount LossRatioSold EarnPremIns PolPlan ShareCost
Crop Year Statistics For 2000As Of: 03/08/2004
TEXASCITRUS TREES IV
512Crop Total 490 0 858 0 13,825 35,344,344 1,965,060 702,202 238,110 0 .000CITRUS TREES V
RBUPDOL 146 124 0 6,960,237196 0 2,364 466,331 97,718 68,322 0 .000RCATDOL 35 29 0 490,27431 0 436 21,500 21,500 0 0 .000181Crop Total 153 0 227 0 2,800 7,450,511 487,831 119,218 68,322 0 .000
CORNRBUPAPH 11,951 4,994 936 96,036,04810,568 1,604 717,404 8,826,448 2,472,641 1,271,786 6,828,195 .770RCATAPH 4,973 2,616 88 40,925,2833,695 107 467,760 1,897,849 1,897,849 0 156,818 .080RBUPCRC 4,303 3,093 647 84,688,0319,098 1,222 650,455 11,252,399 951,370 2,061,120 8,438,642 .750
21,227Crop Total 10,703 1,671 23,361 2,933 1,835,619 221,649,362 21,976,696 5,321,860 3,332,906 15,423,655 .700COTTON
RBUPAPH 38,608 30,430 19,933 908,862,86885,116 47,159 5,655,911 179,663,394 51,946,432 25,551,766 278,890,904 1.550RCATAPH 5,062 3,492 1,212 22,674,3624,747 1,455 298,814 2,765,948 2,765,948 0 2,234,109 .810RBUPCRC 2,457 1,532 938 56,168,9094,453 2,498 305,512 11,481,955 1,937,795 1,906,017 29,562,109 2.570RBUPGRP 151 141 118 14,872,035185 162 60,576 1,536,814 359,844 235,428 6,638,765 4.32046,278Crop Total 35,595 22,201 94,501 51,274 6,320,813 1,002,578,174 195,448,111 57,010,019 27,693,211 317,325,887 1.620
COTTON EX LONG STAPLERBUPAPH 513 29 6 1,679,01357 6 3,885 195,064 44,153 30,183 119,798 .610RCATAPH 76 47 2 1,238,95268 2 6,761 77,531 77,531 0 5,571 .070
589Crop Total 76 8 125 8 10,646 2,917,965 272,595 121,684 30,183 125,369 .460DRY BEANS
RBUPAPH 998 126 102 2,389,930191 143 12,517 252,019 69,415 36,543 1,351,911 5.360RCATAPH 142 22 17 123,73325 18 1,622 11,939 11,939 0 69,169 5.7901,140Crop Total 148 119 216 161 14,139 2,513,663 263,958 81,354 36,543 1,421,080 5.380
EARLY & MIDSEASON ORANGESRBUPAPH 139 127 3 993,720192 3 2,338 59,195 15,126 10,183 5,895 .100RCATAPH 208 185 1 851,451191 1 3,696 42,151 42,151 0 1,193 .030
347Crop Total 312 4 383 4 6,034 1,845,171 101,346 57,277 10,183 7,088 .070GRAIN SORGHUM
RBUPAPH 34,075 12,045 6,109 91,309,72326,657 11,675 1,690,531 14,959,300 4,187,774 2,156,840 27,558,658 1.840RCATAPH 8,402 3,456 1,193 9,654,8965,293 1,574 388,586 1,031,441 1,031,441 0 1,575,318 1.530RBUPCRC 6,579 2,503 1,112 32,987,5416,223 2,354 476,067 6,520,266 582,675 1,188,167 11,572,195 1.770RBUPGRP 2 2 0 2,891,4542 0 19,718 154,992 37,941 23,411 0 .000RBUPIP 77 56 16 1,026,73293 16 11,893 74,647 11,074 12,727 358,082 4.800RCATIP 1 0 0 00 0 0 0 0 0 0 .00049,136Crop Total 18,062 8,430 38,268 15,619 2,586,795 137,870,346 22,740,646 5,850,905 3,381,145 41,064,253 1.810
GRAPES
Page 90 3/9/04
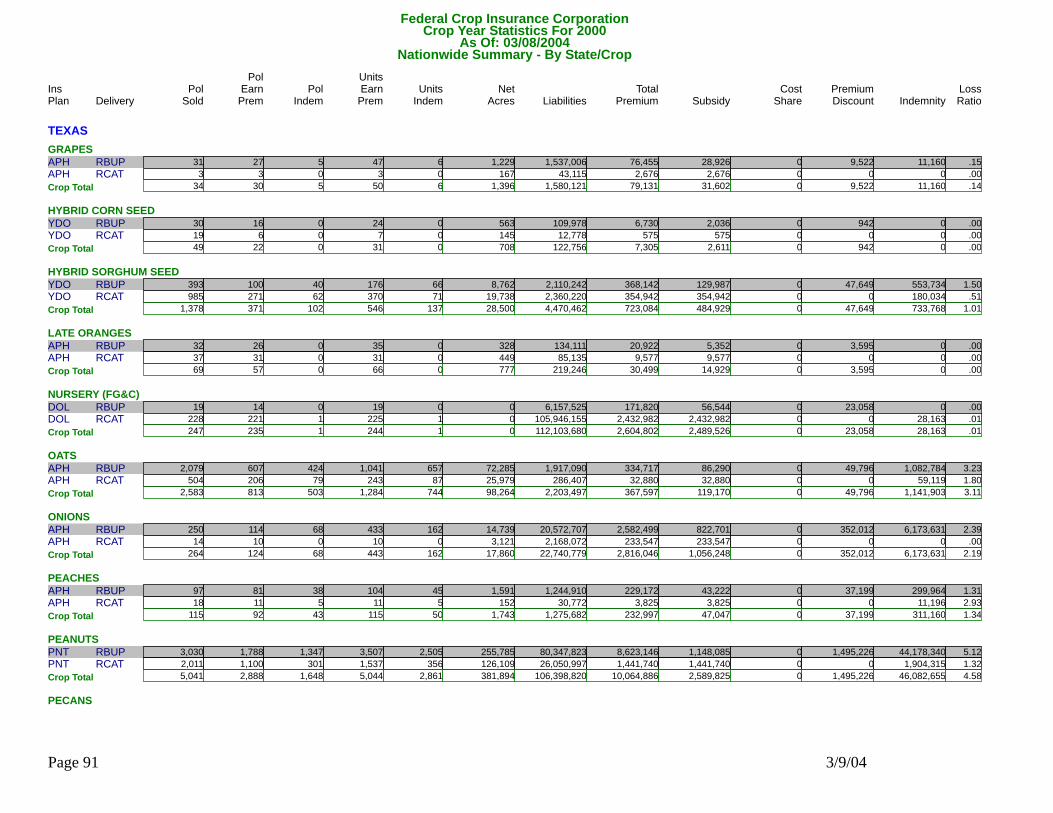
Federal Crop Insurance CorporationNationwide Summary - By State/Crop
Delivery Pol Units Units Net Liabilities Total Subsidy Premium IndemnityPol
Indem EarnPrem Indem Acres Premium Discount LossRatioSold EarnPremIns PolPlan ShareCost
Crop Year Statistics For 2000As Of: 03/08/2004
TEXASGRAPES
RBUPAPH 31 27 5 1,537,00647 6 1,229 76,455 28,926 9,522 11,160 .150RCATAPH 3 3 0 43,1153 0 167 2,676 2,676 0 0 .00034Crop Total 30 5 50 6 1,396 1,580,121 79,131 31,602 9,522 11,160 .140
HYBRID CORN SEEDRBUPYDO 30 16 0 109,97824 0 563 6,730 2,036 942 0 .000RCATYDO 19 6 0 12,7787 0 145 575 575 0 0 .000
49Crop Total 22 0 31 0 708 122,756 7,305 2,611 942 0 .000HYBRID SORGHUM SEED
RBUPYDO 393 100 40 2,110,242176 66 8,762 368,142 129,987 47,649 553,734 1.500RCATYDO 985 271 62 2,360,220370 71 19,738 354,942 354,942 0 180,034 .5101,378Crop Total 371 102 546 137 28,500 4,470,462 723,084 484,929 47,649 733,768 1.010
LATE ORANGESRBUPAPH 32 26 0 134,11135 0 328 20,922 5,352 3,595 0 .000RCATAPH 37 31 0 85,13531 0 449 9,577 9,577 0 0 .000
69Crop Total 57 0 66 0 777 219,246 30,499 14,929 3,595 0 .000NURSERY (FG&C)
RBUPDOL 19 14 0 6,157,52519 0 0 171,820 56,544 23,058 0 .000RCATDOL 228 221 1 105,946,155225 1 0 2,432,982 2,432,982 0 28,163 .010247Crop Total 235 1 244 1 0 112,103,680 2,604,802 2,489,526 23,058 28,163 .010
OATSRBUPAPH 2,079 607 424 1,917,0901,041 657 72,285 334,717 86,290 49,796 1,082,784 3.230RCATAPH 504 206 79 286,407243 87 25,979 32,880 32,880 0 59,119 1.800
2,583Crop Total 813 503 1,284 744 98,264 2,203,497 367,597 119,170 49,796 1,141,903 3.110ONIONS
RBUPAPH 250 114 68 20,572,707433 162 14,739 2,582,499 822,701 352,012 6,173,631 2.390RCATAPH 14 10 0 2,168,07210 0 3,121 233,547 233,547 0 0 .000264Crop Total 124 68 443 162 17,860 22,740,779 2,816,046 1,056,248 352,012 6,173,631 2.190
PEACHESRBUPAPH 97 81 38 1,244,910104 45 1,591 229,172 43,222 37,199 299,964 1.310RCATAPH 18 11 5 30,77211 5 152 3,825 3,825 0 11,196 2.930
115Crop Total 92 43 115 50 1,743 1,275,682 232,997 47,047 37,199 311,160 1.340PEANUTS
RBUPPNT 3,030 1,788 1,347 80,347,8233,507 2,505 255,785 8,623,146 1,148,085 1,495,226 44,178,340 5.120RCATPNT 2,011 1,100 301 26,050,9971,537 356 126,109 1,441,740 1,441,740 0 1,904,315 1.3205,041Crop Total 2,888 1,648 5,044 2,861 381,894 106,398,820 10,064,886 2,589,825 1,495,226 46,082,655 4.580
PECANS
Page 91 3/9/04
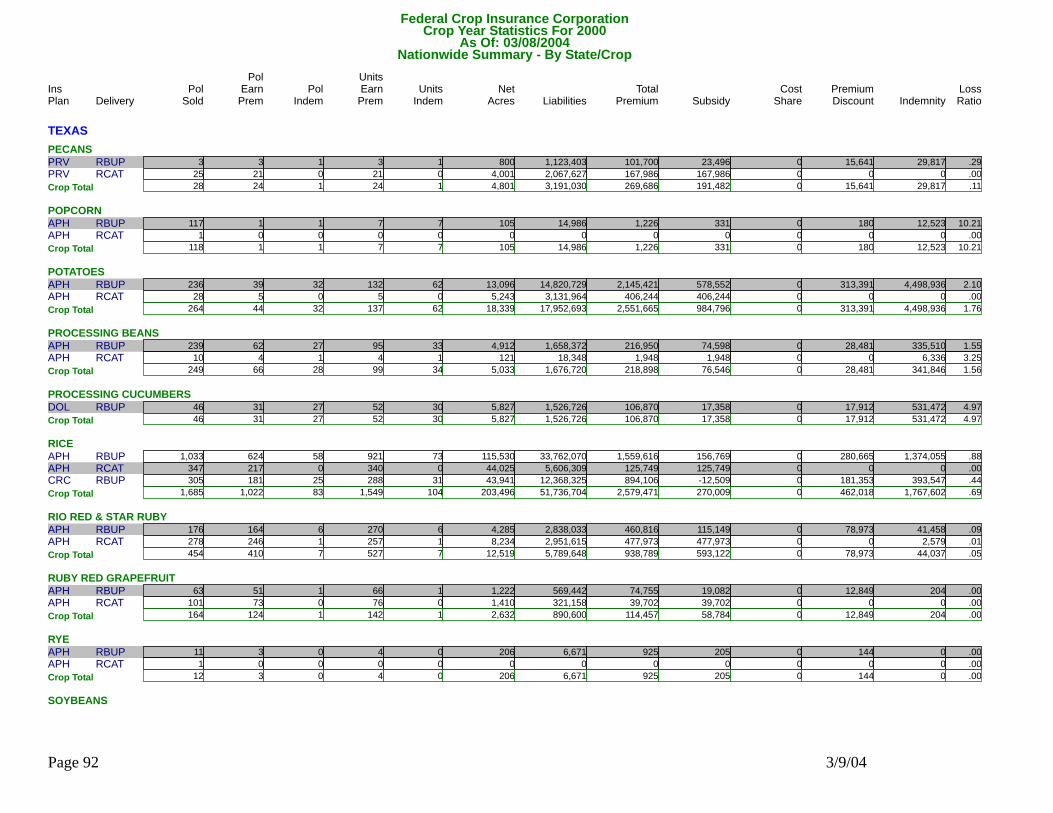
Federal Crop Insurance CorporationNationwide Summary - By State/Crop
Delivery Pol Units Units Net Liabilities Total Subsidy Premium IndemnityPol
Indem EarnPrem Indem Acres Premium Discount LossRatioSold EarnPremIns PolPlan ShareCost
Crop Year Statistics For 2000As Of: 03/08/2004
TEXASPECANS
RBUPPRV 3 3 1 1,123,4033 1 800 101,700 23,496 15,641 29,817 .290RCATPRV 25 21 0 2,067,62721 0 4,001 167,986 167,986 0 0 .00028Crop Total 24 1 24 1 4,801 3,191,030 269,686 191,482 15,641 29,817 .110
POPCORNRBUPAPH 117 1 1 14,9867 7 105 1,226 331 180 12,523 10.210RCATAPH 1 0 0 00 0 0 0 0 0 0 .000
118Crop Total 1 1 7 7 105 14,986 1,226 331 180 12,523 10.210POTATOES
RBUPAPH 236 39 32 14,820,729132 62 13,096 2,145,421 578,552 313,391 4,498,936 2.100RCATAPH 28 5 0 3,131,9645 0 5,243 406,244 406,244 0 0 .000264Crop Total 44 32 137 62 18,339 17,952,693 2,551,665 984,796 313,391 4,498,936 1.760
PROCESSING BEANSRBUPAPH 239 62 27 1,658,37295 33 4,912 216,950 74,598 28,481 335,510 1.550RCATAPH 10 4 1 18,3484 1 121 1,948 1,948 0 6,336 3.250
249Crop Total 66 28 99 34 5,033 1,676,720 218,898 76,546 28,481 341,846 1.560PROCESSING CUCUMBERS
RBUPDOL 46 31 27 1,526,72652 30 5,827 106,870 17,358 17,912 531,472 4.97046Crop Total 31 27 52 30 5,827 1,526,726 106,870 17,358 17,912 531,472 4.970
RICERBUPAPH 1,033 624 58 33,762,070921 73 115,530 1,559,616 156,769 280,665 1,374,055 .880RCATAPH 347 217 0 5,606,309340 0 44,025 125,749 125,749 0 0 .000RBUPCRC 305 181 25 12,368,325288 31 43,941 894,106 -12,509 181,353 393,547 .440
1,685Crop Total 1,022 83 1,549 104 203,496 51,736,704 2,579,471 270,009 462,018 1,767,602 .690RIO RED & STAR RUBY
RBUPAPH 176 164 6 2,838,033270 6 4,285 460,816 115,149 78,973 41,458 .090RCATAPH 278 246 1 2,951,615257 1 8,234 477,973 477,973 0 2,579 .010454Crop Total 410 7 527 7 12,519 5,789,648 938,789 593,122 78,973 44,037 .050
RUBY RED GRAPEFRUITRBUPAPH 63 51 1 569,44266 1 1,222 74,755 19,082 12,849 204 .000RCATAPH 101 73 0 321,15876 0 1,410 39,702 39,702 0 0 .000
164Crop Total 124 1 142 1 2,632 890,600 114,457 58,784 12,849 204 .000RYE
RBUPAPH 11 3 0 6,6714 0 206 925 205 144 0 .000RCATAPH 1 0 0 00 0 0 0 0 0 0 .00012Crop Total 3 0 4 0 206 6,671 925 205 144 0 .000
SOYBEANS
Page 92 3/9/04
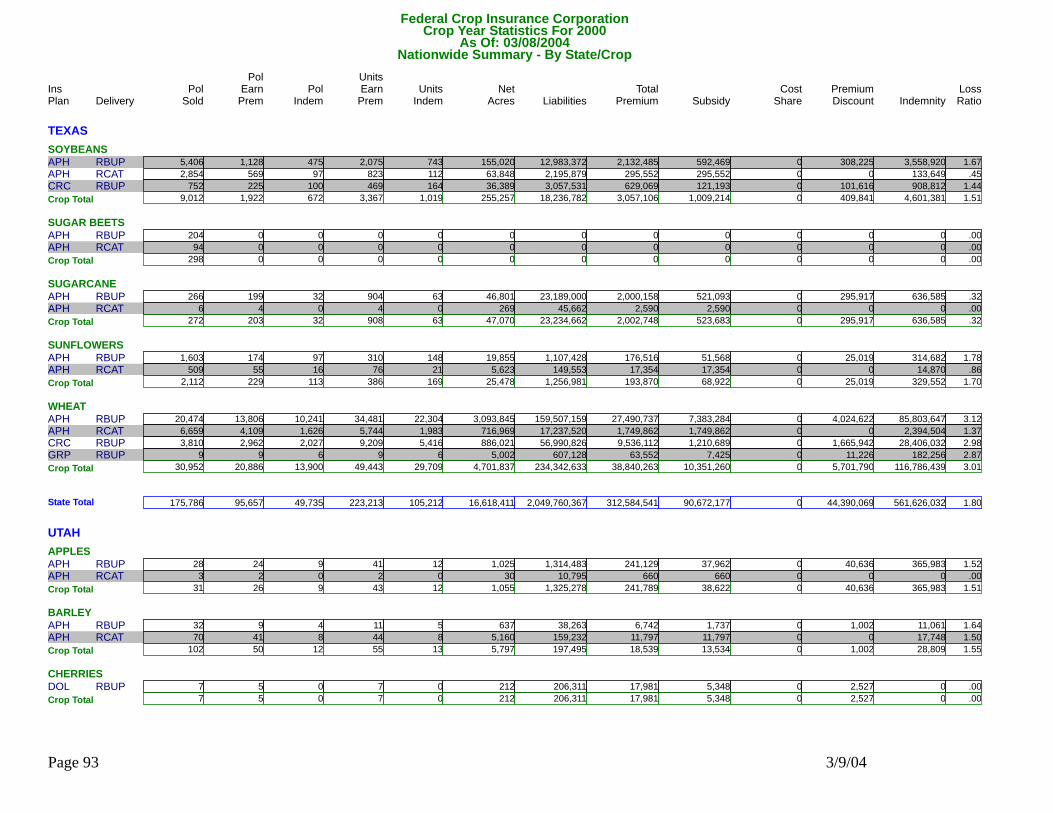
Federal Crop Insurance CorporationNationwide Summary - By State/Crop
Delivery Pol Units Units Net Liabilities Total Subsidy Premium IndemnityPol
Indem EarnPrem Indem Acres Premium Discount LossRatioSold EarnPremIns PolPlan ShareCost
Crop Year Statistics For 2000As Of: 03/08/2004
TEXASSOYBEANS
RBUPAPH 5,406 1,128 475 12,983,3722,075 743 155,020 2,132,485 592,469 308,225 3,558,920 1.670RCATAPH 2,854 569 97 2,195,879823 112 63,848 295,552 295,552 0 133,649 .450RBUPCRC 752 225 100 3,057,531469 164 36,389 629,069 121,193 101,616 908,812 1.4409,012Crop Total 1,922 672 3,367 1,019 255,257 18,236,782 3,057,106 1,009,214 409,841 4,601,381 1.510
SUGAR BEETSRBUPAPH 204 0 0 00 0 0 0 0 0 0 .000RCATAPH 94 0 0 00 0 0 0 0 0 0 .000
298Crop Total 0 0 0 0 0 0 0 0 0 0 .000SUGARCANE
RBUPAPH 266 199 32 23,189,000904 63 46,801 2,000,158 521,093 295,917 636,585 .320RCATAPH 6 4 0 45,6624 0 269 2,590 2,590 0 0 .000272Crop Total 203 32 908 63 47,070 23,234,662 2,002,748 523,683 295,917 636,585 .320
SUNFLOWERSRBUPAPH 1,603 174 97 1,107,428310 148 19,855 176,516 51,568 25,019 314,682 1.780RCATAPH 509 55 16 149,55376 21 5,623 17,354 17,354 0 14,870 .860
2,112Crop Total 229 113 386 169 25,478 1,256,981 193,870 68,922 25,019 329,552 1.700WHEAT
RBUPAPH 20,474 13,806 10,241 159,507,15934,481 22,304 3,093,845 27,490,737 7,383,284 4,024,622 85,803,647 3.120RCATAPH 6,659 4,109 1,626 17,237,5205,744 1,983 716,969 1,749,862 1,749,862 0 2,394,504 1.370RBUPCRC 3,810 2,962 2,027 56,990,8269,209 5,416 886,021 9,536,112 1,210,689 1,665,942 28,406,032 2.980RBUPGRP 9 9 6 607,1289 6 5,002 63,552 7,425 11,226 182,256 2.87030,952Crop Total 20,886 13,900 49,443 29,709 4,701,837 234,342,633 38,840,263 10,351,260 5,701,790 116,786,439 3.010
175,786State Total 95,657 49,735 223,213 105,212 16,618,411 2,049,760,367 312,584,541 90,672,177 44,390,069 561,626,032 1.800
UTAHAPPLES
RBUPAPH 28 24 9 1,314,48341 12 1,025 241,129 37,962 40,636 365,983 1.520RCATAPH 3 2 0 10,7952 0 30 660 660 0 0 .00031Crop Total 26 9 43 12 1,055 1,325,278 241,789 38,622 40,636 365,983 1.510
BARLEYRBUPAPH 32 9 4 38,26311 5 637 6,742 1,737 1,002 11,061 1.640RCATAPH 70 41 8 159,23244 8 5,160 11,797 11,797 0 17,748 1.500
102Crop Total 50 12 55 13 5,797 197,495 18,539 13,534 1,002 28,809 1.550CHERRIES
RBUPDOL 7 5 0 206,3117 0 212 17,981 5,348 2,527 0 .0007Crop Total 5 0 7 0 212 206,311 17,981 5,348 2,527 0 .000
Page 93 3/9/04
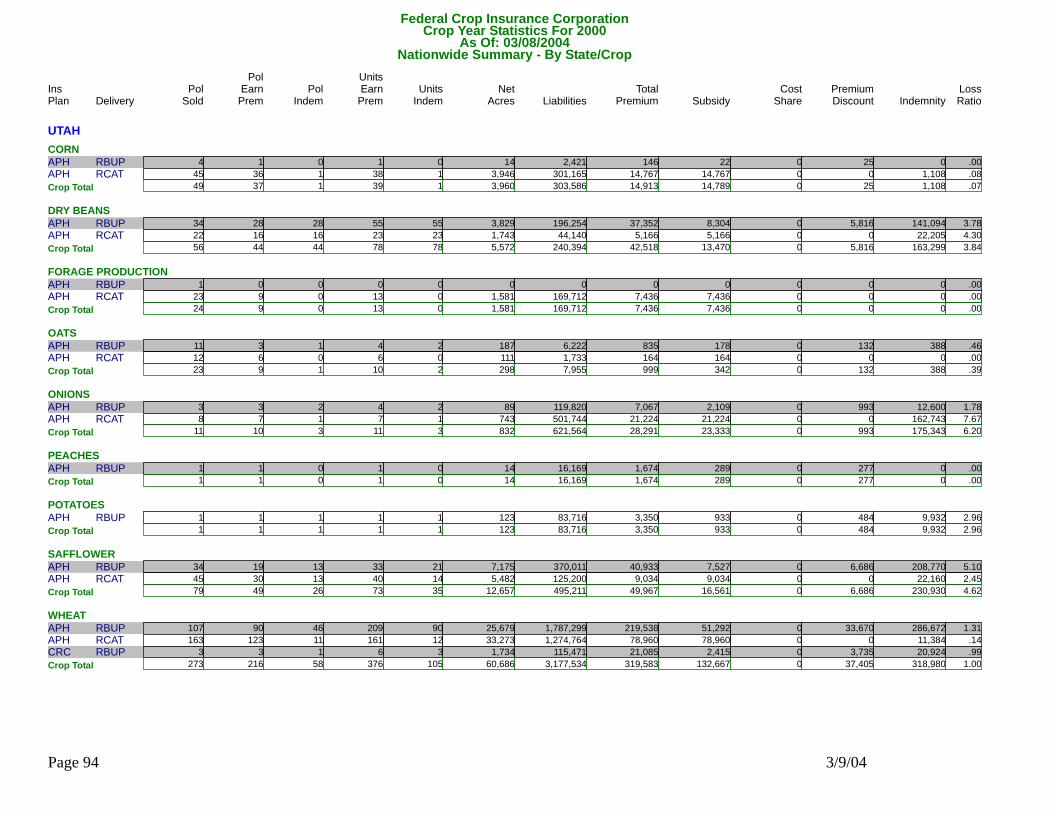
Federal Crop Insurance CorporationNationwide Summary - By State/Crop
Delivery Pol Units Units Net Liabilities Total Subsidy Premium IndemnityPol
Indem EarnPrem Indem Acres Premium Discount LossRatioSold EarnPremIns PolPlan ShareCost
Crop Year Statistics For 2000As Of: 03/08/2004
UTAHCORN
RBUPAPH 4 1 0 2,4211 0 14 146 22 25 0 .000RCATAPH 45 36 1 301,16538 1 3,946 14,767 14,767 0 1,108 .08049Crop Total 37 1 39 1 3,960 303,586 14,913 14,789 25 1,108 .070
DRY BEANSRBUPAPH 34 28 28 196,25455 55 3,829 37,352 8,304 5,816 141,094 3.780RCATAPH 22 16 16 44,14023 23 1,743 5,166 5,166 0 22,205 4.300
56Crop Total 44 44 78 78 5,572 240,394 42,518 13,470 5,816 163,299 3.840FORAGE PRODUCTION
RBUPAPH 1 0 0 00 0 0 0 0 0 0 .000RCATAPH 23 9 0 169,71213 0 1,581 7,436 7,436 0 0 .00024Crop Total 9 0 13 0 1,581 169,712 7,436 7,436 0 0 .000
OATSRBUPAPH 11 3 1 6,2224 2 187 835 178 132 388 .460RCATAPH 12 6 0 1,7336 0 111 164 164 0 0 .000
23Crop Total 9 1 10 2 298 7,955 999 342 132 388 .390ONIONS
RBUPAPH 3 3 2 119,8204 2 89 7,067 2,109 993 12,600 1.780RCATAPH 8 7 1 501,7447 1 743 21,224 21,224 0 162,743 7.67011Crop Total 10 3 11 3 832 621,564 28,291 23,333 993 175,343 6.200
PEACHESRBUPAPH 1 1 0 16,1691 0 14 1,674 289 277 0 .000
1Crop Total 1 0 1 0 14 16,169 1,674 289 277 0 .000POTATOES
RBUPAPH 1 1 1 83,7161 1 123 3,350 933 484 9,932 2.9601Crop Total 1 1 1 1 123 83,716 3,350 933 484 9,932 2.960
SAFFLOWERRBUPAPH 34 19 13 370,01133 21 7,175 40,933 7,527 6,686 208,770 5.100RCATAPH 45 30 13 125,20040 14 5,482 9,034 9,034 0 22,160 2.450
79Crop Total 49 26 73 35 12,657 495,211 49,967 16,561 6,686 230,930 4.620WHEAT
RBUPAPH 107 90 46 1,787,299209 90 25,679 219,538 51,292 33,670 286,672 1.310RCATAPH 163 123 11 1,274,764161 12 33,273 78,960 78,960 0 11,384 .140RBUPCRC 3 3 1 115,4716 3 1,734 21,085 2,415 3,735 20,924 .990273Crop Total 216 58 376 105 60,686 3,177,534 319,583 132,667 37,405 318,980 1.000
Page 94 3/9/04
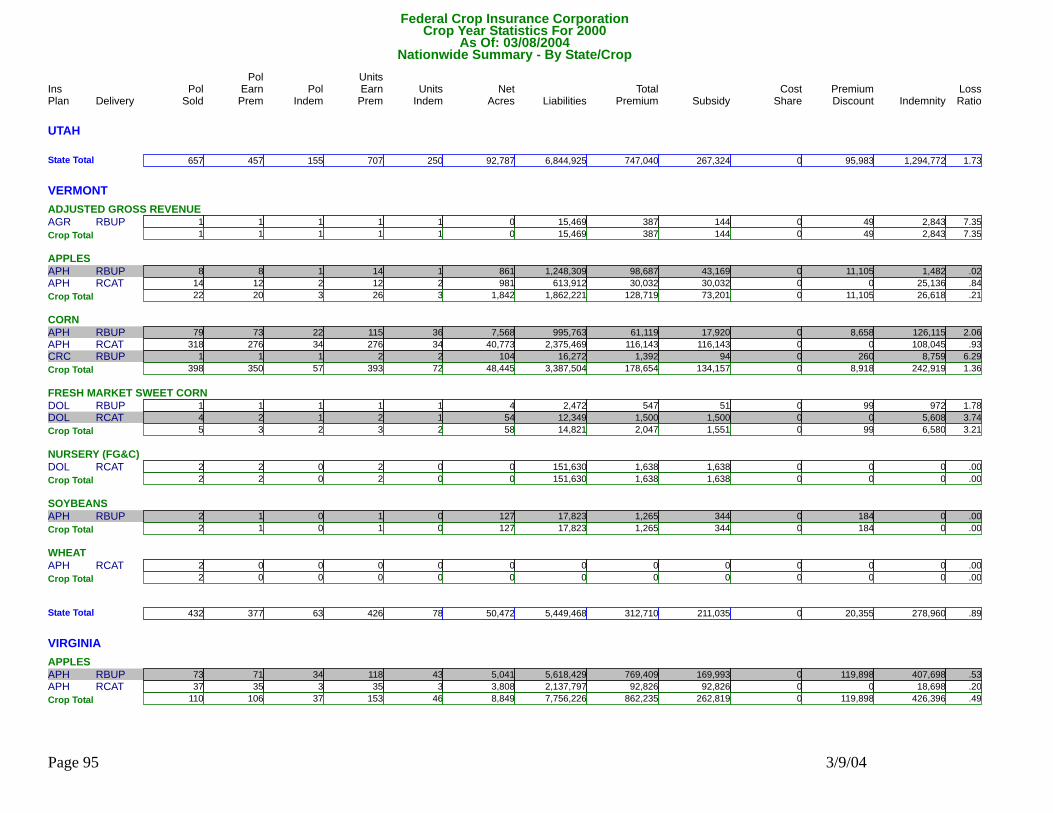
Federal Crop Insurance CorporationNationwide Summary - By State/Crop
Delivery Pol Units Units Net Liabilities Total Subsidy Premium IndemnityPol
Indem EarnPrem Indem Acres Premium Discount LossRatioSold EarnPremIns PolPlan ShareCost
Crop Year Statistics For 2000As Of: 03/08/2004
UTAH657State Total 457 155 707 250 92,787 6,844,925 747,040 267,324 95,983 1,294,772 1.730
VERMONTADJUSTED GROSS REVENUE
RBUPAGR 1 1 1 15,4691 1 0 387 144 49 2,843 7.3501Crop Total 1 1 1 1 0 15,469 387 144 49 2,843 7.350
APPLESRBUPAPH 8 8 1 1,248,30914 1 861 98,687 43,169 11,105 1,482 .020RCATAPH 14 12 2 613,91212 2 981 30,032 30,032 0 25,136 .840
22Crop Total 20 3 26 3 1,842 1,862,221 128,719 73,201 11,105 26,618 .210CORN
RBUPAPH 79 73 22 995,763115 36 7,568 61,119 17,920 8,658 126,115 2.060RCATAPH 318 276 34 2,375,469276 34 40,773 116,143 116,143 0 108,045 .930RBUPCRC 1 1 1 16,2722 2 104 1,392 94 260 8,759 6.290398Crop Total 350 57 393 72 48,445 3,387,504 178,654 134,157 8,918 242,919 1.360
FRESH MARKET SWEET CORNRBUPDOL 1 1 1 2,4721 1 4 547 51 99 972 1.780RCATDOL 4 2 1 12,3492 1 54 1,500 1,500 0 5,608 3.740
5Crop Total 3 2 3 2 58 14,821 2,047 1,551 99 6,580 3.210NURSERY (FG&C)
RCATDOL 2 2 0 151,6302 0 0 1,638 1,638 0 0 .0002Crop Total 2 0 2 0 0 151,630 1,638 1,638 0 0 .000
SOYBEANSRBUPAPH 2 1 0 17,8231 0 127 1,265 344 184 0 .000
2Crop Total 1 0 1 0 127 17,823 1,265 344 184 0 .000WHEAT
RCATAPH 2 0 0 00 0 0 0 0 0 0 .0002Crop Total 0 0 0 0 0 0 0 0 0 0 .000
432State Total 377 63 426 78 50,472 5,449,468 312,710 211,035 20,355 278,960 .890
VIRGINIAAPPLES
RBUPAPH 73 71 34 5,618,429118 43 5,041 769,409 169,993 119,898 407,698 .530RCATAPH 37 35 3 2,137,79735 3 3,808 92,826 92,826 0 18,698 .200110Crop Total 106 37 153 46 8,849 7,756,226 862,235 262,819 119,898 426,396 .490
Page 95 3/9/04
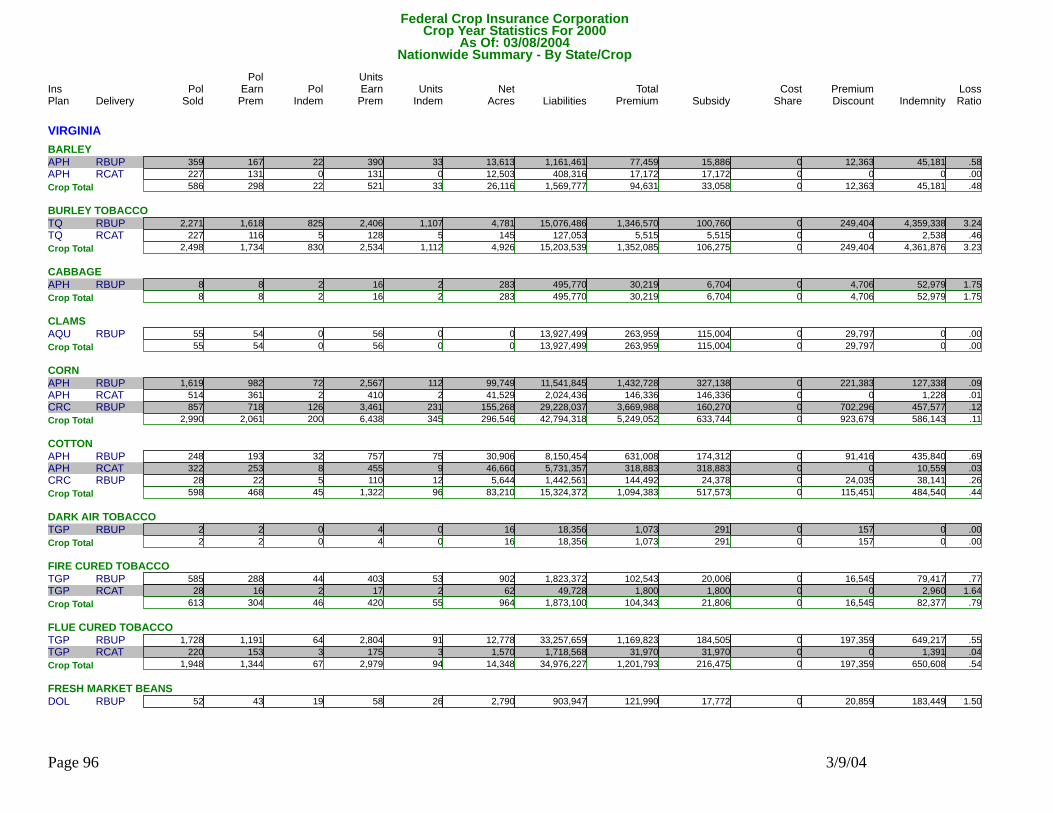
Federal Crop Insurance CorporationNationwide Summary - By State/Crop
Delivery Pol Units Units Net Liabilities Total Subsidy Premium IndemnityPol
Indem EarnPrem Indem Acres Premium Discount LossRatioSold EarnPremIns PolPlan ShareCost
Crop Year Statistics For 2000As Of: 03/08/2004
VIRGINIABARLEY
RBUPAPH 359 167 22 1,161,461390 33 13,613 77,459 15,886 12,363 45,181 .580RCATAPH 227 131 0 408,316131 0 12,503 17,172 17,172 0 0 .000586Crop Total 298 22 521 33 26,116 1,569,777 94,631 33,058 12,363 45,181 .480
BURLEY TOBACCORBUPTQ 2,271 1,618 825 15,076,4862,406 1,107 4,781 1,346,570 100,760 249,404 4,359,338 3.240RCATTQ 227 116 5 127,053128 5 145 5,515 5,515 0 2,538 .460
2,498Crop Total 1,734 830 2,534 1,112 4,926 15,203,539 1,352,085 106,275 249,404 4,361,876 3.230CABBAGE
RBUPAPH 8 8 2 495,77016 2 283 30,219 6,704 4,706 52,979 1.7508Crop Total 8 2 16 2 283 495,770 30,219 6,704 4,706 52,979 1.750
CLAMSRBUPAQU 55 54 0 13,927,49956 0 0 263,959 115,004 29,797 0 .000
55Crop Total 54 0 56 0 0 13,927,499 263,959 115,004 29,797 0 .000CORN
RBUPAPH 1,619 982 72 11,541,8452,567 112 99,749 1,432,728 327,138 221,383 127,338 .090RCATAPH 514 361 2 2,024,436410 2 41,529 146,336 146,336 0 1,228 .010RBUPCRC 857 718 126 29,228,0373,461 231 155,268 3,669,988 160,270 702,296 457,577 .1202,990Crop Total 2,061 200 6,438 345 296,546 42,794,318 5,249,052 633,744 923,679 586,143 .110
COTTONRBUPAPH 248 193 32 8,150,454757 75 30,906 631,008 174,312 91,416 435,840 .690RCATAPH 322 253 8 5,731,357455 9 46,660 318,883 318,883 0 10,559 .030RBUPCRC 28 22 5 1,442,561110 12 5,644 144,492 24,378 24,035 38,141 .260
598Crop Total 468 45 1,322 96 83,210 15,324,372 1,094,383 517,573 115,451 484,540 .440DARK AIR TOBACCO
RBUPTGP 2 2 0 18,3564 0 16 1,073 291 157 0 .0002Crop Total 2 0 4 0 16 18,356 1,073 291 157 0 .000
FIRE CURED TOBACCORBUPTGP 585 288 44 1,823,372403 53 902 102,543 20,006 16,545 79,417 .770RCATTGP 28 16 2 49,72817 2 62 1,800 1,800 0 2,960 1.640
613Crop Total 304 46 420 55 964 1,873,100 104,343 21,806 16,545 82,377 .790FLUE CURED TOBACCO
RBUPTGP 1,728 1,191 64 33,257,6592,804 91 12,778 1,169,823 184,505 197,359 649,217 .550RCATTGP 220 153 3 1,718,568175 3 1,570 31,970 31,970 0 1,391 .0401,948Crop Total 1,344 67 2,979 94 14,348 34,976,227 1,201,793 216,475 197,359 650,608 .540
FRESH MARKET BEANSRBUPDOL 52 43 19 903,94758 26 2,790 121,990 17,772 20,859 183,449 1.500
Page 96 3/9/04
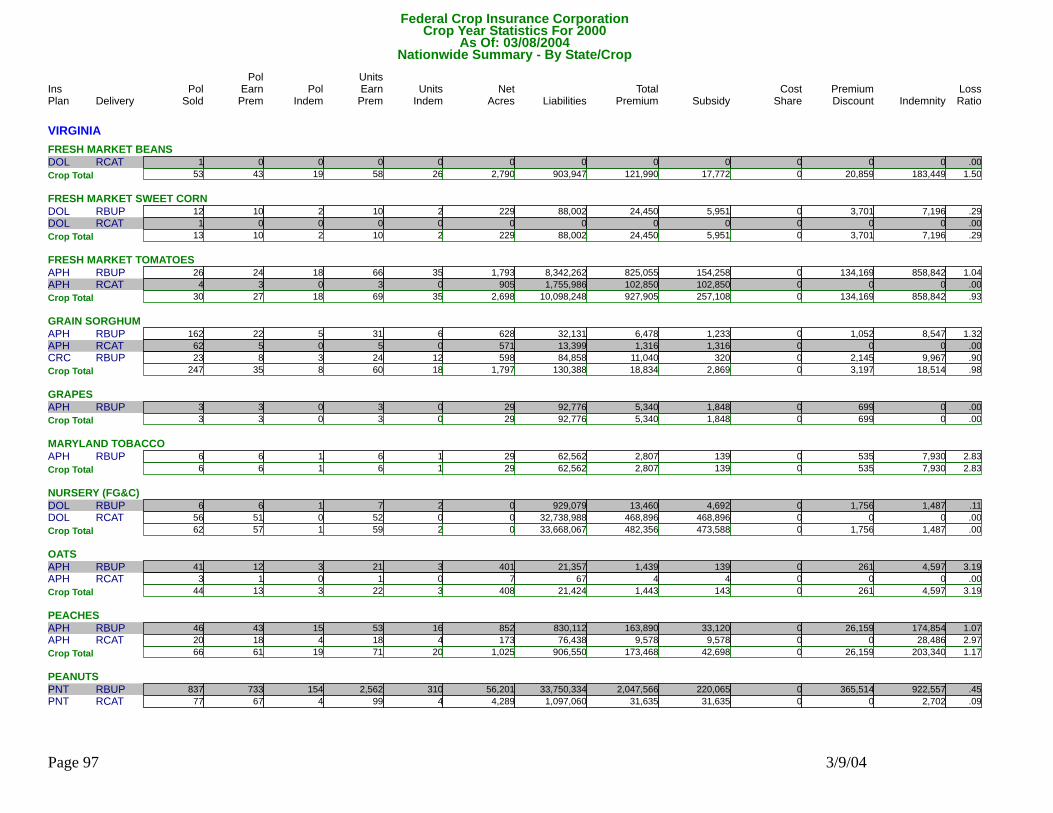
Federal Crop Insurance CorporationNationwide Summary - By State/Crop
Delivery Pol Units Units Net Liabilities Total Subsidy Premium IndemnityPol
Indem EarnPrem Indem Acres Premium Discount LossRatioSold EarnPremIns PolPlan ShareCost
Crop Year Statistics For 2000As Of: 03/08/2004
VIRGINIAFRESH MARKET BEANS
RCATDOL 1 0 0 00 0 0 0 0 0 0 .00053Crop Total 43 19 58 26 2,790 903,947 121,990 17,772 20,859 183,449 1.500
FRESH MARKET SWEET CORNRBUPDOL 12 10 2 88,00210 2 229 24,450 5,951 3,701 7,196 .290RCATDOL 1 0 0 00 0 0 0 0 0 0 .000
13Crop Total 10 2 10 2 229 88,002 24,450 5,951 3,701 7,196 .290FRESH MARKET TOMATOES
RBUPAPH 26 24 18 8,342,26266 35 1,793 825,055 154,258 134,169 858,842 1.040RCATAPH 4 3 0 1,755,9863 0 905 102,850 102,850 0 0 .00030Crop Total 27 18 69 35 2,698 10,098,248 927,905 257,108 134,169 858,842 .930
GRAIN SORGHUMRBUPAPH 162 22 5 32,13131 6 628 6,478 1,233 1,052 8,547 1.320RCATAPH 62 5 0 13,3995 0 571 1,316 1,316 0 0 .000RBUPCRC 23 8 3 84,85824 12 598 11,040 320 2,145 9,967 .900
247Crop Total 35 8 60 18 1,797 130,388 18,834 2,869 3,197 18,514 .980GRAPES
RBUPAPH 3 3 0 92,7763 0 29 5,340 1,848 699 0 .0003Crop Total 3 0 3 0 29 92,776 5,340 1,848 699 0 .000
MARYLAND TOBACCORBUPAPH 6 6 1 62,5626 1 29 2,807 139 535 7,930 2.830
6Crop Total 6 1 6 1 29 62,562 2,807 139 535 7,930 2.830NURSERY (FG&C)
RBUPDOL 6 6 1 929,0797 2 0 13,460 4,692 1,756 1,487 .110RCATDOL 56 51 0 32,738,98852 0 0 468,896 468,896 0 0 .00062Crop Total 57 1 59 2 0 33,668,067 482,356 473,588 1,756 1,487 .000
OATSRBUPAPH 41 12 3 21,35721 3 401 1,439 139 261 4,597 3.190RCATAPH 3 1 0 671 0 7 4 4 0 0 .000
44Crop Total 13 3 22 3 408 21,424 1,443 143 261 4,597 3.190PEACHES
RBUPAPH 46 43 15 830,11253 16 852 163,890 33,120 26,159 174,854 1.070RCATAPH 20 18 4 76,43818 4 173 9,578 9,578 0 28,486 2.97066Crop Total 61 19 71 20 1,025 906,550 173,468 42,698 26,159 203,340 1.170
PEANUTSRBUPPNT 837 733 154 33,750,3342,562 310 56,201 2,047,566 220,065 365,514 922,557 .450RCATPNT 77 67 4 1,097,06099 4 4,289 31,635 31,635 0 2,702 .090
Page 97 3/9/04
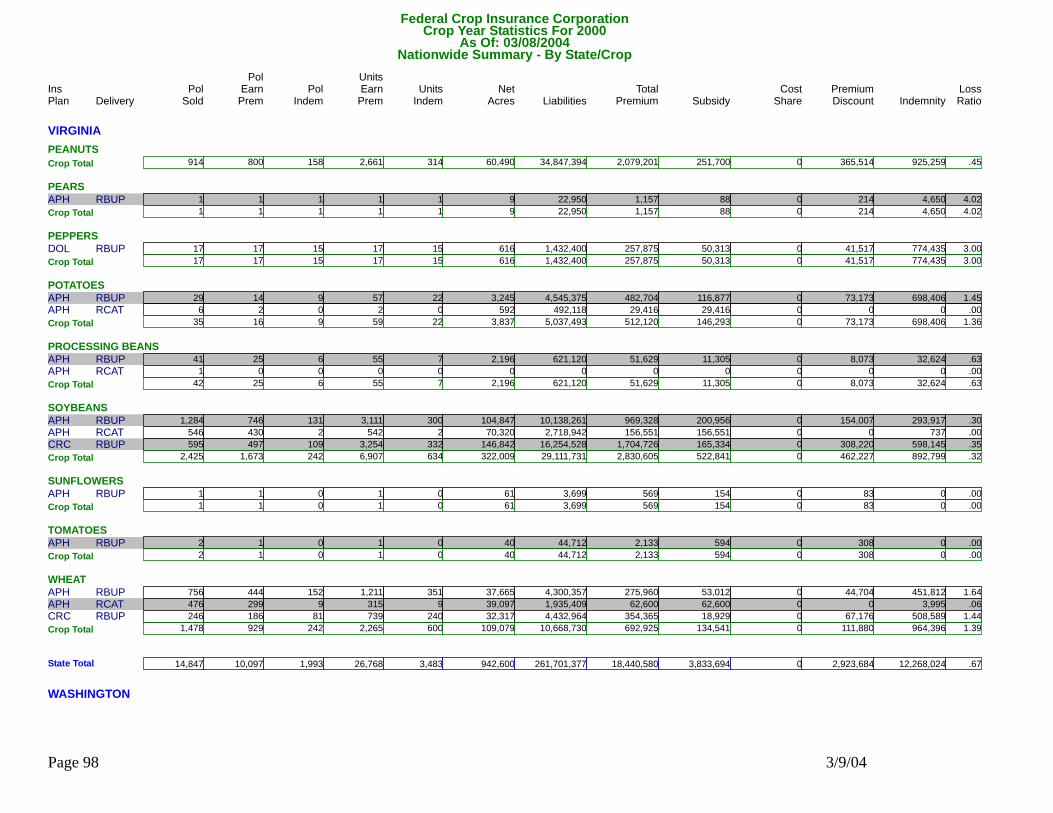
Federal Crop Insurance CorporationNationwide Summary - By State/Crop
Delivery Pol Units Units Net Liabilities Total Subsidy Premium IndemnityPol
Indem EarnPrem Indem Acres Premium Discount LossRatioSold EarnPremIns PolPlan ShareCost
Crop Year Statistics For 2000As Of: 03/08/2004
VIRGINIAPEANUTS
914Crop Total 800 158 2,661 314 60,490 34,847,394 2,079,201 251,700 365,514 925,259 .450PEARS
RBUPAPH 1 1 1 22,9501 1 9 1,157 88 214 4,650 4.0201Crop Total 1 1 1 1 9 22,950 1,157 88 214 4,650 4.020
PEPPERSRBUPDOL 17 17 15 1,432,40017 15 616 257,875 50,313 41,517 774,435 3.000
17Crop Total 17 15 17 15 616 1,432,400 257,875 50,313 41,517 774,435 3.000POTATOES
RBUPAPH 29 14 9 4,545,37557 22 3,245 482,704 116,877 73,173 698,406 1.450RCATAPH 6 2 0 492,1182 0 592 29,416 29,416 0 0 .00035Crop Total 16 9 59 22 3,837 5,037,493 512,120 146,293 73,173 698,406 1.360
PROCESSING BEANSRBUPAPH 41 25 6 621,12055 7 2,196 51,629 11,305 8,073 32,624 .630RCATAPH 1 0 0 00 0 0 0 0 0 0 .000
42Crop Total 25 6 55 7 2,196 621,120 51,629 11,305 8,073 32,624 .630SOYBEANS
RBUPAPH 1,284 746 131 10,138,2613,111 300 104,847 969,328 200,956 154,007 293,917 .300RCATAPH 546 430 2 2,718,942542 2 70,320 156,551 156,551 0 737 .000RBUPCRC 595 497 109 16,254,5283,254 332 146,842 1,704,726 165,334 308,220 598,145 .3502,425Crop Total 1,673 242 6,907 634 322,009 29,111,731 2,830,605 522,841 462,227 892,799 .320
SUNFLOWERSRBUPAPH 1 1 0 3,6991 0 61 569 154 83 0 .000
1Crop Total 1 0 1 0 61 3,699 569 154 83 0 .000TOMATOES
RBUPAPH 2 1 0 44,7121 0 40 2,133 594 308 0 .0002Crop Total 1 0 1 0 40 44,712 2,133 594 308 0 .000
WHEATRBUPAPH 756 444 152 4,300,3571,211 351 37,665 275,960 53,012 44,704 451,812 1.640RCATAPH 476 299 9 1,935,409315 9 39,097 62,600 62,600 0 3,995 .060RBUPCRC 246 186 81 4,432,964739 240 32,317 354,365 18,929 67,176 508,589 1.440
1,478Crop Total 929 242 2,265 600 109,079 10,668,730 692,925 134,541 111,880 964,396 1.390
14,847State Total 10,097 1,993 26,768 3,483 942,600 261,701,377 18,440,580 3,833,694 2,923,684 12,268,024 .670
WASHINGTON
Page 98 3/9/04
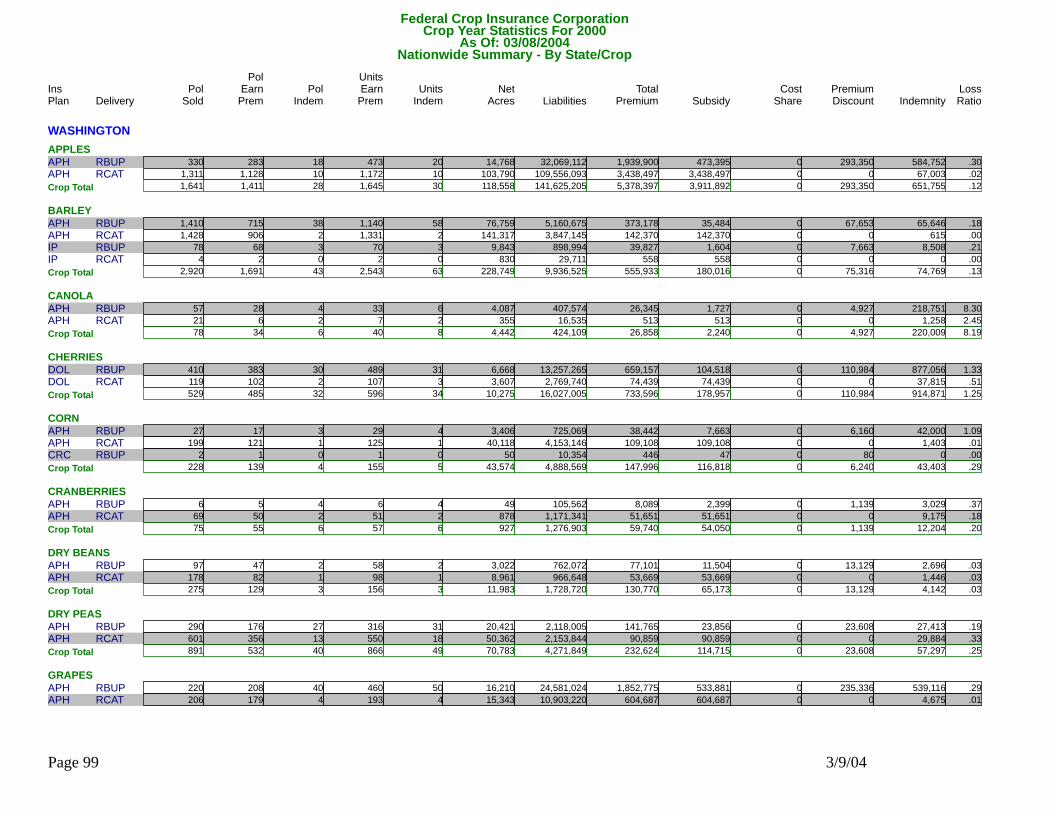
Federal Crop Insurance CorporationNationwide Summary - By State/Crop
Delivery Pol Units Units Net Liabilities Total Subsidy Premium IndemnityPol
Indem EarnPrem Indem Acres Premium Discount LossRatioSold EarnPremIns PolPlan ShareCost
Crop Year Statistics For 2000As Of: 03/08/2004
WASHINGTONAPPLES
RBUPAPH 330 283 18 32,069,112473 20 14,768 1,939,900 473,395 293,350 584,752 .300RCATAPH 1,311 1,128 10 109,556,0931,172 10 103,790 3,438,497 3,438,497 0 67,003 .0201,641Crop Total 1,411 28 1,645 30 118,558 141,625,205 5,378,397 3,911,892 293,350 651,755 .120
BARLEYRBUPAPH 1,410 715 38 5,160,6751,140 58 76,759 373,178 35,484 67,653 65,646 .180RCATAPH 1,428 906 2 3,847,1451,331 2 141,317 142,370 142,370 0 615 .000RBUPIP 78 68 3 898,99470 3 9,843 39,827 1,604 7,663 8,508 .210RCATIP 4 2 0 29,7112 0 830 558 558 0 0 .000
2,920Crop Total 1,691 43 2,543 63 228,749 9,936,525 555,933 180,016 75,316 74,769 .130CANOLA
RBUPAPH 57 28 4 407,57433 6 4,087 26,345 1,727 4,927 218,751 8.300RCATAPH 21 6 2 16,5357 2 355 513 513 0 1,258 2.45078Crop Total 34 6 40 8 4,442 424,109 26,858 2,240 4,927 220,009 8.190
CHERRIESRBUPDOL 410 383 30 13,257,265489 31 6,668 659,157 104,518 110,984 877,056 1.330RCATDOL 119 102 2 2,769,740107 3 3,607 74,439 74,439 0 37,815 .510
529Crop Total 485 32 596 34 10,275 16,027,005 733,596 178,957 110,984 914,871 1.250CORN
RBUPAPH 27 17 3 725,06929 4 3,406 38,442 7,663 6,160 42,000 1.090RCATAPH 199 121 1 4,153,146125 1 40,118 109,108 109,108 0 1,403 .010RBUPCRC 2 1 0 10,3541 0 50 446 47 80 0 .000228Crop Total 139 4 155 5 43,574 4,888,569 147,996 116,818 6,240 43,403 .290
CRANBERRIESRBUPAPH 6 5 4 105,5626 4 49 8,089 2,399 1,139 3,029 .370RCATAPH 69 50 2 1,171,34151 2 878 51,651 51,651 0 9,175 .180
75Crop Total 55 6 57 6 927 1,276,903 59,740 54,050 1,139 12,204 .200DRY BEANS
RBUPAPH 97 47 2 762,07258 2 3,022 77,101 11,504 13,129 2,696 .030RCATAPH 178 82 1 966,64898 1 8,961 53,669 53,669 0 1,446 .030275Crop Total 129 3 156 3 11,983 1,728,720 130,770 65,173 13,129 4,142 .030
DRY PEASRBUPAPH 290 176 27 2,118,005316 31 20,421 141,765 23,856 23,608 27,413 .190RCATAPH 601 356 13 2,153,844550 18 50,362 90,859 90,859 0 29,884 .330
891Crop Total 532 40 866 49 70,783 4,271,849 232,624 114,715 23,608 57,297 .250GRAPES
RBUPAPH 220 208 40 24,581,024460 50 16,210 1,852,775 533,881 235,336 539,116 .290RCATAPH 206 179 4 10,903,220193 4 15,343 604,687 604,687 0 4,675 .010
Page 99 3/9/04
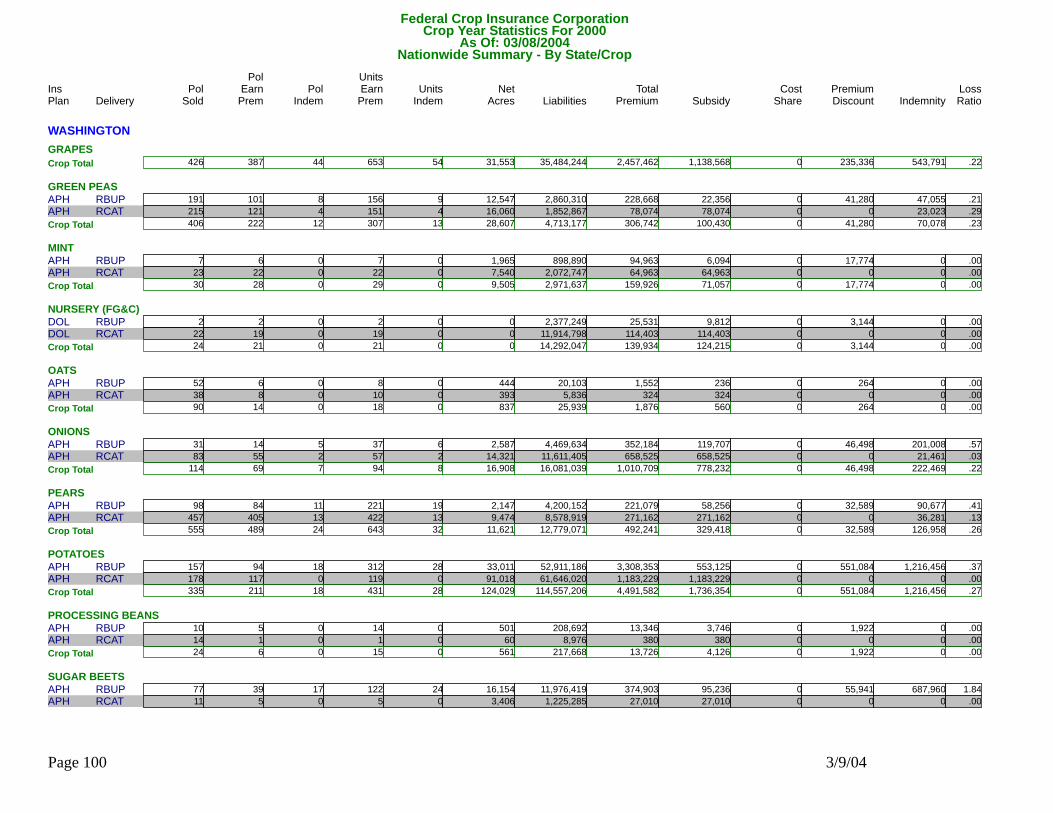
Federal Crop Insurance CorporationNationwide Summary - By State/Crop
Delivery Pol Units Units Net Liabilities Total Subsidy Premium IndemnityPol
Indem EarnPrem Indem Acres Premium Discount LossRatioSold EarnPremIns PolPlan ShareCost
Crop Year Statistics For 2000As Of: 03/08/2004
WASHINGTONGRAPES
426Crop Total 387 44 653 54 31,553 35,484,244 2,457,462 1,138,568 235,336 543,791 .220GREEN PEAS
RBUPAPH 191 101 8 2,860,310156 9 12,547 228,668 22,356 41,280 47,055 .210RCATAPH 215 121 4 1,852,867151 4 16,060 78,074 78,074 0 23,023 .290406Crop Total 222 12 307 13 28,607 4,713,177 306,742 100,430 41,280 70,078 .230
MINTRBUPAPH 7 6 0 898,8907 0 1,965 94,963 6,094 17,774 0 .000RCATAPH 23 22 0 2,072,74722 0 7,540 64,963 64,963 0 0 .000
30Crop Total 28 0 29 0 9,505 2,971,637 159,926 71,057 17,774 0 .000NURSERY (FG&C)
RBUPDOL 2 2 0 2,377,2492 0 0 25,531 9,812 3,144 0 .000RCATDOL 22 19 0 11,914,79819 0 0 114,403 114,403 0 0 .00024Crop Total 21 0 21 0 0 14,292,047 139,934 124,215 3,144 0 .000
OATSRBUPAPH 52 6 0 20,1038 0 444 1,552 236 264 0 .000RCATAPH 38 8 0 5,83610 0 393 324 324 0 0 .000
90Crop Total 14 0 18 0 837 25,939 1,876 560 264 0 .000ONIONS
RBUPAPH 31 14 5 4,469,63437 6 2,587 352,184 119,707 46,498 201,008 .570RCATAPH 83 55 2 11,611,40557 2 14,321 658,525 658,525 0 21,461 .030114Crop Total 69 7 94 8 16,908 16,081,039 1,010,709 778,232 46,498 222,469 .220
PEARSRBUPAPH 98 84 11 4,200,152221 19 2,147 221,079 58,256 32,589 90,677 .410RCATAPH 457 405 13 8,578,919422 13 9,474 271,162 271,162 0 36,281 .130
555Crop Total 489 24 643 32 11,621 12,779,071 492,241 329,418 32,589 126,958 .260POTATOES
RBUPAPH 157 94 18 52,911,186312 28 33,011 3,308,353 553,125 551,084 1,216,456 .370RCATAPH 178 117 0 61,646,020119 0 91,018 1,183,229 1,183,229 0 0 .000335Crop Total 211 18 431 28 124,029 114,557,206 4,491,582 1,736,354 551,084 1,216,456 .270
PROCESSING BEANSRBUPAPH 10 5 0 208,69214 0 501 13,346 3,746 1,922 0 .000RCATAPH 14 1 0 8,9761 0 60 380 380 0 0 .000
24Crop Total 6 0 15 0 561 217,668 13,726 4,126 1,922 0 .000SUGAR BEETS
RBUPAPH 77 39 17 11,976,419122 24 16,154 374,903 95,236 55,941 687,960 1.840RCATAPH 11 5 0 1,225,2855 0 3,406 27,010 27,010 0 0 .000
Page 100 3/9/04
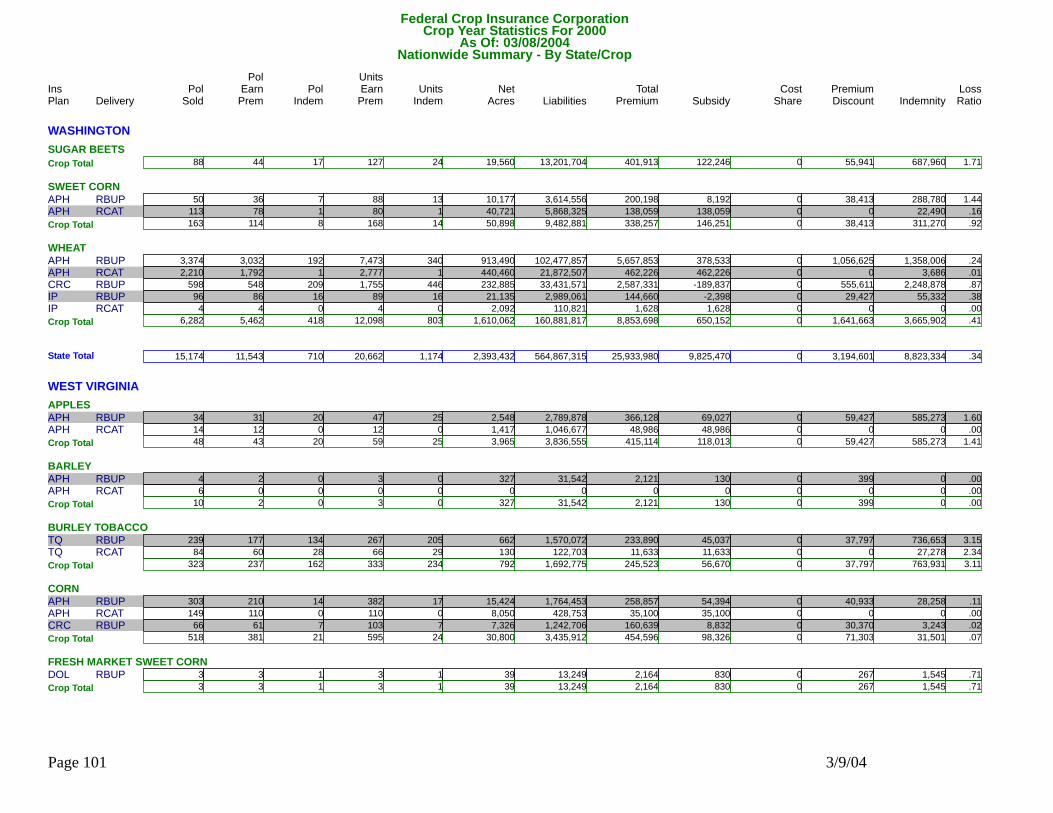
Federal Crop Insurance CorporationNationwide Summary - By State/Crop
Delivery Pol Units Units Net Liabilities Total Subsidy Premium IndemnityPol
Indem EarnPrem Indem Acres Premium Discount LossRatioSold EarnPremIns PolPlan ShareCost
Crop Year Statistics For 2000As Of: 03/08/2004
WASHINGTONSUGAR BEETS
88Crop Total 44 17 127 24 19,560 13,201,704 401,913 122,246 55,941 687,960 1.710SWEET CORN
RBUPAPH 50 36 7 3,614,55688 13 10,177 200,198 8,192 38,413 288,780 1.440RCATAPH 113 78 1 5,868,32580 1 40,721 138,059 138,059 0 22,490 .160163Crop Total 114 8 168 14 50,898 9,482,881 338,257 146,251 38,413 311,270 .920
WHEATRBUPAPH 3,374 3,032 192 102,477,8577,473 340 913,490 5,657,853 378,533 1,056,625 1,358,006 .240RCATAPH 2,210 1,792 1 21,872,5072,777 1 440,460 462,226 462,226 0 3,686 .010RBUPCRC 598 548 209 33,431,5711,755 446 232,885 2,587,331 -189,837 555,611 2,248,878 .870RBUPIP 96 86 16 2,989,06189 16 21,135 144,660 -2,398 29,427 55,332 .380RCATIP 4 4 0 110,8214 0 2,092 1,628 1,628 0 0 .000
6,282Crop Total 5,462 418 12,098 803 1,610,062 160,881,817 8,853,698 650,152 1,641,663 3,665,902 .410
15,174State Total 11,543 710 20,662 1,174 2,393,432 564,867,315 25,933,980 9,825,470 3,194,601 8,823,334 .340
WEST VIRGINIAAPPLES
RBUPAPH 34 31 20 2,789,87847 25 2,548 366,128 69,027 59,427 585,273 1.600RCATAPH 14 12 0 1,046,67712 0 1,417 48,986 48,986 0 0 .00048Crop Total 43 20 59 25 3,965 3,836,555 415,114 118,013 59,427 585,273 1.410
BARLEYRBUPAPH 4 2 0 31,5423 0 327 2,121 130 399 0 .000RCATAPH 6 0 0 00 0 0 0 0 0 0 .000
10Crop Total 2 0 3 0 327 31,542 2,121 130 399 0 .000BURLEY TOBACCO
RBUPTQ 239 177 134 1,570,072267 205 662 233,890 45,037 37,797 736,653 3.150RCATTQ 84 60 28 122,70366 29 130 11,633 11,633 0 27,278 2.340323Crop Total 237 162 333 234 792 1,692,775 245,523 56,670 37,797 763,931 3.110
CORNRBUPAPH 303 210 14 1,764,453382 17 15,424 258,857 54,394 40,933 28,258 .110RCATAPH 149 110 0 428,753110 0 8,050 35,100 35,100 0 0 .000RBUPCRC 66 61 7 1,242,706103 7 7,326 160,639 8,832 30,370 3,243 .020
518Crop Total 381 21 595 24 30,800 3,435,912 454,596 98,326 71,303 31,501 .070FRESH MARKET SWEET CORN
RBUPDOL 3 3 1 13,2493 1 39 2,164 830 267 1,545 .7103Crop Total 3 1 3 1 39 13,249 2,164 830 267 1,545 .710
Page 101 3/9/04
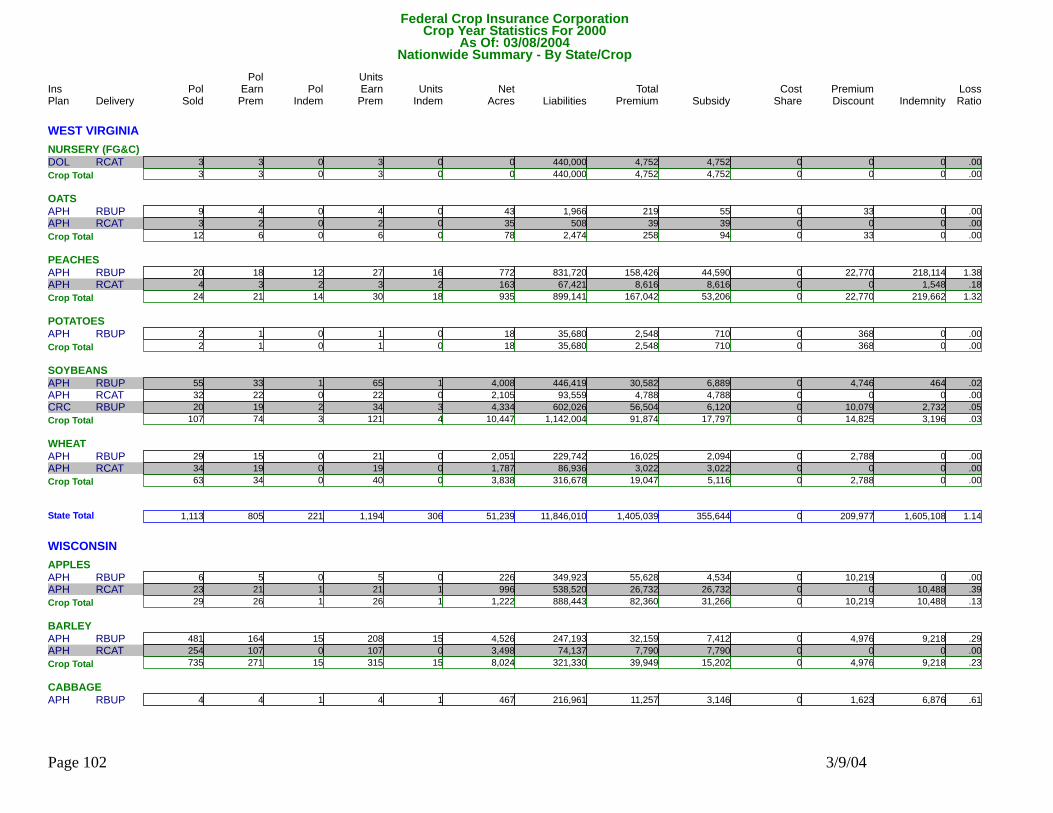
Federal Crop Insurance CorporationNationwide Summary - By State/Crop
Delivery Pol Units Units Net Liabilities Total Subsidy Premium IndemnityPol
Indem EarnPrem Indem Acres Premium Discount LossRatioSold EarnPremIns PolPlan ShareCost
Crop Year Statistics For 2000As Of: 03/08/2004
WEST VIRGINIANURSERY (FG&C)
RCATDOL 3 3 0 440,0003 0 0 4,752 4,752 0 0 .0003Crop Total 3 0 3 0 0 440,000 4,752 4,752 0 0 .000
OATSRBUPAPH 9 4 0 1,9664 0 43 219 55 33 0 .000RCATAPH 3 2 0 5082 0 35 39 39 0 0 .000
12Crop Total 6 0 6 0 78 2,474 258 94 33 0 .000PEACHES
RBUPAPH 20 18 12 831,72027 16 772 158,426 44,590 22,770 218,114 1.380RCATAPH 4 3 2 67,4213 2 163 8,616 8,616 0 1,548 .18024Crop Total 21 14 30 18 935 899,141 167,042 53,206 22,770 219,662 1.320
POTATOESRBUPAPH 2 1 0 35,6801 0 18 2,548 710 368 0 .000
2Crop Total 1 0 1 0 18 35,680 2,548 710 368 0 .000SOYBEANS
RBUPAPH 55 33 1 446,41965 1 4,008 30,582 6,889 4,746 464 .020RCATAPH 32 22 0 93,55922 0 2,105 4,788 4,788 0 0 .000RBUPCRC 20 19 2 602,02634 3 4,334 56,504 6,120 10,079 2,732 .050107Crop Total 74 3 121 4 10,447 1,142,004 91,874 17,797 14,825 3,196 .030
WHEATRBUPAPH 29 15 0 229,74221 0 2,051 16,025 2,094 2,788 0 .000RCATAPH 34 19 0 86,93619 0 1,787 3,022 3,022 0 0 .000
63Crop Total 34 0 40 0 3,838 316,678 19,047 5,116 2,788 0 .000
1,113State Total 805 221 1,194 306 51,239 11,846,010 1,405,039 355,644 209,977 1,605,108 1.140
WISCONSINAPPLES
RBUPAPH 6 5 0 349,9235 0 226 55,628 4,534 10,219 0 .000RCATAPH 23 21 1 538,52021 1 996 26,732 26,732 0 10,488 .39029Crop Total 26 1 26 1 1,222 888,443 82,360 31,266 10,219 10,488 .130
BARLEYRBUPAPH 481 164 15 247,193208 15 4,526 32,159 7,412 4,976 9,218 .290RCATAPH 254 107 0 74,137107 0 3,498 7,790 7,790 0 0 .000
735Crop Total 271 15 315 15 8,024 321,330 39,949 15,202 4,976 9,218 .230CABBAGE
RBUPAPH 4 4 1 216,9614 1 467 11,257 3,146 1,623 6,876 .610
Page 102 3/9/04

Federal Crop Insurance CorporationNationwide Summary - By State/Crop
Delivery Pol Units Units Net Liabilities Total Subsidy Premium IndemnityPol
Indem EarnPrem Indem Acres Premium Discount LossRatioSold EarnPremIns PolPlan ShareCost
Crop Year Statistics For 2000As Of: 03/08/2004
WISCONSINCABBAGE
RCATAPH 12 12 1 491,45312 1 1,666 19,904 19,904 0 7,356 .37016Crop Total 16 2 16 2 2,133 708,414 31,161 23,050 1,623 14,232 .460
CIGAR BINDER TOBACCORBUPTGP 333 203 23 1,300,507470 33 557 57,343 8,911 9,734 36,190 .630RCATTGP 40 18 0 67,88027 0 78 1,677 1,677 0 0 .000
373Crop Total 221 23 497 33 635 1,368,387 59,020 10,588 9,734 36,190 .610CORN
RBUPAPH 6,924 5,926 1,040 97,282,41612,910 1,604 657,851 8,645,024 2,092,825 1,312,025 3,854,351 .450RCATAPH 4,533 3,802 172 35,245,4323,900 173 546,294 2,063,712 2,063,712 0 298,498 .140RBUPCRC 3,131 2,845 1,012 127,951,4538,660 1,970 578,424 12,642,052 211,615 2,487,137 7,898,957 .620RBUPGRP 457 399 1 21,182,824399 1 74,994 453,539 49,651 80,827 747 .00015,045Crop Total 12,972 2,225 25,869 3,748 1,857,563 281,662,125 23,804,327 4,417,803 3,879,989 12,052,553 .510
CRANBERRIESRBUPAPH 75 72 7 22,978,98679 7 4,631 1,151,513 181,111 194,088 419,272 .360RCATAPH 89 86 0 15,744,96094 0 7,731 505,623 505,623 0 0 .000
164Crop Total 158 7 173 7 12,362 38,723,946 1,657,136 686,734 194,088 419,272 .250DRY BEANS
RBUPAPH 15 6 2 856,33623 4 2,587 84,157 22,822 12,270 32,834 .390RCATAPH 12 4 0 38,9266 0 451 3,725 3,725 0 0 .00027Crop Total 10 2 29 4 3,038 895,262 87,882 26,547 12,270 32,834 .370
FORAGE PRODUCTIONRBUPAPH 1,753 1,567 200 38,643,1211,588 200 154,969 2,999,142 744,879 451,336 2,075,852 .690RCATAPH 2,313 1,776 9 18,050,8221,787 9 179,276 805,553 805,553 0 16,858 .020RBUPGRP 765 699 0 17,161,809701 0 74,375 559,677 186,383 74,735 0 .000RCATGRP 1,435 1,265 0 25,309,0341,266 0 151,255 488,083 488,083 0 0 .000
6,266Crop Total 5,307 209 5,342 209 559,875 99,164,786 4,852,455 2,224,898 526,071 2,092,710 .430FORAGE SEEDING
RBUPDOL 1,561 923 148 3,191,6641,324 187 31,252 332,087 132,291 40,098 338,429 1.020RCATDOL 594 331 18 497,528333 18 12,445 47,481 47,481 0 13,287 .2802,155Crop Total 1,254 166 1,657 205 43,697 3,689,192 379,568 179,772 40,098 351,716 .930
FRESH MARKET SWEET CORNRBUPDOL 9 7 2 662,7117 2 1,170 75,155 7,042 13,626 52,746 .700
9Crop Total 7 2 7 2 1,170 662,711 75,155 7,042 13,626 52,746 .700GRAIN SORGHUM
RBUPAPH 1 0 0 00 0 0 0 0 0 0 .000RCATAPH 1 0 0 00 0 0 0 0 0 0 .000
Page 103 3/9/04
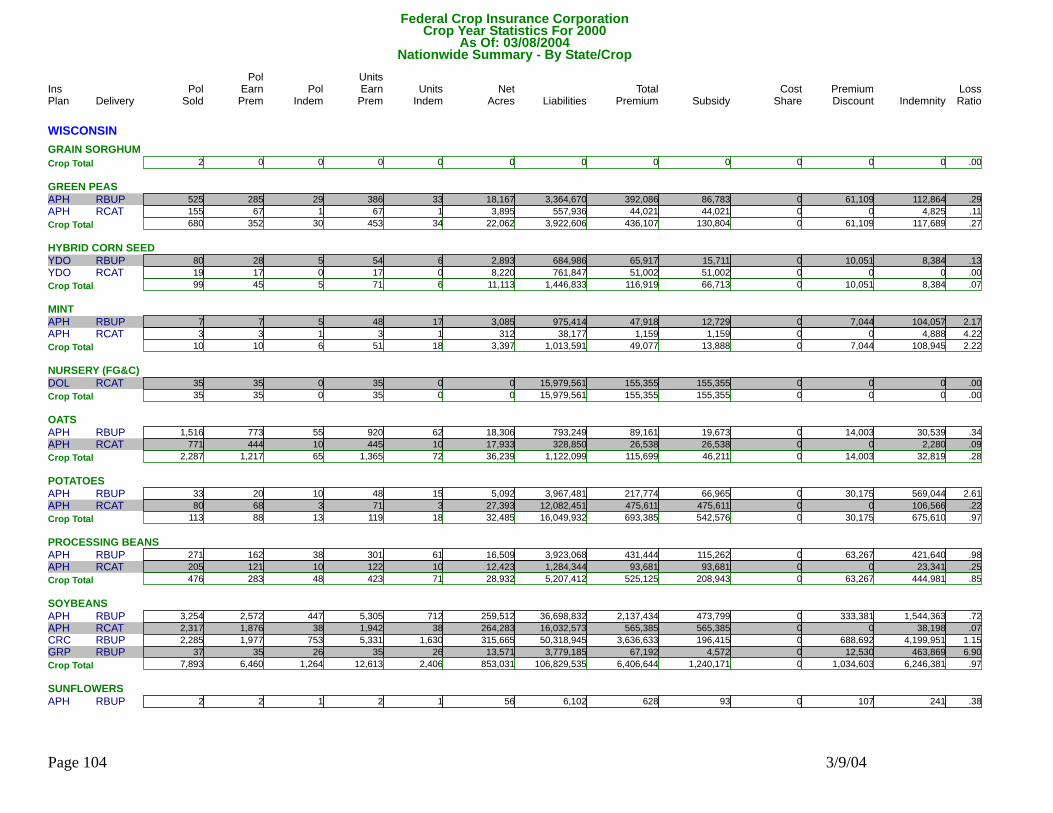
Federal Crop Insurance CorporationNationwide Summary - By State/Crop
Delivery Pol Units Units Net Liabilities Total Subsidy Premium IndemnityPol
Indem EarnPrem Indem Acres Premium Discount LossRatioSold EarnPremIns PolPlan ShareCost
Crop Year Statistics For 2000As Of: 03/08/2004
WISCONSINGRAIN SORGHUM
2Crop Total 0 0 0 0 0 0 0 0 0 0 .000GREEN PEAS
RBUPAPH 525 285 29 3,364,670386 33 18,167 392,086 86,783 61,109 112,864 .290RCATAPH 155 67 1 557,93667 1 3,895 44,021 44,021 0 4,825 .110680Crop Total 352 30 453 34 22,062 3,922,606 436,107 130,804 61,109 117,689 .270
HYBRID CORN SEEDRBUPYDO 80 28 5 684,98654 6 2,893 65,917 15,711 10,051 8,384 .130RCATYDO 19 17 0 761,84717 0 8,220 51,002 51,002 0 0 .000
99Crop Total 45 5 71 6 11,113 1,446,833 116,919 66,713 10,051 8,384 .070MINT
RBUPAPH 7 7 5 975,41448 17 3,085 47,918 12,729 7,044 104,057 2.170RCATAPH 3 3 1 38,1773 1 312 1,159 1,159 0 4,888 4.22010Crop Total 10 6 51 18 3,397 1,013,591 49,077 13,888 7,044 108,945 2.220
NURSERY (FG&C)RCATDOL 35 35 0 15,979,56135 0 0 155,355 155,355 0 0 .000
35Crop Total 35 0 35 0 0 15,979,561 155,355 155,355 0 0 .000OATS
RBUPAPH 1,516 773 55 793,249920 62 18,306 89,161 19,673 14,003 30,539 .340RCATAPH 771 444 10 328,850445 10 17,933 26,538 26,538 0 2,280 .0902,287Crop Total 1,217 65 1,365 72 36,239 1,122,099 115,699 46,211 14,003 32,819 .280
POTATOESRBUPAPH 33 20 10 3,967,48148 15 5,092 217,774 66,965 30,175 569,044 2.610RCATAPH 80 68 3 12,082,45171 3 27,393 475,611 475,611 0 106,566 .220
113Crop Total 88 13 119 18 32,485 16,049,932 693,385 542,576 30,175 675,610 .970PROCESSING BEANS
RBUPAPH 271 162 38 3,923,068301 61 16,509 431,444 115,262 63,267 421,640 .980RCATAPH 205 121 10 1,284,344122 10 12,423 93,681 93,681 0 23,341 .250476Crop Total 283 48 423 71 28,932 5,207,412 525,125 208,943 63,267 444,981 .850
SOYBEANSRBUPAPH 3,254 2,572 447 36,698,8325,305 712 259,512 2,137,434 473,799 333,381 1,544,363 .720RCATAPH 2,317 1,876 38 16,032,5731,942 38 264,283 565,385 565,385 0 38,198 .070RBUPCRC 2,285 1,977 753 50,318,9455,331 1,630 315,665 3,636,633 196,415 688,692 4,199,951 1.150RBUPGRP 37 35 26 3,779,18535 26 13,571 67,192 4,572 12,530 463,869 6.900
7,893Crop Total 6,460 1,264 12,613 2,406 853,031 106,829,535 6,406,644 1,240,171 1,034,603 6,246,381 .970SUNFLOWERS
RBUPAPH 2 2 1 6,1022 1 56 628 93 107 241 .380
Page 104 3/9/04
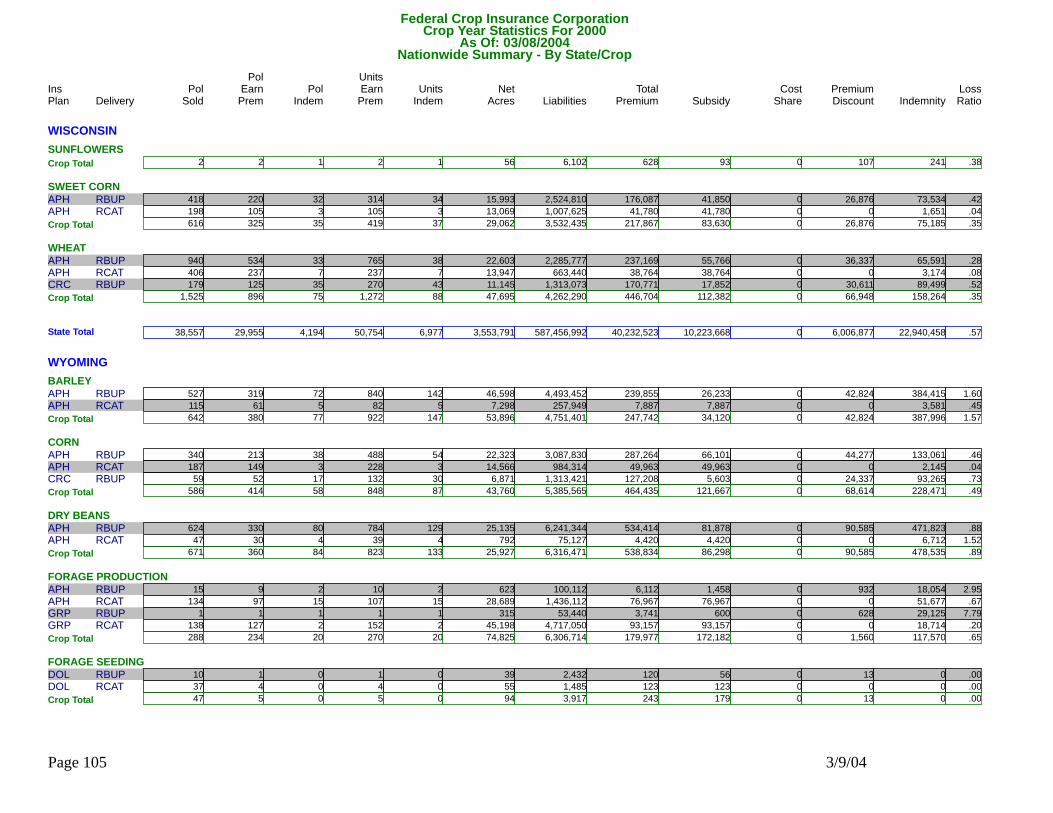
Federal Crop Insurance CorporationNationwide Summary - By State/Crop
Delivery Pol Units Units Net Liabilities Total Subsidy Premium IndemnityPol
Indem EarnPrem Indem Acres Premium Discount LossRatioSold EarnPremIns PolPlan ShareCost
Crop Year Statistics For 2000As Of: 03/08/2004
WISCONSINSUNFLOWERS
2Crop Total 2 1 2 1 56 6,102 628 93 107 241 .380SWEET CORN
RBUPAPH 418 220 32 2,524,810314 34 15,993 176,087 41,850 26,876 73,534 .420RCATAPH 198 105 3 1,007,625105 3 13,069 41,780 41,780 0 1,651 .040616Crop Total 325 35 419 37 29,062 3,532,435 217,867 83,630 26,876 75,185 .350
WHEATRBUPAPH 940 534 33 2,285,777765 38 22,603 237,169 55,766 36,337 65,591 .280RCATAPH 406 237 7 663,440237 7 13,947 38,764 38,764 0 3,174 .080RBUPCRC 179 125 35 1,313,073270 43 11,145 170,771 17,852 30,611 89,499 .520
1,525Crop Total 896 75 1,272 88 47,695 4,262,290 446,704 112,382 66,948 158,264 .350
38,557State Total 29,955 4,194 50,754 6,977 3,553,791 587,456,992 40,232,523 10,223,668 6,006,877 22,940,458 .570
WYOMINGBARLEY
RBUPAPH 527 319 72 4,493,452840 142 46,598 239,855 26,233 42,824 384,415 1.600RCATAPH 115 61 5 257,94982 5 7,298 7,887 7,887 0 3,581 .450642Crop Total 380 77 922 147 53,896 4,751,401 247,742 34,120 42,824 387,996 1.570
CORNRBUPAPH 340 213 38 3,087,830488 54 22,323 287,264 66,101 44,277 133,061 .460RCATAPH 187 149 3 984,314228 3 14,566 49,963 49,963 0 2,145 .040RBUPCRC 59 52 17 1,313,421132 30 6,871 127,208 5,603 24,337 93,265 .730
586Crop Total 414 58 848 87 43,760 5,385,565 464,435 121,667 68,614 228,471 .490DRY BEANS
RBUPAPH 624 330 80 6,241,344784 129 25,135 534,414 81,878 90,585 471,823 .880RCATAPH 47 30 4 75,12739 4 792 4,420 4,420 0 6,712 1.520671Crop Total 360 84 823 133 25,927 6,316,471 538,834 86,298 90,585 478,535 .890
FORAGE PRODUCTIONRBUPAPH 15 9 2 100,11210 2 623 6,112 1,458 932 18,054 2.950RCATAPH 134 97 15 1,436,112107 15 28,689 76,967 76,967 0 51,677 .670RBUPGRP 1 1 1 53,4401 1 315 3,741 600 628 29,125 7.790RCATGRP 138 127 2 4,717,050152 2 45,198 93,157 93,157 0 18,714 .200
288Crop Total 234 20 270 20 74,825 6,306,714 179,977 172,182 1,560 117,570 .650FORAGE SEEDING
RBUPDOL 10 1 0 2,4321 0 39 120 56 13 0 .000RCATDOL 37 4 0 1,4854 0 55 123 123 0 0 .00047Crop Total 5 0 5 0 94 3,917 243 179 13 0 .000
Page 105 3/9/04
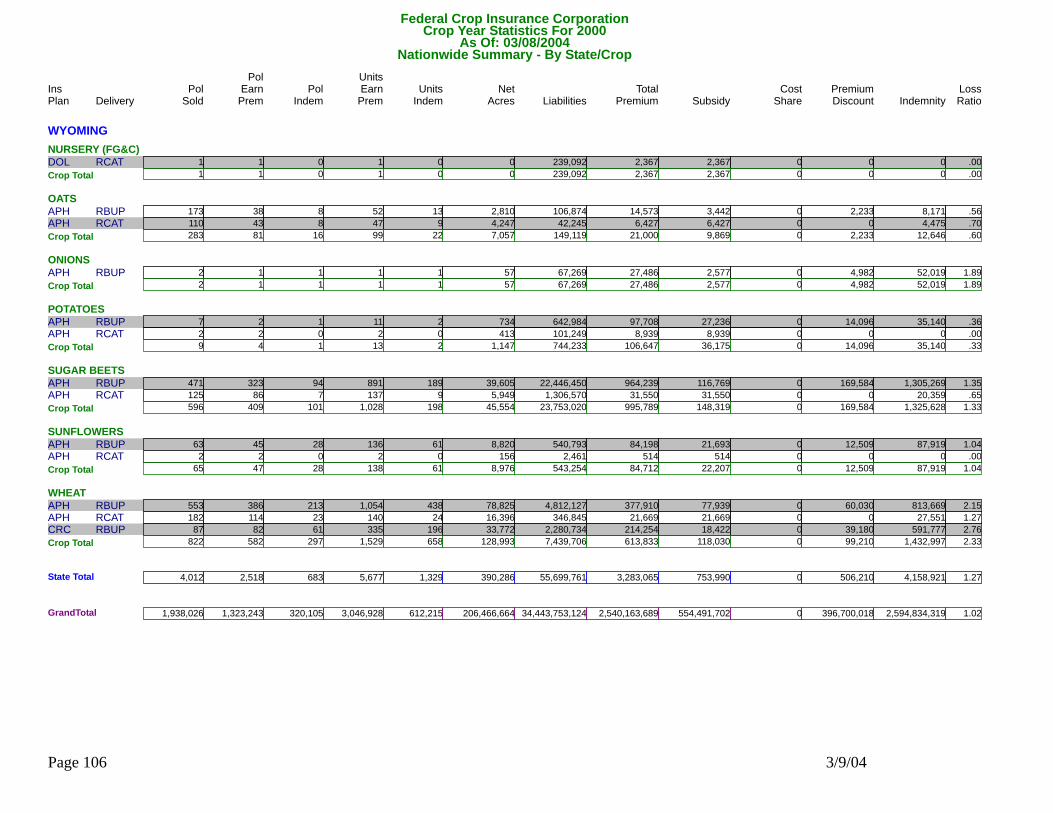
Federal Crop Insurance CorporationNationwide Summary - By State/Crop
Delivery Pol Units Units Net Liabilities Total Subsidy Premium IndemnityPol
Indem EarnPrem Indem Acres Premium Discount LossRatioSold EarnPremIns PolPlan ShareCost
Crop Year Statistics For 2000As Of: 03/08/2004
WYOMINGNURSERY (FG&C)
RCATDOL 1 1 0 239,0921 0 0 2,367 2,367 0 0 .0001Crop Total 1 0 1 0 0 239,092 2,367 2,367 0 0 .000
OATSRBUPAPH 173 38 8 106,87452 13 2,810 14,573 3,442 2,233 8,171 .560RCATAPH 110 43 8 42,24547 9 4,247 6,427 6,427 0 4,475 .700
283Crop Total 81 16 99 22 7,057 149,119 21,000 9,869 2,233 12,646 .600ONIONS
RBUPAPH 2 1 1 67,2691 1 57 27,486 2,577 4,982 52,019 1.8902Crop Total 1 1 1 1 57 67,269 27,486 2,577 4,982 52,019 1.890
POTATOESRBUPAPH 7 2 1 642,98411 2 734 97,708 27,236 14,096 35,140 .360RCATAPH 2 2 0 101,2492 0 413 8,939 8,939 0 0 .000
9Crop Total 4 1 13 2 1,147 744,233 106,647 36,175 14,096 35,140 .330SUGAR BEETS
RBUPAPH 471 323 94 22,446,450891 189 39,605 964,239 116,769 169,584 1,305,269 1.350RCATAPH 125 86 7 1,306,570137 9 5,949 31,550 31,550 0 20,359 .650596Crop Total 409 101 1,028 198 45,554 23,753,020 995,789 148,319 169,584 1,325,628 1.330
SUNFLOWERSRBUPAPH 63 45 28 540,793136 61 8,820 84,198 21,693 12,509 87,919 1.040RCATAPH 2 2 0 2,4612 0 156 514 514 0 0 .000
65Crop Total 47 28 138 61 8,976 543,254 84,712 22,207 12,509 87,919 1.040WHEAT
RBUPAPH 553 386 213 4,812,1271,054 438 78,825 377,910 77,939 60,030 813,669 2.150RCATAPH 182 114 23 346,845140 24 16,396 21,669 21,669 0 27,551 1.270RBUPCRC 87 82 61 2,280,734335 196 33,772 214,254 18,422 39,180 591,777 2.760822Crop Total 582 297 1,529 658 128,993 7,439,706 613,833 118,030 99,210 1,432,997 2.330
4,012State Total 2,518 683 5,677 1,329 390,286 55,699,761 3,283,065 753,990 506,210 4,158,921 1.270
GrandTotal 1,938,026 1,323,243 320,105 3,046,928 612,215 206,466,664 34,443,753,124 2,540,163,689 554,491,702 396,700,018 2,594,834,319 1.020
Page 106 3/9/04