Feasibility and Implications of the Michigan 2012 Proposal 3
37
CLOSUP Working Paper Series Number 32 October 2012 Feasibility and Implications of the Michigan 2012 Proposal 3 for a 25% State Renewable Portfolio Standard Elisabeth Moyer, Sean Johnson, Lexie Goldberger, Joe Zhu Center for Robust Decision-making on Climate and Energy Policy University of Chicago This paper is available online at http://closup.umich.edu Any opinions, findings, conclusions, or recommendations expressed in this material are those of the author(s) and do not necessarily reflect the view of the Center for Local, State, and Urban Policy or any sponsoring agency Center for Local, State, and Urban Policy Gerald R. Ford School of Public Policy University of Michigan
-
Upload
closup-u-m -
Category
Documents
-
view
214 -
download
0
description
CLOSUP working paper examining the feasibility and implications of Michigan's 2012 ballot Proposal 3, which would amend the state’s constitution to mandate that 25% of the state’s electricity sales derive from enewable sources by 2025.
Transcript of Feasibility and Implications of the Michigan 2012 Proposal 3

CLOSUP Working Paper Series Number 32
October 2012
Feasibility and Implications of the Michigan 2012 Proposal 3
for a 25% State Renewable Portfolio Standard
Elisabeth Moyer, Sean Johnson, Lexie Goldberger, Joe Zhu Center for Robust Decision-making on Climate and Energy Policy
University of Chicago
This paper is available online at http://closup.umich.edu
Any opinions, findings, conclusions, or recommendations expressed in this material are those of the author(s) and do not necessarily reflect the view of the Center for Local, State, and Urban Policy or any sponsoring agency
Center for Local, State, and Urban Policy Gerald R. Ford School of Public Policy
University of Michigan

This report was previously released by the Center for Robust Decision-making on Climate and Energy Policy (RDCEP) at the University of Chicago. RDCEP is supported by a grant from the National Science Foundation through the Decision Making Under Uncertainty (DMUU) program. The views and opinions expressed herein are solely those of the authors and do not necessarily reflect the policy or position of the United States Government nor any agency thereof, Argonne National Laboratory, the University of Chicago or RDCEP. Comments are welcome and should be sent to the author(s) by email. Author contact:
Elisabeth Moyer Assistant Professor, Dept. of the Geological Sciences University of Chicago 5734 S. Ellis Ave. Chicago, IL 60637 Telephone: (773) 834-2992 Email: [email protected]
DRAFT ONLY
October 2012
Feasibility and Implications of the Michigan 2012Proposal 3 for a 25% State Renewable Portfolio
Standard
Elisabeth Moyer1,2, Sean Johnson1,3, Lexie Goldberger2,4, and Joe Zhu2,4
University of Chicago
1. Center for Robust Decision-making on Climate and Energy Policy2. Dept. of the Geophysical Sciences
3. Dept. of Astronomy and Astrophysics4. College of the University of Chicago
3

4

ContentsSummary . . . . . . . . . . . . . . . . . . . . . . . . . . . . . . . . . . . . . . . . . . . . . . . . . . . . . . . . . . . . . . . . . . . . . . . . . . . 71 Background: Renewables in the Michigan Electric Sector . . . . . . . . . . . . . . . . . . . . . . . . . . . . 9
1.1 Michigan Electric Sector . . . . . . . . . . . . . . . . . . . . . . . . . . . . . . . . . . . . . . . . . . . . . . 91.2 Michigan RPS Specifications . . . . . . . . . . . . . . . . . . . . . . . . . . . . . . . . . . . . . . . . . . . 10
2 Windpower Resources and Costs . . . . . . . . . . . . . . . . . . . . . . . . . . . . . . . . . . . . . . . . . . . . . . . . . . 112.1 Eligible Wind Resources . . . . . . . . . . . . . . . . . . . . . . . . . . . . . . . . . . . . . . . . . . . . . . 112.2 Site Quality . . . . . . . . . . . . . . . . . . . . . . . . . . . . . . . . . . . . . . . . . . . . . . . . . . . . . . . . 142.3 Wind Costs . . . . . . . . . . . . . . . . . . . . . . . . . . . . . . . . . . . . . . . . . . . . . . . . . . . . . . . . . 17
3 Forecast Evolution of Proposal 3 and PA 295 . . . . . . . . . . . . . . . . . . . . . . . . . . . . . . . . . . . . . . . 183.1 Proposal 3 . . . . . . . . . . . . . . . . . . . . . . . . . . . . . . . . . . . . . . . . . . . . . . . . . . . . . . . . . 183.2 PA 295 . . . . . . . . . . . . . . . . . . . . . . . . . . . . . . . . . . . . . . . . . . . . . . . . . . . . . . . . . . . . 21
4 Conclusion . . . . . . . . . . . . . . . . . . . . . . . . . . . . . . . . . . . . . . . . . . . . . . . . . . . . . . . . . . . . . . . . . . . . . . 22Nomenclature . . . . . . . . . . . . . . . . . . . . . . . . . . . . . . . . . . . . . . . . . . . . . . . . . . . . . . . . . . . . . . . . . . . . . . . 25References . . . . . . . . . . . . . . . . . . . . . . . . . . . . . . . . . . . . . . . . . . . . . . . . . . . . . . . . . . . . . . . . . . . . . . . . . . 26
AppendixA PA 295 Cost Cap and Michigan Renewables Fraction . . . . . . . . . . . . . . . . . . . . . . . . . . . . . . . . 28B Wind Speed and Capacity Factor . . . . . . . . . . . . . . . . . . . . . . . . . . . . . . . . . . . . . . . . . . . . . . . . . . 29C Michigan Capacity Densities . . . . . . . . . . . . . . . . . . . . . . . . . . . . . . . . . . . . . . . . . . . . . . . . . . . . . . 30D Cost Assumptions . . . . . . . . . . . . . . . . . . . . . . . . . . . . . . . . . . . . . . . . . . . . . . . . . . . . . . . . . . . . . . . . 31E Michigan Approved PPAs for Renewables Under PA 295. . . . . . . . . . . . . . . . . . . . . . . . . . . . . 32F Case Study: Northern States Power - Minnesota Included . . . . . . . . . . . . . . . . . . . . . . . . . . . . 34
Figures1 Mandated renewables levels . . . . . . . . . . . . . . . . . . . . . . . . . . . . . . . . . . . . . . . . . . . . 92 Windspeeds in the U.S. . . . . . . . . . . . . . . . . . . . . . . . . . . . . . . . . . . . . . . . . . . . . . . . 123 Wind farm siting . . . . . . . . . . . . . . . . . . . . . . . . . . . . . . . . . . . . . . . . . . . . . . . . . . . . 144 Site depletion, excluding NSP-MN . . . . . . . . . . . . . . . . . . . . . . . . . . . . . . . . . . . . . . 155 Designated EWITS wind sites . . . . . . . . . . . . . . . . . . . . . . . . . . . . . . . . . . . . . . . . . . 166 Site depletion, including NSP-MN . . . . . . . . . . . . . . . . . . . . . . . . . . . . . . . . . . . . . . 167 Windpower cost as a function of site quality . . . . . . . . . . . . . . . . . . . . . . . . . . . . . . . 188 Impact on Michigan electricity prices of renewables, with the PTC . . . . . . . . . . . . . 199 Impact on Michigan electricity prices of renewables, without the PTC . . . . . . . . . . 1910 Histogram of retail electricity price in U.S . . . . . . . . . . . . . . . . . . . . . . . . . . . . . . . . 2011 Marginal cost of windpower, with the PTC . . . . . . . . . . . . . . . . . . . . . . . . . . . . . . . . 2112 Marginal cost of windpower, without the PTC . . . . . . . . . . . . . . . . . . . . . . . . . . . . . 22B.1 Estimation of capacity factor for low-wind sites . . . . . . . . . . . . . . . . . . . . . . . . . . . . 29E.2 Renewable energy contracts I . . . . . . . . . . . . . . . . . . . . . . . . . . . . . . . . . . . . . . . . . . 32E.3 Renewable energy contracts II . . . . . . . . . . . . . . . . . . . . . . . . . . . . . . . . . . . . . . . . . . 33
5

E.4 Renewable energy contracts III . . . . . . . . . . . . . . . . . . . . . . . . . . . . . . . . . . . . . . . . . 33F.5 Site depletion, including NSP-MN . . . . . . . . . . . . . . . . . . . . . . . . . . . . . . . . . . . . . . 34F.6 Impact on Michigan electricity prices of renewables, with the PTC, including NSP-
MN . . . . . . . . . . . . . . . . . . . . . . . . . . . . . . . . . . . . . . . . . . . . . . . . . . . . . . . . . . . . . . . 35F.7 Impact on Michigan electricity prices of renewables, without the PTC, including
NSP-MN . . . . . . . . . . . . . . . . . . . . . . . . . . . . . . . . . . . . . . . . . . . . . . . . . . . . . . . . . . 35F.8 Marginal cost of windpower, with the PTC, including NSP-MN . . . . . . . . . . . . . . . 36F.9 Marginal cost of windpower, without the PTC, including NSP-MN . . . . . . . . . . . . . 36
Tables1 Michigan utilities with out-of-state territories. . . . . . . . . . . . . . . . . . . . . . . . . . . . . . 13A.1 Estimation of the PA 295 cost cap . . . . . . . . . . . . . . . . . . . . . . . . . . . . . . . . . . . . . . . 28A.2 Michigan renewables in 2008 . . . . . . . . . . . . . . . . . . . . . . . . . . . . . . . . . . . . . . . . . . 28C.3 Capacity densities in MI wind farms . . . . . . . . . . . . . . . . . . . . . . . . . . . . . . . . . . . . . 30D.4 Assumptions used to calculate wind costs . . . . . . . . . . . . . . . . . . . . . . . . . . . . . . . . . 31
6

Summary
Analysis of the wind resources of Michigan suggests that the 2012 ballot Proposal 3, which wouldamend the state’s constitution to mandate that 25% of the state’s electricity sales derive from re-newable sources, can be met by its 2025 target date with a moderate direct financial impact onthe consumer. The amendment as written does pose some conflict between the stated intent ofin-state business support and consumer cost-protection, with the responsibility for balancing theseobjectives likely placed on the Michigan Public Service Commission (MPSC).
The language in Proposal 3 implies intent to favor in-state generation for the purpose of eco-nomic stimulus, but through a technicality allows the use of out-of-state windpower in large partsof Wisconsin, Illinois, Indiana, and Ohio, and, depending on the interpretation of the MPSC, pos-sibly also portions of Minnesota, North Dakota, and South Dakota. (This same exception, thatcovers all service territories of utilities that serve Michigan customers, also applies to the smallerexisting state renewable portfolio standard enacted in Public Act 295.) Over much of the out-of-state eligible area, wind speeds are substantially higher and so the cost of windpower generationis lower than in Michigan. While Michigan has some high-quality onshore wind resources, par-ticularly in the “Thumb” of the state, wind farm site quality would drop off as more in-state windcapacity is built.
We estimate that meeting the Proposal 3 requirements with onshore Michigan wind wouldraise average Michigan retail electricity rates by 6.5% over 2010 rates if federal subsidies forrenewables are continued and 11% if they are permitted to expire (as may happen at the end of2012). Using the lowest-cost eligible wind instead would result in significant cost savings butwould drive almost all renewables development out of state. Meeting Proposal 3 with out-of-statewind, if the eligible territories are restricted to the Great Lakes states (as is most likely), wouldcause Michigan retail electricity price increases of 5% with federal subsidies and 9% without them.If the wind-rich Great Plains territories were used, fulfilling Proposal 3 would cause rate increasesof only 3.5% with federal support and 6.5% without it. A scenario where the best Michigan sitesare supplemented by out-of-state wind would obviously result in intermediate costs. Because thelanguage in Proposal 3 does not explicitly resolve the conflicting objectives of local economicstimulus and consumer cost protection, the choice of how to implement the renewables mandatewould likely be left to the MPSC.
The smaller existing Michigan mandate of 10% renewables by 2015, enacted in PA 295, carriesa fixed cost cap that may affect its implementation. The PA 295 cost cap would freeze requirementsif renewables caused average Michigan retail prices to rise by a fixed amount roughly equivalent toa 3% rise in rates. The PA 295 renewables target is small enough to meet with commercial-qualityMichigan wind sites and is feasible within its cost cap with in-state wind if federal subsidies con-tinue. If federal subsidies expire, meeting the PA 295 target with in-state wind is likely impossible.Even with federal support, care in cost control is required to ensure feasibility of the statute as writ-ten. Meeting the terms of PA 295 within its cap requires holding average payments to post-2008renewables generators to ≈ $80/MWh, but power purchasing agreements with renewables gener-ators approved by the MPSC to date generally exceed this value. Michigan wind quality shouldhowever be sufficient to allow profitable generation within this constraint.
7

8

1 Background: Renewables in the Michigan Electric Sector
Like 29 other U.S. states, Michigan law contains a renewable portfolio standard (RPS) mandatingthat utilities serving MI customers source a certain fraction of their electricity from renewables by2015. The current Michigan requirement, enacted in 2008 Public Act 295, requires that renewablesmake up 10% of Michigan-serving generation by 2015 [2]. The constitutional amendment inProposal 3 would raise that renewables requirement further to 25%, with a target achievement dateof 2025 [1]. This scale and implementation timetable are common to many existing U.S. stateRPSs (Figure 1). In this report we analyze the likely costs of implementation of the Proposal 3requirements and consider pathways for implementation. Although part of the intent of Proposal3 is to benefit the Michigan economy by economic stimulus, we restrict this analysis to only the“direct costs” that would be incurred by the consumer. The reader should keep in mind that thosecosts may be offset by other economic benefits.
Michigan PA 295Michigan Proposal 3
2000 2005 2010 2015 2020 2025year
0
10
20
30
40
50
% re
new
able
ele
ctric
ity re
quire
men
t
Figure 1. Mandated renewables levels in the 29 U.S. states with renewable portfo-lio standards. Michigan’s PA 295 is highlighted in blue. Proposal 3 specificationsare shown in red.
1.1 Michigan Electric Sector
Michigan is quite typical among U.S. states in its electricity use and generation. Per capita electric-ity use in Michigan is slightly below the U.S. national average (1200 W vs. 1400 W, 15% lower),likely because Michigan’s climate permits a lower than average air conditioning use. (Numbersthroughout this section are 2010 values from [13] unless otherwise cited). At present Michigan’selectricity is derived largely from imported coal: in 2010, 59% the state’s generation was fromcoal, 27% from nuclear power and the remainder from natural gas (11%) and renewable sources
9

(3.6%) [6]. Renewables include wood waste (1.5%), hydropower (1.1%), landfill gas (0.7%), andwind (< 1% in 2010 but projected to grow to nearly 5% by 2013 [4]). The recent rapid growthof windpower in Michigan has largely been in response to the renewables requirements enacted in2008 through PA 295. Michigan’s heavy coal use means that the state’s electric sector has beenslightly more CO2-intensive than the national average, balancing out the state’s lower per capitaelectricity use so that electricity-derived CO2 emissions per Michigan resident are essentially at thenational average. Finally, retail electricity prices in Michigan are also almost exactly the nationalaverage (9.88 cents/kWh vs. the U.S. average 9.83 cents/kWh) 1.
1.2 Michigan RPS Specifications
Although renewables generation in Michigan is growing, the proportion of Michigan electricitygenerated by renewables is still only 4.5% in 2012 [6], meaning that both PA 295 and Proposal3 would require substantial additional new builds. Since Michigan’s total electricity sales are ≈12 GW, fulfilling PA 295 would require a total of ≈ 1.2 GW generation from renewables, or anadditional ≈ 800 MW over 2008 renewable generation. Fulfilling Proposal 3 would require ≈ 3GW, or an extra ≈ 2.5 GW over 2012 renewable generation2.
In both the existing PA 295 and Proposal 3, new renewables generation can be derived froma broad range of sources. PA 295 sources include windpower, solar power (both thermal electricand photovoltaics), hydroelectric power, geothermal electricity, and combustion of landfill gas,biomass, or municipal solid waste [2]. Proposal 3 includes all these other than the minor potentialsources of landfill gas, municipal waste, and geothermal [1]. Michigan’s substantial forestry sectorand existing dams make biofuel (wood waste) and hydropower a significant contributor to thestate’s electricity generation (2.6% of total electricity) [13], but we assume that the potential forthose energy sources is largely utilized and the remainder of the state RPS is likely to be metwith windpower, generally the lowest-cost non-hydro renewable. (Wind did in fact constitute 94%of all renewable energy contracts approved by the MPSC from 2009-2011 [6]). Both PA 295and Proposal 3 therefore represent mandates to move the state’s electricity generation away fromimported coal to presumably in-state wind. (Both statutes contain language that explicitly refers tothe objective of in-state economic stimulus) [2, 1].
Both PA 295 and Proposal 3 contain “cost caps”, provisions that alter requirements if they causeelectricity prices to rise above a certain threshold. The cost caps are structured quite differently.In the existing PA 295, the cap is a fixed maximum price rise, specified separately for residential,commercial, and industrial customers, that for the current distribution of customers is equivalent to≈ 3% of 2010 average Michigan retail price (derived from [22]). A 3% cap on a 10% RPS meansthat each unit of windpower applied to meeting the state standard must contribute an addition ofno more than 30% to the average retail rate. In other words, the “wind premium”, the additional
1Although Michigan customers see an electricity price essentially equal to the national average, the many low-population states with low electricity prices means that Michigan ranks as high as 17th among the 50 states plusD.C. in electricity price.
2These values are actual realized power produced, not “capacities”. Because the wind capacity factor is ≈ 30%,necessary installed wind capacity to fulfill Proposal 3 would be three times higher, i.e. ≈ 7 GW.
10

subsidy wind generators must receive to be profitable, must be no larger than 30% of the retail rate.Using $100/MWh and $35/MWh for Michigan retail and wholesale rate, this implies that the totalrevenue per unit of electricity R (in $/MWh) paid by Michigan ratepayers to wind generators underPA 295 can be no more than (R−35)/100 = 30%, or R = 30+ 35 = $65/MWh. That is, the PA295 cap allows renewables generators an average subsidy of $30/MWh.
The subsidy permitted to new renewables generators built specifically in response to PA 295is still larger than this value. At the time of enactment of PA 295, 3.4% of Michigan’s electricitywas already derived from renewables [11], and any additional costs for those existing facilitieswere already folded into 2008 rates. The entirety of the PA 295 permitted subsidy would then goto new renewables generators, which can receive (10/6.6)× 30 = $45/MWh subsidy, for a totalrevenue of $80/MWh from Michigan ratepayers, over twice what they would receive from sellingelectricity on the wholesale market. PA 295 is therefore more pragmatic and realistic about the costof renewables than are some other state statutes with unrealistically tight cost caps. (See [19]).
Furthermore, wind farms with higher operating costs than $80/MWh may still be viable inMichigan because renewables are also supported by federal subsidies. The federal ProductionTax Credit and Investment Tax Credit (henceforth “PTC”) effectively reimburse developers ofcommercial wind farms by 30% of construction costs. (See [19] and references therein for detailsand discussion). These subsidies top up the contribution of state RPSs. However, subsidies forcommercial wind farms are due to expire in 2012 unless new federal legislation is passed.
Proposal 3, in contrast to PA 295, does not limit the total price increase due to implementationbut instead caps the rate of increase, permitting no more than a 1% average price rise per year. (Therelative burden on different classes of customers is not specified). Proposal 3 also explicitly allowsa delayed implementation of the RPS past 2025 as necessary until the mandate is met. Those pro-visions mean that the target renewables level under Proposal 3 would always eventually be met:the cap can alter the timescale of full implementation but not the mandate itself. This design re-moves any feasibility constraints, but at the expense of some uncertainty about total potential cost.In the remainder of this analysis, we estimate the cost of full implementation of both PA 295 andProposal 3 in order to assist Michigan voters in making informed choices. Because continuationof federal wind subsidies is uncertain, we consider cases both with and without the PTC.
2 Windpower Resources and Costs
2.1 Eligible Wind Resources
The cost of fulfilling a renewables mandate with wind depends on where wind farms are built,because the power derived from wind turbine (and therefore the necessary subsidy per unit ofelectricity generated) is highly dependent on wind speed. Michigan is a moderately-endowed statefor wind resources, ranked by the American Wind Energy Association (AWEA) as 14th in potentialproduction from commercial-quality wind sites [3]. Michigan statewide average wind speeds areconsiderably below those of the central “wind belt” that runs through the Great Plains, but that
11

average incorporates a wide range of site quality. Michigan has some very high-quality wind areasin the state’s “Thumb” and along Lake Michigan’s eastern shore. In the remainder of the states,wind speeds drop off considerably (Figure 2).
Both PA 295 and Proposal 3 contain an opt-out from Michigan wind: they allow renewablesmandates to be met not only by in-state generation but by out-of-state generation in the serviceterritories of entities that also serve Michigan electricity customers 3. Michigan has five of theseutilities and cooperatives (Table 1), three serving small numbers of customers in the Upper Penin-sula. The out-of-state territories of these utilities include substantial portions of Wisconsin, Illinois,Indiana, and Ohio, and, depending on interpretation, possibly also territories in Minnesota, NorthDakota, and South Dakota that rank among the best wind resources in the United States (Figure2). The ambiguity over the eligibility of wind belt territories stems from the interpretation of acase of multiple nested ownership. Northern States Power - Wisconsin, which serves customers inMichigan’s Upper Peninsula, has an interchange agreement with Northern States Power Company- Minnesota (NSP-MN); these are jointly known as “NSP Companies” and are owned in turn byXcel. In the body of this analysis, we show the case in which the territories of NSP-MN are ruledineligible, but we show the case including them in Appendix F.
Figure 2. Windspeeds in the U.S. (NREL), with eligible and potentially eligibleareas under the current and proposed Michigan RPSs marked. While Michigan ismoderately-endowed state for onshore wind resources, the service territories of util-ities serving Michigan customers extend into higher-wind locations. The territoriesof NSP-MN, which may be ruled eligible, lie in the U.S. “wind belt.”
3PA 295 also has additional provisions for existing out-of-state wind contracts and permits exceptions at the dis-cretion of the MPSC.
12
Utility Other states served % of MI customers
Upper Peninsula customersWisconsin Electric Power Company WI 0.6%Wisconsin Public Service Corporation WI 0.2%Northern States Power - Wisconsin WI 0.2%
(part of NSP Companies) + MN, ND, SD
Remainder of stateIndiana Michigan Power Company IN 3%Midwest Energy Cooperative IN, OH 0.8%
(part of Wabash Valley Power Assoc.) + IL, MO
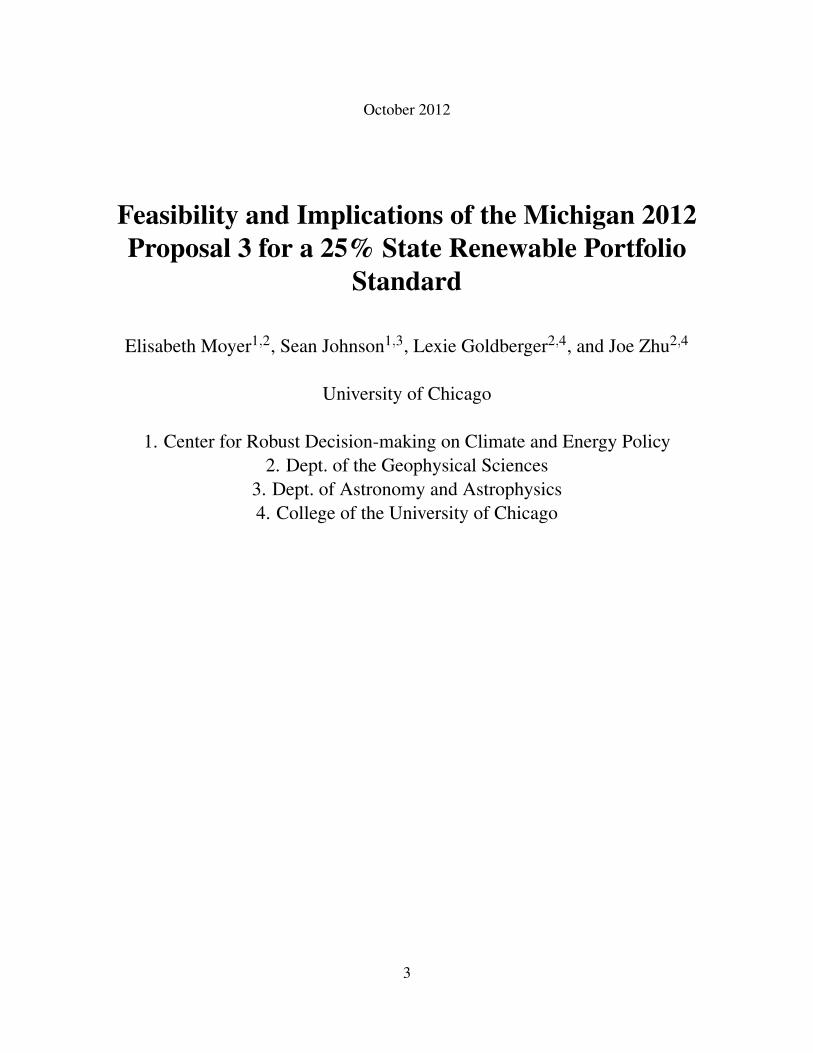
Table 1. Michigan utilities with out-of-state territories. It remains unclear whethereligibility under a Michigan RPS would extend to all of NSP Companies. IndianaMichigan is a unit of American Electric Power and is sometimes known as AEP.Utility information is from the EIA [12] and stems originally from the FederalEnergy Regulatory Commission (FERC) and the Rural Utilities Service (RUS).
Because the utilities of Table 1 serve only a small fraction of Michigan’s residential customers(less than 5%), and their Michigan RPS requirements scale with their Michigan customer base,they have little direct impact on the implementation of Michigan’s RPS statute. Total Michiganrenewables generation would be only slightly affected if the six utilities of Table 1 satisfied theirRPS requirements with generation from out-of-state facilities. (Indiana-Michigan already doesso, meeting their obligations to PA 295 with windpower from two wind farms in Indiana)[6]. Theoverwhelming majority of Michigan’s electricity customers are served by only two in-state utilities,Detroit Edison (2.1 M customers) and Consumers Energy (1.8 M), which combined sell 86% ofall of Michigan’s marketed electric power [22].
The language in both PA 295 and Proposal 3 does however open one significant possible alter-native for RPS implementation: that Detroit Edison and Consumers Energy could legally meet theirown renewable obligations from facilities in the eligible out-of-state territories of other Michigan-serving utilities. Those territories include substantial areas where wind speeds are considerablyhigher in and therefore costs lower than in Michigan. In the current system for demonstratingcompliance with the RPS, individual utilities have no direct incentive to go out of state, sincenearly all their RPS obligations are satisfied via power purchase agreements with individual windfarms approved by the Michigan Public Service Commission, with costs passed on to consumers.If the MPSC chose to deny approval to more expensive local projects, however, Michigan utilitiescould be effectively forced to use lower-cost out-of-state wind. The MPSC therefore has greatdiscretion in determining the location of facilities satisfying the Michigan RPS.
13

2.2 Site Quality
Since windpower production costs are a function of wind speed, we assume that investors wouldbuild on the best wind sites first, and as builds progress would turn to sites of increasingly lowerquality and higher production costs. The first step in estimating RPS cost is therefore modelingthis “site depletion” progression. We evaluate site depletion here using the methods of Johnsonand Moyer 2012 ([19]) developed for a study of the Illinois RPS, using the standard national in-ventory of wind potential in the Eastern U.S., the 2010 Eastern Wind Integration and TransmissionStudy (EWITS), released by the Department of Energy’s National Renewable Energy Laboratory[9]. EWITS estimates site quality by first identifying areas favorable for constructing wind farms(excluding for example protected lands, populated areas, and critical infrastructure) and then de-termining site quality by modeling the distribution of wind speeds at each site and and resultingpower generation from suitable wind turbines for each site.
Wind site quality is given as a “capacity factor”: the ratio of actual power generation of awind farm to the maximum power generation if the wind blew optimally at all times. CommercialU.S. wind farm sites developed in the last decade have capacity factors ranging from 15-55% [25],highest in the wind belt states and lowest for a few sites in New England. In other words, generationcosts for existing U.S. wind farms differ by over a factor of three depending on location. In thisstudy, we rank EWITS sites by capacity factor and assume that builds will occur in that order.Comparison of existing Michigan wind farms to EWITS sites suggests that wind developers dolargely follow this practice (Figure 3). We then use the capacity factor and an assumed spacing ofwind turbines of 5 W/m2 to estimate the total power output of each wind farm as builds progressuntil the RPS is fulfilled.
(a) EWITS site choice
Beebe Wind, 81 MW
Echo Wind, 110 MW
Garden Wind Farm, 28 MW
Gratiot County Wind, 212.8 MW
Harvest I Wind, 52.8 MW
Harvest II Wind, 59.4 MW
Lake Winds Energy Park, 100.8 MW
Mackinaw City, 1.8 MW
McKinley, 14.4 MW
Michigan Wind I, 69 MW
Michigan Wind II, 90 MW
Minden, 32 MW
Sigel, 64 MW
Stoney Corners, 60 MW
Tuscola Bay Wind, 120 MW
Wind Energy
Zone (Region 1)
Primary Wind Energy
Zone (Region 4)
3
7 6
11
4
15
2
Michigan Wind Farms
1
12
9
13
1
2
3
4
7
8
9
10
11
12
13
15
14
5
10
8
Currently Operational Under Development
5
6
Map includes wind farms
currently operating or under
development for MPSC rate-
regulated electric providers.
14
(b) 2012 Michigan wind farms
Figure 3. EWITS suggested wind farm sites in Michigan (L) and actual locationof wind farms in Michigan (R). With a few exceptions (e.g. a tiny 1.8 MW facilityin Mackinaw City), wind developers appear to be choosing optimal wind sites. L.figure from NREL and R. from MPSC.
The resulting site depletion curves imply that both PA 295 and Proposal 3 can be met with in-state Michigan wind, but that the higher requirement of Proposal 3 would require use of sites with
14

capacity factors lower than those typically used for commercial wind (lower curve in Figure 4).Because EWITS only models wind farms on sites of assumed good commercial quality, we mustotherwise estimate the characteristics for the last Michigan sites used to fulfill the requirementsof Proposal 3. We assume that they would lie somewhere between characteristics of the lowestEWITS sites (25% capacity factor) and those of the large areas of Michigan with moderate wind(windspeeds ≈ 5.5 m/s, Figure 2, with a capacity factor of ≈ 20%). (See Appendix B FigureB.1 for estimation of capacity factors in low winds). Technology for commercial wind turbinesoptimized for these low wind speeds continues to develop [23, 15].
0 10 20 30% MI 2025 electricity from eligible wind
20
25
30
35
Mar
gina
l cap
acity
fact
or (%
)
0 10 20 30% MI 2025 electricity from eligible wind
20
25
30
35
Mar
gina
l cap
acity
fact
or (%
)
IllinoisIndianaWisconsinMichiganMichigan wind
Figure 4. Reduction in site quality as wind sites are progressively occupied duringbuildup of renewables generation. The lower curve includes only Michigan sites,the top curve those definitely eligible under PA 195 and Proposal 3 (Great Lakesonly). Shaded area represents the uncertainty in the quality of the last Michigansites that must be used. Out-of-state territories largely outcompete Michigan wind.
The falloff in in-state site quality opens the possibility that the MPSC may choose to fill partof Proposal 3, if passed, with eligible out-of-state wind. If sites in the eligible area (exclusive ofNSP-MN) were chosen in order of site quality, Proposal 3 renewable requirements would be metalmost completely by wind farms in Illinois, Indiana, and Wisconsin (upper curve in Figure 4).These states have peak capacity factors no higher than the best sites in Michigan, but they have farmore area of this quality than does Michigan. Note that the model of Figure 4 does not accountfor the fact that some sites are already occupied by wind farms with long-term contracts to othercustomers. We also do not consider transmission limitations. Nevertheless, the flatness of thesite depletion curve for the non-Michigan areas suggests that these factors would not change theconclusions here, that out-of-state wind facilities would dominate were the Michigan renewablesstandard to be filled on the basis of generation cost alone.
That domination would be even stronger were the territories of Northern States Power - Min-nesota ruled eligible to serve the Michigan RPS, allowing access to the intense winds of the windbelt. Peak capacity factors in potentially eligible areas of Minnesota, North Dakota, and South
15
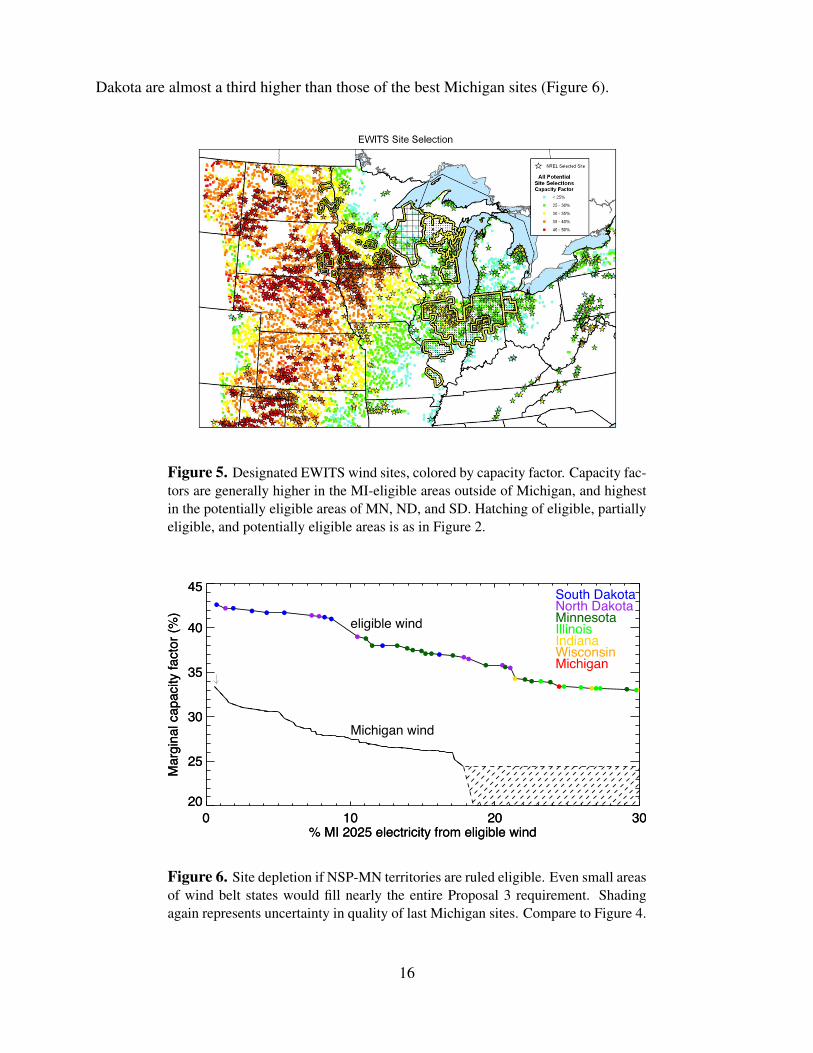
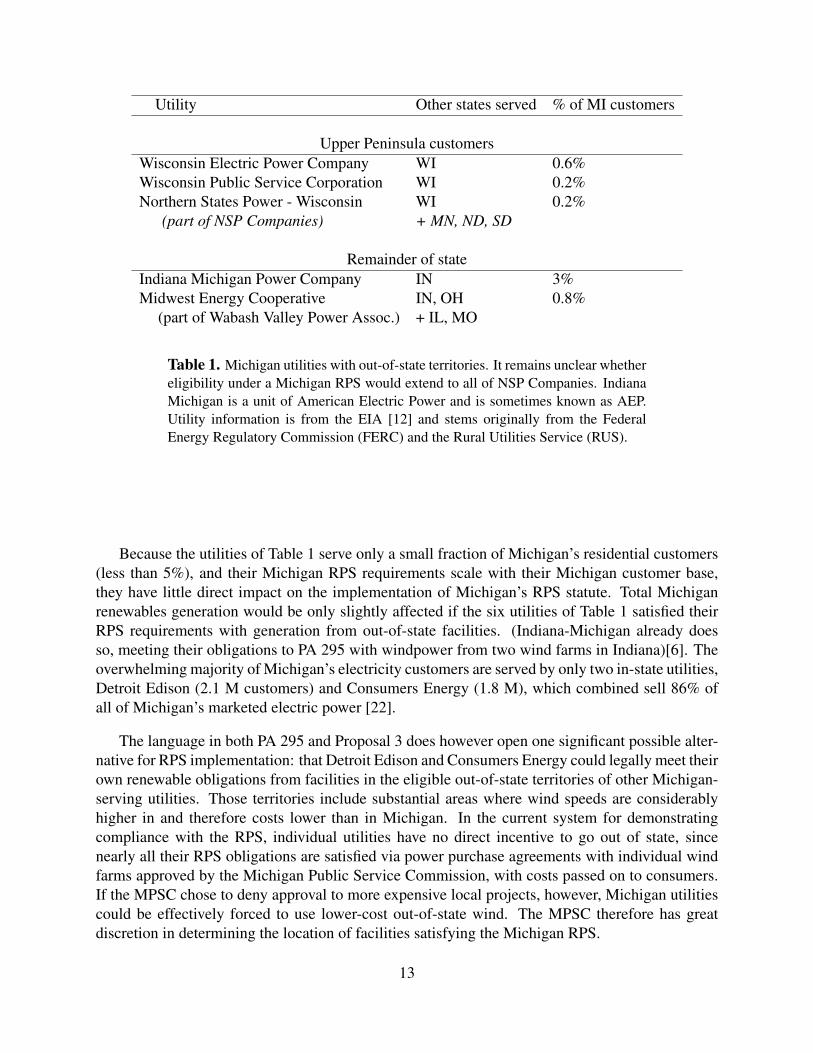
Dakota are almost a third higher than those of the best Michigan sites (Figure 6).
Figure 5. Designated EWITS wind sites, colored by capacity factor. Capacity fac-tors are generally higher in the MI-eligible areas outside of Michigan, and highestin the potentially eligible areas of MN, ND, and SD. Hatching of eligible, partiallyeligible, and potentially eligible areas is as in Figure 2.
0 10 20 30% MI 2025 electricity from eligible wind
20
25
30
35
40
45
Mar
gina
l cap
acity
fact
or (%
)
0 10 20 30% MI 2025 electricity from eligible wind
20
25
30
35
40
45
Mar
gina
l cap
acity
fact
or (%
)
South DakotaNorth DakotaMinnesotaIllinoisIndianaWisconsinMichigan
eligible wind
Michigan wind
Figure 6. Site depletion if NSP-MN territories are ruled eligible. Even small areasof wind belt states would fill nearly the entire Proposal 3 requirement. Shadingagain represents uncertainty in quality of last Michigan sites. Compare to Figure 4.
16

The siting analysis above depends significantly on the assumption of turbine spacing. Thetighter that turbines can be packed together without interfering with each other, the more powercan be produced from each wind farm. If wind farm designers find they must space turbinesmore widely than we have assumed to achieve optimal power, the highest-quality Michigan siteswould contribute less to filling the Michigan RPS, increasing the incentive to turn to out-of-statewind. If turbine spacing is tighter than we have assumed, site depletion would be reduced andMichigan wind more favored. We have assumed here a capacity density of 5 W/m2, a slightlyoptimistic number, as the American Wind Energy Association recommends that wind farms notspace turbines closer together than 60 acres per megawatt, or 4 W/m2 [21]. (If turbines are packedtoo tightly, wake interference reduces the power they generate, i.e. effectively drops the capacityfactor.) For one of the wind turbines in common use in the U.S. and modeled by EWITS, the GE1.5xle [9], our 5 W/m2 value is equivalent to spacing individual wind turbines a bit under ≈ 7rotor diameters apart, or 5× 10 along the prevailing wind direction. (Turbine specifications are1.5 MW max power and 82.5 m rotor diameter.) We do not use total power output directly fromEWITS as the EWITS assumed turbine spacings are are unrealistically tight, with average capacitydensities of 14.2 W/m2 [9], over three times the AWEA’s recommended maximum. We assumeinstead that there is some error in this aspect of EWITS. Our spacing of 5 W/m2 represents thetightest plausible spacing for new wind farms built in response to a Michigan RPS, and thereforea lower bound on site depletion effects. Existing wind farms in the U.S. in fact typically use widerspacings, averaging 2.9 W/m2 in 2009 [10]. (For existing Michigan wind farms, see Appendix C).
2.3 Wind Costs
The cost of windpower in the U.S. is highly dependent on location. In 2011, new wind projects inthe U.S. received revenues that differed by a factor of nearly three, from ≈ $35/MWh - $115/MWh[25]4. Those revenues presumably represent the amounts that wind generators must receive per unitof electrical energy generated to cover their expenses, and the difference in expenses per energygenerated is principally due to site quality. The higher the capacity factor for a wind farm site,the greater the electrical energy produced by each turbine and the lower the windpower cost, andin turn the lower the subsidy required to allow wind generators to be profitable. At the best U.S.wind sites, with capacity factors over 45%, windpower is competitive with natural gas or coalgeneration, especially given the subsidy in the form of the PTC.
We show estimated windpower cost as a function of site quality both with and without thePTC in Figure 7. Since most of the cost of wind generation is the upfront expense of buying andinstalling a turbine, the PTC rebate of 30% of installation cost approximately lowers the cost ofgeneration by 30%. Wind costs are estimated here as in [19], combining installation, fixed operat-ing, and variable operating costs from the literature and applying standard financing assumptions.(See Appendix D). The resulting cost estimates are consistent with the costs of U.S. wind genera-tors compiled in NREL’s 2011 Wind Technologies Report [25].
4Costs are given as “levelized costs”, i.e. the amount in current dollars that an operator would need to receive eachyear to recover his investment.
17

The analysis here implies that if in-state Michigan wind is used to meet Proposal 3 require-ments, site depletion during buildup of wind farms would raise marginal generation costs by ≈30%. If federal subsidies remain in effect, Michigan wind costs would rise from ≈ $55 to $70-80/MWh (Figure 7). Without federal support, costs would rise from ≈ $75 to over $100/MWh.
45 40 35 30 25 20Capacity factor (%)
40
50
60
70
80
90
100$/
MW
h
45 40 35 30 25 20Capacity factor (%)
40
50
60
70
80
90
100$/
MW
h
no PTC
with PTC
Figure 7. Estimated cost of generation of windpower as a function of capacityfactor. Capacity factors shown here span the range of those in Michigan and out-of-state potentially eligible territories under PA 295 and Proposal 3.
3 Forecast Evolution of Proposal 3 and PA 295
3.1 Proposal 3
Predicting the direct impact of Proposal 3’s impact on Michigan ratepayers is relatively straight-forward once wind costs and site quality distributions are known. Because Michigan renewablesgenerally pre-sell their electricity to specific utilities via power purchase agreements (PPAs) ratherthan selling electricity and renewable energy credits on the market, their revenues can be tied di-rectly to their generating costs. We assume that wind generators receive contracts to sell electricityat rates just sufficient to allow them to cover their costs. The estimates therefore represent a lowerbound on impact to the Michigan consumer. As more wind farms are built and a larger and largerfraction of Michigan electricity derives from wind, total subsidies to wind generators and impacton Michigan ratepayers necessarily grow. The resulting pathway of price increases suggest thatthe Proposal 3 target should be achievable in the desired timetable, by 2025, even within the capof 1%/year price increases.
If federal subsidies continue, we estimate that the meeting the requirements of Proposal 3 windwould cause an increase in retail electricity rates over 2012 values of ≈ 6.5% if only Michigan
18

wind were used and ≈ 5% if facilities could be sited in the best eligible territories in the Great Lakestates (Figure 8). If eligibility was opened to NSP-MN territories in Minnesota and the Dakotas,fulfilling the Proposal 3 mandate could be achieved with impact on Michigan retail prices as lowas 3.5%; see Appendix F Figure F.6.
0 10 20 30% Renewable generation (2025)
0
2
4
6
8%
Incr
ease
in e
lect
ricity
pric
e (o
ver 2
012)
0 10 20 30% Renewable generation (2025)
0
2
4
6
8%
Incr
ease
in e
lect
ricity
pric
e (o
ver 2
012)
Michigan only
MI, IL, IN, WI
Figure 8. Estimated average Michigan retail price over 2012 values increases asrenewables penetration increases, assuming the PTC continues. Existing renew-ables (4.5% of Michigan’s electricity) are included in the reference 2012 rates.
0 10 20 30% renewable generation (2025)
0
5
10
15
% In
crea
se in
ele
ctric
ity p
rice
(ove
r 201
2)
0 10 20 30% renewable generation (2025)
0
5
10
15
% In
crea
se in
ele
ctric
ity p
rice
(ove
r 201
2)
Michigan only
MI, IL, IN, WI
Figure 9. Estimated average Michigan retail price increases over 2012 values asrenewables penetration increases, assuming the PTC expires. Compare to Figure 8.
19

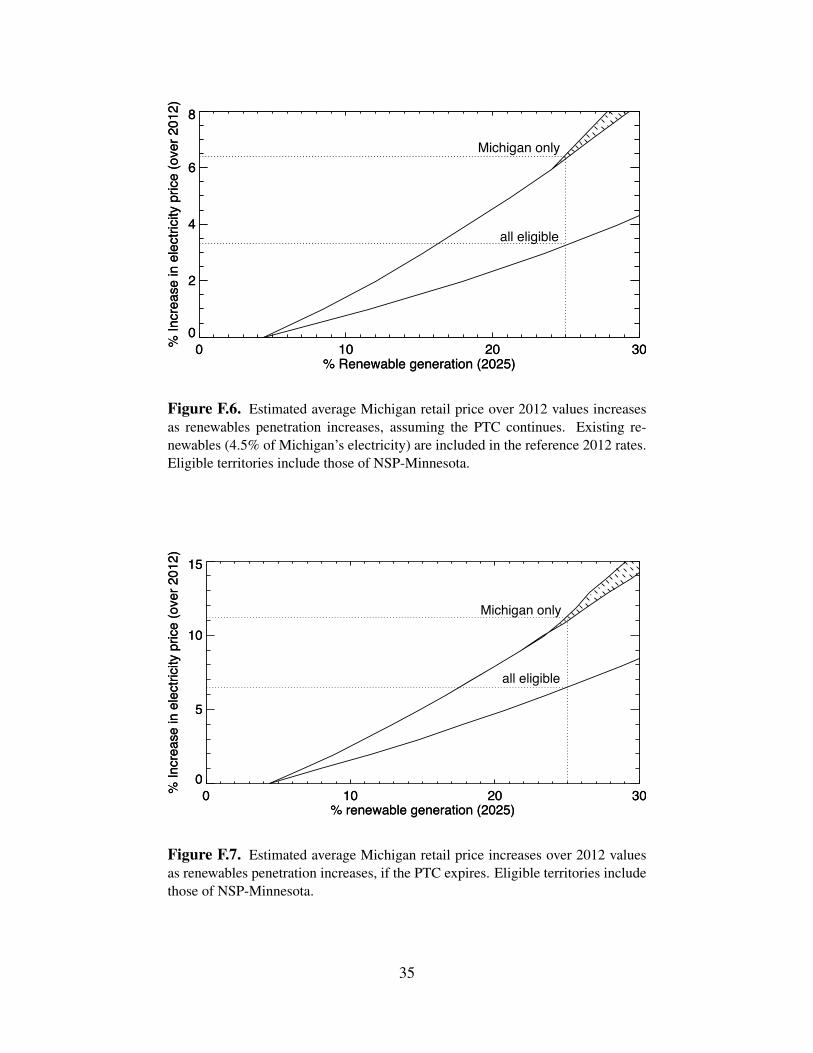
If the federal PTC were not renewed, wind generators would need more support from Michiganto operate. We estimate the direct impact on the Michigan ratepayer of filling Proposal 3 withoutfederal support as 11% with in-state wind, 9% with eligible Great Lakes wind, and 6.5% if thewind belt territories of NSP-MN were used (Figures 9 and Appendix F Figure F.7). In both cases,the uncertainty over the exact capacity factor in the last Michigan sites used to fill the renewablesrequirement does not meaningfully affect the estimates. We note however that these estimatesare essentially minimum ratepayer impacts. We have assumed that the best identified wind sitesare both available and actually used, and that wind generators barely cover their costs. Use ofsub-optimal sites or granting of windfall profits would raise impacts on Michigan ratepayers.
Although the estimated rate impacts of Proposal 3 are not trivial, they would not significantlyaffect Michigan’s competitiveness as a business environment among U.S. states (Figure 10). Thisconclusion holds whether or not in-state wind is used and indeed whether or not the PTC is contin-ued. Michigan is currently the 17th-highest U.S. state in retail electricity rates, and the added costsof meeting Proposal 3 would move it at most only two places further up, passing only Pennsylvaniaand Florida. The next highest state, Delaware, has retail rates nearly 12 cents/kWh. (Price datafrom [12]).
6 8 10 12 14 16 18Retail elec. price (cents/kWh)
02
4
6
8
10
12
No.
of s
tate
s
Michigan now w/ Proposal 3, MI wind
w/ Proposal 3, MI wind, no PTC
Figure 10. Histogram of retail electricity price in U.S. states + Washington DC,excluding only Hawaii that is off-scale at 25 cents/kWh. Michigan is 17th in retailelectricity prices at present. Fulfilling the targets of Proposal 3 with in-state windwould not significantly alter Michigan’s competitive position, even if federal PTCsupport for windpower is not renewed.
20

3.2 PA 295
The analysis here can be also used to estimate the expected costs of implementation of the existingMichigan renewables mandate, PA 295. It is not valid however to estimate PA 295’s feasibilitydirectly from Figures 8 and 9 above, because those figures show increases on 2012 rates and thePA 295 cost cap is benchmarked to rates in 2008, the year of enactment. Figures 8 and 9 abovetreat the renewables growth since enactment of PA 295, over 1% of Michigan’s electricity supply,as essentially free.
Because we do not have a simple means of retroactively determining the impact on the ratepayerof renewables builds between 2008-2012, the most instructive feasibility test is to consider whetherPA 295 requirements can be met by renewables generators receiving the maximum average pay-ments permitted under the statute’s cost cap. As discussed in Section 1 of this report, PA 295can be fulfilled within its cost cap if new renewables built in response to the mandate are grantedaverage revenues of no more than $80/MWh. Figure 11 implies that wind generation in Michiganfilling the requirements of PA 295 should be profitable at $80/MWh given the additional supportprovided by the federal PTC.
0 10 20 30% 2025 MI electricity from wind
40
50
60
70
80
90
100
Mar
gina
l cos
t ($/
MW
h)
0 10 20 30% 2025 MI electricity from wind
40
50
60
70
80
90
100
Mar
gina
l cos
t ($/
MW
h)
Michigan
MI, IL, IN
Figure 11. Marginal cost of windpower production with increasing penetration,assuming the PTC is continued. Upper curve shows the case of in-state wind only,with marginal costs rising as the best wind sites are used up. Shading again denotesuncertainty in site characteristics after all EWITS sites in Michigan are consumed.The lower curve includes territories in Great Lakes states eligible under PA 295 andProposal 3. PA 295 appears fulfillable with the constraint of average new renew-ables cost of $80/MWh, even with in-state wind
Without the federal PTC, complete fulfillment of PA 295 appears impossible with in-state windand uncomfortably tight even with use of eligible sites in other Great Lakes states (Figure 12).(Fulfilling PA 295 would however be very feasible if eligibility were extended to the wind beltterritories of NSP-MN; see Appendix F Figure 12). In the absence of federal support, wind-
21

generated electricity from even the best sites in the Great Lakes eligible territories would cost$75/MWh, close to the PA 295 limit. If renewables were restricted to Michigan alone, marginalcost would rise to nearly $90/MWh before the PA 295 requirements were met. The subsidy grantedto renewables generators by Michigan voters through PA 295 is simply not enough alone to supportcontinued renewables development in the state under current cost conditions. Given that the finaltimeline for implementation of PA 295 is only three years away, it is also unreasonable to expectany radical technological improvement than can dramatically lower the cost of wind generation.The feasibility of PA 295 therefore depends on continuation of federal support for renewables, oron the willingness of Michigan ratepayers and agencies to use primarily out-of-state wind sites.
0 10 20 30% 2025 MI electricity from wind
40
60
80
100
120
Mar
gina
l cos
t ($/
MW
h)
0 10 20 30% 2025 MI electricity from wind
40
60
80
100
120
Mar
gina
l cos
t ($/
MW
h)
Michigan
MI, IL, IN, WI
Figure 12. Marginal cost of windpower production with increasing penetration,assuming the PTC expires. Same as Figure 11 otherwise. Fulfillment of PA 295appears impossible in Michigan without federal support for renewables generators,and tight even using out-of-state Great Lakes eligible territories.
4 Conclusion
The analysis here suggests that the 2012 ballot Proposal 3, which would amend the state’s constitu-tion to mandate that 25% of the state’s electricity sales derive from renewable sources, can be metby its 2025 target date with a moderate direct financial impact on the consumer. The amendmentas written does pose some conflict, however, between the stated intent of in-state business supportand consumer cost-protection. Windpower in territories explicitly permitted by Proposal 3 is lowerin cost than is in-state Michigan wind, and in the absence of guidance in the terms of Proposal3, the responsibility for balancing these objectives would likely be placed on the Michigan PublicService Commission (MPSC).
The smaller existing Michigan mandate of 10% renewables by 2015, enacted in PA 295, shouldbe possible to meet with commercial-quality Michigan wind sites and is feasible with in-state wind
22

within its cost cap if federal subsidies continue. If federal subsidies expire, however, meetingthe PA 295 target is impossible with in-state wind and may be impossible even with out-of-stateeligible wind. We also note that average of power purchase agreements with renewables generatorsapproved by the MPSC to date exceeds the limiting average payments permitted by the PA 295cost cap of ≈ $80/MWh (Appendix E). Care in cost control is necessary to ensure feasibility of thestatute as written. However, given the continuation of federal subsidies, it should be possible forMichigan generators to fulfill the PA 295 renewables mandate within its cost constraints.
23

Acknowledgments
The methodology used throughout this analysis was developed with the help of many other people;for a complete list see acknowledgments in [19]. Alison Brizius provide invaluable logisticalassistance that made this report possible. The Center for Robust Decision-making on Climate andEnergy Policy (RDCEP) is supported by the National Science Foundation through the DecisionMaking Under Uncertainty program (Award No. SES-0951576).
24
Nomenclature
AWEA American Wind Energy Association.
Capacity factor The actual power output of a generator over a period of time divided by themaximum possible power output of that generator. As used here, effectively a measure ofwind speed and site quality. Capacity factors of wind facilities in the United States built inthe last decade range from 15% to nearly 55%.
Capacity density The power produced by a wind farm per area if all turbines were operating atmaximum power. Capacity density is therefore a measure of the spacing of wind turbines.(Higher capacity density means more wind turbines per area).
EIA Energy Information Agency: a federal agency charged with compiling energy-related data.
EWITS Eastern Wind Integration and Transmission Study: an NREL-released study of windpower potential in the Eastern U.S. that provided capacity factors for this analysis.
MPSC Michigan Public Service Commission: the state agency responsible for administeringMichigan’s renewable portfolio standards.
MW Megawatts: a unit of power, i.e. energy per time. One MW is 1 million Watts.
MWh Megawatt-hour: a unit of electrical energy, equivalent one million watts power consumed/generatedfor one hour. Also equivalent to 1000 kilowatt-hours. Residential electricity rates are usuallygiven in units of kWh/month. Renewable energy credits are typically denoted in MWh.
NREL National Renewable Energy Laboratory.
NSP-MN Northern States Power - Minnesota, a utility which does not directly serve Michigancustomers but which has an interchange agreement with the Michigan-serving NorthernStates Power - Wisconsin. NSP-MN’s territories may therefore be eligible to provide re-newable electricity under Michigan’s RPS; if so, costs of fulfillment could be significantlyreduced.
PA 295 Michigan Public Act 295, enacted in 2008, which established the state’s renewable port-folio standard.
PPA Power Purchase Agreement: a contract by which a utility agrees purchase electricity from agenerator for a set price and duration. Usually signed before construction of the facility.
Proposal 3 A 2012 ballot item that would approve a Michigan constitutional amendment thatincreased the state’s renewable portfolio standard over the requirements of PA 295.
PTC The federal Production Tax Credit and Investment Tax Credit. In their current forms, thesecredits collectively effectively reimburse renewables generators for 30% of their constructioncosts.
RPS Renewable Portfolio Standard: a requirement that a certain fraction of electricity be derivedfrom renewable sources. Often administered at state level.
25

References
[1] Proposal 12-3. A Proposal to Amend the State Constitution to Establish a Standard for Re-newable Energy. Michigan Statewide ballot; initiated constitutional amendment, filed byMichigan Energy, Michigan Jobs, 2012.
[2] Public Act 295. Clean, Renewable, and Efficient Energy Act of 2008. State of Michigan 94thLegislature Regular Session of 2008, S. 213, 2008.
[3] AWEA. U.S. Wind Energy Projects Database. American Wind Energy Association(http://archive.awea.org/projects/), September 2010.
[4] Julie Baldwin. Michigan Wind Working Group Michigan Public Service Commission Up-date. Renewable Energy Section Michigan Public Service Commission, 2011.
[5] Michigan Public Service Commission. PA 295 Contract Summary. (http://www.michigan.gov/documents/mpsc/contract summary 392291 7.pdf), 2012.
[6] Michigan Public Service Commission. Report on the Implementation of the P.A.295 Renewable Energy Standard and the Cost-Effectiveness of the Energy Standards.(http://www.michigan.gov/documents/mpsc/implementation PA295 renewable energy2-15-2012 376924 7.pdf), 2012.
[7] Minnesota Public Utilities Commission. Electric Utility Service Areas. (http://www.mngeo.state.mn.us/eusa/index.html), 2012.
[8] Wolverine Power Cooperative. Harvest Windfarm Facts. (http://www.wpsci.com/ Harvest-WindFarm.aspx), 2012.
[9] David Corbus. Eastern Wind Integration and Transmission Study. NREL(http://www.nrel.gov/docs/fy09osti/46505.pdf), CP-550-46505, 2010.
[10] Paul Denholm, Maureen Hand, Maddalena Jackson, and Sean Ong. Land-Use Requirements of Modern Wind Power Plants in the United States. NREL(http://www.nrel.gov/docs/fy09osti/45834.pdf), TP-6A2-45834, 2009.
[11] EIA. State Electricity Profiles 2008. U.S. Energy Information Administration(http://www.eia.gov/electricity/state/), 2010.
[12] EIA. Annual Energy Outlook 2011 with Projections to 2035. U.S. Energy Information Ad-ministration (http://www.eia.gov/forecasts/aeo/), 2011.
[13] EIA. Michigan Electricity Profile. U.S. Energy Information Administration(http://www.eia.gov/electricity/state/michigan/), 2012.
[14] Consumers Energy. Lakewinds Energy Park FAQ. (http://www.lakewindsenergypark.com/Content2.aspx?id=247), 2012.
26

[15] W. Erdman and M. Behnke. Low Wind Speed Turbine Project Phase II: The Application ofMedium-Voltage Electrical Apparatus to the Class of Variable Speed Multi-Megawatt LowWind Speed Turbines. National Renewable Energy Laboratory, 2005.
[16] Galen Barbose, Staff Research Associate in the Electricity Markets and Policy Group atLawrence Berkeley National Laboratory. Personal communications, January 2012.
[17] Exelon Generation. Fact Michigan Wind Projects, 2012.
[18] Kate Hessling. County Projected to have 160 Turbines by End of Year. Huron DailyTribune (http://www.michigansthumb.com/articles/2012/07/10/news/local news/doc4ffc16a21ddb0055562494.txt), 2012.
[19] Sean D. Johnson and Elisabeth J. Moyer. Feasibility of U.S. renewable port-folio standards under cost caps and case study for Illinois. Energy Policy(http://www.sciencedirect.com/science/article/pii/S0301421512005575), 49(0):499 – 514,2012. Special Section: Fuel Poverty Comes of Age: Commemorating 21 Years of Researchand Policy.
[20] National Renewable Energy Laboratory. Wind Resource Assessment. US Department ofEnergy, http://www.nrel.gov/wind/resource assessment.html, 2012.
[21] Wind Resource LLC. Frequently Asked Questions. (http://www.windresourcellc.com/ Fre-quently Asked Questions.html), 2012.
[22] Michigan Department of Licensing and Regulatory Affairs. Electric Utility Sales Data, 2010.(http://michigan.gov/mpsc/0,4639,7-159-16377 52818—,00.html), 2010.
[23] Ronit K. Singh and M. Rafiuddin Ahmed. Blade Design and Performance Testing of a SmallWind Turbine Rotor for Low Wind Speed Applications. Renewable Energy, 50(0):812 – 819,2013.
[24] Rebecca Trylch. Windfarm up and Running in Gratiot County. ABC12, (http://www.abc12.com/story/18721729/wind-farm-up-and-running-in-gratiot-county), 2012.
[25] Ryan Wiser and Mark Bolinger. 2011 Wind Technologies Market Report. The U.S. De-partment of Energy (http://www1.eere.energy.gov/wind/pdfs/2011 wind technologies mar-ket report.pdf), August 2012.
27

A PA 295 Cost Cap and Michigan Renewables Fraction
price sales revenue customers monthly bill PA 295 cap cap %cents/kWh MMWh/yr $B/yr 1000s $/month/cust. $/month/cust. %
residential 12.6 32.9 4.13 3,990 86 3.00 3.5commercial 9.9 29.8 2.96 465 530 16.58 3.1industrial 7.0 24.1 1.69 11 12,850 187.50 1.5
total 10.1 86.7 8.77 4,470 164 4.87 3
Table A.1. Michigan electric sector breakdown for 2010, from sales datacollected by the Michigan Public Service Commission [6], as needed to calculatethe size of the PA 295 cost cap relative to statewide revenue. The cap is specified in[2]. “Total” numbers here include only direct sales to residential, commercial, andindustrial, the categories explicitly referred to in the PA 295 cost cap. We disregardcustomers labeled “other” and disregard electricity resale. Note that exact valuesof electric sector data depend on accounting practices. The 2010 average Michiganretail rate inclusive of those factors (9.57 cents/kWh) was slightly lower than theaverage for the three customer classes (10.1 cents/kWh), and the EIA’s estimate of9.88 cents/kWh lies midway [13]. In this study we use either the EIA value or arough 10 cents/kWh; our conclusions are robust to this level of imprecision.
Similarly detailed data on the Michigan electric sector were not readilyavailable from the MPSC for 2008, the year of enactment of PA 295. We haveassumed that both prices and the breakdown of Michigan industrial, commercial,and residential customers remain roughly the same from 2008-2010.
2008 MI electricity hydropower other renew. total renew.GW 13.1 0.16 0.30 0.45% (100) 1.2 2.3 3.4
Table A.2. Michigan net generation from renewables in 2008 [13]. A third of PA295’s renewables mandate was already met at the time of enactment, and the entireallowable subsidy under PA 295’s cost cap can support the remaining new builds.
28
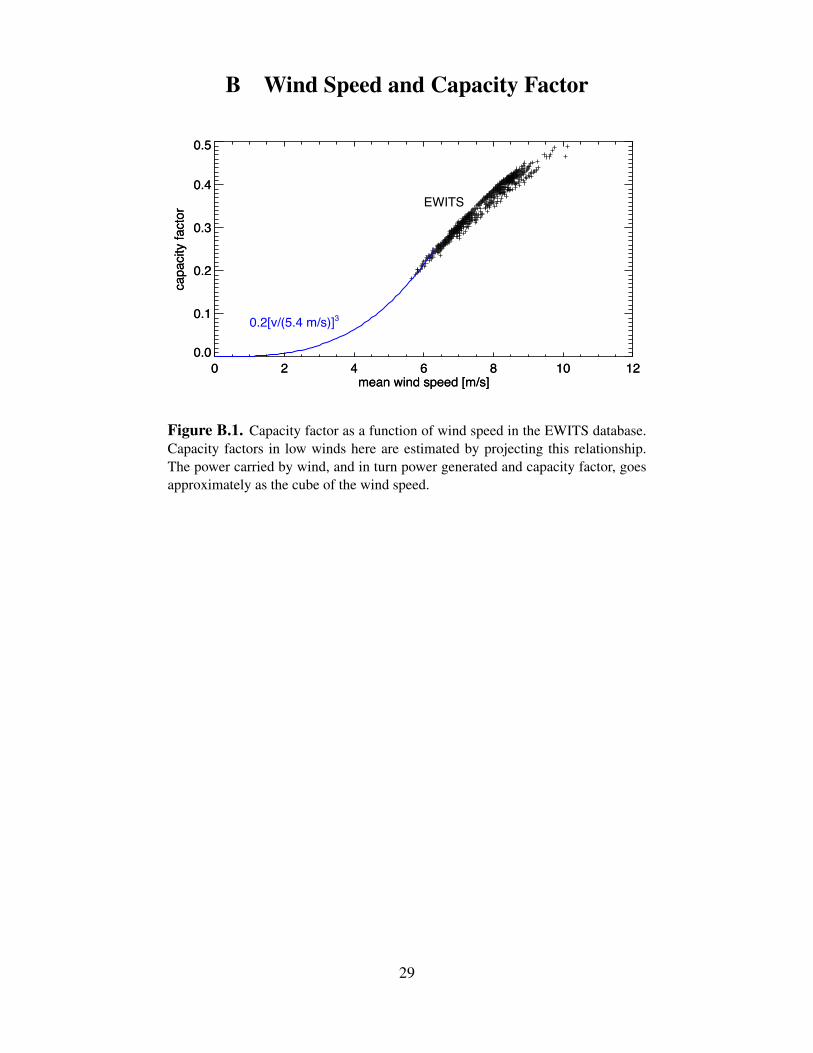
B Wind Speed and Capacity Factor
0 2 4 6 8 10 12mean wind speed [m/s]
0.0
0.1
0.2
0.3
0.4
0.5
capa
city
fact
or
0 2 4 6 8 10 12mean wind speed [m/s]
0.0
0.1
0.2
0.3
0.4
0.5
capa
city
fact
or
EWITS
0.2[v/(5.4 m/s)]3
Figure B.1. Capacity factor as a function of wind speed in the EWITS database.Capacity factors in low winds here are estimated by projecting this relationship.The power carried by wind, and in turn power generated and capacity factor, goesapproximately as the cube of the wind speed.
29

C Michigan Capacity Densities
Wind Farm Capacity (MW) Capacity Density (Wm−2)Lake Winds Energy Park 100 1.5
Michigan Wind 2 (Minden City) 90 1.7Gratiot County 212 1.8
Stoney Corners III 18 2.2Harvest Wind Farm 53 4
Table C.3. Estimated capacity densities of existing MI wind farms, in units ofWatts per square meter. Information about wind farm capacity and physical sizewas derived from a variety of industry and media sources including [18, 7, 17, 8,14, 4, 20, 16, 24]. We include here only farms for which area estimates were readilyavailable.
30

D Cost Assumptions
Description Input Levelized Cost (if applicable)Installed Cost $2/WO&M $10/MWh $10/MWhIntegration Cost $5/MWh $5/MWhFinancing 6%, 20 years (9% amortization)Capacity Factor (from EWITS)Capacity Density 5 W/m2
Wholesale value $35/MWh
Table D.4. Assumptions used to calculate wind costs. Methods follow those ofJohnson and Moyer 2012 [19]. The wholesale electricity price here is intendedto represent average Michigan wholesale rates. Capacity density assumptions areslightly optimistic compared to realized capacity densities in Michigan wind farmslisted in Appendix C.
31
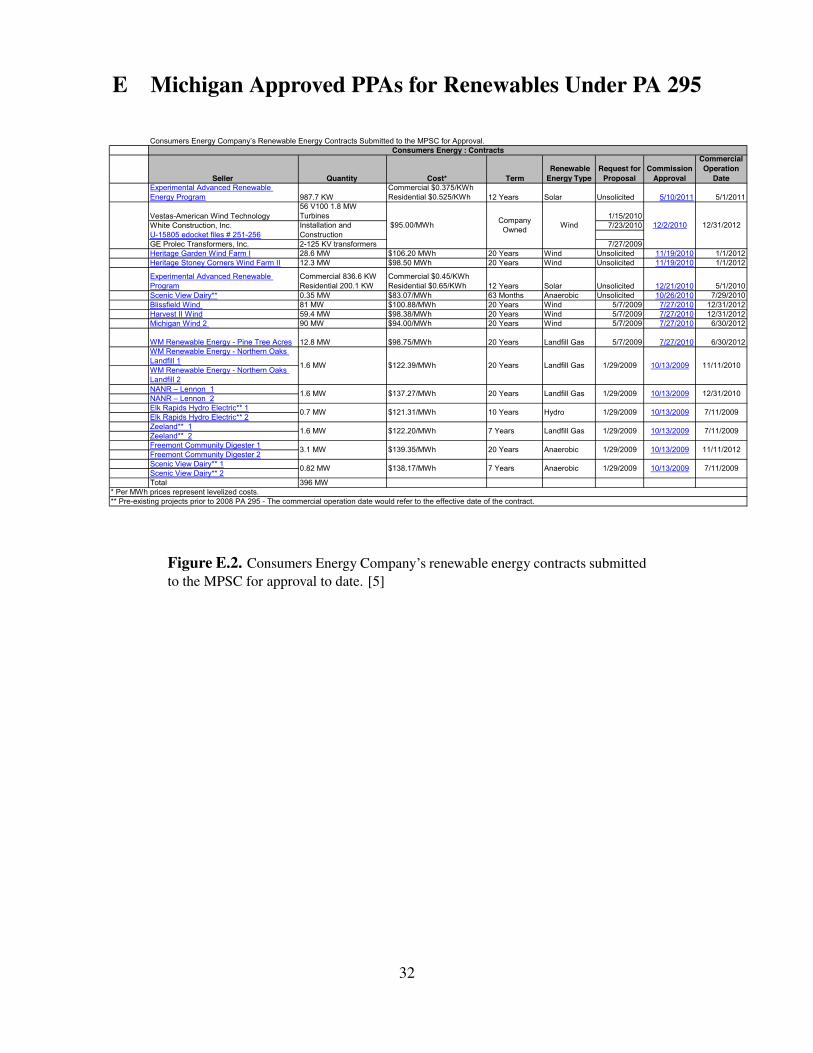
E Michigan Approved PPAs for Renewables Under PA 295
Seller Quantity Cost* Term Renewable Energy Type
Request for Proposal
Commission Approval
Commercial Operation
Date Experimental Advanced Renewable Energy Program 987.7 KW
Commercial $0.375/KWh Residential $0.525/KWh 12 Years Solar Unsolicited 5/10/2011 5/1/2011
Vestas-American Wind Technology 56 V100 1.8 MW Turbines 1/15/2010
White Construction, Inc. Installation and 7/23/2010U-15805 edocket files # 251-256 ConstructionGE Prolec Transformers, Inc. 2-125 KV transformers 7/27/2009Heritage Garden Wind Farm I 28.6 MW $106.20 MWh 20 Years Wind Unsolicited 11/19/2010 1/1/2012Heritage Stoney Corners Wind Farm II 12.3 MW $98.50 MWh 20 Years Wind Unsolicited 11/19/2010 1/1/2012
Experimental Advanced Renewable Program
Commercial 836.6 KW Residential 200.1 KW
Commercial $0.45/KWh Residential $0.65/KWh 12 Years Solar Unsolicited 12/21/2010 5/1/2010
Scenic View Dairy** 0.35 MW $83.07/MWh 63 Months Anaerobic Unsolicited 10/26/2010 7/29/2010Blissfield Wind 81 MW $100.88/MWh 20 Years Wind 5/7/2009 7/27/2010 12/31/2012Harvest II Wind 59.4 MW $98.38/MWh 20 Years Wind 5/7/2009 7/27/2010 12/31/2012Michigan Wind 2 90 MW $94.00/MWh 20 Years Wind 5/7/2009 7/27/2010 6/30/2012
WM Renewable Energy - Pine Tree Acres 12.8 MW $98.75/MWh 20 Years Landfill Gas 5/7/2009 7/27/2010 6/30/2012WM Renewable Energy - Northern Oaks Landfill 1WM Renewable Energy - Northern Oaks Landfill 2���$�������������$����������Elk Rapids Hydro Electric** 1Elk Rapids Hydro Electric** 2Zeeland** 1Zeeland** 2Freemont Community Digester 1Freemont Community Digester 2Scenic View Dairy** 1Scenic View Dairy** 2Total 396 MW
���� ����������#�������#%������"����������#����������� ���������������� �����������!���
* Per MWh prices represent levelized costs.** Pre-existing projects prior to 2008 PA 295 - The commercial operation date would refer to the effective date of the contract.
$95.00/MWh Company Owned Wind 12/2/2010 12/31/2012
Consumers Energy : Contracts
1.6 MW $122.39/MWh 20 Years Landfill Gas 1/29/2009 10/13/2009 11/11/2010
10/13/2009 12/31/2010
0.7 MW $121.31/MWh 10 Years Hydro 1/29/2009 10/13/2009 7/11/2009
1.6 MW $137.27/MWh 20 Years Landfill Gas 1/29/2009
1/29/2009 10/13/2009 7/11/2009
1.6 MW
3.1 MW
0.82 MW
$122.20/MWh
$139.35/MWh
$138.17/MWh 7 Years
20 Years
7 Years Landfill Gas
Anaerobic
Anaerobic
7/11/200910/13/20091/29/2009
1/29/2009 10/13/2009 11/11/2012
Figure E.2. Consumers Energy Company’s renewable energy contracts submittedto the MPSC for approval to date. [5]
32

��������������� ����� Renewable Energy Contracts Submitted to the MPSC for Approval.
Seller Quantity Cost* Term Renewable Energy Type
Request for Proposal
Commission Approval
Commercial Operation
Date
1991Nova Consultants, Inc. Solar EPC Up to $48 Million 2/28/2011
McNaughton-McKay Electric CompanySupply up to 15 MW of Modules
Inovatus Solar, LLC Supply up to 15 MW
General Electric CompanyUp to 69 1.6MW-100 Turbines 3/9/2011
Barton Malow CompanyInstallation and construction 5/6/2011
Tuscola Bay Wind. LLC 120 MW Up to $60.90/MWh 20 Years Wind 11/18/2010 8/25/2011 10/31/2012
Nova Consultants Unchanged from original contract
Unchanged from original contract
Company Owned Solar Extension 12/21/2010 12/31/2011
Blue Water Renewables - Smiths Creek Landfill 3.2 MW $99.00/MWh 20 Years Landfill Unsolicited 1/20/2011 12/31/2011
�%���������������������������# 17 MW 20 years Biomass 8/18/2009 8/10/2010 7/1/2010
Nova Consultants Up to 3 MW Up to $18 MillionCompany Owned Solar 11/23/2009 3/2/2010 12/31/2010
UPPCO** Firm 500,000 RECs 7 Years Hydro 12/23/2009 12/1/2009 10/1/2009Sterling Planet** Firm 2,500,000 RECs 10 Years MISC 12/23/2009 12/1/2009 10/1/2009
Total
Company Owned Solar 12/31/2015Up to $24 Million
3/24/2011
11/10/2011
Detroit Edison Company : Contracts
Michigan Waste Energy, Inc. Up to 65,000 RECs/Year $7.00/REC 13 Years Incinerator Unsolicited 12/6/2012
8/18/2009 9/14/2010 12/1/2011WM Renewable Energy - Eagle Valley Landfill
Gratiot County Wind
Wind
12/31/2012
�%���������������������������#110,374 RECs $11.98 (Average of 4
REC/ACEC Contracts) Biomass 8/18/2009 8/25/2011 7/1/2010
$61-$64/MWh Company Owned Wind
9/13/2011
20 YearsHeritage Sustainable Energy Stoney Corners Wind Farm
12/23/2009 4/27/2010 3/16/2010
12.2 MWUnchanged from original contract 20 Years Wind Unsolicited 12/1/2009 1/1/2011
Boyce Hydro** $7.75/ REC 7 Years Hydro
* Per MWh prices represent levelized costs.** Pre-existing projects prior to 2008 PA 295 - The commercial operation date would refer to the effective date of the contract.
Amendment Acquiring Vintage RECs
Up to $94.43/MWh Price not available
110.4 MW 89.6 MW Company Owned
20 Years Company Owned
3.2 MW Combined average price of $98.94/MWh
20 years Landfill 8/18/2009 8/10/2010 6/1/2011
Firm 210,000 RECs w/additional 112,000 RECs dependent on generation
Heritage Sustainable Energy Stoney Corners Wind Farm
Wind Unsolicited 4/30/2009 12/21/2009482 MW
Combined average price of $12.46/REC
14 MW $115.00/MWh
Figure E.3. Detroit Edison Company’s renewable energy contracts submitted tothe MPSC for approval to date. [5]
Contracts Submitted to the Commission Exclusive from Detroit Edison and Consumer Energy Contracts
Seller Quantity Cost Term Renewable Energy Type
Request for Proposal
Commission Approval
Commercial Operation
Date Consumers Energy "Bulk of RECs needed to
meet the RPS" $30.37/REC (estimated) 20 Years MISC Unsolicited 9/15/2009 8/4/2009
Seller Quantity Cost Term Renewable Energy Type
Request for Proposal
Commission Approval
Commercial Operation
Date Fowler Ridge Wind Farm II 50 MW Redacted 20 Years Wind Unsolicited 9/15/2009 2/15/2010
Alpena Power Company : Contracts
AEP/Indiana Michigan : Contracts
100 MW Redacted 20 years Wind Competitive Solicitation
8/25/2011 12/31/2012Wildcat I Wind Farm, LLC
Figure E.4. Renewable energy contracts submitted to the MPSC for approval byutilities other than Detroit Edison and Consumers Energy. [5]
33

F Case Study: Northern States Power - Minnesota Included
We repeat below the primary figures of this report for the case where the territories of NorthernStates Power - Minnesota are ruled eligible to meet the Michigan renewables requirements of PA295 and Proposal 3.
0 10 20 30% MI 2025 electricity from eligible wind
20
25
30
35
40
45
Mar
gina
l cap
acity
fact
or (%
)
0 10 20 30% MI 2025 electricity from eligible wind
20
25
30
35
40
45
Mar
gina
l cap
acity
fact
or (%
)
South DakotaNorth DakotaMinnesotaIllinoisIndianaWisconsinMichigan
eligible wind
Michigan wind
Figure F.5. Site depletion if NSP-MN territories are ruled eligible. Even smallareas of wind belt states would fill nearly the entire Proposal 3 requirement. Shad-ing again represents uncertainty in Michigan sites. This figure is repeat ofFigure 6.Compare to Figure 4.
34
0 10 20 30% Renewable generation (2025)
0
2
4
6
8
% In
crea
se in
ele
ctric
ity p
rice
(ove
r 201
2)
0 10 20 30% Renewable generation (2025)
0
2
4
6
8
% In
crea
se in
ele
ctric
ity p
rice
(ove
r 201
2)
Michigan only
all eligible
Figure F.6. Estimated average Michigan retail price over 2012 values increasesas renewables penetration increases, assuming the PTC continues. Existing re-newables (4.5% of Michigan’s electricity) are included in the reference 2012 rates.Eligible territories include those of NSP-Minnesota.
0 10 20 30% renewable generation (2025)
0
5
10
15
% In
crea
se in
ele
ctric
ity p
rice
(ove
r 201
2)
0 10 20 30% renewable generation (2025)
0
5
10
15
% In
crea
se in
ele
ctric
ity p
rice
(ove
r 201
2)
Michigan only
all eligible
Figure F.7. Estimated average Michigan retail price increases over 2012 valuesas renewables penetration increases, if the PTC expires. Eligible territories includethose of NSP-Minnesota.
35

0 10 20 30% 2025 MI electricity from wind
40
50
60
70
80
90
100
Mar
gina
l cos
t ($/
MW
h)
0 10 20 30% 2025 MI electricity from wind
40
50
60
70
80
90
100
Mar
gina
l cos
t ($/
MW
h)Michigan
eligible
Figure F.8. Marginal cost of windpower production with increasing penetration,assuming the PTC is continued. Upper curve shows the case of in-state wind only,with marginal costs rising as the best wind sites are used up. Shading again denotesuncertainty in site characteristics after all EWITS sites in Michigan are consumed.The lower curve includes all territories not eligible under PA 295 and Proposal 3,including those of NSP-Minnesota. PA 295 appears fulfillable with the constraintof average new renewables cost of $80/MWh, even with in-state wind
0 10 20 30% 2025 MI electricity from wind
40
60
80
100
120
Mar
gina
l cos
t ($/
MW
h)
0 10 20 30% 2025 MI electricity from wind
40
60
80
100
120
Mar
gina
l cos
t ($/
MW
h)
Michigan
eligible
Figure F.9. Marginal cost of windpower production with increasing penetration,assuming the PTC expires. Same as Figure F.8 otherwise. Fulfillment of PA 295without federal support for renewables generators was not possible if eligible ter-ritories were restricted to the Great Lakes states (see Figure 11), but is if the theterritories of NSP-Minnesota are included, as shown here. Wind belt sites can gen-erate windpower with costs below the PA 295 new-renewables cap of $80/MWh.
36

v1.38