The Financial and Economic Crises: Implications for ... · The Financial and Economic Crises:...
42
Informing the Debate Informing the Debate Informing the Debate The Financial and Economic Crises: Implications for Consumer Finance and for Households in Michigan Author Lisa D. Cook Institute for Public Policy and So- cial Research at Michigan State
-
Upload
truongtram -
Category
Documents
-
view
215 -
download
1
Transcript of The Financial and Economic Crises: Implications for ... · The Financial and Economic Crises:...

Informing the DebateInforming the DebateInforming the Debate
The Financial and Economic Crises: Implications for Consumer Finance
and for Households in Michigan
Author Lisa D. Cook
Institute for Public Policy and So-cial Research at Michigan State

2
Informing the DebateInforming the DebateInforming the Debate
Authors Lisa D. Cook Department of Economics and James Madison College Michigan State University Sponsor The Institute for Public Policy and Social Research Douglas B. Roberts, Ph.D. Director Series Editors Ann Marie Schneider, M.S. Institute for Public Policy and Social Research Program Manager Lauren Meunier Institute for Public Policy and Social Research Communications Assistant
© 2010 Michigan State University
The Institute for Public Policy and Social Research is housed in the College of Social Science at Michigan State University.
Financial Crises
www.ippsr.msu.edu

The Financial and Economic Crises: Implications for Consumer Finance and for Households in Michigan
Lisa D. Cook Department of Economics and
James Madison College Michigan State University
[email protected] September 2010
The author wishes to thank Charlie Ballard, Sheldon Danzinger, Lucia Dunn, Kristin Seefeldt, and Melvin Stephens for helpful conversations; Cliff Broman and Jan Bokemeier for access to their data in the State of the State data set; Chaleampong Kongchareon for excellent research assistance; and IPPSR and MSUE at Michigan State University for financial support. This paper was partially written while a Visiting Scholar at the National Poverty Center at the University of Michigan, and its generosity is also acknowledged.

Michigan Applied Public Police Research Paper, Michigan State University 2
Abstract
Michigan is an epicenter of the recent economic and financial crises. Median personal income was 8 percent above the national average at the beginning of the decade and was 8 percent below the national average by the end of it. Between 2008 and 2009, personal income fell for the first time since 1958. Rates of unemployment and foreclosure activity remain high and above the national average. Indeed, the Michigan economy is changing in dramatic and important ways, but there is little information on household responses to this changing environment. How are Michigan households responding to economic and financial shocks? Are they smoothing income, consumption, or both? What mechanisms are they using to achieve these outcomes? On which factors does the degree of adjustment depend? Using data collected from recent household surveys, I address these questions. Michigan residents are adjusting both spending plans, i.e., household budgets, and income sources, e.g., savings intended for retirement. Degree of responsiveness and type of response depend on a number of factors, including whether an income shock is positive or negative, perception of future macroeconomic trends, income or poverty status, location, educational level, and race.

Michigan Applied Public Police Research Paper, Michigan State University 3
Michigan is an epicenter of the current financial and economic crises. As the state with one of the
highest percentages of nonprime foreclosures in 2007, the highest number of foreclosure filings in
2009, and the average highest unemployment rate in the U.S. for much of the decade, the financial
situation of Michigan households is changing rapidly and in important ways. Prior to the crises,
aggregate indicators, such as national and regional indices of economic activity, often
underemphasized household financial conditions and decisions, which have been central to the
current crises, particularly in Michigan. There is still a lot that is unknown about household
responses to financial and economic shocks. Do they smooth consumption, e.g., adopt and change
spending plans, as anticipated? Do they smooth income, e.g., relax their budget constraints by using
savings intended for retirement or increasing their use of credit? Economists may want to know
how indicators are changing to better analyze changes in living standards and to predict the
magnitude and direction of imminent changes. Policymakers and service providers would also be
interested in such analysis and appropriate responses of interventions, as well as their timing.
To fill this gap, this research analyzes 2009 and 2010 household survey data to understand changes
in financial and economic activity in Michigan. Largely consistent with data from credit agencies,
seven percent have been late with a rent or mortgage payment in the past three months, 14 percent
were sent to a collection agency in the past three months, and two percent plan to file for
bankruptcy in the next three months. Further, the findings suggest that households are employing
both consumption- and income-smoothing mechanisms to respond to shocks. On the consumption
side, 67 percent report having spending plans, although few update it regularly or frequently. On the
income side, 26 percent used their retirement savings for expenses other than retirement, e.g., food
and health, and 81 percent adjusted their retirement investment portfolios.

Michigan Applied Public Police Research Paper, Michigan State University 4
The evidence suggests that household spending plans are not adjusted in a timely fashion in
response to negative idiosyncratic shocks relative to positive ones. In contrast, we find that household
spending plans respond to future negative macroeconomic shocks, but household investment portfolios
do not. We also find significant differences by income, location, employment status, educational
attainment, race, and other factors.
This suggests a role for policymakers and for service providers in increasing behavior that is more
informed and responsive. Most immediately, greater attention must be given to the growing
mortgage-delinquency and foreclosure rates. More generally, state and local agencies may be able to
collect, analyze, and disseminate data relevant for financial decision-making in a timely fashion on a
state-wide basis. Further, financial and economic education should be mandatory for high school
students. For non-profit and other service providers, more services and resources to support
financial and economic literacy, including appropriate consumer household responses to shocks
related to spending and income, are warranted.
In essence, if we can better understand and predict microeconomic events with potentially large
macroeconomic consequences in Michigan, given its pro-cyclical manufacturing base and given the
significant linkage between the auto industry and other industries in the U.S., this could be a Pareto
improvement for local communities, for the state, and for the nation.
I. A Review of Recent Macroeconomic Conditions in Michigan
Economic activity has slowed considerably in Michigan in the last decade. On average, the
Coincident Economic Activity index for Michigan declined 3.7 percent per year since 2001

Michigan Applied Public Police Research Paper, Michigan State University 5
(Figure 1). Correspondingly, unemployment rates doubled at the beginning of the decade and again
between 2008 and 2010, as can be seen in Figure 2. The unemployment rate peaked at 14.5 percent
in December 2009 in Michigan and at 10.1 percent in October 2009 in the U.S. Not surprisingly,
economic contraction was reflected in a broad range of indicators, reported in Figures 3 to 10 and
Tables 1 to 4. Median personal income in Michigan, which is given in Table 1, exceeded the
national average by 8 percent in 2001 but lagged it by 8 percent by 2009. The share of Michigan
residents in poverty was one percentage point greater than the national average in 2006, and, by
2009, 14 percent were living below the poverty line (Table 1). Increases in food-stamp participation
have also surpassed the national average. Between 2006 and 2009, U.S. participation increased by 56
percent, while in Michigan it increased by 65 percent (Table 2).
Similarly, credit conditions have deteriorated significantly. Marked increases in foreclosure activity
began earlier in Michigan relative to the rest of the country, and since mid-2000, the share of
consumers with new foreclosures by state has been above the national average (Figure 3). For
nonprime mortgages originated between 2000 and 2007 in Michigan, 27 percent were the subject of
a completed foreclosure process, 4.7 percent were delinquent, 4.8 percent were in default, and 1.8
percent were in foreclosure by June 30, 2009. For the same period for the U.S., 14.4 percent were
the subject of a completed foreclosure process, 4.3 percent were delinquent, 4.5 percent were in
default, and 4 percent were in foreclosure.1 By July of 2010, Michigan ranked sixth in the country
with a total of 18,833 properties in some state of foreclosure. One in every 241 Michigan housing
units received a foreclosure filing during this month.2 Figure 4 shows that mortgage delinquencies
continue to rise throughout Michigan, although there is significant heterogeneity across the state. 1 Government Accountability Office (2009), pp. 29-30. 2 Realty Trac (2010.)

Michigan Applied Public Police Research Paper, Michigan State University 6
While the fraction of mortgage debt that is delinquent fell and has stayed below the national average
beginning in late 2007, it has risen sharply for much of the period since 2008. In addition, Figure 5
also shows that home prices continued to decline over the last year. Figures 6 and 7 show that
delinquencies for auto loans and bank cards, although they continue to rise, have begun to fall
relative to the second quarter of 2009 in most counties and relative to the rest of the country. The
Corporation for Enterprise Development Assets and Opportunity Scorecard 2009-2010 reports that
in 2008 Michigan borrowers had a slightly higher level of revolving debt at $2, 984 from credit cards,
private label cards, and lines of credit. The national average was $2,900.3 However, if considering
total stock of debt per capita and the share that is delinquent over a longer period, 1999 to 2010, the
average for Michigan is lower than the U.S. average and is comparable to that of Ohio,
Pennsylvania, and Texas (see Figures 8 and 9). Between 2006 and 2009, business bankruptcies
nearly tripled, and non-business bankruptcies more than doubled, as can be seen in Table 3. As a
share of U.S. bankruptcies, between 2004 and 2008, business bankruptcies doubled, and non-
business bankruptcies rose by more than one third. Shares of both types of bankruptcy peaked in
2007. The data in Figure 10 indicate that the share of consumers with new bankruptcies has been
consistently above the national average since mid-2002. The data in Table 4 describe bank failures
in Michigan. Eight banks have failed since 2008.
II. The Surveys
Methods of measuring incremental changes in consumer finance have historically been inadequate.
Before 2008, the best data on consumer finance were obtained through the Federal Reserve’s Survey
of Consumer Finances, which was conducted every three years. Now more than ever, it is
3 Corporation for Enterprise Development (2009).

Michigan Applied Public Police Research Paper, Michigan State University 7
important to collect, analyze, and disseminate timely information on small changes in consumer
financial behavior that could lead to large local, state, and national, if not international, crises. To
gather more timely information on households in Michigan, I have collaborated with two groups at
Michigan State University: the Office of Survey Research in the Institute on Public Policy and Social
Research and MSU Extension (MSUE) on two surveys of Michigan households.
Web Survey
In collaboration with MSUE, a web-based survey with 62 questions was developed using the Snap
Survey platform. This survey was operational from June 2009 to April 2010 to collect data on the
financial situation of households in Michigan and to provide timely information to respondents to
address their financial concerns.4 Respondents were asked about household activity in the last two
to 12 months, e.g., sources of and changes in income and job loss, and expected activity in the next
one to three months, e.g., beginning foreclosure or bankruptcy proceedings. The sample size is 325.
The web-based survey offers rich detail on household financial conditions but is limited in a few
respects. Most importantly, its respondents are not representative of the Michigan population, and
inference from the analysis would be difficult. To address this, we take advantage of a pre-existing
survey instrument, the State of the State Survey (SOSS), to obtain a larger and more representative
sample and as a check on our web-based sampling methods.
4Data continue to be collected on a new survey platform, which provides an interactive assessment of respondents’ financial situation. A sample of the survey is available at www.mimoneyhealth.org.

Michigan Applied Public Police Research Paper, Michigan State University 8
State of the State Survey
SOSS interviews are conducted by telephone and take approximately 20 minutes. Survey
participants are randomly selected from adults age 18 and older living in Michigan. Interviewers ask
basic questions on background information, e.g. demographic, education, and employment
information and residents’ satisfaction with economic and political conditions.5 Further, additional
questions from MSU researchers are incorporated in each round of SOSS.6
The 55th round of SOSS was conducted from February to April 2010. It included interviews with
972 Michigan adults. In order to obtain an adequate sample for useful statistical analysis, the survey
oversamples from some regions, e.g. the Upper Peninsula, and racial groups, e.g., African
Americans. In our analysis, we use the weight variable for statewide estimates when the oversample
of African Americans is not included. Five key questions from the pilot web survey were included
on the SOSS. These ask for information about past, current, and future financial conditions of
households.
III. Results
Who is in the Surveys?
Table 5 summarizes data from survey respondents in the SOSS and provides a comparison with
recent surveys of Michigan residents, i.e., the aforementioned web survey, the Detroit Area
5 A detailed description of the SOSS is available at http://www.ippsr.msu.edu/soss/DEFAULT.ASP. 6 In the 55th round of SOSS, respondents are interviewed in detail about issues related to current economic conditions, retirement funding, and unemployment, among other things. Questions contributed may vary across survey rounds.

Michigan Applied Public Police Research Paper, Michigan State University 9
Household Financial Services study, and the U.S. Census American Community Survey (ACS) for
Michigan. The data are briefly discussed below.
SOSS
One third of the sample has at least a college degree, which is significantly higher than the Census
estimate for the state of Michigan. Slightly more than half, 53 percent, are women. Of the sample,
64 percent are married or members of unmarried couples living together. Three-quarters of
respondents have children. By construction, the racial composition of the SOSS and Census
samples are very similar with approximately 81 percent white and 14 percent African American.
Thirty-eight percent work full time, 16 percent work part time, and six percent report that they are
unemployed. The majority of SOSS respondents reported household income of $40,000 or more.
Web Survey
In this sample, education levels are much higher than in the state, the U.S., and in the SOSS – 33
percent with college degrees and 29 percent with advanced degrees as the highest level of education
attained. Seventy-seven percent of respondents are women.
The median annual household income before tax in the sample is $59,311. Forty percent of
households had within them someone who had lost his or her job or who had taken a pay cut in the
last six months. Twenty-one percent expected someone in the household to lose his or her job, and
25 percent were uncertain as to whether someone in the household would lose his or her job. Of

Michigan Applied Public Police Research Paper, Michigan State University 10
the 42 responding to the question, the median amount received in unemployment benefits last
month was $1,000.
Eighty-five percent of households have credit cards. They have four cards, on average, with two
carrying balances, one of which is paid off every month. The median amount of debt owed is $388
on credit cards; $8,125 in car or appliance loans; $19,600 in student loans; $15,001 in loans from
banks, insurers, or stock brokers; and $584 on payday loans (nine respondents). More than a quarter
had reached the borrowing limit on their credit cards. Fourteen percent of households had at least
one loan sent to a collection agency in the last three months. A small fraction filed for bankruptcy
in the last three years, 3.0 percent, which is comparable to the percentage who had filed for
bankruptcy in the last year in the Detroit study, 3.9 percent. Four percent had been involved in
foreclosure proceedings in the last two years. More than half, 57 percent, had checked their credit
score in the last year.
Respondents in the two surveys are comparable in a number of respects. They are roughly the same
age, 46 (SOSS) and 44 (web), on average. The largest share of respondents is from Southeast
Michigan in both surveys, which reflects the state’s population distribution. The majority of
respondents are homeowners. A high percentage, 89 percent (SOSS) and 91 percent (web) report
having health insurance. These coverage rates are higher than in the ACS and Detroit samples.
While most reported no income change, among those who reported a change, the average change in
income in the last three months is -4 percent (SOSS) and -5 percent (web). Within the next three
months, the median household expected no change, but among those anticipating a change, SOSS
households expected an increase of 1.2 percent, and web households expect a decline of 8.9 percent.

Michigan Applied Public Police Research Paper, Michigan State University 11
Among both sets of respondents, a low percentage, one or two percent, plan to file for bankruptcy
in the next three months. Eighty-three percent have not been late with either mortgage or rent
payments in the last year.
While the web-based survey responses provide detailed information on household financial
conditions, the data obtained from SOSS are more representative and, results reported below will
largely be obtained from analysis of this data set.
How Do Michigan Households Fare In and Interpret the Economic Environment?
Most questions related to precise magnitude of income had poor response rates, which is a common
feature of surveys. Therefore, in addition to using income to capture poverty, we use questions
related to the respondent’s ability to pay for necessities, i.e., food and monthly payments. Thirty
percent cannot afford food the family should have at least once in a while, and 60 percent find it at
least slightly difficult to make monthly payments on their family’s bills.
Sixty-five percent of respondents described their family income is unchanged in the last three
months, 12 percent said that it is higher, and 23 percent said that it was lower. For those reporting
recent declines in income, two-thirds reported a decline of 20 percent or more. Seventy-three
percent of respondents anticipated no change in their incomes in the next three months, 17 percent
percent anticipated an increase, and 10 percent anticipated a decline. When? If evaluating their
overall household financial situations more broadly, 75 percent in the sample believed that their
household’s current financial situation was “just fair” or good, and 21 percent believed that it was
“not so good” or poor (see Table 6). Slightly more than half of respondents estimated that they are
worse off than they were a year ago, and slightly less than half anticipate being better off in a year

Michigan Applied Public Police Research Paper, Michigan State University 12
(Table 6). Two percent anticipate filing for bankruptcy in the next three months, and seven percent
report being 30 days or more late in making a rent or mortgage payment.
Half of those interviewed invest in a 401(k), 403B, or IRA, and 27 percent invest in securities or
mutual funds outside of a formal retirement account. Twenty-nine percent anticipated using mainly
Social Security to fund their retirement, while 49 percent said they would rely on the value of their
homes to fund it.
With respect to perceptions of future macroeconomic conditions in the U.S., Michigan residents are
slightly pessimistic (Table 6). More than half estimate that the inflation rate will increase in the next
year. This finding is consistent with that of professional forecasters surveyed by the Federal Reserve
Bank of Philadelphia and with the RSQE forecast for Michigan.7 Forty percent think it will not
change. Less than a third believe that the unemployment rate will fall. Michigan households’ beliefs
are also similar to those of CEOs. Among those surveyed by the Business Roundtable in the third
quarter of 2010, 31 percent say that employment will rise; 23 percent, fall; and 46 percent, stay the
same. Forecasters at JP Morgan Chase and RSQE predict very slight increases in employment
growth in 2011 and 2012.8 Industry, academic, and survey estimates are broadly in line when
considering the share of respondents who believe the employment situation will stay the same or will
get better, 74 percent. In their local communities, 60 percent of Michigan residents believe that the
business conditions in their local environment will be bad in the next year. When asked to reveal
which problem is the most important in their communities, 62% said jobs and unemployment.
7 Federal Reserve Bank of Philadelphia (2010) and RSQE (2010). The rate of inflation increased 1.9% between February and April 2010, when the SOSS was administered, in the Detroit-Ann Arbor-Flint area, according to the Bureau of Labor Statistics (2010). 8 JP Morgan Chase (2010) and RSQE (2010). The unemployment rate (seasonally adjusted) in April 2010, when the SOSS was administered, was 14% in Michigan (State of Michigan (2010)).

Michigan Applied Public Police Research Paper, Michigan State University 13
Apart from “other,” four of the top five specific problems identified relate to economic issues
(Table 7).
Are Michigan Households Responding to Shocks?
Consistent with evidence from financial institutions, 59 percent of those in the sample are making
regular deposits into their savings accounts for emergencies. Market Rates Insight, a market
research firm for banks and credit unions, reports that in the first half of 2010 depositors exchanged
$200 billion in less liquid CD deposits primarily for more liquid deposits in money market accounts
($138 billion).9
The focal point of the analysis in this paper will be household changes in consumption –
adjustments to budgets or spending plans – and in income patterns – adjustments to sources of
income. Most households are poised to make adjustments to their planned expenses. Two-thirds of
respondents have a household budget that at least accounts for expenditure.10 On the income side,
responses related to retirement plans, savings, and investment portfolios will be evaluated.
How Are Michigan Households Responding to Shocks?
Of those with a budget, 35 percent never change it or update it only once a year, 46 percent change
it occasionally, and 19 percent change it every month. More than half of those eligible, 56 percent,
9 MRI (2010a, 2010b). The liquidity preference is particularly notable, as CD rates are twice as high as money markets rates, on average. MRI also reports that 15 percent of funds from maturing CDs were used to pay down credit card debt. 10 The question on the survey is, “Do you have a monthly household budget where you allocate how much to spend on your living expenses, such as housing, food, and transportation?” Therefore, “budget” and “spending plan” will be used interchangeably in this paper. Only 53 percent of respondents to the web survey report having a household budget.

Michigan Applied Public Police Research Paper, Michigan State University 14
postponed retiring in the last two years, and 21 percent retired earlier than expected. Eighty-one
percent of those reflecting on their retirement plans changed their portfolios in the past two years.
More than a quarter of those with retirement savings used them to pay for expenses unrelated to
retirement in the last two years.
These results are fairly general. There is no information on exactly when budgets were adopted nor
on their precise contents. Nonetheless, we have information on specific shocks to income and to
current employment. Shocks to income can be positive or negative and occur in the past or in the
future. Further, data were collected on respondents’ expectations of macroeconomic shocks, i.e., to
the inflation rate. Data on shocks will be compared to actual consumption- and income-smoothing
behavior to analyze responses of Michigan households to economic and financial change.
In the face of changes to respondent household income, results are asymmetric. As can be seen in
Tables 8 and 9, if there is an increase in income, spending plans adjust, and the behavior of those
whose incomes are increasing is significantly different from those whose incomes are not.11 If there
is a decline in income, consumption responses by those who have experienced a decline in income are
not statistically different from those who have not. It appears that their spending plans are not as
sensitive to negative income shocks as they are to positive income shocks. On the income side, a
larger share of households with positive income shocks has retirement plans and adjusts their
investment portfolios. Regardless of the type of income shock, those experiencing a shock are
11 To analyze differences between groups, we calculated the ratio of positive responses for each question by group and tested the difference between them using Pearson’s χ2 statistic. For example, for the question related to having a monthly budget, 66.2 percent of male respondents and 67% of female respondents have a monthly budget. From Pearson’s χ2 , there is no difference by gender in terms of having a monthly budget. In contrast, for the question related to retirement plans, 55 percent of male respondents and 47.8 percent of female respondents have retirement plans. From Pearson’s χ2 , there is a statistical difference by gender (see Table 19).

Michigan Applied Public Police Research Paper, Michigan State University 15
similarly likely to have adjusted their retirement portfolios and used their savings set aside for
retirement in the last two years. In sum, spending plans appear sticky going down (income decline)
and elastic going up (income increase), and changes to income through investment adjustment are
elastic going up or down.
Responses Vary by Income, Poverty, and Home Ownership Status
Table 10 gives consumption and income activity by household income group. The most frequent
users of budgets are not the most active budget-adjusters. Roughly 80 percent of respondents with
income less than $10,000, between $40,000 and $50,000, and between $100,000 and $150,000 report
having budgets. Those with incomes less than $10,000 change their budgets the least, which is not
surprising if there is little flexibility in spending plans. Lower consumption- and income-smoothing
activity in this income group relative to other groups will be consistent across consumption and
income-smoothing mechanisms. Ninety percent or more of those with incomes above $50,000
change their budgets at least occasionally, and only those with incomes between $60,000 and
$90,000 change them frequently. More than 70 percent of respondents in all but two income groups
report changing their retirement portfolios in the last year.
Interestingly, while more than 59 percent of respondents with incomes of $30,000 or more feel
confident about being able to afford basic necessities (food), less than half in most income groups
feel confident about making monthly payments, a finding which does not vary with income.
Households with incomes between $60,000 and $70,000 are most pessimistic about rising prices.

Michigan Applied Public Police Research Paper, Michigan State University 16
Table 11 describes consumption- and income-smoothing activity by household poverty status, i.e.,
ability to pay for basic necessities. Those who are poorer make greater use of budgets, but there is
no statistical difference between them and other groups with respect to adjusting their budgets and
portfolios.
Table 12 reports activity by ability to make monthly payments. By this measure of relative poverty,
those unable to pay and able to pay differ significantly in their budget- and portfolio-adjustment
behavior. Whether using ability to pay for food or ability to make monthly payments as a measure
of poverty, a higher proportion of those unable to pay have used their retirement savings for non-
retirement expenses in the last two years. Poorer households by this measure respond more than
less poor households.12
In Table 13 we see that renters adjust their budgets more often than homeowners. This is not
surprising, since the largest monthly expense homeowners have is their mortgage payment, and, as a
long-term contract, this is predictable. Renters, however, do not change their asset mixes more than
homeowners, and fewer renters report having retirement plans.
Responses Vary by Employment Status
Table 14 gives data on responsiveness by employment status. Twenty-four to 28 percent of non-
students used their retirement savings for expenses unrelated to retirement. Changing retirement
portfolio and using retirement savings notwithstanding, whether respondents have or use the means
to adjust spending and saving patterns depends on their employment status. Full-time workers and
homemakers use budgets more than others, but part-time and unemployed workers change them 12 In the SOSS, there are only historical assessments of respondents’ financial situations up to a year prior but more commonly three months prior. Therefore, it is difficult to know if these responses are from those who are chronically poor or if they come from the new poor, i.e., those who have been made poor recently by the financial and economic crises.

Michigan Applied Public Police Research Paper, Michigan State University 17
more often than others. This would be expected, if the source, magnitude, or timing of income or
earnings were variable.
Beliefs about future increases in the rate of inflation are somewhat surprising. Unemployed workers
are the most optimistic, and students, who likely have the least work experience of those in the
sample, are the most pessimistic.
Responses Vary by Anticipated Macroeconomic Changes and Expectations for Retirement
As would be predicted, respondents anticipating an increase in the rate of inflation adjust their
budgets more than those who do not (see Table 15). Nonetheless, there is no statistical difference
for other adjustments, including asset mix.
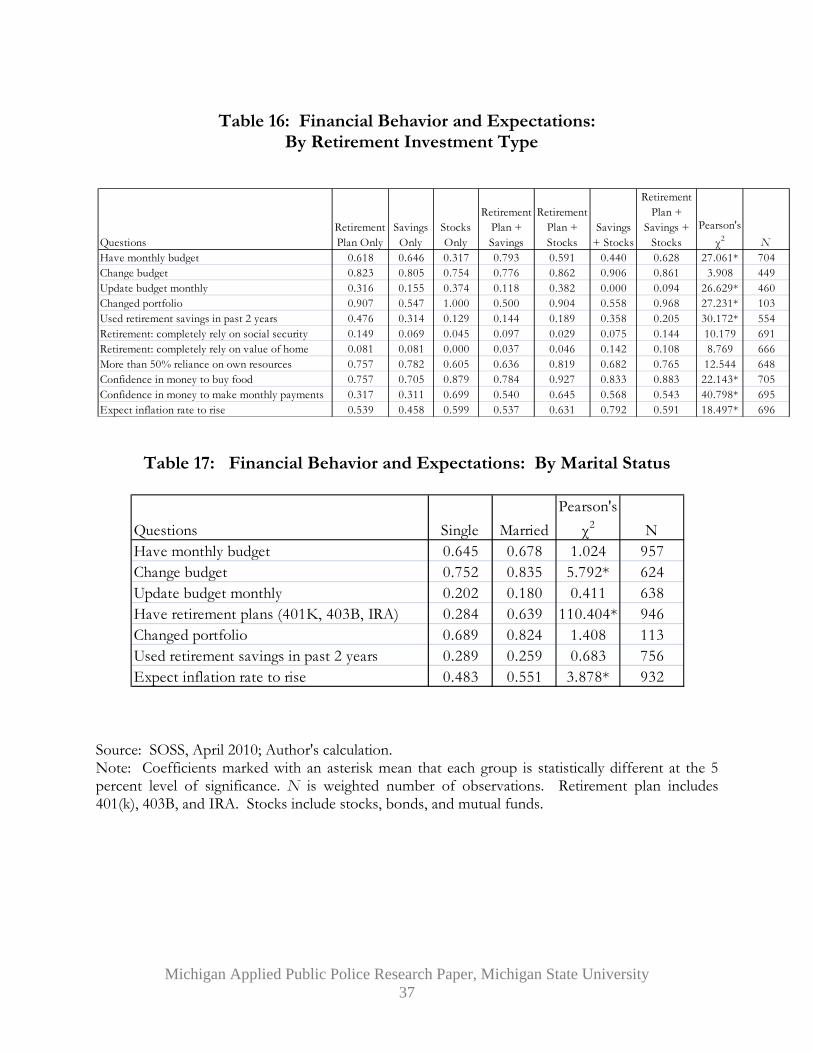
Table 16 shows that the presence of stocks in the retirement portfolio mix is associated with greater
changes in spending plans and in retirement portfolios. This would be predictable, given greater
volatility in stock movements than in other securities or than in bundles of stocks together, e.g.,
mutual funds found in 401(k) plans.
Responses Vary by Family Status but Not by Gender
While married respondents are not more likely to have a spending plan than single respondents, they
are more likely to change their budgets at least occasionally and to have retirement plans (see Table
17). They are also more likely to believe that prices will increase in the next year. In Table 18,
households without children report updating their budgets more often but are less likely than

Michigan Applied Public Police Research Paper, Michigan State University 18
households with children to have retirement plans? less frequently having retirement plans than
those with children.
There are no statistical differences between men and women respondents, with the exception that a
higher fraction of men report having retirement plans. Relatively more men say that they expect
prices to rise in the next year (Table 19).
Responses Vary by Race, Location, and Education
Table 20 shows that while African Americans adjust their budgets from time to time at a higher rate
than other groups, they adjust monthly budgets at a lower rate than other racial groups. While there
is no measurable difference in the presence of retirement plans, there are significant racial
differences in using retirement savings for expenses other than retirement. Whites most likely
smoothed income in this way. Other ethnic or racial groups were less likely to smooth income in this
way. There are also noticeable racial differences related to inflationary expectations.
Residents of rural areas were more likely to have and to frequently change spending plans relative to
those in other areas. A larger share of rural residents believes that the U.S. macroeconomic situation
will deteriorate next year (Table 21). While there is significant heterogeneity across regions within
Michigan with respect to adopting spending and retirement plans, there are fewer differences related
to changing them. Inflationary expectations differ appreciably by region (Table 22).
Respondents at all educational levels had changed their retirement portfolios in the last year, but this
is the only feature they have in common with respect to consumption- or income-smoothing

Michigan Applied Public Police Research Paper, Michigan State University 19
behavior. The data in Table 23 demonstrate that bachelor’s-degree recipients are the most active
users and adjusters of spending plans and retirement savings. Beliefs about future macroeconomic
events vary greatly by level of education, but not systematically.
IV. Implications for Policy
In an environment of higher than average unemployment and foreclosure rates and significant
income decline, I find that credit conditions among Michigan households largely follow national
trends. However, mortgage defaults and delinquencies are increasing more rapidly than in most
other states. Nonetheless, relatively few households in Michigan anticipate filing for bankruptcy or
defaulting on a mortgage in the near future. Household responses to changes in income depend on
the type of shock and on household characteristics. Households experiencing adverse income
shocks are not statistically more responsive, with respect to recent changes in spending, than those
who do not. Responses also depend on income or poverty status, employment status, race, and
location, among other factors.
Given adverse and volatile macroeconomic events in the state and nationally, it appears that a lower
than anticipated number of households are in a position to respond to shocks, i.e., without a
spending plan. That is, a higher proportion of households should be in a position to adjust their
spending plans and to adjust them regularly, if not frequently.
Social scientists, policymakers, and practitioners will need to understand the status of households
during the crisis and period of slow recovery, to measure their responses and to craft appropriate
responses. The recent crises have shown that household or microeconomic decisions can have
large, negative macroeconomic consequences. Policymakers in states like Michigan whose

Michigan Applied Public Police Research Paper, Michigan State University 20
economies are inextricably intertwined with the national economy should make more salient data
available in a timely fashion so that households can make better financial and economic decisions.
Data based on surveys, such as the ones used in this paper, should be collected and made publicly
available on a monthly basis for Michigan to improve decisions made by Michigan households and
by legislators on their behalf. Since questions on the web and SOSS surveys are forward-looking,
survey responses can be compared to contemporaneous and future data on economic activity in
Michigan to gauge the effect certain events, policies, and practices are having or will have on
Michigan households. Further, the findings of this paper and the economic and financial events of
2007 to 2009, if not during the longer-run structural adjustment of the Michigan economy, suggest
that economic and financial education should become a mandatory feature of high school education.
Service providers, such as non-profit credit and financial counselors, may be helpful in
demonstrating optimal decision-making techniques, given the best available information, and in
determining the most salient information to execute these calculations. The evidence is suggestive
that many, including the poorest in the economy, whether chronically or newly poor, can benefit
from more consumption-smoothing – budgeting – activity.

Michigan Applied Public Police Research Paper, Michigan State University 21
References
Blank, Rebecca and Michael Barr, eds. Insufficient Funds: Savings, Assets, Credit, and Banking Among Low-Income Households. New York: Russell Sage Foundation, 2009. Bureau of Labor Statistics (BLS), U.S. Department of Labor, Current Employment Statistics. http://www.bls.gov/data/, last accessed September 2010. Business Roundtable, “Business Roundtable Releases Third Quarter 2010 CEO Economic Outlook Survey,” September 28, 2010. Corporation for Enterprise Development, “Assets and Opportunity Scorecard 2009-2010,” http://scorecard.cfed.org/, last accessed September 2010. Federal Deposit Insurance Corporation (FDIC), Failures and Assistance Transactions, http://www2.fdic.gov/hsob/SelectRpt.asp?EntryTyp=30, last accessed May 2010. Federal Reserve Bank of New York (FRBNY), Quarterly Report on Household Debt and Credit, August 2010a, Available at http://data.newyorkfed.org/creditconditions/DistrictReport.pdf ____________________________________, U.S. Credit Conditions; TransUnion, LLC.; http://data.newyorkfed.org/creditconditions, last accessed September 2010b. Federal Reserve Bank of Philadelphia, “Third Quarter 2010 Survey of Professional Forecasters,” August 13, 2010. Federal Reserve Bank of St. Louis (FRBSL), Federal Reserve Economic Data (FRED): Coincident Economic Activity Index for Michigan ; Federal Reserve Bank of Philadelphia; http://research.stlouisfed.org/fred2/series/MIPHCI, last accessed September, 2010a.
__________________________________, House Price Index for Michigan; Federal Housing Finance Agency; http://research.stlouisfed.org/fred2/series/MISTHPI, last accessed September 2010b.
Food and Nutrition Service, U.S. Department of Agriculture, Program Data: Supplemental Nutrition Assistance Program. http://www.fns.usda.gov/pd/SNAPmain.htm, last accessed May 2010. JPMorgan Chase (Jim Glassman), “The State of Michigan’s Economy,” September 15, 2010. Market Rates Insight, “Consumers Cashing In Maturing CDs to Pay Down Credit Card Debt According to Latest Market Rates Insight Analysis,” September 21, 2010a. __________, cited by Barbara Marquand, “Bank customers choosing savings and money market accounts over CDs,” money-rates.com, September 14, 2010b.

Michigan Applied Public Police Research Paper, Michigan State University 22
Realty Trac, http://www.realtytrac.com/content/press-releases/foreclosure-activity-increases-4-percent-in-july-5946, last accessed September 2010. RSQE (University of Michigan), “Some highlights from the most recent RSQE Michigan forecast released on October 5,” October 5, 2010, www.rsqe.econ.lsa.umich.edu, last accessed October 2010. State of Michigan, Labor Market Information, “Unemployment Statistics,” http://www.milmi.org/cgi/dataanalysis/labForceReport.asp?menuchoice=LABFORCE, last accessed September 2010. State of the State Survey, Office of Survey Research, Institute for Public Policy and Social Research, Michigan State University, May 2010. U.S. Census Bureau, American Community Survey 2009, http://www.census.gov/acs/www/, last accessed September 2010a. _______________________________, U.S. Census Bureau, Current Population Survey, 2001-2010, Annual Social and Economic Supplement, http://www.census.gov/hhes/www/poverty/ and http://www.census.gov/hhes/www/income, last accessed September 2010b. United States Courts, Bankruptcy Statistics, http://www.uscourts.gov/Statistics/BankruptcyStatistics.aspx, last accessed September 2010. U.S. Government Accountability Office, “Nonprime Mortgages,” GAO-10-146R, December 16, 2009.

Figu
Source: FNote: Themploymsalaries. T
Source: BNote: Da
Michigan
ure 1: Coin
Federal Reserhe Coincide
ment, the unThe trend fo
Figure 2
Bureau of Laata are seaso
Applied Pub
ncident Ec
rve Bank of Sent Economemployment
or each state's
2: Unempl
abor Statisticnally adjuste
blic Police R
conomic A
St. Louis (201mic Activity t rate, averags index is set
loyment R
s (2010) d.
Research Pap23
Activity Ind
10a). Index inclu
ge hours wto match th
Rate, Mich
per, Michiga
dex, Selec
udes four inorked in mae trend for g
igan and U
an State Univ
cted States
ndicators: anufacturing
gross state pr
U.S., 2000-
versity
s, 1975-2010
nonfarm pg, and wagesoduct.
-2010
0
ayroll s and

Figure Percent
Source: FNote: FRand houssample ofbased onforeclosu
Fi
Source: F
Michigan
3: Consumt
Federal ReserRBNY Consseholds fromf all individu
n the populaures first appe
igure 4: M
Federal Reser
Applied Pub
mers with
rve Bank of Numer Credit
m 1999 to 20uals with a sotion with a earing on the
Mortgage D
rve Bank of N
blic Police R
New Fore
New York (2Panel consis010. The p
ocial security credit repor
eir credit repo
DelinquencYear
New York (2
Research Pap24
eclosures,
2010a), Figursts of detailepanel is a nanumber and
rt. New forort during th
cy Rate 90r-over-Yea
2010b).
per, Michiga
Michigan
e 25. d Equifax cr
ationally repr a credit repoeclosures are
he past three
0+ Days, 2ar
an State Univ
n and U.S.
redit-report dresentative 5ort. Percene number ofmonths.
2nd Quarter
versity
, 1999 to 2
data of indivi5 percent rannt of consumf individuals
r of 2010,
2010
iduals ndom
mers is with

Source: F
Fig
Source: F
Michigan
Fig
Federal Reser
gure 6: Au
Federal Reser
Applied Pub
gure 5: H
rve Bank of S
uto Loan D
rve Bank of N
blic Police R
Home Price
St. Louis (201
DelinquenYear
New York (2
Research Pap25
e Index, M
10b).
ncy Rate 60r-over-Yea
2010b).
per, Michiga
Michigan, 1
0+ Days, 2ar
an State Univ
1975-2010
2nd Quarte
versity
er of 2010,

Fig
Source: F
F
Source: F
Michigan
gure 7: Ba
Federal Reser
Figure 8: T
Federal Reser
Applied Pub
ank Card D
rve Bank of N
Total Debt
rve Bank of N
blic Police R
DelinquenYear
New York (2
t Balance p
New York (2
Research Pap26
ncy Rate 60r-over-Yea
2010b).
per Capita
2010a), Figur
per, Michiga
0+ Days, 2ar
a, Selected
e 18.
an State Univ
2nd Quarte
d States, 19
versity
er of 2010,
999-2010

Figu
Source: F
F
Source: FNote: Tindividuarandom sconsumerreported
Michigan
ure 9: Deli
Federal Reser
Figure 10:
Federal ReserThe FRBNYals and housesample of alrs is based oduring the p
Applied Pub
inquency S
rve Bank of N
Consume
rve Bank of NY Consumer eholds from ll individualsn the populaast 3 months
blic Police R
Status of D2nd Qu
New York (2
rs with Ne1999 to
New York (2Credit Pane1999 to 201
s with a socation with a cs.
Research Pap27
Debt Balanuarter of 20
2010a), Figur
ew Bankru2010, Perc
2010a), Figurel consists o10. The pancial security credit report
per, Michiga
nce per Ca010
e 20.
uptcies, Mcent
e 26. of detailed Enel is a nationumber and
t. New bank
an State Univ
apita, Sele
Michigan a
Equifax credonally represed a credit repkruptcies are
versity
cted State
nd U.S.,
dit-report daentative 5 peport. Percebankruptcies
es,
ata of ercent ent of s first

Michigan Applied Public Police Research Paper, Michigan State University 28
Table 1: Poverty Levels in Michigan and U.S., 1995-2009
Source: U.S. Census Bureau (2010b).
Table 2: Supplemental Nutrition Assistance Program, 2006-2010, Number of Participants (Households)
Source: Food and Nutrition Service (2010). Note: FY 2006 to 2009 data are average monthly participants.
YearMichigan U.S.
Thousands Percent Thousands Percent Thousands Percent Thousands Percent Dollars Dollars2009 1,376 14.0 43,569 14.3 447 19.5 14,774 20.1 45,994 49,7772008 1,273 13.0 39,829 13.2 435 18.6 13,507 18.5 49,788 50,3032007 1,076 10.8 37,276 12.5 368 15.5 12,802 17.6 49,370 50,2332006 1,323 13.3 36,460 12.3 433 18.2 12,299 16.9 48,647 48,2012005 1,196 12.0 36,950 12.6 402 16.0 12,335 17.1 45,933 46,3262004 1,318 13.3 37,040 12.7 483 19.2 13,041 17.8 42,256 44,3342003 1,125 11.4 35,861 12.5 364 14.6 12,866 17.6 45,022 43,3182002 1,152 11.6 34,570 12.1 349 14.1 11,646 16.3 42,715 42,4092001 927 9.4 32,907 11.7 295 12.4 11,175 15.8 45,047 42,2282000 993 10.0 31,054 11.3 329 12.7 11,018 15.6 45,512 41,9901995 1,068 11.2 27,501 12.3 n.a. n.a. 13,999 20.2 36,426 34,076
Median incomeMichigan U.S.
All ages Children under age of 18Michigan U.S.
State FY 2006 FY 2007 FY 2008 FY 2009 Feb-09 Feb-10 Percent Change Feb-10 vs 2006
California 799,469 827,258 914,161 1,122,949 1,081,909 1,360,840 70%Georgia 386,192 387,254 417,427 534,944 509,986 666,887 73%Illinois 556,293 569,073 595,832 677,147 663,016 756,341 36%Massachusetts 227,263 239,802 266,430 336,050 324,452 402,247 77%Michigan 515,030 555,744 590,930 694,341 668,308 848,429 65%Ohio 480,582 492,811 526,800 624,989 601,377 736,638 53%Texas 1,017,313 947,235 994,786 1,183,153 1,150,198 1,373,771 35%Wyoming 10,134 9,499 9,564 11,185 10,628 14,637 44%U.S. 11,734,491 11,789,594 12,728,981 15,232,105 14,677,726 18,273,141 56%

Michigan Applied Public Police Research Paper, Michigan State University 29
Table 3: Business and Non-Business Bankruptcy Cases Commenced, Michigan, 2004-2010
Source: United States Courts (2010).
Table 4: FDIC Bank Failures and Assistance Transactions, Michigan, 2008-2010 ($, ‘000s)
Source: Federal Deposit Insurance Corporation (2010). Note: DIF is the Deposit Insurance Fund, which is the insurance fund into which financial institutions pay premiums based on specific factors, such as size of insured deposits and risk an institution poses to the insurance fund.
Year/ Quarter
Number, Michigan
Michigan/U.S.
Number, Michigan
Michigan/U.S.
2004 681 0.02 63,531 0.0412005 1,071 0.027 88,402 0.0432006 753 0.038 32,746 0.0552007 1,194 0.042 44,996 0.0552008 1,684 0.039 53,656 0.052009 2,081 0.034 67,265 0.048
2007: Q1 288 0.046 10,852 0.0582007: Q2 280 0.042 10,811 0.0532007: Q3 288 0.04 11,587 0.0552007: Q4 331 0.041 11,755 0.0542008: Q1 374 0.043 13,084 0.0552008: Q2 401 0.041 13,477 0.0512008: Q3 434 0.038 13,454 0.0482008: Q4 445 0.034 13,641 0.0472009: Q1 495 0.035 17,026 0.0542009: Q2 589 0.037 17,690 0.0482009: Q3 480 0.032 16,638 0.0452009: Q4 515 0.034 15,906 0.0452010: Q1 467 0.032 18,617 0.05
Business Non-Business
Institution Name Location Effective date Ins. FundFailure/ Assistance
Total Deposit
Total Assets
Estimated Loss
NEW LIBERTY BANK PLYMOUTH, MI 5/14/2010 DIF FAILURE 101,884 111,239 N/ACF BANCORP PORT HURON, MI 4/30/2010 DIF FAILURE 1,418,445 1,599,122 N/ALAKESIDE COMMUNITY BANK STERLING HEIGHTS, MI 4/16/2010 DIF FAILURE 52,290 53,021 N/ACITIZENS STATE BANK NEW BALTIMORE, MI 12/18/2009 DIF FAILURE 157,149 168,551 33,980HOME FEDERAL SAVINGS BANK DETROIT, MI 11/6/2009 DIF FAILURE 12,730 12,994 7,902WARREN BANK WARREN, MI 10/2/2009 DIF FAILURE 467,767 504,816 243,314MICHIGAN HERITAGE BANK FARMINGTON HILLS, MI 4/24/2009 DIF FAILURE 149,065 167,710 58,377MAIN STREET BANK NORTHVILLE, MI 10/10/2008 DIF FAILURE 98,934 112,368 54,431
8 2,458,264 2,729,821 398,0040 0 0 N/A8 2,458,264 2,729,821 398,004
Total Failures Total Assistance Transactions Total Institutions

Michigan Applied Public Police Research Paper, Michigan State University 30

Michigan Applied Public Police Research Paper, Michigan State University 31
Table 5: Characteristics of SOSS Respondents, Selected
a) b)Region Percent Job Status Percent
Upper Peninsula 3.4 Full time 38.0Northern 5.7 Part time 15.6West Central 14.2 Work+School 4.2East Central 8.7 School Full Time 3.4Southwest 13.8 Armed Forces 0.3Southeast 45.6 Retired 16.1Detroit 8.7 Homemaker 13.9
Unemployed 6.0Disabled 1.9Other 0.7
c) d)Highest Level of Education Percent Race Percent
11th grade or lower 6.9 White 80.9High school graduate, GED 27.7 African American 14.1Some college 24.5 Native American 2.2Technical/junior college graduate 7.9 Hispanic 1.1College graduate (4 years) 19.8 Asian 0.2Some post graduate 2.0 Hawaiian, Pacific Islander 0.2Graduate degree 11.2 Other 2.7
e)Comparison to Other Surveys
Median College Un- AfricanHousehold Graduate Filed Bankruptcy Insured American
Survey Income ($) (%) (%) (%) (%)SOSS over 40,000 33.0 na 11.1 14.1MSUE Consumer Finance Web survey 59,311 62.0 3.0 9.0 naDetroit Area Household Financial 24,146 47.4 3.9 21.0 69.1Services studyU.S. Census, Michigan 45,255 24.6 na 12.2 13.9
(358) (0.3) (0.2) (0.1)
Source: SOSS, April 2010; MSUE Consumer Finance Web survey (2009-2010); Detroit Area Household Financial Services study cited in Blank and Barr (2009); U.S. Census, American Community Survey 2009Note: SOSS: N=972; see text for description of survey; sums of percentages may not sum to 100due to rounding error; respondents reported data ranges for incomeMSUE: N=325; see text for description of survey; data were collected from April 2009 to April 2010Detroit study: N=938; college graduate data are for "beyond high school diploma"Census: N=9.79 million (household population); data are estimated; standard errors are in parentheses;data are for 2009; median income is in 2009 inflation-adjusted dollars; race data are for those reporting one race.

Michigan Applied Public Police Research Paper, Michigan State University 32
Table 6: Perceived Personal, Macroeconomic, and Business Environment
Indicators Better offAbout the
same Worse offCurrent financial situation relative to a year ago 22.0 25.0 53.0Anticipated future financial situation realtive to current situation 46.6 20.2 33.3
Go up Go downStay about the same
Expected change in inflation rate in next year, US 52.8 7.5 39.7
Better WorseAbout the
sameExpected change in unemployment rate in next year, US 32.4 25.8 41.8
Good time Bad time
Neither good or
badBusiness conditions in community in next 12 months 32.2 60.0 7.7
Excellent Good Just fairNot so good Poor
Current financial situation 4.9 36.7 37.8 14.2 6.3
Source: SOSS, April 2010; Author's calculationNote: U.S. inflation rate (CPI): April -- 0.1% decrease from March and 2.2 % from past 12 months; August -- 0.3% increase from July and 1.2% from past 12 months.Midwest, inflation rate (CPI): April -- 0.2% increase from March and 2.7% from past 12 months;August -- 0.2 % increase from July and 1.7 % from past 12 months.U.S. and Michigan unemployment rates: April -- 9.9% and 14%; August -- 9.6% and 13.1%.

Michigan Applied Public Police Research Paper, Michigan State University 33
Table 7: The Most Important Problems Facing Communities, 2010
Table 8: Financial Behavior and Expectations: By Income Change (Increase)
Source: SOSS, April 2010; Author's calculation. Note: Coefficients marked with an asterisk mean that each group is statistically different at the 5 percent level of significance. N is weighted number of observations. The survey question related to change in income is, “In the past three months has your total family income from all sources increased, decreased, or stayed about the same?”
Most Important Problems PercentJobs/creating jobs/unemployment 61.7Other 14.6Economy/economic growth/stimulating economy 11.5School finance/education funding 5.9Crime 3.2Foreclosures/housing crisis/property values 3.1
Source: SOSS, April 2010; Author's calculationNote: Sample size is 972. See text for description of survey. Sums of percentages may not sum to 100 dueto rounding error.The survey question for the most important problem is "What would you say is the most importantproblem facing your community today?".
Questions
Income Decline or No Change
Income Increase
Pearson's χ2 N
Have monthly budget 0.684 0.650 0.535 928Change budget 0.785 0.952 10.417* 618Update budget monthly 0.162 0.354 14.924* 631Have retirement plans (401K, 403B, IRA) 0.493 0.641 9.033* 917Changed portfolio 0.735 1.000 10.499* 113Used retirement savings in past 2 years 0.269 0.340 1.868 730Retirement: completely rely on social security 0.183 0.077 8.002* 913Retirement: completely rely on value of home 0.079 0.033 2.773 881More than 50% reliance on own resources 0.686 0.813 7.168* 851Confidence in money to buy food 0.678 0.840 12.655* 940Confidence in money to make monthly payments 0.396 0.471 2.355 930Expect inflation rate to rise 0.507 0.581 2.194 903

Michigan Applied Public Police Research Paper, Michigan State University 34
Table 9: Financial Behavior and Expectations: By Income Change (Decline)
Table 10: Financial Behavior and Expectations: By Income Level
Source: SOSS, April 2010; Author's calculation. Note: Coefficients marked with an asterisk mean that each group is statistically different at the 5 percent level of significance. N is weighted number of observations. The survey question related to change in income is, “In the past three months has your total family income from all sources increased, decreased, or stayed about the same?”
Questions
Income Increase or No change
Income Decline
Pearson's χ2 N
Have monthly budget 0.689 0.650 1.171 928Change budget 0.804 0.805 0.0003 618Update budget monthly 0.174 0.222 1.513 631Have retirement plans (401K, 403B, IRA) 0.557 0.349 27.956* 917Changed portfolio 0.893 0.590 13.816* 113Used retirement savings in past 2 years 0.275 0.288 0.096 730Retirement: completely rely on social security 0.169 0.173 0.0119 913Retirement: completely rely on value of home 0.064 0.107 4.217* 881More than 50% reliance on own resources 0.736 0.577 18.037* 851Confidence in money to buy food 0.785 0.406 114.700* 940Confidence in money to make monthly payments 0.454 0.239 32.208* 930Expect inflation rate to rise 0.527 0.474 1.693 903
Questions < 10,00010,000-20,000
20,000-30,000
30,000-40,000
40,000-50,000
50,000-60,000
60,000-70,000
70,000-90,000
90,000-100,000
100,000-150,000 >150,000
Pearson's χ2 N
Have monthly budget 0.811 0.699 0.727 0.653 0.779 0.702 0.551 0.630 0.600 0.797 0.741 26.423* 831Change budget 0.433 0.503 0.743 0.721 0.823 0.934 0.943 0.885 0.888 0.895 0.934 73.489* 564Update budget monthly 0.089 0.160 0.138 0.151 0.116 0.218 0.252 0.366 0.104 0.182 0.000 25.387* 573Have retirement plans (401K, 403B, IRA) 0.026 0.140 0.175 0.535 0.407 0.528 0.488 0.796 0.905 0.592 0.920 179.824* 831Changed portfolio 0.000 0.883 0.845 0.717 0.821 0.781 1.000 0.846 0.196 0.942 0.917 27.690* 107Used retirement savings in past 2 years 0.375 0.348 0.213 0.471 0.189 0.441 0.199 0.445 0.042 0.242 0.057 51.382* 668Retirement: completely rely on social security 0.421 0.358 0.219 0.209 0.449 0.062 0.058 0.013 0.018 0.093 0.108 132.075* 825Retirement: completely rely on value of home 0.084 0.062 0.159 0.052 0.129 0.104 0.032 0.038 0.010 0.009 0.137 29.710* 798More than 50% reliance on own resources 0.341 0.627 0.748 0.742 0.748 0.796 0.641 0.830 0.574 0.710 0.612 36.295* 784Confidence in money to buy food 0.263 0.450 0.444 0.656 0.740 0.583 0.682 0.826 1.000 0.951 0.944 139.766* 834Confidence in money to make monthly payments 0.146 0.328 0.236 0.280 0.528 0.341 0.329 0.372 0.632 0.487 0.897 80.529* 829Expect inflation rate to rise 0.461 0.391 0.439 0.607 0.415 0.711 0.437 0.486 0.518 0.515 0.541 32.633* 797N 30 66 77 70 89 119 122 95 34 100 34 -- 836

Michigan Applied Public Police Research Paper, Michigan State University 35
Table 11: Financial Behavior and Expectations: By Ability to Pay for Necessities
Table 12: Financial Behavior and Expectations: By Ability to Make Monthly Payments
Source: SOSS, April 2010; Author's calculation. Note: Coefficients marked with an asterisk mean that each group is statistically different at the 5 percent level of significance. N is weighted number of observations. For Table 11, "Unable to pay" includes once in a while, fairly often and very often that respondents do not have enough money to pay for food. For Table 12, "Unable to Pay" includes extremely difficult, very difficult, somewhat difficult and slightly difficult to meet monthly payment.
QuestionsUnable to
Pay Able to PayPearson's
χ2 NHave monthly budget 0.724 0.640 6.179* 952Change budget 0.799 0.808 0.067 619Update budget monthly 0.168 0.199 0.764 632Have retirement plans (401K, 403B, IRA) 0.310 0.598 65.103* 940Changed portfolio 0.798 0.807 0.009 112Used retirement savings in past 2 years 0.384 0.221 18.348* 752Confidence in money to make monthly payments 0.132 0.519 124.102* 954Expect inflation rate to rise 0.564 0.512 2.038 926
QuestionsUnable to
Pay Able to PayPearson's
χ2 NHave monthly budget 0.685 0.648 1.400 943Change budget 0.837 0.756 5.743* 621Update budget monthly 0.255 0.089 25.334* 632Have retirement plans (401K, 403B, IRA) 0.430 0.639 39.477* 934Changed portfolio 0.862 0.702 4.303* 111Used retirement savings in past 2 years 0.368 0.084 60.319* 747Confidence in money to buy food 0.568 0.903 124.192* 954Expect inflation rate to rise 0.530 0.530 0.000 916

Michigan Applied Public Police Research Paper, Michigan State University 36
Table 13: Financial Behavior and Expectations: By Home Ownership
Table 14: Financial Behavior and Expectations: By Employment Status
Table 15: Financial Behavior and Expectations: By Expect Inflation Rate Increase
Source: SOSS, April 2010; Author's calculation. Note: Coefficients marked with an asterisk mean that each group is statistically different at the 5 percent level of significance. N is weighted number of observations. Home owners include those paying a mortgage. Part time includes "work part time" and "work and go to school."
Questions Own HomeRent House
or Apartment OtherPearson's
χ2 NHave monthly budget 0.681 0.671 0.589 5.158 948Change budget 0.802 0.791 0.821 0.250 616Update budget monthly 0.148 0.244 0.251 8.465* 629Have retirement plans (401K, 403B, IRA) 0.663 0.295 0.070 212.136* 945Changed portfolio 0.803 0.830 0.950 0.330 113Used retirement savings in past 2 years 0.262 0.352 0.223 4.658 756Expect inflation rate to rise 0.537 0.523 0.463 2.574 923
QuestionsFull
TimePart
Time Unemployed Retired Student HomemakerPearson's
χ2 NHave monthly budget 0.738 0.582 0.635 0.581 0.440 0.738 29.136* 931Change budget 0.919 0.834 0.748 0.728 0.597 0.623 45.585* 604Update budget monthly 0.148 0.276 0.250 0.151 0.000 0.238 13.494* 617Have retirement plans (401K, 403B, IRA) 0.655 0.300 0.170 0.749 0.192 0.446 135.570* 918Changed portfolio 0.836 0.871 0.943 0.898 1.000 0.639 7.141 110Used retirement savings in past 2 years 0.282 0.284 0.242 n.a. 0.076 0.275 5.645 731Expect inflation rate to rise 0.580 0.473 0.300 0.567 0.635 0.485 20.916* 903
Questions
Expect Inflation Rate Decline or
No Change
Expect Inflation Increase
Pearson's χ2 N
Have monthly budget 0.705 0.647 3.510 917Change budget 0.814 0.824 0.091 607Update budget monthly 0.155 0.229 5.092* 618Have retirement plans (401K, 403B, IRA) 0.494 0.561 4.084* 906Changed portfolio 0.791 0.847 0.572 112Used retirement savings in past 2 years 0.260 0.279 0.273 729
Michigan Applied Public Police Research Paper, Michigan State University 37
Table 16: Financial Behavior and Expectations:
By Retirement Investment Type
Table 17: Financial Behavior and Expectations: By Marital Status
Source: SOSS, April 2010; Author's calculation. Note: Coefficients marked with an asterisk mean that each group is statistically different at the 5 percent level of significance. N is weighted number of observations. Retirement plan includes 401(k), 403B, and IRA. Stocks include stocks, bonds, and mutual funds.
QuestionsRetirement Plan Only
Savings Only
Stocks Only
Retirement Plan + Savings
Retirement Plan + Stocks
Savings + Stocks
Retirement Plan +
Savings + Stocks
Pearson's χ2 N
Have monthly budget 0.618 0.646 0.317 0.793 0.591 0.440 0.628 27.061* 704Change budget 0.823 0.805 0.754 0.776 0.862 0.906 0.861 3.908 449Update budget monthly 0.316 0.155 0.374 0.118 0.382 0.000 0.094 26.629* 460Changed portfolio 0.907 0.547 1.000 0.500 0.904 0.558 0.968 27.231* 103Used retirement savings in past 2 years 0.476 0.314 0.129 0.144 0.189 0.358 0.205 30.172* 554Retirement: completely rely on social security 0.149 0.069 0.045 0.097 0.029 0.075 0.144 10.179 691Retirement: completely rely on value of home 0.081 0.081 0.000 0.037 0.046 0.142 0.108 8.769 666More than 50% reliance on own resources 0.757 0.782 0.605 0.636 0.819 0.682 0.765 12.544 648Confidence in money to buy food 0.757 0.705 0.879 0.784 0.927 0.833 0.883 22.143* 705Confidence in money to make monthly payments 0.317 0.311 0.699 0.540 0.645 0.568 0.543 40.798* 695Expect inflation rate to rise 0.539 0.458 0.599 0.537 0.631 0.792 0.591 18.497* 696
Questions Single MarriedPearson's
χ2 NHave monthly budget 0.645 0.678 1.024 957Change budget 0.752 0.835 5.792* 624Update budget monthly 0.202 0.180 0.411 638Have retirement plans (401K, 403B, IRA) 0.284 0.639 110.404* 946Changed portfolio 0.689 0.824 1.408 113Used retirement savings in past 2 years 0.289 0.259 0.683 756Expect inflation rate to rise 0.483 0.551 3.878* 932

Michigan Applied Public Police Research Paper, Michigan State University 38
Table 18: Financial Behavior and Expectations: By Child Status
Table 19: Financial Behavior and Expectations: By Gender
Table 20: Financial Behavior and Expectations: By Race
Source: SOSS, April 2010; Author's calculation. Note: Coefficients marked with an asterisk mean that each group is statistically different at the 5 percent level of significance. N is weighted number of observations.
QuestionsWithout Children
With Children
Pearson's χ2 N
Have monthly budget 0.683 0.661 0.399 956Change budget 0.835 0.796 1.106 623Update budget monthly 0.268 0.160 8.540* 637Have retirement plans (401K, 403B, IRA) 0.292 0.587 62.282* 945Changed portfolio 0.852 0.800 0.273 113Used retirement savings in past 2 years 0.303 0.257 1.263 0.756Expect inflation rate to rise 0.534 0.526 0.051 931
Questions Male FemalePearson's
χ2 NHave monthly budget 0.662 0.670 0.079 957Change budget 0.838 0.779 3.161 624Update budget monthly 0.206 0.172 1.152 637Have retirement plans (401K, 403B, IRA) 0.551 0.478 5.076* 946Changed portfolio 0.858 0.770 1.411 113Used retirement savings in past 2 years 0.248 0.287 1.279 756Expect inflation rate to rise 0.601 0.461 18.601* 932
Questions WhiteAfrican
American OtherPearson's
χ2 NHave monthly budget 0.670 0.598 0.604 2.830 924Change budget 0.810 0.822 0.486 8.042* 600Update budget monthly 0.203 0.054 0.164 9.198* 609Have retirement plans (401K, 403B, IRA) 0.520 0.467 0.464 1.427 915Changed portfolio 0.789 0.894 n.a. 0.355 104Used retirement savings in past 2 years 0.288 0.149 0.038 8.908* 732Expect inflation rate to rise 0.548 0.353 0.650 19.146* 901

Michigan Applied Public Police Research Paper, Michigan State University 39
Table 21: Financial Behavior and Expectations: By Type of Community
Table 22: Financial Behavior and Expectations: By Region
Table 23: Financial Behavior and Expectations: By Education Level
Source: SOSS, April 2010; Author's calculation. Note: Coefficients marked with an asterisk mean that each group is statistically different at the 5 percent level of significance. N is weighted number of observations.
Questions RuralSmall Town Suburb Urban
Pearson's χ2 N
Have monthly budget 0.721 0.606 0.697 0.629 9.931* 941Change budget 0.742 0.826 0.833 0.838 5.935 614Update budget monthly 0.271 0.082 0.218 0.147 21.116* 628Have retirement plans (401K, 403B, IRA) 0.543 0.481 0.544 0.481 3.632 934Changed portfolio 0.869 0.899 0.720 0.775 4.667 113Used retirement savings in past 2 years 0.301 0.261 0.276 0.165 5.334 747Expect inflation rate to rise 0.663 0.529 0.479 0.406 28.917* 916
QuestionsUpper
penninsula Northern Central Southwest
Southeast - excluding Detroit Detroit
Pearson's χ2 N
Have monthly budget 0.500 0.570 0.670 0.628 0.728 0.516 23.812* 957Change budget 0.778 0.814 0.739 0.811 0.818 0.820 2.481 624Update budget monthly 0.189 0.158 0.115 0.239 0.197 0.108 6.459 638Have retirement plans (401K, 403B, IRA) 0.701 0.310 0.526 0.473 0.551 0.435 20.148* 946Changed portfolio 0.660 0.798 0.867 0.835 0.798 0.812 0.668 113Used retirement savings in past 2 years 0.141 0.346 0.375 0.283 0.245 0.216 9.023 756Expect inflation rate to rise 0.521 0.695 0.618 0.611 0.466 0.470 23.405* 932
Questions <HS HS
Some college/
Technical BA Post GradPearson's
χ2 NHave monthly budget 0.514 0.641 0.684 0.719 0.667 10.359* 954Change budget 0.798 0.787 0.759 0.949 0.728 22.260* 621Update budget monthly 0.067 0.222 0.130 0.335 0.067 34.218* 635Have retirement plans (401K, 403B, IRA) 0.217 0.449 0.467 0.616 0.753 66.864* 943Changed portfolio 1.000 0.854 0.746 0.789 0.960 3.538 113Used retirement savings in past 2 years 0.122 0.372 0.223 0.320 0.185 21.883* 755Expect inflation rate to rise 0.669 0.545 0.419 0.642 0.532 28.286* 929

3
College of Social Science Michigan State University 321 Berkey Hall East Lansing, MI 48824-1111 Phone:517-355-6672 Fax:517-432-1544 Web: www.ippsr.msu.edu Michigan State University is an affirmative-action, equal-opportunity employer.
Institute for Public Policy and Social Research