
FE Review Materials Science and Structure of MatterFE Review Materials Science and Structure of...
60
FE Review Materials Science and Structure of Matter Jeffrey W. Fergus Materials Engineering Office: 281 Wilmore Phone: 844-3405 email: [email protected]
Transcript of FE Review Materials Science and Structure of MatterFE Review Materials Science and Structure of...

FE ReviewMaterials Science and Structure of
Matter
Jeffrey W. FergusMaterials Engineering
Office: 281 Wilmore
Phone: 844-3405email: [email protected]

Organization from 1996-7 Review Manual(same topics in 2004 review manual)
• Crystallography• Materials Testing• Metallurgy

Crystallography
• Crystal structure– atoms/unit cell– packing factor– coordination number
• Atomic bonding• Radioactive decay

Bravais Lattice
Crystal System Centering
a
b
c
β α
γ
P: Primitive: (x,y,z)
I: Body-centered: (x,y,z); (x+½,y+½,z+½)
C: Base-centered: (x,y,z); (x+½,y+½,z)
F: Face-centered: (x,y,z); (x+½,y+½,z)(x+½,y,z+½); (x,y+½,z+½)
(x,y,z): Fractional coordinates -proportion of axis length, not absolute distanct
Centering must apply to all atoms in unit cell.

Bravais Lattices (14)
Crystal System Parameters Primitive
(Simple) Body-
Centered Face-
Centered Base-
Centered
Cubic a=b=c
α=β=γ=90° X X X
Tetragonal a=b≠c
α=β=γ=90° X X
Orthorhombic a≠b≠c
α=β=γ=90° X X X X
Rhombohedral a=b=c
α=β=γ≠90° X
Hexagonal a=b≠c α=β=90°, γ=120°
X
Monoclinic a≠b≠c
α=γ=90°, β≠120° X X
Triclinic a≠b≠c
α≠β≠γ≠90° X

Atoms Per Unit Cell
• Corners - shared by eight unit cells (x 1/8)– (0,0,0)=(1,0,0)=(0,1,0)=(0,0,1)=(1,1,0)
=(1,0,1)=(0,1,1)=(1,1,1)
• Edges - shared by four unit cells (x 1/4)– (0,0,½)= (1,0,½)= (0,1,½)= (1,1,½)
• Faces - shared by two unit cells (x 1/2)– (½,½,0)= (½,½,1)

Common Metal Structures
• Face-Centered Cubic (FCC)– 8 corners x 1/8 + 6 faces x 1/2 – 1 + 3 = 4 atoms/u.c.
• Body-Centered Cubic (BCC)– 8 corners x 1/8 + 1 center – 1 + 1 = 2 atoms/u.c.
• Hexagonal Close-Packed (HCP)– 8 corners x 1/8 + 1 middle – 1 + 1 = 2 atoms/u.c.– 12 hex. Corner x 1/6 +2 face x 1/2 + 3
middle = 6 atoms/u.c.

Packing Factor
• Fraction of space occupied by atoms• For FCC
• For BCC
cba
rFP i
⋅⋅= ∑
334 π
..
a
ar
raraa2
44diagonalface 22 =⇒⋅=+=
( ) ( )740
23
24
443
334
3
334
.r
a
r.F.P =π=
π⋅=
π⋅=
raraaa3
44diagonalbody 322 =⇒⋅=++=
( ) ( )680
83
34
223
334
3
334
.r
a
r.F.P =π=
π⋅=
π⋅=

Density
volumemass
.c.uvolume
moleatom
molemass
.c.uatom
Density =
⋅
⋅
=
( ) 338249158
1052393106020
71584
cm
g.
cmx.moleatom
x.
moleg
..c.u
atom
Density =⋅
⋅
=−
For nickel:- Atomic weight = 58.71 g/mole- Lattice parameter = 3.5239 Å=3.5239 x 10⁻⁸ cm- Avogrado’s No. = 6.02 x 1023 = 0.602 x 1024 = atoms/mole

Close Packed (CN=12)
Highest packing density for same sized spheresFCC and HCP structures

Cube Center (CN=8)
Same atoms: BCCDifferent atoms: CsCl

Octahedral Site (CN=6)
In FCC:- Center (½,½,½)- Edges (0,0,½),(0,½,0),(½,0,0)- 4 per unit cell- All filled - NaCl structure
8-sided shape

Tetrahedral Site (CN=4)In FCC:- Divide cell into 8 boxes - center of small box- (¼,¼,¼),(¾,¼,¼),(¼,¾,¼),(¾,¾,¼)(¼,¼, ¾)(¾,¼, ¾),(¼,¾, ¾)(¾,¾, ¾)-8 per unit cell-All filled - CaF2 structure; half-filled - ZnS
4-sided shape

Radius Ratio Rules
Critical Radius for CN 8 = 0.732
Critical Radius for CN 6 = 0.414
Critical Radius for CN 4 = 0.225
CN 8
CN 6
CN 4
CN 3planar
Critical radius is size of atom which just fits in siteDefine minimum for bonding (i.e. atoms must touch to bond)

Close Packed Plane
A BA BA C
HCP: ABABABABABABABABFCC: ABCABCABCABCABCSame packing density (0.74)Same coordination (CN=12)

Miller Indices
Planes
Directions
(hkl)
{hkl}
[hkl]
<hkl>
specific
family
specific
family
A family of planes includes all planes which are equivalent by symmetry - depends on crystal system.- For cubic: (110),(011) and (101) are all {110}- For tetragonal: (011) and (101) are {101}
but (110) is not (c≠a)
- No commas- No fractions- Negative indicated by bar overnumber

Miller Indices - Directions
ba
c
1
1/4
1/2
-1/3
1/2-1
x1
y1/4
z1/2 (x 4)
[ ]214
x1/2
y-1
z-1/3 (x 6)
[ ]263

Miller Indices - Planes
41
21
ba
c
41
21
ba
c
x1/44
y∝0
z-1/2-2
( )204
interceptreciprocal

Miller Indices - Planes
31
21
ba
c
41
31
21
ba
c
41
x1/44
y-1/3-3
z-1/2-2
( )234
interceptreciprocal

Atomic Bonding
• Covalent– sharing electrons– strong– directional
• Ionic– trading of elecrons– electrostatic attraction or
ions– strong– non-directional
• Metallic– metal ions in sea or
electrons– moderately strong– non-directional
• Secondary– Van der Waals– H-bonding– electrostatic attraction of
electric dipole (local charge distribution
– weak

Radioactive Decay
• Loss of electrons/protons/neutrons– alpha - 2 protons / two neutrons (i.e He nucleus)– beta - electrons– gamma - energy
• Exponential decay
τ
−= texpNN o
( ) ( )22 2
121
21
21
ln
tln
N
Nln
texpNNN
o
ooo −=τ⇒=
−=
τ⇒==
( )
⋅−=
⋅−=21
21
69302t
t.expN
tlnt
expNN oo half life
amount
original amount
time
time constant

Material Testing
• Stress-strain relationships– engineering stress and strain– stress-strain curve
• Testing methods– tensile test– endurance test– impact test

Stress
AF=σ=Normal
AF=τ=Shear
Tension: σ>0 Compression: σ<0
F F FA A A

Strain
oo
ol
ll
ll ∆=−=ε=Strain θ==γ= tanha
strain Shear
lol lo l h
a
θ

Tensile Test
lengthwidth
thickness
Control length (l)
Measure force (F) with load cell
oo
ol
ll
ll ∆=−=ε=Strain
twF
AF
⋅==σ=Stress
Reduced section used to limit portion of sample undergoing deformation

Stress-Strain Curve
Str
ess
Strain
Ultimate Tensile Strength
Yield Point
Slope = E (Young’s Modulus)
Percent Elongation(total plastic deformation)
Elastic Limit
Proportionality Limit
Force decreases due to necking

0.2% Offset Yield Strength
Str
ess
Strain0.2% strain
0.2% offsetyield strength

True/Engineering Stress/Strain
iT A
F=σ
oE A
F=σoo
oE l
ll
ll ∆=−=ε
∫
==ε
i
o
l
l o
iT l
lln
ldl
( )1+ε=ε ET ln
( )EET ε+σ=σ 1ooii lAlA ⋅=⋅
Engineering(initial dimensions)
True(instantaneous
dimensions)
Usingand
Stress Strain

True/Engineering Stress/StrainS
tres
s
Strain
True
Engineering
True stress does not decrease
Decrease in engineering stress due to decreased load required in the reduces cross-sectional area of the neck.

Strain Hardening
Str
ess
Strain
Onset of plastic deformation after
reloading
Plastic deformation require larger load after defomation.Sample dimensions are decreased, so stress is even higher

Bending Test
Four-point Three-point
LL/2
h
w
By summing moment in cantilever beam
22
3
wh
FLmax =σ
FF/2F/2
Tension at bottom, compression at top

Hardness
• Resistance to plastic deformation• Related to yield strength• Most common indentation test
– make indentation– measure size or depth of indentation– macro- and micro- tests
• Scales: Rockwell, Brinell, Vickers, Knoop

Impact
hi
hf
Fracture energy = mghi -mghf
Charpy V-notch
Toughness: combination of strength and ductility -energy for fracture
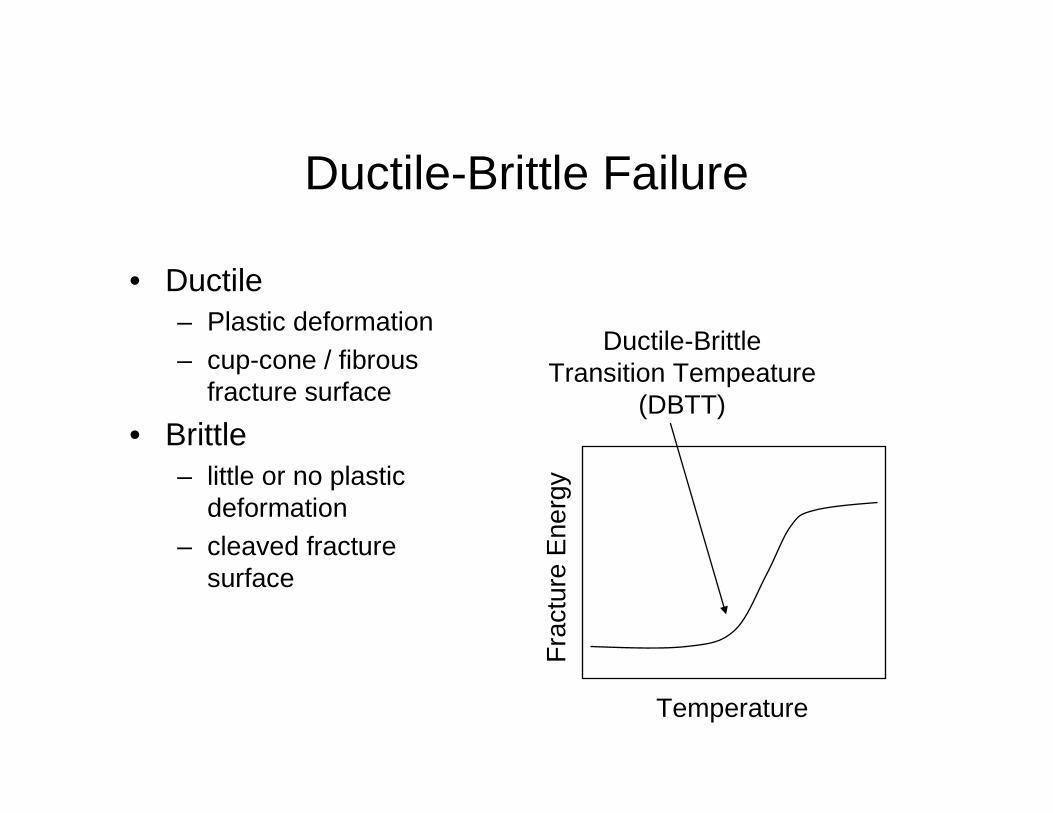
Ductile-Brittle Failure
• Ductile– Plastic deformation– cup-cone / fibrous
fracture surface
• Brittle– little or no plastic
deformation– cleaved fracture
surface
Temperature
Fra
ctur
e E
nerg
y
Ductile-Brittle Transition Tempeature
(DBTT)

Creep / Stress Relaxation
• Load below yield strength - elastic deformation only• Over long time plastic deformation occurs• Requires diffusion, so usually a high-temperature
process• Activation energy, Q (or EA)
−⋅=
−⋅=ε=kTE
expART
QexpA A&ratecreep

Creep /Stress Relaxation
Creep
FF
FF
time
fixed strain
Stress Relaxation
fixed load
time
Permanent deformation

Fatigue
Number of Cycles to Failure
Str
ess
Fatigue Limit(ferrous metals)
Repeated application of load - number of cycles, rather than time important.
σmax
σmin
σave ∆σ
σmax
σmin
0
0

Metallurgy
• Corrosion• Diffusion• Phase Diagrams
– lever rule– Fe-Fe3C diagram– Gibb’s phase rule
• Thermal processing

Corrosion Resistance
• Thermodynamics vs. Kinetics– Thermodynamics - stable phases– Kinetic - rate to form stable phases
• Active vs. Passive– Active: reaction products ions or gas - non protective– Passive: reaction products - protective layer
• Corrosion resistance– Inert (noble): gold, platinum– Passivation: aluminum oxide (alumina) on aluminum,
chromia on stainless steel

Electrode Potential
• Tendency of metal to give up electron• Oxidation (anode)
– M = M2+ + 2e- (loss electrons)
• Reduction (cathode)– M2+ + 2e- = M (gain electrons)
• LEO (loss electrons oxidation) goes GER (gain electrons reduction)

Corrosion Reactions• Oxidation - metal (anode)
– M = M2+ + 2e-
• Reduction - in solution (cathode)– 2H+ + 2e- = H2
– 2H+ + ½O2 + 2e- = H2O– H2O + ½O2 + 2e- = 2OH-
• Overall Reactions– M + 2H+ =M2+ + H2
– M + 2H+ + ½O2 = M2+ + H2O– M + H2O + ½O2 = M2+ + 2OH- = M(OH)2

Galvanic Corrosion / Protection
• At joint between dissimiliar metals– reaction rate of active metal increases– reaction of less active metal decreases
• Galvanic corrosion– high corrosion rate at galvanic couple
• presence of Cu increase the local corrosion rate of Fe
• Galvanic protection– Galvanized steel
• presence of Zn decreases the local corrosion rate of Fe
– Galvanic protection• Mg or Zn connected to Fe decrease corrosion rate

Waterline Corrosion
• Oxygen concentration in water leads to variation in local corrosion rates
Higher corrosion rate near oxygen access
Rings of rust left from water drops
Rust just below water surface

Diffusion
• Atoms moving within solid state• Required defects (e.g. vacancies)• Diffusion thermally activated• Diffusion constant follows Ahrrenius relationship
−=
−=kTE
expDRT
QexpDD A
oo
Gas constant
Boltzman’sconstant Temperature
Activation Energy

Steady-State Diffusion
• Fick’s first law (1-D)• J = flux (amount/area/time)• For steady state
∂∂−=
xC
DJ
∆∆−=
xC
DJ
∆C
∆x
sm
massm
m
mass
sm
J2
32=
−=

Phase Equilibria
• Gibb’s Phase Rule• P + F = C + 2 (Police Force = Cops + 2)
– P = number of phases– F = degrees of freedom– C = number of components (undivided units)– 2: Temperature and Pressure
• One-component system– F = 1 + 2 - P = 3 - P
• Two-component system– F = 2 + 2 - P = 4 - P
• Two-component system at constant pressure– F = 2 + 1 - P = 3 - P
“2” becomes “1” at constant pressure

Pressure-Temperature Diagram
water
ice
watervapor
Temperature
Pre
ssur
e
Single-phase area: can change T and P indepenently
(F=2)
Two-phase line: Change T (P) require specific change in P (T)
(F=1)
Three-phase point: One occurs at specific T and P (triple point)
(F=0)
One component: H2OIf formation of H2 and O2 were considered there would be two
components (H and O)

Phase Diagrams
L
δ
α
γ
β (pure B, neglibible
solubility of A)
α + γ
γ + β
δ + γ
α + β
γ + L β + L
δ + L
Composition (%B)
Tem
pera
ture
Two-component @ constant pressureThree-phase - horizontal line
EutecticL → 2 solids (γ + β)
PeritecticL +solid (δ) → solid (γ)
Eutectoidsolid (γ) → 2 solids (α + β)
BA

Lever Law• Phase diagram give compositions of phases
– two-phase boundaries in 2-phase mixture
• Mass balance generate lever law
L
S
Composition (%B)A B
Tem
pera
ture
LiquidComp.
(XL)
SolidComp.
(XS)
AlloyComp.(Xalloy)
SL
alloyL
XX
XXsolid%
−−
=
SL
Salloy
XX
XXliquid%
−−
=
Opposite arm over total length
Right arm for solid
Left arm for liquid

70 wt% Pb -30 wt% Sn
256°C
12.8 wt% Sn
First solid
( ) %)Pb(Sn%..)liq(Sn%.)Pb(Sn%.)alloy(Sn%
Sn%..liq% 3031886131830
861 =−−=
At 183.1°C
( ) %)Pb(Sn%..)eut(Sn%.)alloy(Sn%.)eut(Sn%.
Sn%.Pb.prim% 70318861
30861318 =
−−=

70 wt% Pb -30 wt% Sn
256°C
12.8 wt% Sn
First solid
( ) %)Pb(Sn%..)liq(Sn%.)Pb(Sn%.)alloy(Sn%
Sn%.% 1531889731830
897 =−−=β
At 182.9°C
( ) %)Pb(Sn%..)liq(Sn%.)alloy(Sn%.)liq(Sn%.
Sn%.phasePb% 85318897
30897318 =
−−=−

Microconstituents
( ) %)Pb(Sn%..)liq(Sn%.)Pb(Sn%.)alloy(Sn%
Sn%.L% 3031886131830
861 =−−=
( ) %)Pb(Sn%..)eut(Sn%.)alloy(Sn%.)eut(Sn%.
Sn%.Pb.% 70318861
30861318Prim =
−−=
( ) %)Pb(Sn%..)liq(Sn%.)Pb(Sn%..)eut(Sn%.
Sn%.% .eutin 55318897318861
897 =−−=β
( ) %)Pb(Sn%..)liq(Sn%..)eut(Sn%..)liq(Sn%.
Sn%.Pb% .eutin 45318897861897
318 =−−=
Eutectic Microsconstituent ((Pb)+βSn)
Primary Pb
Phases in Eutectic Microsconstituent

Fe-Fe3C Phase Diagram
Austenite
Ferrite
Cementite
Pearlite (ferrite + cementite)%C = 0.77%
HypereutectoidHypoeutectoid
Cast Irons
Steels

Time-Temperature-Transformation (TTT) Diagram
fs
ps
bs
ms
mf
pf
bf
727°C
800°C
200°C
100°C
KeyMain symbolf = ferritep = pearliteb = bainitec = cementite
(Fe3C)Subscriptss = startf = finish
Tem
per
atu
re
Log Time
Decomposition of Austenite at fixed temperature
Martensiteathermal (diffusionless)
Pearlite: High Tempslow nucleation
Bainite: Diffusion slow
for pearlite
Coarse pearlite
Fine pearlite

Quench / Hardenability / Tempering
• Quench - rapidly cool– in steel: cool fast enough to Ms to prevent pearlite / bainite
formation
• Hardenability– ease of forming martensite in steels– alloying elements inhibit pearlite / bainite formation, promote
martensite formation
• Tempering of steels– reheating martensite to form transition carbides– improve toughness

Cold Working• Plastic deformation creates dislocations, which
increases strength / decreases ductility• Reduction in Area used to quantify degree of cold
working%
AAfA
RA%CW%i
i 100⋅−==
%lw
lwlwRA%
ii
ffii 100⋅⋅
⋅−⋅=
%l
llRA%
i
fi 100⋅−=
if wwfor ≅
%d
dd%
d
dd
RA%
i
fi
i
fi
100100
4
442
22
2
22
⋅−
=⋅⋅π
⋅π−
⋅π
=

Cold Worked Properties
0
100
200
300
400
500
600
0 10 20 30 40 50 60 70 80
Percent Cold Work
Str
ess
(MP
a)
0
2
4
6
8
10
12
14
16
Percen
t Elo
ng
ation
Yield StrengthTensile StrengthPercent Elongation

Balancing Strength / Ductility
0
100
200
300
400
500
600
0 10 20 30 40 50 60 70 80
Percent Cold Work
Str
ess
(MP
a)
0
5
10
15
20
25
30
35
Percen
t Elo
ng
ation
Yield Strength
Tensile Strength
Percent Elongation
Sy > 310 MParequires
%CW > 22%Elongation > 10%
requires%CW < 31%
Both Propertiesrequires
22% < %CW < 31%

Balancing Strength / Toughness
100
150
200
250
300
350
400
450
500
550
600
0 10 20 30 40 50 60 70Percent Cold Work
Str
ess
(MP
a)
0
5
10
15
20
25
30
35
40
45
50Yield Strength
Tensile Strength
Fracture Toughness Fractu
re To
ug
hn
ess (KIc ) (M
Pa m
0.5)
σy = 250 MPa13% CW
KIc = 16 MPa m0.5
39% CW
31% CWSy = 364 MPa
KIc = 22 MPa m0.5
Sy > 250 MPaand
Kic > 16 Mpa m½
requires13% < %CW < 39%
Examplefor 31% CW
Sy = 364 MPaKic = 22 Mpa m½

Cold Work / Anneal / Hot Work• Annealing can eliminate effect of cold work
– recovery - stress relief, little change in properties– recrystallization - elimination of dislocations, decrease in
strength, increase in ductility– grain growth - increase in grain size, decreases both
strength and ductility
• Hot working– deforming at high enough temperature for immediate
recrystallization– list cold-working and annealing at the same time– no increase in strength– used for large deformation– poor surface finish - oxidation– After hot working, cold working used to increase strength
and improve surface finish

![[CANCER RESEARCH 64, 3395–3405, May 15, 2004] … file[CANCER RESEARCH 64, 3395–3405, May 15, 2004] Expression Profiling of t(12;22) Positive Clear Cell Sarcoma of Soft Tissue](https://static.fdocuments.in/doc/165x107/5c9cb06488c99392348b75c5/cancer-research-64-33953405-may-15-2004-cancer-research-64-33953405.jpg)


![[Free Scores.com] Chopin Frederic Waltzes Op 34 Valse Brillante 3405](https://static.fdocuments.in/doc/165x107/563dbab4550346aa9aa75f63/free-scorescom-chopin-frederic-waltzes-op-34-valse-brillante-3405.jpg)
![ZPJ -LZ[P]HS ;OL >VYSK of Christian Music Comes to Wilmore](https://static.fdocuments.in/doc/165x107/6186f70ef102f36a901e88a7/zpj-lzphs-ol-gtvysk-of-christian-music-comes-to-wilmore.jpg)


