Fayette County USA Expansion Opinion Survey
26
Fayette County USA Expansion Opinion Survey Prepared for Cornett-IMS/Fayette Alliance The Matrix Group, Inc August 2006
-
Upload
adrian-hogan -
Category
Documents
-
view
36 -
download
0
description
Fayette County USA Expansion Opinion Survey. Prepared for Cornett-IMS/Fayette Alliance The Matrix Group, Inc August 2006. Overview & Methodology. Purpose of the Research. - PowerPoint PPT Presentation
Transcript of Fayette County USA Expansion Opinion Survey

Fayette County USA Expansion Opinion
Survey
Prepared for Cornett-IMS/Fayette AllianceThe Matrix Group, Inc
August 2006

Overview & Methodology

This research was initiated by Cornett-IMS and Fayette Alliance to gauge Fayette County voter opinion regarding priorities for Lexington/Fayette County elected officials, with specific focus on the issue of Urban Service Area expansion.
Purpose of the Research

The data was collected in a telephone survey of 200 registered voters residing in Fayette County, conducted between July 14, 2006 and July 25, 2006.
Respondents were stratified by age, gender and area of residence based on actual population percentages.1
Those who indicated they were employed in real estate development or construction, advertising, public relations or market research, as well as those who hold an elected office, were excluded from participation in the survey.
Based on a total number of 163,870 registered voters in Lexington/Fayette County2, the sample of 200 provides research results at the standard 95% confidence level with a margin of error of plus or minus 6.93%.
1 Source: Commonwealth of Kentucky State Board of Elections voter registration statistics report (June 15, 2006). 2 Source: Commonwealth of Kentucky State Board of Elections
Data Collection

Respondents were categorized according to area of residence within Fayette County (determined by zip code), gender, age, length of residency and education.
Respondent Categorization
Female58.5%
Male41.5%
Gender
Age Group
0.5%
21.5%
20.5%
23.5%
19.5%
14.5%
0% 10% 20% 30%
Refused
65+
55-64
45-54
35-44
Under 35

Area of Residence in Lexington/Fayette CountyArea of Residence % #
South Suburban/Rural 28.5% 57 40517 13.0% 26 40515 11.0% 22 40514 4.5% 9
South Central 24.0% 48 40502 14.0% 28 40503 10.0% 20
East 19.5% 39 40505 10.0% 20 40509 9.5% 19
North/West 14.0% 28 40504 9.0% 18 40511 5.0% 10
Downtown 8.0% 16 40508 7.5% 15 40507 0.5% 1
Rural 6.0% 12 40513 3.5% 7 40510 1.5% 3 40516 1.0% 2
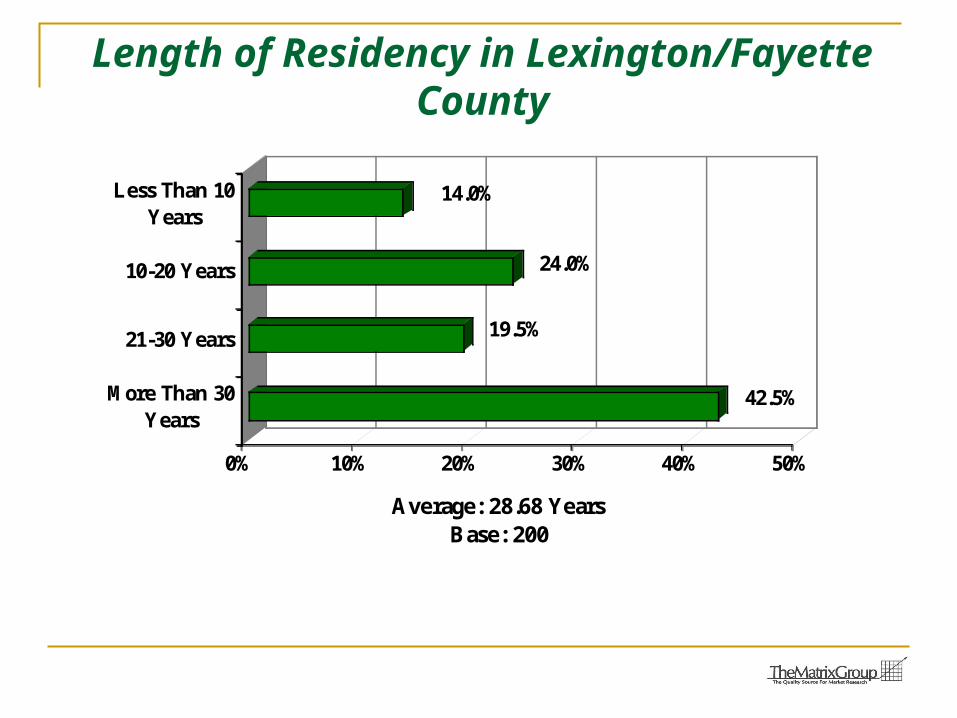
Length of Residency in Lexington/Fayette County
42.5%
19.5%
24.0%
14.0%
0% 10% 20% 30% 40% 50%
More Than 30Years
21-30 Years
10-20 Years
Less Than 10Years
Average: 28.68 YearsBase: 200

Education
2.0%
15.5%
18.5%
35.5%
28.0%
0.5%
0%
10%
20%
30%
40%
Less thanhigh school
High schoolgraduate
Somecollege ortechnical
school
Collegegraduate
Graduateschool
Refused

Summary of the Research Findings

Greatest Concern About Community
As a resident of Lexington, what would you say is the single greatest concern you have about your community?
% # Managing growth/ Overdevelopment 21.0% 42 Traffic problems/issues 18.0% 36 Crime/Safety 18.0% 36 The water company takeover issue 6.5% 13 Poor roads/streets 5.5% 11 Political leaders/leadership/decisions 5.5% 11 Reduction of greenspace/farmland 4.5% 9 Quality/poor quality of the education system 4.0% 8 Lack of jobs/employment opportunities 3.5% 7 Illegal immigrants/immigration 3.0% 6 High taxes 2.5% 5 Having adequate public transportation 1.5% 3 Need more entertainment options 1.5% 3 Overpopulation 1.0% 2 Healthcare/Healthcare issues 1.0% 2 Water supply/shortage 1.0% 2 None 1.5% 3 Other 3.5% 7 Don't know 6.5% 13
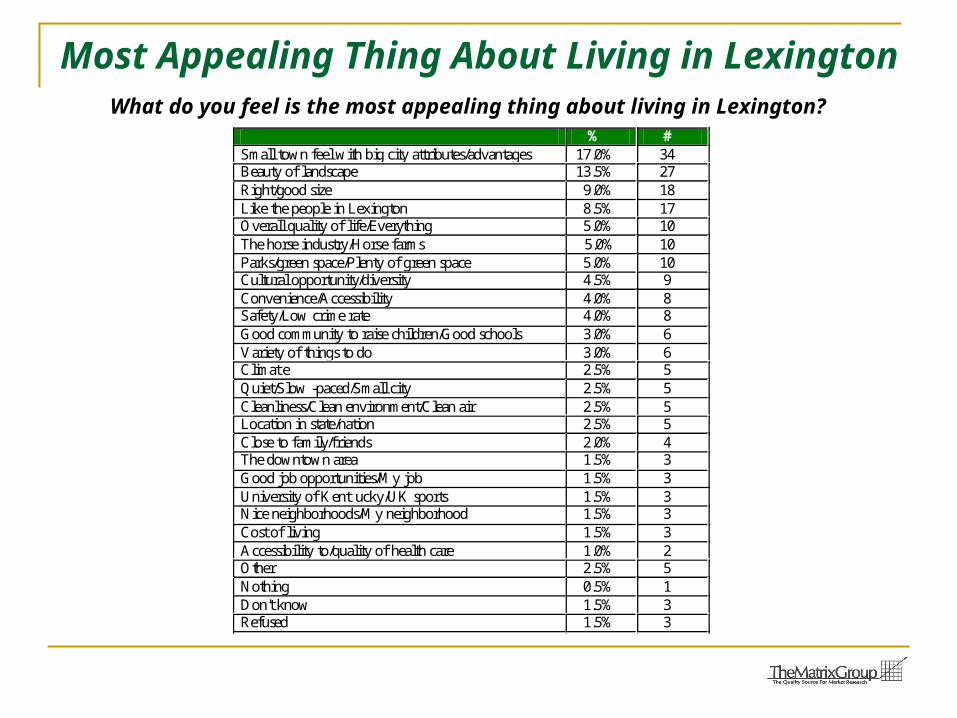
Most Appealing Thing About Living in LexingtonWhat do you feel is the most appealing thing about living in Lexington?
% # Small town feel with big city attributes/advantages 17.0% 34 Beauty of landscape 13.5% 27 Right/good size 9.0% 18 Like the people in Lexington 8.5% 17 Overall quality of life/Everything 5.0% 10 The horse industry/Horse farms 5.0% 10 Parks/green space/Plenty of green space 5.0% 10 Cultural opportunity/diversity 4.5% 9 Convenience/Accessibility 4.0% 8 Safety/Low crime rate 4.0% 8 Good community to raise children/Good schools 3.0% 6 Variety of things to do 3.0% 6 Climat e 2.5% 5 Quiet/Slow -paced/Small city 2.5% 5 Cleanliness/Clean environment/Clean air 2.5% 5 Location in state/nation 2.5% 5 Close to family/friends 2.0% 4 The downtown area 1.5% 3 Good job opportunities/My job 1.5% 3 University of Kent ucky/UK sports 1.5% 3 Nice neighborhoods/My neighborhood 1.5% 3 Cost of living 1.5% 3 Accessibility to/quality of health care 1.0% 2 Other 2.5% 5 Nothing 0.5% 1 Don't know 1.5% 3 Refused 1.5% 3
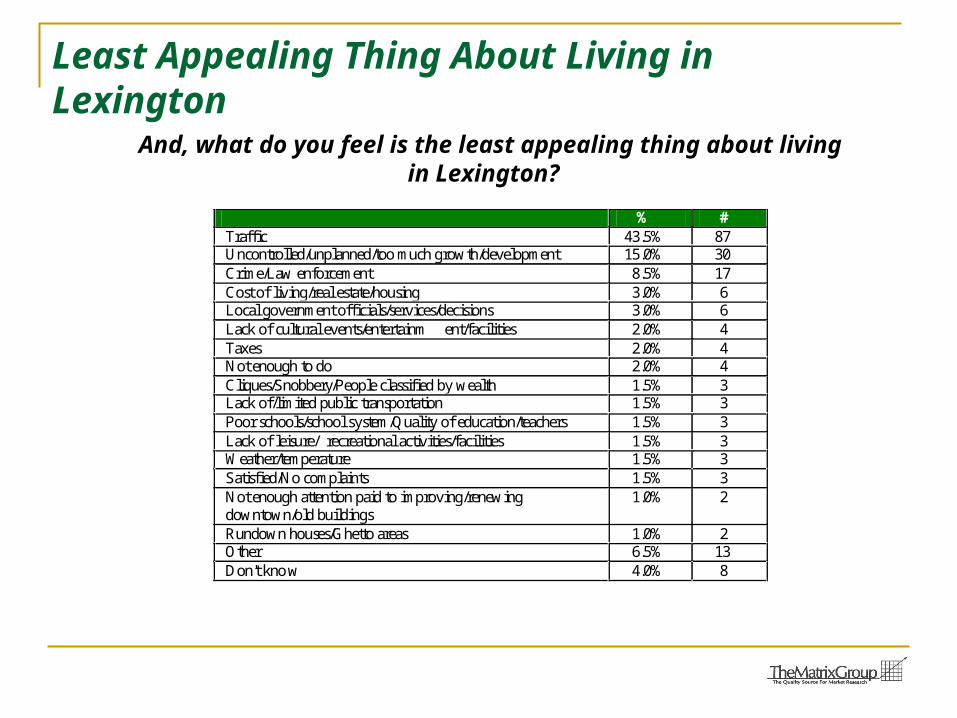
Least Appealing Thing About Living in Lexington
And, what do you feel is the least appealing thing about living in Lexington?
% # Traffic 43.5% 87 Uncontrolled/unplanned/too much growth/development 15.0% 30 Crime/Law enforcement 8.5% 17 Cost of living/real estate/housing 3.0% 6 Local government officials/services/decisions 3.0% 6 Lack of cultural events/entertainm ent/facilities 2.0% 4 Taxes 2.0% 4 Not enough to do 2.0% 4 Cliques/Snobbery/People classified by wealth 1.5% 3 Lack of/limited public transportation 1.5% 3 Poor schools/school system/Quality of education/teachers 1.5% 3 Lack of leisure/ recreational activities/facilities 1.5% 3 Weather/temperature 1.5% 3 Satisfied/No complaints 1.5% 3 Not enough attention paid to improving/renewing downtown/old buildings
1.0% 2
Rundown houses/Ghetto areas 1.0% 2 Other 6.5% 13 Don't kno w 4.0% 8

Performance Ratings: Infrastructure, Growth & Development and Preservation
On a scale of 10 to 1 with 10 being Excellent and 1 being Poor, please rate how well you think Lexington is doing the following areas:
(Excellent=10; Poor=1)
Issue Average Providing citizens with basic infrastructure such as sewers, roads and other public services
6.78 Base: 200
Preserving the unique characteristics of the Bluegrass area
5.46 Base: 196
Long range planning for growth and redevelopment of urba n areas
5.23 Base: 192
Long range planning for growth and expansion into rural areas
4.67 Base: 184

Performance Ratings: Infrastructure, Growth & Development and Preservation
Providing citizens with basic infrastructure such as sewers, roads and other public services
1.0%
5.0%
4.5%
14.0%
11.5%
26.0%
24.5%
9.5%
4.0%
0% 10% 20% 30%
Excellent
9
8
7
6
5
4
3
2
Average: 6.78Base: 200

Performance Ratings: Infrastructure, Growth & Development and Preservation
Preserving the unique characteristics of the Bluegrass area
2.0%
7.0%
6.5%
9.5%
8.5%
20.0%
11.0%
12.0%
14.5%3.0%
6.0%
0% 10% 20% 30%
Excellent
9
8
7
6
5
4
3
2
Poor
Don't Know
Average: 5.46B ase : 196

Performance Ratings: Infrastructure, Growth & Development and Preservation
Long range planning for growth and redevelopment of urban areas
4.0%
5.5%
7.5%
10.5%9.5%
22.5%
13.0%
9.0%
11.0%
4.5%3.0%
0% 10% 20% 30%
Excellent
9
8
7
6
5
4
3
2
Poor
Don't Know
Average: 5.23Base: 192

Performance Ratings: Infrastructure, Growth & Development and Preservation
Long range planning for growth and expansion into rural areas
8.0%
10.0%
8.5%11.5%
9.5%
22.0%
10.5%
9.0%
7.0%
2.0%
2.0%
0% 10% 20% 30%
Excellent
9
8
7
6
5
4
3
2
Poor
Don't Know
Average: 4.67Base: 184
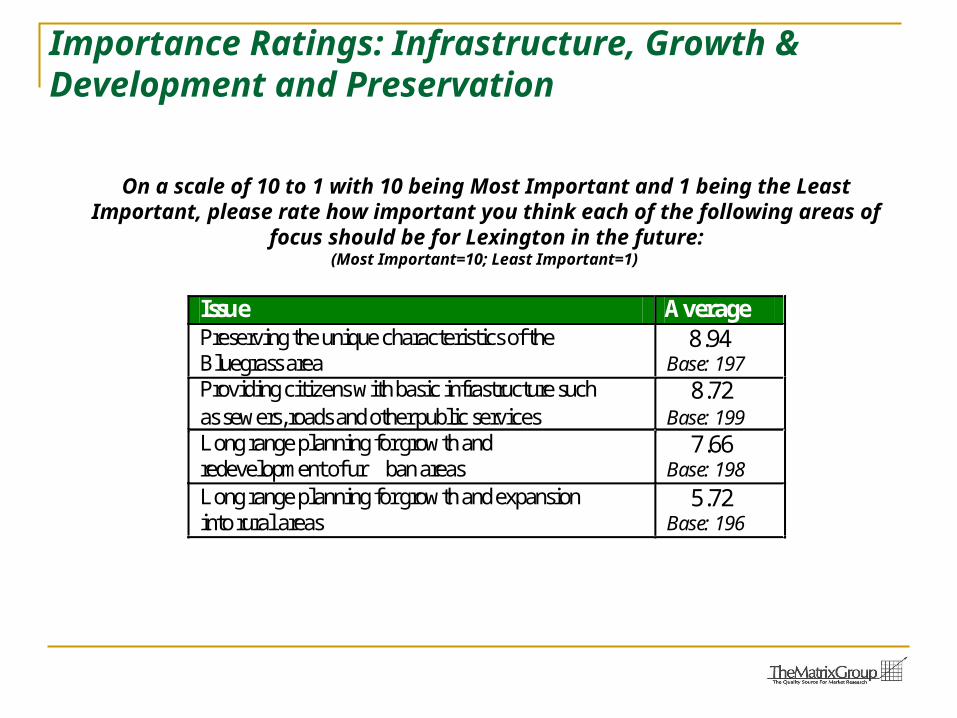
Importance Ratings: Infrastructure, Growth & Development and Preservation
On a scale of 10 to 1 with 10 being Most Important and 1 being the Least Important, please rate how important you think each of the following areas of
focus should be for Lexington in the future:(Most Important=10; Least Important=1)
Issue Average Preserving the unique characteristics of the Bluegrass area
8.94 Base: 197
Providing citizens with basic infrastructure such as sewers, roads and other public services
8.72 Base: 199
Long range planning for growth and redevelopment of ur ban areas
7.66 Base: 198
Long range planning for growth and expansion into rural areas
5.72 Base: 196

Importance Ratings: Infrastructure, Growth & Development and Preservation
Preserving the unique characteristics of the Bluegrass area
1.5%1.0%
0.5%
1.0%
4.0%
1.5%
8.0%
10.5%
16.0%
56.0%
0% 10% 20% 30% 40% 50% 60%
Most Important
9
8
7
6
5
4
3
2
Don't Know
Ave rage : 8.94B ase : 197

Importance Ratings: Infrastructure, Growth & Development and Preservation
Providing citizens with basic infrastructure such as sewers, roads and other public services
0.5%
0.5%
0.5%
2.0%
3.5%
6.5%
30.5%
15.5%
40.5%
0% 10% 20% 30% 40% 50%
Most Important
9
8
7
6
5
4
Least Important
Don't Know
Average: 8.72B ase : 199

Importance Ratings: Infrastructure, Growth & Development and Preservation
Long range planning for growth and redevelopment of urban areas
1.0%
3.0%
1.5%
1.0%
4.0%
7.0%
7.5%12.5%
23.0%13.5%
26.0%
0% 10% 20% 30%
Most Important
9
8
7
6
5
4
3
2
Least Important
Don't Know
Ave rage : 7.66B ase : 198

Importance Ratings: Infrastructure, Growth & Development and Preservation
Long range planning for growth and expansion into rural areas
2.0%11.0%
8.0%
6.5%11.0%
12.0%
7.5%7.5%
13.0%6.5%
15.0%
0% 10% 20%
Most Important
9
8
7
6
5
4
3
2
Least Important
Don't Know
Ave rage : 5.72B ase : 196

Comparison of Importance Ratings vs. Performance Ratings
8.94 8.72
7.66
5.72
5.46
6.78
5.234.67
1
2
3
4
5
6
7
8
9
10
Preserving uniquecharacteristics of the
Bluegrass
Providing basicinfrastructure
Planning for growthand redevelopment
of urban areas
Planning for growthand expansion into
rural areas
Importance
Performance

More Land Needed Outside Current Urban
Service Area Do you feel that more land is needed for new housing, business and
industrial development outside the current Urban Service Area?
No74.0%
Yes19.0%
Don't Know7.0%

Would you be more likely or less likely to vote for a candidate who favors expansion of the Urban Service Area?
Likelihood of Voting For Candidate Who Favors Expansion of Urban Service Area
Less Likely71.0%
More Likely14.5%
No Difference
14.5%

Less Likely13.0%
More Likely73.0%
No Difference
14.0%
Would you be more likely or less likely to vote for a candidate who favors keeping the Urban Service Area as it exists today?
Likelihood of Voting For Candidate Who Favors Keeping Existing Urban Service Area