FAO Growth in 2010: Key Opportunities and Challenges
26
Today’s webinar is brought to you by Outsourcing Center Today’s webinar FAO Growth in 2010: Key Opportunities and Challenges Outsourcing Center Synopsis: Everest experts, Katrina Menzigian and Saurabh Gupta, will discuss the status of the FAO market and what buyers and suppliers must do to develop a strategic plan for 2010, including contract, supplier, and market evaluations. About Outsourcing Center Outsourcing Center is the world’s most prominent internet portal for authoritative information on outsourcing. The Center’s mission is to build the industry by helping people understand how to create value through outsourcing We serve the outsourcing community through: outsourcing. We serve the outsourcing community through: Trusted and objective third-party perspective Database of over 81,000 opt-in subscribers Relevant media including editorials, research, whitepapers, and the annual Outsourcing Excellence Awards Proprietary & Confidential. © 2010 Outsourcing Center 1 For more information, contact Peter Bowes at [email protected]
-
date post
20-Oct-2014 -
Category
Business
-
view
800 -
download
2
description
Everest Group experts, Katrina Menzigian and Saurabh Gupta, will discuss the status of the FAO market and what buyers and suppliers must do to develop a strategic plan for 2010, including contract, supplier, and market evaluations.
Transcript of FAO Growth in 2010: Key Opportunities and Challenges
Today’s webinar is brought to you by Outsourcing Center
Today’s webinar
FAO Growth in 2010: Key Opportunities and Challenges
Outsourcing Center
Synopsis:Everest experts, Katrina Menzigian and Saurabh Gupta, will discuss the status of the FAO market and what buyers and suppliers must do to develop a strategic plan for 2010, including contract, supplier, and market evaluations.
About Outsourcing Center
Outsourcing Center is the world’s most prominent internet portal for authoritative information on outsourcing. The Center’s mission is to build the industry by helping people understand how to create value through outsourcing We serve the outsourcing community through:outsourcing. We serve the outsourcing community through:
Trusted and objective third-party perspectiveDatabase of over 81,000 opt-in subscribersRelevant media including editorials, research, whitepapers, and the annual Outsourcing Excellence Awards
Proprietary & Confidential. © 2010 Outsourcing Center1
For more information, contact Peter Bowes at [email protected]
Q&A
To ask a question during the Q&A session
Click the question mark (Q&A) button located on the floating tool bar in the bottom right
Q&A
q ( ) g gof your screen. This will open the Q&A Panel
Be sure to keep the default set to “send to a Panelist”
Then, type your question in the rectangular field at the bottom of the Q&A box and click the send button to submit
Proprietary & Confidential. © 2010 Outsourcing Center2
IntroductionIntroduction
Katrina MenzigianVP-Research
Everest Group
Saurabh GuptaResearch Director
Everest [email protected]
Proprietary & Confidential. © 2010 Outsourcing Center3
FAO Growth in 2010: Key Opportunities and Challenges
April 6, 2010

Agenda
FAO definition and research methodology
Market size, growth, and buyer adoption
Evolution of contract characteristics
Supplier landscape
Outlook for 2010
Copyright © 2010, Everest Global, Inc. 5
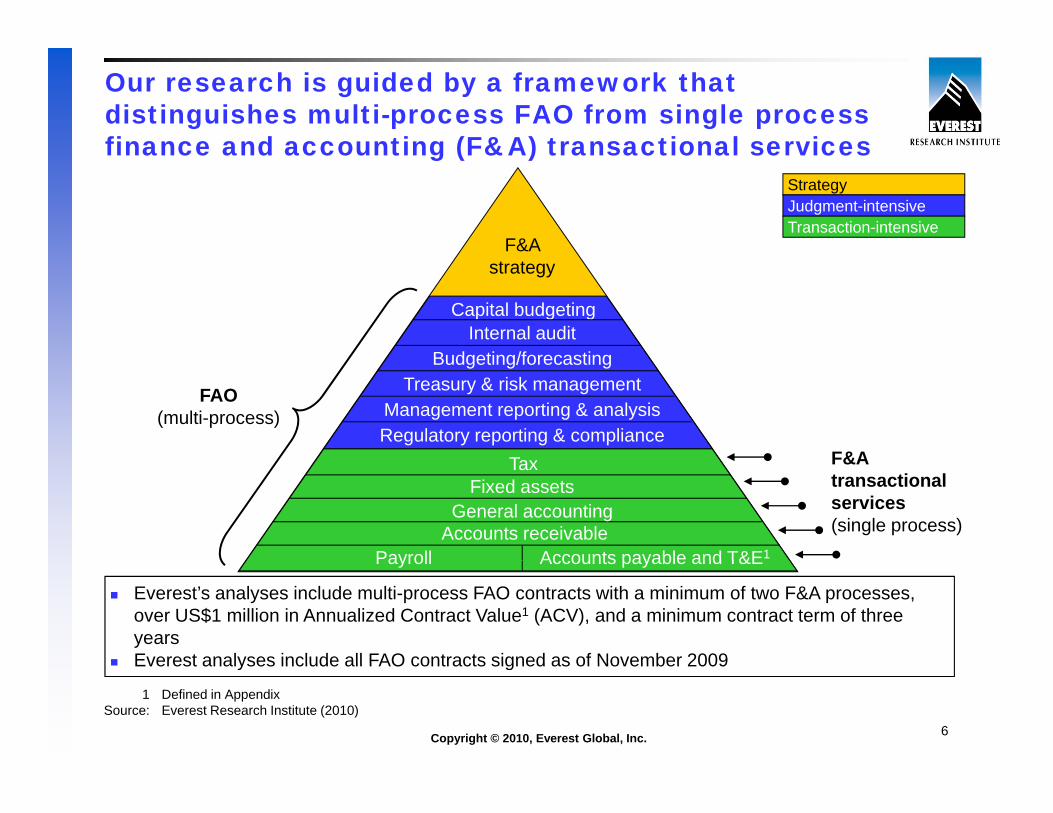
Our research is guided by a framework that distinguishes multi-process FAO from single process finance and accounting (F&A) transactional servicesfinance and accounting (F&A) transactional services
StrategyJudgment-intensiveTransaction-intensive
F&A strategy
Internal auditBudgeting/forecasting
Capital budgeting
FAO(multi-process)
F&A
Budgeting/forecastingTreasury & risk management
TRegulatory reporting & complianceManagement reporting & analysis
F&A transactional services(single process)Accounts receivable
TaxFixed assets
Payroll Accounts payable and T&E1
General accounting
Payroll Accounts payable and T&E
Everest’s analyses include multi-process FAO contracts with a minimum of two F&A processes, over US$1 million in Annualized Contract Value1 (ACV), and a minimum contract term of three yearsEverest analyses include all FAO contracts signed as of November 2009
Copyright © 2010, Everest Global, Inc. 6
Everest analyses include all FAO contracts signed as of November 2009
1 Defined in AppendixSource: Everest Research Institute (2010)
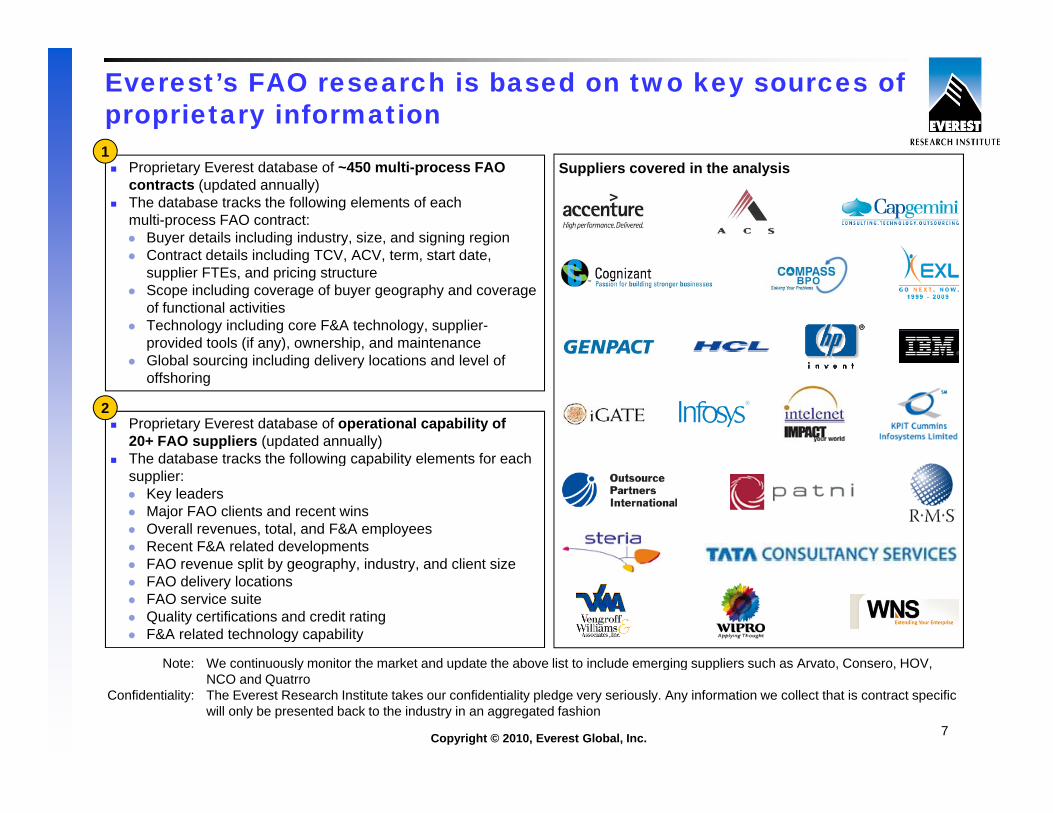
Everest’s FAO research is based on two key sources of proprietary information1
Proprietary Everest database of ~450 multi-process FAO contracts (updated annually)The database tracks the following elements of each multi-process FAO contract:
Buyer details including industry, size, and signing regionContract details including TCV ACV term start date
1Suppliers covered in the analysis
Contract details including TCV, ACV, term, start date, supplier FTEs, and pricing structureScope including coverage of buyer geography and coverage of functional activitiesTechnology including core F&A technology, supplier-provided tools (if any), ownership, and maintenanceGl b l i i l di d li l ti d l l fGlobal sourcing including delivery locations and level of offshoring
Proprietary Everest database of operational capability of 20+ FAO suppliers (updated annually)The database tracks the following capability elements for each
2
The database tracks the following capability elements for each supplier:
Key leadersMajor FAO clients and recent wins Overall revenues, total, and F&A employeesRecent F&A related developmentsFAO lit b h i d t d li t iFAO revenue split by geography, industry, and client sizeFAO delivery locationsFAO service suiteQuality certifications and credit rating F&A related technology capability
Note: We continuously monitor the market and update the above list to include emerging suppliers such as Arvato Consero HOV
Copyright © 2010, Everest Global, Inc. 7
Note: We continuously monitor the market and update the above list to include emerging suppliers such as Arvato, Consero, HOV, NCO and Quatrro
Confidentiality: The Everest Research Institute takes our confidentiality pledge very seriously. Any information we collect that is contract specific will only be presented back to the industry in an aggregated fashion

Agenda
FAO definition and research methodology
Market size, growth, and buyer adoption
Evolution of contract characteristics
Supplier landscape
Outlook for 2010
Copyright © 2010, Everest Global, Inc. 8
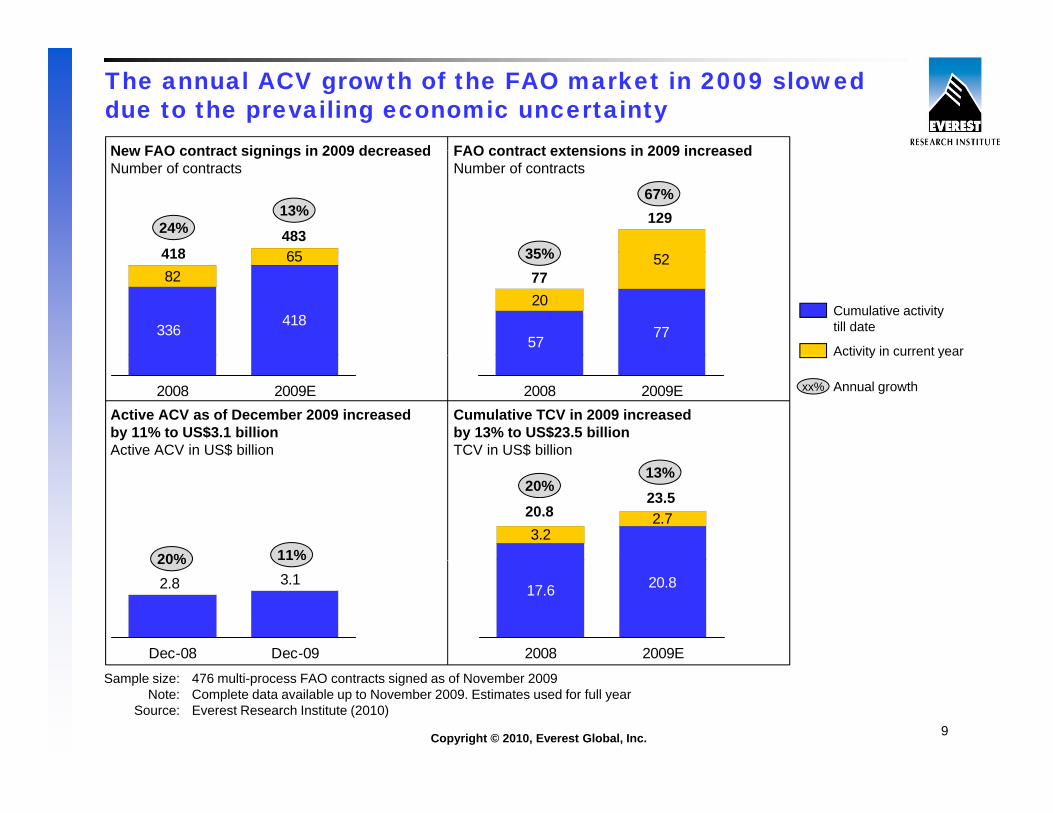
The annual ACV growth of the FAO market in 2009 slowed due to the prevailing economic uncertaintyNew FAO contract signings in 2009 decreased FAO contract extensions in 2009 increased
65
24%
New FAO contract signings in 2009 decreasedNumber of contracts
418483
13% 129
35%
67%
FAO contract extensions in 2009 increasedNumber of contracts
418
8265
336
418
77
20
52
57
7735%
Activity in current year
Cumulative activity till date
2008 2009EActive ACV as of December 2009 increased by 11% to US$3.1 billionActive ACV in US$ billion
2008 2009ECumulative TCV in 2009 increased by 13% to US$23.5 billion TCV in US$ billion
Activity in current year
xx% Annual growth
3.22.720.8
23.520%
13%
20% 11%3.12.8
Dec-08 Dec-09
17.6 20.8
2008 2009E
20%
Copyright © 2010, Everest Global, Inc. 9
Sample size: 476 multi-process FAO contracts signed as of November 2009Note: Complete data available up to November 2009. Estimates used for full year
Source: Everest Research Institute (2010)
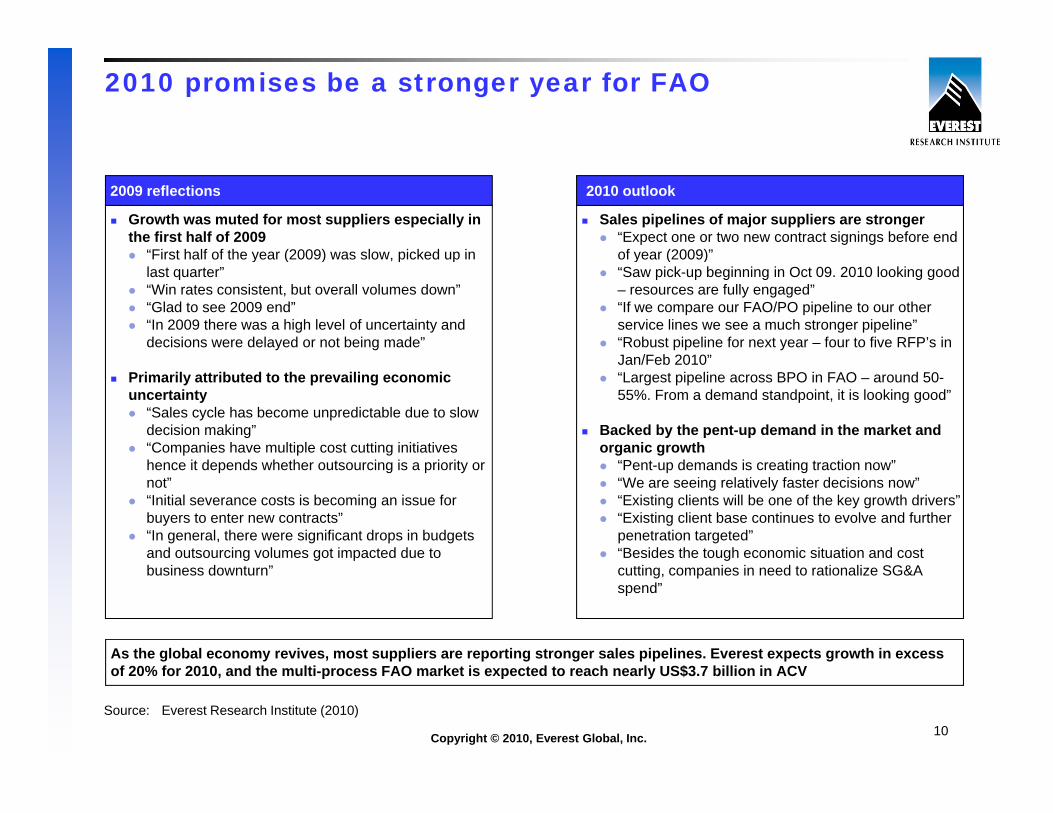
2010 promises be a stronger year for FAO
Growth was muted for most suppliers especially in the first half of 2009
“First half of the year (2009) was slow picked up in
2009 reflections
Sales pipelines of major suppliers are stronger“Expect one or two new contract signings before end of year (2009)”
2010 outlook
First half of the year (2009) was slow, picked up in last quarter”“Win rates consistent, but overall volumes down”“Glad to see 2009 end”“In 2009 there was a high level of uncertainty and decisions were delayed or not being made”
of year (2009)“Saw pick-up beginning in Oct 09. 2010 looking good – resources are fully engaged”“If we compare our FAO/PO pipeline to our other service lines we see a much stronger pipeline” “Robust pipeline for next year – four to five RFP’s in J /F b 2010”
Primarily attributed to the prevailing economic uncertainty
“Sales cycle has become unpredictable due to slow decision making”“Companies have multiple cost cutting initiatives
Jan/Feb 2010”“Largest pipeline across BPO in FAO – around 50-55%. From a demand standpoint, it is looking good”
Backed by the pent-up demand in the market and organic growth
hence it depends whether outsourcing is a priority or not”“Initial severance costs is becoming an issue for buyers to enter new contracts”“In general, there were significant drops in budgets and outsourcing volumes got impacted due to
“Pent-up demands is creating traction now”“We are seeing relatively faster decisions now”“Existing clients will be one of the key growth drivers”“Existing client base continues to evolve and further penetration targeted”“Besides the tough economic situation and cost
As the global economy revives, most suppliers are reporting stronger sales pipelines. Everest expects growth in excess
g g pbusiness downturn”
gcutting, companies in need to rationalize SG&A spend”
Copyright © 2010, Everest Global, Inc. 10
of 20% for 2010, and the multi-process FAO market is expected to reach nearly US$3.7 billion in ACV
Source: Everest Research Institute (2010)
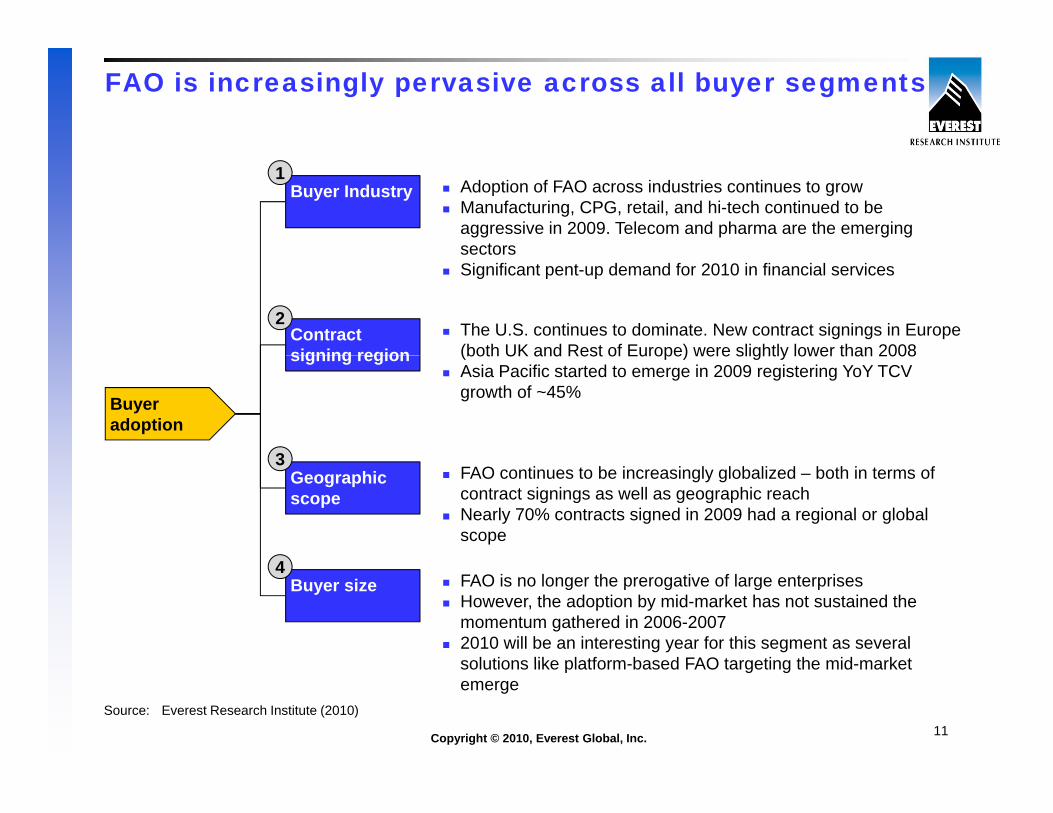
FAO is increasingly pervasive across all buyer segments
Buyer Industry Adoption of FAO across industries continues to growManufacturing, CPG, retail, and hi-tech continued to be aggressive in 2009. Telecom and pharma are the emerging sectors
1
sectorsSignificant pent-up demand for 2010 in financial services
Contract signing region
The U.S. continues to dominate. New contract signings in Europe (both UK and Rest of Europe) were slightly lower than 2008
2
Buyer adoption
signing region (both UK and Rest of Europe) were slightly lower than 2008Asia Pacific started to emerge in 2009 registering YoY TCV growth of ~45%
3Geographic scope
FAO continues to be increasingly globalized – both in terms of contract signings as well as geographic reachNearly 70% contracts signed in 2009 had a regional or global scope
3
Buyer size FAO is no longer the prerogative of large enterprisesHowever, the adoption by mid-market has not sustained the momentum gathered in 2006-20072010 will be an interesting year for this segment as several solutions like platform based FAO targeting the mid market
4
Copyright © 2010, Everest Global, Inc. 11Source: Everest Research Institute (2010)
solutions like platform-based FAO targeting the mid-market emerge
Agenda
FAO definition and research methodology
Market size, growth, and buyer adoption
Evolution of contract characteristics
Supplier landscape
Outlook for 2010
Copyright © 2010, Everest Global, Inc. 12
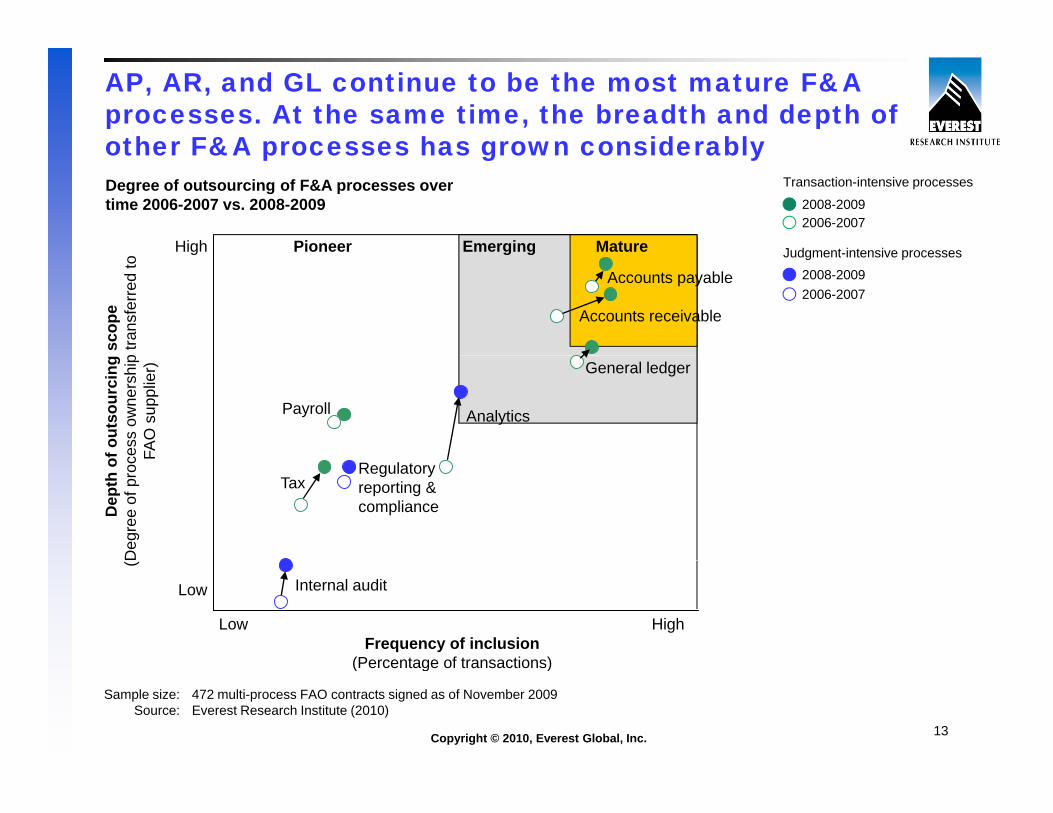
AP, AR, and GL continue to be the most mature F&A processes. At the same time, the breadth and depth of other F&A processes has grown considerablyother F&A processes has grown considerably
High Pioneer MatureEmerging
Transaction-intensive processes
Judgment intensive processes
2008-20092006-2007
Degree of outsourcing of F&A processes over time 2006-2007 vs. 2008-2009
scop
ep
trans
ferr
ed to
g g g
Accounts payable
Accounts receivable
Judgment-intensive processes2008-20092006-2007
f out
sour
cing
ce
ss o
wne
rshi
pFA
O s
uppl
ier)
Payroll
General ledger
Analytics
Dep
th o
Deg
ree
of p
roc F
TaxRegulatory reporting & compliance
(
Low
Frequency of inclusion(Percentage of transactions)
HighLow
Internal audit
Copyright © 2010, Everest Global, Inc. 13
(Percentage of transactions)
Sample size: 472 multi-process FAO contracts signed as of November 2009Source: Everest Research Institute (2010)
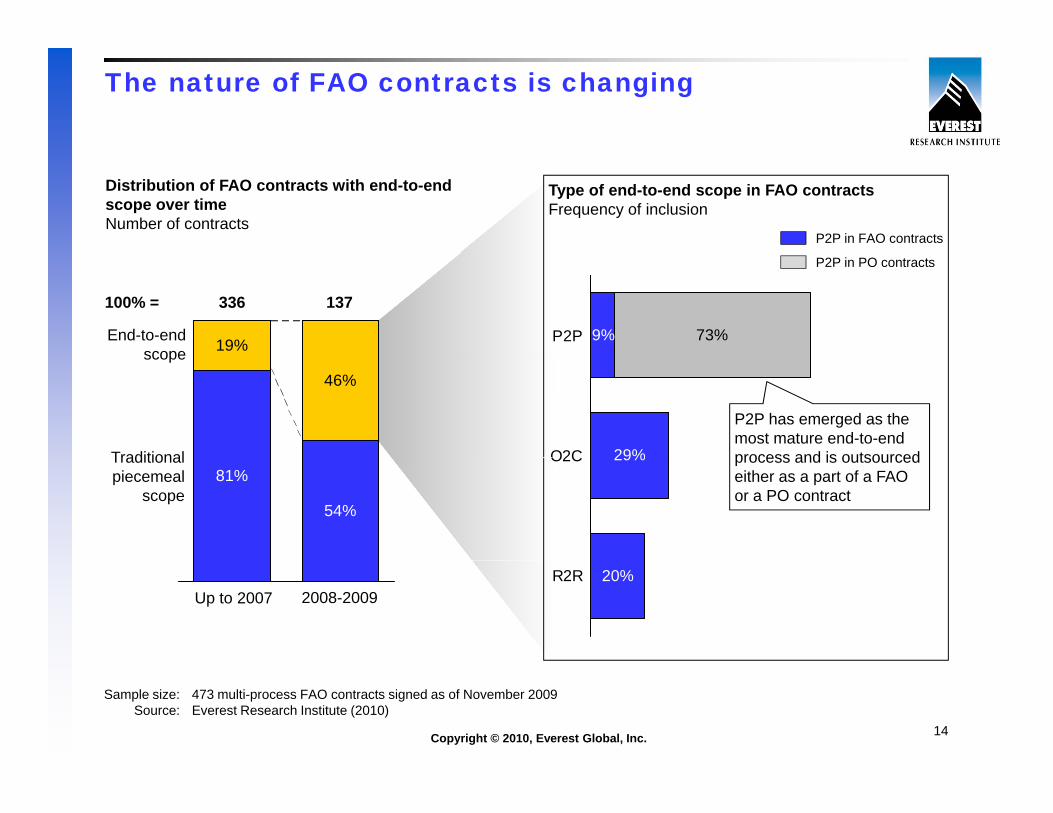
The nature of FAO contracts is changing
Distribution of FAO contracts with end-to-end scope over timeNumber of contracts
Type of end-to-end scope in FAO contractsFrequency of inclusion
P2P in FAO contracts
19%End-to-end scope
100% = 336 137
9% 73%P2P
P2P in PO contracts
46%scope
Traditional 29%O2C
P2P has emerged as the most mature end-to-end process and is outsourced
81%
54%
Traditional piecemeal
scope
29%O2C process and is outsourced either as a part of a FAO or a PO contract
2008-2009Up to 200720%R2R
Copyright © 2010, Everest Global, Inc. 14
Sample size: 473 multi-process FAO contracts signed as of November 2009Source: Everest Research Institute (2010)

The role of technology in FAO has evolved from the basic “tie-and-run” model to an “augmentation” model
Increasing role of technology in FAO
Tie-and-run Technology Core F&A technology Platform-based
Different flavors of technology in FAO and role of supplier
augmentation replacement/ implementation
Pre-integrated applications and pre-built processes owned
FAO
IT infrastructure and/or core F&A application implementation bundled with FAO
Limited role of technology where supplier plugs into the buyer’s existing
Supplier-provided tools that serve as “add-ons” around the periphery of the processes, owned
by supplier, with pricing built into the FAO contract
bundled with FAO services. Technology ownership resides with buyer
the buyer s existing systems to deliver services
the periphery of the existing systems to address specific gaps
F&A outsourcingoutsourcing services
Enabling tools & technologies
Core F&A processing system(s)
Traditional Prevalent
Copyright © 2010, Everest Global, Inc. 15
model model
Source: Everest Research Institute (2010)
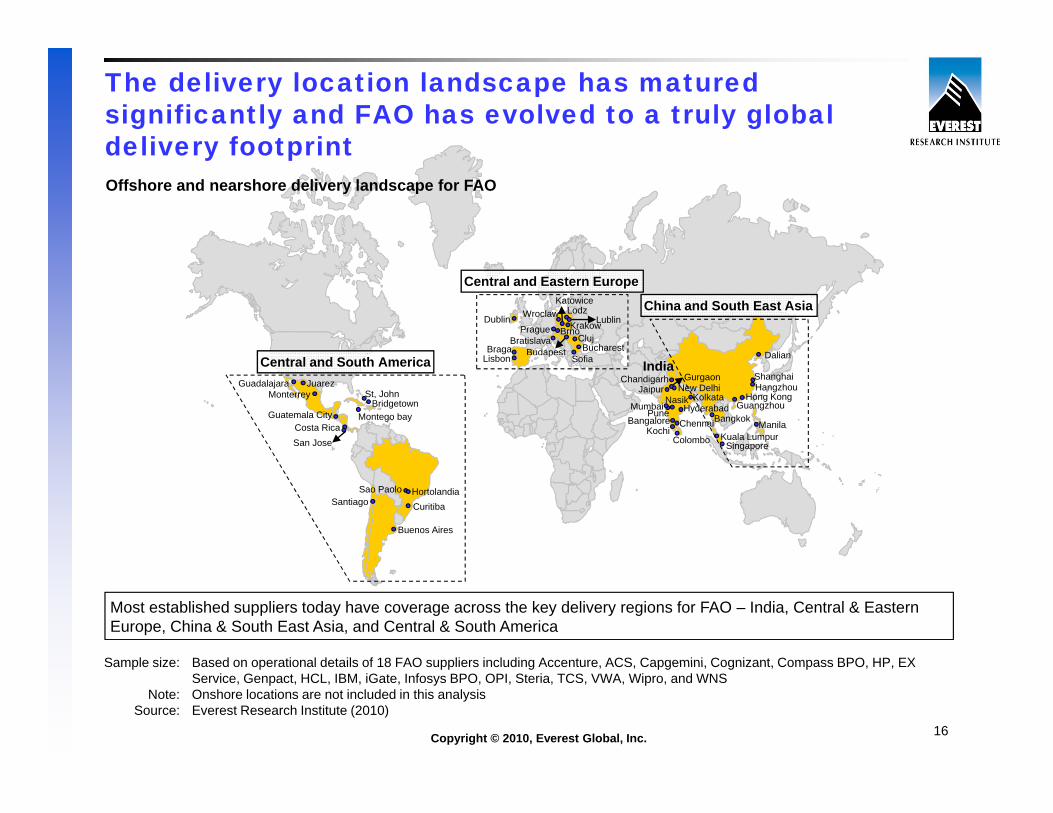
The delivery location landscape has matured significantly and FAO has evolved to a truly global delivery footprintdelivery footprintOffshore and nearshore delivery landscape for FAO
BrnoPrague Krakow
Li bBucharest
Bratislava
Dublin
S fi
WroclawKatowice
LodzLublin
Braga BudapestCluj
Dalian
China and South East Asia
Central and Eastern Europe
Bangalore
Chandigarh
Lisbon
San Jose
Juarez
Sofia
Costa Rica
p
St, John
Guatemala City Montego bay
GuadalajaraMonterrey
MumbaiPune Hyderabad
Kochi
Nasik KolkataNew DelhiJaipur
Gurgaon
Colombo
Dalian
Guangzhou
Shanghai
SingaporeKuala Lumpur
Hong KongHangzhou
BangkokManila
Bridgetown
Chennai
IndiaCentral and South America
Buenos Aires
Curitiba
Sao PaoloSantiago
Hortolandia
Most established suppliers today have coverage across the key delivery regions for FAO – India, Central & Eastern Europe, China & South East Asia, and Central & South America
Sample size: Based on operational details of 18 FAO suppliers including Accenture ACS Capgemini Cognizant Compass BPO HP EX
Copyright © 2010, Everest Global, Inc. 16
Sample size: Based on operational details of 18 FAO suppliers including Accenture, ACS, Capgemini, Cognizant, Compass BPO, HP, EX Service, Genpact, HCL, IBM, iGate, Infosys BPO, OPI, Steria, TCS, VWA, Wipro, and WNS
Note: Onshore locations are not included in this analysisSource: Everest Research Institute (2010)
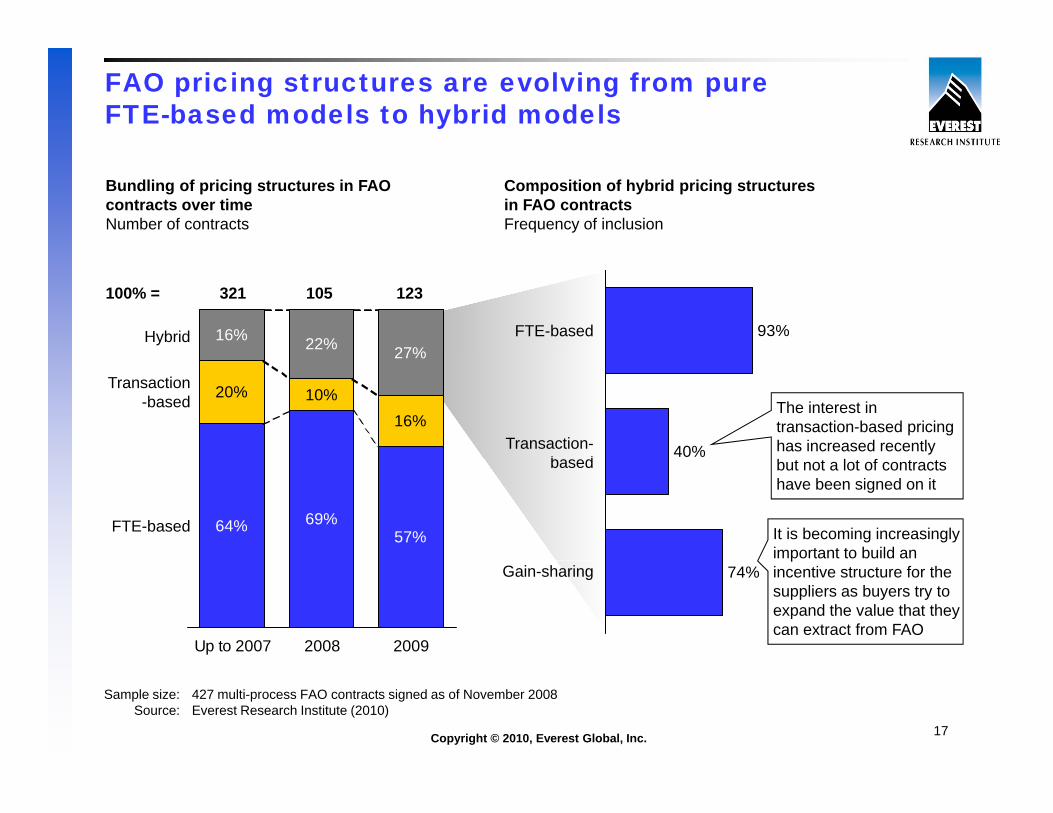
FAO pricing structures are evolving from pure FTE-based models to hybrid models
Bundling of pricing structures in FAO contracts over timeNumber of contracts
Composition of hybrid pricing structures in FAO contractsFrequency of inclusion
100% = 321 123105
16% 22% 27%93%Hybrid FTE-based
20% 10%16%
27%
40%
Transaction-based The interest in
transaction-based pricing has increased recently Transaction-
b d
64% 69%57%
FTE-based
but not a lot of contracts have been signed on it
based
It is becoming increasingly important to build an
Up to 2007 2008 2009
74%p
incentive structure for the suppliers as buyers try to expand the value that they can extract from FAO
Gain-sharing
Copyright © 2010, Everest Global, Inc. 17
Sample size: 427 multi-process FAO contracts signed as of November 2008Source: Everest Research Institute (2010)
Agenda
FAO definition and research methodology
Market size, growth, and buyer adoption
Evolution of contract characteristics
Supplier landscape
Outlook for 2010
Copyright © 2010, Everest Global, Inc. 18
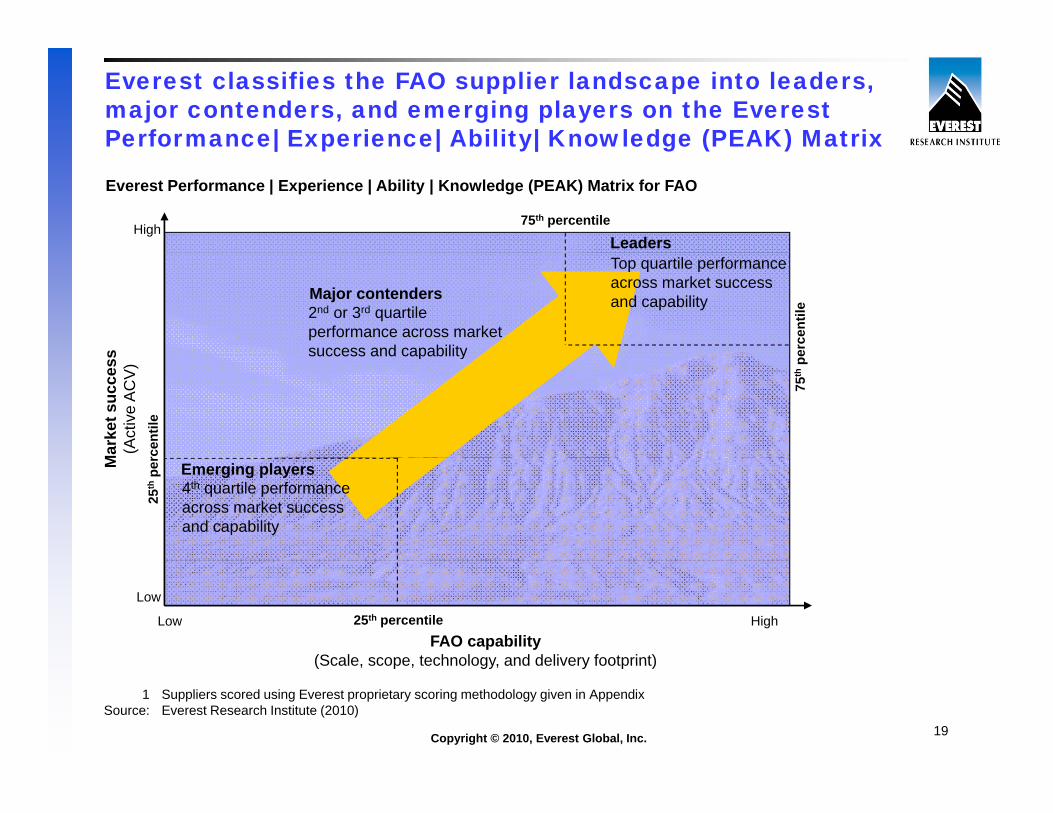
Everest classifies the FAO supplier landscape into leaders, major contenders, and emerging players on the Everest Performance| Experience| Ability| Knowledge (PEAK) Matrix| p | y| g ( )
LeadersHigh
75th percentile
Everest Performance | Experience | Ability | Knowledge (PEAK) Matrix for FAO
s
Major contenders
erce
ntile
Top quartile performance across market success and capability
2nd or 3rd quartile performance across market success and capability
Mar
ket s
ucce
ss(A
ctiv
e A
CV
)
75th
pe
rcen
tile
success and capability
M Emerging players
25th
per
4th quartile performance across market success and capability
FAO capability(Scale scope technology and delivery footprint)
Low
Low High25th percentile
Copyright © 2010, Everest Global, Inc. 19
(Scale, scope, technology, and delivery footprint)
1 Suppliers scored using Everest proprietary scoring methodology given in AppendixSource: Everest Research Institute (2010)
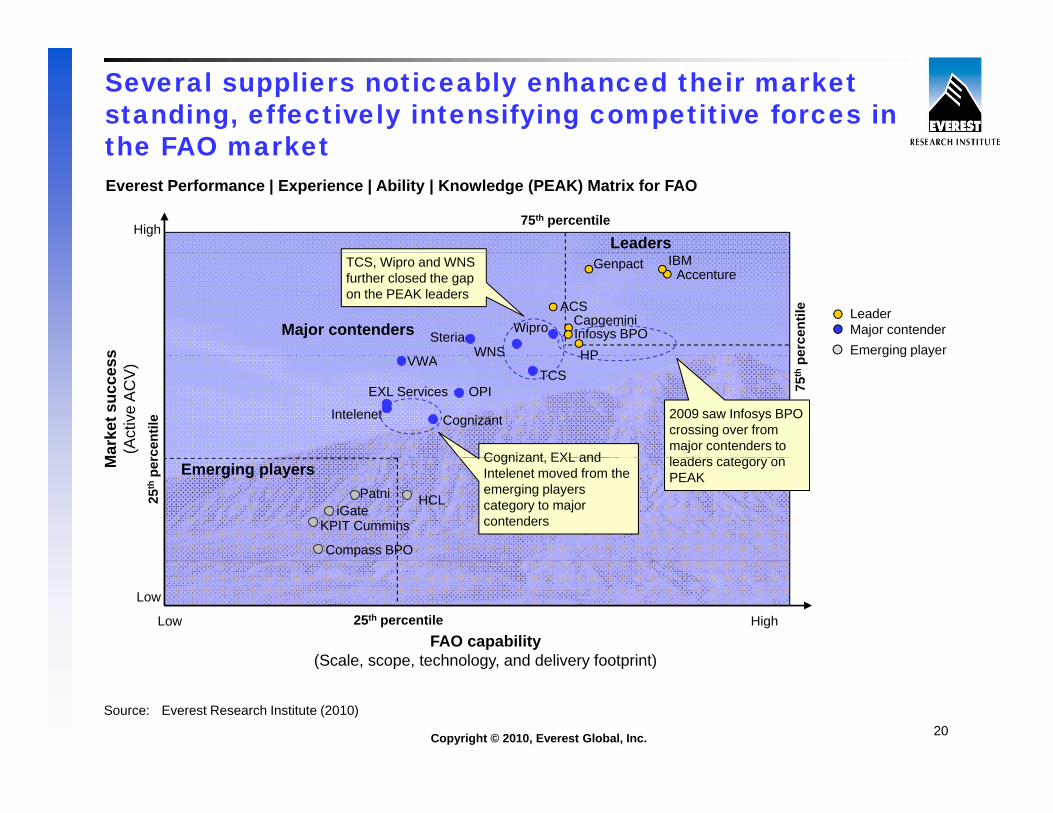
Several suppliers noticeably enhanced their market standing, effectively intensifying competitive forces in the FAO marketthe FAO market
LeadersHigh
Everest Performance | Experience | Ability | Knowledge (PEAK) Matrix for FAO
75th percentile
LeaderMajor contenderEmerging players
AccentureIBMGenpact
SteriaWNS
ACSWipro
HP
CapgeminiInfosys BPOMajor contenders
erce
ntile
TCS, Wipro and WNS further closed the gap on the PEAK leaders
g g p y
Mar
ket s
ucce
ss(A
ctiv
e A
CV
)
Intelenet
EXL Services
VWA
OPI
Cognizant
TCS
WNS HP
Cognizant EXL and
2009 saw Infosys BPO crossing over from major contenders to l d t
75th
pe
rcen
tile
M
Compass BPO
KPIT CumminsiGate
Patni HCL
Emerging playersCognizant, EXL and Intelenet moved from the emerging players category to major contenders
leaders category on PEAK
25th
per
FAO capability(Scale scope technology and delivery footprint)
Low
Low High25th percentile
Copyright © 2010, Everest Global, Inc. 20
(Scale, scope, technology, and delivery footprint)
Source: Everest Research Institute (2010)
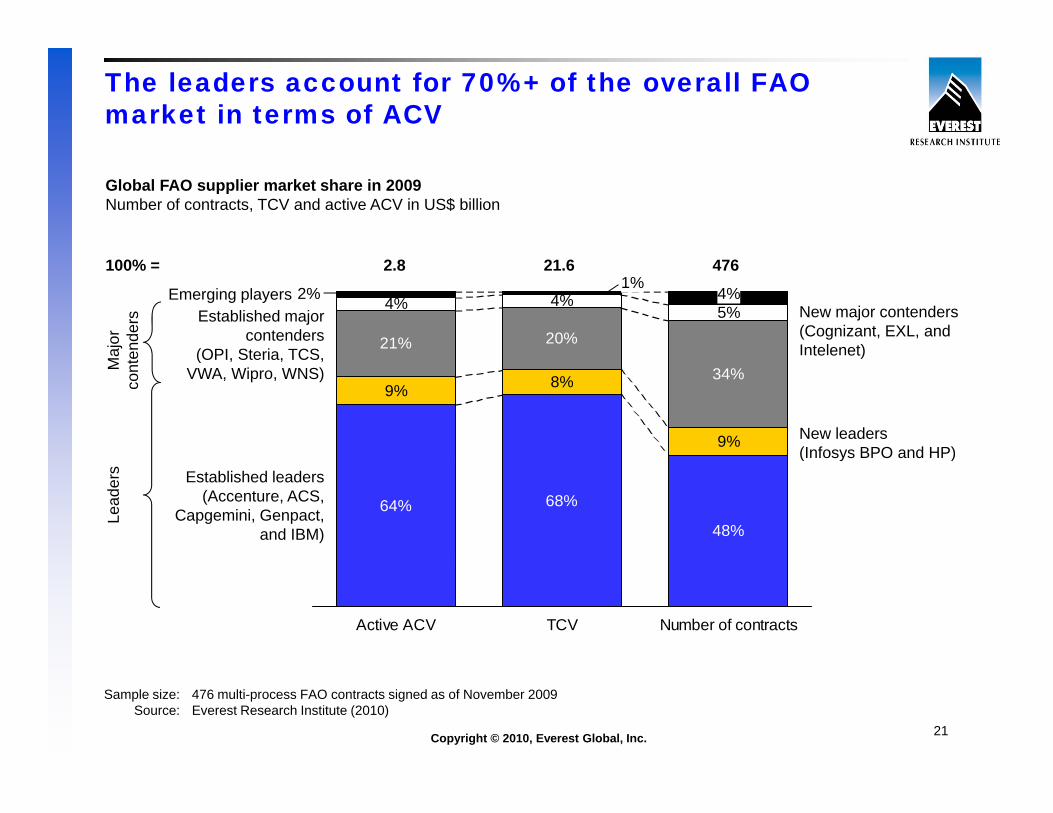
The leaders account for 70%+ of the overall FAO market in terms of ACV
Global FAO supplier market share in 2009Number of contracts, TCV and active ACV in US$ billion
21% 20%
4% 4%5%4%2%
1%100% = 2.8 21.6 476
Emerging players
ajor
en
ders Established major
contenders(OPI Steria TCS
New major contenders (Cognizant, EXL, and Intelenet)
9% 8%
9%
34%Ma
cont
e (OPI, Steria, TCS, VWA, Wipro, WNS)
New leaders(Infosys BPO and HP)
te e et)
64% 68%
48%
Lead
ers Established leaders
(Accenture, ACS, Capgemini, Genpact,
and IBM)
( osys O a d )
Active ACV TCV Number of contracts
Copyright © 2010, Everest Global, Inc. 21
Sample size: 476 multi-process FAO contracts signed as of November 2009Source: Everest Research Institute (2010)

Successful suppliers from all segments were able to fine tune their capability mix to the 2009 market requirementsrequirements
Type of FAO related investments reported in 2008-2009Percentage of events reported
11%Mergers & acquisitions
11%
18%
Partnerships & alliances
11%13%
9%
4%
15%Internal
investments 9% 7%
Technology-related Process/operationalexcellence related
Captive/provideracquisition
Delivery footprintexpansion
Internalreorganization
investments
Copyright © 2010, Everest Global, Inc. 22
Sample size: Operational details of FAO suppliersSource: Everest Research Institute (2010)
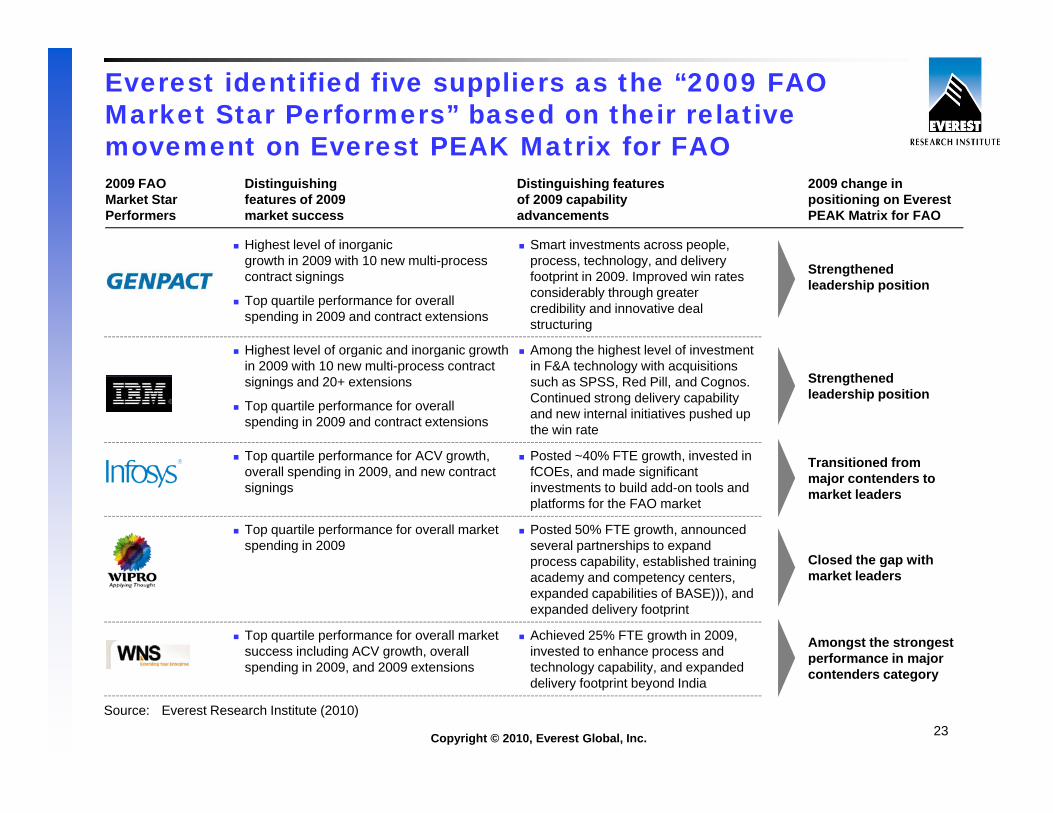
Everest identified five suppliers as the “2009 FAO Market Star Performers” based on their relative movement on Everest PEAK Matrix for FAOmovement on Everest PEAK Matrix for FAO
Highest level of inorganic Smart investments across people,
2009 change in positioning on Everest PEAK Matrix for FAO
Distinguishing features of 2009 capability advancements
Distinguishing features of 2009 market success
2009 FAO Market Star Performers
growth in 2009 with 10 new multi-process contract signings
Top quartile performance for overall spending in 2009 and contract extensions
process, technology, and delivery footprint in 2009. Improved win rates considerably through greater credibility and innovative deal structuring
Highest level of organic and inorganic growth Among the highest level of investment
Strengthened leadership position
g g g gin 2009 with 10 new multi-process contract signings and 20+ extensions
Top quartile performance for overall spending in 2009 and contract extensions
g gin F&A technology with acquisitions such as SPSS, Red Pill, and Cognos. Continued strong delivery capability and new internal initiatives pushed up the win rate
Top quartile performance for ACV growth Posted ~40% FTE growth invested in
Strengthened leadership position
T iti d fTop quartile performance for ACV growth, overall spending in 2009, and new contract signings
Posted 40% FTE growth, invested in fCOEs, and made significant investments to build add-on tools and platforms for the FAO market
Top quartile performance for overall market spending in 2009
Posted 50% FTE growth, announced several partnerships to expand process capability established training
Transitioned from major contenders to market leaders
Closed the gap withprocess capability, established training academy and competency centers, expanded capabilities of BASE))), and expanded delivery footprint
Top quartile performance for overall market success including ACV growth, overall
di i 2009 d 2009 t i
Achieved 25% FTE growth in 2009, invested to enhance process and t h l bilit d d d
Closed the gap with market leaders
Amongst the strongest performance in major
Copyright © 2010, Everest Global, Inc. 23
spending in 2009, and 2009 extensions technology capability, and expanded delivery footprint beyond India
p jcontenders category
Source: Everest Research Institute (2010)

Agenda
FAO definition and research methodology
Market size, growth, and buyer adoption
Evolution of contract characteristics
Supplier landscape
Outlook for 2010
Copyright © 2010, Everest Global, Inc. 24
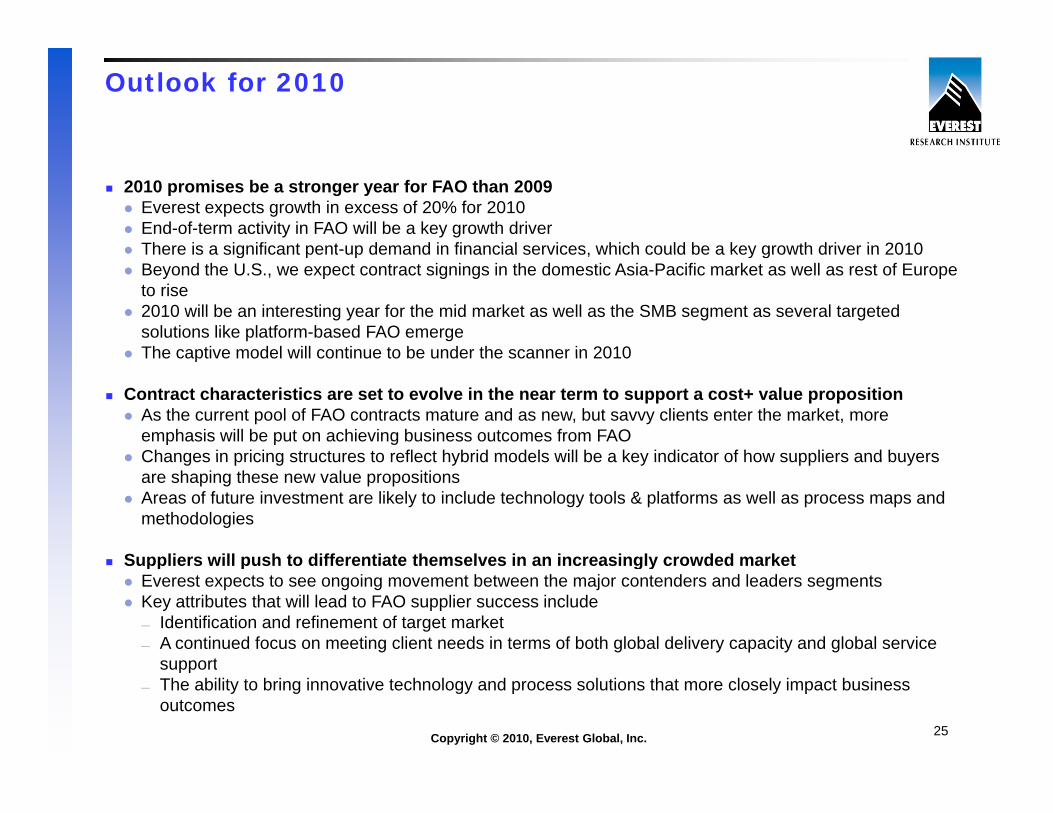
Outlook for 2010
2010 promises be a stronger year for FAO than 2009Everest expects growth in excess of 20% for 2010End-of-term activity in FAO will be a key growth driverThere is a significant pent-up demand in financial services, which could be a key growth driver in 2010There is a significant pent up demand in financial services, which could be a key growth driver in 2010Beyond the U.S., we expect contract signings in the domestic Asia-Pacific market as well as rest of Europe to rise2010 will be an interesting year for the mid market as well as the SMB segment as several targeted solutions like platform-based FAO emergeThe captive model will continue to be under the scanner in 2010The captive model will continue to be under the scanner in 2010
Contract characteristics are set to evolve in the near term to support a cost+ value propositionAs the current pool of FAO contracts mature and as new, but savvy clients enter the market, more emphasis will be put on achieving business outcomes from FAO Changes in pricing structures to reflect hybrid models will be a key indicator of how suppliers and buyersChanges in pricing structures to reflect hybrid models will be a key indicator of how suppliers and buyers are shaping these new value propositionsAreas of future investment are likely to include technology tools & platforms as well as process maps and methodologies
Suppliers will push to differentiate themselves in an increasingly crowded marketSuppliers will push to differentiate themselves in an increasingly crowded marketEverest expects to see ongoing movement between the major contenders and leaders segments Key attributes that will lead to FAO supplier success include — Identification and refinement of target market— A continued focus on meeting client needs in terms of both global delivery capacity and global service
support
Copyright © 2010, Everest Global, Inc. 25
support— The ability to bring innovative technology and process solutions that more closely impact business
outcomes
Q&A
Attendees will receive an email with a link to download today’s webinar presentation. To access a recorded audio version of this webinar, please contact Mark Williamson, [email protected]
Q&A
For advice or research on FAO, please contact Everest:Katrina Menzigian, [email protected] Gupta, [email protected]
For background information on Everest, please visit:www.everestgrp.comwww.everestresearchinstitute.com
Thank you for attending todayThank you for attending today
To ask a question during the Q&A session
Cli k th ti k (Q&A) b tt l t d th fl ti t l b i th b tt i ht fClick the question mark (Q&A) button located on the floating tool bar in the bottom right of your screen. This will open the Q&A Panel
Be sure to keep the default set to “send to a Panelist”
Proprietary & Confidential. © 2010 Outsourcing Center26
Then, type your question in the rectangular field at the bottom of the Q&A box and click the send button to submit