FAO data, tools & methods for climate impact assessment … · Climate Impact Team WMO XV...
37
Climate Impact Team WMO XV Commission for Agricultural Meteorology Belo Horizonte, Brazil 15-21 July 2010 FAO data, tools & methods for climate impact assessment at national level Michele Bernardi Climate, Energy and Tenure Division www.fao.org/nr/climpag/
-
Upload
dangkhuong -
Category
Documents
-
view
217 -
download
1
Transcript of FAO data, tools & methods for climate impact assessment … · Climate Impact Team WMO XV...
Climate Impact Team
WMO XV Commission for Agricultural MeteorologyBelo Horizonte, Brazil 15-21 July 2010
FAO data, tools & methods for climateimpact assessment at national level
Michele Bernardi Climate, Energy and Tenure Divisionwww.fao.org/nr/climpag/
Climate Impact Team
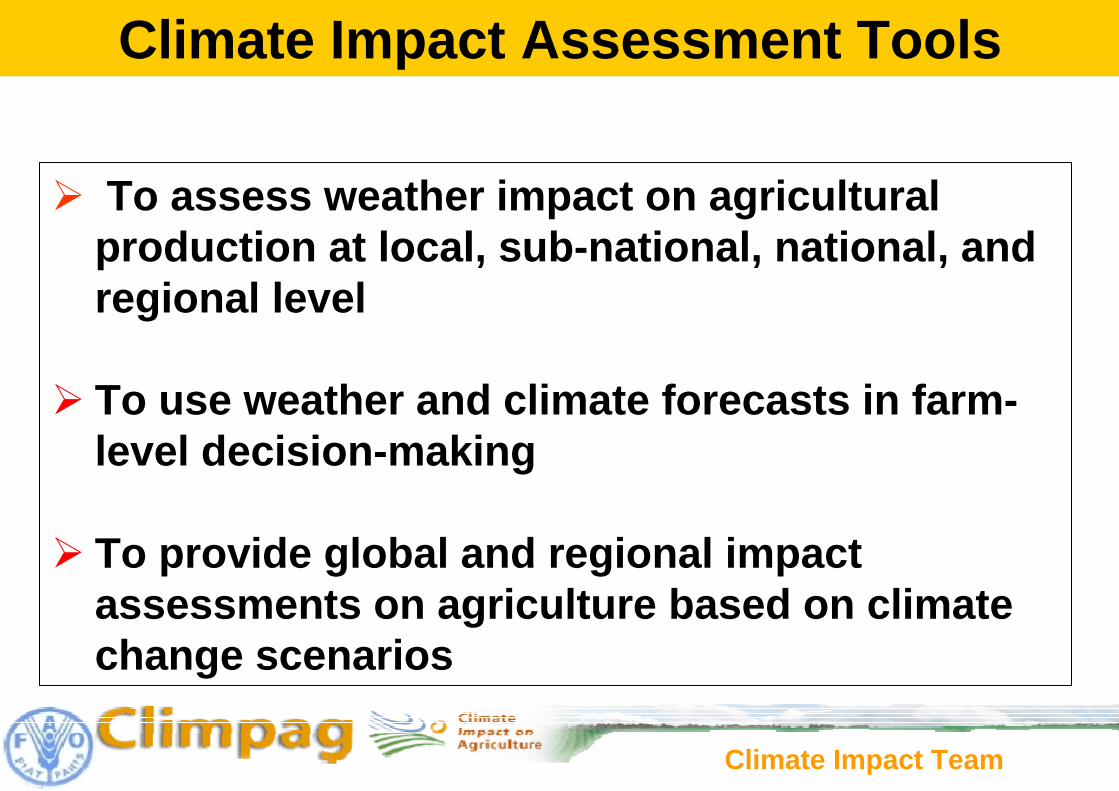
To assess weather impact on agricultural production at local, sub-national, national, and regional level
To use weather and climate forecasts in farm-level decision-making
To provide global and regional impact assessments on agriculture based on climate change scenarios
Climate Impact Assessment Tools

Climate Impact Team
www.fao.org/nr/climpag/

Climate Impact Team
Food security information chain
Climate Impact Team
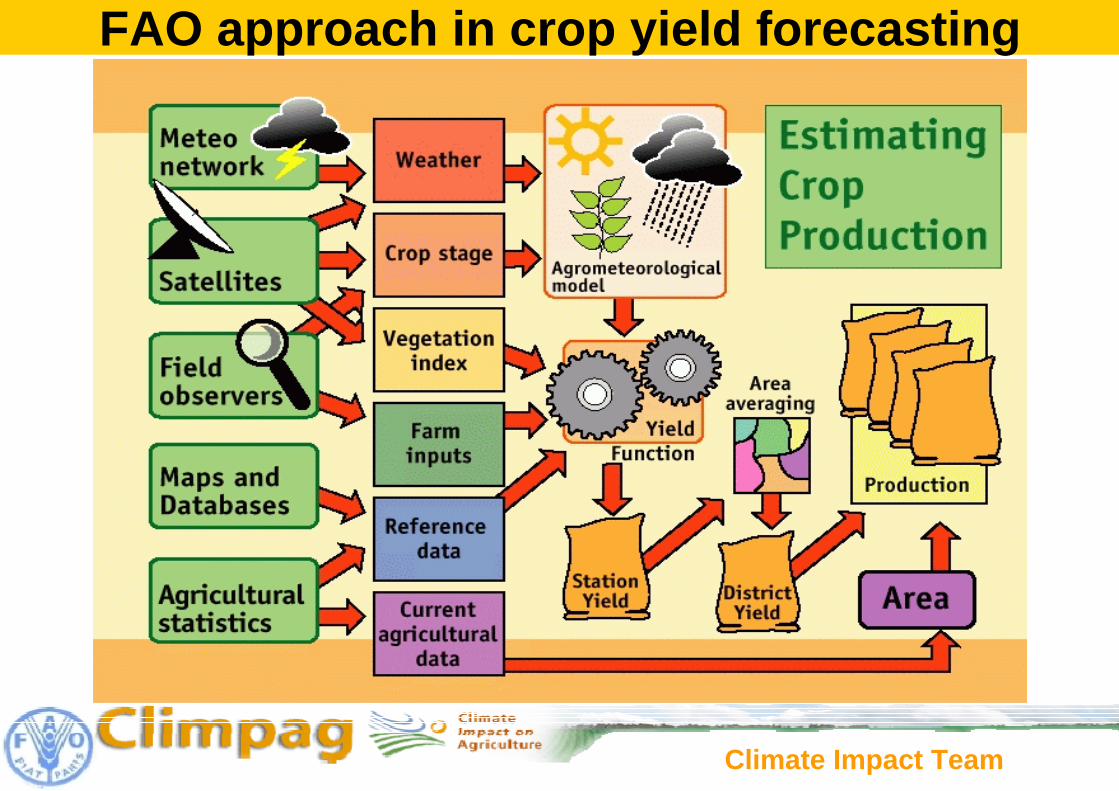
FAO approach in crop yield forecasting

Climate Impact Team
FAO INTRANET USERS
Oracle DBMS(FAOCLIM USER)
MICROSOFTACCESS LINK
MICROSOFTACCESS LINK
MICROSOFTACCESS LINK
FAOCLIM CUSTOM WORK SYSTEM
FAOCLIM CUSTOM WORK SYSTEM
FAOCLIM CUSTOM WORK SYSTEM
FAO INTERNET USERS
Oracle DBMS(FAOCLIM USER)
FAOCLIMBUSINESS
LOGIC
FAO WEB SERVER
INTERNET
BrowserBrowser Browser
FAOCLIM-NET

Climate Impact Team
20010430-999 42 -999 0 6/------- 600942 35 0 1 6/-///WW- 601043 37 1 1 6/////R/R 6011
-999 39 -999 0 6/------- 601256 43 23 23 6//MMRR/W 603053 42 -999 0 6//FF//// 604357 44 -999 0 6//////// 604957 45 11 11 6//////// 605261 48 0 0 6////W/// 6058
Climate Impact Team
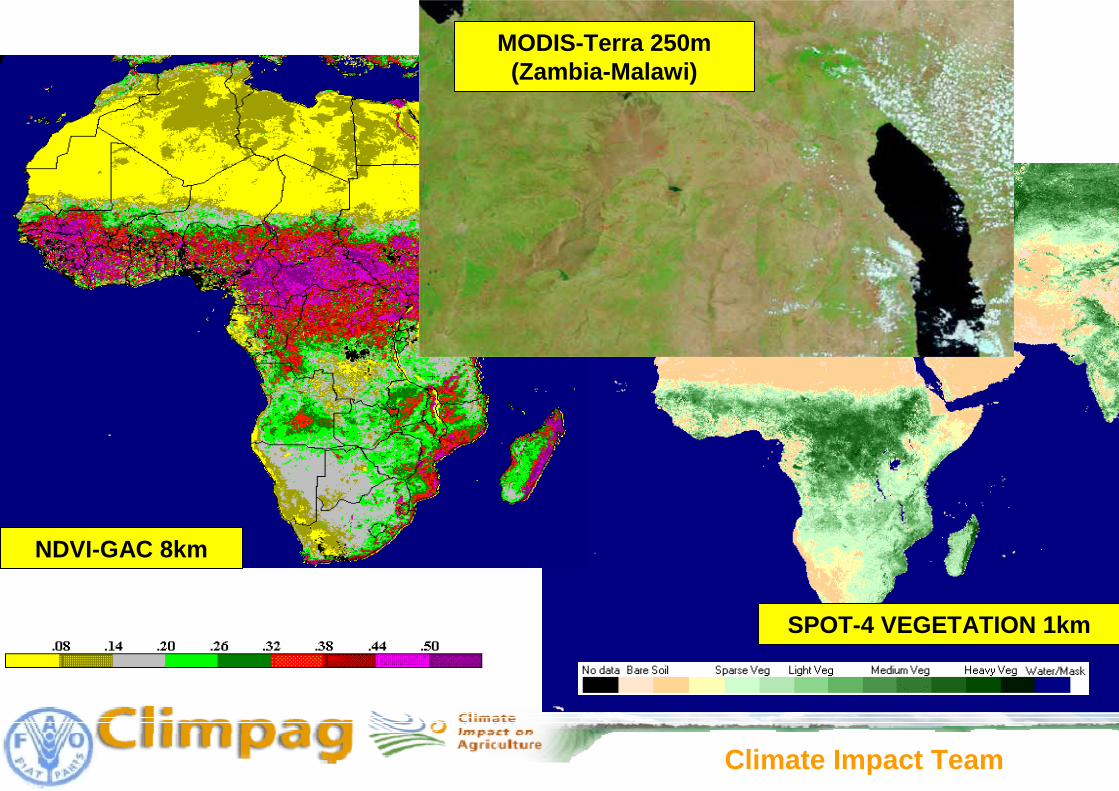
NDVI-GAC 8km
SPOT-4 VEGETATION 1km
MODIS-Terra 250m(Zambia-Malawi)
Climate Impact Team
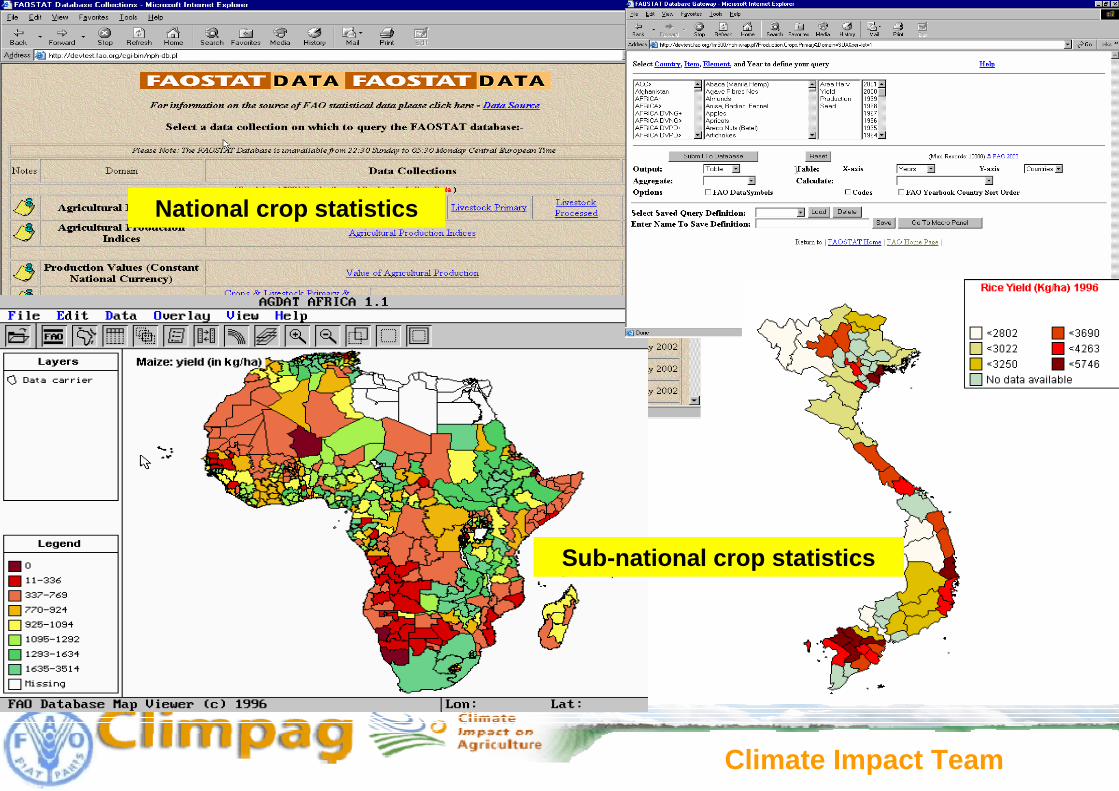
National crop statistics
Sub-national crop statistics
Climate Impact Team
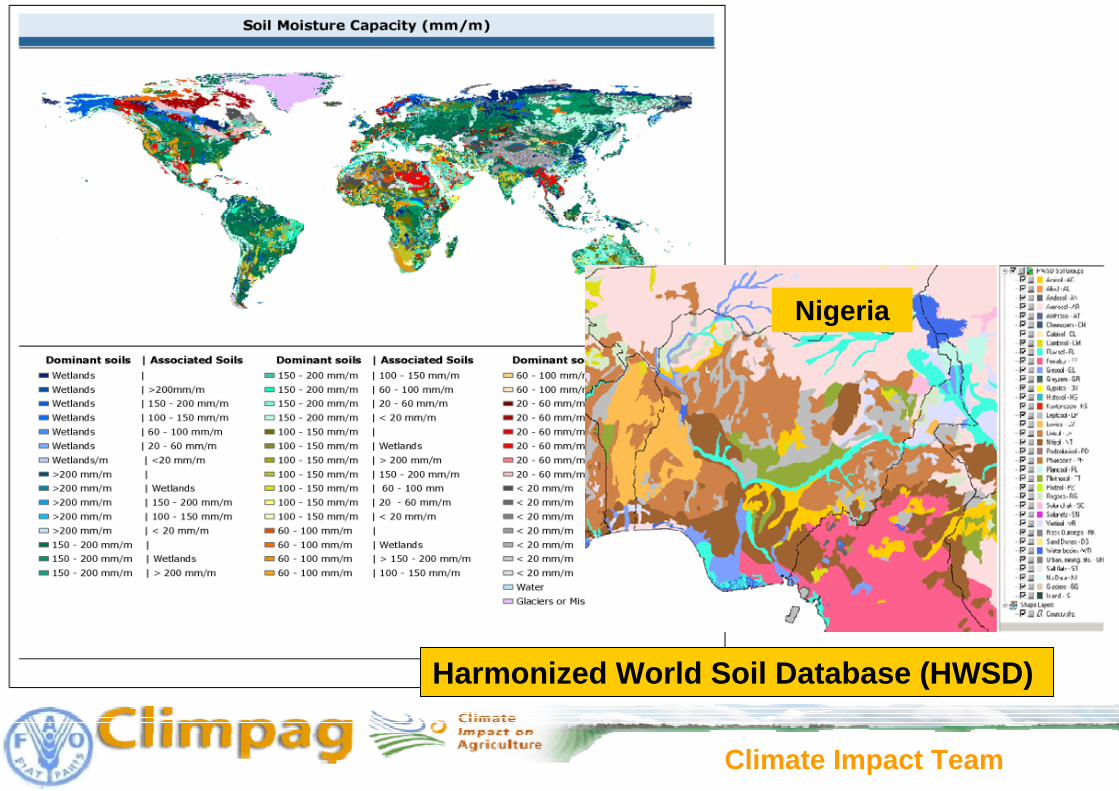
Harmonized World Soil Database (HWSD)
Nigeria

Climate Impact Team
Malawi
Swaziland
AO_Central
BW_North
BW_South
LS_West
MW_Central
MW_South
MZ_NorthWest
MZ_NorthEast
MZ_Central
MZ_South
NA_NorthEastNA_North
NA_Triangle
SZ_Central
TZ_North
TZ_South
ZA_Central
ZM_North
ZM_Central
ZM_South
ZW_CentralMG_Rice
Southern AfricaMain Maize Cropping Zones
(Rice in Madagascar)
Cropping areas
Crop Calendar
Length of cropping season

Climate Impact Team
Planting opportunities
Field reports

Climate Impact Team
FAO standard methodology
Climate Impact Team
Methods for Climate Changeimpact assessment on agriculture

Climate Impact Team
2. Physical impactson main crops and rangelands - livestock activities
3. Impacts on farming systems
4. Economic impacts
1. Climate Projections
5. Policy adaptation options
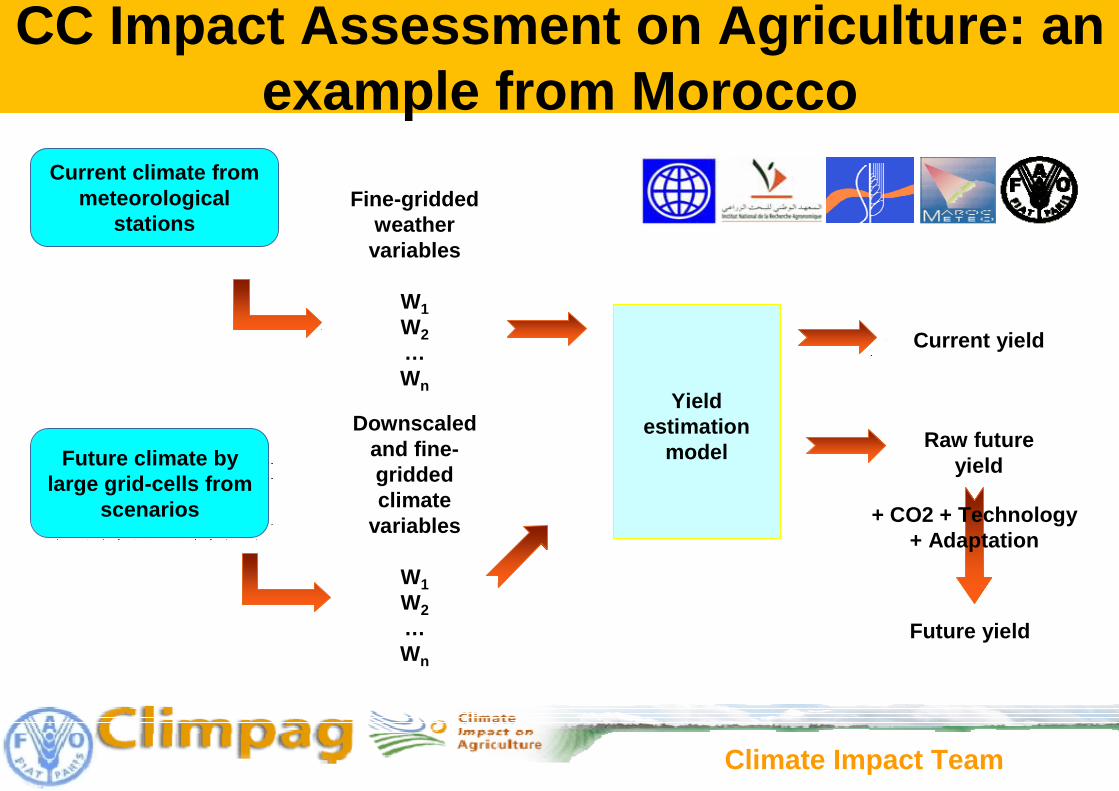
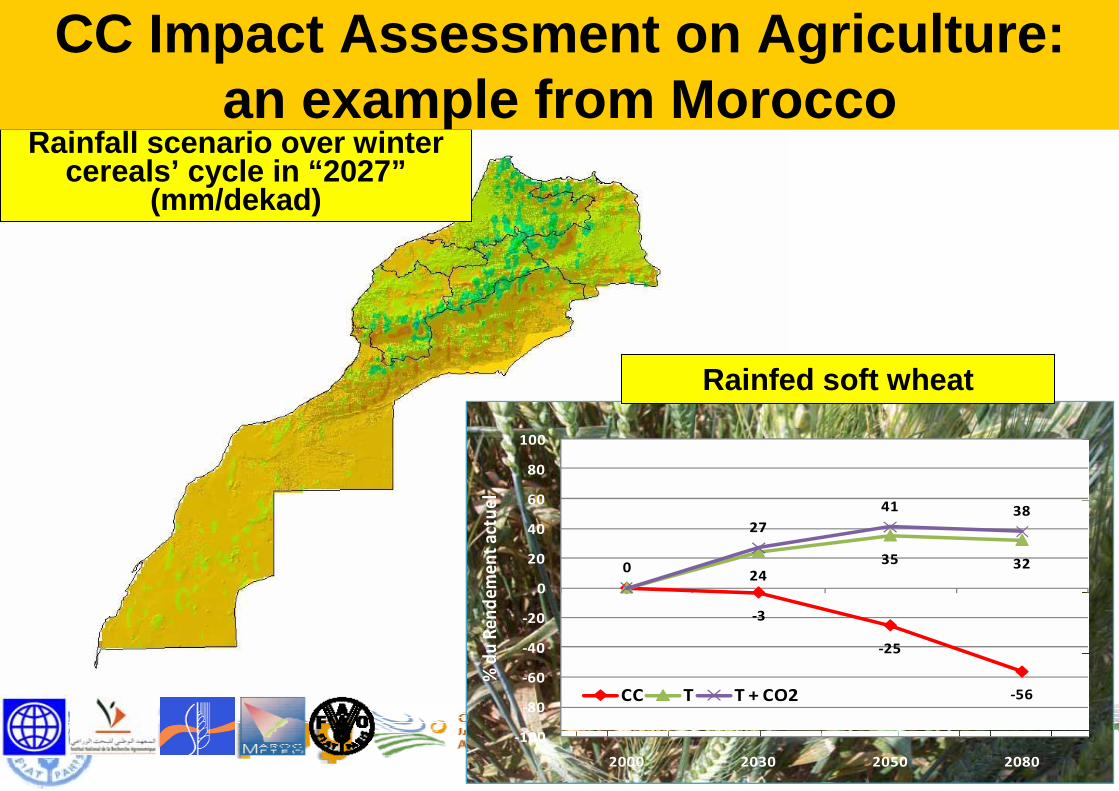
CC Impact Assessment on Agriculture: an example from Morocco
Government of Morocco / World Bank / FAO A number of crops, barley, wheat, vegetables, etc Barley yield projection for 2030 vs current yield A need for country to sub-country level studies of CC impact assessment
ftp://ext-ftp.fao.org/SD/Reserved/Agromet/WB_FAO_morocco_CC_yield_impact/report/WB_Morocco_20091007.pdf
Kingdom of Morocco Climate Change and Agriculture: Impacts and Policy Implications
Climate Impact Team
Current climate from meteorological
stations
Current climate from meteorological
stationsFine-gridded
weathervariables
W1W2…Wn
Future climate by large grid-cells from
scenarios
Future climate by large grid-cells from
scenarios
Yieldestimation
model
Current yield
Raw future yield
Downscaledand fine-griddedclimate
variables
W1W2…Wn
+ CO2 + Technology + Adaptation
Future yield
CC Impact Assessment on Agriculture: an example from Morocco

Climate Impact Team
Downscaling
CC Impact Assessment on Agriculture:an example from Morocco
Climate Impact Team
Rainfall scenario over winter cereals’ cycle in “2027”
(mm/dekad)
‐3
‐25
‐56
2435 320
2741 38
‐100
‐80
‐60
‐40
‐20
0
20
40
60
80
100
2000 2030 2050 2080
% du Re
ndem
ent a
ctue
l
CC T T + CO2
Rainfed soft wheat
CC Impact Assessment on Agriculture:an example from Morocco

Climate Impact Team
-14
-12
-10
-8
-6
-4
-2
0
DEF ORIENTALE
DEF SUD
FAVORABLE INTERMEDIAIR
EMONTAGNE
SAHARIEN
Barley Durum wheat rainfed Soft wheat rainfed
Percent change in average yield
(2030, A2 scenario)
CC Impact Assessment on Agriculture:an example from Morocco
Climate Impact Team
FAO Climate Change impact assessmenttoolbox

Climate Impact Team
Climate ScenarioDownscaling
Historical weatherrecords
Downscaled Climate scenarios
Hydrological Modelling
Crop growth Simulation
Economic Modelling
IPCC GCMLow Resolution
Scenarios
Historical dischargerecords
Water availabilityfor irrigation
Historical water usestatistics
Historical yield
records
Yield projections
Current stateof economy
Macroeconomicscenarios
Economic impacts
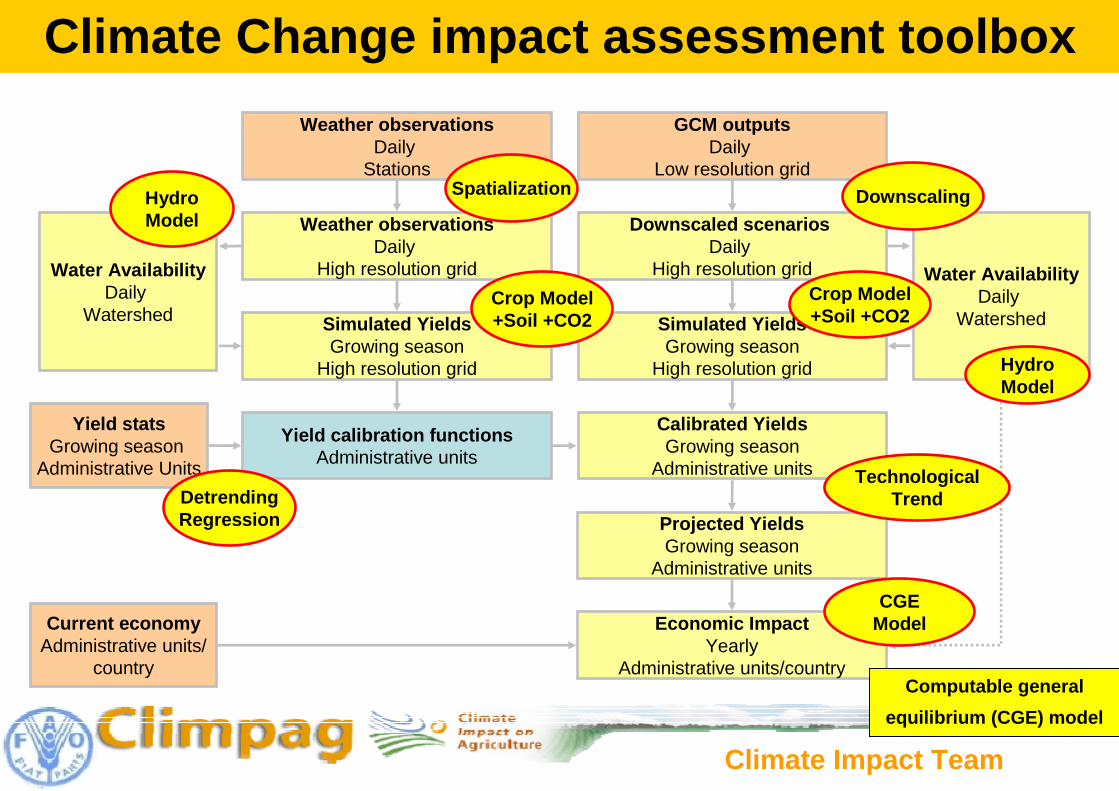
Climate Change impact assessment toolbox
Climate Impact Team
GCM outputsDaily
Low resolution grid
Downscaled scenarios Daily
High resolution grid
Simulated YieldsGrowing season
High resolution grid
Economic ImpactYearly
Administrative units/country
Calibrated YieldsGrowing season
Administrative units
Water AvailabilityDaily
Watershed
Weather observationsDaily
Stations
Weather observationsDaily
High resolution grid
Simulated YieldsGrowing season
High resolution grid
Yield calibration functionsAdministrative units
Water AvailabilityDaily
Watershed
Yield statsGrowing season
Administrative Units
Projected YieldsGrowing season
Administrative units
Climate Change impact assessment toolbox
Spatialization
Crop Model+Soil +CO2
Downscaling
TechnologicalTrend
Crop Model+Soil +CO2
DetrendingRegression
HydroModel
HydroModel
Current economyAdministrative units/
country
CGEModel
Computable general equilibrium (CGE) model

Climate Impact Team
CLIMATE
T (oC) Es Ta
Phenology Canopy CoverLeaf expansion gs
SenescenceBiomass
WP
YieldHI
CO2
Soil water (& salt) balanceInfiltration
UptakeRedistribution
deeppercolation
capillaryrise
Rooting depth
ETo
Rain
Runoff
• Wheat• Maize• Rice• Sugarbeet• Soybean• Cotton• Potato• Quinoa
• Sunflower• Sugarcane• Tomato• Teff• Bambara
Groundnut
• Forage crops (Alfalfa)
• Millet• Barley• Chickpea• Sorghum
Climate Impact Team
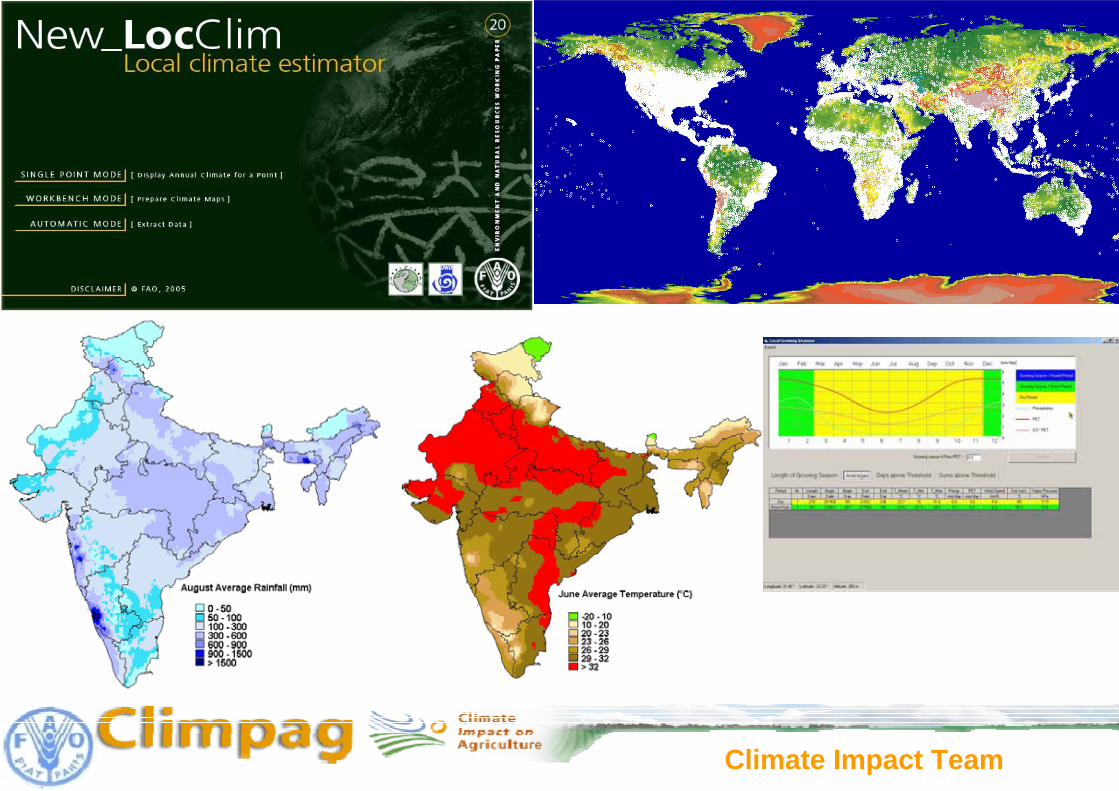
Other tools
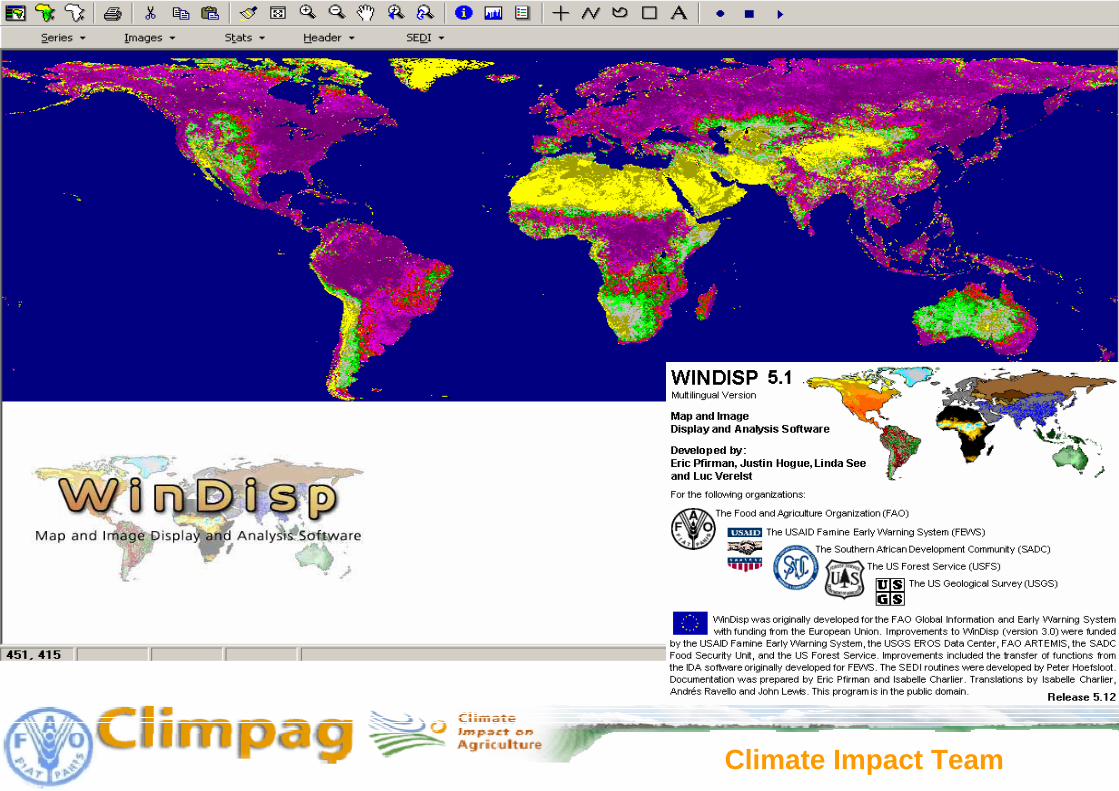
Climate Impact Team

Climate Impact Team
PREPDATA Merges suitably a temporal sequence ofimages
ACOMPIX
NGPIX Non-hierarchical Clustering of Pixels
Principal Components Analysis of the tablepixels x time variables
DISPLAY Displays profiles of pixels and classesin graphic form
BOUND (optional) selects the region(s) to which torestrict the clustering procedure
EXTRACT into a classified image for DISPLAY
SELECT Selects only pixels belonging to someclasses for further processing
Converts any partition computed by NGPIX
ADDAPIXPixel-by-pixel clustering
Climate Impact Team
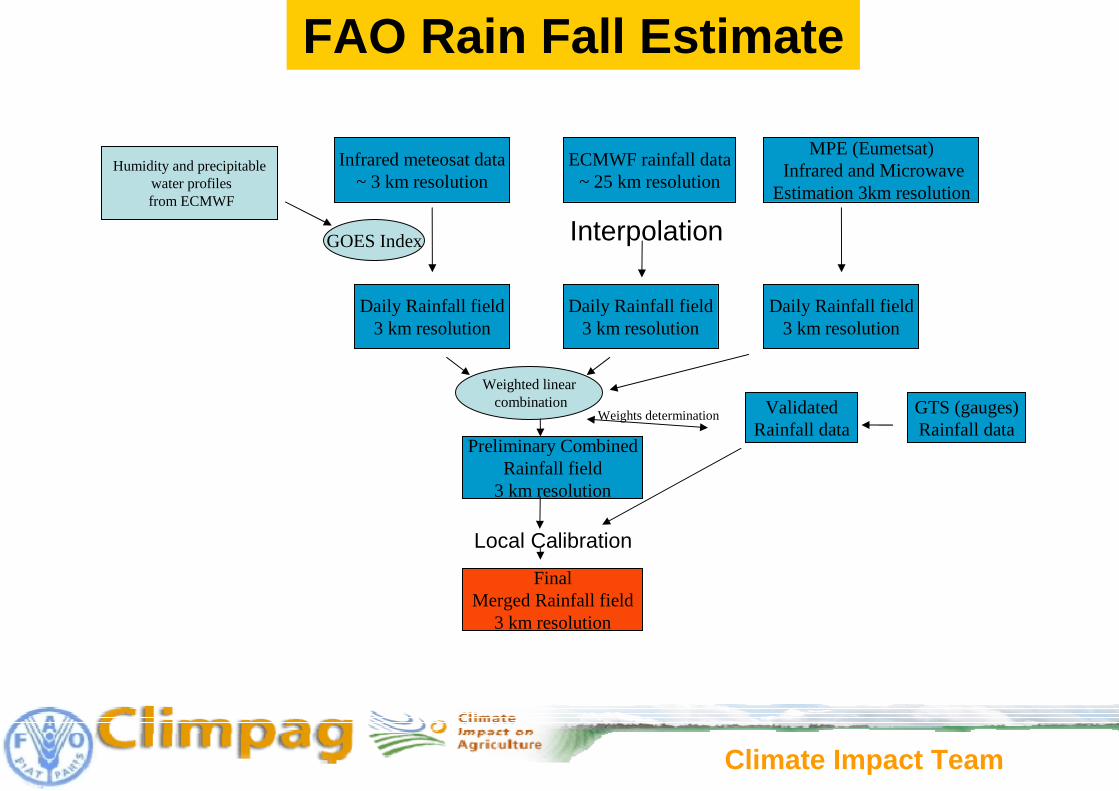
Climate Impact Team
Infrared meteosat data~ 3 km resolution
GOES Index
Humidity and precipitablewater profilesfrom ECMWF
Daily Rainfall field3 km resolution
ECMWF rainfall data~ 25 km resolution
Daily Rainfall field3 km resolution
Weighted linearcombination GTS (gauges)
Rainfall dataWeights determination
Preliminary CombinedRainfall field
3 km resolution
FinalMerged Rainfall field
3 km resolution
MPE (Eumetsat)Infrared and Microwave
Estimation 3km resolution
Daily Rainfall field3 km resolution
ValidatedRainfall data
Interpolation
Local Calibration
FAO Rain Fall Estimate

Climate Impact Team
Africa Sudan
FAO Rain Fall Estimate
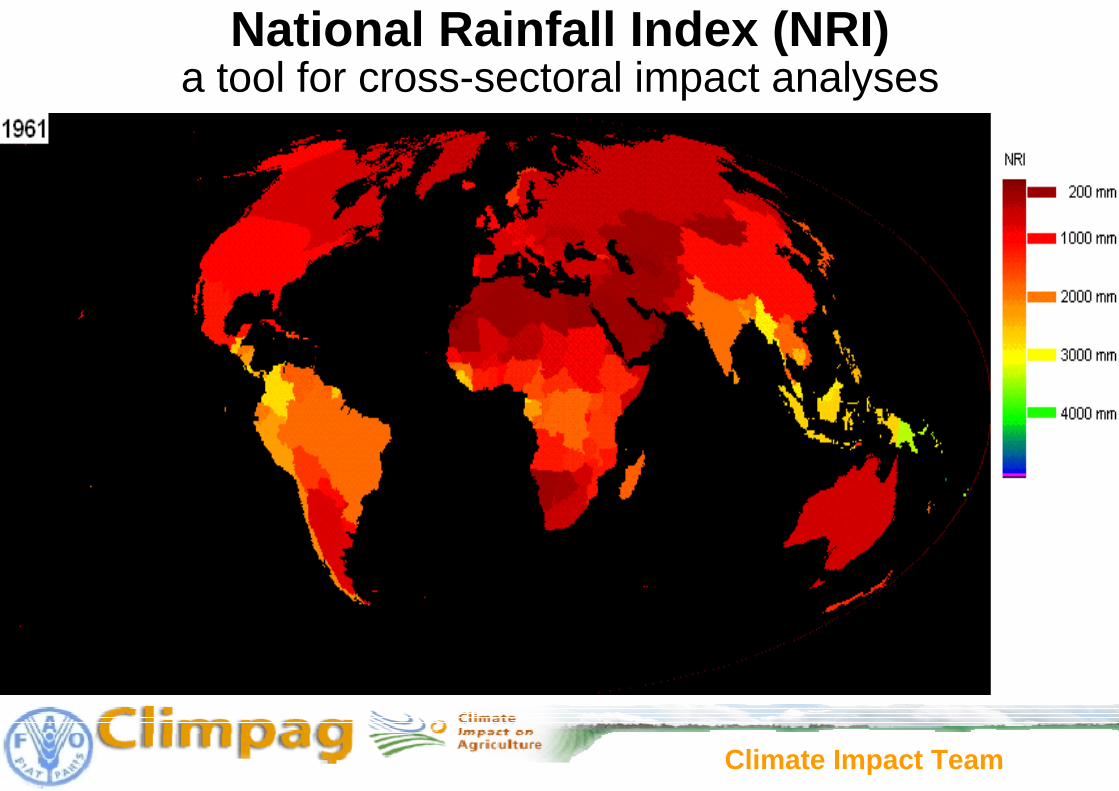
Climate Impact Team
National Rainfall Index (NRI)a tool for cross-sectoral impact analyses

Climate Impact Team
Global water stress maps
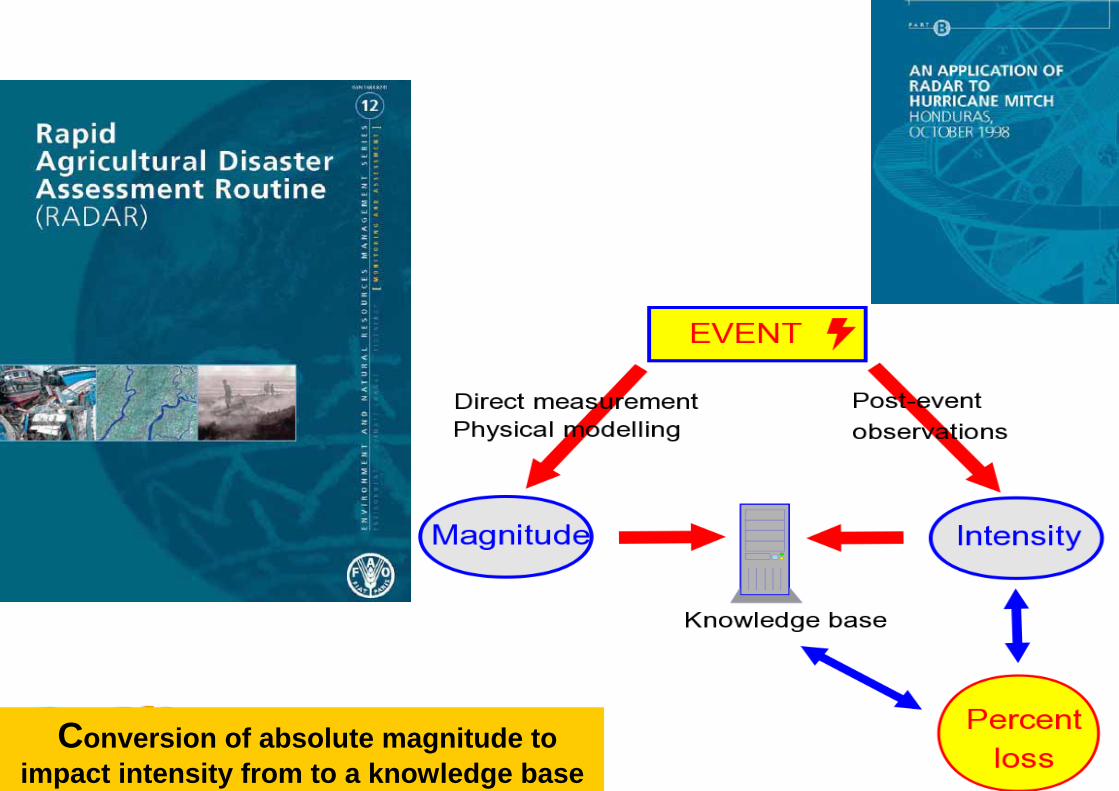
Climate Impact TeamConversion of absolute magnitude to
impact intensity from to a knowledge base

Climate Impact Team
Climate Impact Team

Climate Impact Team
Capacity building at national level

Climate Impact Team
GLCN Activities
• Data
• Software
• Services Technical assistanceSpatial analysisMappingTrainingResource kit
Data/Software distribution and support services
Climate Impact Team
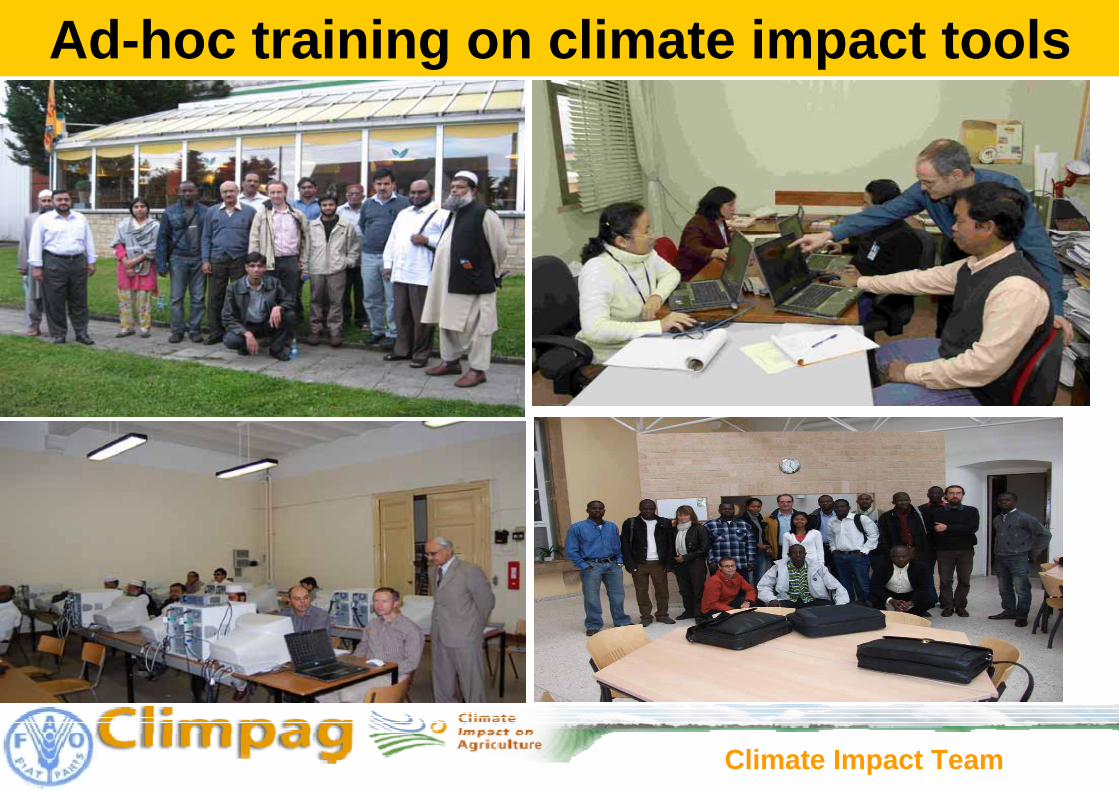
Ad-hoc training on climate impact tools