FANNIE MAE AND FREDDIE MAC SINGLE-FAMILY ... Footer Division of Housing Mission & Goals FANNIE MAE...
23
Division of Housing Mission & Goals FANNIE MAE AND FREDDIE MAC SINGLE-FAMILY GUARANTEE FEES IN 2015 August 2016
Transcript of FANNIE MAE AND FREDDIE MAC SINGLE-FAMILY ... Footer Division of Housing Mission & Goals FANNIE MAE...

Page Footer Division of Housing Mission & Goals
FANNIE MAE AND FREDDIE MAC SINGLE-FAMILY
GUARANTEE FEES IN 2015
August 2016

i
S i n g l e - Fa m i l y G u a r a n t e e F e e s
TABLE OF CONTENTS
Executive Summary 1
Guarantee Fees: Background 2
Factors Considered in Setting Fees 3
I . Estimated Cost 3
I I . Other Factors 5
Timeline of Changes in Guarantee Fees 6
Guarantee Fee Results for 2015 9
I . Average Guarantee Fee and Risk Profile 10
I I . General Factors Affecting Gaps 12
I I I . Guarantee Fees by Product Type 13
IV. Guarantee Fees by Risk Class 15
V. Guarantee Fees by Lender Volume 19

1
S i n g l e - Fa m i l y G u a r a n t e e F e e s
Executive Summary
Section 1601 of the Housing and Economic Recovery Act of 2008 (HERA) requires the Federal
Housing Finance Agency (FHFA) to conduct an ongoing study of the guarantee fees charged by
Fannie Mae and Freddie Mac (the Enterprises) and to submit a report to Congress each year.1
HERA requires an analysis of the average guarantee fee and a breakdown by product type, risk
class, and volume of a lender’s business. The report also must analyze the costs of providing the
guarantee and provide a comparison to the prior year. FHFA issued the first such report in
2009.2
This report discusses the guarantee fees charged in 2015 and provides a five-year perspective
with data back to 2011. The major findings in this report are:
In April 2015, the Agency completed a comprehensive review of the adequacy of the
Enterprises’ single-family guarantee fees.3 FHFA found no compelling economic reason to
change the overall level of fees. However, the Agency directed the Enterprises to make certain
adjustments effective with September 2015 deliveries. Specifically, the Agency directed the
Enterprises to eliminate the 25 basis point upfront adverse market charge that had been in place
since 2008 and to replace the revenue lost from eliminating that charge with targeted changes in
other upfront fees to address risk-based and access-to-credit considerations. Overall, the modest
changes were approximately revenue neutral for the Enterprises.
The average single-family guarantee fee increased by two basis points in 2015 to 59 basis
points. This stability is consistent with FHFA’s April 2015 determination that the fees
adequately reflected the credit risk of new acquisitions after years of sharp fee increases. During
the five year period from 2011 to 2015, fees had more than doubled from 26 basis points to 59
basis points.
1 Section 1601 of the Housing and Economic Recovery Act of 2008, Public Law 110-289, 122 Stat 2824, which may
be found at https://www.congress.gov/110/plaws/publ289/PLAW-110publ289.pdf.
2 See prior guarantee fee reports at http://www.fhfa.gov/DataTools/Pages/Data-Reports.aspx.
3 See press release for guarantee fee review at http://www.fhfa.gov/Media/PublicAffairs/Pages/FHFA-Completes-
Guarantee-Fee-Review-4-17-2015.aspx.

2
S i n g l e - Fa m i l y G u a r a n t e e F e e s
Acquisitions in 2015 showed an improvement in expected profitability. This is measured as
the difference between the charged guarantee fee and modeled costs, including a targeted return
on the modeled economic capital calculated for these loans. The Enterprises expected their 2015
acquisitions to generate returns in line with their targeted levels. In 2014, expected returns on
the yearly acquisitions were below the targeted level. The improvement in 2015 was mainly due
to an acquisition loan mix that represented lower credit risk as compared to the prior year.
Consistent with action taken by FHFA in late 2012 to remove pricing concessions for the
largest lenders, the guarantee fees charged to the largest and smallest lenders had no material
differences. The average guarantee fee for the smallest and largest lenders was within one basis
point in 2015 and there was no material difference in the expected profitability between those
two size groups. The smallest lender groups accounted for 41 percent of the dollar value of
Enterprise acquisitions in 2015, up from 29 percent in 2011.
Guarantee Fees: Background
Guarantee fees are intended to cover the credit risk and other costs that Fannie Mae and Freddie
Mac incur when they acquire single-family loans from lenders. Loans are acquired through two
methods. A lender may exchange a group of loans for a Fannie Mae or Freddie Mac guaranteed
mortgage-backed security (MBS), which may then be sold by the lender into the secondary
market to recoup funds to make more loans to borrowers. Alternatively, a lender may deliver
loans to an Enterprise in return for a cash payment. Larger lenders tend to exchange loans for
MBS, while smaller lenders tend to sell loans for cash and these loans are later bundled by the
Enterprises into MBS.
While the private holders of MBS assume market risk (the risk that the price of the security may
fall due to changes in interest rates), the Enterprises assume the credit risk on the loans.4 The
Enterprises charge a guarantee fee in exchange for providing this guarantee, which covers
administrative costs, projected credit losses from borrower defaults over the life of the loans, and
the cost of holding capital to protect against projected credit losses that could occur during
stressful macroeconomic conditions.5 Investors are willing to pay a higher price for Enterprise
4 Although the Enterprises are always the ultimate guarantors, they may choose to retain the credit risk on their own
balance sheet or, as part of their credit risk transfer programs, pay private entities to bear some of the credit risk.
5 Currently, the guarantee fee also includes a 10 basis point charge as required by Section 401 of the Temporary
Payroll Tax Cut Continuation Act of 2011, codified at 12 USC 4547.

3
S i n g l e - Fa m i l y G u a r a n t e e F e e s
MBS due to their guarantee of principal and interest. The higher value of the MBS leads to
lower interest rates for borrowers.
There are two types of guarantee fees: ongoing and upfront. Ongoing fees are collected each
month over the life of a loan. Upfront fees are one-time payments made by lenders upon loan
delivery to an Enterprise. Fannie Mae refers to upfront fees as “loan level pricing adjustments,”
while Freddie Mac refers to them as “delivery fees.” Both ongoing and upfront fees compensate
the Enterprises for the costs of providing the guarantee. Ongoing fees are based primarily on the
product type, such as a 30-year fixed rate or a 15-year fixed rate loan. Upfront fees are used to
price for specific risk attributes such as the loan-to-value ratio (LTV) and credit score.
Ongoing fees are set by the Enterprises with lenders that exchange loans for MBS, while those
fees are embedded in the price offered to lenders that sell loans for cash. In contrast to ongoing
fees, the upfront fees are publicly posted on each Enterprise’s website.6 Upfront fees are paid
by the lender at the time of loan delivery to an Enterprise, and those charges are typically rolled
into a borrower’s interest rate in the same manner as ongoing fees.
Under the existing protocols of the Enterprises’ conservatorships, FHFA requires that each
Enterprise seek FHFA approval for any proposed change in upfront fees. The upfront fees
assessed by the two Enterprises generally are in alignment.
Factors Considered in Setting Fees
I. Estimated Cost
Guarantee fees cover several cost components that the Enterprises expect to incur in providing
their guarantee on mortgage-backed securities: 1) The expected costs that result from the failure
of some borrowers to make their payments; 2) the cost of holding the modeled capital amount
necessary to protect against potentially much larger unexpected and catastrophic losses that
result from the failure of some borrowers to make their payments in a severe stress environment;
3) general and administrative expenses; and 4) 10 basis points allocated to the U.S. Department
of the Treasury as required by the Temporary Payroll Tax Cut Continuation Act of 2011.
6 See Enterprise upfront fees at https://www.fanniemae.com/content/pricing/llpa-matrix.pdf and
http://www.freddiemac.com/singlefamily/pdf/ex19.pdf.

4
S i n g l e - Fa m i l y G u a r a n t e e F e e s
Of these components, the cost of holding capital is by far the most significant. A firm bearing
mortgage credit risk needs enough capital to survive a stressful credit environment, such as what
occurred during the recent housing market crisis. The annual cost of holding capital to protect
against unexpected losses is the amount of capital required multiplied by the target rate of return
on that capital.
Each Enterprise is subject to a Senior Preferred Stock Purchase Agreement with the U.S.
Department of the Treasury, which restricts the ability to retain capital. Furthermore, FHFA
suspended its quarterly classifications of the capital adequacy of each Enterprise when the
Enterprises were placed into conservatorship. In order to maintain a sound pricing framework,
FHFA has asked each Enterprise to set guarantee fees consistent with the amount of capital they
would need to support their guarantee businesses if they were able to retain capital.
Each Enterprise uses a proprietary model to estimate the costs it expects to bear and the amount
of capital that it needs to set aside to cover unexpected losses. The capital estimates are most
sensitive to the macroeconomic scenario specified in the model. The two primary components of
the macroeconomic scenario are the stressed house price path and stressed interest rate path.
In addition to the macroeconomic scenarios, the main risk characteristics included in the models
that determine the estimated cost of guaranteeing a single-family loan are:
Borrower credit history;
Debt-to-income ratio;
Loan-to-value ratio;
Mortgage insurance coverage;
Loan purpose (purchase, rate-term refinance, cash-out refinance);
Occupancy status (primary home, investor);
Property type (single-family, condo/coop, 2-4 unit);
Product type (fixed, adjustable rate, maturity term); and
Loan interest rate.
Using the models to estimate a required amount of capital and subjecting that estimate to a target
rate of return, the Enterprises calculate a model guarantee fee and, from that, a gap. The gap is
the difference between the fee charged on a loan and the model-estimated cost of providing the

5
S i n g l e - Fa m i l y G u a r a n t e e F e e s
credit guarantee, including a target return on capital.7 If the gap on a loan is positive or zero, the
Enterprise expects to achieve at least its target rate of return on capital. If the gap is negative, the
Enterprise may still earn a positive return on the loan although not achieve its overall target rate
of return on the loan. At acquisition, the Enterprises expect to earn a positive return, whether
above or below target, on nearly all of their loans. Lower expected returns may help the
Enterprises to fulfill their affordable housing missions.8
II. Other Factors
Another consideration in determining guarantee fees is the lending environment. For example,
Fannie Mae and Freddie Mac compete with each other for a lender’s business.9 In addition,
lenders may choose an alternative to the Enterprises such as retaining loans in portfolio,
originating loans insured by the Federal Housing Administration, or securitizing loans in the
private-label securities market. If the Enterprises’ guarantee fees rise relative to the prices of
these alternatives, some reduction in the market share for the Enterprises for certain types of
loans would be expected.
In addition to the estimated cost and lending environment, the Enterprises consider the mandates
of safety and soundness, regulatory affordable housing goals, and their charter obligations to
provide broad access to mortgage credit in determining their guarantee fees.
7 Models and the target return on capital are updated over time, so caution must be exercised when comparing gaps
from different time periods.
8 The Federal Housing Enterprises Financial Safety and Soundness Act, as amended by HERA, requires FHFA “to
ensure that the operations and activities of each regulated entity foster liquid, efficient, competitive, and resilient
national housing finance markets (including activities relating to mortgages on housing for low- and moderate-
income families involving a reasonable economic return that may be less than the return earned on other activities).”
9 Fannie Mae’s MBS tend to trade at higher prices (with corresponding lower interest rate yields) than similar
securities from Freddie Mac. This is mainly due to the liquidity benefit of a larger volume of Fannie Mae securities
in the market. Freddie Mac is able to compete with Fannie Mae for business by offering market adjusted pricing
(MAP) to its lenders that exchange loans for MBS. MAP provides a discount from the contractual ongoing
guarantee fee based on the spreads between Fannie Mae and Freddie Mac MBS. While the guarantee fees in this
report are shown on a combined basis (Fannie Mae and Freddie Mac fees together weighted by the respective
acquisition volumes), the Freddie Mac component of the combined guarantee fees do include the effect of the MAP
pricing discount.

6
S i n g l e - Fa m i l y G u a r a n t e e F e e s
Timeline of Changes in Guarantee Fees
Faced with deteriorating conditions in the housing market, each Enterprise implemented a
guarantee fee increase in March 2008 to better align fees with credit risk. Specifically, the
Enterprises increased ongoing fees and introduced two new upfront fees: a fee based on a
borrower’s LTV ratio and credit score, and an adverse market charge. Later in 2008, the
Enterprises refined their LTV ratio and credit-score-based upfront fees, and in subsequent years
gradually raised their fees to better reflect credit risk.
On December 23, 2011, the President signed into law the Temporary Payroll Tax Cut
Continuation Act of 2011 (TCCA) to fund an extension of the payroll tax cut. Consistent with
the TCCA, in late December 2011 FHFA directed the Enterprises to increase the ongoing fees
for all loans by 10 basis points effective with April 2012 deliveries.10
In August 2012, FHFA directed the Enterprises to increase their guarantee fees by 10 basis
points on average. This increase was intended to more fully compensate taxpayers for bearing
credit risk. The increase was allocated in a way that aligned the gaps of 15-year and 30-year
loans and reduced differences in the ongoing fees of small volume lenders and large volume
lenders. This change was effective with December 2012 deliveries.
FHFA announced another guarantee fee change in December 2013 that would have increased
ongoing fees by 10 basis points and made other changes to the fee structure. However, in
January 2014 FHFA suspended implementation of the change pending further review.
In April 2015, the Agency completed its further review of the adequacy of the Enterprises’
guarantee fees. FHFA found no compelling economic reason to change the overall level of fees.
However, the Agency directed the Enterprises to make certain minor and targeted fee
adjustments effective with September 2015 deliveries:
Due to improvements in the housing market, the 25 basis point upfront adverse market
charge in place since 2008 was removed for all states.
10 The Enterprises collect the TCCA fee and pass it through to the U.S. Department of the Treasury. For reporting
purposes to FHFA, the Enterprises include the 10 basis point TCCA fee in both the guarantee fee and model fee.
The gaps shown in this report do not reflect the benefit of the 10 basis point fee since it is used both as an income
and expense item.

7
S i n g l e - Fa m i l y G u a r a n t e e F e e s
Offsetting the revenue lost from the removal of the adverse market charge, FHFA made
targeted increases in upfront fees for a subset of loans, including some higher-risk loan
segments (cash-out refinances, jumbo conforming loans, investment properties, and loans
with secondary financing) and those with both high credit scores and low LTV ratios.
Fees were not increased on loans with lower credit scores or higher LTV ratios. Contributing to
the determination to leave the upfront fees the same for higher LTV ratio loans was FHFA’s
separate action in April 2015 to finalize new standards for mortgage insurers – Private Mortgage
Insurer Eligibility Requirements (PMIERs). Loans with less than a 20 percent down payment
are required to share credit risk with the private sector through charter-eligible credit
enhancements, which lenders typically satisfy with private mortgage insurance. The finalized
PMIERs provide modest cost savings to the Enterprises from reduced mortgage insurer
counterparty exposure. Overall, the set of changes to guarantee fees aimed to be approximately
revenue neutral, with little or no change in loan interest rates for most borrowers.
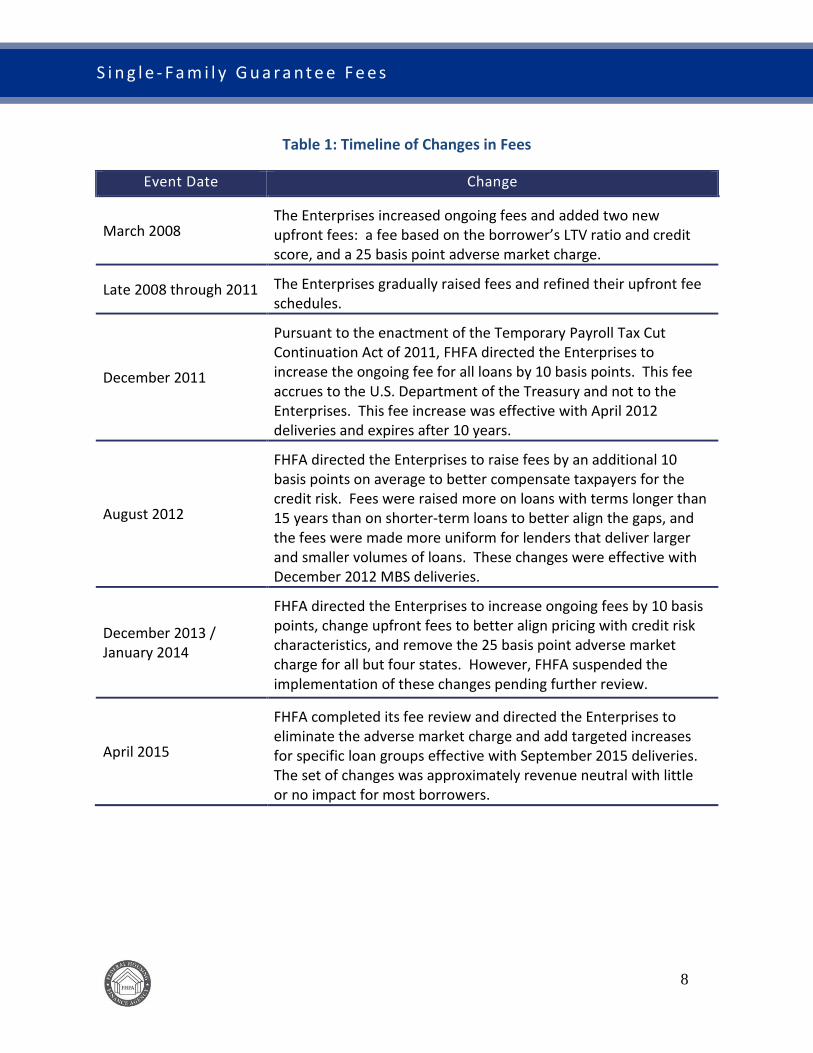
Table 1 shows a timeline of the major changes to guarantee fees, including each of the directives
issued by FHFA to the Enterprises.
8
S i n g l e - Fa m i l y G u a r a n t e e F e e s
Table 1: Timeline of Changes in Fees
Event Date Change
March 2008 The Enterprises increased ongoing fees and added two new upfront fees: a fee based on the borrower’s LTV ratio and credit score, and a 25 basis point adverse market charge.
Late 2008 through 2011 The Enterprises gradually raised fees and refined their upfront fee schedules.
December 2011
Pursuant to the enactment of the Temporary Payroll Tax Cut Continuation Act of 2011, FHFA directed the Enterprises to increase the ongoing fee for all loans by 10 basis points. This fee accrues to the U.S. Department of the Treasury and not to the Enterprises. This fee increase was effective with April 2012 deliveries and expires after 10 years.
August 2012
FHFA directed the Enterprises to raise fees by an additional 10 basis points on average to better compensate taxpayers for the credit risk. Fees were raised more on loans with terms longer than 15 years than on shorter-term loans to better align the gaps, and the fees were made more uniform for lenders that deliver larger and smaller volumes of loans. These changes were effective with December 2012 MBS deliveries.
December 2013 / January 2014
FHFA directed the Enterprises to increase ongoing fees by 10 basis points, change upfront fees to better align pricing with credit risk characteristics, and remove the 25 basis point adverse market charge for all but four states. However, FHFA suspended the implementation of these changes pending further review.
April 2015
FHFA completed its fee review and directed the Enterprises to eliminate the adverse market charge and add targeted increases for specific loan groups effective with September 2015 deliveries. The set of changes was approximately revenue neutral with little or no impact for most borrowers.

9
S i n g l e - Fa m i l y G u a r a n t e e F e e s
Guarantee Fee Results for 2015
This report uses data on single-family loans acquired from 2011 to 2015 to present the average
guarantee fee charged by the Enterprises, as well as a breakdown of fees by product type, risk
class (loan purpose, LTV ratio, and credit score), and lender delivery volume. This report uses
economic concepts, rather than accounting data, to analyze guarantee fees. Therefore, the
guarantee fee presentation in this report is different from the published financial statements of
the Enterprises, which are prepared in accordance with Generally Accepted Accounting
Principles (GAAP).
This report includes loans acquired by the Enterprises under their standard underwriting and
delivery guidelines.11 The study population is show in Table 2.
Table 2: Study Population12
11 The study population does not include the Home Affordable Refinance Program (HARP), manufactured housing,
FHA loans, second liens, and other loans that are outside of the standard underwriting and delivery guidelines.
12 Prior-year data may not be consistent with data in previous FHFA reports due to changes in methodology or data
corrections. The individual numbers in the charts, tables, and narrative in this report may not compute exactly to the
totals due to rounding.
Change
2011 2012 2013 2014 2015 2014 to 2015
Dollars (in Billions) $759 $1,014 $942 $564 $771 $207
Loans (in Millions) 3.6 4.7 4.5 2.7 3.4 0.7

10
S i n g l e - Fa m i l y G u a r a n t e e F e e s
I. Average Guarantee Fee and Risk Profile
Chart 1 shows the average guarantee fee across all loans acquired each year. Upfront fees have
been converted to the ongoing fee equivalent for ease of comparison.13 Guarantee fees increased
sharply from an average of 26 basis points in 2011 to 57 basis points in 2014. However, fees
stabilized in 2015 at an average of 59 basis points as FHFA completed its review of guarantee
fees and implemented a set of modest fee changes that were revenue neutral.
The overall trend in guarantee fees shown in the chart reflects a number of factors, including
directives from FHFA to the Enterprises, changes initiated by the Enterprises, and changes in the
mix of loans acquired by the Enterprises reflected in Table 3. The large fee increases in 2012
and 2013 were driven by the FHFA directive implemented in April 2012 (10 basis point increase
for TCCA passed through to the U.S. Department of the Treasury) and the directive implemented
in December 2012 (10 basis point increase to better align pricing with credit risk).
Chart 1: Average Guarantee Fee
13 The Enterprises use present value multiples (PVM) to convert upfront fees into the ongoing fee equivalent. The
PVM is based on the specific characteristics of each loan. As an example, when a loan has a PVM of 5, a 25 basis
point upfront fee is equivalent to a 5 basis point ongoing fee. The total guarantee fees shown in this report are
actually estimated fees since the upfront fee portion is annualized based on the assumed life of a loan at the time of
acquisition. Fannie Mae updated its PVM calculations in 2015, which makes it difficult to compare both the upfront
and total fees with the results from prior years.

11
S i n g l e - Fa m i l y G u a r a n t e e F e e s
Table 3 shows the acquisition share by risk profile over the five-year study period. As mortgage
interest rates fell to record lows in 2015, fixed-rate loans became more popular with borrowers
and the share of adjustable-rate mortgage (ARM) loans fell from 6 percent to 3 percent of the
dollar value of acquisitions. Low interest rates also drove an increase in the share of refinance
loans for the year. The increased share of rate-term refinances boosted the share of loans with at
least 30 percent borrower equity (equivalent to a 70 percent or lower LTV ratio). A greater share
of loans also had higher borrower credit scores. Overall, the acquisition profile in 2015
represented lower credit risk for the Enterprises compared to 2014.
Table 3: Acquisition Share by Risk Profile

12
S i n g l e - Fa m i l y G u a r a n t e e F e e s
Chart 2 shows the average gap across all loans acquired each year. The gap improved in 2015
from a negative value to zero.14 This means that the Enterprises expect their 2015 acquisitions to
generate overall returns in-line with their targeted levels.
Chart 2: Average Gap
II. General Factors Affecting Gaps
Three main factors contribute to the movement in gaps over time. First, and most intuitively,
changes in guarantee fees affect the gaps, as price increases improve returns. Second, yearly
changes to each Enterprise’s credit model and capital-related assumptions affect the gaps. Third,
changes in the loan mix affect the gap, as more or less loans in different risk categories are
acquired. Table 3 shows the changes in the acquisition share each year along the key risk
dimensions (product type, loan purpose, LTV ratio, credit score, and risk layering features).
14 The gap charts in this report allow the reader to see whether the gaps are negative (below the targeted level) or
positive (above the targeted level) and the relative changes from year to year. The actual values are not provided in
order to protect confidential Enterprise information.

13
S i n g l e - Fa m i l y G u a r a n t e e F e e s
The set of changes in upfront fees announced by FHFA in April 2015 and implemented in
September was approximately revenue neutral. However, it slightly changed the expected
profitability of different categories of loans. For example, small fee increases for loans with
certain risk layering characteristics (cash-out refinances, jumbo conforming, investment
properties, and loans with subordinate financing) better aligned the pricing with the credit risk in
those categories.
The FHFA-directed pricing changes in upfront fees were the same at each Enterprise, and the
loan mix changes were similar at both Enterprises. While each Enterprise makes yearly updates
to its proprietary capital and credit models, major updates or the implementation of a new model
can happen at each Enterprise at different times.
III. Guarantee Fees by Product Type
Chart 3 shows a consistent increase in the guarantee fees for each product type group from 2011
to 2014. In 2015, the Enterprises did not implement any major changes to guarantee fees.
However, changes made in 2015 in how Fannie Mae converts upfront fees into “annualized”
ongoing fee equivalents were the primary driver of changes in the total reported guarantee fee
(ongoing plus upfront fee) for both fixed-rate 30-year loans and ARM loans.15
The all-loans guarantee fee increase of 2 basis points in 2015 (in Chart 1) was driven by a 3 basis
point increase in the average guarantee fee for fixed-rate 30-year loans. The fixed-rate 15-year
fee dipped slightly by 1 basis point, while ARM loans had a 5 basis point decline in the average
fee, but accounted for only 3 percent of the volume. Since upfront fees are based on the loan
purpose, LTV ratio, credit score and risk layering attributes, changes in the mix of acquired loans
(shown in Table 3) normally serve as the primary driver for changes in the upfront fees, which
affect the total charged guarantee fee. However, the primary driver for the fee changes in 2015
was Fannie Mae’s changes to its PVM calculations.
15 Fannie Mae’s PVMs in 2015 were much lower for fixed-rate 30-year loans, little changed for fixed-rate 15-year
loans, and much higher for ARM loans. This had the effect of changing the upfront “annualized” fees, even when
the actual charged upfront fees did not change. While the effect of the Fannie Mae PVM changes is somewhat
muted when Fannie Mae’s data are combined with Freddie Mac’s data, these PMV changes remain the main driver
in the reported increase in the fixed-rate 30-year loan guarantee fee and decrease in the ARM loan guarantee fee.

14
S i n g l e - Fa m i l y G u a r a n t e e F e e s
Chart 3: Guarantee Fee by Product Type
Chart 4 shows the gap by product type. The gap for fixed-rate 30-year loans improved in 2015,
although it was still slightly negative. This means that the Enterprises, on average at delivery,
expected these loans to generate returns slightly below their targeted returns. Fixed-rate 15-year
loans and ARM loans continued to have a positive gap in 2015, indicating expected returns
above target. The gaps for those two product types were nearly unchanged from 2014.
Chart 4: Gap by Product Type

15
S i n g l e - Fa m i l y G u a r a n t e e F e e s
IV. Guarantee Fees by Risk Class
A. Loan Purpose
Chart 5 shows that the average fee for cash-out refinance loans increased by 3 basis points in
2015, reflecting the partial-year impact of the upfront fee increase implemented in September
2015.
Chart 5: Guarantee Fee by Loan Purpose
Chart 6 shows that gaps improved in 2015 for all three loan purpose categories. This reflects an
acquisition profile that was lower risk overall, with decreases in the average LTV ratio and
increases in the average credit score. The gaps, however, were still slightly negative for
purchase and rate-term refinance loans, reflecting expected returns slightly below the targeted
levels.

16
S i n g l e - Fa m i l y G u a r a n t e e F e e s
Chart 6: Gap by Loan Purpose
B. Loan-to-Value Ratio
Chart 7 shows that guarantee fees increased by 3 basis points in the 70.1-80 percent LTV
category. Loans with greater equity (LTV=<70%) had a 1 basis point increase in the average
charged fee. Among the loans with mortgage insurance, the 80.1-90 percent LTV category had
no change in the average fee, while loans above 90 percent LTV had a 1 basis point increase in
the average fee.

17
S i n g l e - Fa m i l y G u a r a n t e e F e e s
Chart 7: Guarantee Fee by Loan-to-Value Ratio
Chart 8 shows that in 2015, the Enterprises expected to earn more than their target rate of return
on loans with LTV ratios up to 70 percent, while they expected to earn below-target returns on
loans with LTV ratios greater than 80 percent. Loans in the 20 percent down payment category
(70.1-80% LTV) were expected to earn returns in-line with the target.
Chart 8: Gap by Loan-to-Value Ratio

18
S i n g l e - Fa m i l y G u a r a n t e e F e e s
C. Credit Score
Chart 9 shows that in 2015, guarantee fees increased by 12 basis points on average for loans with
credit scores below 660, rose a more modest 4 basis points for mid-range credit scores (660-
719), and increased by 1 basis point for the highest credit quality loans (720 or higher). Changes
in how Fannie Mae converts upfront fees into “annualized” ongoing fee equivalents drove the
large increases in the total guarantee fees reported (ongoing plus upfront fee) for the lower credit
quality categories. The upfront fees paid by a lender, and passed through to a borrower, do not
change when an Enterprise makes a change to its PVM calculations.16 The PVM is simply a
construct to annualize the upfront fee for reporting and analysis purposes.
Chart 9: Guarantee Fee by Credit Score
16 The Enterprises use their own PVM calculations to convert upfront fees into ongoing fee equivalents for reporting
and analysis. Lenders typically pass through upfront fees to borrowers through an increase in the yield quoted to a
borrower. Lenders use their own conversion multiple when determining how the interest rate should change to
offset the Enterprise upfront fee.

19
S i n g l e - Fa m i l y G u a r a n t e e F e e s
Chart 10 shows that in 2015 gaps improved in every credit score category. Expected returns
were still below the targeted levels for credit scores below 720. However, these loan categories
are still expected to generate positive returns for the Enterprises.
Chart 10: Gap by Credit Score
V. Guarantee Fees by Lender Volume
In an effort to manage market share the Enterprises traditionally provided a pricing discount to
lenders that delivered a larger volume of loans. However, FHFA has taken action to
substantially reduce or virtually eliminate the pricing disparity between lenders that deliver small
and large volumes of loans. In August 2012, FHFA directed each Enterprise to increase
guarantee fees by an average of 10 basis points. In implementing that fee increase, the ongoing
portion of the guarantee fee was raised more for lenders that exchange loans for MBS than for
lenders that sell loans for cash. This helped to reduce the pricing disparity between large and
small volume lenders because smaller lenders tend to sell loans for cash.

20
S i n g l e - Fa m i l y G u a r a n t e e F e e s
Table 4 shows the number of lenders by Enterprise. In 2015, there was an increase in the
number of lenders at Fannie Mae and a decrease at Freddie Mac. Table 5 shows the acquisition
share by lender volume group. For this analysis, FHFA created 5 lender groups by volume size:
the top 5 lenders for each Enterprise each year (XL), the next 10 lenders (L), the next 10 lenders
(M), the next 75 lenders (S), and all others (XS).17 Each year since FHFA implemented the
August 2012 pricing change, the share of acquisitions from the extra-large group has fallen.
Small and extra-small lenders accounted for 41 percent of the dollar value of Enterprise
acquisitions in 2015, up from 29 percent in 2011.
Table 4: Number of Lenders by Enterprise
Table 5: Acquisition Share by Lender Volume Group
Chart 11 shows that the fee difference between the largest and smallest lender volume groups
remained small in 2015 at one basis point.18
17 The groups at Fannie Mae and Freddie Mac may contain different lenders. For example, the XL Rank 1-5 means
the top 5 lenders for Fannie Mae and the top 5 lenders for Freddie Mac, based on each Enterprise’s acquisition
volume from a particular lender by year. Throughout the report, the combined Fannie Mae and Freddie Mac data
reflect fees weighted by the respective acquisition volumes.
18 Although the chart shows differences in the overall fees, a more detailed look at ongoing and upfront fees reflects
the same general finding that the large-small lender differences were modest.

21
S i n g l e - Fa m i l y G u a r a n t e e F e e s
Chart 11: Guarantee Fee by Lender Volume Group
Chart 12 shows that the largest and smallest lender volume groups had gaps in 2015 close to
zero, indicating that the Enterprises expect each of these groups, on average, to earn returns in-
line with their targeted level. However, before the FHFA directive in late 2012, the Enterprises
expected to earn higher returns from the smallest lender volume group. Gap analysis is useful
since it shows the risk-adjusted returns, while the fee analysis on each lender group does not take
into account risk attributes such as the product type, LTV ratio, or credit score.
Chart 12: Gap by Lender Volume Group