Children, Young People & Families forum 10 October 2013 Phil Mawhinney Community Action Southwark.
Chemistry 1111: Modern Chemistry I Laboratory Manual
Fall 2014 Edition
Instructor: R.C. Mawhinney Lab Instructor: Brad Miller Department of Chemistry
Faculty of Science and Environmental Studies DEPARTMENT OF
Chemistry
i
CHEMISTRY 1111 FA
LABORATORY MANUAL
CONTENTS LABORATORY SAFETY .............................................................................................................. ii
INTRODUCTION TO EXPERIMENTS ....................................................................................... iii
LABORATORY CARDS and EQUIPMENT BREAKAGE PRICE LIST ................................... iv
LABORATORY REPORTS ........................................................................................................... v
EXPERIMENTS: 1. Analytical Techniques: Accuracy and Precision via the Standardization of a Hydrochloric Acid Solution ....................................................................................................... 1 2. Elemental Semi-micro Qualitative Analysis ........................................................................... 10 3. Coordination Chemistry: Preparation and Analysis of Chromic Potassium Oxalate .............. 22 4. Spectroscopy and Qualitative Analysis in the Determination of an Unknown Zinc Salt ................................................................................................................................... 26 5. Organic Chemistry: Preparation and Purification of Acetaminophen ..................................... 31 APPENDIX A – Weighing, Volumetric equipment and techniques ............................................. 36
APPENDIX B – Propagation of experimental uncertainty in calculations ................................... 40
APPENDIX C – Equipment uncertainties ..................................................................................... 42
Plagiarism Certification ................................................................................................................. 43
The Periodic Table of Elements .................................................................................................... 44
R.C. Mawhinney S.D. Kinrade C.D. MacKinnon B. Miller Department of Chemistry Lakehead University Copyright © 2014

ii
LABORATORY SAFETY The practice of safety in the chemical laboratory results from an attitude of mind, and therefore requires the desire on the part of the individual to protect him/herself and associates. All accidents are caused and therefore can be prevented. This can be accomplished if laboratory safety is made an integral part of every activity. It is the object of the lab course to do just that. It is acknowledged that beginning chemistry students are largely unfamiliar with the potentials for injury that surround them, so your instructor will make every effort to point out and explain them to you. It is your responsibility as a student to prepare carefully for each experiment, and to understand and obey the safety rules listed below.
1. Adequate eye protection must be worn at all times (i.e., safety glasses). There is no exception to this rule. Prescription eye glasses are not sufficient; eye protection must be worn over prescription glasses. Safety glasses can be purchased at Chemistry Stores, CB2039, the university bookstore, or off-campus sites.
2. Proper clothing must be worn in the lab. Open-toed shoes, and any type of shoe that exposes the top of the foot (i.e. flats) must not be worn. Long hair must be tied back. Shorts and skirts are not to be worn to a laboratory period. Those doing so will not be permitted to complete the lab. A lab coat must be worn. Lab coats must be full length (to the knee) and buttoned up. Lab coats may be purchased through the Lakehead University Alumni Bookstore or from off-campus sources.
3. Eating, drinking, and smoking are not permitted in the lab.
4. Familiarize yourself with the positions and operation of the fire extinguishers, emergency shower and eye washes, and the location of the safety information poster and nearest exits.
5. All pipetting must be done with an appropriate device and NOT BY MOUTH.
6. Report ALL INJURIES OR ACCIDENTS, no matter how minor, to the instructor. Injuries may include, but are not limited to: cuts; burns; contact with corrosive liquids; inhalation of fumes; etc.
SENDING/RECEIVING PHONE CALLS, TEXT MESSAGES AND EMAILS IS NOT PERMITTED IN THE LABORATORY. ANY STUDENT DOING SO WILL BE ASKED TO LEAVE THE LABORATORY AND WILL RECEIVE A MARK OF ZERO FOR THAT EXPERIMENT PLEASE NOTE THAT BOTH PROPER EYE PROTECTION AND LABORATORY COATS ARE MANDATORY IN THE LAB. STUDENTS NOT WORKING IN A SAFE MANNER WILL BE ASKED TO LEAVE AND WILL RECEIVE A MARK OF ZERO FOR THAT EXPERIMENT. PRIOR TO ENTERING THE LAB, ALL STUDENTS MUST ADORN LAB SAFETY EQUIPMENT
iii
7. The eyewash areas (near the sinks) are to be kept clear of obstruction at all times.
8. Flammable solvents should not be flushed down the drains, with the exception of small volumes of certain solvents used in washing/drying small items of equipment.
9. Although you will not need them for the CHEM 1111 labs, gloves may be purchased from Chemistry Stores, CB2039. If you should come in contact with any chemicals, solvents, etc., WASH THE EXPOSED AREA IMMEDIATELY. Regardless of whether or not you are wearing gloves, always wash your hands when leaving.
10. Material Safety Data Sheets (MSDS) for the regularly used chemicals, as well as a short list of hazardous chemicals, are available in binders located by the fume hoods.
11. In case of EMERGENCY, call SECURITY at ext. 8911.
INTRODUCTION TO EXPERIMENTS 1. In order to obtain maximum benefit from your laboratory work, be prepared before
coming to the lab. This preparation includes careful reading and studying of the experiment itself and the background theory, as well as completion of the pre-lab assignment.
2. Each student will be responsible for a locker. The course will be considered complete only after the locker has been checked out at the end of the year.
3. Read all labels before using any chemicals! 4. Broken glass and sharp objects must be discarded in the BROKEN GLASS bin. There is a
separate sharps container for needles (which you won't use in CHEM 1111) 5. Try not to take more chemical than is required. In the event excess is taken, DO NOT
RETURN IT TO THE REAGENT CONTAINER. 6. Closely follow the instructions given with each experiment regarding the handling of waste.
DISPOSE OF ANY CHEMICALS AS INSTRUCTED. Ask the lab technician or T.A. for chemical disposal instructions if you are uncertain of what to do!
7. When water is required in an experiment, always use distilled water that can be obtained from the stainless steel faucets at the sinks near the fume hoods.
8. Never put anything hot or wet on the pan of a balance. 9. The balances must be left clean and tidy. Clean up spills immediately – if uncertain on how,
consult an instructor/demonstrator. Report any spills encountered, no matter how small. 10. Volumetric equipment, which is glassware designed to contain or deliver an accurate
volume at a specific temperature, should never be heated or used for hot solutions. See Appendix A for an explanation of the care and use of volumetric equipment.
11. The laboratory must be left as it was found – clean and tidy. Students are expected to clean up all spills and other messes as soon as they occur. Students must return all chemicals and equipment to their proper places before leaving the lab. Each student’s tidiness will be assessed.
12. DO NOT COME LATE. You will miss the pre-lab discussion. Students who miss this discussion will not be allowed to perform the experiment.
iv
13. If you are unable to attend your scheduled lab section and have a valid reason (e.g. medical/family emergency) you must contact Mr. Brad Miller as soon as possible to make alternate arrangements.
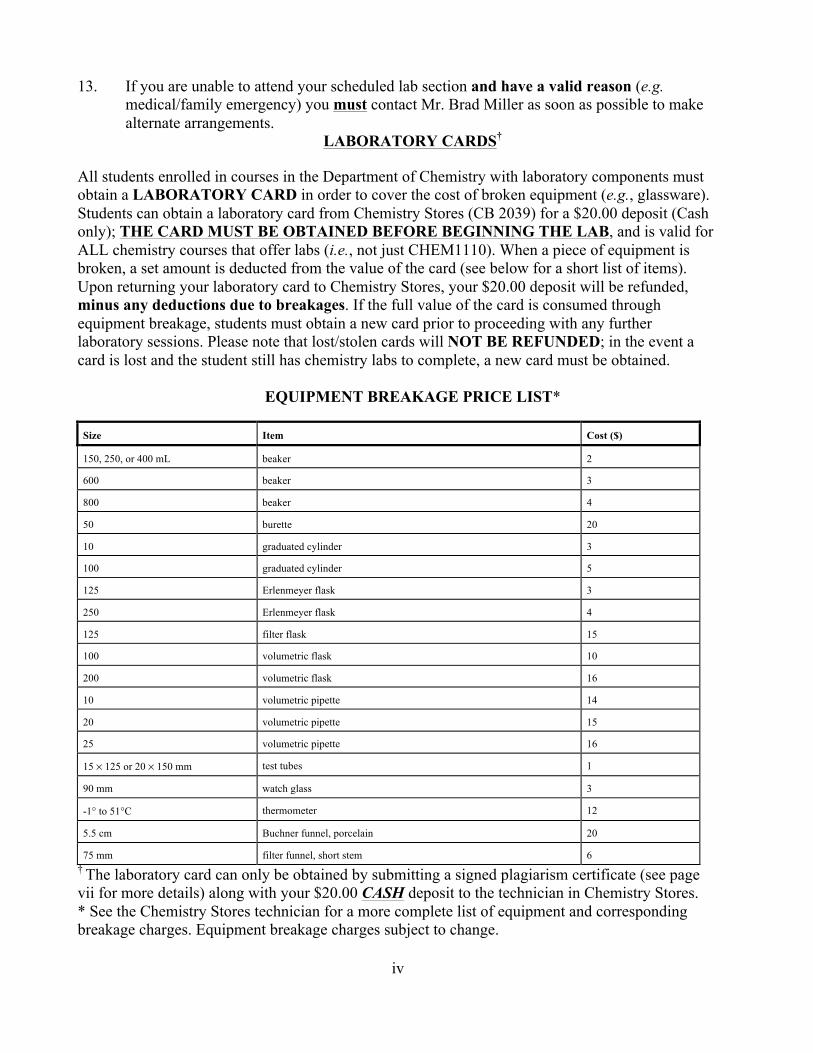
LABORATORY CARDS† All students enrolled in courses in the Department of Chemistry with laboratory components must obtain a LABORATORY CARD in order to cover the cost of broken equipment (e.g., glassware). Students can obtain a laboratory card from Chemistry Stores (CB 2039) for a $20.00 deposit (Cash only); THE CARD MUST BE OBTAINED BEFORE BEGINNING THE LAB, and is valid for ALL chemistry courses that offer labs (i.e., not just CHEM1110). When a piece of equipment is broken, a set amount is deducted from the value of the card (see below for a short list of items). Upon returning your laboratory card to Chemistry Stores, your $20.00 deposit will be refunded, minus any deductions due to breakages. If the full value of the card is consumed through equipment breakage, students must obtain a new card prior to proceeding with any further laboratory sessions. Please note that lost/stolen cards will NOT BE REFUNDED; in the event a card is lost and the student still has chemistry labs to complete, a new card must be obtained. EQUIPMENT BREAKAGE PRICE LIST*
Size Item Cost ($)
150, 250, or 400 mL beaker 2
600 beaker 3
800 beaker 4
50 burette 20
10 graduated cylinder 3
100 graduated cylinder 5
125 Erlenmeyer flask 3
250 Erlenmeyer flask 4
125 filter flask 15
100 volumetric flask 10
200 volumetric flask 16
10 volumetric pipette 14
20 volumetric pipette 15
25 volumetric pipette 16
15 × 125 or 20 × 150 mm test tubes 1
90 mm watch glass 3
-1° to 51°C thermometer 12
5.5 cm Buchner funnel, porcelain 20
75 mm filter funnel, short stem 6 † The laboratory card can only be obtained by submitting a signed plagiarism certificate (see page vii for more details) along with your $20.00 CASH deposit to the technician in Chemistry Stores. * See the Chemistry Stores technician for a more complete list of equipment and corresponding breakage charges. Equipment breakage charges subject to change.
v
LABORATORY REPORTS There are five experiments to perform in CHEM 1111. Experiment 3 must be written as a formal report (see 10, below). The remaining experiments are informal reports, so you have some flexibility in format, noting the following points:
1. All results and observations must be recorded in a BLUE HARD-BACK LAB BOOK WITH BOUND PAPER available in the bookstore. . Lab reports often require sample calculations, but a full record of all calculations, even repetitive ones, should be kept in your lab book.
2. PRE-LAB ASSIGNMENTS MUST BE HANDED IN UPON ENTERING THE LAB. It is suggested that you keep a copy for yourself, as it will not be returned before your lab report is due.
3. Before leaving the lab, you must have your results page signed by the instructor or teaching assistant. THIS SHEET MUST BE HANDED IN WITH YOUR LAB REPORT; otherwise your report will not be graded.
4. In cases where students work in pairs on an experiment, EACH student must submit a separate results sheet and an INDEPENDENTLY WRITTEN lab report.
5. Lab reports must be stapled together, bound in a “duo-tang” cover, or submitted in a lab notebook (i.e., not loose sheets of paper). The title page must contain the following:
• title of the experiment • student name and number, and the lab section (F1, F2, etc.) • if working in pairs, your partner’s name • date when the experiment was carried out • number of pages in the report
6. Each report must begin with an ABSTRACT (see 10(ii), below). Keep all answers and
calculations well-organized. Calculations must be thorough, indicating the major steps. 7. Reports are due BY 4:00 PM OF THE DAY ONE WEEK AFTER THE EXPERIMENT
WAS COMPLETED. Deposit in the appropriate slot in the cabinet outside of CB-2044. Late reports up to 24 hours after the original deadline will receive a -10% penalty; later reports receive a mark of 0. Students unable to hand in a report on time due to medical reasons must notify the instructor IN PERSON (not by phone or email) as soon as possible.
8. Plagiarized pre-labs or lab reports will be sent to the Dean of Science & Environmental
Studies for review and penalty assessment under the Code of Student Behaviour. See point 11 for further information. Lab instructors and T.A.s have full authority to make judgements in all cases of academic misconduct in the lab.
9. The four informal lab reports should follow this general format:
• a title page (see 5, above) and an abstract (see 10(ii), below) • a section containing all of the results obtained and/or observations made (see
10(v), below), along with all necessary calculations • a very brief discussion of your findings and any conclusions made • use any questions that may accompany the experiment as points for leading
vi
your discussion • the raw (signed) data sheet • type-written informal reports are preferred, but not strictly necessary
10. The formal lab report is a rationally organized, type-written account of your findings and
the conclusions that can be drawn from them. The following format is recommended: (i) TITLE PAGE (see 5, above) (ii) ABSTRACT: a concise summary (about 2 or 3 sentences) of the experiment and
significant results (e.g.,. important numbers, values, colours, etc.) and conclusions. (iii) INTRODUCTION: a very brief outline of the necessary theory including
references. Do not copy theory directly from any source material. (iv) EXPERIMENTAL METHOD: only include modifications to (or clarification of)
the procedure given in the lab manual which, in any case, must be referenced. This should be written in the past tense and use the passive voice.
(v) RESULTS: all experimental observations should be included. Data must be clearly
tabulated and include the appropriate units. Detailed sample calculations (which would clutter the main body of the report) should be included in an appendix and referenced appropriately (see 10(vii), below). Figures such as graphs must be neatly labeled and include a legend. Data points on graphs should be highlighted (e.g., with open circles, squares, etc.).
(vi) DISCUSSION: this section should include a clear presentation of the findings along
with a critical evaluation (i.e., compare your results with theoretical expectations or with values reported in the literature). In addition, you might suggest improvements to the procedure or note practical applications of the phenomenon under study. Use any questions that may accompany the experiment as points for leading your discussion
(vii) REFERENCES: in chemical literature, references are listed numerically in the order
they have been cited. Any accepted format for presenting references may be employed, but be consistent. Citations within the text are made using superscripted or bracketed numbers (e.g., “...Smith and Wesson4 have reported that...”; “...Ben and Jerry[24] have shown...”). If the citation occurs at the end of a paragraph or next to punctuation, make sure it comes after the punctuation. We encourage students to include the full references on a separate page at the end of the report, rather than as footnotes. Acceptable formats would be:
For a text, e.g.: Zumdahl, S. and Zumdahl, S. Chemistry (9th edition).
New York Houghton Mifflin, 2010, pp. 175-177. For a journal article, e.g.: Doe, J. Journal of Chemistry 2005, 34, 123-456.
vii
(i.e., author(s), then the journal name in italics, followed by the year in bold, followed by the volume in italics, followed by the page numbers). Wikipedia (and similar web sites) is NOT a reliable reference source and should NEVER be used. (they can be used to find primary information, however)
(viii) APPENDICES: include, for example, sample calculations and the raw (signed) data sheet.
For a more complete guide to undergraduate science writing, see: https://ugr.ue.ucsc.edu/sites/default/files/jyi_guide_to_scientific_writing.pdf
In particular, see part II, which gives advice on writing an abstract, introduction, discussion, and the presentation of Tables, Figures and Equations, especially on how to correctly prepare a caption.
11. Plagiarism is a serious academic offense. It may be understandable that, in the context of
writing and referencing works for a lab report, inadvertent plagiarism may occur; however, ignorance is not a valid defence! In order to prevent misunderstandings about what constitutes plagiarism, the Department of Chemistry has prepared a document that clearly defines plagiarism, giving several examples. Students will have to sign a Plagiarism Certification that verifies that they have read this material before they are allowed to start any experiments. See: http://www.chemistry.lakeheadu.ca.
1
EXPERIMENT #1
ANALYTICAL TECHNIQUES: ACCURACY AND PRECISION VIA THE STANDARDIZATION OF A HYDROCHLORIC ACID SOLUTION
Objectives A. To become familiar with the proper techniques for using the analytic balance, burette,
pipette and graduated cylinder. B. To be able to distinguish between accuracy and precision in experimental results, and to
determine the propagation of experimental uncertainty in calculations. Introduction (Zumdahl and Zumdahl, pp. 8-27 and pp. A10-A13) Uncertainty and Precision vs. Accuracy You will encounter two types of numbers in scientific research. Exact numbers are countable or have specifically defined values, e.g., this carton has 8 eggs, or there are exactly 1000 mg in a gram. These numbers will always be the same, regardless of the conditions. In contrast, numbers obtained through or derived from experimentation are sensitive towards the limitations in the equipment or instrumentation used (as well as the individual who collected the data!). In other words, experimentally measured or derived quantities always have some degree of uncertainty; they are inexact numbers. Thus, quantities measured using any measuring device must be reported along with its uncertainty. Generally, the last reported digit in the measured number has some degree of uncertainty associated with it. For example, the analytical balances used in this lab can be read to 0.0001 g, so all masses must be reported as, e.g., 1.2345 ± 0.0001 g. Similarly, 50 mL burettes can be read to 0.02 mL, so all burette readings must be reported as, e.g., 12.34 ± 0.02 mL. In doing so, you are indicating the uncertainty of the last digit in the measured quantity. The terms “precision” and “accuracy” are often used: precision is a measure of how closely individual measurements agree with one another, while accuracy refers to the degree of agreement between measured quantities and a “true” or “accepted” quantity (we’ll discuss this more later). Significant Figures A calculation using measured quantities is governed by the least accurate measurement used in the calculation (that is, it is the limiting measurement). For this reason, it is important to know the number of significant figures or digits of a measured quantity (an inexact number). Note: exact numbers are regarded as having an infinite number of significant figures (and so can be ignored when determining the number of significant figures in a calculation). In general, the greater the number of significant figures, the greater is the certainty implied for the measurement. Zeros are special digits because they may or may not be significant depending on how they appear in the number. More specifically, zeros may be used as part of the measured quantity, or they may be used to locate the position of a decimal point. In the former instance, the zero is significant, while in the latter, not significant. Consider the following rules: 1. Zeros between nonzero digits are significant, e.g., 401 g and 4.01 g (both have 3 significant
figures)
2
2. Zeros at the beginning of a number are never significant, and just provide the position of the decimal point, e.g., 0.0012 g (2 significant figures) and 0.0134 mL (3 significant figures)
3. Trailing zeros are always significant for digits after the decimal point in a number, e.g., 0.1200 g (4 significant figures; the two trailing zeros are significant)
4. Zeros that fall at the end of a number and after a decimal point are always significant, e.g., 7.00 g (3 significant figures)
5. Zeros that fall after a nonzero digit and before the decimal point, may or may not be significant. In general, they are not unless specified as such, e.g., 310 mL has 2 significant figures) but 310. mL (note the decimal!) would have 3 significant figures
In order to eliminate all confusion, it is best to write the number using base 10 exponential notation (also referred to as scientific notation). All digits (including zeros) are significant for a number written in exponential notation, e.g., 5.01 × 10⁴ mL (3 significant figures) vs. 5.0100 × 10⁴ mL (5 significant figures). When performing calculations, attention must always be paid towards significant figures. In working problems on a calculator, perform the calculation using all of the digits allowed by the calculator and round off at the end of the problem. The calculation rules for simple operations are:
1. When adding/subtracting, the number of decimal places in the answer must equal the number of decimal places in the number with the fewest places, e.g., 0.21 + 4.9 + 11.1124 = 16.2224 on a calculator, but should be reported as 16.2 (4.9 has only one decimal place)
2. When multiplying/dividing, the number of significant figures in the answer should be the same as that in the number with the fewest significant figures, e.g., 15.50 × 27.3 × 5.4 = 2285.01 on a calculator, but should be reported as 2300 (2.3 × 10³) (5.4 has only 2 significant figures)
Keep in mind that the line of numbers which appears on your calculator’s display after hitting the “=” button is a correct but un-rounded arithmetical calculation. For example, for the calculation:
0.1003 𝑔 𝑁𝑎!𝐶!𝑂!×1 𝑚𝑜𝑙 𝑁𝑎!𝐶!𝑂!
134.00 𝑔 𝑁𝑎!𝐶!𝑂!= 7.708955224×10!! 𝑚𝑜𝑙
The answer contains far more figures than are justified. The answer should be given to 4 significant figures, specifically 7.709 × 10⁻⁴ mol. Propagation of Experimental Uncertainty When experimental measurements are used in calculations, there is a propagation of experimental uncertainty that must be determined such that the final result of the calculation also includes the overall experimental uncertainty. Except for standard deviation calculations (see below), all experimental values and calculations based on them must include uncertainty limits. Sample calculations for the propagation of experimental uncertainty are given in Appendix B. The accuracy of a measurement refers to the agreement between the measured value and the true value. To determine accuracy, we calculate the difference between the true value (assuming it is known) and the average value from a series of measurements. The average (arithmetic mean) is given by:
3
Average = x =xi
0
n
∑n
(1)
where Σ is the operation of summation (i.e., the sum of the individual measurements), x is the average value, xi is the individual measurements, and n is the number of measurements. The accuracy would then be defined as:
Accuracy = x – true value (2) An accurate result is one that agrees closely with the true value (the smaller the difference, the greater the accuracy). This is sometimes called the mean error, and is reported in the same units as the measurement, e.g. if the true value is 2.62 g and x = 2.52 g, the accuracy would be -0.10 g. Many times errors are expressed in terms of a percentage. The percent error (or “relative error”) is the absolute value of the difference of the true value and the experimental (measured or mean) value, divided by the true value, and multiplied by 100:
Percent error = true value - experimental valuetrue value
×100 (3) Percent error = H 100 (3) Precision refers to the agreement between several measurements of the same quantity, i.e., the reproducibility of a given type of measurement, and is usually described in terms of the standard deviation, s, which is defined as follows:
𝑠 = xi!x !!!!!n-1
(4)
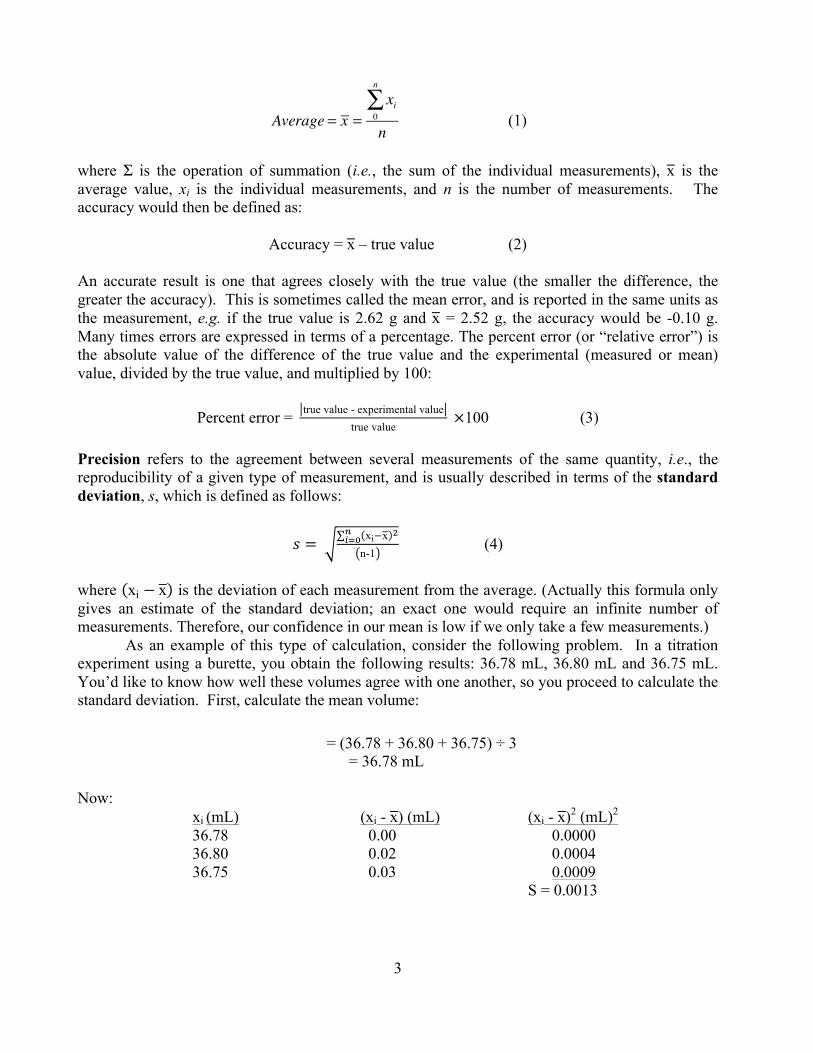
s = (4) where xi − x is the deviation of each measurement from the average. (Actually this formula only gives an estimate of the standard deviation; an exact one would require an infinite number of measurements. Therefore, our confidence in our mean is low if we only take a few measurements.) As an example of this type of calculation, consider the following problem. In a titration experiment using a burette, you obtain the following results: 36.78 mL, 36.80 mL and 36.75 mL. You’d like to know how well these volumes agree with one another, so you proceed to calculate the standard deviation. First, calculate the mean volume:
= (36.78 + 36.80 + 36.75) ÷ 3 = 36.78 mL Now:
xi (mL) (xi - x) (mL) (xi - x)2 (mL)2 36.78 0.00 0.0000 36.80 0.02 0.0004 36.75 0.03 0.0009 S = 0.0013
x

4
So:
s = 0.0013(3-1)
= 0.03
The mean volume would have a standard deviation of 0.03 mL, so we would write the answer as 36.78 mL ± 0.03 mL. The standard deviation calculation is an estimate of the random uncertainty in any given measurement. Note that this is not the same as the experimental uncertainty explained above (that is, uncertainties due to inherent limitations of the instrument or user, often referred to as systematic uncertainty). Generally speaking, for a large number of measurements, the probability that a given measurement will fall within ± s of the average value is 68% and there is a 99.7% probability that it will fall within ± 3s. Titration Titration is a technique used to determine the concentration of an unknown solution by reacting it completely with a solution of known concentration. Since the measurements consist of finding the volumes of solutions containing the same number of moles, it is commonly known as volumetric analysis. In this technique, a known volume of one solution (A), with a known concentration, is reacted with a known volume of another solution (B) of unknown concentration. If the reaction stoichiometry between A and B is known, and there is some means of establishing when the reaction is complete (normally by means of an indicator – a substance that changes colour when enough of A has been added to react with all of B; in an acid-base reaction this occurs at a specific pH), the concentration of solution B can be determined. The most common unit of concentration is molarity (M), which is defined as the number of moles of solute per litre of solution. Therefore, if the molarity is known, a certain volume (V) of the solution is equivalent to certain number of moles of solute:
M V = moles of solutelitre of solution
litres of solution = moles of solute For example, the concentration of an acid solution can be determined by neutralizing the hydronium ion (H3O+) with the required volume of a base solution of a known molarity according to the reaction: H3O+ (aq) + OH- (aq) ! 2 H2O (l) (5) In this experiment, you will determine the molarity of an HCl solution using a standardized (known molarity) NaOH solution. The HCl solution concentration will be determined two ways to compare the accuracy and precision of a graduated cylinder and a pipette. Let’s work out an example. Consult Appendix B and C at this point! You have a standardized solution of NaOH (aq) which has a concentration of 0.1000 ± 0.0002 M. Using a graduated cylinder, you measure out 10.2 ± 0.1 mL (the error associated with a graduated cylinder is ± 0.1 mL) of the HCl solution, and titrate it using the standard NaOH solution. Your initial burette reading was 10.88 ± 0.01 mL (for the purpose of this example, burettes are ± 0.01 mL) and after reaching the end point, the final burette reading was 20.97 ± 0.01 mL. The total volume of

5
NaOH solution used would be: (20.97 ± 0.01) - (10.88 ± 0.01) = 10.09 ± 0.02 mL We add the absolute uncertainties here (see Appendix B). The number of moles of NaOH (and thus OH–) would be calculated using equation (6) (note that relative uncertainties are added in the case of multiplication or division and then converted back to absolute uncertainties in the final result).
A×B ± A×B a!+ b
B (6)
Where: A = molarity of the NaOH solution a = the uncertainty associated with the NaOH solution B = volume of NaOH solution used to reach the endpoint b = the uncertainty associated with the volume of NaOH solution
moles of OH! = 0.1000 0.01009 ± 0.1000 0.010090.00020.1000+
0.0210.09
= (1.009 ± 0.004) × 10-3 mols OH- Since equation (5) tells us H+ and OH- reacts 1:1, there are (1.009 ± 0.004) × 10-3 mols of H+ in the solution we just titrated (note the uncertainty in the moles of OH– corresponds to the last decimal place reported). We now know the number of moles of H+ that was in our sample; we just need volume (remember, molarity = moles/volume). We know the volume of HCl solution titrated was 10.2 ± 0.1 mL. So, the (1.009 ± 0.004) × 10-3 mols of H+ must have been in the 10.2 ± 0.1 mL of HCl solution. We have moles and volume, so molarity is (we need to divide here):
𝐴𝐵 ±
𝐴𝐵
𝑎𝐴 +
𝑏𝐵
In this case: A = moles of H+ (or HCl) a = uncertainty associated with the moles of H+ (or HCl) B = volume of HCl solution b = uncertainty associated with the HCl solution
Molarity of HCl = 1.009 ×10!!
0.0102 ±1.009 ×10!!
0.01020.004 ×10!!
1.009 ×10!! +0.110.2
= 0.100 ± 0.001 M HCl So, our HCl solution has a concentration of 0.100 ± 0.001 M. Notice that our answer is uncertain beginning at the third decimal place, hence we have rounded to this precision (this also happens to be the correct number of significant figures in this example). Compare this with our NaOH solution concentration which was uncertain beginning at the fourth decimal place. This shouldn’t be

6
surprising since all of the numbers we used to calculate our acid concentration were uncertain, and these uncertainties were propagated to our final answer. Pre-Lab Assignment READ Appendix A, B, and C PRIOR TO STARTING THIS PRE-LAB 1. A group of students read the same burette prior to starting a titration and could not agree
amongst themselves what the burette read. Their burette readings were as follows (±0.02 mL): 22.38 mL, 22.37 mL, 22.35 mL and 22.36 mL. A lab demonstrator overheard their discussion and offered to read the burette as well. The lab demonstrator obtained a burette reading of 27.43 mL. Determine the mean and standard deviation, and comment (no calculations necessary) on the accuracy and precision of the student readings using the demonstrators’ value as the “true” reading.
2. A student titrated 10.00 ± 0.02 mL of an HCl solution with a standardized NaOH solution
(M = 0.1172 mol/L ± 0.0002 mol/L) using a phenolphthalein indicator. It required 11.78 ± 0.04 mL of NaOH to reach the endpoint. Calculate the molarity of the HCl solution and the associated uncertainty.
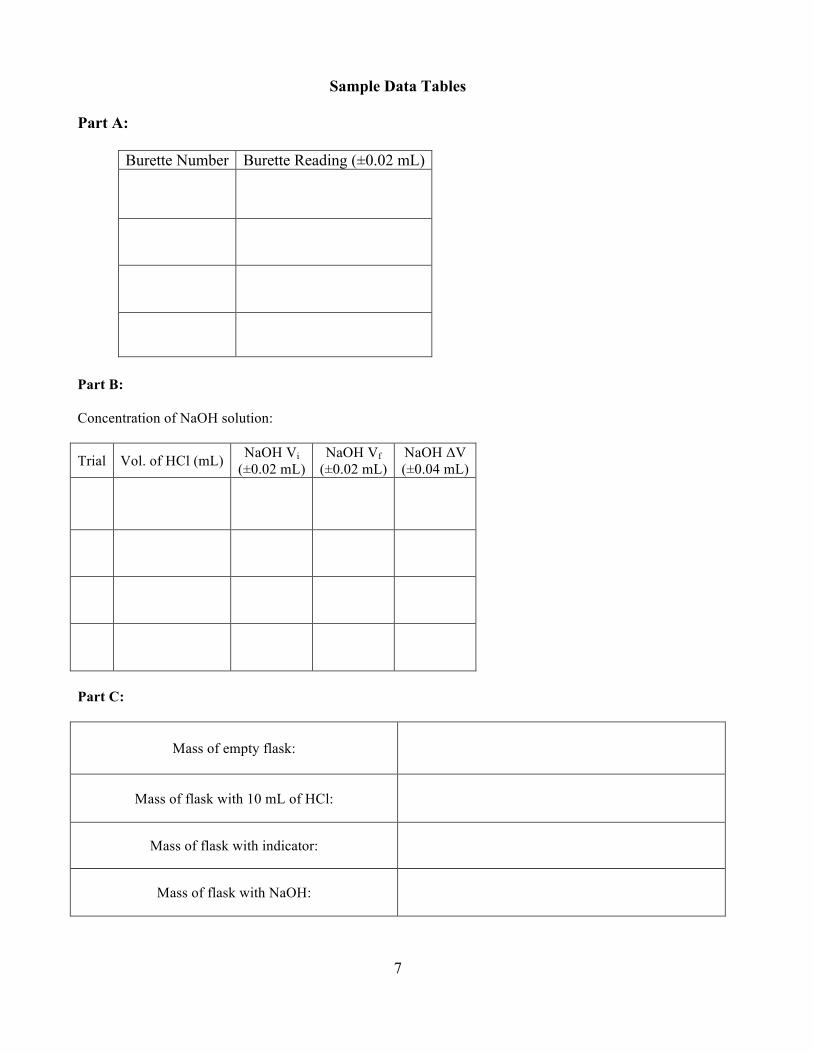
3. Prepare Tables in your lab book consistent with the sample tables given below.
7
Sample Data Tables Part A:
Burette Number Burette Reading (±0.02 mL)
Part B: Concentration of NaOH solution:
Trial Vol. of HCl (mL) NaOH Vi (±0.02 mL)
NaOH Vf (±0.02 mL)
NaOH ΔV (±0.04 mL)
Part C:
Mass of empty flask:
Mass of flask with 10 mL of HCl:
Mass of flask with indicator:
Mass of flask with NaOH:
8
Experimental Procedure A. Proper Technique to Read a Burette (done in pairs) On each bench are four sealed burettes containing water. Record the burette number and read and record the liquid level in each burette, such that there are 4 burette readings per group (see Appendix A for the correct method for reading a burette and meniscus). Ask the lab demonstrators to check your burette readings. YOU CANNOT START PART B WITHOUT HAVING YOUR READINGS CHECKED. B. Standardization of a Hydrochloric Acid Solution (done individually) (a) Obtain ~100 mL of both the standardized NaOH solution and the unknown molarity HCl
solution from the stock solutions provided (DO NOT RETURN EXCESS SOLUTIONS TO THE STOCK CONTAINERS, IT WILL CONTAMINATE THE STOCK SOLUTION).
(b) Fill the burette at your station with the NaOH solution. Open the stopcock fully to evacuate
any air pockets in the burette. It may be necessary to tap the burette lightly to aid in the removal of trapped air.
(c) Using a 10 mL graduated cylinder, transfer approximately exactly 10.0 mL (it need not be
exactly 10.0 mL [it can’t be greater than 10.0 mL] hence the phrase approximately, as long as you record the “exact” value) of the HCl solution to an Erlenmeyer flask and record the volume in your data table. Add 3 drops of the phenolphthalein indicator. In acidic media this indicator is colourless and in basic media it is pink.
(d) Prior to beginning this step, confer with a TA to ensure that your burette does not have any
air pockets in the jet. Record the initial burette reading (to X.XX mL ± 0.02 mL) in your data table. Begin the titration by adding the standardized NaOH solution to the flask until the solution turns a faint but permanent pink colour. This is the endpoint. Record the final burette reading to determine the amount of NaOH required to reach the endpoint. Empty the flask and repeat so that two titrations using the graduated cylinder are completed. For the second trial, obtain a volume of HCl that is as close as possible to the volume of HCl used in the first graduated cylinder trial.
(e) Repeat steps (c) and (d) using a 10.00 mL pipette (see appendix A, or a demonstrator, for
the proper technique) to deliver the 10.00 mL of HCl solution to the flask. C. Assessment of “true” concentration of Hydrochloric Acid (done individually) Weigh a 125 mL Erlenmeyer flask on the analytical balance and record its mass. Make sure you use a 125 mL Erlenmeyer flask; the 250 mL Erlenmeyer flask is too heavy for the analytical balance. Pipette 10 mL of the HCl solution into the flask and reweigh to determine the amount of
All waste solutions can be poured down the sink

9
HCl added. Add phenolphthalein indicator and reweigh to determine the amount of indicator added. Titrate with NaOH until the first trace of permanent pink colour appears. Weigh the flask again to determine the amount of NaOH required to reach the endpoint. You will use this data for question 4 of the report section to calculate your “true” value. Report Be sure to include uncertainties in your calculations. For Part A, report the burette readings from Part A along with the average reading and standard deviation in tabular format. Make sure to show your calculation of the average reading and standard deviation (be aware of significant figures). For Part B, in tabular format, report all burette readings, volumes of HCl solution delivered from the graduated cylinder and pipette, the molarity of unknow HCl solution for each trial, and the average molarity for the graduated cylinder and pipette trials. Make sure to show sample calculations for each unique calculation type. For Part C, in tabular format, report the masses of HCl and NaOH and the molarity of the HCl solution, assuming a density of exactly 1.00 g/mL for both NaOH and HCl solutions. Again, make sure to show your calculations. Use the molarity calculated in Part C as the true value, and the average molarities from the graduated cylinder and pipette trials as your experimental values to determine the percent error associated with each device. Discuss your findings; especially focus on which device was more accurate and whether this is expected.
10
Experiment #2
Elemental Semi-micro Qualitative Analysis
Objective:
1. Become familiar with some basic semi-micro techniques by observing reactions involving a series of cation and anion solutions.
2. Use this information to identify the constituents of an unknown inorganic salt(s).
Introduction
Being able to separate and identify mixtures of substances is a critical component to the development of a chemist. To that end, today’s experiment is designed to expose you to three of the primary types of chemical reactions: acid-base, precipitation and reduction-oxidation (redox). Acid-base reactions normally involve the transfer of protons from one species to another. Precipitation reactions involve the formation of a solid upon the addition of atoms/ions that exchange partners (sometimes call a double displacement reaction). Finally, a redox reaction involves the transfer of electrons generating oxidized and reduced species. Becoming familiar with these types of reactions will enable you to separate and identify the components of a mixture of inorganic salts.
As you progress through this experiment you will probably ask yourself: “why do I keep adding acids and bases to the same solution?” The reason for this is that by altering the pH (hydrogen ion concentration) of your solution you can induce precipitation of an ion upon the addition of a specific reagent while leaving other ions in solution. As an example, the first step of the separation scheme involves the addition of thioacetamide (a source of sulphide) to a basic ammonia solution. If all of the possible cations were in solution you would precipitate Ni, Mn, Fe, Cr and Al while leaving Ba, Ca, Mg and ammonium in solution. If you then take the precipitate and treat it with HCl (making the solution acidic) you would dissolve the hydroxide and sulphide salts of Mn, Fe, Cr, and Al, but, not Ni (NiS is sparingly soluble in HCl solution) thus allowing you to isolate nickel from the mixture. So, manipulating the pH of the solution can be an excellent aid in separating a mixture of inorganic salts. Of course this only works if you take great care with your manipulations to avoid any kind of cross contamination. You don’t want to generate a false positive due to contamination so always make sure your glassware is clean and always use a fresh pasteur pipette.
It is very important that you pay close attention as you are manipulating your samples. Be sure to make detailed observations of the behaviour of the solution (i.e. colour change, gas evolution etc.) and the precipitate (i.e. colour, appearance (wispy, chunky, floccy) etc.) as this will aid you in your determinations. The first step in this experiment is to conduct reactions on standard solutions of the various cations and anions. This will allow you to know what an individual positive tests look like. You will then move on to isolating and identifying the components of your unknown salt mixture.

11
It can be helpful to know the appearance of precipitates that are formed from the group reagents used in separating the cations into their three major divisions. As you progress through the analysis be aware of the colours of the group precipitates:
Precipitate of:
Cation Hydroxide Sulphide
Al(III) White Yellow-grey
Cr(III) Blue-green Brown-black
Fe(III) Red-brown Black
Ni(II) Green to grey Black
Mn(II) Black Red-pink

12
Data Sheet (To be finished by the student) Standard Cation Tests Cation Reagent(s) added Observation Conclusion
Ni(II) 2 drops NH4OH, 3 drops dimethylglyoxime
Mn(II) 5 drops 6 M HNO3, pinch of NaBiO3
Fe(III) 5 drops 6 M HCl, one drop of K4Fe(CN)6
Cr(III) 6 drops of …
Mg(II)

13
Standard Anion Tests
Anion Reagent(s) added Observation Conclusion

14
Unknown Salt Analysis
15
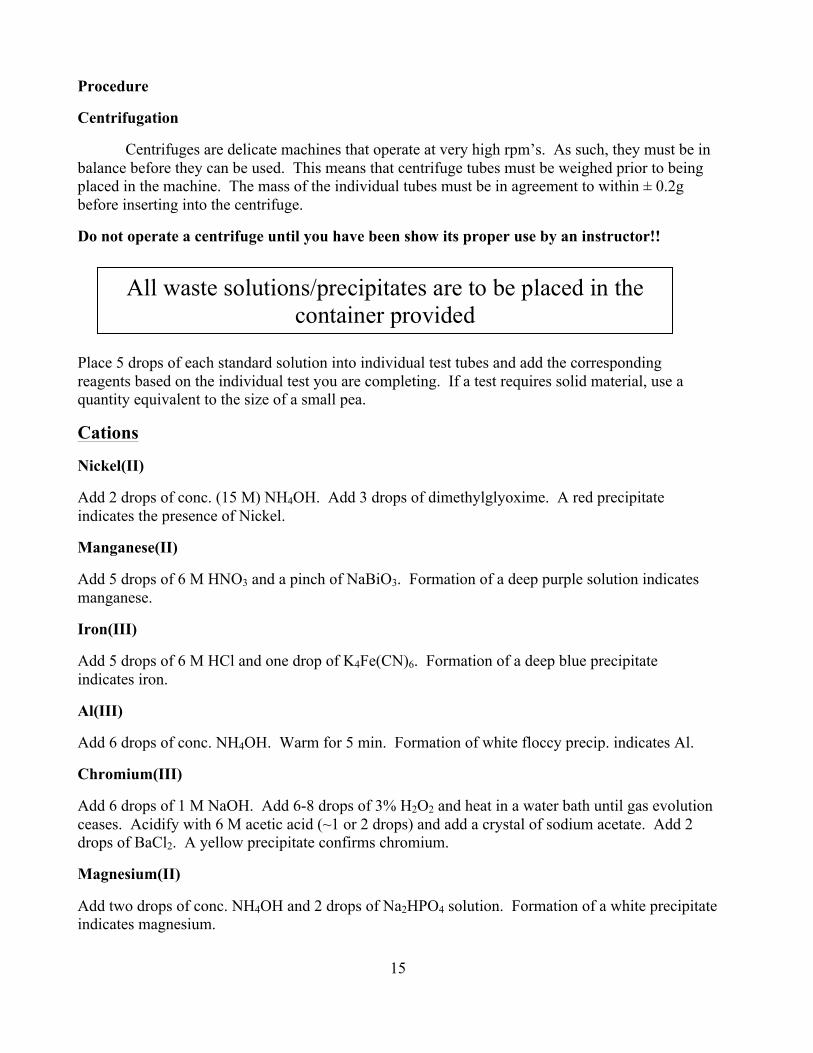
Procedure
Centrifugation
Centrifuges are delicate machines that operate at very high rpm’s. As such, they must be in balance before they can be used. This means that centrifuge tubes must be weighed prior to being placed in the machine. The mass of the individual tubes must be in agreement to within ± 0.2g before inserting into the centrifuge.
Do not operate a centrifuge until you have been show its proper use by an instructor!!
Place 5 drops of each standard solution into individual test tubes and add the corresponding reagents based on the individual test you are completing. If a test requires solid material, use a quantity equivalent to the size of a small pea.
Cations
Nickel(II)
Add 2 drops of conc. (15 M) NH4OH. Add 3 drops of dimethylglyoxime. A red precipitate indicates the presence of Nickel.
Manganese(II)
Add 5 drops of 6 M HNO3 and a pinch of NaBiO3. Formation of a deep purple solution indicates manganese.
Iron(III)
Add 5 drops of 6 M HCl and one drop of K4Fe(CN)6. Formation of a deep blue precipitate indicates iron.
Al(III)
Add 6 drops of conc. NH4OH. Warm for 5 min. Formation of white floccy precip. indicates Al.
Chromium(III)
Add 6 drops of 1 M NaOH. Add 6-8 drops of 3% H2O2 and heat in a water bath until gas evolution ceases. Acidify with 6 M acetic acid (~1 or 2 drops) and add a crystal of sodium acetate. Add 2 drops of BaCl2. A yellow precipitate confirms chromium.
Magnesium(II)
Add two drops of conc. NH4OH and 2 drops of Na2HPO4 solution. Formation of a white precipitate indicates magnesium.
All waste solutions/precipitates are to be placed in the container provided

16
Calcium(II)
Add two drops NH4Cl and 2 drops 6 M NH4OH. Add three drops of (NH4)2CO3 and warm with periodic stirring. White precipitate indicates calcium.
Barium(II)
Add two drops of 6 M acetic acid followed by 5 drops of water. Add 4 drops K2CrO4. Yellow precipitate indicates Barium.
Ammonium
Take a small amount of ammonium nitrate (size of a pea) and place in a test tube. Add about 1 mL (~ 20 drops) of 1 M NaOH. Place a moistened strip of red litmus paper over the lip of the test tube and warm. A uniform blue colour appearing on the moistened litmus paper is a positive test for ammonium.
Anions
Carbonate
Take about the same amount of solid sodium carbonate as you did for the ammonium test and place in a test tube. Add about 10 drops of 1 M HCl. Gas evolution indicates the presence of carbonate.
Chloride and Bromide. Add 3 drops of 6 M HNO3 and shake well. Add 5 drops of 0.1 M AgNO3 and mix well. A precipitate indicates a positive test for chloride or bromide has occurred.
To determine if you have the chloride or bromide anion add 10 drops of 6 M NH4OH, DO NOT MIX!!. If there are two distinct layers, with a discernible phase boundary, then the chloride anion is present. If the solution did not appear to change then the bromide anion is present.
Sulfate. Add 3 drops of 6 M HNO3 and mix. Add 5 drops of 0.1 M BaCl2. The formation of a white precipitate indicates the presence of SO4
2-.
Iodide. Add 3 drops of 6 M HNO3 and shake well. Add 10 drops of sodium hypochlorite (NaOCl). The appearance of a dark brown/black precipitate indicates the presence of iodide. Acetate. Place a small amount of the solid salt (~ the size of a pea) into a test tube. Add 10 drops of concentrated H2SO4 (CARE!!!) and 10 drops of 1-pentanol; mix with a glass stirring rod. Warm in a water bath for about 5 minutes, remove, and check for a fruity odour (it often reminds people of

17
fake banana smell) indicating the presence of the acetate ion. If you are unable to perceive the aroma you can transfer the solution to a watch glass to increase the surface area which should help to pick up the aroma.
Now that you have a feel for what the positive tests look like, combine 3 or 4 of the cation solutions (~ 5 drops of each one) and attempt to separate them based on the scheme that will be used for your unknown salt mixture.
Scheme for the separation and identification of an unknown salt mixture
Note: your salt mixture will contain a combination of some of the following cations and anions:
Cations:
Group III: Ni(II), Mn(II), Al(III), Fe(III), Cr(III)
Group IV: Ca(II), Ba(II)
Group V: Mg(II), NH4+ (ammonium)
Anions: CO32-, Cl-, Br-, I-, SO4
2- and CH3COO- (acetate).
Analysis for Cations
The first step to being able to separate a salt mixture is to find a suitable solvent that will dissolve your salt(s). To accomplish this, take a small portion (about the size of a small pea) in a test tube and add the solvents listed below. If it doesn’t dissolve, warm it (water bath). If it still hasn’t dissolved, discard and repeat with the next solvent.
• ~ 20 drops of distilled water • ~ 20 drops of 1 M HCl • ~ 10 drops conc. HCl • ~ 10 drops of conc. HCl then dilute with 20 drops of water
NOTES:
• precip. = precipitate • cfg. = centrifuge. • Warm = place in warm water bath • Cool = place in ice-water slurry • Conc. HCl = ~12 mol•L-1
• Wash = rinse precip. with 2×1 mL distilled water (you may have to cfg. in between washings)
• Conc. = concentrated • Conc. NH4OH = ~ 14.5 mol•L-1
Proceed sequentially completing each test prior to moving on to the next reaction in the analysis. As you progress through the analysis, be aware of how much acid and base you are adding when you are making your solution acidic or basic. This will make it much easier to know approximately how much acid/base is required to make your solution acidic or basic in the next step of the
18
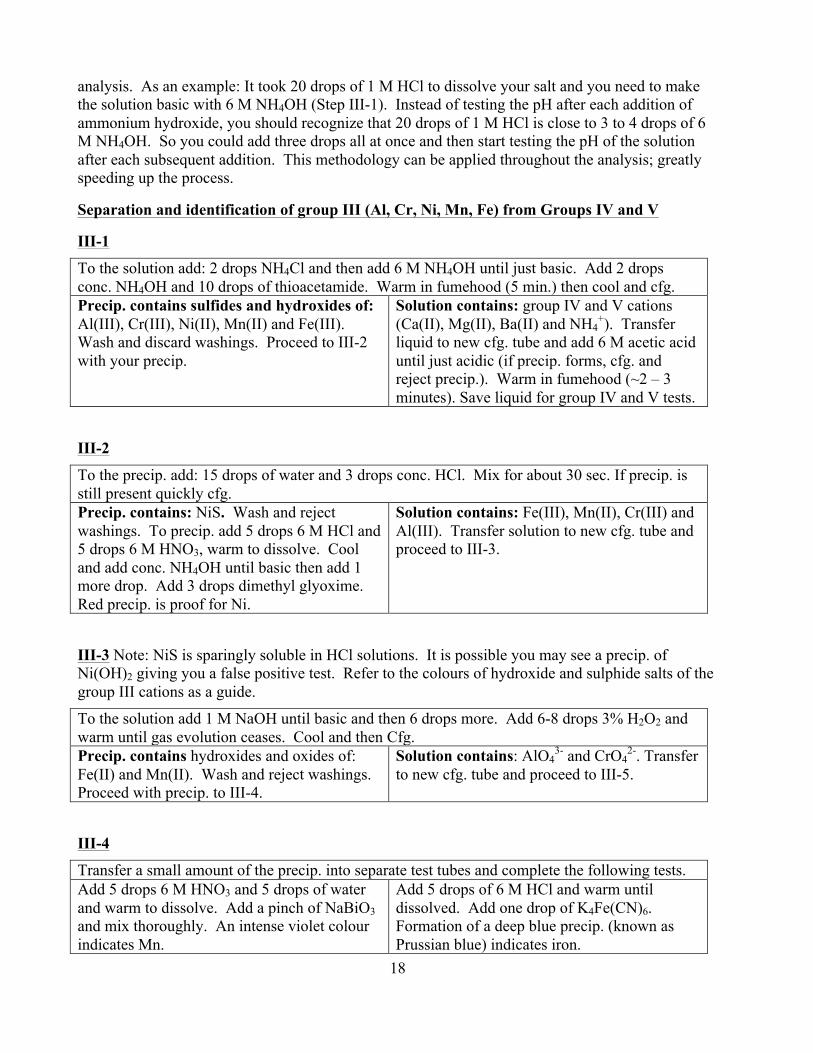
analysis. As an example: It took 20 drops of 1 M HCl to dissolve your salt and you need to make the solution basic with 6 M NH4OH (Step III-1). Instead of testing the pH after each addition of ammonium hydroxide, you should recognize that 20 drops of 1 M HCl is close to 3 to 4 drops of 6 M NH4OH. So you could add three drops all at once and then start testing the pH of the solution after each subsequent addition. This methodology can be applied throughout the analysis; greatly speeding up the process.
Separation and identification of group III (Al, Cr, Ni, Mn, Fe) from Groups IV and V
III-1
To the solution add: 2 drops NH4Cl and then add 6 M NH4OH until just basic. Add 2 drops conc. NH4OH and 10 drops of thioacetamide. Warm in fumehood (5 min.) then cool and cfg. Precip. contains sulfides and hydroxides of: Al(III), Cr(III), Ni(II), Mn(II) and Fe(III). Wash and discard washings. Proceed to III-2 with your precip.
Solution contains: group IV and V cations (Ca(II), Mg(II), Ba(II) and NH4
+). Transfer liquid to new cfg. tube and add 6 M acetic acid until just acidic (if precip. forms, cfg. and reject precip.). Warm in fumehood (~2 – 3 minutes). Save liquid for group IV and V tests.
III-2
To the precip. add: 15 drops of water and 3 drops conc. HCl. Mix for about 30 sec. If precip. is still present quickly cfg. Precip. contains: NiS. Wash and reject washings. To precip. add 5 drops 6 M HCl and 5 drops 6 M HNO3, warm to dissolve. Cool and add conc. NH4OH until basic then add 1 more drop. Add 3 drops dimethyl glyoxime. Red precip. is proof for Ni.
Solution contains: Fe(III), Mn(II), Cr(III) and Al(III). Transfer solution to new cfg. tube and proceed to III-3.
III-3 Note: NiS is sparingly soluble in HCl solutions. It is possible you may see a precip. of Ni(OH)2 giving you a false positive test. Refer to the colours of hydroxide and sulphide salts of the group III cations as a guide.
To the solution add 1 M NaOH until basic and then 6 drops more. Add 6-8 drops 3% H2O2 and warm until gas evolution ceases. Cool and then Cfg. Precip. contains hydroxides and oxides of: Fe(II) and Mn(II). Wash and reject washings. Proceed with precip. to III-4.
Solution contains: AlO43- and CrO4
2-. Transfer to new cfg. tube and proceed to III-5.
III-4
Transfer a small amount of the precip. into separate test tubes and complete the following tests. Add 5 drops 6 M HNO3 and 5 drops of water and warm to dissolve. Add a pinch of NaBiO3 and mix thoroughly. An intense violet colour indicates Mn.
Add 5 drops of 6 M HCl and warm until dissolved. Add one drop of K4Fe(CN)6. Formation of a deep blue precip. (known as Prussian blue) indicates iron.
19
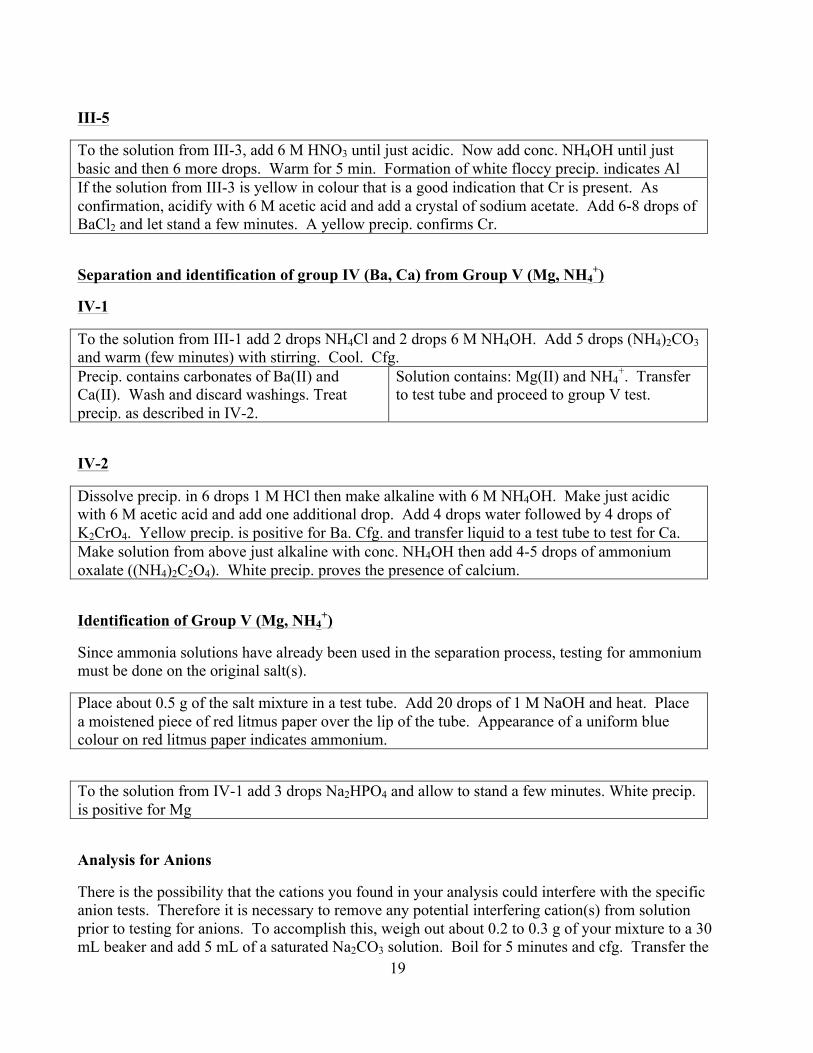
III-5
To the solution from III-3, add 6 M HNO3 until just acidic. Now add conc. NH4OH until just basic and then 6 more drops. Warm for 5 min. Formation of white floccy precip. indicates Al If the solution from III-3 is yellow in colour that is a good indication that Cr is present. As confirmation, acidify with 6 M acetic acid and add a crystal of sodium acetate. Add 6-8 drops of BaCl2 and let stand a few minutes. A yellow precip. confirms Cr.
Separation and identification of group IV (Ba, Ca) from Group V (Mg, NH4+)
IV-1
To the solution from III-1 add 2 drops NH4Cl and 2 drops 6 M NH4OH. Add 5 drops (NH4)2CO3 and warm (few minutes) with stirring. Cool. Cfg. Precip. contains carbonates of Ba(II) and Ca(II). Wash and discard washings. Treat precip. as described in IV-2.
Solution contains: Mg(II) and NH4+. Transfer
to test tube and proceed to group V test.
IV-2
Dissolve precip. in 6 drops 1 M HCl then make alkaline with 6 M NH4OH. Make just acidic with 6 M acetic acid and add one additional drop. Add 4 drops water followed by 4 drops of K2CrO4. Yellow precip. is positive for Ba. Cfg. and transfer liquid to a test tube to test for Ca. Make solution from above just alkaline with conc. NH4OH then add 4-5 drops of ammonium oxalate ((NH4)2C2O4). White precip. proves the presence of calcium.
Identification of Group V (Mg, NH4+)
Since ammonia solutions have already been used in the separation process, testing for ammonium must be done on the original salt(s).
Place about 0.5 g of the salt mixture in a test tube. Add 20 drops of 1 M NaOH and heat. Place a moistened piece of red litmus paper over the lip of the tube. Appearance of a uniform blue colour on red litmus paper indicates ammonium.
To the solution from IV-1 add 3 drops Na2HPO4 and allow to stand a few minutes. White precip. is positive for Mg
Analysis for Anions
There is the possibility that the cations you found in your analysis could interfere with the specific anion tests. Therefore it is necessary to remove any potential interfering cation(s) from solution prior to testing for anions. To accomplish this, weigh out about 0.2 to 0.3 g of your mixture to a 30 mL beaker and add 5 mL of a saturated Na2CO3 solution. Boil for 5 minutes and cfg. Transfer the

20
solution back into your beaker and treat with 6 M HNO3 and warm until gas evolution ceases. Use this solution for your anions tests (page 16).‡
‡ NOTE: The tests for carbonate and acetate must be completed on the original sample. Use an amount equivalent to the size of a small pea.
21
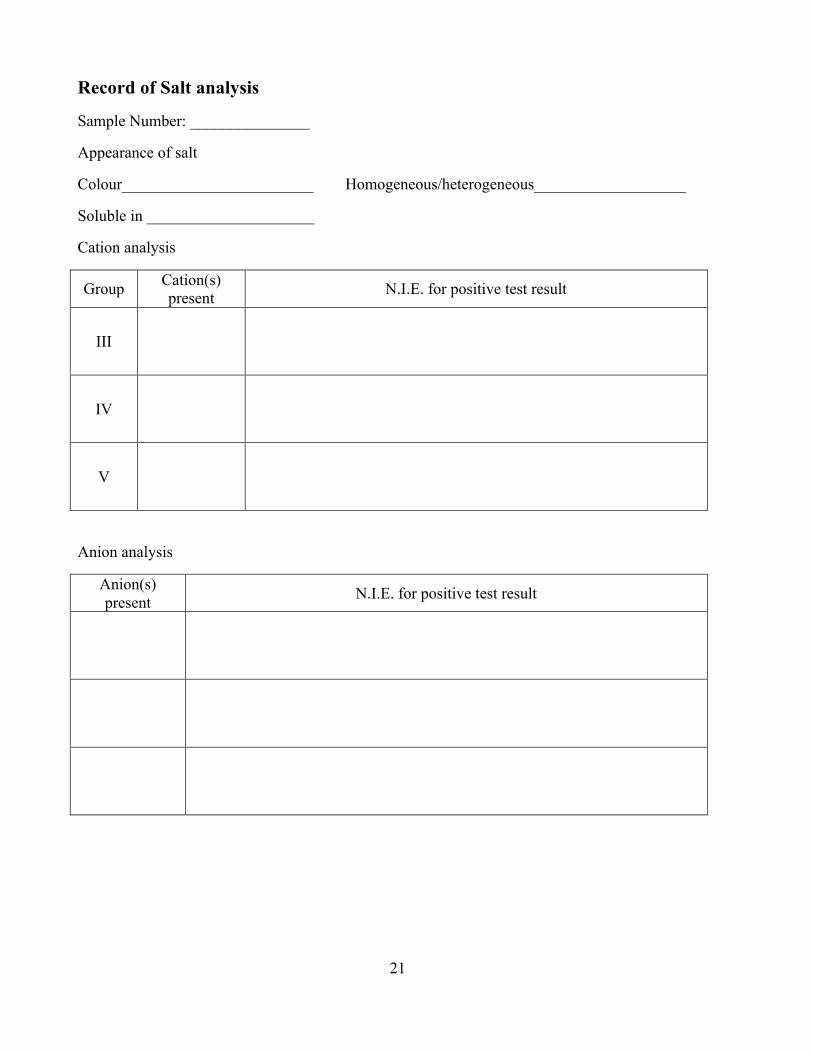
Record of Salt analysis
Sample Number: _______________
Appearance of salt
Colour________________________ Homogeneous/heterogeneous___________________
Soluble in _____________________
Cation analysis
Group Cation(s) present N.I.E. for positive test result
III
IV
V
Anion analysis
Anion(s) present N.I.E. for positive test result
22
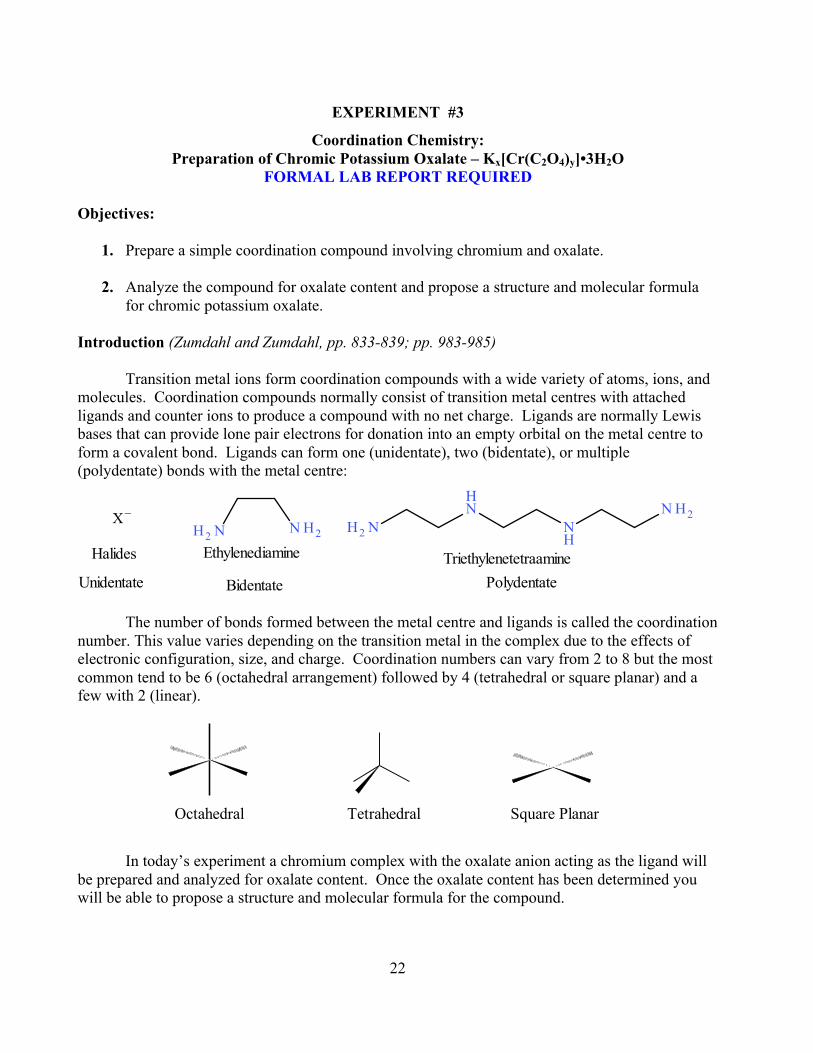
EXPERIMENT #3
Coordination Chemistry: Preparation of Chromic Potassium Oxalate – Kx[Cr(C2O4)y]•3H2O
FORMAL LAB REPORT REQUIRED Objectives:
1. Prepare a simple coordination compound involving chromium and oxalate.
2. Analyze the compound for oxalate content and propose a structure and molecular formula for chromic potassium oxalate.
Introduction (Zumdahl and Zumdahl, pp. 833-839; pp. 983-985) Transition metal ions form coordination compounds with a wide variety of atoms, ions, and molecules. Coordination compounds normally consist of transition metal centres with attached ligands and counter ions to produce a compound with no net charge. Ligands are normally Lewis bases that can provide lone pair electrons for donation into an empty orbital on the metal centre to form a covalent bond. Ligands can form one (unidentate), two (bidentate), or multiple (polydentate) bonds with the metal centre:
Halides
Unidentate
Ethylenediamine
Bidentate
TriethylenetetraaminePolydentate
The number of bonds formed between the metal centre and ligands is called the coordination number. This value varies depending on the transition metal in the complex due to the effects of electronic configuration, size, and charge. Coordination numbers can vary from 2 to 8 but the most common tend to be 6 (octahedral arrangement) followed by 4 (tetrahedral or square planar) and a few with 2 (linear).
Octahedral Tetrahedral Square Planar
In today’s experiment a chromium complex with the oxalate anion acting as the ligand will be prepared and analyzed for oxalate content. Once the oxalate content has been determined you will be able to propose a structure and molecular formula for the compound.

23
Pre-Lab Assignment
1. Prepare a data sheet for today’s experiment (you may wish to review the data sheet from experiment #1).
2. Define: a) Lewis acid b) Lewis base c) ligand
3. A 1.356 g ore sample containing copper(II) is digested, filtered and diluted to 100 mL in a volumetric flask. A 20 mL sample is treated with excess I-. The liberated triiodide (I3
-) is then titrated with a 0.100 M sodium thiosulphate (Na2S2O3) solution requiring 21.35 mL to reach the endpoint. Using the following balanced reactions, determine the moles of copper in:
a. 20 mL sample b. 100 mL volumetric flask c. 1.356 g ore sample
2Cu2+ (aq) + 5I- (aq) ! 2CuI (s) + I3
- (aq)
I3- (aq) + 2S2O3
2- (aq) ! 3I- (aq) + S4O62- (aq)
Procedure: Preparation of Chromic Potassium Oxalate (RECORD!!! all weighing’s)
1. Using one of the available top loading balances, weigh out ~ 2 g of oxalic acid into a 150 mL beaker, add 20 mL of distilled water and a stir bar. Slowly add ~ 0.7 g of K2Cr2O7 to the oxalic acid suspension, cover with a watch glass, and stir for about 15 minutes. (This reaction is quite vigorous and the solution may warm up almost to boiling)
2. The solution should now be green/black in colour. Add 1 g of potassium oxalate monohydrate to the solution while placing a watch glass on top of the beaker; bring to a boil. Keep the solution at a boil for 10 minutes and then allow the contents of the beaker to come back to room temperature. Add 10 mL of 95% ethanol, with stirring, and place the cooled solution on ice for 20 minutes, mixing occasionally. Over time, the solution should thicken with crystals.
3. Pre-weigh a watch glass. After cooling, filter the product using a Büchner funnel (consult your instructor for assistance). Rinse the product with three additions of 10 mL 50% (v/v) aqueous ethanol (not 95% ethanol). Complete a final rinse by adding 25 mL of 95% ethanol and leave the aspirator running for a few minutes. Carefully transfer the product to your pre-weighed watch glass and leave it in your locker to dry until the next laboratory period.
All waste solutions are to be placed in the provided container(s) Solid chromium waste is to be placed in the container provided
24
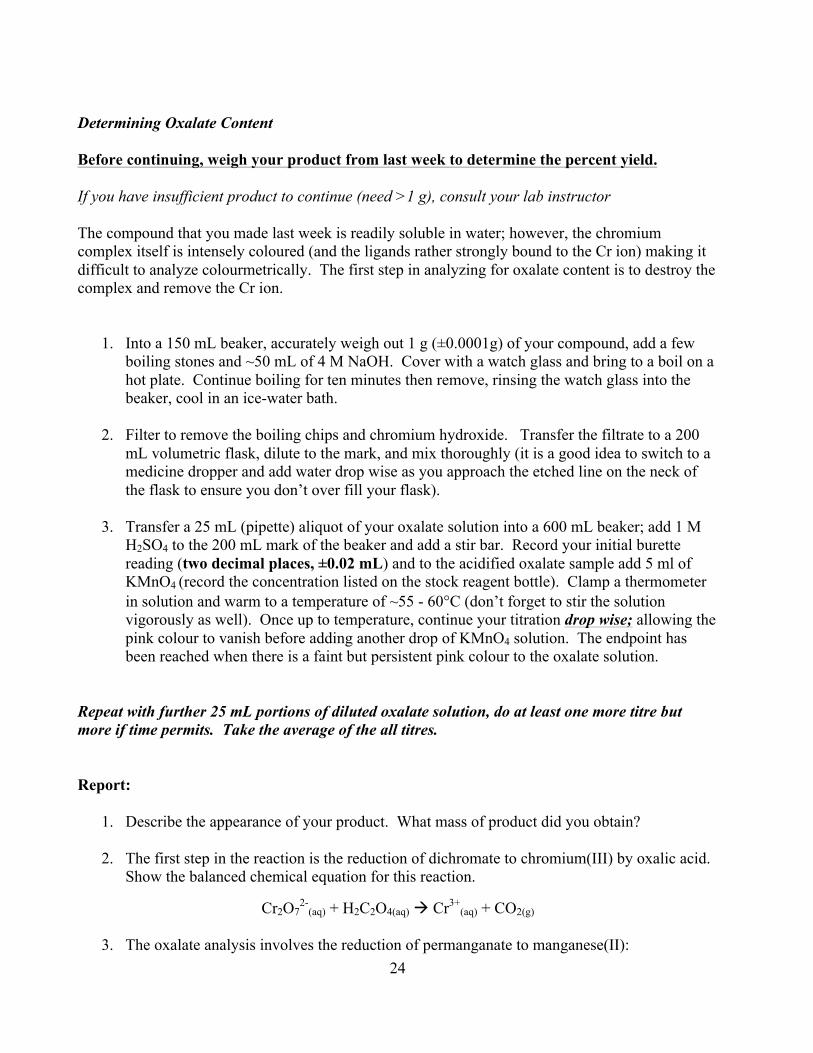
Determining Oxalate Content Before continuing, weigh your product from last week to determine the percent yield. If you have insufficient product to continue (need >1 g), consult your lab instructor
The compound that you made last week is readily soluble in water; however, the chromium complex itself is intensely coloured (and the ligands rather strongly bound to the Cr ion) making it difficult to analyze colourmetrically. The first step in analyzing for oxalate content is to destroy the complex and remove the Cr ion.
1. Into a 150 mL beaker, accurately weigh out 1 g (±0.0001g) of your compound, add a few boiling stones and ~50 mL of 4 M NaOH. Cover with a watch glass and bring to a boil on a hot plate. Continue boiling for ten minutes then remove, rinsing the watch glass into the beaker, cool in an ice-water bath.
2. Filter to remove the boiling chips and chromium hydroxide. Transfer the filtrate to a 200
mL volumetric flask, dilute to the mark, and mix thoroughly (it is a good idea to switch to a medicine dropper and add water drop wise as you approach the etched line on the neck of the flask to ensure you don’t over fill your flask).
3. Transfer a 25 mL (pipette) aliquot of your oxalate solution into a 600 mL beaker; add 1 M H2SO4 to the 200 mL mark of the beaker and add a stir bar. Record your initial burette reading (two decimal places, ±0.02 mL) and to the acidified oxalate sample add 5 ml of KMnO4 (record the concentration listed on the stock reagent bottle). Clamp a thermometer in solution and warm to a temperature of ~55 - 60°C (don’t forget to stir the solution vigorously as well). Once up to temperature, continue your titration drop wise; allowing the pink colour to vanish before adding another drop of KMnO4 solution. The endpoint has been reached when there is a faint but persistent pink colour to the oxalate solution.
Repeat with further 25 mL portions of diluted oxalate solution, do at least one more titre but more if time permits. Take the average of the all titres. Report:
1. Describe the appearance of your product. What mass of product did you obtain?
2. The first step in the reaction is the reduction of dichromate to chromium(III) by oxalic acid. Show the balanced chemical equation for this reaction.
Cr2O72-
(aq) + H2C2O4(aq) ! Cr3+(aq) + CO2(g)
3. The oxalate analysis involves the reduction of permanganate to manganese(II):

25
MnO4-(aq) + C2O4
2-(aq) ! Mn2+
(aq) + CO2(g)
Give a balanced chemical equation for this reaction under acidic conditions.
4. Using your balanced chemical equation, determine the moles of oxalate in: i. Your 25 mL sample of dilute oxalate
ii. The 200 mL volumetric flask iii. Mass of complex
5. Based on your answer for 4iii, and the product having a molecular weight of 487.35 g•mol-1,
propose a structure for the chromium oxalate complex and the molecular formula for chromic potassium oxalate. Note: the complex will have an octahedral (i.e. six coordinate) arrangement with water at empty coordinate sites. As an example, if you found the oxalate-chromium ratio to be 1:1 there would be 4 water molecules involved in the complex.
6. Based on the amount of potassium dichromate measured out, what is the theoretical mass of product that could be obtained from this reaction, assuming 100% conversion?
7. What is the percent yield for this reaction? Where percent yield is defined as:
% 𝑦𝑖𝑒𝑙𝑑 = 𝑎𝑐𝑡𝑢𝑎𝑙 𝑦𝑖𝑒𝑙𝑑 𝑖𝑛 𝑔𝑟𝑎𝑚𝑠
𝑡ℎ𝑒𝑜𝑟𝑒𝑡𝑖𝑐𝑎𝑙 𝑦𝑖𝑒𝑙𝑑 𝑖𝑛 𝑔𝑟𝑎𝑚𝑠 𝑋 100
26
EXPERIMENT #4
SPECTROSCOPY AND QUALITATIVE ANALYSIS IN THE DETERMINATION OF AN UNKNOWN ZINC SALT
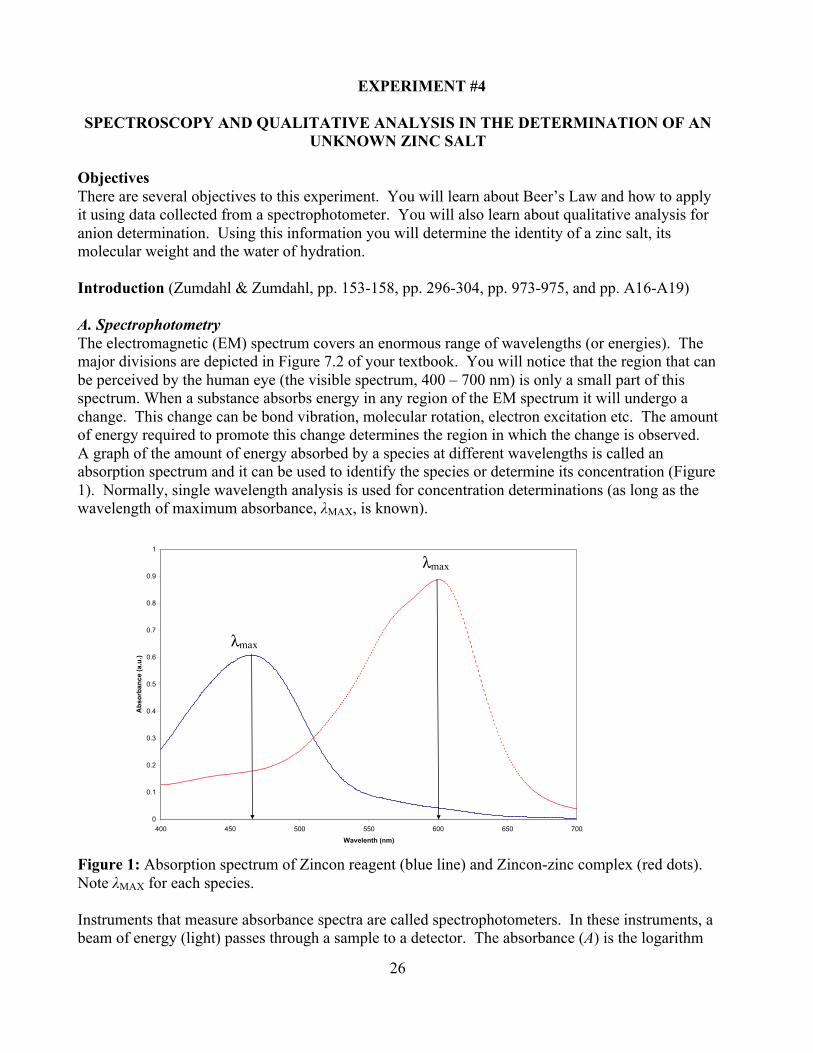
Objectives There are several objectives to this experiment. You will learn about Beer’s Law and how to apply it using data collected from a spectrophotometer. You will also learn about qualitative analysis for anion determination. Using this information you will determine the identity of a zinc salt, its molecular weight and the water of hydration. Introduction (Zumdahl & Zumdahl, pp. 153-158, pp. 296-304, pp. 973-975, and pp. A16-A19) A. Spectrophotometry The electromagnetic (EM) spectrum covers an enormous range of wavelengths (or energies). The major divisions are depicted in Figure 7.2 of your textbook. You will notice that the region that can be perceived by the human eye (the visible spectrum, 400 – 700 nm) is only a small part of this spectrum. When a substance absorbs energy in any region of the EM spectrum it will undergo a change. This change can be bond vibration, molecular rotation, electron excitation etc. The amount of energy required to promote this change determines the region in which the change is observed. A graph of the amount of energy absorbed by a species at different wavelengths is called an absorption spectrum and it can be used to identify the species or determine its concentration (Figure 1). Normally, single wavelength analysis is used for concentration determinations (as long as the wavelength of maximum absorbance, λMAX, is known).
Figure 1: Absorption spectrum of Zincon reagent (blue line) and Zincon-zinc complex (red dots). Note λMAX for each species. Instruments that measure absorbance spectra are called spectrophotometers. In these instruments, a beam of energy (light) passes through a sample to a detector. The absorbance (A) is the logarithm
0
0.1
0.2
0.3
0.4
0.5
0.6
0.7
0.8
0.9
1
400 450 500 550 600 650 700
Wavelenth (nm)
Abs
orba
nce
(a.u
.)
λmax
λmax
27
of the ratio of the original amount of energy (Io) relative to the amount of energy reaching the detector (I):
A = log(Io/I) The spectrophotometer is set at a fixed wavelength where the absorbance of the sample is at a maximum (λMAX). At fixed wavelengths, the amount of energy absorbed is proportional to two parameters: (i) the concentration of the absorbing species, and (ii) the distance travelled through the solution containing the absorbing species. The dependence of absorbance on these two factors is summarized by Beer’s Law:
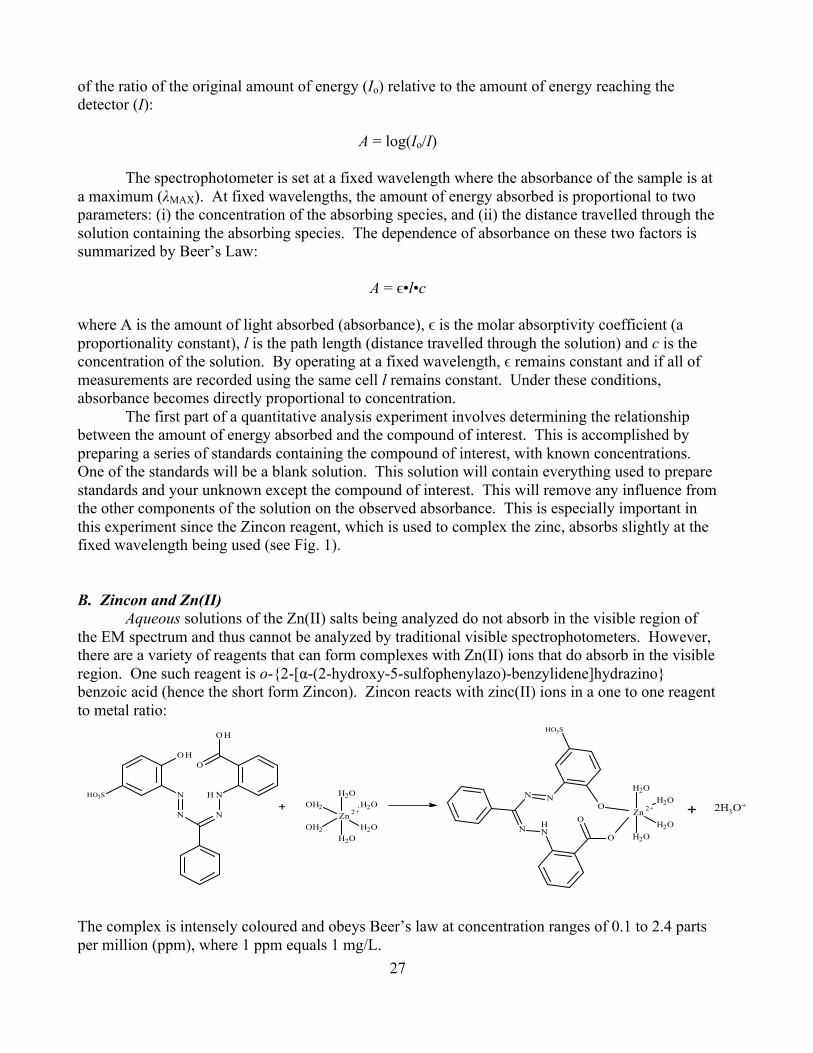
A = ϵ•l•c where A is the amount of light absorbed (absorbance), ϵ is the molar absorptivity coefficient (a proportionality constant), l is the path length (distance travelled through the solution) and c is the concentration of the solution. By operating at a fixed wavelength, ϵ remains constant and if all of measurements are recorded using the same cell l remains constant. Under these conditions, absorbance becomes directly proportional to concentration. The first part of a quantitative analysis experiment involves determining the relationship between the amount of energy absorbed and the compound of interest. This is accomplished by preparing a series of standards containing the compound of interest, with known concentrations. One of the standards will be a blank solution. This solution will contain everything used to prepare standards and your unknown except the compound of interest. This will remove any influence from the other components of the solution on the observed absorbance. This is especially important in this experiment since the Zincon reagent, which is used to complex the zinc, absorbs slightly at the fixed wavelength being used (see Fig. 1). B. Zincon and Zn(II) Aqueous solutions of the Zn(II) salts being analyzed do not absorb in the visible region of the EM spectrum and thus cannot be analyzed by traditional visible spectrophotometers. However, there are a variety of reagents that can form complexes with Zn(II) ions that do absorb in the visible region. One such reagent is o-{2-[α-(2-hydroxy-5-sulfophenylazo)-benzylidene]hydrazino} benzoic acid (hence the short form Zincon). Zincon reacts with zinc(II) ions in a one to one reagent to metal ratio:
The complex is intensely coloured and obeys Beer’s law at concentration ranges of 0.1 to 2.4 parts per million (ppm), where 1 ppm equals 1 mg/L.
2H3O+
28
C. Water of Hydration
Quite often, salts will crystallize with a certain quantity of water present, known as water of hydration. The inclusion of water into the crystalline solid can take several forms, including but not limited to: formation of a complex ion where water is coordinated to the metal, water molecules existing between the cation and anion or as lattice water (where water molecules occupy lattice positions but are not associated directly with either anion or cation). The quantity, or moles, of water present in a salt can be estimated by comparing the experimentally determined molecular weight to that of the anhydrous form of the salt.
Pre-Lab Assignment
1. Prepare a data sheet for today’s experiment. You may wish to consult experiments 1 and 2 for guidance (NOTE: If unprepared, student will be unable to continue with lab session!).
2. What is a Beer’s Law plot and what information will be needed to generate it? What information will you be able to get from this plot?
3. In what manner will the waste generated in this experiment be disposed?
4. In step 2 of the procedure why is it important to thoroughly rinse the 10 mL beaker into the
100 mL volumetric flask?
5. A 231.4 mg ore sample containing iron is digested with acid, filtered and diluted to 500.0 mL in a volumetric flask. A 10.00 mL aliquot is transferred to a 100.00 mL volumetric flask containing hydroxylamine hydrochloride, sodium acetate and 1,10-phenanthroline and diluted to the mark. The resulting orange-red solution had an absorbance of 0.486 at 508 nm in a 1 cm cell. If the molar absorptivity of the iron-phenanthroline complex at this wavelength is 1.89 x 10³ L/mol•cm, determine the percentage of iron in the ore sample.
29
Procedure (in pairs) Preparation of zinc standards and unknown zinc salt
1. Obtain one of the kits provided as well as one of the unknown zinc salts. All of the zinc salts (which may or may not be hydrated) are in the +2 oxidation state and will have one of the following anions: Cl-, Br-, I-, SO4
2- and CH3COO- (acetate). Also, obtain 150 mL of the pH 9 buffer.
2. Using the 10 mL beaker, weigh out ~ 0.03 to 0.035 g (±0.0001 g) of your salt. Transfer the salt to a 100.00 mL volumetric flask using a small amount of water. Rinse the beaker 3 to 4 times and transfer the washing to the flask. Allow the Zn salt to completely dissolve and then dilute to the mark.
3. Transfer 1 mL of the solution from step 2 (using the provided pipette) into a 100 mL volumetric flask. To the flask add 20 mL of the pH 9 buffer (pipette) and, from the burette provided, 2 mL of the Zincon reagent. Dilute to the mark and mix thoroughly.
4. Prepare the standards as follows: into individual 100 volumetric flasks add 1, 2, 3 and 4 ml of the standard Zn2+ solution from the burettes provided (record the concentration of the Zn2+ solution). It need not be exactly 1.00, 2.00, etc. mL. However, the actual volume added must be known. Therefore, initial and final burette readings are required (±0.02 mL). To the individual flask also add 20 mL of the pH 9 buffer and 2 mL of the Zincon reagent. Dilute to the mark and mix.
5. Using a beaker, prepare the blank by adding 20 mL of the pH 9 buffer and 2 mL of the Zincon reagent and dilute to 100 mL with distilled water. NOTE: A VOLUMETRIC FLASK IS NOT NEEDED FOR THIS STEP, SO DON’T USE ONE!!
6. To analyze your samples ask the lab demonstrators for instruction on the proper use of the spectrophotometer. Obtain the absorbance of each of the standards and the unknown at 600 nm.
Quantitative Analysis
Transfer some of your salt (tip of a scoopula) into a beaker and dissolve it in ~ 30 mL distilled water. Transfer equal portions of this solution into three test tubes (about 2-3 cm in height).
1. Chloride and Bromide. Add 3 drops of 6 M HNO3 to the solution in the first test tube and shake well. Add 5 drops of 0.1 M AgNO3 and mix well. If a precipitate has formed upon
o All Zincon-containing solutions can be poured down the drain. o The stock zinc solution is to be poured in the container provided. o All waste from the qualitative analysis section is to be placed in the
container provided.

30
the addition of silver nitrate a positive test for chloride or bromide has occurred.
To determine if you have the chloride or bromide anion add 10 drops of 6 M NH4OH to the mixture (do not mix). If there are two distinct layers then the chloride anion is present. If the solution did not change then the bromide anion is present.
2. Sulfate. Add 3 drops of 6 M HNO3 to the solution in the second test tube and shake well.
Add 5 drops of 0.1 M BaCl2. The formation of a white precipitate indicates the presence of SO4
2-.
3. Iodide. To the final test tube add 3 drops of 6 M HNO3 and shake well. Add 10 drops of sodium hypochlorite (NaOCl). The appearance of a dark brown/black precipitate indicates the presence of iodide.
4. Acetate. Place a small amount of the solid salt (~ the size of a pea) into a test tube. Add 1
mL of concentrated H2SO4 (CARE!!!) and 2 mL of amyl alcohol (1-pentanol) from the burettes in the fume hood and mix with a glass stirring rod. Place the test tube in the water bath provided for about 5 minutes. Remove the test tube from the bath and check the odour of the solution by bringing your nose slowly to the test tube and waving your hand over the top of the test tube towards your nose. You can also pour it onto a watch glass to make it easier to pick up the odour. If a fruity odour is present (it often reminds people of fake banana smell), it indicates the presence of the acetate ion.
Report
1. Using the concentration of the stock Zn solution and the volumes delivered, calculate the concentration of your standard Zn solutions in ppm.
2. Construct a Beer’s Law plot using mm graph paper (absorbance vs. Zn concentration, in ppm). Draw a line of best fit through your data points. Don’t forget that it must go through (0,0) to account for the blank. Clearly mark the absorbance of the unknown sample and determine its concentration.
3. Using the mass of the sample analyzed, the dilutions you performed and the positive anion
test determine: the identity of your unknown salt, its molecular weight and water of hydration.
4. Propose net ionic equations for all observed reactions. Include anion tests that gave
negative results but give equations as if the reactions gave positive results.
31
EXPERIMENT #5
ORGANIC CHEMISTRY: PREPARATION OF ACETAMINOPHIN Objectives: 1. Develop basic techniques used in an Organic Chemistry Laboratory 2. Prepare acetaminophen from 4-nitrophenol via the 4-aminophenol intermediate Introduction A. Theoretical Aspects
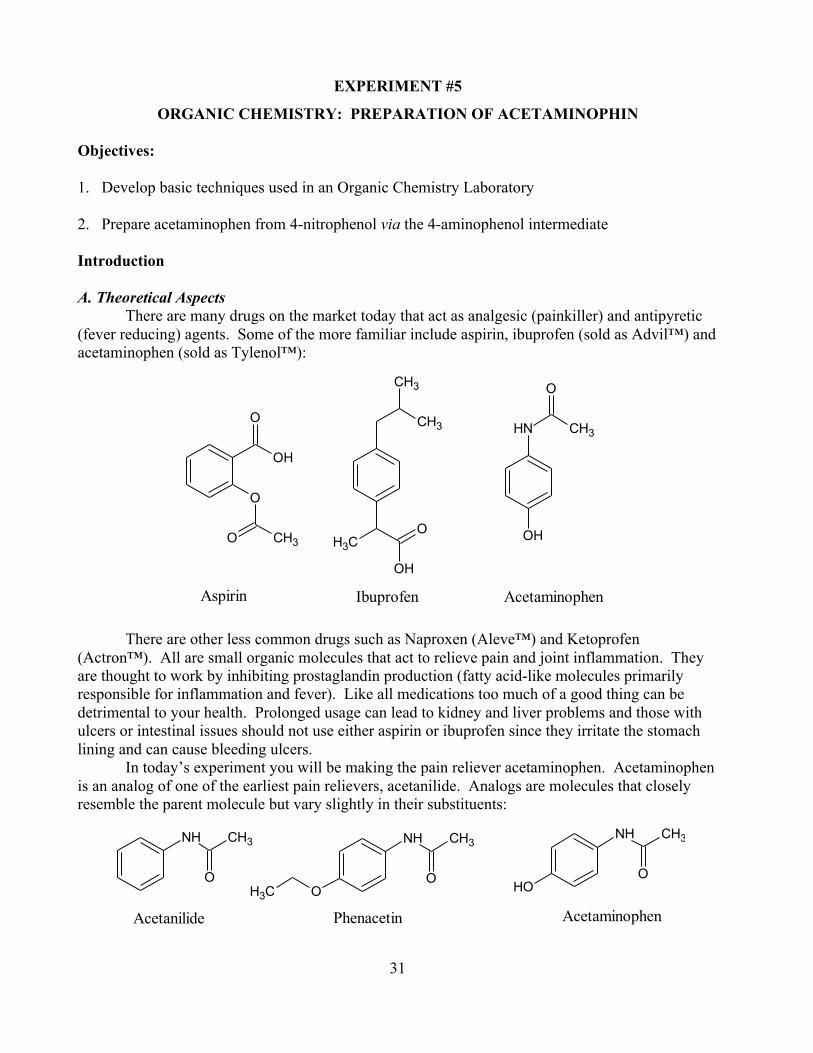
There are many drugs on the market today that act as analgesic (painkiller) and antipyretic (fever reducing) agents. Some of the more familiar include aspirin, ibuprofen (sold as Advil™) and acetaminophen (sold as Tylenol™):
O
CH3O
OH
O
CH3
OH
O
CH3
CH3
OH
NH
O
CH3
Aspirin Ibuprofen Acetaminophen
There are other less common drugs such as Naproxen (Aleve™) and Ketoprofen (Actron™). All are small organic molecules that act to relieve pain and joint inflammation. They are thought to work by inhibiting prostaglandin production (fatty acid-like molecules primarily responsible for inflammation and fever). Like all medications too much of a good thing can be detrimental to your health. Prolonged usage can lead to kidney and liver problems and those with ulcers or intestinal issues should not use either aspirin or ibuprofen since they irritate the stomach lining and can cause bleeding ulcers. In today’s experiment you will be making the pain reliever acetaminophen. Acetaminophen is an analog of one of the earliest pain relievers, acetanilide. Analogs are molecules that closely resemble the parent molecule but vary slightly in their substituents:
NH CH3
OOH
NH CH3
O
NH CH3
OOCH3
Acetanilide Phenacetin Acetaminophen

32
It is hoped that the analog will have similar or greater effectiveness and/or reduced toxicity. The reason for this is that acetanilide, while effective, had a nasty side effect of deactivating hæmoglobin in red bloods cells. This was discovered a few years after it was mistakenly given to a patient to treat a case of worms in the 1880s. It did little for the worms but significantly reduced the patients fever symptoms. When acetaminophen was first produced in 1893 it was thought to have the same side effect as acetanilide and it wasn’t until it was reinvestigated in the 1940s that it was demonstrated to have no impact on hæmoglobin. It went into widespread production in the 1950s and is one of the most commonly used pain/fever reliever today. There are a number of pathways available for the formation of acetaminophen. Today’s experiment involves a two-step process where the nitro group on the starting material (4-nitrophenol) is reduced to the amine by the use of a mild reducing agent and a carbon catalyst. The catalyst provides a surface site for the reaction to take place by forming weak association bonds with 4-nitrophenol. These bonds weaken the strong nitro bonds making it easier for the reduction of the nitro group to the amine to occur.
The second step of the reaction involves acetylating the amine using acetic anhydride. Acetic anhydride is a strong acetylating agent and the reaction progresses quite rapidly.
OH
NH2
H2O, room temp.
OH
NH
O
CH3
CH3 O CH3
O O
B. Practical Aspects Inevitably, once the organic reaction is complete, the reaction mixture will contain the target molecule as well as side products and any catalyst used. In addition, a reaction always has a limiting reagent, resulting in left over starting material. Therefore, the target molecule has to be separated and purified from the reaction mixture. The most common methods of separation are distillation, filtration (which we’ll use in this experiment), and extraction. Prior to purification, the reaction mixture should be neutralized (worked up). This accomplishes two things: safety (e.g., eliminates strongly acidic/basic solutions that can be spilled on clothing), and it changes the solubility of the desired product, making it easier to separate from the reaction mixture.

33
Calculation of Yield Quite often there is some confusion for students between product yield and percent error calculations (see introduction of Experiment 1). In a percent error calculation the primary concern is the deviation of the experimental value from that of the true value. Conversely, in a percent yield calculation the chief concern is the amount of product produced based on the theoretical amount of product attainable:
Percent Yield = 100xproduct of mass ltheoretica
product of mass
The mass of product is simply the actual mass of the product obtained in your reaction (following any purification steps). The theoretical mass of product is determined based on the limiting reagent. The mass of the limiting reagent is converted to moles and, based on the balanced chemical equation, equated to the number of moles of product that could be theoretically produced. The number of moles is then converted back to a mass (using the molecular weight of the product) and used to determine the percent yield. Pre-lab Assignment
1. Prepare a data sheet.
2. Report the appearance and melting point of acetaminophen.
3. A reaction mixture contains 10.13 g of isobutylene, 12.00 g of isobutane and an acid catalysis. They react according to the following balanced reaction scheme:
CH3 CH2
CH3
CH3 CH3
CH3
H
H+
CH3 CH3
CH3
H
CH3
CH3+
Isobutylene Isobutane 2,2,4-Trimethylpentane
After working up the reaction mixture, 17.35 g of product was obtained. Determine:
(a) The limiting reagent
(b) The theoretical mass of product (assume 100% yield)
(c) The percent yield of the reaction
3. The standard literature preparation (which we are using) of acetaminophen involves acetylating the amino group of 4-aminophenol. They suggest a ratio of 1.1 mL of acetic anhydride and 9.0 mL of water for every gram of 4-aminophenol. How much water and acetic acid are required if you have 2.13 g of 4-aminophenol? How much for 0.88 g of 4-aminophenol?
34
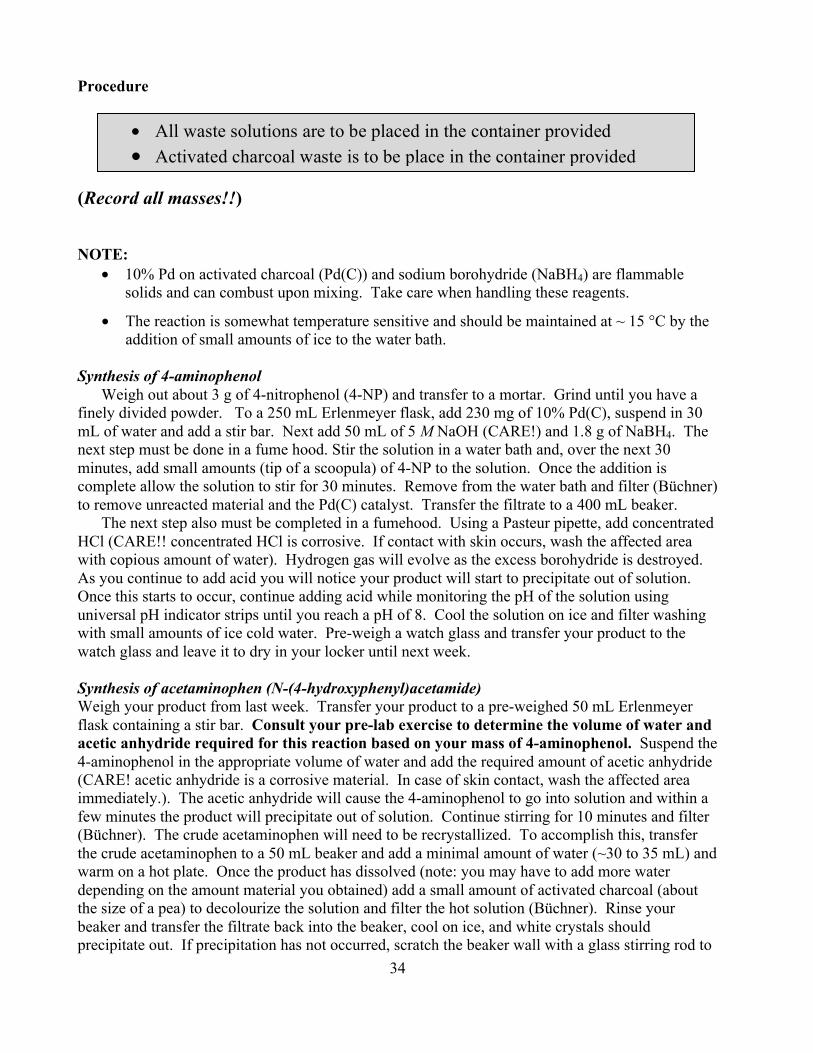
Procedure (Record all masses!!) NOTE:
• 10% Pd on activated charcoal (Pd(C)) and sodium borohydride (NaBH4) are flammable solids and can combust upon mixing. Take care when handling these reagents.
• The reaction is somewhat temperature sensitive and should be maintained at ~ 15 °C by the addition of small amounts of ice to the water bath.
Synthesis of 4-aminophenol Weigh out about 3 g of 4-nitrophenol (4-NP) and transfer to a mortar. Grind until you have a
finely divided powder. To a 250 mL Erlenmeyer flask, add 230 mg of 10% Pd(C), suspend in 30 mL of water and add a stir bar. Next add 50 mL of 5 M NaOH (CARE!) and 1.8 g of NaBH4. The next step must be done in a fume hood. Stir the solution in a water bath and, over the next 30 minutes, add small amounts (tip of a scoopula) of 4-NP to the solution. Once the addition is complete allow the solution to stir for 30 minutes. Remove from the water bath and filter (Büchner) to remove unreacted material and the Pd(C) catalyst. Transfer the filtrate to a 400 mL beaker.
The next step also must be completed in a fumehood. Using a Pasteur pipette, add concentrated HCl (CARE!! concentrated HCl is corrosive. If contact with skin occurs, wash the affected area with copious amount of water). Hydrogen gas will evolve as the excess borohydride is destroyed. As you continue to add acid you will notice your product will start to precipitate out of solution. Once this starts to occur, continue adding acid while monitoring the pH of the solution using universal pH indicator strips until you reach a pH of 8. Cool the solution on ice and filter washing with small amounts of ice cold water. Pre-weigh a watch glass and transfer your product to the watch glass and leave it to dry in your locker until next week. Synthesis of acetaminophen (N-(4-hydroxyphenyl)acetamide) Weigh your product from last week. Transfer your product to a pre-weighed 50 mL Erlenmeyer flask containing a stir bar. Consult your pre-lab exercise to determine the volume of water and acetic anhydride required for this reaction based on your mass of 4-aminophenol. Suspend the 4-aminophenol in the appropriate volume of water and add the required amount of acetic anhydride (CARE! acetic anhydride is a corrosive material. In case of skin contact, wash the affected area immediately.). The acetic anhydride will cause the 4-aminophenol to go into solution and within a few minutes the product will precipitate out of solution. Continue stirring for 10 minutes and filter (Büchner). The crude acetaminophen will need to be recrystallized. To accomplish this, transfer the crude acetaminophen to a 50 mL beaker and add a minimal amount of water (~30 to 35 mL) and warm on a hot plate. Once the product has dissolved (note: you may have to add more water depending on the amount material you obtained) add a small amount of activated charcoal (about the size of a pea) to decolourize the solution and filter the hot solution (Büchner). Rinse your beaker and transfer the filtrate back into the beaker, cool on ice, and white crystals should precipitate out. If precipitation has not occurred, scratch the beaker wall with a glass stirring rod to
• All waste solutions are to be placed in the container provided • Activated charcoal waste is to be place in the container provided

35
induce crystallization. If crystallization still has not occurred, you will have to boil off water before crystallization can occur. Once recrystallization is complete, filter (pre-weighed glass frit) and place in the oven to dry (~30 minutes). When dry, cool the filter and weigh to determine the mass of acetaminophen. Prepare a sample for melting point determination (your lab instructor will show you how to prepare the sample). Determine the melting point. Report:
1. Give all masses of starting materials and products (for both the intermediate 4-aminophenol and the product acetaminophen). Calculate percent yields for both reactions. Show all calculations, including the determination of the limiting reagent.
2. Report the melting point of acetaminophen. Comment on how melting point can vary with
the purity of the product, and therefore comment on the purity of your acetaminophen.
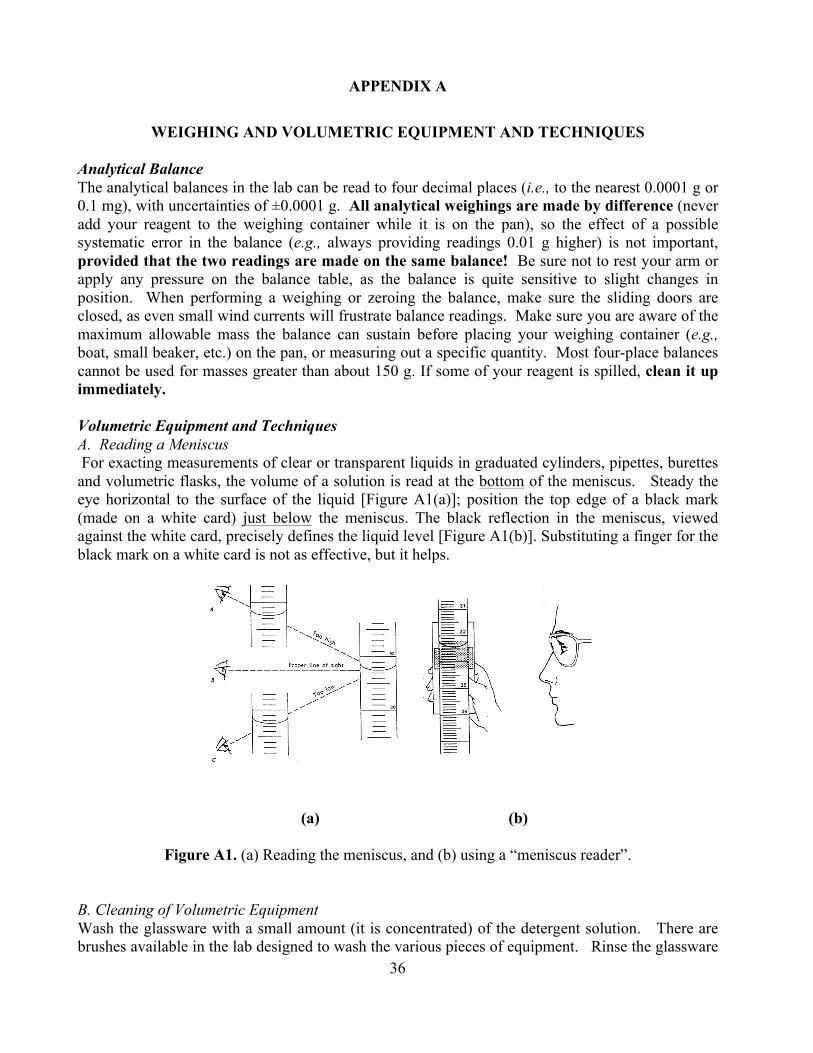
36
APPENDIX A
WEIGHING AND VOLUMETRIC EQUIPMENT AND TECHNIQUES Analytical Balance The analytical balances in the lab can be read to four decimal places (i.e., to the nearest 0.0001 g or 0.1 mg), with uncertainties of ±0.0001 g. All analytical weighings are made by difference (never add your reagent to the weighing container while it is on the pan), so the effect of a possible systematic error in the balance (e.g., always providing readings 0.01 g higher) is not important, provided that the two readings are made on the same balance! Be sure not to rest your arm or apply any pressure on the balance table, as the balance is quite sensitive to slight changes in position. When performing a weighing or zeroing the balance, make sure the sliding doors are closed, as even small wind currents will frustrate balance readings. Make sure you are aware of the maximum allowable mass the balance can sustain before placing your weighing container (e.g., boat, small beaker, etc.) on the pan, or measuring out a specific quantity. Most four-place balances cannot be used for masses greater than about 150 g. If some of your reagent is spilled, clean it up immediately. Volumetric Equipment and Techniques A. Reading a Meniscus For exacting measurements of clear or transparent liquids in graduated cylinders, pipettes, burettes and volumetric flasks, the volume of a solution is read at the bottom of the meniscus. Steady the eye horizontal to the surface of the liquid [Figure A1(a)]; position the top edge of a black mark (made on a white card) just below the meniscus. The black reflection in the meniscus, viewed against the white card, precisely defines the liquid level [Figure A1(b)]. Substituting a finger for the black mark on a white card is not as effective, but it helps.
(a) (b) Figure A1. (a) Reading the meniscus, and (b) using a “meniscus reader”. B. Cleaning of Volumetric Equipment Wash the glassware with a small amount (it is concentrated) of the detergent solution. There are brushes available in the lab designed to wash the various pieces of equipment. Rinse the glassware

37
well with tap water and then finally with distilled water. No water droplets will adhere to the inner walls of the glassware if it is cleaned properly. C. Volumetric Flasks Volumetric flasks are pear-shaped to facilitate drainage, and have a narrow neck to increase the precision of the volume reading at the single graduation mark. They are calibrated to contain a specified volume. A weighed amount (or measured volume) of substance is added to the flask, and solvent is added precisely to the graduation mark. The flask is capped and inverted a number of times to ensure thorough mixing. The temperature of the solution should be close to the calibrated value (a 5°C variation will cause an error of about 1 mL in 1000 mL – that is a 0.02% error per degree). D. Pipettes Transfer pipettes are designed to deliver a single, fixed volume of liquid with good precision. Transfer the solution that you intend to pipette from the reagent bottle to a beaker. To avoid contamination, never pipette directly from a reagent bottle. Dry the tip of the pipette with a tissue. Using suction from a rubber bulb (Caution: NEVER use your mouth), draw 2-3 small portions into the pipette as a rinse (Figure A2). Roll each rinse around in the pipette to make sure the solution washes the entire inner surface (but not into the bulb!). Deliver each rinse to a waste beaker.
Figure A2. Technique for measuring liquids with a pipette for a right-handed person. Use the suction bulb to fill the pipette so that the liquid level is above the graduation mark. Remove the bulb and quickly put your index finger over the end of the pipette. Roll your finger over to the side (so that air can enter the pipette slowly) and allow the liquid to drain until the bottom of the meniscus is exactly on the graduation mark.

38
The tip of a pipette should be small enough to require 20 seconds to empty a 10 mL pipette, 30 seconds for a 50 mL pipette, etc. If the outflow rate is faster, this much time should be allowed for drainage. The pipette is maintained in a vertical position during discharge, with the contacting wall of the receiving vessel at about 45o. Finally, the adhering drop at the tip is touched off inside the receiving vessel, but the small portion of liquid in the tip is left in place, i.e. DO NOT BLOW THE LAST DROP OF LIQUID OUT WITH THE PIPETTE BULB. E. Burettes Burettes are long cylindrical tubes of very uniform bore, calibrated along their length, with some device to control the flow of liquid - a glass stopcock or a Teflon valve. Burettes are calibrated to deliver the measured volume of liquid. If you are using a particular burette for the first time, examine its markings before you fill it. The lines that span the entire circumference occur for each mL, starting with zero at the top and reaching the maximum volume at the bottom. As a result, the burette will show the volume of a liquid that has been delivered rather than the volume that remains. On a 50 mL burette, the smaller lines indicate each tenth of a mL. The spacings between these lines will allow you to estimate the volume to the nearest 0.02 mL. Thus typical burette readings would be 9.34 mL and 17.60 mL. Readings such as 9.3 mL and 17.6 mL are not acceptable. As with a pipette, the burette must be rinsed with small amounts of the solution to be measured. Then fill the burette to above the zero mark with the stopcock closed. Open the stopcock fully once or twice so that the liquid drains rapidly to flush out any air bubbles in the tip of the burette. Drain the burette until the meniscus rests between the zero and the 1 mL mark. Do not waste time trying to align the bottom of the meniscus with the zero or any other specific mark. Read the burette with your eye on the same level as the meniscus. To obtain the volume of the liquid that you delivered, subtract this reading from the final reading. The tip must be small enough that the delivery time is sufficient to allow for drainage (about 40 seconds for 25 mL or 90 seconds for the full 50 mL). If the outflow rate is faster, this much time must be allowed before reading the final volume. Figure A3 shows the best technique for a titration by a right-handed student. Note that the left hand is used to open and close the stopcock. With a bit of practice, you will be able to adjust the stopcock so that as little as half a drop will form on the tip. This drop then is touched off onto the inside neck of the receiving flask and washed down with distilled water (unless conducting a potentiometric titration, i.e., using a pH meter). The right hand is used to swirl the flask as the titrant is added. (A left-handed student would turn the burette 180o, control the stopcock with the right hand and swirl with the left hand.) Coloured endpoints are most easily seen if a white background, such as a white tile, is used. As the endpoint is neared the colour of the indicator persists longer in the solution and the addition of titrant is slowed down. Note that, as shown in Figure A3, the tip of the burette is kept close to the mouth of the flask to avoid errors due to splattering. Experienced chemists usually perform a quick, preliminary titration. Although the
Figure A3. Titration technique for a right- handed person.

39
endpoint may be overshot, it gives the chemist an idea of the size of the titre to be expected and is preferable to doing the first titration very slowly and carefully when the size of the titre is unknown. This procedure, of course, depends on the amount of solution that is available for analysis.
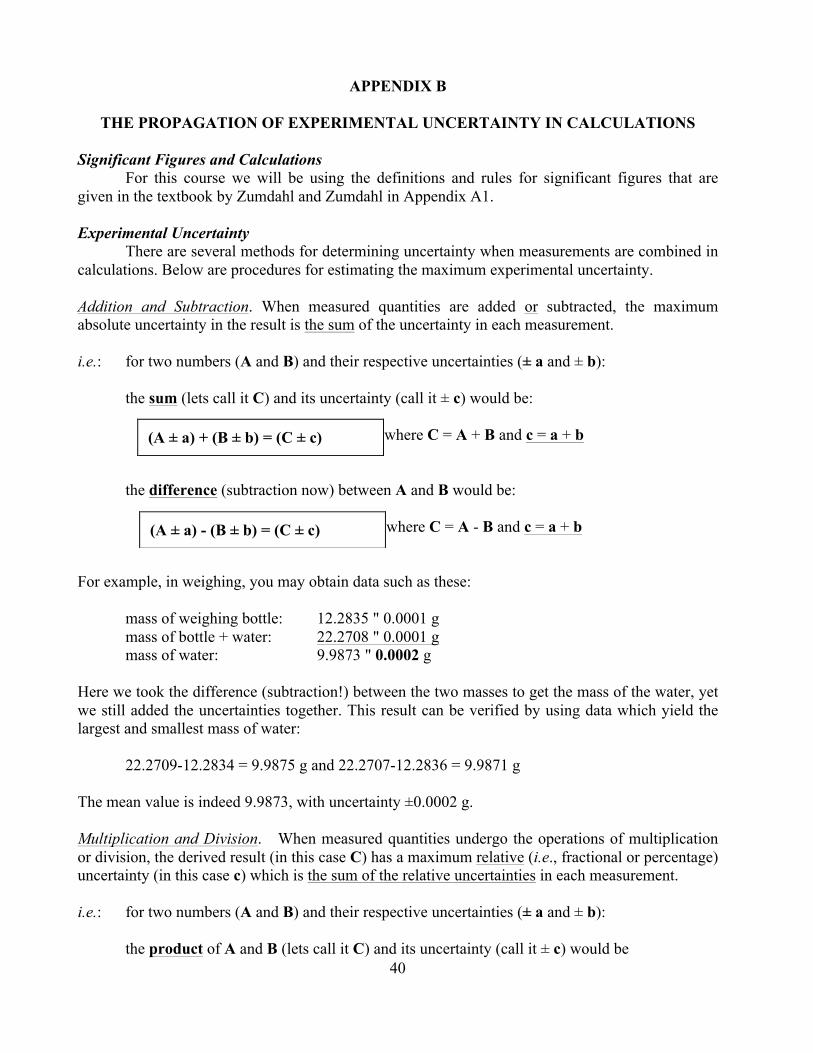
40
APPENDIX B THE PROPAGATION OF EXPERIMENTAL UNCERTAINTY IN CALCULATIONS Significant Figures and Calculations For this course we will be using the definitions and rules for significant figures that are given in the textbook by Zumdahl and Zumdahl in Appendix A1. Experimental Uncertainty There are several methods for determining uncertainty when measurements are combined in calculations. Below are procedures for estimating the maximum experimental uncertainty. Addition and Subtraction. When measured quantities are added or subtracted, the maximum absolute uncertainty in the result is the sum of the uncertainty in each measurement. i.e.: for two numbers (A and B) and their respective uncertainties (± a and ± b): the sum (lets call it C) and its uncertainty (call it ± c) would be:
where C = A + B and c = a + b
the difference (subtraction now) between A and B would be:
where C = A - B and c = a + b
For example, in weighing, you may obtain data such as these: mass of weighing bottle: 12.2835 " 0.0001 g mass of bottle + water: 22.2708 " 0.0001 g mass of water: 9.9873 " 0.0002 g Here we took the difference (subtraction!) between the two masses to get the mass of the water, yet we still added the uncertainties together. This result can be verified by using data which yield the largest and smallest mass of water: 22.2709-12.2834 = 9.9875 g and 22.2707-12.2836 = 9.9871 g The mean value is indeed 9.9873, with uncertainty ±0.0002 g. Multiplication and Division. When measured quantities undergo the operations of multiplication or division, the derived result (in this case C) has a maximum relative (i.e., fractional or percentage) uncertainty (in this case c) which is the sum of the relative uncertainties in each measurement. i.e.: for two numbers (A and B) and their respective uncertainties (± a and ± b): the product of A and B (lets call it C) and its uncertainty (call it ± c) would be
(A ± a) + (B ± b) = (C ± c)
(A ± a) - (B ± b) = (C ± c)
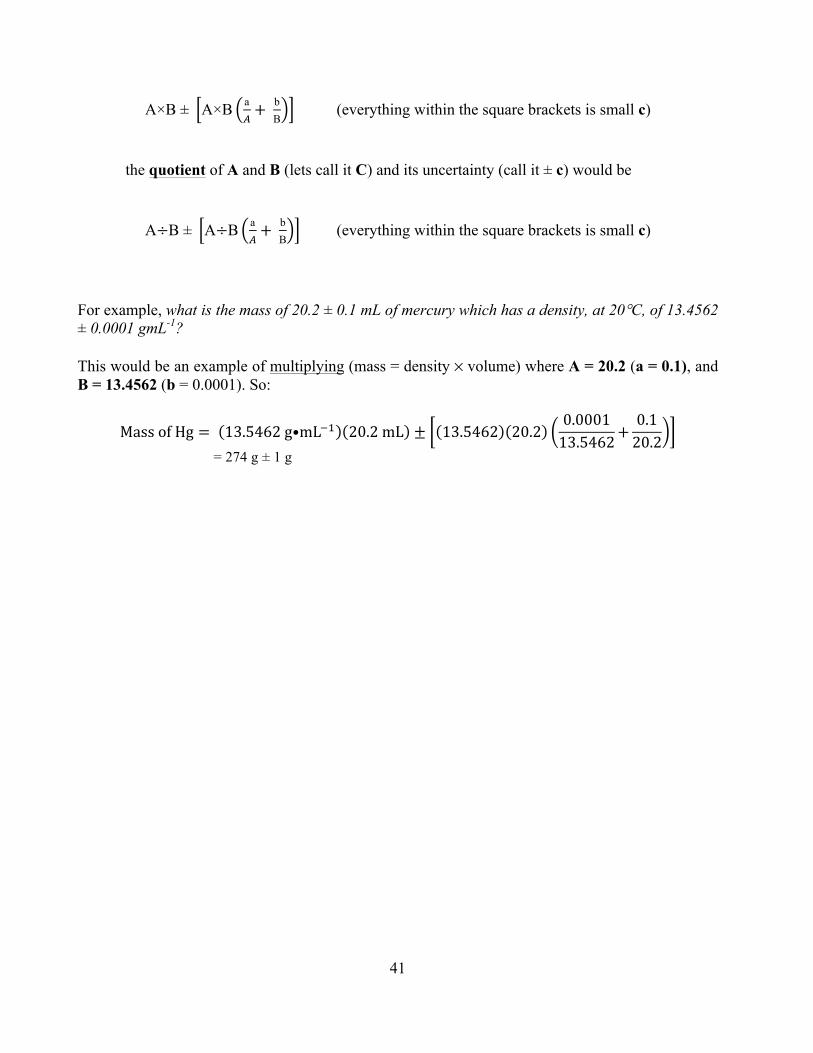
41
A×B ± A×B a
!+ b
B (everything within the square brackets is small c)
the quotient of A and B (lets call it C) and its uncertainty (call it ± c) would be
A÷B ± A÷B a!+ b
B (everything within the square brackets is small c)
For example, what is the mass of 20.2 ± 0.1 mL of mercury which has a density, at 20°C, of 13.4562 ± 0.0001 gmL-1? This would be an example of multiplying (mass = density × volume) where A = 20.2 (a = 0.1), and B = 13.4562 (b = 0.0001). So:
Mass of Hg = 13.5462 g•mL!! 20.2 mL ± 13.5462 20.20.000113.5462+
0.120.2
= 274 g ± 1 g
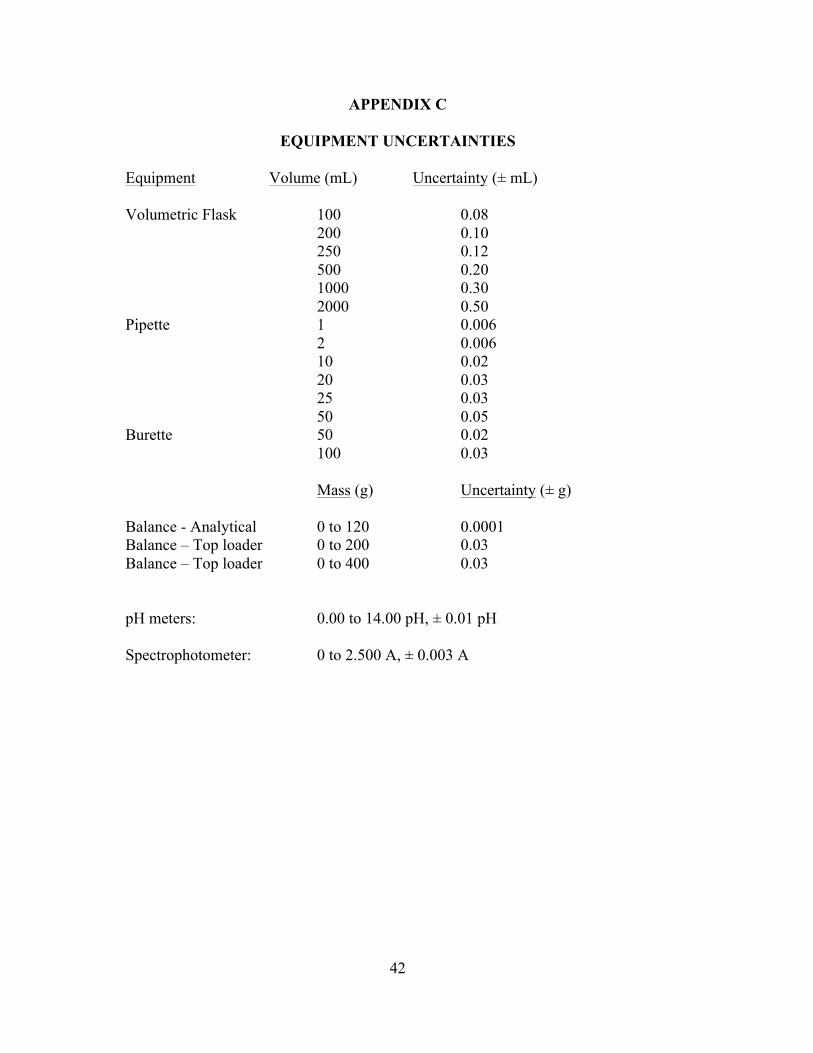
42
APPENDIX C EQUIPMENT UNCERTAINTIES Equipment Volume (mL) Uncertainty (± mL) Volumetric Flask 100 0.08 200 0.10 250 0.12 500 0.20 1000 0.30 2000 0.50 Pipette 1 0.006 2 0.006 10 0.02 20 0.03 25 0.03 50 0.05 Burette 50 0.02 100 0.03 Mass (g) Uncertainty (± g) Balance - Analytical 0 to 120 0.0001 Balance – Top loader 0 to 200 0.03 Balance – Top loader 0 to 400 0.03 pH meters: 0.00 to 14.00 pH, ± 0.01 pH Spectrophotometer: 0 to 2.500 A, ± 0.003 A
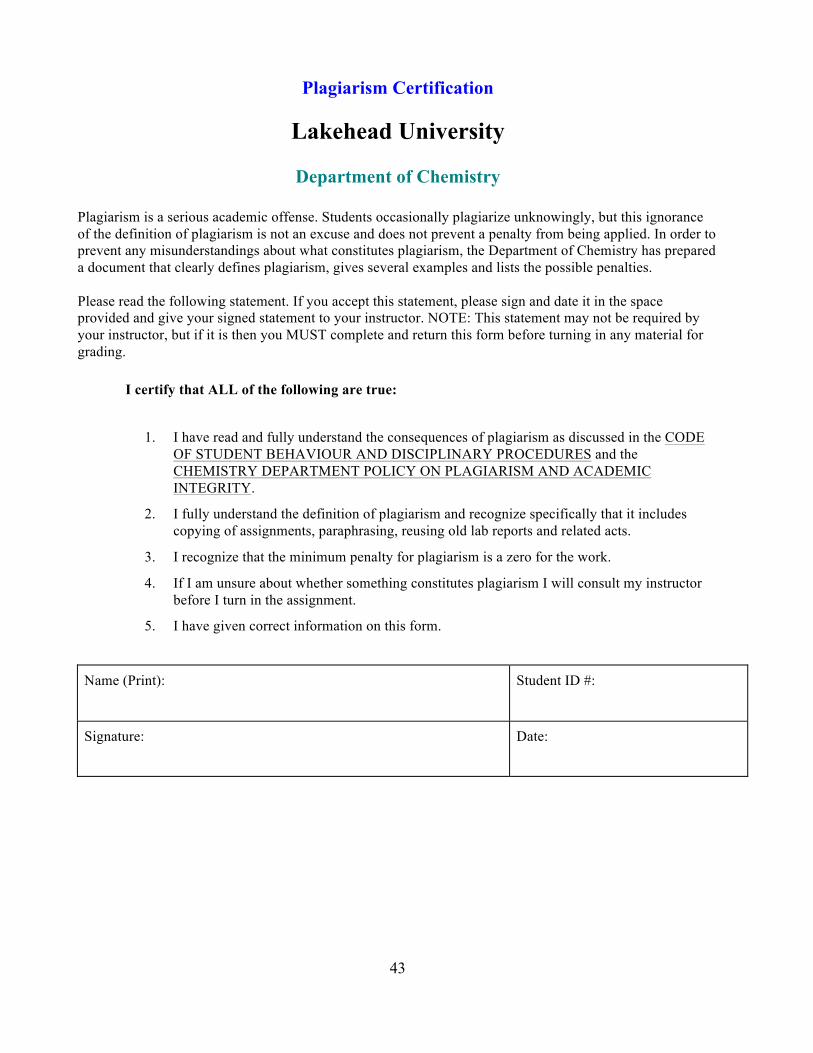
43
Plagiarism Certification
Lakehead University
Department of Chemistry Plagiarism is a serious academic offense. Students occasionally plagiarize unknowingly, but this ignorance of the definition of plagiarism is not an excuse and does not prevent a penalty from being applied. In order to prevent any misunderstandings about what constitutes plagiarism, the Department of Chemistry has prepared a document that clearly defines plagiarism, gives several examples and lists the possible penalties. Please read the following statement. If you accept this statement, please sign and date it in the space provided and give your signed statement to your instructor. NOTE: This statement may not be required by your instructor, but if it is then you MUST complete and return this form before turning in any material for grading. I certify that ALL of the following are true:
1. I have read and fully understand the consequences of plagiarism as discussed in the CODE
OF STUDENT BEHAVIOUR AND DISCIPLINARY PROCEDURES and the CHEMISTRY DEPARTMENT POLICY ON PLAGIARISM AND ACADEMIC INTEGRITY.
2. I fully understand the definition of plagiarism and recognize specifically that it includes copying of assignments, paraphrasing, reusing old lab reports and related acts.
3. I recognize that the minimum penalty for plagiarism is a zero for the work.
4. If I am unsure about whether something constitutes plagiarism I will consult my instructor before I turn in the assignment.
5. I have given correct information on this form. Name (Print): Student ID #:
Signature: Date:
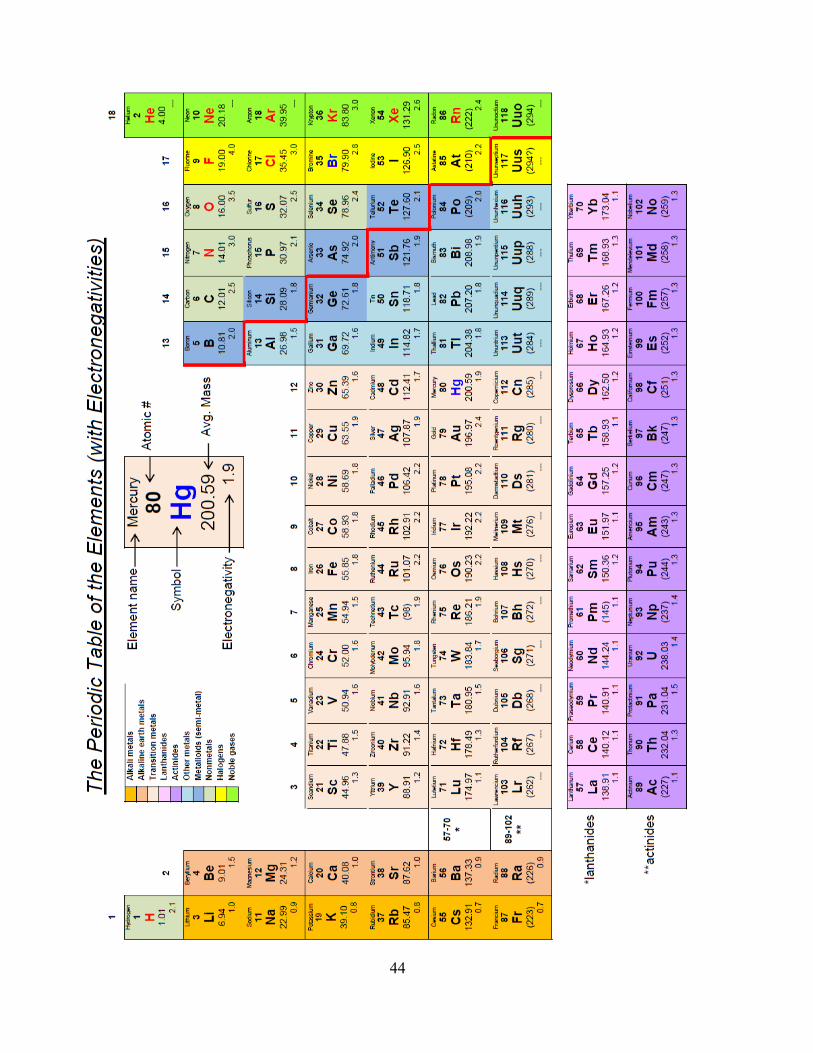
44