Fair Play via Fair Pay - Rotterdam School of … RSM Erasmus University is only responsible for the...
83
ERASMUS UNIVERSITY, ROTTERDAM SCHOOL OF MANAGEMENT & ECOLES DES HAUTES ETUDES COMMERCIALES, PARIS Fair Play via Fair Pay A PWYW Pricing Strategy for Fairtrade Laura van de Ven 302579lv Department of Marketing Management Coach: Christoph Fuchs (Department of Marketing Management) Co-Reader: Pushpika Vishwanathan (Department of Business Society Management) Date: 15 August 2012
Transcript of Fair Play via Fair Pay - Rotterdam School of … RSM Erasmus University is only responsible for the...

ERASMUS UNIVERSITY, ROTTERDAM SCHOOL OF MANAGEMENT &
ECOLES DES HAUTES ETUDES COMMERCIALES, PARIS
Fair Play via Fair Pay A PWYW Pricing Strategy for Fairtrade
Laura van de Ven
302579lv
Department of Marketing Management
Coach: Christoph Fuchs (Department of Marketing Management) Co-Reader: Pushpika Vishwanathan (Department of Business Society Management) Date: 15 August 2012

2 | P a g e
Acknowledgements
This thesis was written as part of my Master’s Degree of Business Administration in
Marketing Management at the Rotterdam School of Management and my Master’s Degree of
Business Administration in Finance at the Ecole des Hautes Etudes Commerciales, Paris.
It’s no secret to anyone that knows me that I have a passion for work that (also) benefits third
world countries. Some joke about it, others share it, and some fear that it will stand in the way
of reaching my potential. To me, it is something natural that I have always incorporated in my
commercial studies, and have once again tried to achieve in my final coursework.
Nevertheless, even passions don’t come easy, and numerous wrinkles on my forehead will
stay with me forever reminding me of the challenges that came with creating, writing and
implementing this paper. Completing this thesis is hardly a job done alone, and for that I want
to thank all involved. I am sincerely grateful to my coach and co-reader Christoph Fuchs and
Pushpika Vishwanathan for their thorough support, challenging nature, and guidance in the
whole process. Also the companies that enabled me to conduct the experiment made this
thesis. Without their help this would not have been possible. Finally, I would like to thank my
family and friends for their continuous positive influence in my life!
Enjoy the read...

3 | P a g e
Note:
The author declares that the text and work presented in this Master thesis is original and that
no sources other than those mentioned in the text and its references have been used in
creating the Master thesis.
The copyright of the Master thesis rests with the author. The author is responsible for its
contents, RSM Erasmus University is only responsible for the educational coaching and
beyond that cannot be held responsible for the content.

4 | P a g e
Executive Summary
Headlines in today’s top business journals talk about the prevalence and importance of ethics
and social causes. Also on TV and on the supermarket shelf there is a surge in the number of
social product labels and natural product offers. As a consequence to this claimed increase of
consumer interest in and awareness of environmentally friendly alternatives, companies are
increasingly investing in corporate social responsibility (CSR) projects and marketing them to
the outside world. Despite these investments, there has been little proven uplift in the sales of
socially responsible companies and social brands. Marketers have experimented with various
promotional methods and product labelling to close the attitude-behaviour gap existent in
consumers; however the general higher price to retain profitability seems to be maintained
and continues to deter sales.
This thesis investigated the use of a pay-what-you-want (PWYW) pricing strategy to increase
the sales of Fairtrade hot chocolate, as part of a CSR programme by the Coffee Corner café at
the Erasmus University of Rotterdam, The Netherlands. The Fairtrade label guarantees that
manufacturers in the Third World receive a sufficiently high wage and basic labour rights are
adhered to. PWYW is a novel, psychological pricing strategy that allows the consumer to pay
any price they want for the product that has to be accepted by the seller without exception.
It was demonstrated that consumers did value the Fairtrade label and were willing to pay a
15% higher price on average in comparison to the normal alternative. Hence, Fairtrade
products do carry value in the eye of the consumer, but consumers are unwilling to bear the
full burden of the extra costs associated with producing and supplying more socially
responsible products. Moreover, when PWYW was put into practice, revenues were higher
under the situation where the Fairtrade product was under this pricing strategy. It appeared
that consumers that valued the cause were willing to provide a larger support in monetary
terms to show this; consumers that did not, likely switched their purchase to the normal
alternative to avoid any post-purchase distress. Such flexible payment schemes could
therefore increase participation and donation amounts in charitable settings or other CSR
schemes. Although the influence of others has often been deemed important in social causes,
this research did not find a similar effect. Product choice and price determination in the

5 | P a g e
purchase setting were not found to be affected by the importance the consumer placed on
being accepted, nor by the number of people that they were surrounded by at the counter.
Therefore it appears that CSR initiatives should be mainly targeted at the individual and
appeal to them.
Contrary to previous evidence, this research found the quality perception of the final product
was not impacted by changes in pricing strategy or implementation of a CSR project. Hence
benefits accrued of such initiatives seemed not to have a significant impact on the intangible
benefits to the firm, but more on the tangible fiscal benefits such as the sales revenues.
Though no consumer demographic was identified for the ethical shopper, the significant effect
of empathy on choosing the Fairtrade alternative in the purchase setting indicated that
attitudes have more impact in ensuring a CSR project is effective. Companies should look at
the interests of their target group prior to implementing a certain social venture to ensure it is
well accepted and fulfils its purpose.
This thesis therefore contributed to existing research in two important ways. Firstly, the
previous findings evolve current literature on ethical products, demonstrating that the
consumer’s purchase behaviour is in line with their attitudes by their willingness to spend
more for social brands. However, managers should learn to share the costs with consumers
when launching similar initiatives and embarking on a CSR project. Secondly, this thesis has
increased the generalisability and applicability of psychological pricing strategies by being
one of the first to apply a PWYW pricing strategy to ethical products. Also as part of a CSR
project this pricing condition seemed to be effective, pointing future researchers to continue to
explore contexts in which such pricing schemes work.

6 | P a g e
Table of Contents
ACKNOWLEDGEMENTS 2 EXECUTIVE SUMMARY 4 TABLE OF CONTENTS 6 LIST OF TABLES AND FIGURES 8 1. INTRODUCTION 9 2. LITERATURE REVIEW 12
2.1 THE RISE OF ETHICAL CONSUMERISM 12 2.2 PRICING STRATEGIES 20 2.3 CONSUMER PSYCHOLOGY 28
3. METHODOLOGY 31
3.1. EMPIRICAL RESEARCH 32 3.2. DATA CLEANING 38 3.3. VALIDITY AND RELIABILITY CHECK 39 3.4. NORMALITY AND MANIPULATION CHECK 40
4. RESULTS: COFFEE CORNER 41
4.1. CONTROL TESTS 41 4.2. HYPOTHESIS TESTING 42 4.2.1. WILLINGNESS TO PAY FOR FAIRTRADE 42 4.2.2. PWYW AS A PRICING STRATEGY 46 4.2.3. PWYW AND PERCEIVED PRODUCT TASTINESS 50 4.3. COMPLETE MODEL TESTING 51
5. DISCUSSION 57
5.1. SUMMARY OF FINDINGS 57 5.2. THEORETICAL IMPLICATIONS 58 5.3. PRACTICAL AND MANAGERIAL IMPLICATIONS 61
6. LIMITATIONS & FUTURE RESEARCH 63 7. APPENDIX 65
I. WILLINGNESS-TO-PAY RESEARCH METHODS 66 II. FAIRTRADE INFORMATION ON DISPLAY 67 III. QUESTIONNAIRE 68 IV. HOT CHOCOLATE FLYERS & POSTERS 70 V. ALBRON EMPLOYEE BRIEFING 71

7 | P a g e
VI. BEHIND THE COUNTER INFORMATION SHEET: CHOICE, PRICE, PAYMENT METHOD, CONTEXT 72
VII. DEMOGRAPHIC ANALYSIS OF TREATMENT GROUPS 73 VIII. SCREE PLOT 74
IX. FACTOR ANALYSIS 75 X. SUMMARY PARAMETRIC TESTS 76 9. REFERENCES 78

8 | P a g e
List of Tables and Figures
Tables TABLE I: AGE DISTRIBUTION 73 TABLE II: FREE INCOME DISTRIBUTION 73 TABLE III: EIGENVALUE FACTOR LOADINGS 75 TABLE IV: CRONBACH ALPHA STATISTICS PER FACTOR PER PRICE CONDITION 75 TABLE V: DESCRIPTIVES COFFEE CORNER 76 TABLE VI: PRODUCT TASTE AND ENJOYMENT 41 TABLE VII: SALES QUANTITY AND SALES REVENUE 47 TABLE VIII: HYPOTHETICAL SALES QUANTITY AND SALES REVENUES 50 TABLE IX: AVERAGE TASTINESS PER PRODUCT TYPE AND PRICING STRATEGY 51 TABLE X: STEP ONE IN TWO-STAGE HECKMAN MODEL 53 TABLE XI: STEP TWO IN TWO-STAGE HECKMAN MODEL 55 TABLE XII: SUMMARY OF HYPOTHESIS TESTING & RESEARCH FINDINGS 57 - 58
Figures FIGURE 1: WILLINGNESS-TO-PAY RESEARCH METHODS 66 FIGURE 2: THEORETICAL RESEARCH MODEL 32 FIGURE 3: AVERAGE PRICE PAID FOR FAIRTRADE AND NORMAL HOT CHOCOLATE 42 FIGURE 4: AVERAGE SELLING PRICE PER PRODUCT PER PRICING CONDITION 49
9 | P a g e
1. Introduction “Ethics is about how we meet the challenge of doing the right thing when that will cost more than we
want to pay. There are two aspects to ethics: the first involves the ability to discern right from wrong,
good from evil, and propriety from impropriety. The second involves the commitment to do what is
right, good and proper. Ethics entails action." (Maxwell, 2003)
Recent studies on ethical consumerism suggest that consumers are increasingly able to fulfil
the first aspect to ethics Maxwell identifies. Survey results indicate that purchase behaviour
no longer solely relies on the product’s functionality but also on how and by whom these
products are made (BBC News 2006). A study from the Cooperative Bank in the United
Kingdom revealed 57% consumers have recommended a company for its responsible
reputation, and 35% have felt guilty about unethical purchases (Kleanthous & Peck, 2006),
while 66% of consumers indicate a specific interest in purchasing Fairtrade (The Nielson
Company, 2008). Such trends in demand have resulted in the intentional ethical veiling of
specific products for commercial reasons, moving them from marginal to mainstream through
means of a much wider range of products, namely: coffee, chocolate, tea, clothes, honey,
bananas and other fruits, roses, wine, nuts, vegetables, olive oil, et cetera.
Nevertheless, the commitment and action stressed by Maxwell is lacking. In a seemingly
paradoxical nature it appears consumers overstate the importance of ethics in their purchase
decisions and are not, in practice, willing to pay the higher prices that, to date, come with
ethical consumption. For example, total sales figures of Fairtrade products are a mere 0.01%
of global food trade (Witkowski, 2005; MacGillivray, 2000 as mentioned in de Pelsmacker,
Driesen, & Rayp, 2005a), and organic products occupy a niche of 1.5 – 2% (Wier &
Calverley, 2002). It has been suggested that perhaps the commitment to ethical consumption
is less than the commitment to having a comfortable personal life (Strong, 1997).
Alternatively, consumers may not be willing to pay more for convenience products whose
functional benefits are identical to lower priced goods. Albeit the fact that consumers are
realising that price is less important than value, Makower states that consumers will only
choose a fairer product provided it costs the same, does not require effort to find and buy, and
is at least as good as the alternative (Franklin, 2008).
In light of these possible explanations, and the fact that ethical consumers are inconsistent in
their purchase behaviour, managers need to understand how to translate moral principles into
buying patterns that are not simply based on a temporary news story or campaign (Strong,

10 | P a g e
1997). Therefore, it is vital that companies and governments understand why consumers
purchase such products, their willingness to pay a premium for moral product attributes, the
consumer response to alternative pricing strategies, and personality variables that affect this
response. Given the current financial crisis, buyer price perceptions and consciousness are an
even more pressing concern, especially for more expensive ethical produce. Moreover,
findings will enable more effective pricing, and segmentation of consumers by means of the
degree to which they buy and use Fairtrade products when exposed to alternative pricing
strategies, also positively affecting a firm’s marketing communications targeting strategies.
Companies attempt to differentiate themselves from their competitors through their products
and services, or their marketing strategies. As mentioned above, many companies have
already altered the composition of their products to include socially acceptable raw materials,
including: the adoption of Fairtrade cotton by Marks and Spencer, Top Shop, Sainsbury’s and
Oasis in the UK; the launch of the biological and Fairtrade ‘puur & eerlijk’ private-label
brand by the Dutch supermarket chain Albert Heijn; the use of Fairtrade coffee by Starbucks;
the use of Fairtrade cocoa and sugarcane by Koninklijke Verkade and Nestlé, and many more.
These structural changes, in addition to giving the opportunity for differentiation, enable firms
to charge higher prices for their products (Voormolen, 2009). Hence, pricing is a vital element
of a company’s marketing strategy that aims to capture the value different consumers are
willing to pay for a product in order to maximise overall company profitability. In the case of
Fairtrade this would additionally result in a greater flow of capital to small-scale Fairtrade
farmers in the Southern hemisphere.
Currently, Fairtrade products tend to be priced higher than equivalent non-Fairtrade products,
which is likely to be the reason for the existing attitude-behaviour gap in ethical purchasing.
For example, consumers need to pay 30 to 80 percent more for Fairtrade bananas (in the
European Commission and Japan respectively) than for conventional bananas, a price
accepted by few (Food and Agriculture Organization, 2001). Different and innovative pricing
strategies may alter reactions among (ethical) consumers, which may help facilitate the
growth of moral and ethical purchase habits. By extension, increased and consistent altruism
will benefit the dependents in the South, who take the hardest blows from society. Therefore,
it is interesting to test whether different pricing mechanisms have a positive effect on the
desired price premium consumers are willing to pay for a moral product attribute.

11 | P a g e
In order to do so, several sub questions are interesting to research including:
(1) How much larger (or smaller) is the return on ethical products when the control of
determining the premium lies in the hands of the consumer, versus paying a fixed
stated price?
(2) Which consumer personality variables can reverse the impact and effectiveness of
alternative pricing strategies?

12 | P a g e
2. Literature Review
2.1 The Rise of Ethical Consumerism
Although altruistic behaviour has been posited to reside in human nature (Hauser, 2006;
Smith, 1759), the act of incorporating this altruism into daily consumption habits is a
relatively novel concept. Contrary to evolutionary and vernacular altruism (for insights see
Sober, 1988), ethical consumerism entails intentionally purchasing basic products that are not
harmful to the environment, animals and people that produce them.
The concern for ethics has increased among businesses as well as consumers over the years
(McKinsey & Company, 2007; Wier & Calverley, 2002; Strahilevitz, 1999; Rode, Hogarth &
Le Menestrel, 2008; Zak, Stanton & Ahmadi, 2007). Public scepticism about large
corporations’ corporate social responsibility (CSR) claims is pressuring firms to address
social, environmental, and governance issues in novel ways (McKinsey & Company, 2007;
Crowe & Williams, 2000). This lack of trust is influencing consumers to make-up for the
deficiency in accepted responsibility by taking part in ethical consumption. Moreover, the
trends of environmentalism and health-consciousness have further disposed the consumer to
incorporate these products in daily purchase behaviour due to the search for food safety and
quality (Wier & Calverley, 2002). Hence, as expected, interest in organic food products has
multiplied in the developed world (Wier & Calverley, 2002) and sales for ethically labelled
goods escalated approximately 42% in 2002 in the United Kingdom (Rode et al., 2002); in the
United States approximately $199 billion was donated to charities (Zak, Stanton & Ahmadi,
2007), and cause-related marketing initiatives – such as that undertaken by Proctor & Gamble
by donating one tetanus shot to a pregnant woman, or woman of child-bearing age, per pack
of Pampers diapers bought – are increasingly common (Stahilevitz, 1999). Furthermore, the
fact that there are more ethical brands today that have developed into legitimate brands
suggests that there are enhanced levels of information and brand awareness (Grunert, 2005),
as well as accompanying positive associations.
As ethical awareness has increased, ethical values are increasingly a factor consumers
consider when making buying decisions. Ethical values, such as a fairer wage for producers in
the Third World (Kanji, 2008), animal rights, the environment, and labour practices (Auger,
Devinney, Louviere & Burke, 2008), were found to be significant influencers for people

13 | P a g e
buying ethical alternatives. Other studies support these findings stressing that consumers have
come to care about more than merely the functional benefits attained from consuming
products, including safe and honest production processes, and the retention of dignity and
autonomy of producers (de Pelsmacker et al., 2005b). The degree to which products are
considered socially responsible and their respective prices are the largest determinants of
purchase according to recent findings by Gielissen and Graafland (2009). Alternatively,
Arnot, Boxall, and Cash (2006) found that ethical attributes may have been the main influence
on buying behaviour for Fairtrade coffee, as opposed to price. Similarly, Harriet Lamb
concludes an ethical shopper would choose an ethical version of the product over a regular
product, albeit it’s higher price, as they are concerned about more than price (Jones, 2004).
There are however numerous reasons for which consumers purchase moral products beyond
ethical considerations. A specific analysis of Fairtrade coffee by Pelsmacker et al (2005a)
identified the main brand of a product, and its flavour as the most important determinants
influencing purchase; the presence of the Fairtrade label was only of mediocre importance,
followed closely by packaging and blending. Sociology posits that a brand a person buys
transcends to the individual identity (Adams & Raisborough, 2008; Connolly & Shaw, 2006;
Maynard 2007; Griskevicius, Tybur & van den Bergh, 2010), and reflects their beliefs and
value systems (Jones, 2004); therefore the enhanced image one may feel upon purchasing
more expensive moral brands may also influence one’s purchase decision (Boulstridge &
Carrigan, 2000; Giskevicius et al., 2009). This is further supported by findings by Maynard
(2007) that reveal the predominant reason for buying the hybrid Toyota Prius is because “it
makes a statement about me...[showing the world that I care].”
Though it is frequently claimed by researchers and customers that buyers attach value to the
ethical attributes, the actual buyer side to the exchange does not appear to manifest this (Hunt
& Vitell, 1992, and Folkes & Kamins, as mentioned in Carrigan & Attalla, 2001; Strong,
1997). In fact, Makower (2007) commented that ethical products are only bought if they attain
all points of parity with other products (Franklin, 2008). Consumers are mainly concerned
about price, quality, value of the product, and convenience (Boulstridge & Carrigan, 2000; de
Pelsmacker, Janssen, & Mielants, 2005b; Carrigan & Attalla, 2001; Memery, Megicks, &
Williams, 2005), especially when buying a commodity. Within the current ethical era,
therefore, it still appears that consumers stress the importance of price for which products and
brands to buy. Kramer (1990) and Cook (1991) suggest that this conceivably prevails due to

14 | P a g e
the high price premium attached to ethical products, and that previous research overestimated
the purchase intentions of consumers and their willingness-to-pay, as they were not obliged to
make trade-offs similar to those faced in reality, thus were not considering freshness, taste,
appearance, and budget constraints. The fact that many ethical brands have been on the
market for decades, such as Stichting Max Havelaar which was founded in 1988, yet do not
have large market shares indicates there is a discrepancy between consumer attitudes and
actual purchases for these product lines. A closer look into consumer product reviews shows
that many consumers complain about the higher costs of ethical products; Moa Green Balm
for instance was found to “cost more than most balms” (Ethical Product Review, 2008).
Moreover, Bart Lacroix (2010) – founder, director, and manager of the 1 % CLUB, an
organisation that sets up projects in developing countries, by utilising the expertise of
consumers in the West, via the internet – believes many ethical brand logos have acquired a
brand reputation of being too expensive due to persistent association between the brand and
the price premium; hence have a reverse effect on facilitating purchases when observed on the
product by the consumer. The pricing strategy applied to ethical products, and consumers’
reactions to them, should therefore be further analysed.
This research paper will limit the discussion to Fairtrade as the ethical product because on the
surface this form of trade appears to be a novel, market-driven initiative that targets a growing
segment of consumers willing to pay higher prices for socially responsible product attributes;
however, a closer look reveals its minimal impact to date, and the rare, myopic focus on the
supplier-side of trade in today’s consumer society. Fairtrade, in contradiction to free trade, is a
movement which aims to create a level playing field for trade between First and Third World
countries by reinforcing the importance of the source of production and its compensation. A
small-scale analysis would reveal that Fairtrade aims to guarantee that poor, small-scale
farmers receive a minimum above-market wage; hence average Fairtrade product prices are
also higher (Strong, 1997; Witowski, 2005; Rode et al., 2008). In the absence of Fairtrade, the
commodity crisis is causing a race-to-the-bottom for the price of commodities – due to the
nature of these products, many commodity producers are unable to absorb price shocks when
they occur, thus putting them at substantial risks of exploitation by large multinational
companies (MNCs) and the increasing power of consolidated retailers. The aim of Fairtrade is
to prevent this. It is important to note that Fairtrade is a certification system whereby a label is
placed on the package of a firm’s products so that consumers can identify when these meet
the agreed Fairtrade standards. The standards to which businesses and products must adhere

15 | P a g e
to so as to carry the Fairtrade label include: raw materials must be sourced from FLO-CERT1
certified producer organisations, the supply chain must have been monitored by FLO-CERT
to ensure integrity (buyers must adhere to paying the minimum market price for the desired
commodities plus a development premium, and must agree to finance 60% at the beginning of
the harvest as credit to the farmer organisation), and sufficient Fairtrade ingredients must have
been used in the manufacturing process (for more detailed insights please see
http://www.fairtrade.net/standards.html).
Contemporarily, vendors appear to base the price of their Fairtrade certified products on a
form of cost-plus pricing to reflect the elevated (yet fair) raw material costs, the premium
given to the Fairtrade cooperative to develop itself, and the higher supply chain costs due to
lower export volumes (The Fairtrade Foundation, 2005). As Frans van de Ven (2012) – the
current Representative of the Food and Agriculture Organization (FAO) in Cape Verde –
critiqued, investigations into the Fairtrade value chain have identified many high costs
associated with flying experts from overseas to small-scale farms to qualify them for the
Fairtrade label, as well as unannounced visits for verification purposes, which further increase
costs. This highlights the complex and costly nature of Fairtrade initiatives.
Retailers who need to pay these premiums will aim to pass them on to their customers in the
form of augmented prices (The Fairtrade Foundation, 2005). Bezencon and Blili (2009)
investigated strategies of Coop, McDonalds Switzerland, Switcher, La Semeuse, and Magasin
du Monde – retailers and brands that carried Fairtrade products – to discuss, amid other
strategic variables, how prices are set for these ethical goods. McDonalds Switzerland did not
advertise that it used Fairtrade certified coffee since this information was solely directed at
stakeholders other than the consumer, and Magasin de Monde had no influence in
manipulating prices for its products. Hence, eliminating these firms concludes that out of the
three businesses that were targeting ethical consumers and were able to manipulate the price
for their Fairtrade certified products, three charged a price premium on them. As previously
discussed, similar findings emerged from practical examples and observation. It is likely that
by applying such a cost-plus based pricing strategy, the price competition fostered among
conventional and Fairtrade certified products has an inhibitive effect on Fairtrade purchases.
1 Fairtrade International’s (FLO) worldwide certification body that takes care of producer certification and
inspection. It is part of a bigger organisation, FLO, which develops Fairtrade standards, licenses buyer and label usage and markets the Fairtrade label in consumer countries.

16 | P a g e
In fact, Lacroix (2010) asserts that the customer focus on price leads to the consumer
choosing the conventional product, and the only way to eliminate this is by making the use of
Fairtrade mandatory by law, thereby eliminating this prevalent price competition.
Exploiting the inherent ‘moral charge’ manifested within the Fairtrade certification mark in
the eyes of the consumer, and translating it into sales would be valuable to practitioners and
small-scale farmers alike. In opposition to products within the same product category,
Fairtrade certified products carry social equity which is likely to carry additional emotional
value to the consumer. This is likely to enhance the value proposition in the eyes of an
ethically-conscious consumer, thereby increasing the likelihood of purchase. Research into
the value proposition indicates consumers’ perceptions of the value strategy (value equity,
brand equity, and relationship equity) directly and indirectly affects loyalty and future sales
(Vogel, Evanschitzsky & Ramaseshan, 2008). Value equity portends to the perceived ratio of
what is received – the produce – versus what is given up – money; for Fairtrade it is likely
that the value equity is lower than similar non-Fairtrade certified products due to its higher
price. Brand equity is the value added to the brand due to intangible factors; the Fairtrade
certification mark has increased in awareness without mass media campaigns due to the fact
that it is strong, unique, and desirable, therefore this equity driver is likely to be high.
Relationship equity pertains to the links created between a brand and a company; though it is
hard to draw any conclusions on this dimension, Fairtrade certified products attempt to make
the supply chain from the producer in the South, and the consumer in the North more
transparent, which may have an impact in driving up the level of relationship equity.
Kleanthous and Peck (2006) identify an additional equity driver that is growing rapidly,
namely social equity. Social equity depends upon ethical practice, social engagement,
employment ethos, service orientation, social responsibility, emotional proximity, and social
utility (ibid, based on Young & Rubicam’s Brand Asset Valuator), which are all very high for
Fairtrade certified products. The sum of all of these value drivers indicates that the value
proposition for Fairtrade certified products is relatively high compared to non-Fairtrade
certified products, hence positively influencing loyalty and sales. The fact that the food
industry is a very saturated market indicates the need for points of difference to maintain a
competitive advantage, such as the social equity naturally embedded in the Fairtrade
certification mark. This implies that from a value-based pricing perspective, the prices
charged for these products can be higher and consumers should be willing to pay for them in
exchange for the additional value received.

17 | P a g e
Contrary to the price-value trade-off discussed above, behavioural finance has suggested
consumers are rational and therefore select the product offered at the lowest price for the
largest quantity (Friedman, 1967; Connolly & Shaw, 2006). Such a tendency to overweigh
rational attributes, while minimising the importance of more subjective attributes (e.g. the
shape or origin of a product’s raw materials), even when there is a preference for a specific
subjective attribute, may be caused by the fact that price is an easily distinguishable factor to
the consumer, free of bias (Hsee & Zhang, 2004). In addition, rational consumers use easy
heuristics when undergoing purchases, such as using a fixed proportion of income for certain
product categories (Hall, 1990). This rational consumer seems to be present in many studies
conducted within the Fairtrade field: Kanji (2008) noted that the second major reason
consumers did not purchase Fairtrade was due to the higher costs, and that consumer studies
revealed on average only 20% of people in Europe would pay more for Fairtrade, regardless
of the positive social and environmental consequences; Carrigan & Attalla (2001) stated that
consumers do express affinity to ethical goods, but will only buy them if they themselves are
not inconvenienced, and get the same price and quality; De Pelsmacker, Janssens and
Mielants (2005b) highlighted reducing the price of Fairtrade would be one of the most
influential measures in increasing the number of consumers that would buy them and the
frequency with which these products would be bought since all segments of ethical consumers
detested the elevated price of Fairtrade products; Shaw and Clarke (1999) further stress the
cost restraints faced by many consumers and that when ethics and price concerns conflict (as
they do with Fairtrade given the option of competing products similar in function, yet lower in
price) either quantity gets restricted or the cheaper non-ethical product alternative is selected.
This rational economic perspective implies that motivating people to turn to more socially-
orientated purchase habits would require such products to become cheaper, more efficient,
and provide the consumer with incentives (Griskevicius et al. 2010).
In extension to the theoretical discussion of the extremes above, in practice consumers seem
to seek a middle-ground since the price of Fairtrade certified products is frequently at the
upper-end of the product category’s price range. Twenty percent of people believe that the
benefits of ethical product attributes are worth paying a premium for (Nielsen, 2007; Auger et
al., 2008), although very few agree strongly to this. Research reveals that consumers are
willing to pay a certain premium on Fairtrade products, but that this premium is lower than
what is currently being charged in the marketplace. Only 10% of Belgian consumers were

18 | P a g e
willing to pay the current social premium for Fairtrade products, which are set at 27% (de
Pelsmacker et al., 2005a). In fact, Belgian and US consumers were willing to pay a 10% and
3% premium on Fairtrade certified coffee respectively (de Pelsmacker et al., 2005a), whereas
Danish consumers would pay an additional 13 – 18% of the regular price of toilet paper for
the eco-labelled alternative (Bjorner et al., 2004 as mentioned in Arnot et al., 2006).
Moreover, a study summarising research conducted across Europe examining the proportion
of consumers that would buy ethical products at differing price premiums concluded that
many more consumers would buy ethical products if the price premium was lower: on
average purchases would multiply by five if premiums decrease from 50 – 60% to 5 – 10%
(Wier and Calverley, 2002). Similarly, Auger, Burke, Devinney, and Louviere (2003)
concluded consumers were willing to pay different amounts for different product attributes,
within which ethical attributes were amongst the top two most important and valuable. At the
extreme, Kimeldorf, Meyer, Prasad, and Robinson (2006) found a small group of consumers
that were willing to pay a 40% premium on ethically produced socks, but again the share of
sales was sensitive to a reduction in the premium. These results indicate that consumers seem
to be willing to pay a premium for Fairtrade products and form the basis for the first
hypothesis that will be studied in this research:
H1a: Consumers are willing to pay more for Fairtrade products than their conventional
substitutes.
Not only did the price premium consumers were willing to pay differ for different levels of
involvement with Fairtrade, but also based on the type and price of product. Luxury products,
which could be positioned within the transformational half of the Rossiter-Percy-Bellman
Grid, were most effectively advertised by evoking emotions within the consumer (Rossiter &
Bellman, 2005). Given that these products are pleasure-orientated, associating an altruistic
incentive with such a product is more likely to affect the consumer than it would on a
necessity (Zak et al., 2007; Strahilevitz, 1999). According to distributive justice – based on
equal ratios of inputs and outputs – and procedural justice – determined by societal norms and
behaviour – consumers should be prepared to pay more for luxurious Fairtrade products than
for non-ethical alternatives, as not paying the premium would result in an imbalance and
hence evoke feelings of guilt. It is also more likely that a premium paid on luxury products
induces the ‘warm glow’ feeling associated with stimulating charity (Zak et al., 2007). On the
contrary, consumers are likely to perceive inequity when relatively high ethical premiums are
placed on necessary products (Strahilevitz & Meyer, 1994), which most Fairtrade certified

19 | P a g e
products are, as these are required to fulfil basic needs for all humankind. Correspondingly, in
accordance to pricing theory, it has been found that the higher the price of a product (usually a
frivolous product), the higher the ethical premium can be without encouraging consumers to
switch to the non-ethical alternative, and the lower the price of the product (usually a practical
product), the less the consumer will want to pay for a premium (Rode et al., 2008;
Strahilevitz, 1999; Shampanier, Mazar & Ariely, 2007). These product-based price
perceptions have consistently been shown to influence willingness to pay; hence managers
need to adjust the ethical premium charged based on the product. The reluctance by
consumers to pay a high ethical premium may be explained by the fact that the majority of
Fairtrade products are (necessary) grocery products.
The previous discussion highlights the controversy and debate surrounding the pricing of
Fairtrade certified products, and whether ethical foods are worth a premium price (Nielsen,
2007). Perhaps managers are leaving a lot of money on the table by charging these higher
prices – lower prices, that are more in accordance to the consumers’ value perception, may
stimulate greater sales from incumbent and novel consumers, who have fewer justification for
non-compliance (Briers, Pandelaere & Warlop, 2007), that could overcome the costs. In
contrast, demand does not decrease significantly when the price of Fairtrade goes up (Arnot et
al., 2006), thus there may also be consumer surplus that the managers can gain by increasing
their pricing. Existing studies conducted with the aim of identifying the consumer
willingness-to-pay for Fairtrade certified products have consistently been performed within
the framework of cost-plus pricing. The main disadvantage of this pricing strategy is that it
tends to ignore the role of the consumer, particularly in an increasingly dynamic retailer
environment. Therefore, this research is set out to test what the effect of a participative
pricing strategy is on the consumer’s product choice and willingness to pay for Fairtrade
versus conventional products. Novel psychological pricing methods have recently emerged
that may be better suited to ethical products, since they allow consumers to express their
individual support and value towards a social brand, and they may eliminate the inherent price
comparison that consumers engage in whilst shopping, as discussed below.

20 | P a g e
2.2 Pricing Strategies
The development of the World Wide Web has initiated many alternative price-setting
mechanisms, including two-part and psychological pricing methods that increase the
transparency of a product’s cost structure, and put the control of the final price in the hands of
end-customers, in order to make it more acceptable to increasingly sceptic consumers. The
use of these pricing strategies has become more common in today’s virtual environment:
online shops, for example, often separate the cost(s) of the product(s) and shipping and
handling fees, and in some supermarkets the price of the product and its value-added-tax are
parted. From a consumer perspective, presenting a partitioned price, versus one all-
encompassing price, has been found to influence both the perceived cost and value of the
product, and even largely influences consumer behaviour (Shampanier et al., 2007; Bertini &
Wathieu, 2008). It is thus vital to analyse these consumer reactions since typically the only
role of prices is to indicate the cost of making a purchase.
Partitioned prices were often underestimated by the consumer as a direct consequence of
discount processing and neglecting the lower surcharge in calculations (Morwitz, Greenleaf,
& Johnson, 1998; Xia & Monroe, 2004). The consumer has, in fact, been found to recall the
total price of a product eight percent lower when it was presented in components than as an
all-inclusive price (Lee & Han, 2002). It thus appears that partitioned pricing can reduce the
perceived cost of the product. Moreover, in contrast to all-inclusive prices – in response to
which consumers simply pay attention to the dominant attribute – partitioned prices have been
found to increase the amount of attention paid to secondary and tertiary dimensions (Bertini &
Wathieu, 2008). Fairtrade and other social certification indicators have been found to be the
sixth attribute consumers look for when purchasing goods in traditional supermarkets (De
Pelsmacker et al., 2005; Idea Consult, 2002). Hence, sensitising the consumer to these
features, which are so evidently overlooked in today’s cluttered environment, can have a
multitude of advantages. Firstly, by bringing forth the differentiated aspects (Bertini &
Wathieu, 2008) upon which Fairtrade certified products build their competitive advantage,
and secondly, by making the transaction more understandable and traceable to the average
consumer (Bertini & Wathieu, 2008; Xia & Monroe, 2004) by identifying what monetary
amount of the sale would go to the seller and the producer – an uncertainty that often even
troubles and puts off do-gooders in donation settings (Berrens, Jenkins-Smith, Bohara, &
Silva, 2002) – the salience of the Fairtrade attribute is likely to rise in consumers’ overall
evaluations of product offers and play a greater role in influencing shopping behaviour.

21 | P a g e
Research has shown that when a surcharge appears to contribute to the seller’s profits rather
than cover costs, it is deemed to be more effective to use an all-inclusive price to avoid
negative word-of-mouth and boycotting (Schindler, Morrin & Bechwati, 2005; Lee & Han,
2002); however in the case of Fairtrade certified products, the separate premium for the
farmers is likely to be positively received. Despite the benefits that could be gained from
implementing a partitioned pricing strategy to Fairtrade products, the vastly fluctuating
changes in market commodity prices would require companies to frequently adjust the
absolute monetary values attached to each price component (the cost-based and premium-
based parts). This is likely to be very impractical, and result in high menu costs, thereby
making it a less viable strategy.
Alternatively, the internet has also introduced more consumer-oriented pricing strategies that
capture individuals’ product valuations. Such participative pricing methods include zero as a
special price, pay what you want (PWYW), and name your own price (NYOP). Literature on
these pricing strategies is scarce; however the myriad of advantages that can be attained by
both the seller and the buyer suggests that they should be considered with respect to Fairtrade
certified products.
In the most extreme case, firms can opt to charge customers nothing for their products. An
increasing amount of research has underscored the effectiveness of zero pricing (Poundstone,
2010; Kim, Natter, & Spann, 2009), particularly to increase the demand for perceived low-
value goods (Shampanier, Mazar, Ariely, 2007). Nevertheless, not charging any price for
Fairtrade certified products – though increasing their demand – will contradict the image and
mission they represent; namely to give producers in Third World countries a better, and fair
deal for their produce. Therefore, simply applying this strategy is unlikely to be fruitful in
enhancing the demand for Fairtrade certified goods while minimising its revenues.
In contrast to charging a fixed price (even a fixed price of zero), NYOP is a participative
pricing strategy where consumers have the liberty to offer any price for the product, but the
seller will only accept it when it is above a certain minimum threshold set by the seller and
unknown to the buyer. Compared to PWYW pricing, it reduces the risk faced by the seller by
enforcing an undisclosed minimum price below which the seller can reject the buyer’s bid
(Shapiro & Zillante, 2009). Evidently, this enables the seller to protect himself from buyers
seeking to pay well below the costs of the product, as the minimum price is likely to be the

22 | P a g e
marginal cost of production (Spann & Tellis, 2006). Nevertheless, the NYOP strategy has
been suggested to be ineffective in the long-run, when it is applied to repeat purchase fast
moving consumer goods, such as most Fairtrade certified products. Over time, rational
customers will acquire large quantities of information and are thus likely to learn the
minimum price threshold, subsequently reducing their bids to this minimum. Consequently,
the more experience the customer acquires, the lower the surplus that may be earned by the
seller and passed on to the producers, especially for fast-moving consumer goods that people
buy routinely without much thought or involvement. Since the NYOP strategy removes the
transaction transparency desired by ethical buyers and implements a minimum price that may
also encompass additional earnings for the vendor as opposed to the farmers, it is unlikely to
allay consumer beliefs that the vendor has ulterior motives by engaging in such a CSR
initiative. Thus, in comparison to fixed prices for Fairtrade products, the NYOP strategy does
not appear to be value-adding hence shall not be tested further.
PWYW, a similar strategy is “a participative pricing model in which a buyers’ control over
the price setting is at a maximum level” (Kim, Natter, & Spann, 2009). This implies that the
seller is obliged to accept any price that the buyer offers to pay for a specific product,
including zero. Initially this raises the seller’s downside risk: the risk that the buyer cheats the
seller by paying a price of zero or similar price below the sellers’ marginal costs.
Nevertheless, it has successfully been applied to a variety of product categories: the most
recent album of the indie band Radiohead was downloadable under PWYW, resulting in two
million purchases and a higher revenue than previous online albums (Kim et al, 2009);
Michelin star restaurant Little Bay, in an attempt to tackle to declining revenues from the
current financial crisis, has doubled its number of customers by using a PWYW strategy
(Moore-Bridger, 2009); and software retailer Binarynow saw an increase in sales of 61%
compared to the same period the previous month, in parallel to a five percent higher
conversation rate, though this did come at a cost as 82% only paid the minimum price of two
dollars – which was intended to cover the internet transaction costs (Neal 2009a; Neal 2009b).
Employing PWYW on Fairtrade certified products could repeat the aforementioned success;
however it also leaves much room for customers to further profit at the expensive of
underpaid farmers in the developing world.
In contrast to conventional pricing, PWYW pricing is likely to alter the consumers’
perception of numerous variables surrounding the product – including its value – since it is

23 | P a g e
the consumer who must initiate the transaction with a bid. Consumers’ perception to pricing
has, in turn, been found to alter consumer behaviour and final product or service choice
(Chandran & Morwitz, 2005; Shampanier et al., 2007; Carlson & Weathers, 2008; Kim et al.,
2009; Gabor & Granger, 1993). The customer has been posited to perceive the application of
standard pricing methods as a money-market relationship; hence they apply rational,
economic norms to assess the respective exchange. This implies that in a simple transaction,
the consumer compares the product’s costs to its value to determine whether or not to buy –
which is consistent with the norm of self-interest. On the other hand, PWYW pricing does
not demand a set price in return for the product. Consequently, this transaction is more likely
to mimic a moral market and hence be perceived as a social-market relationship by the
customer, where social exchange norms (such as the norms of equity, reciprocity, and
cooperation) dominate. In such situations, abstaining from payment may be internalised as a
form of stealing, which often results in internal distress because of inherent conflicting social
norms. Additionally, when this occurs in a public situation, like a supermarket, the effects of
distress are likely to be further leveraged due to the supplementary effect price has as an
impression management tool (Lynn, 1990 as mentioned in Kim et al., 2009; Griskevicius et
al., 2010).
The nature of Fairtrade certified products is such that there is both a humanistic aspect (given
its association with higher incomes for small-scale Third World farmers), as well as a
commercial aspect (since the sale of Fairtrade certified products is currently framed as a
commercial transaction where a consumer acquires the product for a fixed, normally elevated,
price). Hence, in accordance with the previous discussion, the sale of Fairtrade certified
products could be perceived as occurring within the money market and/or moral market. It
would be expected that the story behind Fairtrade ensures that these products are
unequivocally associated with humanistic elements, in which case emotions are likely to play
a large role in decision-making, since people will want to help poor farmers. Strong (1997)
and Gielissen (Sloot, 2010), however, attributed the diminutive impact of Fairtrade to date on
its problem of effectively communicating the human element to the customer. Consequently,
economic norms are probably used to evaluate the offer today, and form comparisons with
functionally competitive conventional products. This may imply that the norm of self-interest
prevails, undermining the sale of Fairtrade certified products due to its higher prices.
Employing pricing strategies that allow the customer to fix the price are likely to highlight the
presence of the humanistic elements these products encompass, and position them within the

24 | P a g e
moral market. By placing control of the price the producer receives with the customer, the
customer is likely to apply the norms of reciprocity and equity, and accordingly be willing to
pay a higher price. Hence, the second hypothesis to be tested in this research reads:
H1b: Consumers are willing to pay higher prices on average for Fairtrade products under PWYW than
their conventional fixed priced alternatives,
H1c: Consumers are willing to pay lower prices on average for conventional products under PWYW
than their Fairtrade fixed prices alternatives.
Additionally, Griskevicius, Tybur, and van den Bergh (2010) discovered that the purchase of
socially responsible products does not only occur to help those worse-off, but also to improve
one’s self-image. Publicly buying Fairtrade certified products probably enhances others’
evaluation of you since you are likely to be perceived as a do-gooder, while also indicating
that you have the additional resources to afford such products and continue living
comfortably. Recent research looking into willingness-to-pay estimations has shown that
estimates of what other people are willing to give is frequently used as a reference to decide
how much you should give in donation settings (Croson et al., 2009). On the other hand, it has
been deemed that people tend to overestimate the amount that others are prepared to buy a
product for in comparison to themselves (Frederick, 2011). Such effects of social influence
have been found to occur in many situations from the decision to smoke and drink among
teenagers (Pechmann, Zhao, Goldberg, & Reibling, 2003), to willingness to participate in a
charity and respective donation amounts from adults (Croson, Handy, & Shang, 2009). It is
likely that the degree of social pressure someone feels will impact their decision to purchase
an ethical product and how much to pay for it. Hence, the recently discovered influence of
others’ behaviour on ours, and the ability to enhance one’s image by buying socially-
responsible goods, like Fairtrade, further supports using participative pricing mechanisms on
these products (also because there is no set maximum price consumers can contribute). Since
the benefit of non-payment is likely to lie far below the anticipated distress of non-payment
caused by the violation of social norms (Kim et al., 2009) and the lower public image formed
by bystanders and spectators (Griskevicius et al., 2010), participative pricing strategies
applied to Fairtrade products are likely to be successful from the producer’s perspective. Thus
it is expected in the third hypothesis that:
H2a: Prices paid for Fairtrade and conventional products are higher when consumers are surrounded
by others than when they are alone.

25 | P a g e
H2b: Estimates of others’ product choice and price paid affects own product choice and price paid
respectively.
Empowering the consumer – by using participative pricing methods that put the task of price
determination with them – has widespread advantages. Firstly, the PWYW mechanism allows
sellers to benefit from heterogeneous customer price and product-valuation segments (Kim et
al., 2009; Fernandez & Nahata, 2009). In this setting, natural price discrimination takes place
as customers who value the products more are likely to pay higher prices, while on the other
end of the spectrum there are also likely to be some free-riders (Terwiesch, Savin, & Hann,
2005; Shehryar, 2008; Abbas, Hann and Terwiesch, 2011). This moreover implies that
demand for the product is likely to increase, as customers who found the previous posted-
prices too high are no longer priced out of the market. Also, the reduced barrier of a higher
price as a reason not to purchase Fairtrade certified products is likely to enhance consumer
attention and awareness of their existence. Secondly, participative pricing has the potential to
influence the depth at which consumers analyse different product attributes. Particularly for
products that consumers purchase without much thought or consideration – low involvement
goods – it is often simple heuristics like price, or habits that influence sales. Hence, secondary
attributes are frequently overlooked. As a result of a PWYW strategy consumers may be more
inclined to look beyond price differences and place more weight on the importance of the
ethical component, thereby increasing purchase probabilities. Thirdly, the novelty of these
pricing models, within the context of a café or supermarket, will attract a vast amount of
attention – from customers, media, and competitors who will spread the news further through
word-of-mouth. This too is likely to leverage the popularity, awareness, trial, and equity of
the products, while also increasing the seller’s differentiation, credibility and pricing image in
the eyes of the customers (Fay, 2009) – a large advantage in today’s cluttered environment. In
addition, they are simple and easy strategies to explain to consumers. Fourthly – similar to
Bolton, Warlop, and Alba (2003) – Kim, Natter, and Spann (2009) found that people prefer to
actively participate in price-setting than to accept a seller-set price because there is extensive
belief that the fair price of a product lies below its actual selling price. For Fairtrade certified
products whose prices are on average more expensive, this belief is likely to be even greater.
The importance of fairness in exchanges for social brands, in particular for a label like
Fairtrade that intrinsically encompasses these values, makes a participative pricing strategy
well-suited. Since consumers’ willingness-to-pay is partially influenced by the perceived

26 | P a g e
fairness of the exchange, competitive prices, income, satisfaction, and altruism (Kim et al.,
2009; Cox, 2001; Carlson, & Weathers, 2008), giving the consumer the freedom to determine
the price they feel is right is likely to increase perceptions of fairness; hence they are expected
to be more likely to be willing to pay an extra amount. In the context of Fairtrade certified
products, the direct emotional linkage and the accompanying responsibility of determining an
appropriate price is likely to amplify the amount paid. Research conducted by Gneezy,
Gneezy, Nelson and Brown (2010) indicated that during the purchase of photographs at a
theme park, using a PWYW strategy when 50% of revenues were donated to charity
decreased sales volume in comparison to a fixed price with charitable contribution and a
PWYW strategy for conventional photographs, but increased average prices paid and total
revenues – even after the donations were made. These findings suggest that people do not
only care about money; they identify with the company and ethical and social causes they
support, plus want to send a signal of this support through means of the amount of money
spent. Hence, it is expected that applying a PWYW strategy to Fairtrade products will show
similar results. Consumers who do not strongly support Fairtrade will defer from purchasing
the products at all, as opposed to paying a low price for them since this will give a costly, bad
signal, deemed unworthy (Gneezy et al., 2010). Nevertheless, these findings are in contrast to
Briers, Pandelaere, and Warlop (2007) who observed that in a purely charitable donation
setting, where people were allowed to give any amount, many consumers had trouble
estimating a suitable amount to give, which led to greater choice deferral than under a
condition similar to the current sale of Fairtrade products where a fixed donation amount is
provided (i.e. through the price premium). It is not expected that applying psychological
pricing strategies to Fairtrade certified products would lead to similar internal decision
making difficulty, since firstly consumers are faced with an economic transaction as opposed
to a request for charity; and secondly, they are surrounded by functionally similar, competing,
conventional products – both in supermarkets and cafés – which provide external references
prices (ibid).
Reference prices, whether internal or external, are used by consumers as a way to guide them
in valuing a product or service and hence deciding on what, where, and how much to buy and
pay. Internal reference prices are prices stored in the memory of the consumer, accumulated
from previous purchase experiences and other past environmental cues (Kotler & Keller,
2008), whereas an external reference price is the price of a similar or competing good (Kim et
al., 2009). Briers, Pandalare and Warlop (2007) concluded that the most effective way to

27 | P a g e
enhance payments towards a social cause is by specifying the donation amount – similar to
providing an external reference price – without attaching it to a product. This is probably
because it avoids consumers analysing the charity setting from an economic perspective,
assessing and comparing the free product’s costs, value, and usefulness. Nevertheless, the
authors only tested the combination of a donation with a worthless token, such as a key chain.
It is likely that building ethics and incorporating charitable causes into the production process
of basic necessities on an individual’s shopping list, as is the case with Fairtrade certified
products, will not evoke similar comparisons as buying the product simultaneously benefits
both parties involved. In addition, in this research design competing conventional goods
provide an immediate external reference price that can be used to facilitate estimating
willingness to pay for the Fairtrade alternative placed under PWYW. Previous studies
investigating the use of PWYW pricing methods have shown external reference prices
significantly increase prices paid for identical products by on average four percent (Kim et al.,
2009). The additional social attribute encompassed in the Fairtrade product is hence expected
to further augment consumers’ willingness to pay. What is more, ethical consumers have been
considered to be less price sensitive than regular consumers (Szmigin, Carrigan &
O’Loughlin, 2007; Connolly & Shaw, 2006; Arnot et al., 2006; de Pelsmacker et al., 2005a).
This has been found to further decrease as repeat purchases occur due to the enhanced
goodwill experienced by purchasers, and the greater perception of these prices being for a
good deed (Cox, 2001).
Besides the ample evidence underscoring the advantages participative pricing mechanisms
can have, there are risks that presumably discourage many firms from using it. Firstly,
manipulating the pricing strategy of Fairtrade certified products to positively influence the net
contribution from consumers may further undermine the moral, humanistic commitment to
the cause. This could have negative repercussions on other Fairtrade campaigns, or future
compliance rates. Secondly, there is a large downside risk – when using PWYW pricing – that
the consumer will free-ride, and choose to pay a price which lies far below its costs, making
the deal unprofitable to the seller. Yet, while the average price paid per Fairtrade certified
stock keeping unit may fall, it is still expected that participative pricing will result in a huge
boost in baseline sales, as a larger group of people are expected to undergo trial and repeat
purchases. Alternatively, the high internal distress that may result from social costs and guilt
feelings from the fear of not paying enough, may dissuade people from purchasing completely
(Fernandez & Nahata, 2009). Consequently, there may be fluctuations in revenues between

28 | P a g e
periods. Critics could argue that these repercussions of the previously discussed pricing
strategy would counteract exactly those objectives the Fairtrade certification aims to achieve:
a stable, higher income for small-scale farmers in the South. Thirdly, overall findings from
existing research conclude that the average amount paid or donated, upon putting consumers
in control of determining the amount of money to give, drops (Kim et al., 2009; Briers et al.,
2007). Especially in the long-run, repeat purchasing has been found to reduce average prices
paid for CDs under PWYW (Regner & Barria 2009; Kim, Natter & Spann, 2010), though not
significantly, which may also be the case for Fairtrade commodities sold under PWYW. For
this reason, as Kim, Natter, and Spann (2009) asserted, products most suited to PWYW
strategies have high (low) fixed (variable) costs – costs that are constant (vary) in relation to
the amount produced – since they are easier to compensate. In the case of Fairtrade certified
end-products it is hard to assess the cost distribution, because small-scale farmers unite into
cooperatives to make production processes more efficient and effective. The raw material
subsequently undergoes complex production processes in factories where fixed costs are
vastly greater.
From the previous analysis, it can be concluded that a participative pricing strategy appears to
be a viable pricing strategy for Fairtrade certified products. Despite the natural risks that
accompany such pricing methods for these products, a PWYW strategy may enhance the
humanistic attributes in the eyes of the consumer, enable a greater number of people to
engage in ethical purchasing (more frequently), and give consumers the responsibility and
opportunity to express their support for farmers in the Developing World. Hence, it is
hypothesised in this research that a PWYW strategy, albeit atypical, could be used to increase
profits from Fairtrade products in comparison to fixed prices.
2.3 Consumer Psychology
As the previous literature review has revealed, research on similar auction pricing studies
remains limited. Some studies look into the specific design of the auction, the level of
competition, profitability, and most suitable products, while others analyse the (ir)rationality
of consumer behaviour ex post repeat bidding and the effect such a pricing strategy has on
consumer cognition (Spann & Tellis, 2006; Terwiesch et al., 2005; Shapiro et al., 2009; Kim
et al., 2009; Fay, 2009; Chandran et al., 2005; Rao, 2009). Additionally, research pertaining to
the ethical consumer remains centred on trying to identify this consumer through means of
demographic and character-defining variables (see Mazar & Zhong, 2010). Seemingly

29 | P a g e
missing in research to date is the effect psychological pricing methods can have on consumer
perceptions, especially when applied to ethical brands.
Decades of research has pointed out that price, quality, convenience, habit but also social
values influence consumers’ purchases; however it is not fully understood how the type of
pricing strategy may affect consumer behaviour and perception. The purchase and
consumption of food in particular is interesting, as it can be seen as a negotiation of what a
person will or will not ingest in their bodies. In hedonic literature for example, healthier
products are often associated with lacking in taste, less pleasurable to eat upon actual
consumption, and are hence chosen less frequently (Raghunathan, Naylor, & Hoyer, 2006).
This is in stark contrast to findings showing that ethical consumers claim to pay more
attention to sustainable products and perceive them to be tastier, fresher, of higher quality, and
therefore healthier (Vermeir & Verbeke, 2006). Jager (2000, as mentioned in Vermeir &
Verbeke, 2006) posits that when people are willing to put effort into a specific decision it
stems from their high involvement – as opposed to low involvement that tends to result in
more routine purchase behaviours. This suggests that the involvement of ethical consumers
with sustainable products is higher, hence their motivation to purchase such products is
higher, thereby increasing their actual ethical purchase rates. In addition to influencing pre-
purchase actions, involvement has also been found to impact post-purchase experience and
enjoyment. Given the fact that participative pricing strategies require greater cognitive effort
from consumers as they have more influence and power in paying the price they feel a
product is worth, it is likely that they will feel more involved when faced with such a pricing
condition. This increased involvement under a PWYW pricing condition is likely to manifest
itself in increased liking and quality assessment towards the product after consumption in
accordance with cognitive dissonance theory, due to the conversion from extrinsic to intrinsic
purchase motives (Shampanier et al., 2007). Moreover, this effect may even appear to be
greater when PWYW is applied to social brands since the greater emphasis given to the
humanistic aspect of Fairtrade is expected to leverage these effects. Similar to intriguing
conclusions by Mazar and Zhong (2010) that engaging in ethical consumption can have
greater effects on consumers’ overall altruistic attitudes and behaviour, it is expected that
liking and taste evaluations of ethical products can also be affected by the applied pricing
strategy, as will be assessed in this research.
H3a: Products bought under PWYW receive higher taste and liking scores than those bought under a
fixed price.

30 | P a g e
H3b: The aforementioned effect PWYW has on taste and liking is greater for Fairtrade certified
products, than normal products.
Not only can pricing strategies have a long-term impact on attitudes, but in classic literature
attitudes and emotions have also been found to influence the relationship between brands and
advertisements and consumer behaviour, also moral behaviour (de Pelsmacker et al., 2005a,
2005b; de Pelsmacker & Janssens, 2007; Vermeir & Verbeke, 2006; Vallerand, Pelletier,
Deshaires, Cuerrier, Mongeau, 1992). Pricing, as the fourth marketing tool of brand
managers, may also have a similar influence. This means that consumers who have a positive
attitude towards Fairtrade and Fairtrade products would be more inclined to buy Fairtrade
products than consumers who have a negative attitude towards Fairtrade. In addition, it is
expected that people with a positive attitude towards Fairtrade will also be willing to pay a
higher premium for Fairtrade products, also when faced by a PWYW strategy. Similarly,
more empathetic people, who are able to envision and understand the emotions of another
person, are likely to be more responsive to social brands and will be willing to pay more for
such brands. This shall be tested in the following research:
H4a: Consumers with a positive attitude towards Fairtrade are more likely to choose the Fairtrade
product than the normal alternative.
H4b: Consumers with a positive attitude towards Fairtrade will pay more for Fairtrade products under
PWYW than consumers with a low attitude towards Fairtrade.
H4c: Consumers with high levels of empathy are more likely to choose the Fairtrade product than the
normal alternative.
H4d: Consumers with high levels of empathy pay more for Fairtrade products under PWYW than
consumers with low levels of empathy.

31 | P a g e
3. Methodology
Prior research done to determine consumers’ willingness-to-pay for any product have used
various research methodologies (for an overview of these methods see Figure 1 in Appendix I
with further explanation in Breidert, 2005). These methods vary to the extent that they take
into account actual purchase contexts and provide an incentive to the consumers to reliably
reveal their true reference price (Wertenbroch & Skiera, 2002). The vast existing research
done to measure the value consumers place on social product features is expected to have
overestimated the purchase intention and consumer willingness-to-pay due to the lack of
trade-offs presented to and considered by respondents and the use of direct surveying
techniques to elicit complex price estimates (Auger, Burke, Devinney & Louviere, 2003;
Kamer, 1990; Cook, 1991; Breidert, Hahsler & Reutterer, 2006). The following research thus
aims to more validly gauge the willingness-to-pay for Fairtrade products by consumers
through implementing a PWYW strategy in a field experiment (Breidert, 2005). Field
experiments are becoming a more popular research method, especially in the case of PWYW
pricing (Gneezy et al., 2010; Kim et al., 2009; Kim et al., 2010; Shehryar, 2008; Boelaars,
2010; Shapiro et al., 2009), since they allow for observation of actual purchase actions and
control for confounding variables such as the social bias frequently present in alternative
research approaches (Nisbett & Wilson, 1977 as mentioned in Briers et al., 2005;
Blumenschein et al., 2008; Shuttleworth, 2010). In addition, this study will aim to expand
prior research by testing the application of PWYW as a pricing strategy for a social product
attribute, while subsequently trying to assess the impact it may have on consumer product
evaluation.
In summary, this study will set out to investigate the following research questions:
1. What is the moral charge encompassed in the Fairtrade certification mark? What
premium are consumers willing-to-pay for such a moral product attribute?
2. What is the effect of a PWYW strategy on the demand and willingness-to-pay for
Fairtrade certified versus conventional products?
3. To what extent can the pricing strategy influence product quality perceptions?
4. To what extent do repeat purchases and social presence moderate the prices paid?
5. To what level do empathy and ethical attitudes moderate product choice and payment?
6. What role do demographics play in ethical purchasing?

32 | P a g e
The figure below illustrates the model to be investigated:
3.1. Empirical Research
Following the previous discussion of viable methodological designs, this research was
conducted as a 3 x 1 field experiment with the cooperation of Albron’s Catering Café, the
Coffee Corner, at the Erasmus University T-building in Rotterdam, the Netherlands. The
widely generalisable nature of the design of this café – where customers pass by quickly on
their way to purchase the things they need, do not know the sales force behind the counter and
maintain a sense of anonymity towards them, and do not tip for service – was well-suited for
this field experiment.
Hot beverages were chosen to be the experimental products, as these are frequently available
at cafés in both the Fairtrade and conventional format. In addition, they have low variable
costs, thereby minimising the risk exposure faced by the seller if consumers’ payments lie
below the products’ marginal costs. In particular, the focus product in this research was
Fairtrade cocoa. Fairtrade cocoa is one of the longest standing and fastest growing Fairtrade
products on the market; hence it was familiar to consumers and researchers alike. The
rationale for carrying out the experiment on students was three-fold. Firstly, the use of
students in a vast amount of prior research has shown that they can be used without
jeopardising the generalisability of the findings. Although students have a relatively low
income and some may still live at home (thus they are not responsible for the daily groceries),
hot chocolate is likely to be a beverage consumers indulge in for its taste, therefore its
attributes are likely to have a greater impact than habitual consumer necessities such as
+/-
+
FixedNormal&Fairtrade:
- a fixed price for Fairtrade labeled product
- a fixed price for conventional product
Price Paid
Product Choice
Product Quality
Repeat Purchases
Importance Social Acceptance
Payment Method
Presence of Others
PWYWFairtrade:
- a PWYW price for Fairtrade labeled product
- a fixed price for conventional product
PWYWNormal:
- a fixed price for Fairtrade labeled product
- a PWYW price for conventional product
Consumer Demographics
Sales Volume
Other Products (cannibalization)
Empathy
Attitude to Fairtrade
Estimate others’ price paid &
choice made
Figure 2: Theoretical Research Model

33 | P a g e
coffee. In addition, a hot beverage is a minor cost within monthly expenditures, therefore
manipulating its price is unlikely to drastically impact behaviour for saving purposes.
Moreover, students of this age conduct their purchases independently at the University, thus
their opinion and behaviour is relevant. Secondly, a higher education has been found to
influence familiarity and awareness with the notion of sustainability and Fairtrade (Vermeir &
Verbeke, 2006). To assess attitudes (positive or negative) may be less evident and unreliable
when respondents are not aware. Thirdly, they make-up tomorrow’s consumers and their
consumption habits and related reactions and behaviour are likely to be carried into the future;
hence they are deemed the most appropriate subjects in research aimed to identify
opportunities to encourage ethical consumption.
Three price conditions made up the independent variable, and were manipulated as follows:
Price Condition 1 (FixedNormal&Fairtrade):
Consumers were faced with a single fixed price for both Fairtrade and conventional hot
chocolate. Since hot chocolate beverages tended to be sold at the Coffee Corner in this way,
this was used as the control condition. The typical price of normal hot chocolate was €1.50,
which was kept constant in FixedNormal&Fairtrade to avoid promotional effects. Moreover, for
internal validity and comparison purposes, the Fairtrade cocoa was equally priced.
Price Condition 2 (PWYWNormal):
Consumers were faced with a single fixed price of €1.50 for Fairtrade certified hot chocolate,
similar to FixedNormal&Fairtrade. But, they could also choose a conventional hot chocolate under
the PWYW pricing strategy. Due to the fact that this is a relatively novel concept, buyers
were informed about the specific pricing mechanism avoiding any terms that could alter the
perceived value of the price, as suggested by Gneezy, Gneezy, Nelson and Brown (2010). The
determination of the price for the conventional hot chocolate was entirely set by the buyer.
The transaction took place as the seller had to accept this price, regardless of its magnitude.
Price Condition 3 (PWYWFairtrade):
In reverse to PWYWNormal, consumers were faced with a single fixed price of €1.50 for the
conventional hot chocolate and a PWYW pricing strategy on Fairtrade hot chocolate. Once
again, due to the novelty of the pricing strategy, buyers were duly informed about the pricing
strategy.

34 | P a g e
Stemming from existing methodologies like the most recent and relevant experiment
conducted by Gneezy, Gneezy, Nelson and Brown (2010), this research was similarly
conducted to test the effect of a PWYW price strategy on several dependent variables namely:
actual price paid, real demand, and taste perceptions of conventional and Fairtrade labelled
hot chocolate. Flyers were used to advertise the hot chocolate beverage. Once consumers
approached the counter ordering a hot chocolate, they were faced with a dichotomous choice:
to opt for Fairtrade labelled hot chocolate or Normal, non-Fairtrade hot chocolate. The
employee who greeted the consumer would inform and ask each consumer in a standardised
way “Today you have a choice between Fairtrade hot chocolate at [the price specified in the
treatment] or normal, non-Fairtrade hot chocolate at [the price specified in the treatment].”
Information about the meaning behind Fairtrade was displayed around the cafeteria, as was
done by Gneezy, Gneezy, Nelson and Brown (2010) (see Appendix II), and if there were any
questions concerning this label, employees were instructed to explain Fairtrade using its
international definition as derived from their homepage: “Fairtrade products are produced and
traded under fair trading conditions. The label ensures that a higher price is paid for cocoa
from farmers in developing countries to encourage social and environmental development
there” (www.fairtradeusa.org). The PWYW pricing strategy was explained as “a price
strategy where you, the consumer, can decide how much the cup of [product under the
PWYW pricing strategy treatment] hot chocolate is worth to you, and how much you are
willing to pay for it.” Subsequent to the purchase, consumers were asked to fill in a short
questionnaire upon consumption of the hot chocolate beverage (see Appendix III for an
example).
The brief consumer questionnaire concerned scales to measure the dependent variables,
moderating variables, and controls including socio-demographic factors. A probe question
was also included to verify that respondents were unaware of the purpose of the experiment.
To avoid demand effects after purchasing the hot chocolate, customers were approached to fill
in the questionnaire as part of a customer satisfaction survey on behalf of the company,
Albron.
Firstly, the dependent variables product choice and price paid were measured in the course of
the experiment whereas two questions “How tasty do you think this hot chocolate was?” and
“How much did you enjoy drinking this hot chocolate?” made up the multi-item tastiness
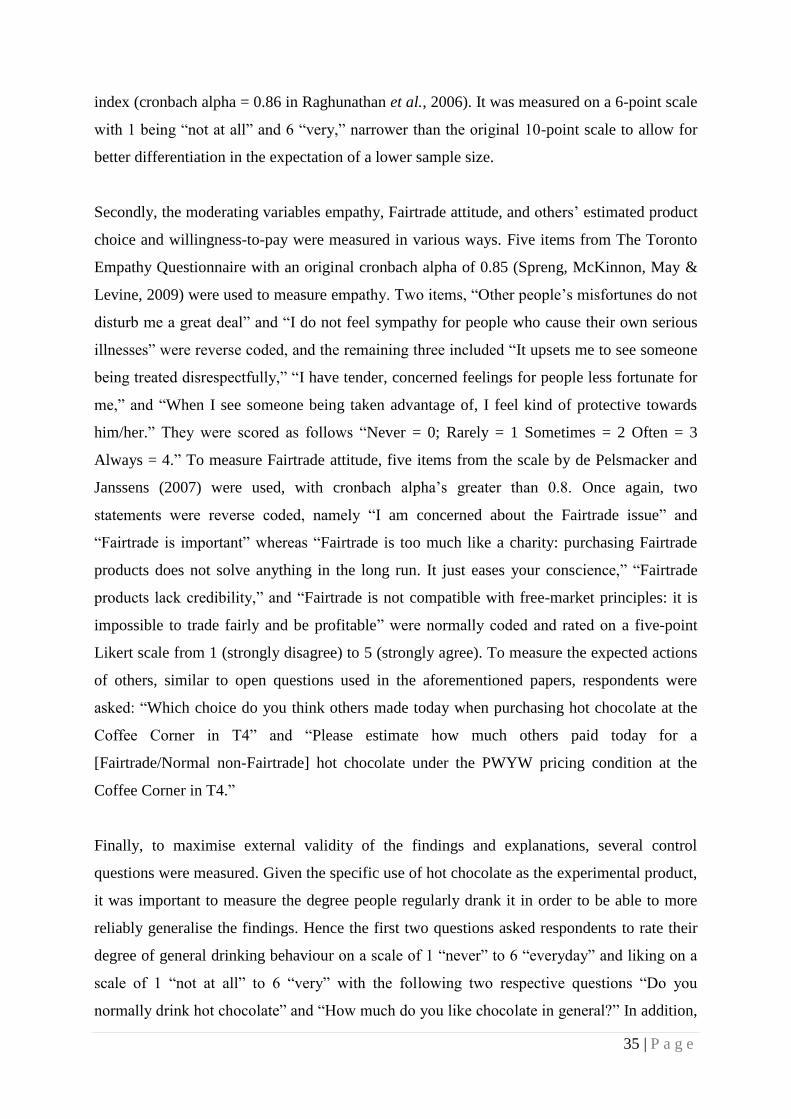
35 | P a g e
index (cronbach alpha = 0.86 in Raghunathan et al., 2006). It was measured on a 6-point scale
with 1 being “not at all” and 6 “very,” narrower than the original 10-point scale to allow for
better differentiation in the expectation of a lower sample size.
Secondly, the moderating variables empathy, Fairtrade attitude, and others’ estimated product
choice and willingness-to-pay were measured in various ways. Five items from The Toronto
Empathy Questionnaire with an original cronbach alpha of 0.85 (Spreng, McKinnon, May &
Levine, 2009) were used to measure empathy. Two items, “Other people’s misfortunes do not
disturb me a great deal” and “I do not feel sympathy for people who cause their own serious
illnesses” were reverse coded, and the remaining three included “It upsets me to see someone
being treated disrespectfully,” “I have tender, concerned feelings for people less fortunate for
me,” and “When I see someone being taken advantage of, I feel kind of protective towards
him/her.” They were scored as follows “Never = 0; Rarely = 1 Sometimes = 2 Often = 3
Always = 4.” To measure Fairtrade attitude, five items from the scale by de Pelsmacker and
Janssens (2007) were used, with cronbach alpha’s greater than 0.8. Once again, two
statements were reverse coded, namely “I am concerned about the Fairtrade issue” and
“Fairtrade is important” whereas “Fairtrade is too much like a charity: purchasing Fairtrade
products does not solve anything in the long run. It just eases your conscience,” “Fairtrade
products lack credibility,” and “Fairtrade is not compatible with free-market principles: it is
impossible to trade fairly and be profitable” were normally coded and rated on a five-point
Likert scale from 1 (strongly disagree) to 5 (strongly agree). To measure the expected actions
of others, similar to open questions used in the aforementioned papers, respondents were
asked: “Which choice do you think others made today when purchasing hot chocolate at the
Coffee Corner in T4” and “Please estimate how much others paid today for a
[Fairtrade/Normal non-Fairtrade] hot chocolate under the PWYW pricing condition at the
Coffee Corner in T4.”
Finally, to maximise external validity of the findings and explanations, several control
questions were measured. Given the specific use of hot chocolate as the experimental product,
it was important to measure the degree people regularly drank it in order to be able to more
reliably generalise the findings. Hence the first two questions asked respondents to rate their
degree of general drinking behaviour on a scale of 1 “never” to 6 “everyday” and liking on a
scale of 1 “not at all” to 6 “very” with the following two respective questions “Do you
normally drink hot chocolate” and “How much do you like chocolate in general?” In addition,
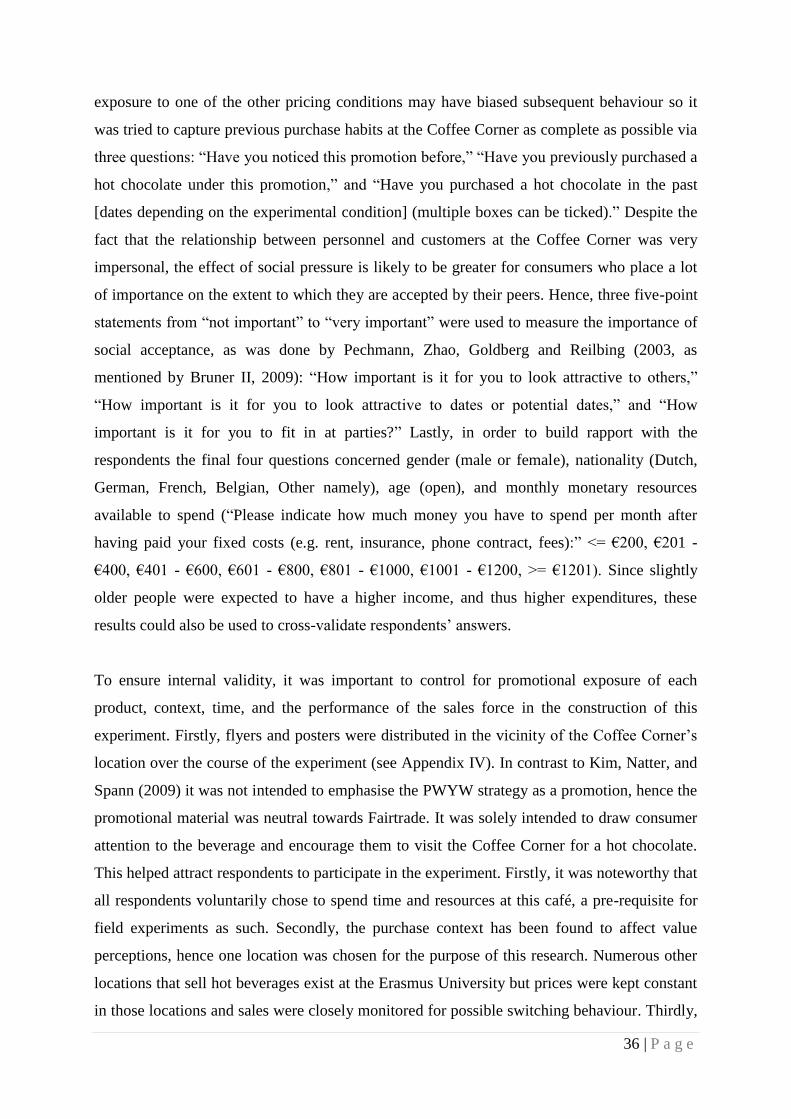
36 | P a g e
exposure to one of the other pricing conditions may have biased subsequent behaviour so it
was tried to capture previous purchase habits at the Coffee Corner as complete as possible via
three questions: “Have you noticed this promotion before,” “Have you previously purchased a
hot chocolate under this promotion,” and “Have you purchased a hot chocolate in the past
[dates depending on the experimental condition] (multiple boxes can be ticked).” Despite the
fact that the relationship between personnel and customers at the Coffee Corner was very
impersonal, the effect of social pressure is likely to be greater for consumers who place a lot
of importance on the extent to which they are accepted by their peers. Hence, three five-point
statements from “not important” to “very important” were used to measure the importance of
social acceptance, as was done by Pechmann, Zhao, Goldberg and Reilbing (2003, as
mentioned by Bruner II, 2009): “How important is it for you to look attractive to others,”
“How important is it for you to look attractive to dates or potential dates,” and “How
important is it for you to fit in at parties?” Lastly, in order to build rapport with the
respondents the final four questions concerned gender (male or female), nationality (Dutch,
German, French, Belgian, Other namely), age (open), and monthly monetary resources
available to spend (“Please indicate how much money you have to spend per month after
having paid your fixed costs (e.g. rent, insurance, phone contract, fees):” <= €200, €201 -
€400, €401 - €600, €601 - €800, €801 - €1000, €1001 - €1200, >= €1201). Since slightly
older people were expected to have a higher income, and thus higher expenditures, these
results could also be used to cross-validate respondents’ answers.
To ensure internal validity, it was important to control for promotional exposure of each
product, context, time, and the performance of the sales force in the construction of this
experiment. Firstly, flyers and posters were distributed in the vicinity of the Coffee Corner’s
location over the course of the experiment (see Appendix IV). In contrast to Kim, Natter, and
Spann (2009) it was not intended to emphasise the PWYW strategy as a promotion, hence the
promotional material was neutral towards Fairtrade. It was solely intended to draw consumer
attention to the beverage and encourage them to visit the Coffee Corner for a hot chocolate.
This helped attract respondents to participate in the experiment. Firstly, it was noteworthy that
all respondents voluntarily chose to spend time and resources at this café, a pre-requisite for
field experiments as such. Secondly, the purchase context has been found to affect value
perceptions, hence one location was chosen for the purpose of this research. Numerous other
locations that sell hot beverages exist at the Erasmus University but prices were kept constant
in those locations and sales were closely monitored for possible switching behaviour. Thirdly,
37 | P a g e
similar to the manipulation of the pricing strategy (fixed price vs. PWYW) and the inclusion
of a charitable component (half the revenues being donated to charity vs. no charity) of
souvenir photos bought after a ride at a US theme park by Gneezy, Gneezy, Nelson and
Brown (2010), each aforementioned pricing condition was available at the Coffee Corner for
two consecutive days during one week to eliminate any sporadic day effects. The remaining 4
days of the week (Sunday the café was closed) there was no treatment. The time lag between
the various treatment conditions, created by having one pricing strategy per week, ensured
that there was no interference from possible day effects, and also gave consumers a chance to
forget about the previous conditions to revert to their regular behaviour. Fourthly, it was
necessary to control for the behaviour and language used by the sales force. In previous
research (Gneezy et al., 2010) theme park visitors were informed about the pricing strategy
and charitable component included in their purchase at the register, without making use of
vocabulary that could affect the perceived value of the offer. Correspondingly, the sales force
working at the Coffee Corner received a training prior to the start of the experiment to ensure
consistency2; a reminder paper behind the counter (see Appendix V), and the researcher
herself joined as an employee for the experimental days to further ensure a consistent
implementation. Since customers did not know the researcher, her presence behind the
counter further ensured anonymity. Employees’ behaviour was monitored throughout the
three experimental weeks, although they were not informed about the true intentions behind
the experiment until it was completed.
In order to account for the fact that there would be both English and Dutch speaking
customers at the Coffee Corner, the questionnaire was translated. To confirm that the Dutch
questionnaire was identical in meaning to the English questionnaire, two fluent bilingual
professionals were asked to translate the Dutch version to English, and two to translate the
English version to Dutch. Thereafter, four others were asked to compare the questionnaires in
meaning. To finalise the two questionnaires, a small pre-test with five respondents was
conducted to identify any other problems and confusions. Though two respondents expressed
hesitation when answering the reversely coded empathy question “Other people’s misfortunes
2 The sales force was told not to refer to past prices or future prices, nor were they to mention or imply that this
was a temporary promotion. They were also asked to maintain a consistent tone of voice – avoiding a quieter and
softer voice when describing the payment schemes and the concept of fair trade – and a professional approach
regardless of reactions from consumers. Finally, they were instructed to call a supervisor should any problem
occur. For questions concerning the fair trade attribute, the sales team were instructed to stick to the common
definition of Fairtrade: the label provides a higher price for the cocoa sourced from farmers in developing
countries to encourage higher social and environmental standards (de Pelsmacker et al., 2005a).

38 | P a g e
do not disturb me a great deal,” it was decided to pursue with the scale as it was set up by
Spreng, McKinnon, May, and Levine (2009) to also try identify respondents that were not
filling in the questionnaire seriously.
Lastly, the employees behind the counter noted how much consumers paid, their
environmental context (i.e. whether they were alone or with other people around them), and
whether payment occurred with cash or by card (see Appendix VI).
3.2. Data Cleaning
Depending on the day and week in which consumers visited the Coffee Corner, they were
confronted with one of the three pricing strategies (Fairtrade at €1.50, Normal non-Fairtrade
at €1.50 vs. Fairtrade at €1.50, Normal non-Fairtrade under PWYW vs. Fairtrade under
PWYW, Normal non-Fairtrade at €1.50) when ordering a hot chocolate beverage. Given the
nature of a field study, consumers independently decided to purchase the product under study
ensuring random assignment, and were subsequently asked to fill in a satisfaction survey to
improve the service of the Coffee Corner in return for a biscuit to accompany their beverage.
Overall 104 people participated in the experiment by purchasing a hot chocolate over the
course of six days; 31, 34, and 39 in FixedNormal-Fairtrade, PWYWNormal and PWYWFairtrade
respectively. To ensure this dataset could be used for analysis, it was examined and cleaned
by eliminating irrelevant respondents, re-coding the four reversely coded variables in two
scales, and checking for missing, extreme or inconsistent values. Eight questionnaires were
not (fully) completed post-purchase and one respondent knew the purpose of the experiment;
hence they were registered as missing variables and excluded from the analysis via case-wise
deletion, resulting in 96 valid respondents (64 female, 32 male). The product choice, price
paid, payment method and environmental context were nevertheless noted for those eight
consumers and were thus included in the analysis of these variables. One extreme value of
€25 was identified as an estimate of what others paid that day for a Normal, non-Fairtrade hot
chocolate under the PWYW strategy, however this did not seem to affect the remaining
answers, hence pairwise deletion was applied to this case throughout the analysis. In addition,
various tools were used to detect any influential outliers. However box plots, standardised z-
scores, and the fact that the five percent trimmed mean did not significantly differ from the
mean for all core interval variables suggested outliers were not a problem. Finally, Grubb’s
test was used to identify whether the extreme values were significant outliers from the others.

39 | P a g e
Two prices paid of €0.00 and €2.80 in PWYWFairtrade were considered to be outliers, however
removing them from the dataset did not significantly impact the means or any of the findings
and it was considered invalid to remove them since in real-life situations there are often
polarising views towards a CSR initiative and it is expected to have a large variance.
Therefore they were kept in the dataset for analysis.
3.3. Validity and Reliability Check
Before analysing the results of the questionnaire, the multi-item scales had to be checked for
reliability. Despite their use in previous studies, the scales for Fairtrade attitude, empathy,
importance of social acceptance, and tastiness index were checked via a factor analysis. This
analysis was allowed on the aforementioned measurement items since the Barlett Test of
Sphericity identified the correlation matrix as being significantly different from an identity
matrix (χ2 = 524.43, p < 0.001), and there was sufficient common variance between the
variables for the analysis to be performed (Kaiser-Meyer-Olkin sampling adequacy measure
was very high at 0.67). Due to the chance that empathy was significantly correlated with
Fairtrade attitude – where more empathetic people were likely to have a higher Fairtrade
attitude due to their ability to sympathise and care more about people less fortunate than
themselves – an oblique factor analysis with direct oblimin rotation was conducted. The
findings revealed that the items that made up the scale in previous studies, did in fact load
highly on their respective scales, confirming that they could be combined and used for
subsequent analysis.
Using the Eigenvalues criteria being greater than one, and judging the Scree Plot depicted in
Appendix VIII, it was concluded that five factors explained 68.54% of the variance of the
underlying data. Table III in Appendix IX shows the final factor loadings of each variable,
and illustrates that the percentage of variance in the variable explained by the factor model,
the communalities, is quite high. The items loaded as they should have, with high internal
reliability measures for tastiness index (α = 0.93), importance of social acceptance (α = 0.74),
and general drinking behaviour (α = 0.66). For Fairtrade attitude, five items were initially
expected to compose the multi-item scale. Although “Fairtrade products lack credibility” also
loads onto another factor, it was assigned to its highest loading factor where it fit more
logically. An inspection of cronbach’s alpha additionally revealed that the scale could be
strengthened from 0.68 to 0.72 by removing the negatively phrased Fairtrade Concern item.
Similarly, the item “Other people’s misfortunes do not disturb me a great deal,” which was

40 | P a g e
expected to load heavily on the factor empathy was removed from the previous scale as the
double negation clearly led to much confusion in respondents and ended up measuring
something else. This also improved cronbach’s alpha from 0.72 to 0.78. Though the scales of
empathy and Fairtrade attitude were found to significantly correlate positively (rho = -0.31, p
= 0.002), where customers with a more positive attitude to Fairtrade also scored as being
more empathetic, the two constructs measured different things and any multicollinearity was
ruled out (VIF = 1.01, Tolerance = 0.99).
From this factor analysis it was concluded that the variables used in this research did in fact
measure the constructs they aimed to measure and were fit for further use, as all the variables
loaded onto factors that closely reflected scales taken from previous studies. For subsequent
analyses, consumers’ scores on each multi-item construct were composed of the mean of their
score of the variables that made up this construct.
3.4. Normality and Manipulation Check
To use parametric statistical tests, it had to be ensured that the data followed a relatively
normal distribution, and that each of the conditions had a similar distribution. Table V in
Appendix VII gives an overview of the mean, standard deviation, sample size, and
distribution per variable, per pricing condition, per product choice (Fairtrade or Normal). For
all the data together it seemed only age was not approximately normally distributed – due to
the fact that the experiment was conducted at a University there were a larger number of
younger consumers. When interpreting the results, this negative skew (skewness = - 1.06,
kurtosis = 5.15) was taken into account. Robustness tests and manipulation checks (available
in detail in Appendix VII) confirmed that the groups exposed to the three different pricing
strategies did not differ significantly from one another in terms of demographic characteristics
age, gender, income, nationality and general drinking behaviour, and showed that none of the
variables nor errors significantly differed from a normal distribution and thus the multi-item
scales could be reliably used for further hypothesis testing.

41 | P a g e
4. Results: Coffee Corner
4.1. Control Tests
General Drinking Behaviour
Three ANOVAs were conducted on average hot chocolate drinking behaviour, liking, and
general drinking behaviour to find that there were statistically no differences across the three
pricing conditions (F(2,93) = 1.44, p = 0.24; F(2,93) = 0.31, p = 0.74; F(2,93) = 0.57, p = 0.57
respectively). Additionally, Levene’s statistic of 0.06 (p = 0.94) for hot chocolate drinking
behaviour and 1.01 (p = 0.37) for hot chocolate liking highlighted there were no significant
differences in the variance of these two variables across the conditions. This implied that
consumers’ behaviour and perception of hot chocolate in general were similar across the
conditions, and did not unduly influence variations in other factors. Moreover, Fairtrade and
Normal hot chocolate did not significantly differ in average taste, current enjoyment and
tastiness index within each condition (see Table VI below). Therefore changes in the taste
perceptions across treatment groups and across the product types could be attributed to price
manipulations and the different prices that people paid for the beverages, as opposed to
differences in product quality.
Table VI: Product Taste and Enjoyment
Pricing Condition Taste Product Mean SD p-value t-value
Fixed
Normal
&
Fairtrade
How tasty do you think this hot chocolate was? Normal 4.29 1.70
0.77 -0.30 Fairtrade 4.10 1.37
How much did you enjoy drinking this hot chocolate? Normal 4.43 1.51
0.87 -0.17 Fairtrade 4.33 1.20
Tastiness Index Normal 4.13 0.88
0.89 -0.14 Fairtrade 4.10 0.98
PWYW
Normal
How tasty do you think this hot chocolate was? Normal 4.56 0.78
0.45 -0.76 Fairtrade 4.27 1.28
How much did you enjoy drinking this hot chocolate? Normal 4.61 0.70
0.51 -0.66 Fairtrade 4.40 1.12
Tastiness Index Normal 4.58 0.65
0.47 -0.74 Fairtrade 4.33 1.18
PWYW
Fairtrade
How tasty do you think this hot chocolate was? Normal 4.00 1.25
0.23 -1.23 Fairtrade 3.50 1.15
How much did you enjoy drinking this hot chocolate? Normal 3.73 1.22
0.85 -0.20 Fairtrade 3.65 1.27
Tastiness Index Normal 3.87 1.19
0.47 -0.73 Fairtrade 3.58 1.15
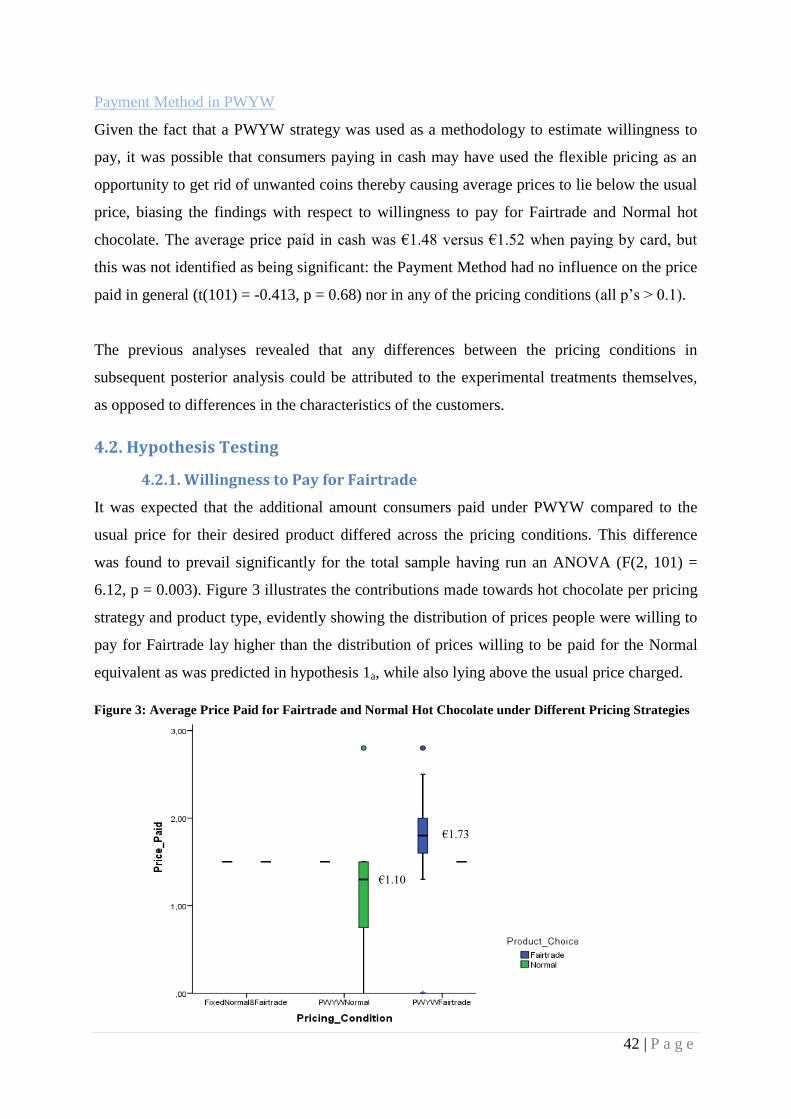
42 | P a g e
Payment Method in PWYW
Given the fact that a PWYW strategy was used as a methodology to estimate willingness to
pay, it was possible that consumers paying in cash may have used the flexible pricing as an
opportunity to get rid of unwanted coins thereby causing average prices to lie below the usual
price, biasing the findings with respect to willingness to pay for Fairtrade and Normal hot
chocolate. The average price paid in cash was €1.48 versus €1.52 when paying by card, but
this was not identified as being significant: the Payment Method had no influence on the price
paid in general (t(101) = -0.413, p = 0.68) nor in any of the pricing conditions (all p’s > 0.1).
The previous analyses revealed that any differences between the pricing conditions in
subsequent posterior analysis could be attributed to the experimental treatments themselves,
as opposed to differences in the characteristics of the customers.
4.2. Hypothesis Testing
4.2.1. Willingness to Pay for Fairtrade
It was expected that the additional amount consumers paid under PWYW compared to the
usual price for their desired product differed across the pricing conditions. This difference
was found to prevail significantly for the total sample having run an ANOVA (F(2, 101) =
6.12, p = 0.003). Figure 3 illustrates the contributions made towards hot chocolate per pricing
strategy and product type, evidently showing the distribution of prices people were willing to
pay for Fairtrade lay higher than the distribution of prices willing to be paid for the Normal
equivalent as was predicted in hypothesis 1a, while also lying above the usual price charged.
Figure 3: Average Price Paid for Fairtrade and Normal Hot Chocolate under Different Pricing Strategies
€1.10
€1.73

43 | P a g e
Similar to the indications in previous studies, respondents faced by the PWYW strategy that
chose the product type priced flexibly (i.e. selected Normal in PWYWNormal and Fairtrade in
PWYWFairtrade), paid an average price of €1.44 for their beverage3. A further breakdown, using
least squared differences t-tests, indicated that the average price paid for the Normal beverage
under PWYWNormal was €1.104. In line with initial prospects in hypothesis 1c, price paid was
€1.50 under FixedNormal&Fairtrade while consumers paid on average €0.40 less when Normal
non-Fairtrade beverages were priced under a PWYW strategy, significantly lower from when
there was fixed pricing (MDFixedNormal&Fairtrade-PWYWNormal = -0.40 p = 0.02). Hence,
notwithstanding the fact that consumers were on average willing to pay for the beverage, they
paid significantly less for it. Perhaps the novelty of the pricing strategy caught consumers by
surprise; and the fact that people have been conditioned to pay for the products they buy at a
café to ensure its survival may have acted as a motivator to at least pay something. In fact, for
the normal hot chocolate the average price paid was still 73.33% of the typical fixed price. It
was expected that the longer the PWYW strategy would be in place, and the more frequently
consumers would come in contact with it by purchasing a Normal hot chocolate priced as
such, the lower the average price paid would become. Unfortunately, the limited number of
respondents that visited the Coffee Corner at least twice during the three experimental weeks,
and were hence confronted with more than one of the experimental pricing strategies, made it
impossible to reliably test for its effect; 8 were previously exposed to the control group, 3 to
the PWYWNormal and 2 to the PWYWFairtrade.
For Fairtrade products bought during PWYWFairtrade the price paid was also found to be
significantly greater than zero at an average of €1.73 (t(22) = 13.01,p < 0.001), and as
expected in hypothesis 1b this was also marginally significantly greater – by an average of
€0.23 – than the usual price charged for the beverage at the Coffee Corner (t(22) = 1.74,
MDFixedNormal&Fairtrade-PWYWFairtrade = 0.23, p = 0.10). This finding was further supported by the
large difference between PWYWNormal and PWYWFairtrade. Confirming expectations of
hypothesis 1a, consumers’ willingness-to-pay for Fairtrade products was thought to be higher
than for normal products, where consumers in PWYWFairtrade paid on average €0.63 more for
their Fairtrade drink than consumers in PWYWNormal paid on average for a Normal hot
chocolate (MDPWYWNormal-PWYWFairtrade = -0.63, t (40) = 3.06, p = 0.004). In accordance with
3 Significantly greater than zero (t(41) = 12.75, p < 0.001), a first indication that consumers do not act extremely
rational, will not walk away without paying, and even pay on average 96% of the fixed price typically charged. 4 A price significantly greater than zero, contrary to economic assumptions of consumer rationale being that
people would walk away with a product for free (t(18) = 6.78, p < 0.001).

44 | P a g e
expectations, it appeared that consumers did see an added value in the Fairtrade label and
were willing to pay more for it when given the opportunity to do so, in comparison to the
conventional alternative.
Consumer Demographics and willingness to pay
Contrary to expectations that consumer characteristics had an influence on willingness to pay
for their purchases, this was not confirmed. Given the aforementioned findings, it was a
surprise to find that when choosing the product priced under a PWYW strategy, there was no
significant difference between the magnitude of willingness to pay for either gender (t = 0.82,
p = 0.42), free income category (t = 1.04, p = 0.31), or age (t = -0.64, p = 0.53); for neither
Fairtrade nor Normal products did this change. These findings were not expected as older
consumers tend to have higher incomes and hence were expected to be less worried about
their exact monthly expenditures, particularly on minimal costs such as a beverage. What is
more, despite the fact that women often seek to minimise household costs, research has found
them to be more willing to pay a surplus for charitable causes than the more money-hungry
male. Given that the Dutch consumer has a stereotype of being cheap and underspending, it
was expected that Dutch consumers – especially students – would profit from the PWYW
strategy and pocket any savings they could make on beverage purchases. Surprisingly, no
significant differences could be detected between prices paid by Dutch and Other nationalities
(t = -0.20, p = 0.85). In conclusion, demographics did not appear to explain the differences in
prices paid.
The Influential Effect of the Presence of Others on willingness to pay
Consumers are not only influenced in the purchase environment by their own feelings and
attitudes, but also by the people around them. The importance of social acceptance however
did not manifest as being meaningfully higher when consumers were surrounded by people
than when they were alone (MD = -0.21, t(94) = -1.48, p = 0.14). It was thought that the
importance that someone places on being socially accepted would be positively linked to
additional prices paid for the beverages since customers would feel judged by those around
them and the sales people behind the counter. In contrast to this assumption, there was no
significant relationship between the importance of social acceptance and the price paid for a
beverage labelled as Fairtrade (B = 0. 06, t = 0.32, p = 0.75) albeit marginally significant for
the Normal alternative (B = 0.38, t = 2.04, p = 0.06). Perhaps respondents that chose the
Fairtrade option were already convinced of their good image since they chose the more

45 | P a g e
socially responsible option, whereas consumers that opted for a Normal hot chocolate felt
more of a need to make up for the lost image of not being social responsible by paying a
slightly higher price when they cared more about other peoples’ judgements. This was
however not confirmed. The importance of social acceptance did not appear to significantly
influence product choice (B = -0.40, Wald χ2 (1)=1.24, p = 0.27).
The expectations in hypothesis 2a were that people that were surrounded by others in their
Environmental Context would pay a significantly greater price, and on average when this was
the case consumers paid on average €0.59 more when undergoing a purchase priced under
PWYW, than when they were alone (B = 0.59, t = 2.28, p = 0.03). This seems to suggest that
one’s image may play a significant role in psychological pricing and ethical purchasing.
Nevertheless, this effect disappeared when looking at the product choice being priced under
the PWYW strategy separately. Robustness tests indicated that there was no moderation or
mediation by this variable (pcontext*productchoice = 0.91). It was similarly supposed in hypothesis
2b that the amount that consumers thought others paid that day for the product under the
PWYW pricing strategy would be highly correlated with the amount they chose to give. There
was indeed a strongly significant positive correlation between the two variables (r = 0.75, p <
0.001). Due to the possibility of spill-over effects from asking respondents to answer this
question after they had decided a price for the beverage it was unfortunately not possible to
determine the direction of the causal relationship.
Fairtrade Attitude and Empathy on willingness to pay
Certain other attitudes have also been found to affect how much people wish to give as a
donation or in return for a product. Despite having expected that empathy and Fairtrade
attitude would positively affect the willingness to pay for the beverage in hypothesis 4d and 4b
respectively, only Fairtrade attitude was found to significantly positively influence the actual
price paid (B = -0.16, t = -2.79, p = 0.01). Similarly, considering only products bought under a
PWYW strategy, Fairtrade attitude was found to influence the willingness to pay even
stronger (B = -0.34, t = -2.65, p = 0.01). Since Fairtrade attitude was reverse coded with lower
values of the variable relating to stronger disagreements with the negatively phrased
statements, implying that the lower the score the more positive the respondent’s attitude
towards Fairtrade. As attitudes to Fairtrade decreased by one unit, respondents’ average
additional price paid also decreased by €0.16. When looking at products priced and bought

46 | P a g e
under the PWYW pricing strategies, respondents paid a significant €0.34 more as their rating
on Fairtrade attitude became more positive. Interestingly, this effect completely disappeared
when considering only Normal products under the PWYW pricing strategy (B = -0.10, t = -
0.57, p = 0.58), but remained for Fairtrade products under PWYW pricing with respondents
paying on average €0.43 more (B = -0.43, t = -2.66, p = 0.02). This seemed to suggest that
Fairtrade attitude influenced product choice, which was confirmed overall as posited in
hypothesis 4a (B = 1.38, Wald χ2 (1) = 15.09, p < 0.001), and was independent of the Pricing
Strategy that was imposed on the products at the time (pFixedNormal&Fairtrade = 0.02, pPWYWNormal =
0.04, pPWYWFairtrade = 0.02). Although the effect was slightly weaker when Normal products
faced a PWYW pricing strategy, logically a more positive attitude to Fairtrade caused people
to choose the Fairtrade beverage. Similarly, as expected in hypothesis 4c, higher empathy
levels resulted in a tendency to choose the Fairtrade alternative overall (B = -0.610, Wald χ2
(1) = 4.24, p = 0.04), but looking at each price condition it was only significant under
PWYWFairtrade (B = -1.20, Wald χ2 (1) = 3.76, p = 0.05).
4.2.2. PWYW as a Pricing Strategy
Secondly, this study analysed whether or not the pricing strategy of PWYW is a justified one
in comparison to the more common form of fixed, cost-plus pricing.
Owing to the novelty of the pricing strategy, sales could have increased across the various
pricing conditions. This however was not expected to happen due to the fact that the prices
were not actively communicated to students prior to purchase and any such effect would
likely have been caused by word-of-mouth and repeat purchases. In addition, the fact that hot
chocolate beverages were being offered at a fully flexible price to students could have
resulted in severe cannibalisation of the sales and revenues driven by other products. Once
again, this was not anticipated given that hot chocolate does not replace the caffeine acquired
from coffee, or the soothing or thirst quenching nature of tea and cold, soft drinks. In the table
below, Table VII, an overview is provided of the quantity and profit levels over the course of
the experiment.

47 | P a g e
The fact that total sales quantities and profit figures of the Coffee Corner were only measured
for the two days each condition was in place made it easier to find significant differences
across the three pricing conditions using an ANOVA (F(2,3) = 11.39, p = 0.04 and F (2,3) =
18.56, p = 0.02 respectively). Given the significant differences, t-tests could be used to
determine the direction of the relationship. The sales quantity was significantly lower under
the control condition than under PWYWNormal and PWYWFairtrade respectively
(MDFixedNormal&Fairtrade-PWYWNormal = -205, p = 0.04 and MDFixedNormal&Fairtrade-PWYWFairtrade = -
332.07, p = 0.02), thus it seemed as if the implementation of a PWYW strategy increased
sales in the company. Similarly, total sales revenues significantly differed across the pricing
conditions: on the days that the PWYW pricing strategy was applied, revenues were
significantly higher than during the control treatment (MDFixedNormal&Fairtrade-PWYWNormal = -
332.07, p = 0.02; MDFixedNormal&Fairtrade-PWYWFairtrade = -455.39, p = 0.01). Revenues were
highest at €2,900.07 when Fairtrade hot chocolate was flexibly priced, despite not manifesting
as significantly greater than when Normal hot chocolate was flexibly priced (MD PWYWNormal -
PWYWFairtrade = -123.33, p = 0.21). Thus, sales quantity significantly increased when hot
chocolate was placed under a PWYW strategy, without having a detrimental effect on
revenues. This seemed to indicate that a PWYW strategy was more advantageous to a café in
terms of bottom line than a fixed pricing strategy.
It appeared as if the observed differences between the groups were related to the
implementation of the participating pricing strategy, which resulted in more cross-selling and
thus the increase in sales of other products. But, fluctuations in total sales quantity and total
sales revenues could have explained away these differences. In fact, conducting a two-tailed
z-test of proportions highlighted that the proportion of hot chocolate sales over total sales did
not seem to significantly vary between 2.83% in FixedNormal&Fairtrade and 2.26% in
PWYWNormal (z = 0.92, p = 0.36), 2.83% in FixedNormal&Fairtrade and 2.38% PWYWFairtrade (z =
0.73, p = 0.47), and 2.26% in PWYWNormal and 2.38% PWYWFairtrade (z = -0.23, p = 0.82). On
Table VII: Sales Quantity and Sales Revenues per Product Type and Pricing Strategy
Product Type Sales Quantity Sales Revenues (€)
Total
Sample Fixed
Normal&Fairtrade PWYW
Normal PWYW
Fairtrade Total
Sample Fixed
Normal&Fairtrade PWYW
Normal PWYW
Fairtrade
Fairtrade 61 23 15 23 96.83 34.50 22.50 39.83
Normal 43 8 19 16 56.85 12.00 20.85 24.00
Hot Chocolate 104 31 34 39 153.68 46.50 43.35 63.83 Total 4236 1095 1505 1636 7542.78 1989.29 2653.42 2900.07

48 | P a g e
the other hand, the proportion of hot chocolate revenues over total revenues did marginally
vary between FixedNormal&Fairtrade, 2.34%, and PWYWNormal, 1.63% (z = 1.82, p = 0.07) – with
hot chocolate revenues being lower when a PWYW strategy was applied to Normal hot
chocolate – albeit not being significantly different between FixedNormal&Fairtrade, 2.34%, and
PWYWFairtrade, 2.20% (z = 0.36, p = 0.72) or PWYWNormal, 1.63%, and PWYWFairtrade, 2.20%
(z = -1.59, p = 0.11). These findings indicated that the changes in sales quantity over the three
treatment groups, were not proportional to the changes in profits. Despite having too few
observations to test for significance, it appeared that the Pricing Strategy did not impact the
total quantities of hot chocolate sold, hence a benchmark for sales quantities could be used to
estimate hypothetical profits had the same quantity of hot chocolates been sold over all three
conditions.
In doing this it was however noticeable that the proportion of Fairtrade and conventional hot
chocolate differed across the Pricing Strategies. Since product choice was a dichotomous
nominal dependent variable, binary regressions had to be used in order to verify the
hypotheses since this is a stronger type of test. A closer look indicated that when Fairtrade
was under a PWYW strategy, product choice did not significantly differ from the control
condition (B = 0.69, Wald χ2 (1) = 1.75, p = 0.19). On the other hand, when Normal was
under a PWYW strategy, product choice could be predicted as being significantly different
than the control condition (Wald χ2 (1) = 5.81, p = 0.02), with a significantly greater
preference for Normal (B = 1.29). Having analysed the 31 products sold under
FixedNormal&Fairtrade and the 34 products sold under PWYWNormal, it indeed appeared as if more
than double the amount of consumers chose the Normal product alternative when it was
priced under PWYW and the Fairtrade product was a fixed price (19 consumers being
55.88%), than when it was priced at a fixed price equal to the Fairtrade alternative (8
consumers, 25.81%). These results seem to suggest that the implementation of a PWYW
pricing strategy could also steer the type of hot chocolate consumers selected – to encourage
more ethical consumption, a PWYW pricing strategy could be applied to Fairtrade products.
When looking at its effect on baseline sales however, the proportions of product choice had to
be assumed as being constant across different quantities per pricing strategy.
As previously discussed, an analysis of the average selling price (ASP) per pricing condition
as depicted in Figure 4, revealed that in accordance with hypothesis 1a, consumers were

49 | P a g e
willing to pay a price significantly higher for Fairtrade hot chocolate than Normal hot
chocolate. In fact, when combining the hot chocolate types it appeared as if the ASP of €1.64
in PWYWFairtrade was significantly higher than the ASP of €1.28 in PWYWNormal (t(71) = -
2.92, p = 0.01) and marginally higher than the ASP of €1.50 in FixedNormal&Fairtrade (t(68) = -
1.71, p = 0.10). This implied that as long as proportions of Fairtrade and Normal hot
chocolate sales remained constant, revenues would be highest under PWYWFairtrade where
socially labelled goods were priced under a PWYW pricing strategy and a clear benchmark
price was given for the conventional equivalent. On the other hand, it also showed that a
PWYW pricing strategy could meaningfully decrease revenues per product sold – as it did in
PWYWNormal versus FixedNormal&Fairtrade (t(63) = 2.35, p = 0.03) – when it was applied to the
conventional product. A more in depth scrutiny of the effect of pricing strategies on Fairtrade
hot chocolate showed that when it was offered at a PWYW pricing strategy, an equal number
of units sold as in FixedNormal&Fairtrade resulted in elevated revenues by €5.33.
To eliminate the possibility that this increase existed due to differences in total hot chocolate
sales quantities, the benchmark of 39 units was taken. Had 39 units of hot chocolate also been
sold, in the existing proportions of product choice, during FixedNormal&Fairtrade and
PWYWNormal, the profits would have been as illustrated in Table VIII below.
Figure 4: Average Selling Price per Product per Pricing Condition

50 | P a g e
Once again the findings support using a PWYW pricing strategy for Fairtrade products versus
fixed pricing, as the sales revenues for a constant number of sales are higher in PWYWFairtrade.
This is line with expectations in hypotheses 1a, and 1b. Alternatively, the €8.80 lower sales
revenue on the 22 units of Normal hot chocolates sold under PWYW in PWYWNormal result in
a loss under this treatment condition versus what would usually be pocketed by the company.
In this case a PWYW strategy was found to be less effective and less profitable, in line with
hypothesis 1c. The perceived intention of a business’ corporate social responsibility
programmes may have played a role in these findings as will be discussed in Section 6.3.
4.2.3. PWYW and Perceived Product Tastiness
It must be reiterated that in the nature of the experiment respondents were forced to choose a
type of product and the amount they were willing to give for it prior to filling out the
questionnaire. Therefore, tastiness index could only be considered as a dependent variable; it
did not act as an influencer in any part of the design. It was hypothesised (in 3a and 3b) that
tastiness would be higher when consumers could decide the price they wanted to pay for their
hot chocolate, and that this effect would be stronger for Fairtrade than Normal beverages.
Accordingly, using binary regressions with dummy variables for each pricing strategy, a
direct effect was detected between PWYWFairtrade and FixedNormal&Fairtrade, but not between
PWYWNormal and FixedNormal&Fairtrade, and tastiness (B = -0.55, t = -1.91, p = 0.06 and B = 0.22,
t = 0.75, p = 0.45). The difference stemmed from the marginally significant difference in taste
perceptions for the Fairtrade beverage between PWYWFairtrade and FixedNormal&Fairtrade (B = -
0.64, t = -1.71, p = 0.09) where the taste of the Faitrade hot chocolate was lower when chosen
under the PWYW strategy than a fixed price, contrary to this research’s expectations. When
simply looking at the two PWYW pricing conditions this relationship stayed significant
(F(1,66) = 9.15, p = 0.004), post-hoc tests indicating that the average taste was significantly
higher when Normal products were priced under PWYW than when Fairtrade products were
(MD = 0.77, p = 0.003). Despite product choice and tastiness being independent (t = 1.06, p =
0.29), Fairtrade and Normal hot chocolate were surprisingly rated as being most tasty under
Table VIII: Hypothetical Sales Quantity and Sales Revenues per Product Type and Pricing Strategy
Product Type Sales Quantity Sales Revenues (€)
Total
Sample Fixed
Normal&Fairtrade PWYWNormal PWYWFairtrade
Total Sample
Fixed
Normal&Fairtrade PWYWNormal PWYWFairtrade
Fairtrade 69 29 17 23 108.83 43.50 25.50 39.83
Normal 48 10 22 16 63.20 15.00 24.20 24.00
Hot Chocolate
117 39 39 39 172.03 58.50 49.70 63.83

51 | P a g e
PWYWNormal (MFairtrade = 4.33, MNormal = 4.58) and lowest under PWYWFairtrade (MFairtrade =
3.58, MNormal = 3.87), see Table IX.
Table IX: Average Tastiness per Product Type and Pricing Strategy
FixedNormal&Fairtrade PWYWNormal PWYWFairtrade
Fairtrade 4.21 4.33** 3.58*
Normal 4.36 4.58** 3.87 * p < 0.01 vs. FixedNormal&Fairtrade ** p < 0.01 vs. PWYWFairtrade
It therefore appeared as if the implementation of a PWYW pricing strategy could have
repercussions on product quality and taste perceptions. Furthermore, this seemed to provide
indications that people that chose the Fairtrade product for a fixed price, when they could
have chosen a cheaper or equally priced Normal product, experienced enhanced feelings of
pleasure towards the beverage perhaps due to their ethical behaviour. Moreover, difficulty in
making a pricing decision under PWYWFairtrade for the ethical alternative, and continued
thoughts about the price they decided to pay after the purchase occasion may have decreased
their enjoyment of the beverage under this condition. Also, consumers that chose the Normal
product alternative when they also had the option to get the Fairtrade version at a cheaper or
equal price, did not continue to enjoy their beverage as much, which may have indicated some
feelings of distress or guilt by their product choice. The additional or lower price they chose
to pay however did not cause these changes in taste levels for neither Fairtrade nor Normal (t
= -0.22, p = 0.83 and t = -0.61, p = 0.55 respectively). These effects were nonetheless too
small to be significant, and should be looked at in future research.
4.3. Complete Model Testing
In the previous analysis, the direct relationships between the various variables were analysed,
mainly on the dependent variable of interest, price paid. Given the findings that supported the
hypothesis that product choice significantly influenced the additional price paid by consumers
(B = -0.29, t = -3.47, p < 0.001), and the fact that in theory the two dependent variables
product choice and price paid were related in the sense that first consumers chose which
product they wanted and secondly they decided how much they were willing to pay required a
higher-order Heckman two-stage regression model to be used. Due to the inherent sequential
relationship between choosing the type of product, followed by determining the price to pay
for it – dependant on the applied pricing strategy – introduces a sample selection bias that
could result in erroneous interpretations of findings and poor policy when simply considering
the direct relationships. Such a selection effect may undermine the internal validity of
research, thus prior results should be checked and confirmed in one model to get a holistic

52 | P a g e
view of the relationships as depicted in the model in Section 3. Heckman, as applied here, is a
more powerful test allowing for the analysis of the key hypotheses while correcting for non-
randomly selected samples. It is often used in applied econometrics.
This experiment was conducted as a two-stage process, where in the first stage the decision to
purchase Fairtrade or Normal was made by the consumer, and consequently, at the second
stage, the consumer had to decide on how much to pay. Since the second stage only occurred
when the consumer decided to buy the product under the PWYW pricing strategy in the first
stage, the second equation (2) was subjected to selection bias. This occurred due to the fact
that the second model was estimated based only on the observations where the PWYW
product was selected for consumption. To correct for this selection bias, Heckman's (1979,
1976) two-stage selection model was used, where the first model was estimated with
maximum likelihood, and the decision concerning the amount to pay was estimated with a
corrected OLS model, that took into account information from the cases where a product
under the fixed pricing strategy was made.
(1) Choice Product Type = β0 + β1(Fairtrade PWYW) + β2(Normal PWYW) + ε
(2) Price Paid = β0 + β1(Fairtrade PWYW) + β2(Normal PWYW) + ε
Initially, a logistic regression was run to examine the variables that made up the decision of
which product type to choose. This represented the first stage of the two-step Heckman
model. In the sequential second step of the model, the dependent variable – the amount of
money given for the product selected – was examined by means of an ordinary least squares
regression analysis, corrected for selection bias (Heckman, 1979; 1976), as shown below. To
test the complete model based on previous findings in the direct effects, the Heckman model
was run numerous times to test for the effects of moderating and mediating variables. Similar
to findings from the previous examination, robustness checks confirmed that no significant
direct effects could be found for any of the demographic variables in the Heckman model or
from being regressed on others’ product choice, others’ price paid, importance of social
acceptance (as posited in hypothesis 2), context, and payment method. To ensure
multicollinearity was not a problem, the scales of Fairtrade attitude and empathy were
standardised. No large deviations were identified upon using standardised scales versus the
absolute scores of respondents, hence for simplicity the absolute scales were maintained. The
tables below (Table X and XI) illustrate the most relevant and explicable models as found

53 | P a g e
from the analysis, where Model 1 reiterated the main effects sought after by this field study,
Model 2 illustrated the direct effect of relevant variables, Model 3 tried to identify potential
mediators across both dependent variables, and Model 4 seemed to capture the relationships
best.
From the basic model presented above, it could be said that the Pricing Strategy does affect
the product choice. Under PWYWNormal, product choice was significantly affected with a
preference for the Normal product type, versus when both products had an equal price. As
previously discussed, more than half of the consumers (55.88%) bought the Normal product
type under this pricing strategy, while approximately one quarter did in the control group
(25.81%). Under the pricing condition where Fairtrade was priced flexibly, no significant
difference was expected nor found with respect to product choice in comparison to the control
group.
Upon adding Fairtrade attitude and empathy to the model (see the results for Model 2), the
direct relationships in the model changed, suggesting that there was an interaction effect at
play. In this model, similar to Model 1, a significantly larger portion of consumers faced by
PWYWNormal chose the Normal product alternative to the Fairtrade alternative versus
Table X: Step one in two-stage Heckman Model
Product Choice (0 = Fairtrade 1 = Normal)
Predictor Coefficient (SE)
Model 1 Model 2 Model 3 Model 4
Constant -0.649* (0.243)
-2.538* (0.922)
-7.457* (3.075)
-7.457* (3.075)
Fairtrade PWYW 0.450 (0.318)
0.648** (0.376)
6.547** (3.408)
6.547** (3.408)
Normal PWYW 0.797* (0.325)
1.027* (0.387)
6.477** (3.350)
6.477** (3.350)
Fairtrade Attitude
0.831* (0.220)
1.899* (0.713)
1.899* (0.713)
Empathy -0.228 (0.215)
0.547 (0.526)
0.547 (0.526)
Fairtrade PWYW*Empathy -1.210**
(0.656)
-1.210** (0.656)
Normal PWYW*Empathy -0.717
(0.0.624)
-0.717 (0.0.624)
Fairtrade PWYW*Fairtrade Attitude
-1.028 (0.820)
-1.028 (0.820)
Normal PWYW*Fairtrade Attitude
-1.329**
(0.776)
-1.329** (0.776)
* p < 0.05 ** p < 0.10

54 | P a g e
FixedNormal&Fairtrade. On the other hand, in contrast to Model 1, people faced by PWYWFairtrade
were also marginally significantly more likely than people under FixedNormal&Fairtrade to choose
the Normal product alternative (Heckman z = 0.65, p = 0.09). The significant direct effect
detected between a lower Fairtrade attitude and the choice of a Normal product type
(Heckman z = 0.83, p < 0.001) may have explained why these differences were identified. A
further analysis of the data suggested that consumers’ Fairtrade attitude and empathy
significantly differed across the type of pricing strategy to influence product choice. There
was a significant interaction at the 10% significance level between the pricing strategy and
empathy on product choice, where when Fairtrade was under a PWYW price, higher empathy
levels resulted in more people choosing the ethical option (Heckman z = -1.21, p = 0.07)
versus under the control group. This interaction however was not significant when Normal
products were priced as PWYW. In stark contrast, when Fairtrade products were priced under
the PWYW strategy the interaction with Fairtrade attitude versus the control group had no
significant effect on product choice (Heckman z = -1.03, p = 0.21), which it did when Normal
products were priced as such (Heckman z = -1.33, p = 0.09). In fact, lower levels of Fairtrade
attitude under PWYWNormal marginally significantly resulted in consumers choosing the
Fairtrade alternative, versus the control condition. Given the expected lower boundaries and
lower costs of distress of choosing a Fairtrade product when the alternatives were equally
priced, the lower levels of empathy (B = -0.63, Wald χ2 = 1.09, p = 0.30) and lower levels of
Fairtrade attitude (B = 2.74, Wald χ2 = 5.91, p = 0.02) prevailed in consumers that selected
the Normal hot chocolate. It is thus likely that the other pricing strategies triggered a more
emotive reaction to the product choice. Logically this seemed to imply that when a PWYW
pricing condition was used, the consumer was forced to make trade-offs that affected the
product choices they made, and that depending on which type of product was priced using this
strategy, different motivating attitudes had the greatest influence.

55 | P a g e
Table XI: Step two in two-stage Heckman Model Differential Price Paid
Predictor Coefficient (SE) Model 1 Model 2 Model 3 Model 4
Constant 1.50* (0.161)
-1.184 (4.982)
-4.593 (12.197)
1.402* (0.233)
Fairtrade PWYW 0.000 (0.197)
0.467 (0.966)
4.389 (9.395)
0.000 (0.216)
Normal PWYW -0.403* (0.192)
0.238 (1.262)
4.383 (9.321)
-0.414* (0.211)
Fairtrade Attitude
0.491 (0.962)
1.236 (2.542)
Empathy -0.139 (0.315)
0.420 (0.949)
Fairtrade PWYW*Empathy
-0.831 (1.698)
Normal PWYW*Empathy
-0.540 (1.117)
Fairtrade PWYW*Fairtrade Attitude
-0.667 (1.629)
Normal PWYW*Fairtrade Attitude
-0.988 (1.940)
* p < 0.05 ** p < 0.10
Also central to our hypothesis 1c, under PWYWNormal the pricing strategy was found to
significantly affect the price paid, versus FixedNormal&Fairtrade. Respondents paid significantly
lower prices for Normal products under this pricing strategy than the fixed price charged at
the café. Despite the findings that the average respondent was only willing to pay a price
below the price of the Fairtrade equivalent in PWYWNormal, the reverse was not detected under
PWYWFairtrade implying that notwithstanding the fact that consumers recognise the additional
value in Fairtrade and hence pay less for the Normal substitute, they refused to pay a
significantly higher price than usual for the Fairtrade equivalent. Noteworthy however is that
these findings were in aggregate and did not simply look at those products actually bought
under PWYW.
Contrary to the meaningful attitudinal influencers on product choice, there was no significant
effect of any of the additional measured variables on price paid. These findings hence
supported that attitudes towards Fairtrade and general empathy influenced product choice,
which significantly affected overall price paid in the case of Normal products. However, it
also seemed to suggest that once the initial decision of product type had been made,
consumers already dealt with the internal distress of this decision making process and hence
had accepted the consequences of their decision – if there were any – and did not mind to act

56 | P a g e
accordingly in their decision of what to pay. For example, a consumer who chose to pay a
flexible price of less than €1.50 for the Normal hot chocolate when a Fairtrade hot chocolate
would have been a fixed €1.50 (i.e. a consumer faced with PWYWNormal) may already have
felt that his/her choice of the Normal alternative proved that he/she had behaved unethical,
and had not responded to the needs of society; hence subsequent upward adjustments in their
price paid to overcompensate for the negative consequences and judgments of others did not
occur as their choice for Normal in itself already accounted for these expecting judgements.
Similarly, for the majority of consumers faced with PWYWFairtrade may have felt that their
choice for the Fairtrade alternative already made them ethical consumers and showed that
they supported this trade movement and cause; hence a significantly higher premium for this
product seemed unnecessary.

57 | P a g e
5. Discussion
5.1. Summary of Findings
In the face of burgeoning evidence that PWYW pricing strategies can have a positive effect
on a company’s financial performance as well as its customers, this research tried to
understand the effect of applying such a participative pricing strategy on a social brand as a
corporate social responsibility initiative on consumer payment behaviour and product
attitudes, and why, as well as the impact on the business. The tests of the conceptual
framework linking a company’s pricing strategy and product range to consumers’ purchase
behaviour (in terms of product choice and price paid) and product evaluation revealed that
consumers are not only willing to pay more for social brands, but do so even when given the
choice to pay zero, yielding positive revenue figures for a company. Moreover, using a real
company, an existing social label, and uninformed consumers, this study showed the positive
effect that a PWYW pricing strategy can have on revenues when applied to an ethical product,
and its detrimental effect on conventional product types. Notwithstanding the undeniable
effect on sales revenue, it was also found that consumers’ product choice, when exposed to
the different pricing strategies, was mediated by the specific attitudes, Fairtrade attitude or
empathy. Table XII below shows a summary of the main findings to be discussed.
Table XII: Summary of Hypothesis Testing and Research Findings
Hypothesis (Not) Rejected Results
1a: Consumers are willing to pay more for Fairtrade products than
their conventional substitutes.
Not Rejected p = 0.004
Using PWYW as a means to uncover consumers' willingness-to-pay it was found that consumers were willing to pay a 15%
premium for the Fairtrade label. It appeared consumers placed a value on the additional social product attribute and were
willing to partially contribute towards funding it.
1b: Consumers are willing to pay higher prices on average for
Fairtrade products under PWYW than their conventional fixed
priced alternatives.
Marginally Not Rejected p = 0.10
Upon implementing PWYW on Fairtrade, the average price paid was found to be €1.73, €0.23 above the conventional
alternative on offer (at the regular price of €1.50).
1c: Consumers are willing to pay lower prices on average for
conventional products under PWYW than their Fairtrade fixed
prices alternatives.
Not Rejected p = 0.02
Upon implementing PWYW on Normal beverages, the average price paid was found to be €1.10, €0.40 below the Fairtrade
alternative on offer (at the regular price of €1.50).
2a: Prices paid for Fairtrade and conventional products are higher when consumers are surrounded
by others than when they are alone.
Rejected pPWYWall = 0.03; pPWYWNormal = 0.12;
pPWYWFairtrade = 0.24
The influence of the presence of others was not found to prevail in this research study. Consumers appeared to be
equally likely to pay more for the Normal/Fairtrade alternative when they were alone or in the presence of others. Their
environmental context additionally had no significant impact on product choice.
2b: Estimates of others’ product choice and price paid affects own
product choice and price paid respectively.
n/a Due to the measurement method, it was not possible to draw
any conclusions.

58 | P a g e
3a: Products bought under PWYW receive higher taste and liking
scores than those bought under a fixed price.
Rejected pallPWYWvsFixed = 0.63
When combining all products selected and paid for under PWYW vs. those chosen and paid for under fixed pricing, no significant difference was detected between tastiness index.
Contrary to other research linking pricing to quality perceptions, this research was unable to confirm this; allowing consumers to decide the price they paid instead of charging them with a set
price did not influence tastiness.
3b: The aforementioned effect PWYW has on taste and liking is
greater for Fairtrade certified products, than Normal products.
Rejected TasteNormalPWYW > TasteFairtradePWYW
p = 0.003
For both hot chocolates, taste was worst under PWYWFairtrade and best under PWYWNormal; FixedNormal&Fairtrade falling in between.
It is expected that under PWYWNormal Normal tasted better because it was cheaper, and Fairtrade tasted better because
people felt better about doing well; under PWYWFairtrade Normal tasted worst due to post-purchase guilt for not choosing the fairer alternative for a cheaper/equal/higher price whereas Fairtrade tasted worse due to post-purchase distress and
doubts about adequately high payment decreasing enjoyment levels.
4a: Consumers with a positive attitude towards Fairtrade are
more likely to choose the Fairtrade product than the normal
alternative.
Not Rejected p < 0.001
Consumers with a higher Fairtrade attitude were, as expected, significantly more likely to choose the Fairtrade product in each
price condition (pFixed = 0.02; pPWYWNormal = 0.04, pPWYWFairtrade = 0.02)
4b: Consumers with a positive attitude towards Fairtrade will pay more for Fairtrade products under PWYW than consumers with a low
attitude towards Fairtrade.
Not Rejected p = 0.02
Fairtrade attitude positively influenced willingness to pay in general (p = 0.01) and in particular for Fairtrade products under
PWYW (p = 0.02). Unsurprisingly, this effect disappeared for Normal products priced under PWYW, where there was no
significant impact of Fairtrade attitude (p = 0.58).
4c: Consumers with high levels of empathy are more likely to choose
the Fairtrade product than the normal alternative.
Not Rejected p = 0.04
Although overall higher empathy levels resulted in significantly greater choice for Fairtrade products (p = 0.04), however at a closer look this only significantly prevailed under PWYWFairtrade
(p = 0.05).
4d: Consumers with high levels of empathy pay more for Fairtrade
products under PWYW than consumers with low levels of
empathy.
Rejected
pall = 0.31 pFTunderPWYWFairtrade = 0.73 pNormalPWYWNormal = 0.99
No significant relationship was found with empathy and price paid, for any of the products in any of the pricing conditions.
This section will focus on discussing the implementations of the three key findings from the
previous analysis namely: that people do seem to be willing to pay more for Fairtrade
products than conventional alternatives, that a PWYW pricing strategy can be used effectively
to increase sales revenues and ethical consumption in parallel, and the wider business
implications of corporate social responsibility initiatives.
5.2. Theoretical Implications
This research contributed to a large, existing, highly critiqued research base to investigate
whether consumers were willing to pay more for social labels than their conventional
alternatives. A field study was implemented using the PWYW pricing strategy
methodologically (on both conventional and ethical products) as a way to capture how much

59 | P a g e
money consumers were truly willing to spend out of pocket for each product type. Findings
identified that on average consumers did pay significantly more for the Fairtrade alternative.
This seems to suggest that, contrary to many other studies (Boulstridge & Carrigan, 2000; de
Pelsmacker et al., 2005b; Carrigan & Attalla, 2001; Memery et al., 2005; Kramer, 1990;
Cook, 1991), there is a market for ethically produced goods for which people are willing to
pay a premium. Nevertheless, the premium currently charged is higher than the 15.30%
premium the average person was willing to pay in this study. In accordance to the extensive
literary discussion in (refer to Section 2) consumers do appear to value social product
attributes, and firms can charge a premium for them.
It is however recommended that they take into consideration the pricing strategy applied to
such products. Although a pricing strategy is typically defined as the means through which a
company puts a price on its product or service in order to maximise its profits, within a
specified timeframe and scenario (Tellis, 1986), practical examples have also revealed the
importance of pricing as a mechanism to influence consumer purchases and company
reputations. From the previous results it also appears that Fairtrade products are not as niche
as they have previously been thought to be. Therefore, a fixed cost-based pricing strategy, as
currently applied to most social brands, prices out many subgroups of the population. Similar
to the strategy undertaken in this study, managers are advised to consider their pricing
strategy in their marketing mix, especially for ethical products. This could be seen as part of a
CSR initiative of the firm, and have paralleled multi-stakeholder rewards, as those witnessed
at the Coffee Corner: firms should be able to increase their reputation as do-gooders in society
amid an increasingly socially aware consumer base while also benefiting from increased sales
revenues, quantities and cross-selling; the social charitable parties acquire a larger awareness
amongst consumers but also collect greater financial support; and more consumers are able to
engage in socially-responsible shopping, and feel better about themselves despite often paying
above average. In addition, they are expected to be more involved with the cause as the
PWYW strategy enabled them to express their true support through the price they offer to pay
(Gneezy et al., 2010).
The use of a PWYW pricing strategy was examined in this study for Fairtrade hot chocolate,
as a type of CSR initiative. Firstly, the effect of CSR campaigns on consumers’ product
evaluations has been found to have a corresponding positive effect on their company
evaluations (Sen & Bhattacharya, 2001). Given the fact that the quality perception of the hot

60 | P a g e
chocolate did not significantly differ across the treatments, it seemed that this Fairtrade-
oriented CSR initiative did not have an effect on the Coffee Corner’s image, however future
research should directly measure this effect. Although most CSR studies have analysed the
consumer response to such programmes, its continuity is ultimately dependent on its effect on
the firm’s financial wellbeing – something that earlier studies have found conflicting results
for (Ellen, Mohr, & Webb, 2000; Luo & Bhattacharya, 2006). This study nevertheless seemed
to indicate that CSR can and does have a positive financial effect, although it needs the
support of customers. Drawing on conclusions from signalling theory, by implementing a
pricing strategy where consumers could pay what they wanted (including €0), the Coffee
Corner probably removed the typical assumption by customers that the firm had an ulterior
motive by implementing such a CSR project (Luo & Bhattacharya, 2006; Gneezy et al.,
2010). By exposing itself to financial risk, the conflict of interest between the parties was
removed and the goodwill in the CSR campaign became more obvious, giving consumers an
incentive to act accordingly – 44% and 59% of participants chose the Fairtrade option under
PWYWNormal and 3 respectively. This pricing strategy not only ensured transparency between
the parties, but also gave consumers the opportunity to show the extent to which they were
willing to support and hence donate to the respective ethical cause. Similar to findings by
Gneezy, Gneezy, Nelson and Brown (2010), and Ellen, Mohr, and Webb (2000), consumers at
the Coffee Corner with a higher Fairtrade attitude had a higher tendency to choose the
Fairtrade alternative, and when it was priced under a PWYW pricing strategy they even paid
more for it, showing their inherent support for the cause.
Sen and Bhattacharya (2001) specified that CSR programmes are of strategic importance in
the sense that only those people that are committed to that specific cause will respond
positively to the CSR information, while negative CSR information influences everyone.
Although this research did not look at the effects of negative CSR information, findings did
reveal that consumers who were most dedicated to Fairtrade did in fact support the initiative
more by paying a higher price for the product. Nevertheless, even consumers with weaker
Fairtrade attitudes were also positively influenced to engage in ethical purchasing. These
findings have several implications, namely that managers firstly need to apply strategically
appropriate CSR campaigns that have a high fit with the company’s competitive advantage
and the target groups’ interests. In this study, the Coffee Corner implemented a different
pricing strategy to promote the consumption of Fairtrade. Since business students are

61 | P a g e
frequently confronted with today’s societal trends and ethics, responsible working conditions
may have been more appreciated and accepted than other charitable initiatives.
Additional findings revealed that when Normal products were priced under PWYW, a
significantly lower average Fairtrade attitude stimulated consumers to choose the Fairtrade
product than under the control group. Contrary to expected findings, even when consumers
had a less positive attitude towards the underlying cause, their choice deferral away from the
potentially cheaper option in favour of the Fairtrade option seems to suggest that the PWYW
strategy highlighted the ethical attribute underlying the purchase. In opposition, when
Fairtrade products were priced under PWYW, empathy significantly impacted product choice
in favour of the Fairtrade alternative versus when both were under a fixed price. This
significance versus the control group disappeared when Normal products were priced under
PWYW, once again suggesting the PWYW initiative highlighted the Fairtrade (or not) nature
of the product on sale, which influenced the purchase behaviour of consumers. Hence it
appears clear that consumers have a positive attitude towards CSR programmes, but in order
to steer their purchases towards the ethically responsible one, firms and charities need to
activate these attitudes (whether empathy, or attitude towards the cause) and give them a
reason. The pricing strategy, as seen in this research, is one way in which this could be done:
the Coffee Corner stimulated sales of Fairtrade hot chocolate versus conventional hot
chocolate. Charity initiatives could similarly apply these strategies to highlight their
underlying cause and encourage donations. On the other hand, many findings concerning
donation settings indicate that it is in fact the requesting of a specific, fixed price that
increases participation (Briers et al., 2007).
5.3. Practical and Managerial Implications
Managers and marketers of café’s and supermarkets ponder about whether enlarging their
assortment with classically more expensive socially responsible products, like Fairtrade, will
add to their financial performance. Findings stemming from this research seem to suggest that
consumers are indeed not only becoming more attitudinally aware and supportive of social
brands, but are also willing to pay a premium for these products. The premium the average
consumer seemed to be willing to spend for the Fairtrade label on hot chocolate was 15.3%.
Although research has often allocated ethical purchasing to certain demographic groups, this
research did not exhibit these results. Nevertheless, managers need to consider their target
group before implementing a similar strategy, and ensure to have analysed their financial

62 | P a g e
resources. In order to actively stimulate ethical purchasing however, findings have shown that
a PWYW strategy enables a larger group of people to undertake ethical purchasing who pay a
premium in comparison to the conventional alternative.
Not only should managers consider their target group to ensure that they have the financial
resources to pay the higher prices that tend to accompany Fairtrade and other social brands,
but they also need to consider their target consumer for strategic purposes. As the previous
discussion highlighted, in deciding which social activities to participate to and assign limited
resources to, support of the consumer is essential. Therefore, prior to diving into a CSR
activity in general, or a particular one as was described in this research, it should be
investigated whether the firm’s key segments also support this cause and see its added value.
The firm’s business activities should also be linked to the CSR activity to provide further
credibility. For example, The Fairtrade Organisation Max Havelaar currently focuses its
strategy on targeting the whole population in a country through supermarkets; despite having
high levels of awareness, sales are minimal. Findings from research, including this one, would
suggest that this can be attributed to the fact that involvement levels with the cause are low
when simply purchasing the products at a fixed, pre-determined price and hence people
cannot express the extent to which they are dedicated to the cause behind the label. Moreover,
the population in its entirety is unlikely to support the Fairtrade cause hence they do not
respond to the availability of Fairtrade products. Undergoing smaller partnerships with
businesses whose key customer segments are dedicated to the cause may allow Fairtrade to
enjoy more widespread success and financial rewards.

63 | P a g e
6. Limitations & Future Research
It is safe to assume that this study achieved an adequate level of external validity due to its
field experimental nature. Moreover, the controls imposed likely raised the level of internal
validity. Nevertheless, several future research initiatives stem from the findings and inherent
limitations in this study. Firstly, the nature of a field experiment in itself could have resulted
in several limitations. Despite having tried to control for the influence of the most important
extraneous variables, it is not impossible that the independent variables were unduly
influenced by unexplained variables affecting the internal validity of the research.
Furthermore, the fact that the experiment was conducted at one café, at one university, implies
that these results are only applicable in this context. Similar experiments should be conducted
in future research to also assess differences across locations and sample populations. For
example, Fairtrade probably has much more impact in large-scale supermarkets where
consumers need to pick their own products from the shelf; it would be interesting to test the
effect of a PWYW pricing strategy on social brands in such locations in the future. Secondly,
the social brand presented in this research was the Fairtrade label. There are nevertheless
many other cause-related marketing campaigns and social brands to which the PWYW pricing
strategy could be applied that fall into different corporate social responsibility categories as
defined by the CSR scale, Socrates: The corporate social ratings monitor (Kinder, Lydenberg,
Domini, 1999 as mentioned in Sen & Bhattacharya, 2001) and that hence may yield different
responses. Thirdly, due to the limited time frame in which the field study was conducted there
were a limited number of respondents. Data was gathered from a relatively small sample size
of only just more than 30 consumers per treatment condition, which also resulted in a lower
variance in responses than would have been optimal. As a result of the small sample sizes and
infrequent repeat purchases, several hypotheses could not be reliably tested. In order to obtain
more reliable and generalisable findings, future research should be done to gather a larger
sample size upon which to draw conclusions. Moreover, research is needed to further
comment and conclude on the long-term effect and repeated exposure to average prices paid
under a PWYW pricing strategy in general, and to ethical brands in particular. Fourthly, hot
chocolate was the only product that was tested in this study, limiting the generalisation of the
findings since this automatically made it a more female-oriented study. In addition, hot
chocolate is not a strict commodity as it is consumed based on some hedonic senses; since
Fairtrade products are mainly commodities (e.g. bananas, chocolate, honey, oranges), further
research should include numerous product types, both informational and transformational,

64 | P a g e
across different ranges. Fifthly, notwithstanding the greater interest in bringing participative
pricing mechanisms offline, online auctions still have an option catering for the consumer
who prefers paying a fixed price. This suggests that there is a group of consumers who prefer
the greater power they get from being allowed to decide their own price, whilst there is also a
group that prefers the lack of uncertainty involved by paying a fixed price. A person’s level of
risk aversion therefore may have moderated their product choice, which should be controlled
in forthcoming research. Finally, although this research was completed looking at financial
measures as the dependent variable, it is limited in the sense that the situation of having
different pricing strategies on the different product types may not only have affected how
much consumers effectively paid for the product of their choice, but may also have had an
influence on consumers’ attitude towards the firm or product. These measures were not
included in this study, and will likely be value-adding in future explorations.

65 | P a g e
7. Appendix
I. WILLINGNESS-TO-PAY RESEARCH METHODS II. FAIRTRADE INFORMATION ON DISPLAY III. QUESTIONNAIRE IV. HOT CHOCOLATE FLYERS/POSTERS V. ALBRON EMPLOYEE BRIEFING VI. BEHIND THE COUNTER INFORMATION SHEET:
CHOICE, PRICE, PAYMENT METHOD, CONTEXT VII. DEMOGRAPHICS VIII. SCREE PLOT IX. FACTOR ANALYSIS X. SUMMARY PARAMETRIC TESTS

66 | P a g e
I. WILLINGNESS-TO-PAY RESEARCH METHODS
Breidert, 2005

67 | P a g e
II. FAIRTRADE INFORMATION ON DISPLAY

68 | P a g e
III. QUESTIONNAIRE

69 | P a g e

70 | P a g e
IV. HOT CHOCOLATE FLYERS & POSTERS

71 | P a g e
V. ALBRON EMPLOYEE BRIEFING
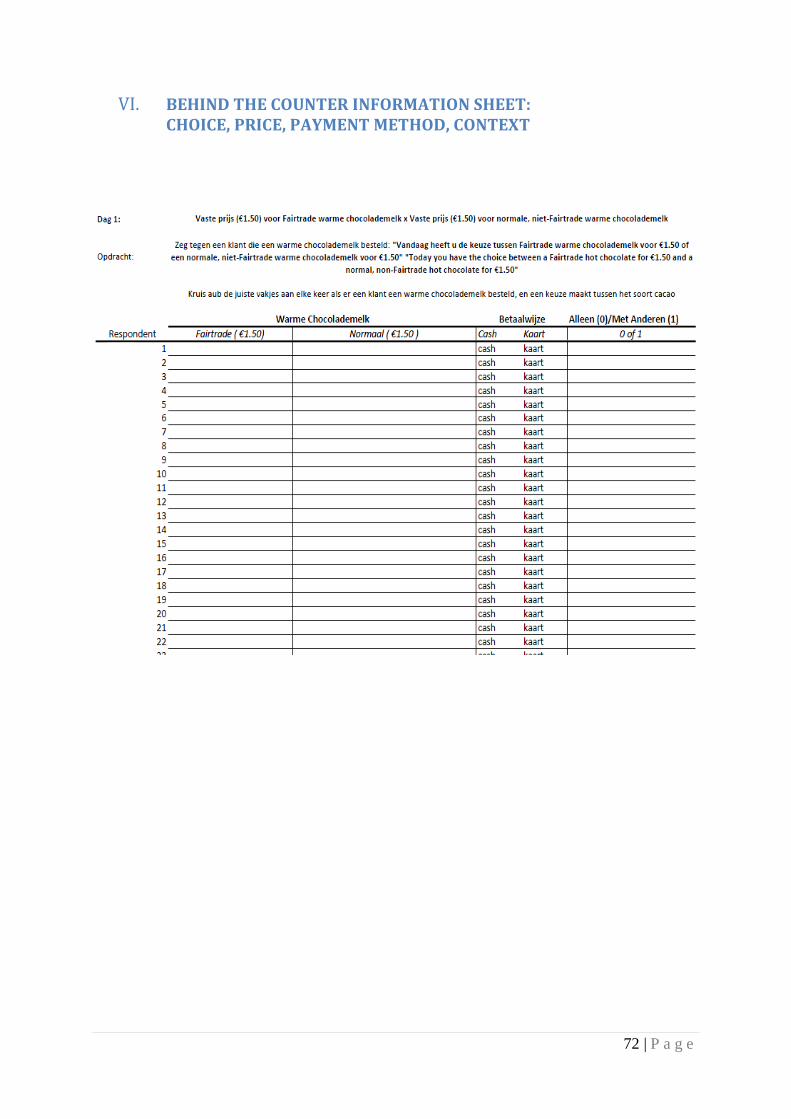
72 | P a g e
VI. BEHIND THE COUNTER INFORMATION SHEET: CHOICE, PRICE, PAYMENT METHOD, CONTEXT

73 | P a g e
Table I: Age Distribution
Age Frequency Percentage
< 20 years 19 19.8% 20 -25 years 57 59.4% 26 - 30 years 14 14.6% 31 - 35 years 0 0.0% 36 - 40 years 0 0.0% 41 - 45 years 1 1.0% 46 - 50 years 1 1.0%
> 50 years 4 4.2%
Total 96 100%
Table II: Free Income Distribution
Free Income (€) Frequency Percentage
< = 200 28 29.2% 201 - 400 25 26.0% 401 - 600 26 27.1% 601 - 800 4 4.2%
801 - 1000 6 6.3% 1001 - 1200 1 1.0%
> = 1201 6 6.3%
Total 96 100%
VII. DEMOGRAPHIC ANALYSIS OF TREATMENT GROUPS
Since hot chocolate is a sweet drink that people indulge in, it is quite logical that the majority
of the sample was female (66.7%), also being significantly bigger chocolate consumers than
men (t(94)= -3.42, p = 0.001: Mwomen = 4.33 SDwomen = 0.91, Mmen = 3.67 SDmen = 0.84).
Despite more women having participated than men, it did not appear that there was a
significant difference in gender composition across the three pricing conditions (χ2 (2) = 0.44,
p = 0.80). Moreover, given the location of the field experiment at the Erasmus University of
Rotterdam the age distribution was slightly positively skewed with a mean age of 24.12 years
(SD = 7.95) and the majority, 59.4%, of the sample was between the age of 20 and 25 as
shown in the table left. Moreover, the majority of participants came from The Netherlands
(84.0%) – this resulted in the need to combine the existing categories of nationality from six
to two: Dutch and Others. No significant difference was subsequently found between the ages
(F(2,93) = 1.67, p = 0.20) and nationalities (χ2 (2) = 1.59 , p = 0.45) of respondents across the
three pricing conditions.
The amount of money someone had after paying fixed expenditures (referred to as free
income in the remainder of the text) and age were established to be significantly positively
related (r = 0.68, p < 0.001), given that older people tend to have higher free incomes,
especially in a University. Hence, similar to age, free income was slightly positively skewed
with 29.2% of the sample having less than or equal to €201 per month, 26% having between
€201 and €400, and 27.1% having between €601 and €800 to spend freely after having paid
their fixed costs. Given that free income has been shown to significantly influence purchase
habits of consumers, it was important to note that the distribution of free income was not
found to be significantly different between respondents in the three pricing conditions through
a Kruskal-Wallis test (p = 0.59). The groups exposed to the three pricing strategies did not
differ significantly from one another in terms of demographic characteristics.

74 | P a g e
VIII. SCREE PLOT

75 | P a g e
IX. FACTOR ANALYSIS Table III: Eigenvalue Factor Loadings (only factor loadings > 0.4 were presented)
Factor Loading
Items Factor 1 Factor 2 Factor 3 Factor 4 Factor 5 Communality
It upsets me to see someone being treated disrespectfully
0.90 0.83
I have tender, concerned feelings for people less fortunate than me
0.87 0.77
I do not feel sympathy for people who cause their own serious illnesses (re-coded)
0.51 0.37
When I see someone being taken advantage of, I feel kind of protective towards him/her
0.72 0.58
How important is it for you to look attractive to others
0.86 0.78
How important is it for you to look attractive to dates or potential dates
0.84 0.71
How important is it for you to fit in at parties 0.72 0.55
How tasty do you think this hot chocolate was
-0.94 0.90
How much did you enjoy drinking this hot chocolate
-0.95 0.93
Do you normally drink hot chocolate 0.87 0.75
How much do you like hot chocolate in general
0.86 0.75
Fairtrade is too much like a charity: purchasing Fairtrade products does not solve anything in the long run. It just eases your conscience
0.79 0.65
Fairtrade products lack credibility -0.51 0.67 0.55 Fairtrade is not compatible with free-market principles: it is impossible to trade fairly and be profitable
0.77 0.61
Fairtrade is important (re-coded) 0.71 0.57
Name of Factor Empathy Importance
Social Acceptance
Tastiness General Drinking
Behaviour
Fairtrade Attitude
% Variance Explained 24.32% 15.60% 12.35% 8.25% 8.03% 68.54%
Cronbach’s Alpha 0.78 0.74 0.93 0.66 0.72
Table IV: Cronbach alpha statistics per factor per price condition
Factor (Index) Cronbach Alpha
FixedNormal&Fairtrade PWYWNormal PWYWFairtrade Total
General Drinking Behaviour 0.62 0.66 0.71 0.66
Tastiness 0.96 0.88 0.90 0.93
Fairtrade Attitude 0.73 0.77 0.67 0.72
Empathy 0.81 0.82 0.74 0.78
Importance of Social Acceptance 0.75 0.62 0.83 0.74

76 | P a g e
X. SUMMARY PARAMETRIC TESTS Table V: Descriptives Coffee Corner
Variable Choice Total Sample FixedNormal&Fairtrade PWYWNormal PWYWFairtrade
Mean SD Skewness Kurtosis N Mean SD Skewness Kurtosis N Mean SD Skewness Kurtosis N Mean SD Skewness Kurtosis N
Price Paid Fairtrade 1.59 0.40 -1.21 8.08 61 1.50 0.00 0.00 0.00 23 1.50 0.00 0.00 0.00 15 1.73 0.64 -1.63 3.68 23
Normal 1.32 0.50 -1.06 3.98 43 1.50 0.00 0.00 0.00 8 1.10 0.71 0.12 0.67 19 1.50 0.00 0.00 0.00 16
Total 1.48 0.46 -1.18 4.79 104 1.50 0.00 0.00 0.00 31 1.28 0.56 -0.74 2.24 34 1.64 0.50 -1.33 5.23 39
Estimate Price Paid Others Fairtrade 1.38 0.41 -0.82 1.54 58 1.50 0.00 0.00 0.00 23 1.01 0.29 -0.73 3.58 15 1.53 0.55 -1.24 1.49 20
Normal 1.39 0.55 0.33 1.37 41 1.50 0.00 0.00 0.00 8 1.07 0.48 0.11 1.12 18 1.72 0.57 0.64 0.46 15
Total 1.39 0.47 -1.01 1.63 95 1.50 0.00 0.00 0.00 31 1.04 0.40 0.10 1.94 33 1.61 0.56 -0.37 1.32 35
General Drinking Behaviour Fairtrade 4.10 0.98 -0.36 -0.63 56 4.02 0.94 -0.13 -0.86 21 4.47 1.08 -1.04 0.61 15 3.90 0.93 -0.39 -0.27 20
Normal 4.13 0.88 0.20 -0.60 40 4.43 0.93 -0.58 -1.33 7 4.03 0.90 0.59 0.19 18 4.10 0.85 0.04 -0.22 15
Total 4.11 0.94 -0.19 -0.60 96 4.13 0.94 -0.21 -1.00 28 4.23 0.99 -0.20 -0.51 33 3.99 0.89 -0.26 -0.24 35
Tastiness Fairtrade 4.02 1.22 -0.18 -1.04 56 4.21 1.26 -0.10 -1.21 21 4.33 1.18 -0.95 0.32 15 3.58 1.15 0.08 -1.05 20
Normal 4.28 1.09 -0.74 0.35 40 4.36 1.60 -0.58 -1.29 7 4.58 0.65 0.39 -0.28 18 3.87 1.19 -0.63 -0.38 15 Total 4.13 1.17 -0.39 -0.69 96 4.25 1.32 -0.21 -1.23 28 4.47 0.92 -0.97 1.56 33 3.70 1.16 -0.20 -0.99 35
Empathy Fairtrade 3.04 0.62 -0.63 0.55 56 2.81 0.58 -0.69 1.41 21 3.18 0.63 -0.80 0.40 15 3.19 0.61 -0.93 1.87 20
Normal 2.71 0.78 -0.61 -0.66 40 2.46 0.94 -0.27 -0.94 7 2.76 0.87 -0.80 -0.65 18 2.75 0.61 -0.34 -0.88 15
Total 2.90 0.71 -0.73 -0.10 96 2.72 0.68 -0.73 0.49 28 2.95 0.79 -0.95 0.10 33 3.00 0.64 -0.55 0.01 35
Fairtrade Attitude Fairtrade 2.42 0.64 0.31 -0.13 56 2.42 0.59 1.36 3.71 21 2.35 0.73 -0.24 -1.33 15 2.46 0.66 0.14 -1.33 20
Normal 3.12 0.80 0.23 -0.02 40 3.50 0.65 1.22 2.20 7 3.04 0.98 0.41 -0.64 18 3.03 0.60 -0.40 0.58 15
Total 2.71 0.79 0.46 0.09 96 2.69 0.76 0.93 0.93 28 2.73 0.93 0.47 -0.05 33 2.71 0.69 -0.13 -0.90 35
Importance Social Acceptance Fairtrade 3.73 0.66 -0.21 -0.14 56 3.63 0.69 -0.76 -0.12 21 3.69 0.53 0.75 -0.16 15 3.87 0.74 -0.15 -0.45 20
Normal 3.59 0.75 -0.96 3.05 40 3.57 0.69 -0.43 2.58 7 3.74 0.87 -1.67 5.60 18 3.42 0.62 -0.22 1.30 15 Total 3.67 0.70 -0.60 1.60 96 3.62 0.68 -0.65 -0.05 28 3.72 0.72 -1.29 5.43 33 3.68 0.72 0.00 -0.10 35
Age Fairtrade 25.14 9.31 2.70 7.22 56 28.14 13.40 1.72 1.75 21 23.33 6.87 3.26 11.77 15 23.35 3.33 -0.22 -1.06 20
Normal 22.70 5.33 4.00 20.78 40 21.14 2.85 0.94 -0.15 7 22.56 3.20 0.39 -0.96 18 23.60 7.81 3.48 12.95 15 Total 24.12 7.80 3.15 10.57 96 26.39 12.01 2.12 3.55 28 22.91 5.13 3.39 15.34 33 23.46 5.60 3.61 17.53 35
Nationality Fairtrade 1.20 0.40 1.54 0.39 56 1.25 0.44 1.25 -0.50 21 2.00 1.27 0.46 -0.73 15 1.10 0.31 2.89 7.04 20 Normal 1.15 0.36 2.04 2.26 40 1.14 0.38 2.65 7.00 7 1.17 0.38 1.96 2.04 18 1.13 0.35 2.40 4.35 15 Total 1.18 0.39 1.70 0.92 96 1.22 0.42 1.42 0.00 27 1.21 0.42 1.48 0.19 33 1.11 0.32 2.53 4.69 35
Free Income Fairtrade 1.73 1.80 1.21 0.67 56 2.19 2.14 0.99 -0.39 21 1.33 1.59 1.96 4.83 15 1.14 1.07 -0.37 -2.80 20
Normal 1.43 1.38 1.22 2.00 40 1.14 1.07 -0.37 -2.80 7 1.39 1.33 0.69 -0.37 18 1.60 1.59 1.74 3.51 15 Total 1.60 1.64 1.28 1.22 96 1.93 1.96 1.19 0.45 28 1.36 1.43 1.35 2.19 33 1.57 1.54 1.14 1.05 35

An independent samples Kruskal-Wallis test further confirmed that the distributions of
empathy, Fairtrade attitude, importance of social acceptance, age, and general drinking
behaviour across pricing conditions were not significantly different from each other (p value
of 0.18, 0.90, 0.89, 0.80, and 0.63 respectively). Given the fact that the three groups were
being compared this was vital and suggested that the dataset could be reliably used for
subsequent statistical analyses.

78 | P a g e
8. References
Abbas, A., Hann, I.H., and Terwiesch, C. 2011. Risk Averse Bidding in Name Your own
Price Channels. Work in Progress. Available from:
http://web.merage.uci.edu/~veecee/WISE2005/papers/202.pdf [Accessed 16 January
2012]
Adams, M., & Raisborough, J. 2008. What can Sociology Say About Fair trade? Class,
Reflexivity, and Ethical Consumption. Sociology, Vol. 42, No. 6, p. 1165 – 1182.
Alpizar, F., Carlsson, F., & Martinsson, P. 2001. Using Choice Experimentation for Non-
Market Valuation. Working Paper in Economics No. 52. Department of Economics,
Gothenburg University. Available from: http://idrc.org.sg/uploads/user-
S/10301141930choiceexperiments.pdf [Accessed 6 June 2011]
Arnot, C., Boxall, P.C., & Cash, S.B. 2006. Do ethical consumers care about price? A
revealed preference analysis of fair trade coffee purchases. Department of Rural
Economy, University of Alberta Edmonton, Alberta. Available from:
http://econpapers.repec.org/article/blacanjag/v_3a54_3ay_3a2006_3ai_3a4_3ap_3a555-
565.htm [20 December 2009]
Auger, P., Burke, P., Devinney, T.M., & Louviere, J.J. (2003) What Will Consumers pay for
Social Product Features. Journal of Business Ethics, Vol. 42, No. 3, p. 281 – 304.
Auger, P., Devinney, T.M., Louviere, J.J., Burke, P.F. (2008) Do Social Product Features
have Value to Consumers? International Journal of Research in Marketing, Vol. 25, p.
183 – 191.
Berrens, R.P., Jenkins-Smith, H., Bohara, A.K., & Silva, C.L. 2002. Further Investigation of
Voluntary Contribution Contingent Valuation: Fair Share, Time of Contribution, and
Respondent Uncertainty. Journal of Environmental Economics and Management, Vol.
44, p. 144 – 168.
Bertini, M., & Wathieu, L. 2008. Attention Arousal Through Price Partitioning. Marketing
Science, Vol. 27, No. 2, p. 236 – 246.
Bezencon, V. & Blili, S. 2009. Fair Trade Managerial Practices: Strategy, Organisation, and
Engagement. Journal of Business Ethics, Vol. 90, p. 95 – 113.
Bird, K., & Hughes, D.R. 1997. Ethical consumerism: The case of “fairly-traded” coffee.
Business Ethics: A European Review, Vol. 6, p. 159 – 167.
Blumenschein, K., Blomquist, G.C., Johannesson, M., Horn, N., & Freeman, P. 2008.
Eliciting Willingness to Pay Without Bias: Evidence from a Field Experiment. The
Economic Journal, Vol. 118, p. 114 – 137.
Boelaars, G. 2010. Satisfaction and Manipulation at Pay What You Want: Empirical study
about the influence of satisfaction and manipulation on prices paid under Pay What You
Want conditions. Master Thesis in International Business, Department of Strategic
Marketing, Maastricht University School of Business and Economics, the Netherlands.
Bolton, L.E., Warlop, L., &Alba, J.W. 2003. Consumer Perceptions of Price (Un)Fairness.
Journal of Consumer Research, Vol. 29, p. 474 – 491.
Boulstridge, E., & Carrigan, M. 2000. Do Consumers Really Care About Corporate
Responsibility? Highlighting the attitude – behaviour gap. Journal of Communications
Management, Vol. 4, No. 4, p. 355 – 368.
Breidert, C. 2005. Estimation of Willingness-to-Pay. Theory Measurement, and Application.
Doctoral Thesis, WU Vienna University of Economics and Business. Available from:
http://epub.wu.ac.at/1934/ [Accessed 3 January 2012].

79 | P a g e
Breidert, Hahsler & Reutterer, 2006. A Review of Methods for Measuring Willingness-to-
Pay. Innovative Marketing, Vol. 2, No. 4, p. 8 – 32.
Briers, B., Pandelaere, M., & Warlop, L. 2007. Adding Exchange to Charity: A Reference
Price Explanation. Journal of Economic Psychology, Vol. 28, p. 15 – 30.
Bruner II, G.C. 2009. Marketing Scales Handbook: A Complication of Multi-Item Measures
for Consumer Behaviour & Advertising Research Volume 5. GCBII Productions: Illinois.
Campbell, M. 1999. Perceptions of Price Unfairness: Antecedents and Consequences. Journal
of Marketing Research, Vol. 36, p. 187 – 199.
Carlson, J.P., & Weathers, D. 2008 Examining Differences in Consumer Reactions to
Partitioned Prices with a Variable Number of Price Components. Journal of Business
Research, Vol. 61, p. 724 – 731.
Carrigan, M., & Attalla, A. 2001. The Myth of the Ethical Consumer – Do Ethics Matter in
Purchase Behaviour? Journal of Consumer Marketing, Vol. 18, No. 7, p. 560 – 578.
Connolly, J., & Shaw, D. 2006. Identifying fair trade in consumption choice. Journal of
Strategic Marketing, Vol. 14, No. 4, p. 353 – 368.
Chandran, S., & Morwitz, V.G. 2005. Effects of Participative Pricing on Consumers’
Cognitions and Actions: A Goal Theoretic Perspective. Journal of Consumer Research,
Vol. 32, No. 2, p. 249 – 259.
Cook, R. 1991. Consumer Demand for Food Safety-oriented Marketing Labels: Implications
for Sustainable Agriculture. Tokyo, paper presented at the International Agricultural
Economics Association Meeting.
Cowe, R., & Williams, S. 2000. Who are the ethical consumers? Co-operative Bank Report:
p. 1–44. Accessed from:
http://www.goodwithmoney.co.uk/assets/Uploads/Documents/ethicalconsumerreport2000
-part-1.pdf [24 February 2010]
Cox, J.L. 2001. Can Differential Prices be Fair? The Journal of Product and Brand
Management, Vol. 10, No. 5, p. 264 – 275.
Croson, R., Handy, F., & Shang, J. 2009. Keeping Up with the Joneses: The Relationship of
Perceived Descriptive Social Norms, Social Information, and Charitable Giving.
Nonprofit Management & Leadership, Vol. 19, No. 4, p. 467 – 489.
de Pelsmacker, P., Driesen, L., & Rayp, G. 2005a. Do Consumers Care About Ethics?
Willingness to Pay for Fair Trade Coffee. Journal of Consumer Affairs, Vol. 39, No. 2, p.
363 – 385.
de Pelsmacker, P., Janssens, W. 2007. A Model for Fair Trade Buying Behaviour: The Role
of Perceived Quantity and Quality of Information and of Product-Specific Attitudes.
Journal of Business Ethics, Vol. 75, No. 4, p. 361 – 380.
de Pelsmacker, P., Janssens, W., & Mielants, C. 2005b. Consumer Values and Fair Trade
Beliefs, Attitudes, and Buying Behaviour. International Review on Public and Non-profit
Marketing, Vol. 2, No. 2, p. 50 – 69.
Dolan, R.J. 1990. Conjoint Analysis: A Manager’s Guide. Harvard Business School, Case
Number 9-590-059, p. 1 – 14.
Dull, J., & Hak, T. 2008. Case Study Methodology in Business Research. Butterworth-
Heinemann: Oxford.
Eckel, C.C., & Grossman, P.J. 2008. Handbook of Experimental Economics Results:
Volume 1.Chapter 57: Differences in the Economic Decisions of Men and Women:
Experimental Evidence. North Holland.
Ellen, P.S., Mohr, L.A., & Webb, D.J. 2000. Charitable Programs and the Retailer: Do They
Mix? Journal of Retailing, Vol. 76, No. 3, p. 393 – 406.
Ethical Product Review. 2008. Accessed from:
http://www.ethicalproductreview.co.uk/index.php?State=10&id=187 [24 February 2010]

80 | P a g e
Fay, S. 2009. Competitive Reasons for the Name-Your-Own-Price Channel. Marketing
Letters, Vol. 20, No. 3, p. 277 – 293.
Fernandez, J. & Nahata, B. 2009. Pay What You Like, Munich Personal RePEc Archive, No.
16265. Accessed from: http://mpra.ub.uni-muenchen.de/16265/ [19 February 2010]
Food and Agriculture Organization of the United Nations (FAO). 2001. The Market for
“Organic” and “Fair-trade” Bananas, Intergovernmental Group on Bananas and on
Tropical Fruits, Committee on Commodity Problems. Accessed from:
http://www.fao.org/docrep/MEETING/004/Y1767E.HTM#P175_15499 [24 February
2010]
Foreit, K.G.F., & Foreit, J.R. 2001. Using Simply Survey Techniques to set Prices for Social
Products and Services. Social Marketing Quarterly, Vol. 7, No. 3, p. 14 – 27.
Franklin, D. 2008. The Good Consumer. The Economist, Vol. 387, No. 8562.
Frederick, S. 2011. Overestimating Others’ Willingness to Pay. Journal of Consumer
Research. Available from: http://www.jstor.org/stable/10.1086/662060 [Accessed 29
February 2012]
Friedman, M.P. 1967. Quality and Price Considerations in Rational Consumer Decision
Making. Journal of Consumer Affairs, Vol. 1, No. 1, p. 13 – 23.
Gabor, A., & Granger, C.W.J. 1993. Price as an Indicator of Quality: Report on an Enquiry.
Management Decision, Vol. 17, No. 8, p. 590 – 618.
Gielissen, R., & Graafland, J. 2009. Concepts of Price Fairness: Empirical Research into the
Dutch Coffee Market. Business Ethics: A European Review, Vol. 18, No. 2, p. 165 – 178.
Gneezy, A., Gneezy, U., Nelson, L.D., & Brown, A. 2010. Shared Social Responsibility: A
Field Experiment in Pay-What-You-Want Pricing and Charitable Giving. SCIENCE, Vol.
329, p. 325 – 326.
Griskevicius, V., Tybur, J.M., & van den Bergh, B. 2010. Going Green to Be Seen: Status,
Reputation, and Conspicuous Conservation. Journal of Personality and Social
Psychology, Vol. 98, p. 392 – 404.
Grunert, K.G. 2005. Food Quality and Safety: Consumer Perception and Demand.
European Review of Agricultural Economics, Vol. 32, No. 3, p. 369 – 391.
Hall, R.E. 1990. The Rational Consumer: Theory and Evidence. United States of America:
Massachusetts Institute of Technology.
Hauser, M.D. 2006. Moral Minds: How Nature Designed our Universal Sense of Right and
Wrong, Abacus: London, United Kingdom.
Hsee, C.K., & Zhang, J. 2004. Distinction Bias: Misprediction and Mischoice due to Joint
Evaluation. Journal of Personality and Social Psychology, Vol. 86, No. 5, p. 680 – 695.
Idea Consult. 2002. Effectenstudie en Opiniepeiling over Eerlijke Handel in Belgie. Research
Report for the Belgian Ministry of Foreign Affairs and International Cooperation,
Brussels.
Jones, L. 2004. How Fair Trade hit the Mainstream. BBC News, Business. Accessed From:
http://news.bbc.co.uk/2/hi/business/3522059.stm [21 December 2009]
Kanji, K. 2008. Mainstreaming Fair Trade: The Role of Consumers. Available from:
http://www.articlesbase.com/environment-articles/mainstreaming-fair-trade-the-role-of-
consumers-306764.html [21 December 2009]
Kahneman, D. & Tversky, A.1979. Prospect Theory: An Analysis of Decision under Risk.
Econometrica, Vol. 47, No. 2, p. 263 – 293.
Kim, J., Natter, M., & Spann, M. 2009. Pay What You Want: A New Participative Pricing
Mechanism. Journal of Marketing, Vol. 73, p. 44 – 58.
Kim, J., Natter, M., & Spann, M. 2010. Kish: Where Customers Pay As THEY Wish. Review
of Marketing Science, 8, Article 3. Available from:
http://www.degruyter.com/view/j/roms [Accessed: 23 January 2012]

81 | P a g e
Kimeldorf, H., Meyer, R., Prasad, M., & Robinson, I. 2006. Consumers with a Conscience:
Will They Pay More? Contexts, Vol. 5, p. 24 – 29.
Kleanthous, A., & Peck, J. 2006. Let Them Eat Cake: Satisfying the new consumer appetite
for responsible brands. Available from:
http://assets.wwf.org.br/downloads/let_them_eat_cake_full.pdf [21 December 2009]
Kotler, P., & Keller, K.L. 2008. Kotler, P., & Keller, K. L. 2008. Marketing Management 13th
Edition. Chapter 14: Developing Pricing Strategies and Programmes. New Jersey:
Prentice Hall.
Kramer, C. 1990. Food Safety: The Consumer Side of the Environmental Issue. Southern
Journal of Agricultural Economics, Vol. 22, No.1, p. 33 – 40.
Lacroix, B. 2010. [Personal Communication]. 3 February. Amsterdam.
Lee, Y.H., & Han, C.Y. 2002. Partitioned Pricing in Advertising: Effects on Brand and
Retailer Attitudes. Marketing Letters, Vol. 13, No. 1, p. 27 – 40.
Loureiro, M.L., & Lotade, J. 2005. Do fair trade and eco-labels in coffee wake up the
consumer conscience? Ecological Economics, Vol. 53, p. 129 – 138.
Lusk, J.L., & Schroeder, T.C. 2004. Are Choice Experiments Incentive Compatible? A Test
With Quality Differentiated Beef Steaks. American Journal of Agricultural Economics,
Vol. 86, No. 2, p. 467 – 482.
Nielsen. 2007. Britain’s Ethical Shopper: Which Way Now? United Kingdom.
Maxwell, J. 2003. Ethics 101: What Every Leader Needs to Know. New York: Time Warner
Book Group.
Mazar, N., & Zhong, C. 2010. Do Green Products Make us Better People? Psychological
Science, Vol. 21, No. 4, p. 494 – 498.
Maynard, M. 2007. Say ‘Hybrid’ and Many People will Hear ‘Prius.’ The New York Times,
Business. Accessed from: http://www.nytimes.com/2007/07/04/business/04hybrid.html
[25 July 2010]
McKinsey & Company: Oppenheim, J., Bonini, S., Bielak, D., Kehm, T., & Lacy, P. 2007.
Shaping the New Rules of Competition: UN Global Compact Participant Mirror.
Australia: McKinsey & Company. Accessed from:
http://www.mckinsey.com/clientservice/ccsi/pdf/Shaping_the_new_rules.pdf [24
February 2010]
Memery, J., Megicks, P., & Williams, J. 2005. Ethical and Social Responsibility Issues in
Grocery Shopping: A Preliminary Typology. Qualitative Market Research: An
International Journal, Vol. 8, No. 4, p. 399 – 412.
Mintz, S. (1996) Tasting Food, Tasting Freedom: Excursions Into Eating, Culture, and the
Past. Boston: Beacon Press.
Moore-Bridger, B. 2009. Pay-what-you-like restaurant’s recipe to beat the crunch. London
Evening Standard. Available from: http://www.thisislondon.co.uk/standard/article-
23633384-pay-what-you-like-restaurants-recipe-to-beat-the-crunch.do [13 June 2010]
Morwitz, V.G., Greenleaf, E.A., & Johnson, E.J. 1998. Divide and Prosper: Effects of
Partitioned Prices on Consumers’ Price Recall and Demand. Journal of Marketing
Research, Vol. 35, p. 453 – 463.
Neal, D. 2009a. Pay as you like software is popular. The Inquirer. Available from:
http://www.theinquirer.net/inquirer/news/1565876/pay-software-popular [13 June 2010]
Neal, D. 2009b. Binarynow ends pay what you like test. The Inquirer. Available from:
http://www.theinquirer.net/inquirer/news/1566396/binarynow-pay-test [13 June 2010]
Pechmann, C., Zhao, G., Goldberg, M.E., & Reibling, E.T. 2003. What to Convey in
Antismoking Advertisements for Adolescents: The Use of Protection Motivation Theory
to Identify Effective Message Themes. Journal of Marketing, Vol. 67, p. 1 – 18.

82 | P a g e
Poundstone, W. 2010. Priceless: The Myth of Fair Value (and how to take advantage of it).
Hill and Wang; New York.
Raghunathan, R., Naylor, R.W., & Hoyer, W.D. 2006. The Unhealthy = Tasty Intuition and
Its Effects on Taste Inferences, Enjoyment, and Choice of Food Products. Journal of
Marketing, Vol. 70, p. 170 – 184.
Rao, V.R. 2009. Handbook of Pricing Research in Marketing. Edward Elgar Publishing
Limited: Cheltenham.
Regner, T. & Barria, J.A. 2009. Do Consumers Pay Voluntarily? The Case of Online Music.
Journal of Economic Behaviour & Organisation, Vol. 71, p. 395 – 406.
Rode, J., Hogarth, R.M. & Le Menestrel, M. 2008. Ethical Differentiation and Market
Behaviour: An Experimental Approach, Journal of Economic Behaviour & Organisation,
Vol. 66, p. 265 – 280.
Roosen, J., Marette, S., & Blanchemanche, S. 2010. Value Elicitation using BDM and
Discrete Choice Mechanism. Economics Bulletin, Vol. 30, No. 2, p. 1554 – 1563.
Rossiter, J.R., & Bellman, S. 2005. Marketing Communications: Theory and Applications.
PEARSON Prentice Hall: Australia.
Schindler, R., Morrin, M., & Bechwati, N.N. 2005. Shipping Charges and Shipping Charge
Skepticism: Implications for Direct Marketers' Pricing Formats. Journal of Interactive
Marketing, Vol. 19, No. 1, p. 41 – 53.
Sen, S., & Bhattacharya, C.B. 2001. Does Doing Good Always Lead to Doing Better?
Consumer Reactions to Corporate Social Responsibility. Journal of Marketing Research, Vol.
28, No. 2, p. 225 – 243.
Shampanier, K., Mazar, N., & Ariely, D. 2007. Zero as a Special Price: The True Value of
Free Products. Marketing Science, Vol. 26, No. 6, p. 742 – 757.
Shapiro, D., & Zillante, A. 2009. Naming your own Price Mechanisms: Revenue gain or
drain? Journal of Economic Behavior & Organisation, Vol. 72, p. 725 – 737.
Shaw, D., & Clarke, I. 1999. Belief Formation in Ethical Consumer Groups: An Exploratory
Study. Marketing Intelligence & Planning, Vol. 17, No. 2, p. 109 – 120.
Shehryar, O. 2008. The Effect of Buyer’s Gender, Risk-Proneness, and Time Remaining in
and Internet Auction on the Decision to Bid or Buy-it-Now. The Journal of Product and
Brand Management, Vol. 17, No. 5, p. 356 – 365.
Shuttleworth, M. 2010. Field Experiments. Experiment Resources. Available from:
http://www.experiment-resources.com/field-experiments.html [Accessed 18 January
2012].
Sloot, E. 2010. ‘Fair Trade Laat Kansen Liggen door Consument niet te Shockeren.’ HDC
Media, Economie, 24 June 2010.
Smith, A. 1759. The Theory of Moral Sentiments. Accessed from:
http://www.marxists.org/reference/archive/smith-adam/works/moral/index.htm [24
February 2010]
Sober, E. 1988, What Is Evolutionary Altruism? Canadian Journal of Philosophy, Vol. 14, p.
75 – 99.
Spann, M., & Tellis, G.J. 2006. Does the Internet Promote Better Consumer Decisions? The
Case of Name-Your-Own-Price Auctions. Journal of Marketing, Vol. 70, p. 65 – 78.
Strahilevitz, M.A. 1999. The Effects of Product Type and Donation Magnitude on
Willingness-to-Pay More for a Charity-Linked Brand, Journal of Consumer, Vol. 8, No.
3, p. 215 – 241.
Strahilevitz, M.A. & Meyers, J.G. 1994. Bundling Products with Promised Donations to
Charity: the Effects of Donation Magnitude and Product Type on Choice and Actual
Purchase Behaviour. Presented at the Association for Consumer Research Conference,
Boston.

83 | P a g e
Strong, C. 1997. The Problems of Translating Fair Trade Principles into Consumer Purchase
Behaviour. Marketing Intelligence & Planning, Vol. 15, No. 1, p. 32 – 37.
Szmigin, I., Carrigan, M., & O’Loughlin, D. 2007. Integrating Ethical Brands into our
Consumption Lives. Journal of Brand Management, Vol. 14, p. 396 – 409.
Tellis, G.J. 1986. Beyond the Many Faces of Price: An Integration of Pricing Strategies.
Journal of Marketing, Vol. 50, No. 4, p. 146 – 160.
Terwiesch, C., Savin, S., & Hann, I.H. 2005. Online Haggling at a Name-Your-Own-Price
Retailer: Theory and Application. Marketing Science, Vol. 51, No. 3, p. 339 – 351.
The Fairtrade Foundation. 2005. Are Consumers Getting a Fair Deal From Fairtrade
Products? Accessible from:
http://www.fairtrade.org.uk/includes/documents/cm_docs/2008/R/1_Retail_pricing.pdf
[25 February 2010]
The Nielson Company. 2008. The environment - #1 corporate priority - according to the
world's consumers. Nielson: Breaking News October 2008. Accessed from:
http://pt.nielsen.com/documents/CSR_Global_BN.pdf [21 December 2009]
Umberger, W.J., & Feuz, D.M. 2004. The Usefulness of Experimental Auctions in
Determining Consumers' Willingness-to-Pay for Quality-Differentiated Products. Applied
Economic Perspecives and Policy, Vol. 26, No. 2, p. 170 – 185.
Vallerand, R.J., Pelletier, L.G., Deshaires, P., Cuerrier, J., & Mongeau, C. 1992. Ajzen and
Fishbein’s Theory of Reasoned Action as Applied to Moral Behaviour: A Confirmatory
Analysis. Journal of Personality and Social Psychology, Vol. 62, No. 1, p. 98 – 109.
van de Ven, F.P. 2009. [Personal Communication]. 21 December.
Vogel, V., Evanschitzky, H., & Ramaseshan, B. 2008. Customer Equity Drivers and Future
Sales. Journal of Marketing, Vol. 72, p. 98 – 108.
Volcker, F. 2005. Biases in Measuring Consumers’ Willingness to Pay. Research Papers on
Marketing and Retailing, University of Hamburg. Available from:
http://www.econbiz.de/archiv/hh/uhh/marketing/biases_consumers_willingness.pdf [20
December 2009]
Voormolen, S. (2009) Knipoog naar geitenwollen sokkendrager. NRC De Week,
Internationale Editie, NRC Handelsblad, 21 December 2009, p. 10 – 11.
Wertenbroch, K., & Skiera, B. 2002. Measuring Consumers’ Willingness to Pay at the Point
of Purchase. Journal of Marketing Research, Vol. 39, No. 2, p. 228 – 241.
Wier, M., & Calverley, C. 2002. Market Potential for Organic Foods in Europe, British Food
Journal, Vol. 104, No. 1, p. 45 – 62.
Witkowski, T.H. 2005. Fair Trade Marketing: An Alternative System for Globalisation and
Development. Journal of Marketing Theory and Practice, Vol. 13, No. 4, p. 22 – 34.
Xia, L., & Monroe, K.B. 2004. Price Partitioning on the Internet. Journal of International
Marketing, Vol. 18, No. 4, p. 63 – 73.
Zak, P.J., Stanton, A.A., & Ahmadi, S. 2007. Oxytocin Increases Generosity in Humans,
PLoS ONE Vol. 2, No. 11. Accessed from: www. plosone.org [19 February 2010]
Zhao, Y. 2006. Price Dispersion in the Grocery Market. The Journal of Business, Vol. 79, No.
3, p. 1175 – 1192.