Faculty & Research Working Paper - INSEAD - Manfred Kets de Vries
28
Faculty & Research Working Paper Development and Application of the Leadership Archetype Questionnaire _______________ Manfred F.R. KETS DE VRIES Pierre VRIGNAUD Anupam AGRAWAL Elizabeth FLORENT-TREACY 2007/40/EFE
Transcript of Faculty & Research Working Paper - INSEAD - Manfred Kets de Vries

Faculty & Research Working Paper Development and Application of the Leadership Archetype Questionnaire
_______________
Manfred F.R. KETS DE VRIES Pierre VRIGNAUD Anupam AGRAWAL Elizabeth FLORENT-TREACY 2007/40/EFE

Development and Application of the Leadership Archetype Questionnaire
(sent for review to the Journal of Applied Psychology, July 2007)
Manfred F.R. Kets De Vries*
Pierre Vrignaud**
Anupam Agrawal***
and
Elizabeth Florent-Treacy****
* The Raoul de Vitry d'Avaucourt Chaired Professor of Leadership Development, ClinicalProfessor of Leadership Development, Director, INSEAD Global Leadership Centre (IGLC)at INSEAD, Boulevard de Constance, 77305 Fontainebleau Cedex, France
** Professor of Work and Vocational Psychology, Université de Paris X ; Laboratoire Travail et
Evolution Professionnelle, EA 3984, France *** PhD candidate in Technology Management at INSEAD, Boulevard de Constance,
77305 Fontainebleau Cedex, France **** Research Project Manager at INSEAD, Boulevard de Constance,
77305 Fontainebleau Cedex, France A working paper in the INSEAD Working Paper Series is intended as a means whereby a facultyresearcher's thoughts and findings may be communicated to interested readers. The paper should be considered preliminary in nature and may require revision. Printed at INSEAD, Fontainebleau, France. Kindly do not reproduce or circulate without permission.

Development and application of the LAQ 7/6/2007
2
Abstract
The Leadership Assessment Questionnaire (LAQ) is a 360-degree survey instrument that has been developed as a simple diagnostic tool to help us understand leadership behavior. The LAQ can help organizational leaders in two ways. First, it can be used to identify leaders’ own style of leadership and help formulate appropriate development objectives. Second, it can provide avenues for development of an executive team in which multiple leadership archetypes are represented.
The LAQ is based on eight leadership archetypes—Strategist, Change-catalyst, Transactor, Builder, Innovator, Processor, Coach, and Communicator. These archetypes are representations of ways of leading in a complex organizational environment. In this article, we discuss the development, design, and psychometric analysis of the LAQ. We detail the conceptual foundations of the questionnaire and the psychometric methods used to confirm the validity and reliability of the instrument. We conclude with avenues for future research.
KEY WORDS: Leadership archetype; leadership behavior; character; team; executive role configuration; leadership archetype questionnaire; 360-degree survey instrument.
Development and application of the LAQ 7/6/2007
3
Introduction
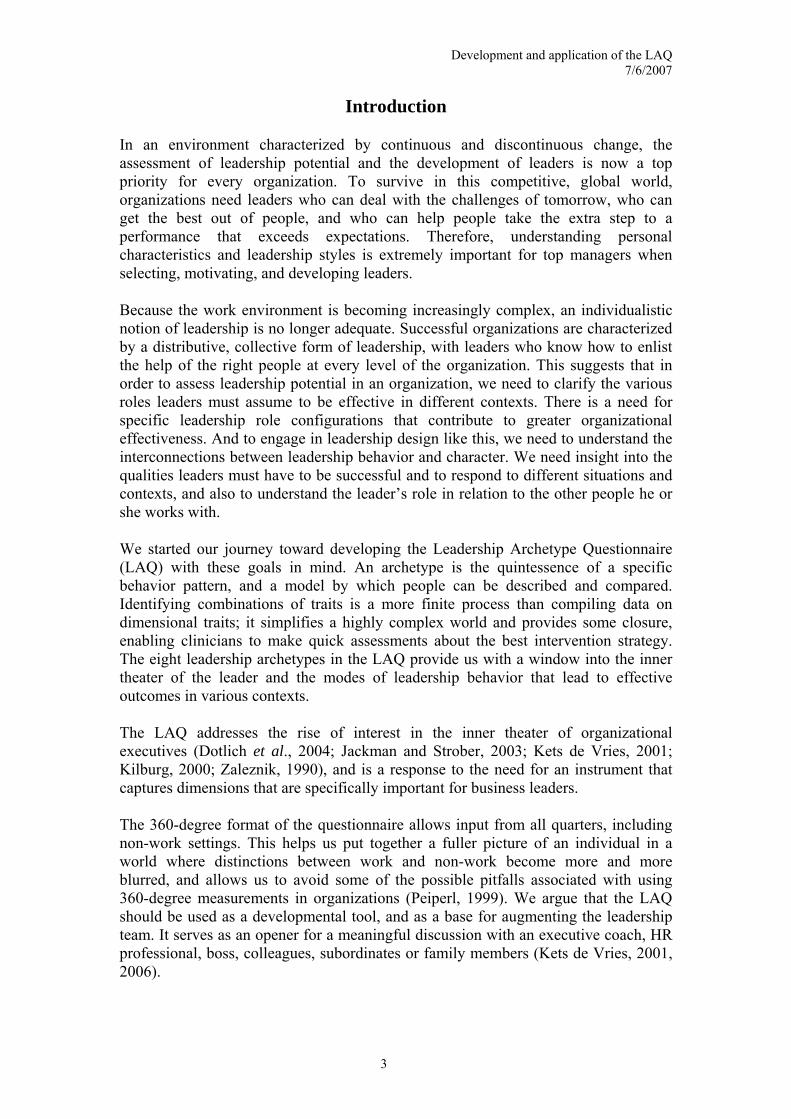
In an environment characterized by continuous and discontinuous change, the assessment of leadership potential and the development of leaders is now a top priority for every organization. To survive in this competitive, global world, organizations need leaders who can deal with the challenges of tomorrow, who can get the best out of people, and who can help people take the extra step to a performance that exceeds expectations. Therefore, understanding personal characteristics and leadership styles is extremely important for top managers when selecting, motivating, and developing leaders.
Because the work environment is becoming increasingly complex, an individualistic notion of leadership is no longer adequate. Successful organizations are characterized by a distributive, collective form of leadership, with leaders who know how to enlist the help of the right people at every level of the organization. This suggests that in order to assess leadership potential in an organization, we need to clarify the various roles leaders must assume to be effective in different contexts. There is a need for specific leadership role configurations that contribute to greater organizational effectiveness. And to engage in leadership design like this, we need to understand the interconnections between leadership behavior and character. We need insight into the qualities leaders must have to be successful and to respond to different situations and contexts, and also to understand the leader’s role in relation to the other people he or she works with.
We started our journey toward developing the Leadership Archetype Questionnaire (LAQ) with these goals in mind. An archetype is the quintessence of a specific behavior pattern, and a model by which people can be described and compared. Identifying combinations of traits is a more finite process than compiling data on dimensional traits; it simplifies a highly complex world and provides some closure, enabling clinicians to make quick assessments about the best intervention strategy. The eight leadership archetypes in the LAQ provide us with a window into the inner theater of the leader and the modes of leadership behavior that lead to effective outcomes in various contexts.
The LAQ addresses the rise of interest in the inner theater of organizational executives (Dotlich et al., 2004; Jackman and Strober, 2003; Kets de Vries, 2001; Kilburg, 2000; Zaleznik, 1990), and is a response to the need for an instrument that captures dimensions that are specifically important for business leaders.
The 360-degree format of the questionnaire allows input from all quarters, including non-work settings. This helps us put together a fuller picture of an individual in a world where distinctions between work and non-work become more and more blurred, and allows us to avoid some of the possible pitfalls associated with using 360-degree measurements in organizations (Peiperl, 1999). We argue that the LAQ should be used as a developmental tool, and as a base for augmenting the leadership team. It serves as an opener for a meaningful discussion with an executive coach, HR professional, boss, colleagues, subordinates or family members (Kets de Vries, 2001, 2006).

Development and application of the LAQ 7/6/2007
4
The Assessment of Leadership Behavior
Successful leaders fulfill two roles. One is charismatic, relating to the way in which leaders envision, empower and energize in order to motivate their followers. The other is more instrumental; every effective leader has to be an organizational designer, and control and reward behavior appropriately.
Most leadership tests have tried to identify certain recurring behavior patterns considered more or less effective in a leadership context. In the most popular of these tests, executives are classified as being people- or task-oriented (Fiedler 1967; Blake and Mouton 1985; Bass 1989). In the people (or consideration) orientation, leaders are concerned about their employees’ human needs. They are assumed to be more effective in creating teams, in helping employees with their problems, and providing psychological support. In the task (or structure) orientation, leaders believe that they get results by consistently focusing on the task to be done.
Another common approach found in leadership questionnaires is to assess whether leaders have an autocratic or democratic leadership style (Tannenbaum and Schmidt 1958; McGregor 1960; Likert 1961; Bass 1989). In the autocratic (or directive) style, the leader tells employees what needs to be done and how to do it, without soliciting their advice. In the democratic or participative style, the leader includes employees in the decision making process. However, the leader is still responsible for the decisions made.
A relatively recent distinction has been made between transactional and transformational leadership. The transactional leader works through creating structures where subordinates are clear about what is required of them, and the rewards that will accrue through following orders. Transformational leaders, in contrast, work to transform organizations, implying the transformation of their followers in the process. The aim of transformational leadership is supposed to construct a relationship of mutual stimulation and elevation that converts followers into leaders. While transactional leadership is more short-term oriented and focused on tactical issues, transformational leadership transcends daily affairs and helps release human potential (Burns 1978; Bass 1985; House and Shamir 1993; Bass and Avolo 1994).
Many variations on these basic themes can be identified, some more realistic than others. Classifying leaders in this way, however, frequently creates extremely simplistic two-by-two matrices, presenting a number of leadership styles. But in spite of their oversimplified nature, these approaches have some merit, as the insights they provide can point people in the right direction. They can also help identify people configurations that will be more or less effective in an organizational setting.
Some leadership scholars have gone further, searching for richer descriptions of executive behavior. The work of Henry Mintzberg has been very influential in this area. Mintzberg suggested that executives must take on a variety of different roles simultaneously to meet the many demands of their functions. He identified ten roles that most executives have in common: figurehead, liaison, leader, monitor, disseminator, spokesman, entrepreneur, disturbance handler, resource allocator, and negotiator (Mintzberg 1973). These ten roles are arranged into three groups:
Development and application of the LAQ 7/6/2007
5
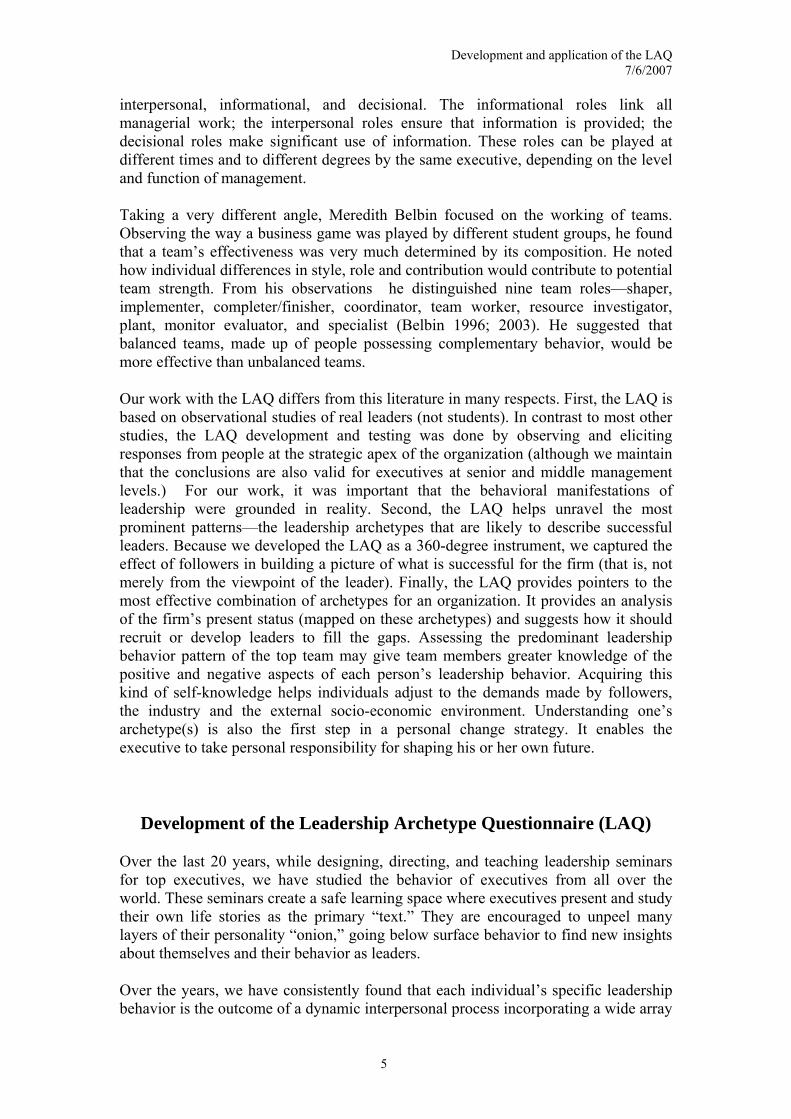
interpersonal, informational, and decisional. The informational roles link all managerial work; the interpersonal roles ensure that information is provided; the decisional roles make significant use of information. These roles can be played at different times and to different degrees by the same executive, depending on the level and function of management.
Taking a very different angle, Meredith Belbin focused on the working of teams. Observing the way a business game was played by different student groups, he found that a team’s effectiveness was very much determined by its composition. He noted how individual differences in style, role and contribution would contribute to potential team strength. From his observations he distinguished nine team roles—shaper, implementer, completer/finisher, coordinator, team worker, resource investigator, plant, monitor evaluator, and specialist (Belbin 1996; 2003). He suggested that balanced teams, made up of people possessing complementary behavior, would be more effective than unbalanced teams.
Our work with the LAQ differs from this literature in many respects. First, the LAQ is based on observational studies of real leaders (not students). In contrast to most other studies, the LAQ development and testing was done by observing and eliciting responses from people at the strategic apex of the organization (although we maintain that the conclusions are also valid for executives at senior and middle management levels.) For our work, it was important that the behavioral manifestations of leadership were grounded in reality. Second, the LAQ helps unravel the most prominent patterns—the leadership archetypes that are likely to describe successful leaders. Because we developed the LAQ as a 360-degree instrument, we captured the effect of followers in building a picture of what is successful for the firm (that is, not merely from the viewpoint of the leader). Finally, the LAQ provides pointers to the most effective combination of archetypes for an organization. It provides an analysis of the firm’s present status (mapped on these archetypes) and suggests how it should recruit or develop leaders to fill the gaps. Assessing the predominant leadership behavior pattern of the top team may give team members greater knowledge of the positive and negative aspects of each person’s leadership behavior. Acquiring this kind of self-knowledge helps individuals adjust to the demands made by followers, the industry and the external socio-economic environment. Understanding one’s archetype(s) is also the first step in a personal change strategy. It enables the executive to take personal responsibility for shaping his or her own future.
Development of the Leadership Archetype Questionnaire (LAQ)
Over the last 20 years, while designing, directing, and teaching leadership seminars for top executives, we have studied the behavior of executives from all over the world. These seminars create a safe learning space where executives present and study their own life stories as the primary “text.” They are encouraged to unpeel many layers of their personality “onion,” going below surface behavior to find new insights about themselves and their behavior as leaders.
Over the years, we have consistently found that each individual’s specific leadership behavior is the outcome of a dynamic interpersonal process incorporating a wide array
Development and application of the LAQ 7/6/2007
6
of cognitive as well as emotional competencies. There seems to be an intricate dynamic interface between leadership behavior and the organizational context (including the mindset of followers) in which the leader operates. In addition—and this is often one of the reasons why executives take the seminar—a particular leadership behavior pattern that had been highly effective at one stage in their career proves increasingly dysfunctional at another. In many cases, we observe behavioral inflexibility as executives struggle to cope with new situations. We have also discovered (a finding confirmed by other studies) that a key factor in making a specific leadership archetype more or less effective depends on the complementarity of roles in the organization’s executive team. If an executive can build on his or her strengths, while the other members of the executive team compensate for his or her weaknesses, all is well. If that is not the case—if there is incongruity between the needs of the organization and the capabilities of the individual—this mismatch can have grave consequences. The success of an organization very much depends on the effectiveness of the team.
By observing and interviewing these leaders in the classroom and in their organizations, we were able to formulate a number of leadership archetypes that we use to describe effective and essential ways of leading in the complex organizational environment. These archetypes represent prototypes for ideas, a template for interpreting observed phenomena and understanding behavior. When we made these conceptualizations, however, we were not looking for total inclusion.
Our observations also revealed that although individuals may “drift” toward one particular archetype, it is more common for a person to possess the characteristics of a number of archetypes. “Hybrids” are the rule rather than the exception. Executives may drift toward a particular archetype, depending on the situation. Of course, ideally an executive team should be able to cover all the leadership needs that are required, whatever the context.
In trying to link the leadership archetypes with character typology, it has to be accepted that it is impossible to include all character types. The fact that our study sample is not a cross-section of the work population excludes that possibility. People in a leadership position, or aspiring to be leaders, are a self-selected group. Some people have character types less likely to be found at senior executive positions. For example, there were very few people in the group with a self-defeating, dependent, depressive or detached personality (Kets de Vries and Perzow, 1991; Kets de Vries 2006).
The LAQ is a multidimensional model. Such models have an advantage over so-called categorical models in that they encourage breadth and comprehensiveness, and allow for a rich representation of individuality rather than forcing people into specific categories They “lose” less information than models dependent on discrete traits.
Given the nature of human development, the dimensions are, however, rarely independent. They build upon each other, making psychometric assessment more difficult. The most troubling limitation inherent in the dimensional approach is that while the scale gives no single dimension pride of place, test-users inevitably interpret some personality traits as being more positive than others. To minimize this problem,

Development and application of the LAQ 7/6/2007
7
we have made an effort to present the anchor points as neutrally as possible, but even being positioned on a “desirable” point on the dimension can have its downside.
Another reason that we chose a dimensional approach for the LAQ was our belief that an instrument like this must be ecologically valid (Messick, 1994)—that is, its findings must be generalizable and transferable to the environment in which the tested behaviors flourish (in this case, the business environment). The interpretation of the results, and the communication of this interpretation to the person tested, is necessary to the validation process. For this reason, we chose many correlated dimensions rather than fewer orthogonal ones, on the basis that the ease with which they could be understood by executives, and their relevance for personal development in a leadership context, would render them particularly ecologically valid. This is especially important to the LAQ, because it is intended for use in executive training and coaching contexts. Executives sometimes fail as leaders because of their behavior toward colleagues, subordinates, bosses, and other stakeholders (Kets de Vries, 2001). Identifying the dimensions that can be an asset in particular contexts can be extremely valuable as a tool for change.
For face validity, we confirmed our observations with a number of our colleagues involved in clinical group coaching. These colleagues, familiar with the leaders in question, validated our conceptualizations and assessments. In addition, we presented the archetypes to a number of colleagues in the strategy area for further face validation.
Following our observations we identified eight commonly found leadership archetypes. Each of these leadership archetypes will prove more or less effective depending on the organizational situation. They are not static. They can be changed to serve the needs of the individual, the team, and the situation if there is sufficient motivation to engage in a change effort. The archetypes are detailed in the next section.
The Eight Leadership Archetypes
The Strategist
Strategists have a long-term orientation, can see the big picture, and plan accordingly. They excel at anticipating future developments and are agile in response to change. Strategists provide vision, strategic direction and outside-the-box thinking to create new organizational forms and generate future growth.
Although Strategists are very talented, they do not always make the best people managers. They prefer to ignore “softer” issues and may avoid conflict. Because they are task-driven, they continue with the work at hand, focusing on facts and figures, and abstract scenarios. Despite their talent for aligning vision with strategy, they are not always good at taking the next step, or at aligning strategy with values and behavior, as this would entail awkward people interventions, something they are reluctant to deal with. This part of the leadership equation may be neglected as a
Development and application of the LAQ 7/6/2007
8
result, and lead to problem behavior in the organization. To compensate for this deficiency, Strategists often join forces with Coaches.
Examples of Strategist items from the LAQ
I am at my best conceptualizing long-term scenarios.
My ideas are long-term oriented and visionary.
The Change-catalyst
Change-catalysts are excellent at managing rapidly growing organizational units and at recognizing opportunities for organizational transformation. They are very good at turning abstract concepts into practical action and creating new organizational “blueprints.” They have a great sense of urgency and, unlike Strategists, have the talent to align vision, strategy and behavior. They are both outcome- and process-oriented.
Although many Change-catalysts have a talent for people management, their sense of urgency may override their sensitivity to the human dimension and make them poor communicators. Change-catalysts tend to have a starkly black-and-white view of what is right or wrong, and may not always be sufficiently politically sensitive to handle complex organizational problems.
Examples of Change-catalyst items
Overcoming blocked situations really excites me.
I enjoy the challenge of implementing turnaround plans for our organization.
The Transactor
Transactors identify and tackle new opportunities. Extremely dynamic and enthusiastic, they have considerable adaptive capacity, thriving on new challenges and negotiations. They like novelty, adventure, and exploration and have high risk-tolerance. Transactors know how to lobby inside and outside the organization to get their point of view across. They are outcome oriented but not as effective at processes.
Transactors react—or over-react— quickly to any environmental stimulus without much concern for long-term consequences. They are short-term oriented. Because they are good deal-makers or negotiators, they are frequently hard to read. Their confidence and bravura may cover considerable insecurity. For some, money becomes a signifier of self-worth; a narrow focus on financial gain, however, can contribute to stunted development.

Development and application of the LAQ 7/6/2007
9
Examples of Transactor items
Where others see problems in negotiations, I see new business opportunities.
I enjoy the challenge of looking for new clients with whom to make deals.
The Builder
Builders have an enormous amount of energy, drive, dynamism and enterprise. They are decisive, focused, single-minded, persevering and have a great capacity to deal with setbacks. Builders like setting up “skunkworks” or other intrapreneurial ventures inside a large organization. Builders are quite creative, and quick to adapt when they see opportunities elsewhere.
Given their great need for control, their leadership style will not always bring out the best in other people. When builders set up organizations they tend to create centralized, web-like structures where all of the reporting lines go through them. Builders tend to pay insufficient attention to the systemic side of organizational life. Their need for control and ambivalence toward authority mean that Builders find delegation difficult.
Examples of Builder items
I am at my best when I have a great deal of autonomy.
I feel a strong need to make my mark in whatever I am doing.
The Innovator
Innovators are endlessly inventive, and always on the lookout for new projects, new activities or new procedures. Free-spirited and imaginative, they lose themselves in solving complex problems. Their passion for learning new things—their insatiable search for knowledge—can be a source of inspiration to others. However, they are not organization builders and will only reluctantly accept a leadership position. They are ideally partnered with more organizational, people-oriented types such as Processors and Coaches.
Innovators enjoy outwitting the system and using its own rules and regulations to win the game—whatever the game may be. Some may even rebel actively (and successfully) against social rules they view as irrational and meaningless. But occasionally they will work against the system just for the joy of being obstructive. This brinkmanship-like behavior can endanger their careers.

Development and application of the LAQ 7/6/2007
10
Examples of Innovator items
People see me as extremely free spirited and imaginative.
I am always on the lookout for new projects, new activities or new procedures.
The Processor
Processors excel at turning organizations into smoothly running, well-oiled machines, and are particularly adept at helping organizations make an effective transition from an entrepreneurial to a more professionally managed stage. They are talented at setting boundaries and at creating the structures and systems necessary to support the organization’s objectives. Processors are committed corporate citizens and loyal to their organizations. However, they are not always particularly effective when dealing with people. They make decisions based on irrefutable data, sometimes at the cost of the personal element.
Because they tend to be collaborative, processors complement most other leadership styles; they will play an important role in any executive role constellation. Generally, they are not the kind of people who will get themselves or their organizations into trouble.
Examples of Processor items
I am very good at implementing action plans and managing the workflow.
I like to put into place measurement systems to assess the results of our work.
The Coach
Coaches are very good at instituting culture change projects that address issues of organizational alienation and loss of trust. They are exceptional people developers, full of empathy, and have high emotional intelligence. With their positive, constructive outlook on life, they inspire confidence and trust. Coaches are great communicators and motivators, excellent at handling difficult interpersonal and group situations, and at giving constructive feedback. Coaches create high performance teams and high performance cultures. They are great believers in participatory management and know how to delegate. Because of their great people skills, coaches are particularly effective in networking, knowledge-based organizations.
Of course, there are situations when a Coaching archetype is less effective. In crises a more direct (more authoritarian) approach) might be required. With some exceptions, however, Coaches can work quite well, even in extreme situations.

Development and application of the LAQ 7/6/2007
11
Examples of Coach items
I am very good at getting the best out of each person who works for me.
I am at my best when I am developing people.
The Communicator
Communicators can express a vision strongly and powerfully. They are able to “touch” and inspire people individually at all levels. They also know how to appeal to other organizational stake-holders. They are good at projecting optimism in times of adversity or crisis and are strongly influential with the various constituencies in the organization.
Communicators can appear to lack real focus and vision. The chameleon-like quality of their behavior suggests the triumph of form over substance. They quickly latch on to others for support and frequently go further, taking credit for other people’s achievements.
Examples of Communicator items
I am much better in presenting the broad picture than dealing with the details.
I strongly believe that impression management is an essential part of an executive’s job.
Design and Analysis of the LAQ: Development and refinement
The LAQ has been in development for many years. We went through three iterations before it reached its final form. We started with a questionnaire with a large number of items (the first tested version had 79). After testing the questionnaire on participants, classical psychometrical analysis and exploratory factor analysis of the data allowed us to identify a clear structure giving account of the relationships between the eight dimensions of the LAQ and to reduce drastically the number of items. In every round of development, we needed to test the questionnaire on senior executives participating in scheduled programs; there was therefore an inherent delay in the process, necessary to ensure that the instrument was reliable. We converged in three iterations. The LAQ now consists of a self and an observer questionnaire, with 48 items in each, spread over eight scales with six items each. A validation study was done on the final version of the LAQ and we present the findings below.
Validation
The LAQ is a 360-degree feedback instrument and therefore has a self and an observer version. Each item is presented in a bipolar form proposing two opposite statements. Instrument-takers are asked simply to indicate on a seven-point Likert-

Development and application of the LAQ 7/6/2007
12
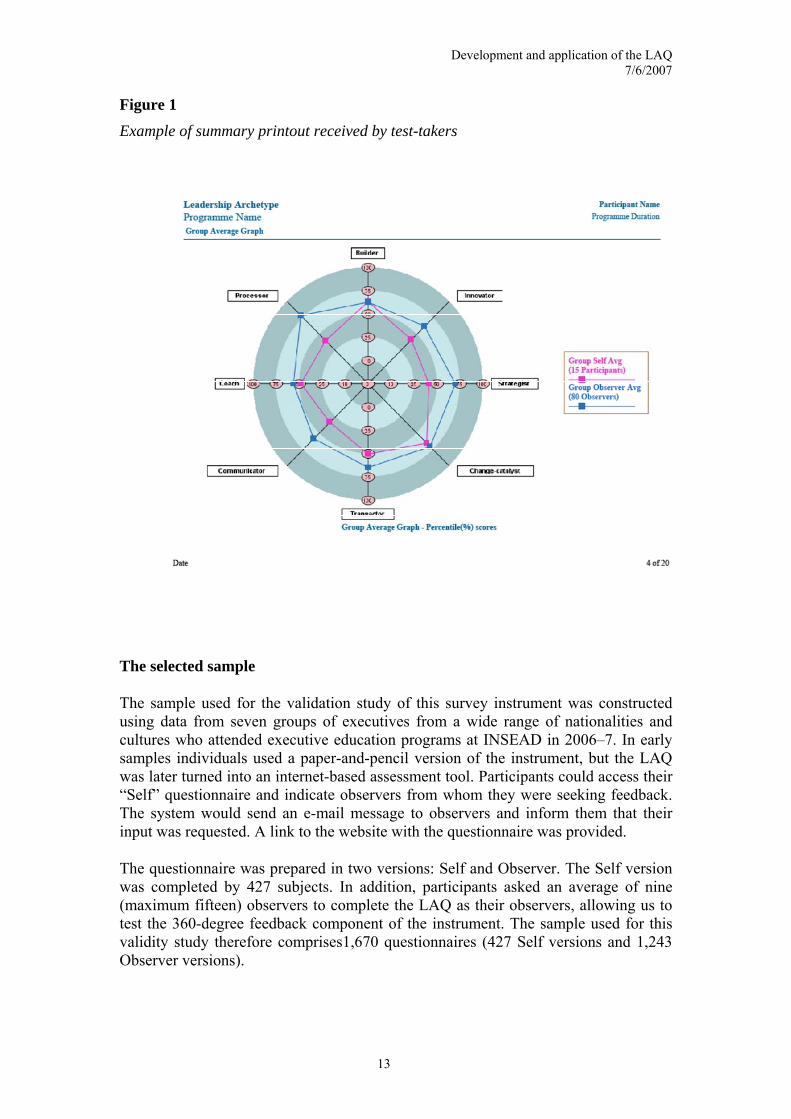
type scale the degree to which the left or the right pole of each statement describes the way they (or the individuals they are assessing) act in a particular situation (Likert, 1961). As a guideline, they are advised that the scale has a 4 in the middle and goes up from 1–3 to the left and 5–7 to the right. On each side of the scale, there is a statement that describes self-perceptions. The two descriptions are opposites. The subjects have to read each statement and decide how they feel about it, and then mark the number that describes them or the individuals they observe best. If they feel that their behavior is somewhere in the middle of the two contrasting statements, they should mark 4. After completing the questionnaire, and after the instrument had been made operational, the test-takers receive a printout, as shown in Figure 1.
Development and application of the LAQ 7/6/2007
13
Figure 1
Example of summary printout received by test-takers
The selected sample
The sample used for the validation study of this survey instrument was constructed using data from seven groups of executives from a wide range of nationalities and cultures who attended executive education programs at INSEAD in 2006–7. In early samples individuals used a paper-and-pencil version of the instrument, but the LAQ was later turned into an internet-based assessment tool. Participants could access their “Self” questionnaire and indicate observers from whom they were seeking feedback. The system would send an e-mail message to observers and inform them that their input was requested. A link to the website with the questionnaire was provided.
The questionnaire was prepared in two versions: Self and Observer. The Self version was completed by 427 subjects. In addition, participants asked an average of nine (maximum fifteen) observers to complete the LAQ as their observers, allowing us to test the 360-degree feedback component of the instrument. The sample used for this validity study therefore comprises1,670 questionnaires (427 Self versions and 1,243 Observer versions).

Development and application of the LAQ 7/6/2007
14
The balance between genders is skewed (as is the case at senior levels in most organizations) in favor of males for the Self version of the instrument (76%) and for the Observer version (73%). The mean respondents’ age is 31 years and six months for the Self version (std = 8 years, age minimum = 22 years, maximum = 62); 43 years for observer position (std = 8 years, age minimum = 21 years, maximum = 68). The respondents belong to 69 different nationalities, mostly European, North American and Middle Eastern (British 16%, Australian 11%, South African 9%, German 8%, French 6%, US 6%, Indian 5%, New Zealander 4%, Russian 4%, Dutch 3%, Canadian 3%, Saudi 3%). The order of the countries for these relative frequencies is roughly equivalent for both Self and Observer versions.
Reliability
In this section, we detail the results of the reliability analysis of the LAQ. Table 1 gives the descriptive statistics for the sample. The theoretical maximum score per scale is 48. The average scores are higher than the theoretical mean (24) in general, indicating a ceiling effect due partly to the social desirability factor.
Table 1
Means, standard deviations, and Cronbach’s alpha for the scales of the LAQ estimated on the whole sample (N = 1,670)
Type
Mean
Std Deviation
Cronbach’s alpha
Strategist 31.77 5.92 0.86
Change-catalyst 31.97 5.23 0.78
Transactor 31.15 5.78 0.82
Builder 32.13 5.28 0.66
Innovator 31.63 5.18 0.83
Processor 30.05 6.46 0.82
Coach 34.20 6.00 0.89
Communicator 30.79 6.02 0.81
Internal reliabilities, assessed through standardized Cronbach’s alpha, range from 0.66 to 0.89 for the different scales of the LAQ. The lowest values are close to the 0.70 value generally considered to indicate a sufficient reliability by classical psychometric

Development and application of the LAQ 7/6/2007
15
treatises (for example, Nunnally, 1978) and by standard practice within the scientific community (Peterson, 1994). These values are partially due to the small number of items per scale (6). In fact, research has found that the number of items in the calculation of alpha coefficients can appear to create confusion between internal consistency and the length of the scale (Cortina, 1993). A small number of items also has the advantage of needing only short administration time, an important factor for a 360-degree instrument that must be filled by very busy respondents. The inconvenience is that the values for reliability as estimated through Cronbach’s alpha are not as high as one would like them to be, although most of the items present sound psychometric properties. Furthermore, the Corrected Item/Total Correlations (CITC) has been computed for each item. The CITC mean value (.58) indicates that most of the items present a high relationship with their scale.
The internal reliability of 360-degree feedback instruments is, in general, lower for questionnaires filled out by the subjects themselves than for questionnaires filled out by their observers (Kouzes and Posner, 2002). It is hypothesized that the difference in internal consistency can be explained by the manifestation of the social desirability factor. Another hypothesis is artificial inflation of the reliability indicators due to the data collection design. Several observers are rating the same subject in the Self position. The data are structured as a nested design: the raters are nested in the observers. This implies that there are some dependencies between observers who rate the same self. This situation is a violation of the assumption of local independency under which the reliability indexes are valid (Lord and Novick, 1968).
To avoid this problem, we tested a sample of one observer per assessed test-taker, drawing one observer at random for each Self version with several corresponding Observer versions. Cronbach’s alphas have been computed separately for both (Self and Observer) questionnaires. Reliability ranges from .67 to .83 for the Self scores (Table 2) and from .70 to .92 for the Observer scores (Table 2). Observer ratings appear to be more reliable than the way the person (Self) rates him or herself. This phenomenon, undoubtedly related to a more reliable use of the response scale by observers, underscores the importance of using multiple feedback instruments to help executives gain a better understanding of their behavior.
Self-observer reliability was assessed by an inter-rater reliability approach: the intraclass correlation coefficient (Shrout and Fleiss, 1979). As the observers’ number was not the same for every subject (varying from 0 to 12), the sample made up of one randomly selected observer for each self was used. The reliability of the inter-rater agreement can be foreseen from two generalizability situations: the use of the rater’s single score (comparison between self and each observer) and the use of the average of several raters’ scores. The formulae used to estimate the inter-rater reliability are different for both situations. As the LAQ can be used for both situations, the ICC values have been computed for the single (Table 3, column 3) and average situation (Table 3, column 4). These values indicate a reliable agreement between Observer and Self versions.
Table 2
Reliability indices of Self and a random sample of Observers.

Development and application of the LAQ 7/6/2007
16
Cronbach’s Alpha
ICC*
ICC*
Scale
Self†
Observer†
Single
Average
Strategist .82 .88 .17 .29
Change-catalyst .82 .82 .23 .37
Transactor .83 .81 .20 .33
Builder .67 .70 .26 .41
Innovator .68 .79 .19 .32
Processor .71 .74 .42 .59
Coach .80 .92 .24 .39
Communicator .80 .85 .18 .31
† n = 427 * Internal Consistency Coefficient (Shrout and Fleiss, 1979)

Development and application of the LAQ 7/6/2007
17
Table 3
Correlations at the scale level for the whole sample for LAQ (N =1670)
BDR INN ST CC TR COM COA PR
BDR
1
INN .548
ST .430 .670 1
CC .505 .649 .606 1
TR .441 .550 .495 .597 1
COM .424 .574 .535 .539 .552 1
COA .151 .377 .359 .389 .232 .499 1
PR .263 .244 .272 .368 .312 .273 .120 1
At the item level, the strength of the relationship of each item to its scale can be measured by examining the corrected item test correlation (CITC). For the whole LAQ sample, the CITC ranged from 0.38 to 0.80, with a median at 0.58. For 45 items out of 48, the CITC was higher than 0.40, a value usually considered to indicate a reliable relationship between the item and the scale to which it belongs. For the remaining three items, the CITC values were 0.38, 0.38 and 0.39. Based on this analysis, we concluded that the items were well placed in their respective scales, and were therefore measuring different aspects.
Structural validity
To ascertain the validity of the instrument, we did a confirmatory factor analysis (CFA). In the CFA, we compared three measurement models. In our first (base) model we did not have any constraint and evaluated correlations between the eight scales. We compared this to the second model, where we constrained the correlations between scales to a value of 1—thereby assuming a single factor structure. This procedure was proposed by Bagozzi, Yi and Philips (1991) and it indicates that if the first model (unconstrained) significantly improves the fit, then the scales are distinct from each other—even though they may be correlated. Next, we compared the base model to one where we constrained the correlations to a value of zero—thereby assuming complete independence. Again, using the base model, a significant improvement in fit demonstrates that the scales are indeed related, indicating convergent validity. This procedure of confirmatory factor analysis (where we are studying the structure of the questionnaire) was studied for the LAQ using AMOS 7.
Development and application of the LAQ 7/6/2007
18
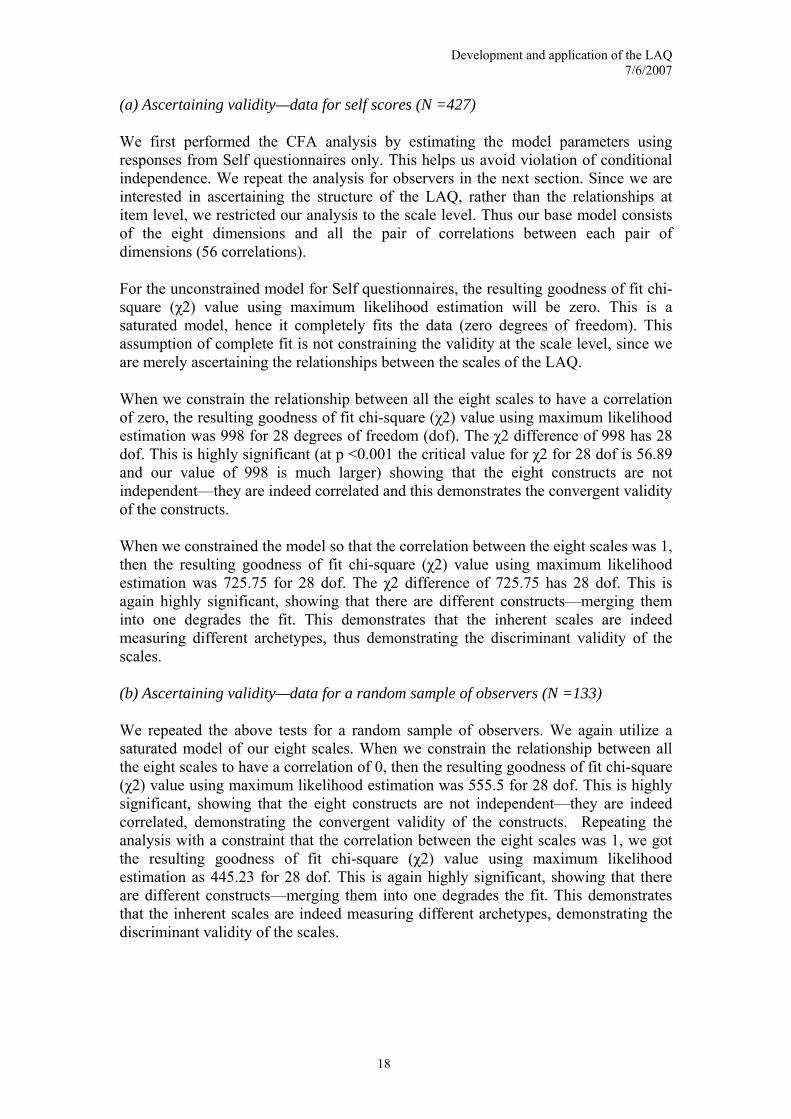
(a) Ascertaining validity—data for self scores (N =427)
We first performed the CFA analysis by estimating the model parameters using responses from Self questionnaires only. This helps us avoid violation of conditional independence. We repeat the analysis for observers in the next section. Since we are interested in ascertaining the structure of the LAQ, rather than the relationships at item level, we restricted our analysis to the scale level. Thus our base model consists of the eight dimensions and all the pair of correlations between each pair of dimensions (56 correlations).
For the unconstrained model for Self questionnaires, the resulting goodness of fit chi-square (χ2) value using maximum likelihood estimation will be zero. This is a saturated model, hence it completely fits the data (zero degrees of freedom). This assumption of complete fit is not constraining the validity at the scale level, since we are merely ascertaining the relationships between the scales of the LAQ.
When we constrain the relationship between all the eight scales to have a correlation of zero, the resulting goodness of fit chi-square (χ2) value using maximum likelihood estimation was 998 for 28 degrees of freedom (dof). The χ2 difference of 998 has 28 dof. This is highly significant (at p <0.001 the critical value for χ2 for 28 dof is 56.89 and our value of 998 is much larger) showing that the eight constructs are not independent—they are indeed correlated and this demonstrates the convergent validity of the constructs.
When we constrained the model so that the correlation between the eight scales was 1, then the resulting goodness of fit chi-square (χ2) value using maximum likelihood estimation was 725.75 for 28 dof. The χ2 difference of 725.75 has 28 dof. This is again highly significant, showing that there are different constructs—merging them into one degrades the fit. This demonstrates that the inherent scales are indeed measuring different archetypes, thus demonstrating the discriminant validity of the scales.
(b) Ascertaining validity—data for a random sample of observers (N =133)
We repeated the above tests for a random sample of observers. We again utilize a saturated model of our eight scales. When we constrain the relationship between all the eight scales to have a correlation of 0, then the resulting goodness of fit chi-square (χ2) value using maximum likelihood estimation was 555.5 for 28 dof. This is highly significant, showing that the eight constructs are not independent—they are indeed correlated, demonstrating the convergent validity of the constructs. Repeating the analysis with a constraint that the correlation between the eight scales was 1, we got the resulting goodness of fit chi-square (χ2) value using maximum likelihood estimation as 445.23 for 28 dof. This is again highly significant, showing that there are different constructs—merging them into one degrades the fit. This demonstrates that the inherent scales are indeed measuring different archetypes, demonstrating the discriminant validity of the scales.
Development and application of the LAQ 7/6/2007
19
Structure of the LAQ
Louis Guttman (1954) studied the relationship between variables in a set (mostly intelligence tests), and noted that these relationships are often ordered. Consider four variables A, B, C, and D. Then we may find that these variables are ordered—A is nearer to B than to C and nearer to C than to D; B is nearer to C than to D, etc. This kind of relationship can be represented by a linear order relationship: the variables can be ordered on a line, a schema that Guttman called a simplex. Guttman also observed that some sets of variables exhibited a quite different pattern: the relationships between the variables decreased to a minimum and then began to grow up again: A is nearer to B than to C but is nearer to D than to C. He hypothesized that there is a circular order relationship between these variables. He called this kind of organization a circumplex. It is possible to represent the circumplex by positioning the variables on a circle. Since the seminal work by Leary (1957), circumplex models have been widely used to account for the organization of personality traits (Leary). A publication edited by Plutchik and Conte (1996) takes stock of the research in different psychological fields (emotion, personality, values, vocational interests) using circumplex models.
The eight dimensions of the LAQ are not independent; they are correlated but are sufficiently different for us to hypothesize that they assess different facets of leadership behavior. The correlations matrix (Table 3) exhibits a pattern close to the theoretical one that can be associated with Guttman’s simplex or even circumplex structure. The proximity between types deduced from the correlation pattern and represented through the positions of the types on a circle (Figure 2) received strong theoretical support, as they express similarities and dissimilarities between types. This polar graph has been used to present the results of the LAQ.

Development and application of the LAQ 7/6/2007
20
Figure 2
Circumplex model of the LAQ structure
Since Guttman’s seminal work, different approaches have been proposed to test whether a simplex or circumplex model fits the data. Geometrical approaches like exploratory factor analysis (EFA) and multidimensional scaling (MDS) have been widely used. The aim of these methods is to obtain a geometrical representation of the relationship between the variables using a smaller subset of dimensions than the number of variables. It has been generally accepted that a two-factor (two dimensions, in the case of the MDS) solution supports a circumplex model (Wiggins, J.S., Steiger, J. H. & Gaelick, L., 1981). The geometrical figure formed by the representation of the variables (in general the variables form a circle or a polygon) allows us to conclude—descriptively—whether a circumplex model fits the data.
Anderson (1960) proposed the modeling of the circumplex as a stochastic application in which variables are represented as points around a circle. Correlations between variables are expressed as functions of the tangent arc (in terms of hyperbolic cosine) formed by the vectors joining the center of the circle to the points on the circumference representing the variables. Browne (1992; Browne and Du Toit, 1992) has extended this approach by expressing correlations as Fourier series. Their algorithm is available as a specific subroutine of a general software—AUFIT, automated fitting of non-standard models—dedicated to solving systems of non-linear equations. To test the fit of the model to the data, the software computes fit indexes

Development and application of the LAQ 7/6/2007
21
that Browne and Cudeck (1993) demonstrated were pertinent to the use of structural equation modeling: test of exact fit, test of close fit or RMSEA (root mean square error of approximation) and CVI (cross-validation index).
We tested the fit of a circumplex model to the LAQ data (the sample of 427 Self questionnaires) with equally spaced points representing types (Figure 2). We positioned the reference type (Builder) at a zero-degree angle and each subsequent type at a point 45° further of the preceding one: Innovator (45°), Strategist (90°), Change-catalyst (135°), Transactor (180°), Communicator (225°), Coach (270°), Processor (315°). The test of exact fit (following a chi-square distribution) is 28.59 with 18 ddf (p < .054) and allows us to reject the null hypothesis of a gap between the model and the data. Other fit indices are as follows: RMSEA = .037 (a value < .05 is generally regarded as acceptable); CVI = .152 less than the CVI for the saturated model (= .169). We can conclude from the results of this analysis using Anderson’s approach as parameterized by Browne and Du Toit that a circumplex model can give account of the structure of the LAQ data. The similarity and dissimilarity between types can be represented as the proximity between points equally spaced on a circle.
Discussion and Future Research
The Leadership Assessment Questionnaire was developed to identify and facilitate the analysis of leadership archetypes. The instrument, consisting of eight archetypes—Strategist, Change-catalyst, Transactor, Builder, Innovator, Processor, Coach, and Communicator—possesses sufficient internal reliability and consistency as well as validity.
The fact that there are significant links among the various archetypes measured may be viewed as a support of the theoretical underpinnings of the LAQ: many of the behaviors demonstrated by test-takers come from the same biosocial, cognitive, and psychosocial foundations. The difference, however, is that the dimensions measured by this instrument, without doubt capturing only a fraction of the richness of leadership behavior, reflect the areas that seem to be particularly important for the functioning of executives in organizations. The objective of the LAQ is to deepen the test-takers’ awareness of how their strengths align with their context and how others perceive them. This instrument helps executives start a journey of self-exploration, and encourages them to undertake a meaningful discussion with their leadership teams about the best combination of archetypes for the organization. It provides an overview of the firm’s current leadership constellation and a roadmap of how recruitment and executive development can fill the gaps in it. The LAQ is an effective tool for individual or group executive coaching on building high-performance teams and organizations.
Future research can focus on delving deeper into each of the archetypes and the nature of their relationships with other performance indicators. This is a fascinating field, and important for a better understanding of the human mind, executive functioning, leadership style, and organizational effectiveness.

Development and application of the LAQ 7/6/2007
22
Another exciting area for further research is addressing the differences between Self and Observer scores. We have indicated the difference that is generally typical for 360-degree instruments. However, further research into differences in perception of various leadership dimensions may shed light on discrepancies between public and private selves, as well as archetypes that are more or less accessible to an outsider. The implications would include important issues such as selection and development based on observations of an individual.
Further research into differences along various dimensions measured by the LAQ is important for increasing our knowledge about the influence of nationality, gender, and age on the scores obtained. In particular, it would be interesting to see how perceptions differ between different national cultures and between genders.
Another important area for future research involves comparing the results of the LAQ with some established measures of managerial or leadership behavior, such as the Global Executive Leadership Inventory (Kets de Vries, 2004a, 2004b; Kets de Vries et al., 2004). Understanding the correlations between the LAQ and the Global Executive Leadership Inventory could increase our understanding of the driving forces behind certain leadership practices.
Conclusion
The acquisition of a specific leadership behavior pattern can be compared to a dance between nature and nurture. Leadership behavior does not emerge in isolation. It is a highly complex transformation in which many factors play a part. Genetic predisposition combines with socializing influences to create character traits that will be expressed as behavior, including leadership archetype(s). A leadership archetype is an outcome of an interactive process between the individual and his or her environment.
For diagnostic purposes, using the notion of leadership archetypes is helpful in designing and shaping effective organizational teams. Understanding character, competencies, and roles is a powerful tool in the hands of an organizational designer. Effective or ineffective leadership behavior is very much dependent on context. The situation in which the organization finds itself will determine which leadership archetype is going to be most effective. What transition do leaders have to make to function well in a new role? What kind of developmental preparation is needed to make such a transition possible? What can executives do to enact changes in their leadership behavior?
The LAQ will help leaders assess which executive role configuration will be most effective in meeting future challenges. As suggested, the strength of an archetype in one situation may turn into a weakness in another. Knowing one’s preferred style will also be helpful when creating management teams. Highly effective organizations have high-performance teams, and from our experience in studying such teams, there needs to be complementarity between team members. In well functioning teams, members help each other. They view life in organizations as a sum-sum, not a zero-sum, game.
Development and application of the LAQ 7/6/2007
23
In high performance teams, executives leverage their strengths, allowing their colleagues to compensate for their weaknesses.
People are like books: it takes time to read them and work out the plot. And the plot thickens as we spend time with them. We have to view the identification and exploration of our own archetypes as a first step to self-knowledge. By learning more about their behavioral preferences and their leadership behavior, executives will optimize their interactions more efficiently. This knowledge will help them with communication and decision making. They will gain valuable insights into other people and how they resemble or differ from them. When executives take time to develop an understanding of each other’s leadership archetype, and are able to discuss each other’s strengths and weaknesses, they will have laid the foundations of the organization’s success.

Development and application of the LAQ 7/6/2007
24
References
Anderson, T.W. (1960). “Some stochastic process models for intelligence test scores” in K.J. Arrow, S. Kalin, and P. Suppes (Eds). Mathematical methods in the social sciences (pp. 205–20). Stanford CA: Stanford University Press.
Bagozzi, R. P., Yi, Y., and Phillips, L. W. 1991. “Assessing construct validity in organizational research.” Administrative Science Quarterly, 36(3), 421–58.
Bass, B. M. (1985). Leadership and Perfomance Beyond Expectations. New York: Free Press.
Bass, B. M. (1989). Stogdill's Handbook of Leadership: A Survey of Theory and Research. New York: Free Press.
Bass, B. M. and B. J. Avolo (1994). Improving Organizational Effectiveness through Transformational Leadership. Thousand Oaks, CA: Sage Publications.
Belbin, R. M. (1996). Team Roles at Work. Oxford: Butterworth Heinemann.
Belbin, R. M. (2003). Management Teams: Why they Succeed or Fail. Oxford: Butterworth Heinemann.
Blake, R. R. and J. S. Mouton (1985). The Managerial Grid III: The Key to Leadership Excellence. Houston: Gulf Publishing Company.
Browne, M.W. (1992). “Circumplex models for correlation matrices.” Psychometrika, 57, 469–97.
Browne, M. W., and R. Cudeck. 1993. “Alternative ways of assessing model fit. ” In: Testing structural equation models (136–62), K. A. Bollen and J. S. Long, eds. Newbury Park, CA: Sage Publications,
Browne, M.W., & Du Toit, S.H.C. (1992). “Automated fitting of nonstandard models.” Multivariate Behavioral Research, 27, 269–300.
Burns, J. M. (1978). Leadership. New York: Harper and Row.
Cortina, J. M. (1993). “What is Coefficient Alpha?: An Examination of Theory and Application.” Journal of Applied Psychology 78, 98–104.
Dotlich, D., Noel, J. and Walker, N. (2004). Leadership Passages: The Personal and Professional Transitions that Make or Break a Leader. Jossey-Bass: San Francisco, CA
Fiedler, F. E. (1967). A Theory of Leadership Effectiveness. New York: McGraw-Hill.
Development and application of the LAQ 7/6/2007
25
Guttman, L. (1954). “A new approach to factor analysis: the radex.” In P.F.Lazarsfeld (Ed), Mathematical thinking in the social sciences (pp. 258-348). Glencoe Ill.: The Free Press.
House, R. J. and B. Shamir (1993). Toward the Integration of Charismatic, Transformational, Inspirational, and Visionary Theories of Leadership. Leadership Theory and Research Perspectives and Directions. (81–107) M. Chemmers and R. Ayman. New York: Academic Press Inc.
Jackman, J. and Strober, M. (2003) “Fear of Feedback.” Harvard Business Review, April, 101–7.
Kets de Vries, M. F. R. (2001). The Leadership Mystique. London: Financial Times/Prentice Hall.
Kets de Vries, M. F. R. (2004a). Global Executive Leadership Inventory: Participant’s Guide. San Francisco: Jossey-Bass.
Kets de Vries, M. F. R. (2004b). Global Executive Leadership Inventory: Facilitator’s Guide. San Francisco: Jossey-Bass.
Kets de Vries, M. F. R. (2006). The Leader on the Couch. London: Wiley.
Kets de Vries, M. F. R. and S. Perzow (1991). Handbook of Character Studies. New York: International University Press.
Kets de Vries, M. F. R., Vrignaud, P. and Florent-Treacy, E. (2004). “The Global Leadership Life Inventory: Development and Psychometric Properties of a 360-Degree Feedback Instrument,” International Journal of Human Resource Management, 15 (3), 475–92.
Kilburg, R. (2000). Executive Coaching: Developing Managerial Wisdom in a World of Chaos. Washington, DC: American Psychological Association.
Kouzes, J. M. and Posner, B. Z. (2002). The Leadership Challenge. San Francisco: Jossey-Bass.
Leary, T. (1957). Interpersonal diagnosis of personality: A functional theory and methodology for personality evaluation. New York : Ronald Press.
Likert, R. (1961). New patterns of Management. New York: McGraw-Hill.
Lord, F. and Novick, M. (1968). Statistical Theories of Mental Test Scores. Oxford: Addison-Wesley.
McGregor, D. (1960). The Human Side of Enterprise. New York: McGraw Hill.
Messick, S. (1994). “Foundations of Validity: Meaning and Consequences in Psychological Assessment.” European Journal of Psychological Assessment, 10, 1–9.
Development and application of the LAQ 7/6/2007
26
Millon, T. (1996). Disorders of Personality: DSM IV and Beyond. New York: John Wiley.
Mintzberg, H. (1973). The Nature of Managerial Work. New York: Harper & Row.
Nunnally, J. C. (1978). Psychometric Theory. New York: McGraw-Hill.
Peiperl, M. (1999). “Conditions for the Success of Peer Evaluation.” The International Journal of Human Resource Management. 10 (3), 429–58.
Pervin, L. and J. E. Oliver, Eds. (2001). Handbook of Personality: Theory and Research. New York: The Guilford Press.
Peterson, R. A. (1994). “Cronbach's Alpha Coefficient: A Meta-analysis.” Journal of Consumer Research. 21, 381–91.
Plutchik, R., and H. R. Conte (1996). “Introduction: Circumplex models of personality and emotions.” In Plutchik, R., and H. R.Conte (Eds), Circumplex models of personality and emotions (1–14). Washington D.C: American Psychological Association.
Shrout, P. E. and Fleiss, J. L. (1979). “Intraclass Correlations: Uses in Assessing Rater Reliability.” Psychological Bulletin. 86, 420–28.
Tannenbaum, R. and W. Schmidt (1958). “How to Choose a Leadership Pattern.” Harvard Business Review. 36, 95–101.
Wiggins, J.S., Steiger, J. H. & Gaelick, L. (1981). Evaluating circumplexity in personality data. Multivariate Behavioral Research, 16, 263-289.
Zaleznik, A. (1990). Executive’s Guide to Motivating People. Chicago: Bonus Books.

Europe Campus Boulevard de Constance, 77305 Fontainebleau Cedex, France Tel: +33 (0)1 6072 40 00 Fax: +33 (0)1 60 74 00/01 Asia Campus 1 Ayer Rajah Avenue, Singapore 138676 Tel: +65 67 99 53 88 Fax: +65 67 99 53 99 www.insead.edu