Facts and Figures - rlp.de · 3 Madrid1,830 Oslo 1,293 Paris533 Prague562 riga 1,622 rome 1,242...
9
FACTS AND FIGURES
Transcript of Facts and Figures - rlp.de · 3 Madrid1,830 Oslo 1,293 Paris533 Prague562 riga 1,622 rome 1,242...
Facts and Figures
3
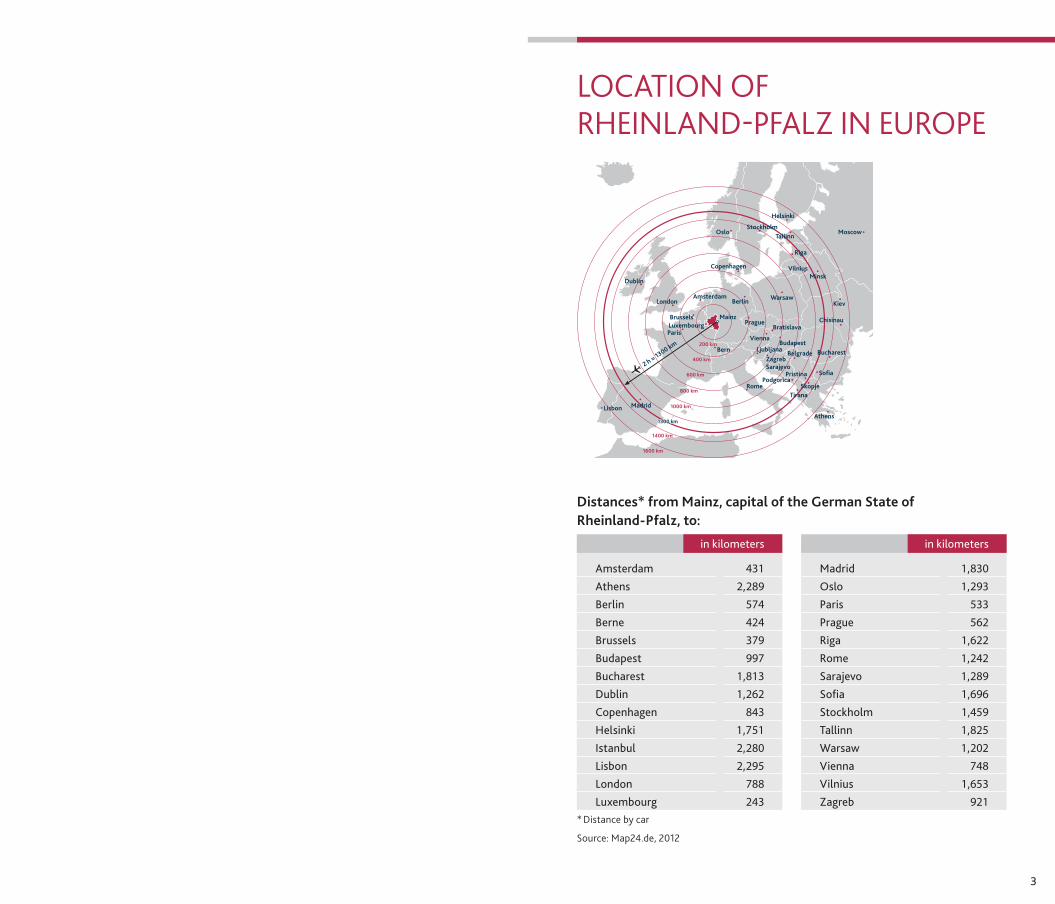
Madrid 1,830 Oslo 1,293 Paris 533 Prague 562 riga 1,622 rome 1,242 sarajevo 1,289 sofia 1,696 stockholm 1,459 tallinn 1,825 Warsaw 1,202 Vienna 748 Vilnius 1,653 Zagreb 921
Location of RheinLand-PfaLz in euRoPe
Distances* from Mainz, capital of the German State of Rheinland-Pfalz, to:
* distance by car
Source: Map24.de, 2012
amsterdam 431 athens 2,289 Berlin 574 Berne 424 Brussels 379 Budapest 997 Bucharest 1,813 dublin 1,262 copenhagen 843 Helsinki 1,751 istanbul 2,280 Lisbon 2,295 London 788 Luxembourg 243
in kilometers in kilometers

54
������
����
��������
��������
������
�����
���������
���������
���������
�����
�����������
�������
���������
�����������������
�� �������
����
������
������ ����������
����
� ��� ���������
������
������ �� ����
�� � ���
����� ���� ��
�����
����
�� � ����������
������
�����������
���������
������
���� ����������
�������������
�����
�������
��� �� ����� �����
��� �� ����� �����
��� �� �����
���� �
Mainz 203 ,082 Ludwigshafen 160 ,741 Koblenz 110 ,053 trier 106 ,303 Kaiserslautern 96 ,849 Worms 79 , 819 neuwied 64 ,026 neustadt a.d.W. 52 ,280 speyer 49 ,718 Frankenthal/Pf. 47 ,141 Bad-Kreuznach 43 ,769 Landau i.d.Pf. 43 ,554 Pirmasens 40 ,159 Zweibrücken 33 ,987
Cities in Rheinland-Pfalz with a population of 30,000 or more (2013)
City number
Location of RheinLand-PfaLz in GeRMany
RheinLand-PfaLz at a GLance
Baden-Württemberg 10 ,569 13. 1 35.8 296 Bayern 12 ,520 15. 5 70.6 177 Berlin 3 ,375 4. 2 0.9 3,785 Brandenburg 2 ,450 3. 0 29.5 83
Bremen 655 0. 8 0.4 1,562 Hamburg 1 ,734 2. 2 0.8 2,296 Hessen 6 ,016 7. 5 21.1 285 Mecklenburg-Vorpommern 1 ,600 2. 0 23.2 69 niedersachsen 7 ,779 9. 7 47.6 163 nordrhein-Westfalen 17 ,554 21. 8 34.1 515
Rheinland-Pfalz 3 ,990 5. 0 19.9 201 saarland 994 1. 2 2.6 387 sachsen 4 ,050 5. 0 18.4 220 sachsen-anhalt 2 ,259 2. 8 20.5 110 schleswig-Holstein 2 ,807 3. 5 15.8 178 thüringen 2 ,170 2. 7 16.2 134 Germany 80 ,524 10 0 357.2 225Source: federal Statistical office Germany, 2014
Source: federal Statistical office and the statistical offices of the German States, 2014
StatePopulation
in 1,000Population %
of GermanyArea in
1,000 kmPopulation
per km2
Rheinland-Pfalz compared to the Federal States (2012)

76
o
o
o
o
o o
o
!
!
!
!
! !
!
!
!
!
!
!
MoselMainR
hein
Frankfurt-HahnBitburg
Zweibrücken
BELGIUM
LUXEMBOURG
FRANCE
SAARLAND
BADEN-WÜRTTEMBERG
HESSEN
NORDRHEIN-WESTFALEN
A4
A59
A659
A602
A623
A8
A64
A560
A656
A650
A555
A1
A565
A620
A44
A3
A67
A66
A27
A65
A62
A60
A63
A8
A48
A4
A1
A5
A6
A3
A61
A61
Trier
KaiserslauternLudwigshafen
Mainz
Koblenz
Köln
Bonn
Saarbrücken
Mannheim
WiesbadenFrankfurt am Main
Karlsruhe
0 3015km
Kirchen
RheinbreitbachRemagenBad Neuenahr-Ahrweiler
Neuwied Höhr-Grenzhausen
Vallendar
KoblenzKaiserseschHillesheim
Daun
Simmern BingenMainz
Föhren
Trier
Birkenfeld
Idar-Oberstein
Bolanden-WeierhofWorms
LudwigshafenKaiserslautern
Zweibrücken
Pirmasens
Neustadt a.d.W.
Landau
Siebeldingen
Wendelsheim
University
Polytech institute
Research institution
Technology center and incubator
0 3015km
!
!
!
!
! !
!
!
!!
!
!
!
o
Köln
Bonn
Trier
Saarbrücken
KaiserslauternLudwigshafen
Mainz
Mannheim
Wiesbaden
Frankfurtam Main
Koblenz
MontabaurLimburg
Mos
el
Rhein
Main
Saa r
BELGIUM
LUXEMBOURG
FRANCE
SAARLAND
BADEN-WÜRTTEMBERG
HESSEN
NORDRHEIN-WESTFALEN
0 3015km
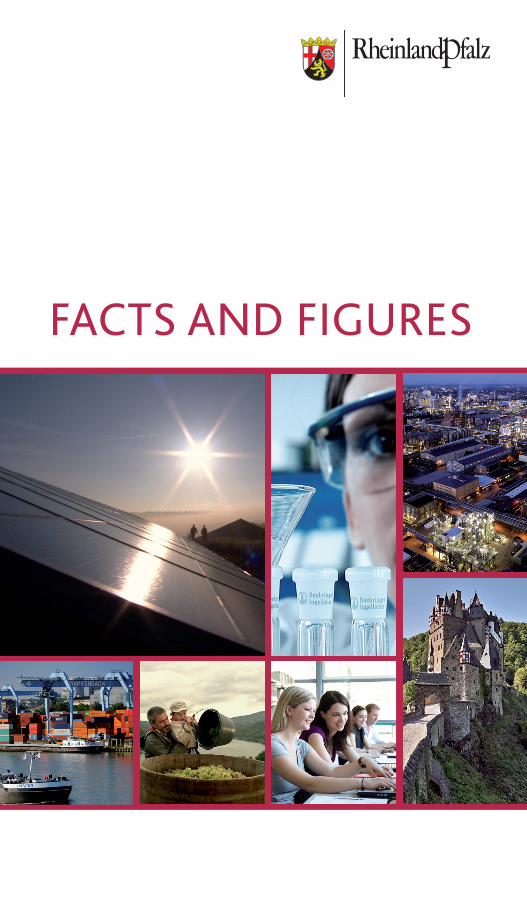
tRanSPoRtation infRaStRuctuRe
ReSeaRch and technoLoGy
Highways and airports
Waterways and high-speed train network
Kirchen
RheinbreitbachRemagenBad Neuenahr-Ahrweiler
Neuwied Höhr-Grenzhausen
Vallendar
KoblenzKaiserseschHillesheim
Daun
Simmern BingenMainz
Föhren
Trier
Birkenfeld
Idar-Oberstein
Bolanden-WeierhofWorms
LudwigshafenKaiserslautern
Zweibrücken
Pirmasens
Neustadt a.d.W.
Landau
Siebeldingen
Wendelsheim
University
Polytech institute
Research institution
Technology center and incubator
0 3015km
98
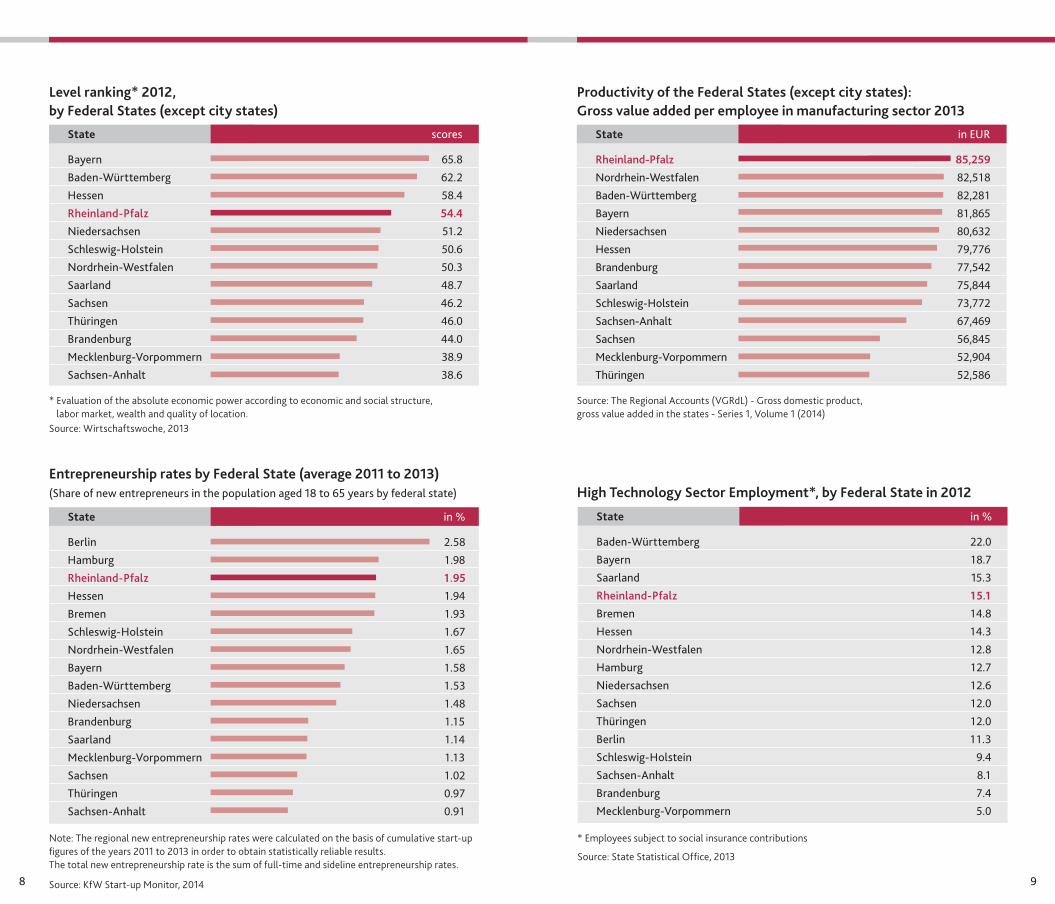
Level ranking* 2012, by Federal States (except city states)
Bayern 65.8 Baden-Württemberg 62.2 Hessen 58.4 Rheinland-Pfalz 54.4
niedersachsen 51.2 schleswig-Holstein 50.6 nordrhein-Westfalen 50.3 saarland 48.7 sachsen 46.2 thüringen 46.0 Brandenburg 44.0 Mecklenburg-Vorpommern 38.9 sachsen-anhalt 38.6
State scores
* evaluation of the absolute economic power according to economic and social structure, labor market, wealth and quality of location.
Source: Wirtschaftswoche, 2013
Entrepreneurship rates by Federal State (average 2011 to 2013) (share of new entrepreneurs in the population aged 18 to 65 years by federal state)
Berlin 2.58 Hamburg 1.98 Rheinland-Pfalz 1.95 Hessen 1.94 Bremen 1.93 schleswig-Holstein 1.67 nordrhein-Westfalen 1.65 Bayern 1.58 Baden-Württemberg 1.53 niedersachsen 1.48 Brandenburg 1.15 saarland 1.14 Mecklenburg-Vorpommern 1.13 sachsen 1.02 thüringen 0.97 sachsen-anhalt 0.91
State in %
note: the regional new entrepreneurship rates were calculated on the basis of cumulative start-up figures of the years 2011 to 2013 in order to obtain statistically reliable results. the total new entrepreneurship rate is the sum of full-time and sideline entrepreneurship rates.
Source: KfW Start-up Monitor, 2014
Productivity of the Federal States (except city states): Gross value added per employee in manufacturing sector 2013
Rheinland-Pfalz 85,259 nordrhein-Westfalen 82,518 Baden-Württemberg 82,281 Bayern 81,865 niedersachsen 80,632 Hessen 79,776 Brandenburg 77,542 saarland 75,844 schleswig-Holstein 73,772 sachsen-anhalt 67,469 sachsen 56,845 Mecklenburg-Vorpommern 52,904 thüringen 52,586
State in eur
Source: the Regional accounts (VGRdL) - Gross domestic product, gross value added in the states - Series 1, Volume 1 (2014)
Baden-Württemberg 22.0 Bayern 18.7 saarland 15.3 Rheinland-Pfalz 15.1 Bremen 14.8 Hessen 14.3 nordrhein-Westfalen 12.8 Hamburg 12.7 niedersachsen 12.6 sachsen 12.0 thüringen 12.0 Berlin 11.3 schleswig-Holstein 9.4 sachsen-anhalt 8.1 Brandenburg 7.4 Mecklenburg-Vorpommern 5.0
High Technology Sector Employment*, by Federal State in 2012
State
* employees subject to social insurance contributions
Source: State Statistical office, 2013
in %
1110
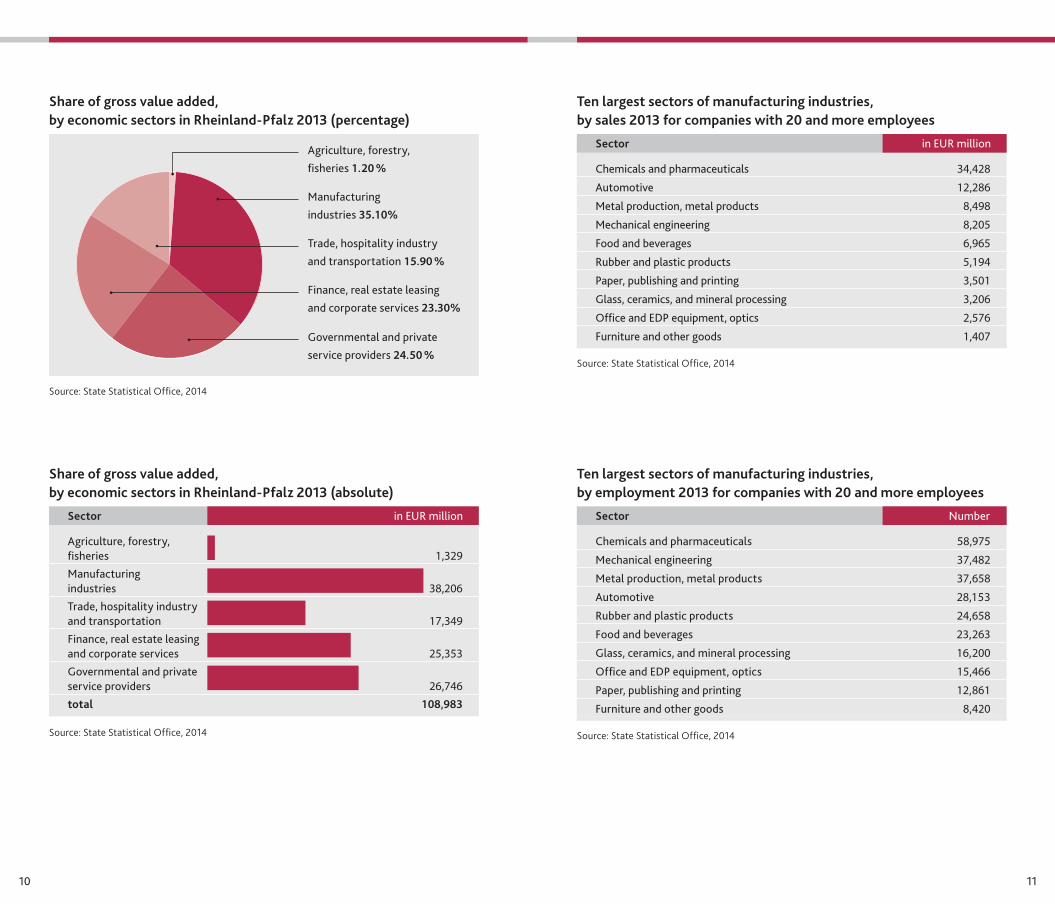
Share of gross value added, by economic sectors in Rheinland-Pfalz 2013 (percentage)
Share of gross value added, by economic sectors in Rheinland-Pfalz 2013 (absolute)
Ten largest sectors of manufacturing industries, by sales 2013 for companies with 20 and more employees
Ten largest sectors of manufacturing industries, by employment 2013 for companies with 20 and more employees
agriculture, forestry,
fisheries 1.20 %
Manufacturing
industries 35.10%
trade, hospitality industry
and transportation 15.90 %
Finance, real estate leasing
and corporate services 23.30%
governmental and private
service providers 24.50 %
Source: State Statistical office, 2014
Source: State Statistical office, 2014
Source: State Statistical office, 2014
Source: State Statistical office, 2014
agriculture, forestry, fisheries 1,329
Manufacturing industries 38,206
trade, hospitality industry and transportation 17,349
Finance, real estate leasing and corporate services 25,353
governmental and private service providers 26,746
total 108,983
chemicals and pharmaceuticals 34,428
automotive 12,286
Metal production, metal products 8,498
Mechanical engineering 8,205
Food and beverages 6,965
rubber and plastic products 5,194
Paper, publishing and printing 3,501
glass, ceramics, and mineral processing 3,206
Office and edP equipment, optics 2,576
Furniture and other goods 1,407
chemicals and pharmaceuticals 58,975
Mechanical engineering 37,482
Metal production, metal products 37,658
automotive 28,153
rubber and plastic products 24,658
Food and beverages 23,263
glass, ceramics, and mineral processing 16,200
Office and edP equipment, optics 15,466
Paper, publishing and printing 12,861
Furniture and other goods 8,420
Sector
Sector
Sector in eur million
in eur million
number
1312
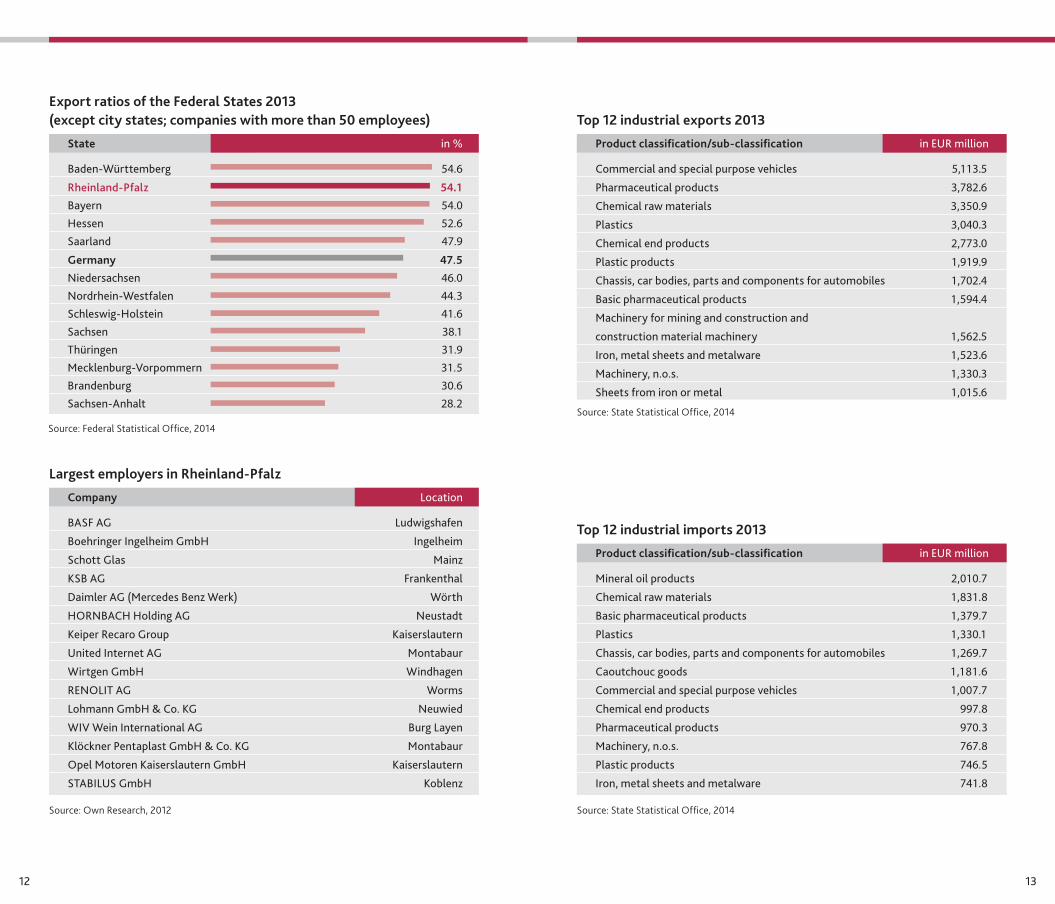
Top 12 industrial exports 2013
Top 12 industrial imports 2013
Largest employers in Rheinland-Pfalz
Source: State Statistical office, 2014
Source: State Statistical office, 2014
commercial and special purpose vehicles 5,113.5
Pharmaceutical products 3,782.6
chemical raw materials 3,350.9
Plastics 3,040.3
chemical end products 2,773.0
Plastic products 1,919.9
chassis, car bodies, parts and components for automobiles 1,702.4
Basic pharmaceutical products 1,594.4
Machinery for mining and construction and
construction material machinery 1,562.5
iron, metal sheets and metalware 1,523.6
Machinery, n.o.s. 1,330.3
sheets from iron or metal 1,015.6
Mineral oil products 2,010.7
chemical raw materials 1,831.8
Basic pharmaceutical products 1,379.7
Plastics 1,330.1
chassis, car bodies, parts and components for automobiles 1,269.7
caoutchouc goods 1,181.6
commercial and special purpose vehicles 1,007.7
chemical end products 997.8
Pharmaceutical products 970.3
Machinery, n.o.s. 767.8
Plastic products 746.5
iron, metal sheets and metalware 741.8
BasF ag Ludwigshafen
Boehringer ingelheim gmbH ingelheim
schott glas Mainz
KsB ag Frankenthal
daimler ag (Mercedes Benz Werk) Wörth
HOrnBacH Holding ag neustadt
Keiper recaro group Kaiserslautern
united internet ag Montabaur
Wirtgen gmbH Windhagen
renOLit ag Worms
Lohmann gmbH & co. Kg neuwied
WiV Wein international ag Burg Layen
Klöckner Pentaplast gmbH & co. Kg Montabaur
Opel Motoren Kaiserslautern gmbH Kaiserslautern
staBiLus gmbH Koblenz
Product classification/sub-classification in eur million
Product classification/sub-classification in eur million
Company Location
Export ratios of the Federal States 2013 (except city states; companies with more than 50 employees)
Baden-Württemberg 54.6
Rheinland-Pfalz 54.1 Bayern 54.0 Hessen 52.6 saarland 47.9
Germany 47.5 niedersachsen 46.0 nordrhein-Westfalen 44.3 schleswig-Holstein 41.6 sachsen 38.1 thüringen 31.9 Mecklenburg-Vorpommern 31.5 Brandenburg 30.6 sachsen-anhalt 28.2
State in %
Source: federal Statistical office, 2014
Source: own Research, 2012
14
contact infoRMationFor all questions regarding sites and locations, contact:
investment and economic development Bankof the German State of Rheinland-Pfalz(investitions- und Strukturbank Rheinland-Pfalz (iSB))
Address:investitions- und StrukturbankRheinland-Pfalz (iSB)holzhofstraße 455116 Mainz, GermanyPhone: +49 6131 6172-1202fax: +49 6131 6172-1299www.isb.rlp.de
Ministry for economic affairs, climate Protection, energy and Regional Planning of Rheinland-Pfalz(Ministerium für Wirtschaft, Klimaschutz, energieund Landesplanung)
Address:Ministerium für Wirtschaft, Klimaschutz, energie und Landesplanung Rheinland-PfalzStiftsstraße 955116 Mainz, GermanyPhone: +49 6131 16-5218fax: +49 6131 16-175218www.mwkel.rlp.de
For additional information, please check:

stiftsstraße 955116 Mainz, germany
Holzhofstraße 455116 Mainz, germany
Phone +49 6131 6172-1202telefax +49 6131 6172-1299isb-marketing@isb.rlp.dewww.isb.rlp.dewww.locationfinder.rlp.de
MINISTRY FORECONOMIC AFFAIRS,CLIMATE PROTECTION, ENERGYAND REGIONAL PLANNING