Factorsinfluencingmathematicsachievementof ...¬‚uencingmathematicsachievementof...
345
Running head: FACTORS INFLUENCING MATHEMATICS ACHIEVEMENT OF SECONDARY SCHOOL STUDENTS IN INDIA 1 Factors influencing mathematics achievement of secondary school students in India by Mini Joseph Chaman B Sc., B Ed., M Sc., M Ed Faculty of Education A thesis submitted in fulfilment of the requirements for the degree of Doctor of Philosophy University of Tasmania, October 2014
Transcript of Factorsinfluencingmathematicsachievementof ...¬‚uencingmathematicsachievementof...
Running head: FACTORS INFLUENCING MATHEMATICS ACHIEVEMENT OF SECONDARY SCHOOL STUDENTS IN INDIA 1
Factors influencing mathematics achievement ofsecondary school students in India
by
Mini Joseph Chaman B Sc., B Ed., M Sc., M Ed
Faculty of Education
A thesis submitted in fulfilment of the requirements for the degree of
Doctor of Philosophy
University of Tasmania, October 2014

FACTORS INFLUENCING MATHEMATICS ACHIEVEMENT OF SECONDARY SCHOOL STUDENTS IN INDIA 2
Declaration of Originality
This thesis contains no material which has been accepted for a degree or diploma by the
University or any other institution, except by way of background information and duly
acknowledged in the thesis, and to the best of my knowledge and belief no material
previously published or written by another person except where due acknowledgement is
made in the text of the thesis, nor does the thesis contain any material that infringes
copyright.
Signed Mini Joseph Chaman 22/10/2014
Authority of Access
This thesis may be made available for loan and limited copying and communication in
accordance with the Copyright Act 1968.
Signed Mini Joseph Chaman 22/10/2014
Statement of Ethical Conduct
The research associated with this thesis abides by the international and Australian codes
on human and animal experimentation, the guidelines by the Australian Government’s
Office of the Gene Technology Regulator and the rulings of the Safety, Ethics and
Institutional Biosafety Committees of the University.
Signed Mini Joseph Chaman 22/10/2014

FACTORS INFLUENCING MATHEMATICS ACHIEVEMENT OF SECONDARY SCHOOL STUDENTS IN INDIA 3
Abstract
Mathematics achievement and its importance to the future learning and careers of
students is a recurrent concern of academics, researchers, and media. In a developing
country like India, along with the technological advancement, achievement in
mathematics will be of paramount importance. This study looked at mathematics
achievement of secondary school students in Kerala, India. The study investigated how
mathematics anxiety, attitude towards mathematics, and parental involvement influenced
the mathematics achievement of the participants in this study. The study assessed how
the constructs were inter-related and how gender influenced these relationships. The
participants were Year 9 and Year 11 students and their parents from a private school in
Kerala.
A combination of quantitative and qualitative research methods was used to collect
data for the study. A student questionnaire gathered data on students’ perception of
their mathematics anxiety, attitude towards mathematics, and their parents’ involvement
in their mathematics learning. A parent questionnaire was used to understand parents’
perceptions of their mathematics anxiety, attitude towards mathematics, and their own
involvement in their child’s mathematics learning. A standardised achievement test in
mathematics was used to measure the students’ achievement. Semi-structured interviews
were conducted with a representative sample of the student and parent pairs in order to
gain a deeper understanding of the participants’ views about the constructs, their
inter-relationships and their relationship to mathematics achievement.
The study found that parental involvement was significantly and positively
associated with attitude towards mathematics and but had no significant association with
mathematics anxiety. Mathematics anxiety and attitude towards mathematics were

FACTORS INFLUENCING MATHEMATICS ACHIEVEMENT OF SECONDARY SCHOOL STUDENTS IN INDIA 4
significantly and positively related. The relationship between parental involvement and
mathematics achievement was non-significant. Student attitude towards mathematics,
and mathematics anxiety were also not significantly related to mathematics achievement.
Gender was found not to have any influence on the variables. Interview data revealed
that all of the parents had high expectations for their children’s mathematics
achievement that they had communicated through consistent reinforcement.
The study was limited in sample size constraining the generalizability of its findings
and its cross-sectional nature precludes the establishment of a casual relationship among
the variables. The timing of the administration of the student questionnaire and
achievement test on the same day, a week before the second term examinations may have
affected the results of the study.
In spite its limitations, the study opens several avenues for further research in the
field of mathematics achievement of secondary school students, particularly in India. A
longitudinal study with participants from public and private schools as well as schools in
urban and rural areas may help in understanding the casual relationship among the
variables considered in this study and others. It would be worthwhile, for example, to
consider the influence on mathematics achievement of contextual factors such as
teacher-student relationship, teacher competency, peer support, socio-economic status
and educational level of parents.

This dissertation is dedicated to God Almighty for the past, the present and the future
To my husband, Athanasius, and my sons, Arul and Paul

FACTORS INFLUENCING MATHEMATICS ACHIEVEMENT OF SECONDARY SCHOOL STUDENTS IN INDIA 6
Acknowledgements
I offer my extreme gratitude and praise to my Lord and Saviour, Jesus Christ, who
enabled me to complete this journey. He has made the impossible possible. All the glory
to Him.
A big thank you to my husband, Athanasius, for everything he has done to complete
this dissertation. It would have been difficult to travel this journey without your support.
Another big thank you goes to my sons, Arul and Paul, for their support and
encouragement through the dissertation. A special thanks to both of you for the
technical help you have given during the final stages of the dissertation.
I would like to express my gratitude to my principal supervisor Professor Kim
Beswick for her guidance, help, and support through the journey. I am thankful to you
for the many hours you put into reading and helping me to revise the thesis to what it is
now. Your thorough and insightful review of the thesis has been greatly appreciated. I
wish to thank my co-supervisor Associate Professor Rosemary Callingham for her
suggestions, and support. I greatly appreciate your help with Rasch analysis. I also wish
to thank my co-supervisor Dr.Jeong Jin Yu for his encouragement, and timely help in
working out the complexities of structural equation modeling. Thank you for your
comments and suggestions in improving the dissertation.
I would like to thank my parents for their sacrifices and support in my academic
endeavors. I would also like to thank my brother, sister and their families for their help
and support. Another thank you goes to my (late) mother-in-law, father-in-law,
brother-in-law and his family for their help and encouragement.
I would like to thank Professor Emerita Jane Watson for her constant words of
FACTORS INFLUENCING MATHEMATICS ACHIEVEMENT OF SECONDARY SCHOOL STUDENTS IN INDIA 7
encouragement and advice. A special thanks to Professor Neil Cranston for his advice
and willingness to help during a time when it was much needed. I would like to thank
Associate Professor Karen Swabey, Dr.Allen Hill, Dr.Megan Woods, Carol Lilley, and
Ben Millet for their support and encouragement. I would also like to thank my fellow
researchers and staff at the University of Tasmania.
A special thanks to my church family for their encouragement. I would like to thank
all who helped during the data collection process. Finally, I would like to thank all the
students and parents who participated in the study, without whom this study would not
have become a reality.
FACTORS INFLUENCING MATHEMATICS ACHIEVEMENT OF SECONDARY SCHOOL STUDENTS IN INDIA 8
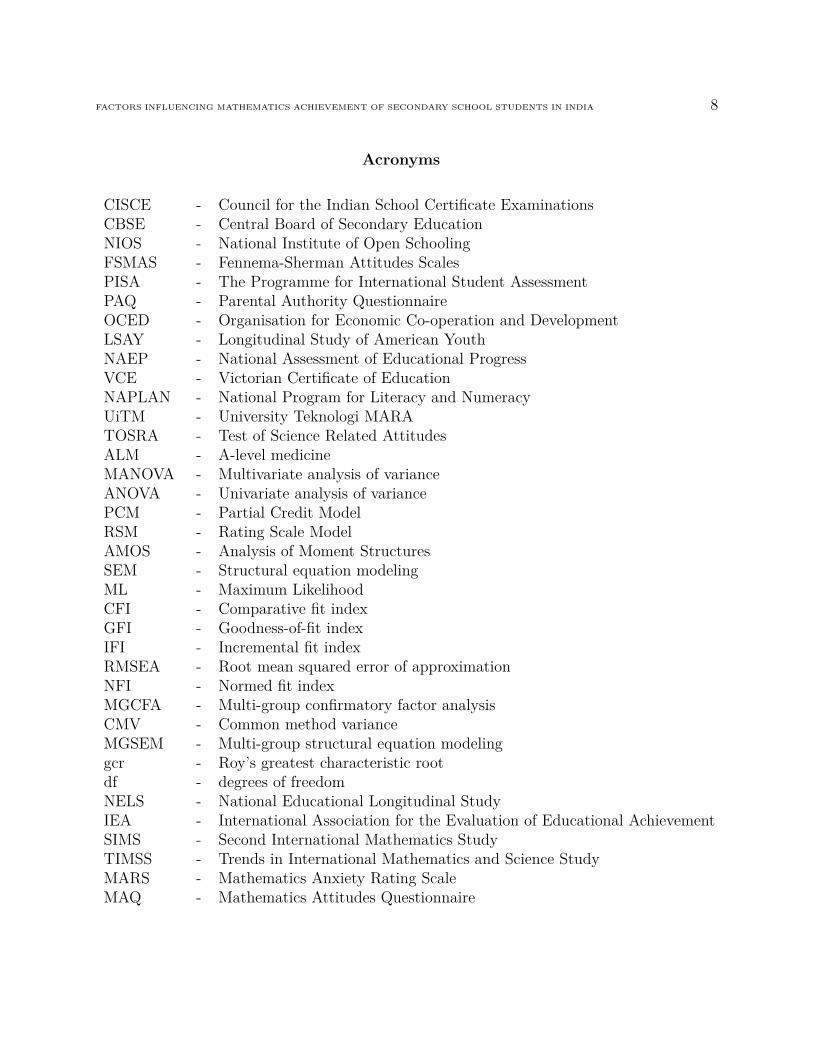
Acronyms
CISCE - Council for the Indian School Certificate ExaminationsCBSE - Central Board of Secondary EducationNIOS - National Institute of Open SchoolingFSMAS - Fennema-Sherman Attitudes ScalesPISA - The Programme for International Student AssessmentPAQ - Parental Authority QuestionnaireOCED - Organisation for Economic Co-operation and DevelopmentLSAY - Longitudinal Study of American YouthNAEP - National Assessment of Educational ProgressVCE - Victorian Certificate of EducationNAPLAN - National Program for Literacy and NumeracyUiTM - University Teknologi MARATOSRA - Test of Science Related AttitudesALM - A-level medicineMANOVA - Multivariate analysis of varianceANOVA - Univariate analysis of variancePCM - Partial Credit ModelRSM - Rating Scale ModelAMOS - Analysis of Moment StructuresSEM - Structural equation modelingML - Maximum LikelihoodCFI - Comparative fit indexGFI - Goodness-of-fit indexIFI - Incremental fit indexRMSEA - Root mean squared error of approximationNFI - Normed fit indexMGCFA - Multi-group confirmatory factor analysisCMV - Common method varianceMGSEM - Multi-group structural equation modelinggcr - Roy’s greatest characteristic rootdf - degrees of freedomNELS - National Educational Longitudinal StudyIEA - International Association for the Evaluation of Educational AchievementSIMS - Second International Mathematics StudyTIMSS - Trends in International Mathematics and Science StudyMARS - Mathematics Anxiety Rating ScaleMAQ - Mathematics Attitudes Questionnaire
FACTORS INFLUENCING MATHEMATICS ACHIEVEMENT OF SECONDARY SCHOOL STUDENTS IN INDIA 9
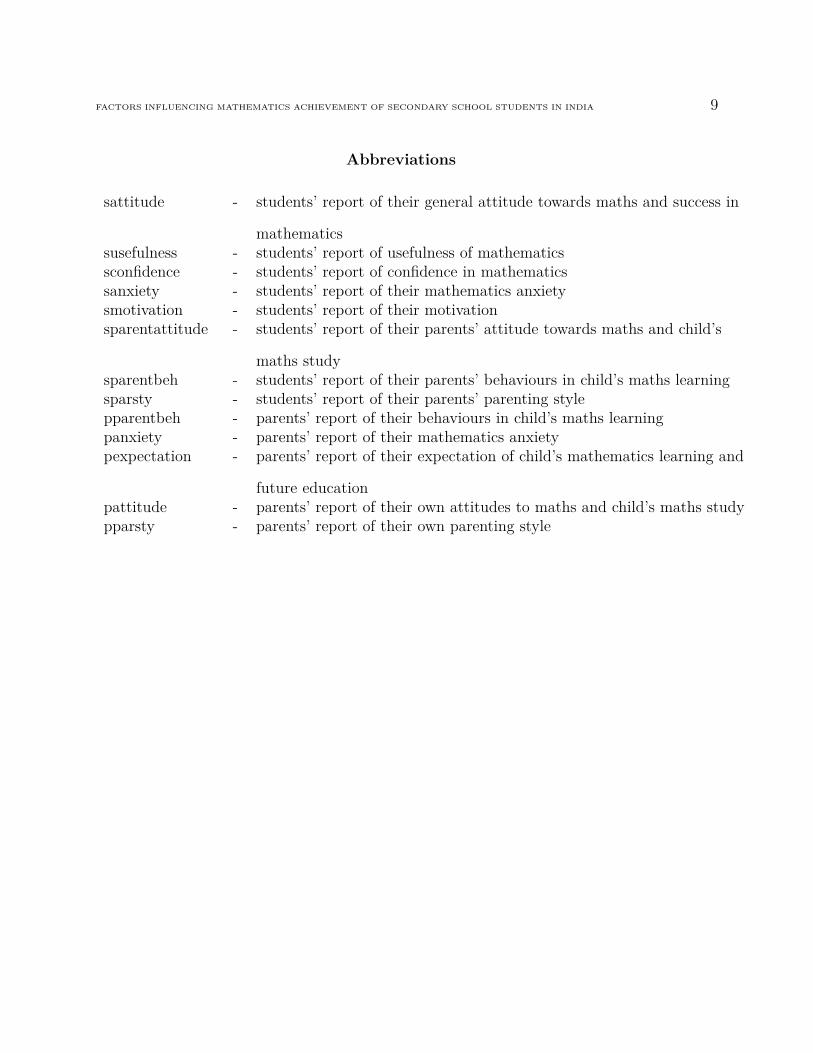
Abbreviations
sattitude - students’ report of their general attitude towards maths and success in
mathematicssusefulness - students’ report of usefulness of mathematicssconfidence - students’ report of confidence in mathematicssanxiety - students’ report of their mathematics anxietysmotivation - students’ report of their motivationsparentattitude - students’ report of their parents’ attitude towards maths and child’s
maths studysparentbeh - students’ report of their parents’ behaviours in child’s maths learningsparsty - students’ report of their parents’ parenting stylepparentbeh - parents’ report of their behaviours in child’s maths learningpanxiety - parents’ report of their mathematics anxietypexpectation - parents’ report of their expectation of child’s mathematics learning and
future educationpattitude - parents’ report of their own attitudes to maths and child’s maths studypparsty - parents’ report of their own parenting style
Contents
Abstract 3
Acknowledgements 6
Acronyms 8
Abbreviations 9
Chapter 1 INTRODUCTION 21
1.1 Preamble 21
1.2 Conceptual framework of the study 22
1.2.1 Mathematics anxiety . . . . . . . . . . . . . . . . . . . . . . . . . . . . . . 23
1.2.2 Attitude towards mathematics . . . . . . . . . . . . . . . . . . . . . . . . . 24
1.2.3 Parental involvement . . . . . . . . . . . . . . . . . . . . . . . . . . . . . . 25
1.2.4 Conceptual model . . . . . . . . . . . . . . . . . . . . . . . . . . . . . . . . 27
1.3 Research site 29
1.3.1 Education System in Kerala, India . . . . . . . . . . . . . . . . . . . . . . 30
1.4 Method 31
1.5 Significance of the study 32
1.6 Limitations of the study 33
1.7 Chapter Summary 33
Chapter 2 LITERATURE REVIEW 35
10
FACTORS INFLUENCING MATHEMATICS ACHIEVEMENT OF SECONDARY SCHOOL STUDENTS IN INDIA 11
2.1 Introduction 35
2.2 Mathematics anxiety 37
2.3 Attitude towards mathematics 40
2.4 Parental involvement 42
2.5 Influence of gender 48
2.5.1 Gender differences in mathematics anxiety and attitude towards mathematics 50
2.5.2 Parental involvement and gender . . . . . . . . . . . . . . . . . . . . . . . 52
2.6 Summary 53
Chapter 3 METHODOLOGY 56
3.1 Introduction 56
3.2 Research Design 56
3.3 Conceptual model 57
3.4 Data collection tools 58
3.4.1 Questionnaires . . . . . . . . . . . . . . . . . . . . . . . . . . . . . . . . . 58
3.4.2 Interviews . . . . . . . . . . . . . . . . . . . . . . . . . . . . . . . . . . . . 59
3.5 Instruments 60
3.5.1 Questionnaires . . . . . . . . . . . . . . . . . . . . . . . . . . . . . . . . . 60
3.5.1.1 Existing questionnaire instruments . . . . . . . . . . . . . . . . . . 61
3.5.1.1.1 Shortened Form of the Fennema-Sherman Attitudes Scales . . 61
3.5.1.1.2 Parental Authority Questionnaire . . . . . . . . . . . . . . . . 62

FACTORS INFLUENCING MATHEMATICS ACHIEVEMENT OF SECONDARY SCHOOL STUDENTS IN INDIA 12
3.5.1.2 Existing achievement test instruments . . . . . . . . . . . . . . . . 62
3.5.1.2.1 Programme for International Student Assessment . . . . . . . . 62
3.6 Instruments for the present study 63
3.6.1 Student questionnaire . . . . . . . . . . . . . . . . . . . . . . . . . . . . . 63
3.6.2 Parent Questionnaire . . . . . . . . . . . . . . . . . . . . . . . . . . . . . . 66
3.6.3 Achievement test in mathematics . . . . . . . . . . . . . . . . . . . . . . . 68
3.6.4 Interviews . . . . . . . . . . . . . . . . . . . . . . . . . . . . . . . . . . . . 70
3.7 Sample for the study 71
3.7.1 Description of participants . . . . . . . . . . . . . . . . . . . . . . . . . . . 72
3.8 Interviews 72
3.9 Data Collection Procedures 73
3.9.1 Data collection from students . . . . . . . . . . . . . . . . . . . . . . . . . 73
3.9.2 Student Interviews . . . . . . . . . . . . . . . . . . . . . . . . . . . . . . . 74
3.9.3 Data collection from parents . . . . . . . . . . . . . . . . . . . . . . . . . . 75
3.9.4 Parent interviews . . . . . . . . . . . . . . . . . . . . . . . . . . . . . . . . 76
3.10 Summary 76
Chapter 4 DATA ANALYSIS PLAN 78
4.1 Introduction 78
4.2 Analysis of quantitative data 78
4.3 Preparation of data 79
4.4 The Rasch models 80
FACTORS INFLUENCING MATHEMATICS ACHIEVEMENT OF SECONDARY SCHOOL STUDENTS IN INDIA 13
4.4.1 Partial Credit Models . . . . . . . . . . . . . . . . . . . . . . . . . . . . . 81
4.4.2 Assumptions of Rasch model . . . . . . . . . . . . . . . . . . . . . . . . . . 81
4.4.3 Data fit . . . . . . . . . . . . . . . . . . . . . . . . . . . . . . . . . . . . . 82
4.4.4 Variable map . . . . . . . . . . . . . . . . . . . . . . . . . . . . . . . . . . 83
4.5 Multivariate normality 84
4.6 Multivariate analysis of variance 85
4.7 Structural equation modeling 86
4.7.1 Model specification . . . . . . . . . . . . . . . . . . . . . . . . . . . . . . . 87
4.7.2 Model identification . . . . . . . . . . . . . . . . . . . . . . . . . . . . . . 87
4.7.3 Model estimation and evaluation . . . . . . . . . . . . . . . . . . . . . . . 88
4.7.4 Model modification . . . . . . . . . . . . . . . . . . . . . . . . . . . . . . . 89
4.8 Multi-group analysis 89
4.9 Analysis of qualitative data 94
Chapter 5 RESULTS OF THE STUDY 96
5.1 Introduction 96
5.2 Descriptive statistics 96
5.2.1 Student participants . . . . . . . . . . . . . . . . . . . . . . . . . . . . . . 96
5.2.2 Parent participants . . . . . . . . . . . . . . . . . . . . . . . . . . . . . . . 97
5.3 Results of Rasch analysis 97
5.3.1 Student questionnaire data . . . . . . . . . . . . . . . . . . . . . . . . . . . 98
5.3.2 Parent questionnaire data . . . . . . . . . . . . . . . . . . . . . . . . . . . 116
FACTORS INFLUENCING MATHEMATICS ACHIEVEMENT OF SECONDARY SCHOOL STUDENTS IN INDIA 14
5.3.3 Achievement test data . . . . . . . . . . . . . . . . . . . . . . . . . . . . . 125
5.4 Analysis of multivariate normality results 127
5.5 Multivariate analysis of variance results 128
5.6 Results of multi-group analysis 129
5.6.1 Preliminary analysis . . . . . . . . . . . . . . . . . . . . . . . . . . . . . . 129
5.6.2 Measurement model testing . . . . . . . . . . . . . . . . . . . . . . . . . . 134
5.6.3 Structural model testing . . . . . . . . . . . . . . . . . . . . . . . . . . . . 138
5.7 Findings from the qualitative data 140
5.7.1 Maya and her father Baby . . . . . . . . . . . . . . . . . . . . . . . . . . . 141
5.7.1.1 Attitude towards mathematics . . . . . . . . . . . . . . . . . . . . . 141
5.7.1.2 Mathematics anxiety . . . . . . . . . . . . . . . . . . . . . . . . . . 141
5.7.1.3 Parental involvement . . . . . . . . . . . . . . . . . . . . . . . . . . 141
5.7.2 Meenu and her mother Jaya . . . . . . . . . . . . . . . . . . . . . . . . . . 143
5.7.2.1 Attitude towards mathematics . . . . . . . . . . . . . . . . . . . . . 143
5.7.2.2 Mathematics anxiety . . . . . . . . . . . . . . . . . . . . . . . . . . 143
5.7.2.3 Parental involvement . . . . . . . . . . . . . . . . . . . . . . . . . . 143
5.7.3 Tony and his mother Jane . . . . . . . . . . . . . . . . . . . . . . . . . . . 145
5.7.3.1 Attitude towards mathematics . . . . . . . . . . . . . . . . . . . . . 145
5.7.3.2 Mathematics anxiety . . . . . . . . . . . . . . . . . . . . . . . . . . 145
5.7.3.3 Parental involvement . . . . . . . . . . . . . . . . . . . . . . . . . . 145
5.7.4 Mary and her mother Lizy . . . . . . . . . . . . . . . . . . . . . . . . . . . 146
5.7.4.1 Attitude towards mathematics . . . . . . . . . . . . . . . . . . . . . 146
5.7.4.2 Mathematics anxiety . . . . . . . . . . . . . . . . . . . . . . . . . . 146
5.7.4.3 Parental involvement . . . . . . . . . . . . . . . . . . . . . . . . . . 147

FACTORS INFLUENCING MATHEMATICS ACHIEVEMENT OF SECONDARY SCHOOL STUDENTS IN INDIA 15
5.7.5 Hema and her mother Rani . . . . . . . . . . . . . . . . . . . . . . . . . . 148
5.7.5.1 Attitude towards mathematics . . . . . . . . . . . . . . . . . . . . . 148
5.7.5.2 Mathematics anxiety . . . . . . . . . . . . . . . . . . . . . . . . . . 148
5.7.5.3 Parental involvement . . . . . . . . . . . . . . . . . . . . . . . . . . 149
5.7.6 Honey and her father Mathew . . . . . . . . . . . . . . . . . . . . . . . . . 149
5.7.6.1 Attitude towards mathematics . . . . . . . . . . . . . . . . . . . . . 150
5.7.6.2 Mathematics anxiety . . . . . . . . . . . . . . . . . . . . . . . . . . 150
5.7.6.3 Parental involvement . . . . . . . . . . . . . . . . . . . . . . . . . . 150
5.8 Summary of the findings from the qualitative data 151
5.9 Conclusion 153
Chapter 6 DISCUSSION AND CONCLUSION 154
6.1 Introduction 154
6.2 Overview of the findings of the current study 155
6.2.1 Research Question: 1 How does parental involvement in learning influence
the mathematics achievement of secondary school students in India? . . . . 160
6.2.2 Research Question: 2 How does attitude towards mathematics influence
mathematics achievement of secondary school students in India? . . . . . . 162
6.2.3 Research Question: 3 How does mathematics anxiety influence mathematics
achievement of secondary school students in India? . . . . . . . . . . . . . 164
6.2.4 Research Question: 4 How do parental involvement, attitude towards math-
ematics and mathematics anxiety interact to influence the mathematics
achievement of secondary school students in India? . . . . . . . . . . . . . 165
FACTORS INFLUENCING MATHEMATICS ACHIEVEMENT OF SECONDARY SCHOOL STUDENTS IN INDIA 16
6.2.5 Research Question: 5 Are there gender differences in relation to any of these
variables and/or their relationships? . . . . . . . . . . . . . . . . . . . . . . 169
6.2.6 Research Question: 6 Gender differences in the inter-relationship among the
variables . . . . . . . . . . . . . . . . . . . . . . . . . . . . . . . . . . . . . 173
6.3 Limitations of the study 174
6.4 Recommendations for further research 175
6.5 Conclusion 176
References 178
Appendix 209
Appendix A: Student Questionnaire . . . . . . . . . . . . . . . . . . . . . . . . . 209
Appendix B: Details of changed items in student questionnaire . . . . . . . . . . 227
Appendix C: Parent Questionnaire . . . . . . . . . . . . . . . . . . . . . . . . . 232
Appendix D: Details of changed items in parent questionnaire . . . . . . . . . . 244
Appendix E: Achievement Test . . . . . . . . . . . . . . . . . . . . . . . . . . . 245
Appendix F: Interview Schedules . . . . . . . . . . . . . . . . . . . . . . . . . . 256
Appendix G: Ethics Approval Letter . . . . . . . . . . . . . . . . . . . . . . . . 259
Appendix H: Permission Letter from Principal . . . . . . . . . . . . . . . . . . . 262
Appendix I: Consent Forms . . . . . . . . . . . . . . . . . . . . . . . . . . . . . 264
Appendix J: Information Sheets . . . . . . . . . . . . . . . . . . . . . . . . . . . 273
Appendix K: Interview transcripts . . . . . . . . . . . . . . . . . . . . . . . . . 280
Appendix L: Overall Item Fit Statistics- Students . . . . . . . . . . . . . . . . . 342
Appendix M: Overall Item Fit Statistics- Parents . . . . . . . . . . . . . . . . . 344
List of Tables
3.1 Example of reworded items in the student questionnaire . . . . . . . . . . . 65
3.2 Example of reverse coded items in the student questionnaire . . . . . . . . 66
3.3 Example of reworded items in the parent questionnaire . . . . . . . . . . . 67
3.4 Example of reverse coded items in the panxiety scale in parent questionnaire 68
3.5 Numbers of student participants in the study . . . . . . . . . . . . . . . . . 72
5.1 Summary of the overall fit statistics for the sattitude scale . . . . . . . . . 99
5.2 Summary of the overall fit statistics for the susefulness scale . . . . . . . . 102
5.3 Summary of the overall fit statistics for the sconfidence scale . . . . . . . . 105
5.4 Summary of the overall fit statistics for the sanxiety scale . . . . . . . . . . 107
5.5 Summary of the overall fit statistics for the smotivation scale . . . . . . . . 110
5.6 Summary of the overall fit statistics for the sparentbeh scale . . . . . . . . 112
5.7 Summary of the overall fit statistics for the sparentattitude scale . . . . . . 114
5.8 Summary of the overall fit statistics for the pparentbeh scale . . . . . . . . 117
5.9 Summary of the overall fit statistics for the panxiety scale . . . . . . . . . 119
5.10 Summary of the overall fit statistics for the pexpectation scale . . . . . . . 121
5.11 Summary of the overall fit statistics for the pattitude scale . . . . . . . . . 124
5.12 Summary of the overall fit statistics for the achievement test data . . . . . 126
5.13 Details of Mahalanobis distance obtained for the variables in the study . . 128
5.14 Descriptive statistics of the variables in the study . . . . . . . . . . . . . . 130
5.15 Means, standard deviations and inter-correlations of the variables for the
whole sample . . . . . . . . . . . . . . . . . . . . . . . . . . . . . . . . . . 131
5.16 Means, standard deviations and correlations of the variables for boys (above
the diagonal) and girls (below the diagonal) . . . . . . . . . . . . . . . . . 132
17
List of Figures
1.1 Conceptual model for the study showing the hypothesised relationship be-
tween the variables . . . . . . . . . . . . . . . . . . . . . . . . . . . . . . . 28
3.1 Conceptual model for the study showing the relationship between the variables 57
3.2 Example of items in the achievement test . . . . . . . . . . . . . . . . . . . 69
3.3 Example of questions for the students . . . . . . . . . . . . . . . . . . . . . 70
3.4 Example of questions for the parents . . . . . . . . . . . . . . . . . . . . . 71
4.1 Overview of the analysis plan for quantitative data in this study . . . . . . 79
4.2 Example of a variable map generated by Winsteps . . . . . . . . . . . . . . 84
4.3 The hypothesised measurement model showing the relationship between the
observed variables and the latent variables . . . . . . . . . . . . . . . . . . 92
4.4 The structural model showing the relationship between the latent variables
in the study . . . . . . . . . . . . . . . . . . . . . . . . . . . . . . . . . . . 93
5.1 Variable map showing the distribution of items and persons for sattitude scale100
5.2 Variable map showing the distribution of items and persons for susefulness
scale . . . . . . . . . . . . . . . . . . . . . . . . . . . . . . . . . . . . . . . 103
18

FACTORS INFLUENCING MATHEMATICS ACHIEVEMENT OF SECONDARY SCHOOL STUDENTS IN INDIA 19
5.3 Variable map showing the distribution of items and persons for sconfidence
scale . . . . . . . . . . . . . . . . . . . . . . . . . . . . . . . . . . . . . . . 106
5.4 Variable map showing the distribution of items and persons for sanxiety scale108
5.5 Variable map showing the distribution of items and persons for smotivation
scale . . . . . . . . . . . . . . . . . . . . . . . . . . . . . . . . . . . . . . . 111
5.6 Variable map showing the distribution of items and persons for sparentbeh
scale . . . . . . . . . . . . . . . . . . . . . . . . . . . . . . . . . . . . . . . 113
5.7 Variable map showing the distribution of items and persons for sparentatti-
tude scale . . . . . . . . . . . . . . . . . . . . . . . . . . . . . . . . . . . . 115
5.8 Variable map showing the distribution of items and persons for pparentbeh
scale . . . . . . . . . . . . . . . . . . . . . . . . . . . . . . . . . . . . . . . 118
5.9 Variable map showing the distribution of items and persons for panxiety scale120
5.10 Variable map showing the distribution of items and persons for pexpectation
scale . . . . . . . . . . . . . . . . . . . . . . . . . . . . . . . . . . . . . . . 122
5.11 Variable map showing the distribution of items and persons for pattitude
scale . . . . . . . . . . . . . . . . . . . . . . . . . . . . . . . . . . . . . . . 124
5.12 Variable map showing the distribution of items and persons for achievement
test data . . . . . . . . . . . . . . . . . . . . . . . . . . . . . . . . . . . . . 127
FACTORS INFLUENCING MATHEMATICS ACHIEVEMENT OF SECONDARY SCHOOL STUDENTS IN INDIA 20
5.13 The modified measurement model showing the relationship between the ob-
served variables and the latent variables . . . . . . . . . . . . . . . . . . . 136
5.14 Structural model showing the relationship between the variables in the study139

FACTORS INFLUENCING MATHEMATICS ACHIEVEMENT OF SECONDARY SCHOOL STUDENTS IN INDIA 21
CHAPTER 1 INTRODUCTION
1.1 Preamble
“Mathematics is a key science for the future, through both its fundamental
development and its enabling role for science, engineering and technology. This is
illustrated by dramatic advances in communications, bioinformatics, the understanding of
uncertainty and dealing with large data sets” (Lemaire, 2003, p. 21). The former Director
of the Division of Mathematical Sciences at the USA National Science Foundation, Prof.
Philippe Tondeur, has observed that the 21st century is going to witness greater
opportunities for mathematical sciences. Mathematical thought and concepts will become
the primary navigational tools in the data driven world (Lemaire, 2003). As a result of
the technological advancement in today’s societies, mathematical knowledge has become
essential for the success of individuals and for the progress and security of nations.
For success in tertiary education and beyond, a strong foundation in secondary
school mathematics is essential (Cappellari, Lucifora, & Pozzoli, 2008; Steinberg, Varua,
& Yong, 2010). Despite the importance of mathematics in life and in the study of other
science subjects, there has been a decline in the number of students enrolled in the
tertiary mathematics courses in India as well as in western countries (Mishra, 2011;
Smith, 2011). When capable students avoid the study of mathematics, it reduces their
career options and thereby limits the nation’s resource base in science and technology
(Hembree, 1990).
The researcher’s experience as a mathematics teacher brought her to this study. She
has first-hand experience of students who described mathematics as a difficult, boring,
abstract or uninteresting subject. Whether this view of mathematics was due to
FACTORS INFLUENCING MATHEMATICS ACHIEVEMENT OF SECONDARY SCHOOL STUDENTS IN INDIA 22
perceived difficulty of mathematics or students’ inability to do mathematics, hard work
and effort brought about better achievement for many of them. This experience has led
the researcher to consider why students perceive mathematics as a difficult subject. Why
are they not confident in their ability to do mathematics? What are the factors affecting
their mathematic achievement? These experiences resulted in the present study that
aimed to examine the influence of selected factors on mathematics achievement of
secondary school students.
1.2 Conceptual framework of the study
Many researchers have studied factors affecting mathematics learning and
performance of students (Beaton & O’Dwyer, 2002; Kifer, 2002; Ma & Klinger, 2000;
Papanastasiou, 2002; Reynolds & Walberg, 1991). Among factors that have been studied
extensively in relation to mathematics learning and achievement are mathematics anxiety
(Cates & Rhymer, 2003; Ma & Xu, 2004b; Zakaria & Nordin, 2008); attitude towards
mathematics (K. C. Cheung, 1988; Hannula, 2002); mathematics self-efficacy (Pietsch,
Walker, & Chapman, 2003; Williams & Williams, 2010); teachers (Beverley, 2002; Hill &
Rowe, 1998); peers (Berndt & Keefe, 1995; Wentzel, 1999); gender (Gray, 1996;
Kenney-Benson, Pomerantz, Ryan, & Patrick, 2006); and parental involvement
(Levpuscek & Zupancic, 2009; Vukovic, Roberts, & Wright, 2013; Yan & Lin, 2005). The
personal experiences of the researcher as a student, mother and a mathematics teacher
have influenced her in the selection of the three variables, mathematics anxiety, attitude
towards mathematics, and parental involvement, for the study. The variables of interest
were selected after reviewing the literature on mathematics achievement of students, in
particular secondary school students. Mathematics achievement was, for this study,
defined as the level of attainment in any or all mathematical skills operationalised by
FACTORS INFLUENCING MATHEMATICS ACHIEVEMENT OF SECONDARY SCHOOL STUDENTS IN INDIA 23
performance on a test.
1.2.1 Mathematics anxiety
Mathematics anxiety has been regarded as the feelings of fear or tension in situations
involving mathematics problem solving or any mathematics-related activities (Ashcraft,
2002; Ma & Xu, 2004b). Dreger and Aiken (1957, p. 344) defined mathematics anxiety as
the “the presence of a syndrome of emotional reactions to arithmetic and mathematics”.
Mathematics anxiety was defined by Bandalos, Yates, and Thorndike-Christ (1995) as a
combination of test anxiety, thoughts of failure, low self-confidence, and a negative
outlook on the learning of mathematics. For the purpose of this study, mathematics
anxiety was defined as students’ negative emotional reactions to mathematical concepts
and testing situations (F. C. Richardson & Woolfolk, 1980).
Mathematics anxiety has been identified at all levels of schooling from lower primary
to tertiary years (Ma & Kishor, 1997) and has been found to influence the mathematics
achievement of students. A small negative association has been observed between
mathematics anxiety and achievement consistently over several decades (Eccles & Jacobs,
1986; Hembree, 1990; Ma, 1999; Woodard, 2004). Zakaria and Nordin (2008) also found
that pre-tertiary students with high mathematics anxiety scored significantly lower in
achievement than less anxious students. In a similar vein, Quilter and Harper (1988)
found that highly mathematically anxious adults scored lower in mathematics than those
with low mathematics anxiety.
Mathematics anxiety also affects the career options of individuals both by negatively
influencing their mathematical attainment and their inclination to pursue mathematically
dependent options. An individual’s level of attainment in mathematics at the secondary

FACTORS INFLUENCING MATHEMATICS ACHIEVEMENT OF SECONDARY SCHOOL STUDENTS IN INDIA 24
and university levels affects a student’s range of career options (Lent, Lopez, & Bieschke,
1993). Students with high mathematics anxiety are more likely to avoid
mathematics-related activities, courses or majors, (Ashcraft, 2002; Ashcraft & Kirk, 2001;
Betz, 1978; Hackett, 1985; Zettle & Houghton, 1998), thereby limiting their career
options.
1.2.2 Attitude towards mathematics
According to Aiken (1970), an attitude is an individual’s learned predisposition to
respond in a positive or negative way to an object, concept, situation, or another
individual. Somewhat similarly, McLeod (1992) defined the term attitude as the
“affective responses that involve positive or negative feelings of moderate intensity and
reasonable stability” (p. 581). Generally, attitude towards mathematics refers to
individuals’ beliefs and feelings about mathematics (Kulum, 1980; Leder, 1987). Attitude
towards mathematics has been defined as a negative or positive emotional disposition
towards mathematics (McLeod, 1992; Zan & Martino, 2007). The above definitions of the
construct encompass the emotional side of an individual’s reaction to a situation, object
or a subject of study. Accordingly, for the purpose of this study, attitude towards
mathematics was defined as a combined measure of like or dislike towards mathematics,
an inclination to engage in or avoid activities in mathematics, a belief that one is good or
bad at mathematics, and a belief about the usefulness of mathematics as described by
Ashcraft (2002) and Ma and Kishor (1997).
Generally a strong relationship has been assumed between students’ positive attitude
towards mathematics and achievement in the subject (Ma & Kishor, 1997; Nicolaidou &
Philippou, 2003). Teachers and educators believe that students learn and achieve better
FACTORS INFLUENCING MATHEMATICS ACHIEVEMENT OF SECONDARY SCHOOL STUDENTS IN INDIA 25
if they have interest in mathematics and a liking for the subject (Suydam & Weaver,
1975). Nevertheless, researchers have reported varying findings about the relationship.
For example, some researchers have found weak relationships (Deighan, 1970; Wolf &
Blixt, 1981), others have found relationships that are statistically significant, but not
strong (Hammouri, 2004; Ma & Kishor, 1997), yet others have found no significant
relationship between attitude towards mathematics and mathematics achievement
(Cain-Caston, 1993).
1.2.3 Parental involvement
In general, parental involvement is referred to as the participation of parents in the
education of children to enhance their social and academic achievement (Fishel &
Raimirez, 2005). Because parental involvement encompasses various parental practices
and behaviours, most researchers regard the construct as multi-dimensional (Brown,
1994; Epstein, 1995). Multi-dimensional definitions of parental involvement include
helping with homework or supervising home work, volunteering or attending school
events (Epstein, 1987, 1991), encouragement of academic success, having high
expectations for achievement (Hoover-Dempsey & Sandler, 1995, 1997), and parent-child
communication (McNeal Jr, 1999). In keeping with these definitions, for the purpose of
the study, parental involvement has been defined as parental participation in
school-related activities (such as monitoring of home study and attending parent-teacher
interviews), parental encouragement of academic success, and parental expectations of
educational attainment (Chen & Gregory, 2010) and parenting style.
Depending on the way the construct parental involvement has been operationalised
and the outcomes measured, the findings about the influence of parental involvement on
FACTORS INFLUENCING MATHEMATICS ACHIEVEMENT OF SECONDARY SCHOOL STUDENTS IN INDIA 26
students’ academic achievement have been varied (Catsambis, 2001; W. Fan & William,
2010). The support of knowledgeable, involving, and supportive parents has been found
to improve the academic performance and behaviours of their children(Epstein, 1992).
Researchers have found a positive association between parental expectation and students’
academic achievement in general (X. Fan, 2001; Griffith, 1998; Hubbard, 1999).
McNeal Jr (1999) found that communication between parent and child was associated
with higher achievement in science. On the other hand, parent participation in
parent-teacher association meetings was found to be negatively related to science
achievement (McNeal Jr, 1999). When considering achievement in mathematics the
findings regarding parent-child communication, or parental expectation seem also to
apply. For example, researchers have found that home-based parental involvement (e.g.,
communication between parent-child, parental expectation of success, encouragement of
mathematics learning) facilitates mathematics achievement of elementary school students
(Fantuzzo, King, & Heller, 1992; Jeynes, 2007; C. Nye, Turner, & Schwartz, 2007).
Parenting style covers the totality of the emotional feeling in a parent-child
relationship and is considered as a global construct (Darling & Steinberg, 1993).
Baumrind (1971, 1978, 1991) suggested three main parental classifications: permissive,
authoritative, and authoritarian. According to Baumrind (1978), permissive parents are
non-controlling, moderately responsive to child’s needs, and use minimum punishment.
Authoritative parents, are reasonably controlling, affectionate, responsive, and they
encourage autonomy (Baumrind, 1978). On the other hand, authoritarian parents are
demanding, non-responsive, and exhibit high levels of control (Baumrind, 1978). A
number of studies have found a positive relationship between authoritative parenting and
academic performance of students (Baumrind, 1978; Reitman, Rhode, Hupp, & Altobello,
2002; Steinberg, Elmen, & Mounts, 1989).
FACTORS INFLUENCING MATHEMATICS ACHIEVEMENT OF SECONDARY SCHOOL STUDENTS IN INDIA 27
The studies reviewed above have shown that mathematics anxiety, attitude towards
mathematics and parental involvement influence mathematics achievement of students in
all levels of schooling. Gender was also found to influence the above mentioned factors
and the inter-relationship among them. The influence of gender on the selected factors
and their relationships is discussed in detail in Chapter 2. In previous research studies,
these factors have been studied in pairs to understand their interaction with each other,
and they have each been studied individually to understand their influence on
mathematics achievement. Very few studies have been found to investigate the influence
of mathematics anxiety, attitude towards mathematics and parental involvement on
mathematics achievement together in a single research study. Also not much has been
done to study the effect of these factors on achievement in mathematics, particularly
among secondary school students in India. This study investigated the influence of
mathematics anxiety, attitude towards mathematics and parental involvement on
mathematics achievement of secondary school students in India. Further, the researcher’s
experience as a secondary school teacher in India impacted her in choosing these
variables in the present study.
1.2.4 Conceptual model
A conceptual model was built based on research findings discussed in the earlier
sections. The model included the variables; mathematics anxiety, attitude towards
mathematics, and parental involvement. These variables were hypothesised to influence
mathematics achievement among secondary school students as shown in Figure 1.1. The
study also investigated the inter-relationships among the variables and the influence of
gender on these variables.

FACTORS INFLUENCING MATHEMATICS ACHIEVEMENT OF SECONDARY SCHOOL STUDENTS IN INDIA 28
The model shown in Figure 1.1 shows the ways in which the variables under the
study interact based on the literature. Mathematics achievement appears to be
influenced by mathematics anxiety, attitude towards mathematics, parental involvement
and gender. Attitude towards mathematics and mathematics anxiety appear to be closely
related and are influenced by parental involvement, and gender. In addition, parental
involvement appears to be influenced by gender.
Figure 1.1 . Conceptual model for the study showing the hypothesised relationship be-
tween the variables
FACTORS INFLUENCING MATHEMATICS ACHIEVEMENT OF SECONDARY SCHOOL STUDENTS IN INDIA 29
The major research questions that framed the study were based on the conceptual
model. They were:
1. How does parental involvement in learning influence mathematics achievement of
secondary school students in India?
2. How does attitude towards mathematics influence mathematics achievement of
secondary school students in India?
3. How does mathematics anxiety influence mathematics achievement of secondary
school students in India?
4. How do parental involvement, attitude towards mathematics and mathematics
anxiety interact to influence the mathematics achievement of secondary school
students in India?
5. Are there gender differences in relation to any of these variables and/or their
relationships?
1.3 Research site
As a consequence of industrialisation, more skilled workers are required in industries
and organisations to replace manual labourers in India. The technological growth
happening in India also requires a highly skilled population (Levy & Murnane, 2004).
Higher levels of education are, therefore, required from its citizens, and students’
educational achievement has become an important factor in deciding one’s future and
self-worth in Indian society. Consequently Indian parents and students attach more
importance to academic work than to extra-curricular activities (Verma, 1998). Indian
FACTORS INFLUENCING MATHEMATICS ACHIEVEMENT OF SECONDARY SCHOOL STUDENTS IN INDIA 30
parents, as in many other Asian cultures, pressure their children to excel in their
academic studies (Nisbitt, 2003). The researcher selected this site for the project to
understand how the selected variables impact the mathematics achievement of secondary
school students in the present Indian context. The education system prevalent in the
particular Indian state in which the school that was the site of the study is located is
outlined in the next section.
1.3.1 Education System in Kerala, India
Keralam (Kerala), the land of kera or coconut, is a small state lying along the
coastline to the extreme south west of India. The official language of Kerala is
Malayalam. Other languages such as Konkani, Tulu, Kannada, Hindi, Mahl and various
tribal languages are also spoken by ethnic minorities.
The school education system in Kerala is divided into three stages; Primary or
Elementary Education, Secondary Education, and Higher Secondary Education. The
primary stage is further divided into Lower primary (ages 6-10) and Upper primary (ages
11 and 12). Secondary education includes schooling for students aged 13 to 15 years.
Higher secondary stage comprises Classes 11 and 12 for students aged 16 and 17 years
who can choose one of the discipline areas; humanities, commerce, or sciences (Indian
Government, 2005). Upon completing the required coursework in Classes 11 and 12,
students can enrol in general or professional undergraduate programmes. Vocational
schools train students who do not want to enrol in any undergraduate degree, for a
business, or trade or other occupation that does not require a degree qualification.
Schools in Kerala are run by the government, individuals, private trusts, or churches.
Each school is affiliated with the Kerala State Educational Board, Council for the Indian
FACTORS INFLUENCING MATHEMATICS ACHIEVEMENT OF SECONDARY SCHOOL STUDENTS IN INDIA 31
School Certificate Examinations (CISCE), Central Board of Secondary Education
(CBSE), or the National Institute of Open Schooling (NIOS). The medium of instruction
in most of the self-financing institutions (i.e., schools run by individuals, private trusts, or
churches) is English, while government and government aided schools offer classes in
English and Malayalam (Indian Government, 2005). The particular school that was the
site of this study was run by the Catholic management (fee paid by parents) and offered
secondary education for boys and girls in English.
1.4 Method
The study employed a mixed method research design involving both quantitative
and qualitative approaches as described by Creswell and Clark (2007). The mixed
method approach was chosen for the study because that design lends itself to the
investigation of a complex phenomenon such as considered in this study involving factors
relating to school and home. Mixed methods studies can maximise understanding and
facilitate interpretation of results. In this approach, the researcher collects information
both in numeric forms using, for example, questionnaires requiring responses on Likert
scales, and text forms (e.g., using interviews) so that in the final form, the data comprise
both qualitative and quantitative information (Creswell & Clark, 2007). The mixed
methods approach enables the researcher to study the research problem from different
perspectives to get a better understanding of the phenomenon under study (Thurmond,
2001). Since the researcher uses more than one approach, it provides a stronger platform
than other designs for conclusions (Yin, 2006). Though the study employed a mixed
method approach, qualitative data was used to complement the quantitative data. In this
study more emphasis was given to quantitative data. The results of the qualitative data
were used to complement the quantitative findings of the study wherever possible.
FACTORS INFLUENCING MATHEMATICS ACHIEVEMENT OF SECONDARY SCHOOL STUDENTS IN INDIA 32
The instruments used for collecting quantitative data included a student
questionnaire, an achievement test in mathematics, and a parent questionnaire adapted
from the Shortened Form of Fennema-Sherman Attitudes Scales (Mulhern & Rae, 1998),
the Programme for International Student Assessment (PISA) (PISA, 2009), and the
Parental Authority Questionnaire (PAQ) (Buri, 1991). Interviews were used to collect
qualitative data from students and parents.
1.5 Significance of the study
The study has both theoretical and practical implications for the field of
mathematics education for secondary school students. The theoretical contribution is in
bringing together the three distinct research areas of parental involvement, mathematics
anxiety, and attitude towards mathematics, providing new insights and suggesting an
agenda for further research in the field.
Practically, the relationships found from the study have potential to improve
secondary school mathematics teaching and learning. The findings may add to the
understanding of the effect of parental involvement, students’ mathematics anxiety, and
attitude towards mathematics on mathematics achievement, and reinforce the importance
of parental involvement in mathematics achievement of secondary school students while
providing insights into aspects of this involvement that are helpful. The findings may
assist parents to help their children to become more confident and optimistic in their
mathematics learning and help them to have a positive sense of their ability in
mathematics. Teachers may use the results of the study to change their teaching methods
and strategies for the benefit of students. Education policy makers can formulate new
policies in the secondary school sector based on the findings of this study. Ultimately, the

FACTORS INFLUENCING MATHEMATICS ACHIEVEMENT OF SECONDARY SCHOOL STUDENTS IN INDIA 33
study can help secondary school students to improve their mathematical skills to achieve
their academic potential.
Importantly, little research has been done in India on these variables and the
findings from the research studies conducted mainly in the western countries may not
apply in the Indian context. Thus this study adds to the knowledge of these variables in
Indian context.
1.6 Limitations of the study
The study was limited by a relatively small sample size of 135 students and 118
parents. It was conducted among students and parents from only one urban private
school in South India. The interpretation of the results beyond the context should,
therefore, be made with caution. The study was also limited in its capacity to explain
causal relationship between the variables because of its cross-sectional nature.
1.7 Chapter Summary
This chapter has provided information on the background of the research study and
its conceptual framework. The introduction chapter was presented as to give a
comprehensive overview of the thesis. The context of the study was briefly described and
the significance of the study explained. Chapter 2 presents the review of the literature
that provided the foundation for the study relevant to the variables considered, and how
they influence mathematics achievement of students, particularly secondary school
students. Chapter 3 describes the sample, the instruments, and the data collection
procedures used in the study. Chapter 4 outlines the details of data analysis approaches

FACTORS INFLUENCING MATHEMATICS ACHIEVEMENT OF SECONDARY SCHOOL STUDENTS IN INDIA 34
employed. In Chapter 5, the findings from the quantitative and qualitative data analysis
are presented. The last chapter, Chapter 6, presents a discussion of the results,
limitations of the study as well as suggestions for future research.
FACTORS INFLUENCING MATHEMATICS ACHIEVEMENT OF SECONDARY SCHOOL STUDENTS IN INDIA 35
CHAPTER 2 LITERATURE REVIEW
2.1 Introduction
Achievement in mathematics has been for the past several decades a topic of
investigation for researchers around the world concerned with improving the quality of
mathematics education. Mathematics achievement of students in the high school years
has been found to be significant to success in tertiary mathematics and performance in
other science subjects, as well as contributing to better career options and quality of life
(Barry & Chapman, 2007; Halpern et al., 2007; Murrane, Willett, & Levy, 1995; Wilson
& MacGillivray, 2007). There is, however, increasing concern about levels of student
mathematics achievement and quality of mathematics education globally (Martin, Mullis,
Gregory, Hoyle, & Shen, 2000). Substantial evidence shows that there is a decline in the
number of students selecting sciences and mathematics in Years 11 and 12, in Australia
as well as in many OECD (Organisation for Economic Co-operation and Development)
countries (Department of Education, Science and Training, 2006; Fullarton, Walker,
Ainley, & Hillman, 2003; OECD Global Science Forum, 2006; Osborne & Collins, 2001).
India is not an exception. In particular, a large number of students in India drop out of
school even before they reach secondary level (Ramanujam, 2012). It has been reported
that in India, the number of graduates selecting mathematics-related careers has been
declining, in spite of the importance of mathematics in today’s scientific world (Mishra,
2011).
Studies have identified several factors influencing mathematics achievement during
the school years. These include mathematics self-concept (Abu-Hilal, 2000; Wang, 2007);
mathematics anxiety (Ashcraft, 2002; Hembree, 1990; Ma & Xu, 2004a); attitudes
FACTORS INFLUENCING MATHEMATICS ACHIEVEMENT OF SECONDARY SCHOOL STUDENTS IN INDIA 36
towards mathematics (Hannula, 2002; Hart, 1989; Lamb & Fullarton, 2002); mathematics
self-efficacy (Hackett & Betz, 1989; Pietsch et al., 2003; Williams & Williams, 2010);
parental involvement in academic learning (Coleman, 1988; Epstein, 1991; Jeynes, 2005);
teachers (Beverley, 2002; Hill, 1994; Hill & Rowe, 1998); peers (Berndt & Keefe, 1995;
Wentzel, 1999); and gender (Gray, 1996; Kenney-Benson, Pomerantz, Ryan, & Patrick,
2006). The researcher’s personal experiences as a student, mother and a mathematics
teacher influenced her in selecting the variables (i.e., mathematics anxiety, attitudes
towards mathematics, and parental involvement) for the study. In addition, not many
studies have been done among secondary school students in India to study the influence
of the above mentioned factors on mathematics achievement. Thus the study investigated
the influence of students’ mathematics anxiety, attitudes towards mathematics, and
parental involvement on mathematics achievement of secondary school students in India.
There is a plethora of research studies on mathematics anxiety, attitude towards
mathematics, parental involvement, and mathematics achievement among school students
as well as tertiary students. The majority of the research studies on the selected variables
were conducted in the western context. There is a paucity of research studies in India
investigating these variables and their influence on mathematics achievement. Attention
has been given to include studies investigating the variables of interest among secondary
school students in the Indian context wherever possible. Effort was made to look into as
many studies as possible to understand the relationship among the variables considered
from non-western context. The contexts of the studies reviewed including, the age of
participants, the school subjects under consideration, the country in which the study
took place, the size of the sample, the data collection tools were mentioned wherever
available. Effort was also made to critique the studies and to highlight similarities and
differences between them and the current study especially when these might explain
FACTORS INFLUENCING MATHEMATICS ACHIEVEMENT OF SECONDARY SCHOOL STUDENTS IN INDIA 37
differing findings.
2.2 Mathematics anxiety
Mathematics anxiety has been found to influence the mathematics performance of
students at all levels of schooling (Ashcraft, 2002; Hembree, 1990). F. C. Richardson and
Woolfolk (1980) defined mathematics anxiety as a condition in which students experience
negative responses to mathematical concepts and testing processes. Speilberger (1972, p.
38) stated that anxiety is a “condition characterized by feelings of tension and
apprehension”. According to Spielberger, there are two components for this condition:
trait anxiety and state anxiety. State anxiety is an emotional condition which varies in
intensity and changes with time. On the other hand, trait anxiety is a feeling at the core
of an individual who considers certain situations to be dangerous or threatening.
Mathematics trait anxiety is specific to mathematics education contexts and related
activities, and can interfere with achievement in mathematics and further learning in
mathematics. It is also relatively constant and difficult to change. Mathematics anxiety
has been found to be influenced by various factors including parents, teachers (Goldstein,
1999; Jennison & Beswick, 2009), peers and teaching methods (Ma, 1999; J. Turner et al.,
2002).
Researchers over the years have agreed that mathematics anxiety takes root in the
elementary years, peaks during the secondary education, and continues to a lesser degree
through university years (Jackson & Leiffingwell, 1999; Lazarus, 1974; Uusimaki, 2004).
The early stages of secondary schooling have been identified as crucial in the development
of mathematics anxiety (Hembree, 1990), but more recently Bekdemir (2010) found that
mathematics anxiety among his participants (senior elementary pre-service teachers)
FACTORS INFLUENCING MATHEMATICS ACHIEVEMENT OF SECONDARY SCHOOL STUDENTS IN INDIA 38
appeared to have formed during senior secondary school years, mainly in Years 9 to 11.
It has been found that mathematics anxiety interferes with achievement in
mathematics. For example, researchers found a negative relationship between
mathematics anxiety and mathematics achievement among students in Year 6 through to
tertiary level (H. Z. Ho et al., 2000; Ng, 2012; Woodard, 2004). When studying how
mathematics anxiety affected the mathematics learning of pre-tertiary students in terms
of achievement and motivation, Zakaria and Nordin (2008) found that students with low
mathematics anxiety achieved significantly higher than those with high or moderate
anxiety in relation to mathematics. Similarly Wither (1998) observed a negative
relationship between mathematics anxiety and mathematics achievement among Year 6
to Year 10 students. These findings are consistent with those of other researchers who
have found that students with higher mathematics anxiety perform less well in
mathematics (e.g., H. Z. Ho et al., 2000; B. Y. Lee, 1992; Tocci & Engelhard Jr., 1991).
Consistent with these findings McCarty (2007) and Luigi et al. (2007) also found that
generally, a high level of general anxiety was related with low academic performance.
Hembree’s (1990) meta-analysis of studies of mathematics anxiety found a negative
correlation between mathematics anxiety and performance in mathematics. Newstead
(1998), however, argued that the direction of causality in the relationship between
mathematics anxiety and mathematics achievement is ambiguous. One of the reasons for
this may be the dependence of studies on cross-sectional data. Using the Longitudinal
Study of American Youth (LSAY) data, Ma and Xu (2004a) observed that prior low
mathematics achievement was found to cause higher mathematics anxiety in succeeding
years through the entire junior grades (Year 7-Year 9) as well as in senior school grades
(Year 10-Year 12), especially for boys. In contrast, there was very little evidence of
causation in the opposite direction at any grade level.

FACTORS INFLUENCING MATHEMATICS ACHIEVEMENT OF SECONDARY SCHOOL STUDENTS IN INDIA 39
In India, Karimi and Venkatesan (2009) studied the relationship between
mathematics anxiety, in mathematics performance, and academic hardiness (attitude to
academic success) among 10th grade students in nine different secondary schools in
Karnataka, India. They found a significant negative correlation between mathematics
anxiety and performance in mathematics among the students.
One of the main features of mathematics anxiety has been its connection with
avoidance of mathematics (Friman, Hayes, & Wilson, 1998; Ma & Xu, 2004a). Students
with high mathematics anxiety tend to avoid mathematics-related activities, courses or
majors (Ashcraft & Kirk, 2001; Chinn, 2009; Zettle & Houghton, 1998), drop out of
mathematics, especially advanced courses, prematurely, and avoid mathematics-related
careers (see Hembree, 1990; H. Z. Ho et al., 2000). According to Preis and Biggs (2001),
there is a cycle of mathematics avoidance, involving four phases, namely, (a) negative
reactions to mathematical situations as a consequence of negative past experiences in
mathematics; (b) avoidance of mathematical situations; (c) poor preparation for
assessments in mathematics; and (d) poor performance in mathematics. They suggested
that an individual’s poor performance in mathematics may take him/her back to the
beginning of the cycle, which, if repeated, may result in the individual coming to the
conclusion that he/she cannot perform well in mathematics.
Review of the mathematics anxiety literature indicated that only a few studies have
been reported on the topic in India. Not much is known about mathematics anxiety
among Indian high school students and its influence on mathematics achievement. With
this in mind, the present study attempted to address the gap in the literature by looking
at the relationship of mathematics anxiety and achievement in mathematics for Indian
students.
FACTORS INFLUENCING MATHEMATICS ACHIEVEMENT OF SECONDARY SCHOOL STUDENTS IN INDIA 40
2.3 Attitude towards mathematics
Students’ attitude towards mathematics has been considered as important in their
learning, participation, and achievement in mathematics (Papanastasiou, 2002;
Shashanni, 1995). In general, it is believed that a positive attitude towards a subject
influences a student’s success in that subject. Attitude towards mathematics has been
defined as a positive or negative evaluation of a psychological object (Ajzen & Fishbein,
1980). According to Hannula (2002), four different evaluative processes were associated
with attitude towards mathematics, namely, (a) emotions experienced while engaging in
mathematical activities; (b) emotions evoked by the concept of mathematics; (c)
evaluations of the results of doing mathematics; and (d) evaluations of the value of
mathematics to one’s future goals. In a similar vein, attitude towards mathematics has
been considered as multidimensional (Hart, 1989; Ma & Kishor, 1997) distinguished by a
number of dichotomies: whether one likes or dislikes mathematics; believing that one is
proficient or inefficient in mathematics; the tendency to pursue or to avoid mathematics;
beliefs that mathematics is significant or non-significant, easy or hard, (Ashcraft, 2002;
Ma & Kishor, 1997; Neale, 1969); and whether it is engaging or uninspiring (McLeod,
1992). These pairings differ in the degree of emotionality or cognition associated with
them and it is viable that an individual might have a positive attitude in relation to some
yet a negative attitude in relation to others.
Researchers have tried to understand the relationship between attitude towards
mathematics and mathematics achievement for many years (Ma & Kishor, 1997;
Nicolaidou & Philippou, 2003). In Ma and Kishor’s(1997) meta-analytic study, they
observed a significant, but weak causal relationship between the two constructs. In
agreement with Ma and Kishor’s (1997) study, Singh, Granville, and Dika (2002) found

FACTORS INFLUENCING MATHEMATICS ACHIEVEMENT OF SECONDARY SCHOOL STUDENTS IN INDIA 41
that among Grade 8 students from the Longitudinal Study of American Youth database,
achievement in mathematics was positively affected by a positive attitude towards
mathematics. Similar results have been reported by Mato and de la Torre (2010),
Nicolaidou and Philippou (2003) and Thomson, Hillman, and Wernert (2012). However,
Chagwiza, Mutambara, Tatira, and Nyaumwe (2013) failed to find any significant
relationship between attitude towards mathematics and achievement in mathematics for
secondary school students from three urban schools in Bindura, Zimbabwe. The
complexity of the construct of attitude to mathematics and the inconsistency in its
definitions across studies make it difficult to give a conclusive picture regarding the
nature of the relationship.
It has been observed that mathematical attitudes and beliefs of students tend to
change gradually as the students progress through schooling (McLeod, 1992).
Researchers have reported that most middle school students like mathematics, and had
more positive beliefs about importance of mathematics than their high school
counterparts (National Center for Education Statistics, 2001; Dossey, Mullis, Linquist, &
Chambers, 1988). Wilkins and Ma (2003) using the Longitudinal Study of American
Youth (LSAY) data found that secondary school students’ attitudes towards mathematics
becomes increasingly negative as they transit from elementary to secondary education.
Although the research studies carried out with Western and East Asian samples have
found a positive relationship between the constructs, it is still unclear whether these
findings are applicable in the Indian setting. Thus, this study looks at the influence of
attitude to mathematics on mathematics achievement among secondary school students
in India.
FACTORS INFLUENCING MATHEMATICS ACHIEVEMENT OF SECONDARY SCHOOL STUDENTS IN INDIA 42
2.4 Parental involvement
From an early age children engage in learning and parents are their first teachers.
Parental involvement describes the participation of parents in the education of children
usually with the intention of enhancing their social and academic achievement (Fishel &
Raimirez, 2005). Parental involvement has been among the factors that have been
studied in relation to academic achievement of students in general and in mathematics in
particular. The multidimensional nature of parental involvement has also been recognised
by researchers (Chen & Gregory, 2010; Epstein, 1992; Grolnick & Slowiaczek, 1994) as
the construct includes various parental practices and behaviours (Brown, 1994; Chen &
Gregory, 2010; Epstein, 1995).
Salient aspects of parental involvement include parental encouragement of academic
success (Chen & Gregory, 2010), parental expectations of academic performance (Chen &
Gregory, 2010; Jeynes, 2005), participation in parent-teacher interviews, and checking of
children’s homework (Steinberg, Lamborn, Dornbusch, & Darling, 1992), and parenting
style (Jeynes, 2005; Steinberg et al., 1992). Studies have found that parental involvement
influences students’ achievement throughout the school years K-12 (Simon, 2001; Trusty,
1999). Wheeler (1992) argued that parental involvement at the middle school and
secondary school level is critical for teenagers to become stable and productive adults. In
the same vein, Bronstein, Ginsburg, and Herrera (2005) argued that parents’ day to day
engagement with their children, encouraging skills in problem solving and independent
thinking may further heighten achievement and motivate them toward academic success.
The importance of parental involvement in children’s lives has also been pointed out by
Epstein (1992), who stated that students will be more interested in academic work and
will exhibit more positive attitudes and other positive behaviours, and will have higher
FACTORS INFLUENCING MATHEMATICS ACHIEVEMENT OF SECONDARY SCHOOL STUDENTS IN INDIA 43
aspirations, if their parents are knowledgeable about and encouraging and involved in the
education of their children.
More recent conceptualisations of parental involvement encompass activities and
engagement between children and their parents at home as well as in school such as
helping them with homework, supervision, and discussion about school activities (Jeynes,
2005; Pomerantz, Moorman, & Litwack, 2007). The large body of research available on
how parents are involved in the education of their children, particularly in mathematics
learning has shown that home-based involvement activities such as parental
encouragement in child’s learning, and communication between parent and child were all
linked with higher achievement in mathematics (X. Fan & Chen, 2001; Jeynes, 2005).
Although there exists enough evidence about the positive influence of parental
involvement on mathematics achievement, findings are inconclusive about how this
happens. For example, Hoover-Dempsey and Sandler (1995) suggested that parental
involvement influences achievement by enhancing students’ social and academic
self-efficacy and motivation to learn. According to Grolnick, Ryan, and Deci (1991),
parental involvement influences children’s learning behaviours which in turn enhance
their achievement in mathematics. Based on the literature on parental involvement, the
significant parental involvement dimensions considered in the study include parental
expectations, parents’ encouragement of academic success, and parent participation in
activities related to school (Chen & Gregory, 2010).
In their meta-analysis of studies of parental involvement, X. Fan and Chen (2001)
found a significant overall positive relationship between parental involvement and
academic achievement with the strongest relationship observed between parental
expectations and academic achievement. This study mirrored the findings of others (e.g.,
X. Fan, 2001; Ma, 2001; Trivette & Anderson, 1995; Yenug, Linver, & Brooks-Gunn,
FACTORS INFLUENCING MATHEMATICS ACHIEVEMENT OF SECONDARY SCHOOL STUDENTS IN INDIA 44
2002) who found a strong association between academic performance and parental
expectations of, or aspirations for, their child’s academic success. Jacobs and Harvey
(2005) investigated the extent to which parental attitude and expectations of their
children’s academic achievement predicted achievement of students in nine secondary
schools in Melbourne, Australia. Based on the final year secondary school achievement
scores of students and school improvement indices, the schools were categorised into high
achieving, medium achieving, and low achieving schools. The researchers investigated the
degree to which parent’s attitudes to school environment and academic achievement of
their children influenced student’s achievement in the three groups of schools. That is,
they studied variables in the whole school context and compared schools rather than
individual students. It was found that parents’ expectations of the educational
attainment of their children strongly predicted academic achievement of the students.
The researchers also observed that higher expectations of their child’s academic
achievement had been maintained more consistently by parents from the high achieving
schools since their child’s birth, than had those of children at medium or low achieving
schools. Chen and Gregory (2010) in their study of low achieving Year 9 students in the
United States found that those students whose parents held higher expectations about
their child’s academic attainment and grades, performed better. Similarly, Jeynes (2007)
found a strong relationship between parental expectations and academic achievement in
her meta-analysis involving 300,000 secondary school students, reflecting the findings of
the studies reported above.
Adolescence is a time when teenagers place more emphasis on their relationship with
friends than with their family (Santrock & Yussen, 1984). In spite of this tendency,
research has shown that the academic encouragement given by parents is more influential
in their academic endeavours than is the support of their peers (Sands & Plunkett, 2005).
FACTORS INFLUENCING MATHEMATICS ACHIEVEMENT OF SECONDARY SCHOOL STUDENTS IN INDIA 45
Chen and Gregory (2010) also found that parental encouragement of academic success for
their child was associated with improved performance. Similarly, Catsambis (2001) found
that, for Year 12 students, parental encouragement to pursue higher education was
positively related to students’ outcomes in mathematics, English, and science. On the
other hand, when exploring the association of parental involvement and mathematics
achievement among elementary school students, El Nokali, Bachman, and Votruba-Drzal
(2010) found no significant association between the variables.
Parental involvement with homework has not been found to have a consistently
positive influence on the academic achievement of students (E.-S. Ho & Wilms, 1996;
Jeynes, 2007; T. Z. Keith & Keith, 1993; Muller, 1998). For example, T. Z. Keith and
Keith (1993) found that time spent on homework was strongly associated with parental
involvement defined in terms of communication between parent and child, parental
aspirations for their child’s education, participation in school activities and home
structure, which in turn result in improved achievement. Nevertheless, some researchers
have found contradictory findings in the relationship between the variables (Chen &
Gregory, 2010; Ginsburg & Bronstein, 1993; I. Levin et al., 1997; Patall, Cooper, &
Robinson, 2008). For example, Patall, Cooper, and Robinson (2008) found a negative
relationship between parental involvement in homework and mathematics achievement in
their meta-analysis of correlational studies. On the other hand, Chen and Gregory (2010)
found that parental involvement in terms of parents helping with homework was not
related to improved academic achievement.
Researchers have studied the influence of parenting style on the academic
achievement of children and adolescents for decades (Baumrind, 1991; Dornbusch, Ritter,
Leiderman, Robert, & Fraleigh, 1987; Steinberg et al., 1992; Strage & Brandt, 1999).
Parenting style is a global construct (Darling & Steinberg, 1993) that encompasses the
FACTORS INFLUENCING MATHEMATICS ACHIEVEMENT OF SECONDARY SCHOOL STUDENTS IN INDIA 46
entire emotional spirit of the parent-child relationship. According to Maccoby and Martin
(1983), it captures two important aspects of parenting: parental responsiveness (also
referred to as parental warmth) and parental demandingness (also referred to as
behavioural control). Parental responsiveness refers to “the extent to which parents
intentionally foster individuality, self-regulation, and self-assertion by attuned,
supportive, and acquiescent to children’s special needs and demands” (Baumrind, 1991,
p.62). Parental demandingness refers to “the claims parents make on children to become
integrated into the family whole, by their maturity demands, supervision, disciplinary
efforts and willingness to confront the child who disobeys” (Baumrind, 1991, p.61-62).
Based on extensive studies Baumrind (1971, 1978, 1991) proposed three primary
parental typologies: permissive, authoritative, and authoritarian. Baumrind (1978)
suggested that permissive parents are demonstrating non-controlling behaviours, using
minimal punishment, are moderate in responsiveness to their children’s needs and overly
lax in maturity demands. They showed high levels of demandingness and low levels of
maturity demands and control (Maccoby & Martin, 1983). Baumrind (1978) proposed
that authoritative parents are responsive, warm, nurturing with reasonable control,
affectionate, supportive of their children’s academic and non-academic endeavours, and
encouraging autonomy. They foster high maturity demands in their children through
communication, explanation, and granting independence. Maccoby and Martin (1983)
found that authoritative parents showed high levels of warmth, responsiveness, control,
and maturity demands. Authoritarian parents, on the other hand, are neither warm nor
responsive, but are demanding, directive, and exhibit high levels of control (Baumrind,
1978). They showed high levels of and maturity demands and control, but low levels of
warmth and responsiveness (Maccoby & Martin, 1983).
Numerous studies have reported a positive association between authoritative
FACTORS INFLUENCING MATHEMATICS ACHIEVEMENT OF SECONDARY SCHOOL STUDENTS IN INDIA 47
parenting and academic performance among children and adolescents (Baumrind, 1978;
Ingoldby, Schvaneveldt, Supple, & Bush, 2003; Reitman et al., 2002). Strage and Brandt
(1999) studied the influence of parenting styles on college students’ academic success.
They found a continuing effect of authoritative parenting on students’ academic
performance. E. A. Turner, Chandler, and Heffer (2009) investigated the relation
between parenting styles, academic performance, self-efficacy and achievement motivation
among college students. Among a sample of undergraduate psychology students in the
United States, they found that authoritative parenting style strongly predicted the
academic performance of the students. A study investigating the long term relation
between authoritative parenting and academic achievement using a sample of 10-16 year
olds found that authoritative parenting facilitates students’ academic success (Steinberg
et al., 1989). Aye, Lau, and Nie (2008) looked at the mediating effect of self-efficacy, and
task value (i.e., degree to which one believe that an academic task is worth pursuing) in
the relationship between authoritative parenting and student outcomes for Year 9
students in secondary schools in Singapore. The researchers found no direct relationship
between authoritative parenting and mathematics achievement, but an indirect
relationship through the mediating effect of self-efficacy.
There is only limited research available on the topic of parental involvement in India,
particularly in relation to mathematics achievement. Hemalatha and Sabitha (2009)
studied how parental involvement influenced academic achievement of secondary school
students in Kerala, South India. They found that parental involvement was not
significantly associated with academic performance of the students. However, Schneider
and Lee (1990) observed that East Asian parents in the United States maintain greater
interest, monitor more and keep greater control over their children’s education than do
other parents in the United States. In a similar vein, children of Indian immigrants in the

FACTORS INFLUENCING MATHEMATICS ACHIEVEMENT OF SECONDARY SCHOOL STUDENTS IN INDIA 48
United States have been shown to have great concern regarding their parents’
expectations of their achievement compared to other children in the United States
(Asher, 2002) and, like East Asian children, they believe that hard work and good
performance in examinations is important for their future success (Kim, 1993). This was
also true in the case of Indian students (Ramalingam, 2005; Verma & Gupta, 1990). The
Indian children may have felt pressured to live up to their parents’ expectations because
of the personal and professional sacrifices made by parents for their education (Liu,
1998). Bearing in mind these considerations, the purpose of the present study was to
confirm whether these findings based on mainly samples from Western countries are
applicable to Indian students.
2.5 Influence of gender
Gender differences in educational achievement, affect, and attitudes have been
researched widely because of the under representation of women in courses or careers
involving advanced mathematics (Else-Quest, Hyde, & Linn, 2010; Halpern et al., 2007).
According to Spelke (2005), there is no gender difference in the development of number
concepts among infants and pre-schoolers. Gender differences in mathematics favouring
boys tend to appear in high school years (Hyde, Fennema, & Lamon, 1990; Ma, 2008;
Mullis, Martin, Fierros, Goldberg, & Stemler, 2000; Randhawa, 1991).
Pinar (2011) studied differences in the mathematics performance of a sample of 8th
grade students in public schools in the United States across gender as well as
race/ethnicity using the data from National Assessment of Educational Progress (NAEP)
8th Grade Mathematics Assessment for 2003-2007. A small gender gap, favouring boys
was found. Other studies involving specific cohorts of students have reported large gender
FACTORS INFLUENCING MATHEMATICS ACHIEVEMENT OF SECONDARY SCHOOL STUDENTS IN INDIA 49
gaps in the achievement in mathematics of high ability students. For example, studies
involving samples of students in gifted and talented programs found a substantial gender
gap favouring high performing boys (Benbow & Minor, 1986; X. Fan, Chen, &
Matsumoto, 1997; Gallagher & DeLisi, 1994). Some evidence suggests that gender
performance differs with respect to the various concepts and complexity of mathematics.
For example, Fennema, Carpenter, Jacob, Frank, and Levi (1998) found no gender
differences among Grade 1 to Grade 3 students in their basic computational skills, but
with respect to the strategies employed in solving problems, substantial gender
differences were observed. According to Willingham and Cole (1997), girls in the United
States showed a slight advantage in computational skills during elementary grades,
whereas in problem solving and mathematical concepts, boys showed small advantage
during higher elementary and secondary grades.
In a recent study in Australia, Forgasz and Hill (2013) investigated the effects of
selected factors on the mathematics achievement of Grade 12 high achieving students in
Victoria. The researchers considered how gender, public versus private schools, single-sex
versus co-educational schools and the locality of school influenced the performance of
Grade 12 students in three mathematics courses (i.e., further mathematics, mathematics
methods, and specialist mathematics) in the Victorian Certificate of Education (VCE).
The researchers reported that male students dominated among the high achievers in all
the three mathematics courses for the period 2007-2009. In relation to younger
Australian students , the National Program for Literacy and Numeracy (NAPLAN) data
for Years 3, 5, 7 and 9 have revealed consistent gender gap favouring males, on average,
for 2008-2010 (Forgasz & Hill, 2013). In the Programme for International Student
Assessment (PISA) 2012, boys outperformed girls in mathematics in more than half of
the participating countries and economies, and the performance of girls was better than
FACTORS INFLUENCING MATHEMATICS ACHIEVEMENT OF SECONDARY SCHOOL STUDENTS IN INDIA 50
that of boys in five of the participating countries (OECD, 2014).
2.5.1 Gender differences in mathematics anxiety and attitude towards
mathematics
Gender differences in mathematics anxiety and the attitudes towards mathematics
have been widely researched, but the findings have been inconsistent. Else-Quest et al.
(2010) conducted a meta-analysis of two international data sets - the Programme for
International Student Assessment (PISA) 2003 and the Trends in International
Mathematics and Science Study (TIMSS) 2003 - to estimate the magnitude of gender
differences in affect and attitudes. This study involved 493,495 students of 14-16 years of
age from 69 nations. Despite similarities in achievement, the study reported boys as
having more positive mathematics attitudes than girls. Meta analytic studies of gender
differences in attitudes towards mathematics in the United States have also reported that
boys have more positive attitudes to mathematics than do girls, though the gap is small
(Hyde, Fennema, Ryan, Frost, & Hopp, 1990). In a similar line of research, Barkatsas,
Gialamas, and Kasimatis (2008) examined students’ attitudes towards computers and its
interaction with mathematics achievement and gender among Year 9 and Year 10
students in Athens, Greece. The researchers observed that boys reported more positive
attitudes towards mathematics and more positive views towards the use of computers in
mathematics learning than did girls. On the other hand, there are studies that have
reported no significant gender differences in mathematics attitudes among elementary
and secondary students (e.g., Ma & Kishor, 1997; Nicolaidou & Philippou, 2003).
In terms of gender differences in mathematics anxiety, several studies have reported
girls having more anxiety and lower self-concept about mathematics than boys (e.g.,

FACTORS INFLUENCING MATHEMATICS ACHIEVEMENT OF SECONDARY SCHOOL STUDENTS IN INDIA 51
Fredricks & Eccles, 2002; Haynes, Mullins, & Stein, 2004; H. Z. Ho et al., 2000; Hopko,
2003; Pajares & Miller, 1994; Tapia, 2004). For samples in the United States, secondary
school and college going female students were found to demonstrate more anxiety in
mathematics than did males (Bernstein, Reilly, & Cote-Bonanno, 1992; Campbell &
Evans, 1997). Baloglu and Koack (2006) studied multi-variate differences in mathematics
anxiety among college students in Turkey. They found female students to have higher
test anxiety in mathematics than males. The 2012 Programme for International Student
Assessment (PISA) reported that, overall, girls had higher mathematics anxiety than
boys (OECD, 2014). In an Indian study exploring anxiety among adolescents aged
between 13 and 17 years, researchers found that, on average, boys experienced more
anxiety than girls (Deb, Chatterjee, & Walsh, 2010). The study compared anxiety among
higher secondary school students based on gender using self-reported semi-structured
questionnaires. But when looking at the gender differences in mathematics anxiety
among secondary school students in three different states in India (Karnataka, Kerala
and Tamilnadu), Venkatsh and Karimi (2010) found that girls reported more anxiety in
mathematics than the boys. In contrast, some other studies have failed to find any
gender differences in mathematics anxiety (e.g., Birgin, Baloglu, Cathoglu, & Gurbuz,
2010; Cooper & Robinson, 1991). The results have thus been mixed and therefore
inconclusive. Thus there is uncertainty about the association of gender and mathematics
anxiety among Indian secondary school students, and so the present study investigated
how gender influences students’ mathematics anxiety in the Indian context.
Very little empirical evidence exists on gender differences in attitude towards
mathematics among Indian students. When reviewing gender studies in attitudes to
mathematics in the Asian context, the results were found to be inconsistent. For
example, Mahad, Abdullah, and Abdul Kadir (2012) examined attitudes towards the
FACTORS INFLUENCING MATHEMATICS ACHIEVEMENT OF SECONDARY SCHOOL STUDENTS IN INDIA 52
learning of mathematics among 95 students enrolled in the A-level medicine (ALM)
programme in the University Teknologi MARA (UiTM) in Malaysia and found that girls
had more positive attitudes towards mathematics than did boys. Similar results were
observed by Anwer, Iqubal, and Harrison (2012) in a study carried out in Pakistan to
understand attitude towards science among Grade 10 students. They have found that
girls have more positive attitude towards science compared to boys. The results were
similar for the total scale- Test of Science Related Attitudes (TOSRA) - and for all the
subscales of TOSRA except for Career interest in science scale. In contrast with this
finding, Rodrigues and Khaliq (2012) found that male students had more positive
attitude towards mathematics than their female counterparts. In the Programme for
International Student Assessment (PISA) 2012, girls were reported to have less positive
attitude towards mathematics than boys (OECD, 2014). However, other researchers have
found no gender differences in attitude towards mathematics (e.g., Farooq & Shah, 2008;
Mohammed & Waheed, 2011). Given the inconsistent picture of gender differences in the
literature, the present study investigated the extent to which gender affects attitude
towards mathematics among Indian students.
2.5.2 Parental involvement and gender
Not much is known about gender differences in parental involvement, especially
among secondary school students in India. Early studies on parental involvement in the
United States reported parents being more involved with sons in school activities, and
more involved with daughters in home activities; with more involvement in total reported
with daughters on average (e.g., Stevenson & Baker, 1987). Later studies in United
States have found that parents were more involved in school related issues with their
daughters than with their sons (Carter & Wojtkiewicz, 2000). Other studies in western
FACTORS INFLUENCING MATHEMATICS ACHIEVEMENT OF SECONDARY SCHOOL STUDENTS IN INDIA 53
countries have also reported greater involvement of parents in the education of their
daughters than their sons (e.g., Fehrmann, Keith, & Reimers, 1987; P. Keith & Lichtman,
1994). The above studies portrayed parents as having more verbal communications with
daughters, but showing more academic supervision of their sons. In Japan, Schoolland
(1990), found parents had higher expectations for sons than daughters. Similar results
were observed by Verma and Gupta (1990) for Indian students.
This section discussed gender differences in academic achievement, attitude, anxiety
and parental involvement with special reference to mathematics. The majority of the
studies reviewed were carried out in western settings (e.g., Else-Quest, Hyde, & Linn,
2010; Forgasz & Hill, 2013; Pinar, 2011), and a few of them were conducted with students
in Asian countries (e.g., Mahad et al., 2012; Schoolland, 1990; Verma & Gupta, 1990).
Based on the few studies available, it appears that parental involvement and gender
associations might vary among countries and over time. A new study of these
relationships involving Indian students will add to the existing knowledge.
2.6 Summary
This chapter provided a review of the literature related to mathematics anxiety,
attitude towards mathematics, and parental involvement and their influence on
mathematics achievement. The review has shown that mathematics anxiety negatively
influences achievement in mathematics. That is, students with higher mathematics
anxiety perform more poorly in mathematics than their less anxious peers (H. Z. Ho et
al., 2000; Woodard, 2004). The relationship between attitude towards mathematics and
achievement in mathematics is inconclusive because of the complex nature of the
construct, although a positive relationship has been observed between the two variables
FACTORS INFLUENCING MATHEMATICS ACHIEVEMENT OF SECONDARY SCHOOL STUDENTS IN INDIA 54
in general (Nicolaidou & Philippou, 2003; Singh et al., 2002). Parental involvement has
been found to influence the academic achievement of students from kindergarten to Year
12 (Simon, 2001). In particular, parental expectations have been found to have the
strongest influence on the mathematics achievement of students (X. Fan & Chen, 2001;
Ma, 2001; Trivette & Anderson, 1995).
Gender differences in mathematics anxiety, attitude towards mathematics, parental
involvement, and mathematics achievement has also been widely researched. In terms of
mathematics anxiety of male and female students, researchers have found female students
to have more mathematics anxiety than their male counterparts (Haynes, Mullins, &
Stein, 2004; Hopko, 2003). Other researchers have reported male students having more
mathematics anxiety than female students (Deb, Chatterjee, & Walsh, 2010). Studies
examining gender differences in attitude towards mathematics have reported boys having
more positive attitude to mathematics than girls (Else-Quest et al., 2010; Hyde,
Fennema, Ryan, et al., 1990). Results concerning gender differences related to parental
involvement in mathematics are inconsistent. For example, some researchers found that
parents were more involved with boys than girls (e.g., Schoolland, 1990; Verma & Gupta,
1990), others found that parents were more involved with girls than boys (e.g.,
T. Z. Keith et al., 1998). These findings are likely related to the varied definitions of
parental involvement and the multi-faceted nature of the construct.
The present study explored how mathematics anxiety, attitude towards mathematics
and parental involvement influences the mathematics achievement of secondary school
students in India. In the present study it was hypothesised that mathematics anxiety,
attitude towards mathematics and parental involvement would have a direct influence on
mathematics achievement of students. Further, it was expected that parental involvement
would directly influence mathematics anxiety and attitude towards mathematics and it
FACTORS INFLUENCING MATHEMATICS ACHIEVEMENT OF SECONDARY SCHOOL STUDENTS IN INDIA 55
also assumed a correlational relationship between mathematics anxiety and attitude
towards mathematics. Furthermore, the study investigated the influence of gender on
these variables. The methodology adopted for the study is described in the next chapter,
Chapter 3, along with the discussion of the sample, the instruments used and the
procedures for data collection.
FACTORS INFLUENCING MATHEMATICS ACHIEVEMENT OF SECONDARY SCHOOL STUDENTS IN INDIA 56
CHAPTER 3 METHODOLOGY
3.1 Introduction
A mixed method approach using a cross sectional research design was employed in
this study. Mixed method research involves collection and analysis of both quantitative
and qualitative data (Creswell, 2003). The quantitative data consisted of closed-ended
information from the participants collected through questionnaires, whereas the
qualitative data comprised open-ended responses collected through interviews. This
chapter describes the research design for the study, the instruments, the sample, and the
data collection procedures. The data analysis procedures are described in Chapter 4.
3.2 Research Design
The research design was selected and developed on the basis of the conceptual model
of the study, shown in Figure 3.1. The study aimed to investigate the relationship among
the variables mathematics anxiety, attitude towards mathematics, parental involvement
and mathematics achievement at a particular point in time and for a particular group of
participants. Thus, a mixed method approach with cross sectional research design was
the appropriate method for the study. Mixed methods approaches apply various
strategies of inquiry that help the researcher to collect data either simultaneously or in
sequence to better understand the problem under study (Creswell, 2003). Further, this
approach enables the researcher to conduct the data collection procedures in the natural
environment of the school or home for the participants (Lin, 1976). The cross-sectional
research design enables the researcher to understand the prevalence of a particular
attribute for a population or a sample of the population at one point in time
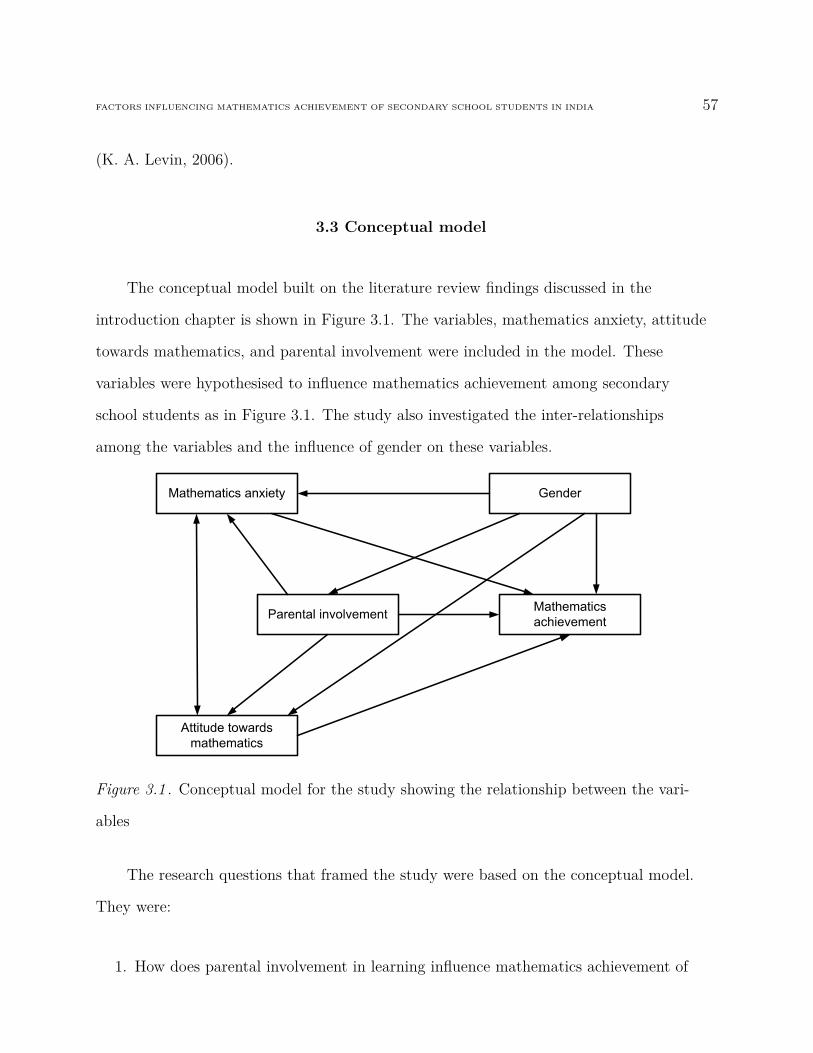
FACTORS INFLUENCING MATHEMATICS ACHIEVEMENT OF SECONDARY SCHOOL STUDENTS IN INDIA 57
(K. A. Levin, 2006).
3.3 Conceptual model
The conceptual model built on the literature review findings discussed in the
introduction chapter is shown in Figure 3.1. The variables, mathematics anxiety, attitude
towards mathematics, and parental involvement were included in the model. These
variables were hypothesised to influence mathematics achievement among secondary
school students as in Figure 3.1. The study also investigated the inter-relationships
among the variables and the influence of gender on these variables.
Figure 3.1 . Conceptual model for the study showing the relationship between the vari-
ables
The research questions that framed the study were based on the conceptual model.
They were:
1. How does parental involvement in learning influence mathematics achievement of
FACTORS INFLUENCING MATHEMATICS ACHIEVEMENT OF SECONDARY SCHOOL STUDENTS IN INDIA 58
secondary school students in India?
2. How does attitude towards mathematics influence mathematics achievement of
secondary school students in India?
3. How does mathematics anxiety influence mathematics achievement of secondary
school students in India?
4. How do parental involvement, attitude towards mathematics and mathematics
anxiety interact to influence the mathematics achievement of secondary school
students in India?
5. Are there gender differences in relation to any of these variables and/or their
relationships?
3.4 Data collection tools
The next section explains the general characteristics of questionnaires and interviews
used for collecting quantitative and qualitative data.
3.4.1 Questionnaires
A questionnaire is a list of questions used to collect information from a large number
of people on the subject of interest. It serves as a medium through which the researcher
and the respondent communicate indirectly (Brace, 2004). According to Strange and his
colleagues (Strange, Forest, Oakley, & The Ripple Study Team, 2003), respondents may
feel more comfortable to convey their opinions through questionnaire than in a
face-to-face interview.
FACTORS INFLUENCING MATHEMATICS ACHIEVEMENT OF SECONDARY SCHOOL STUDENTS IN INDIA 59
Questionnaires have various other advantages and disadvantages. They are cost
effective, and convenient to administer (Cohen & Manion, 1994) and are supposed to be
less invasive than face-to-face interviews (Popper, 2002) and are also considered an
inexpensive way to cover large geographical areas. The main disadvantages include low
response rates, the inability to clarify misunderstandings or doubts of the respondents
(Fox, Murray, & Warm, 2003). In the case of postal or web-based questionnaires, the
researchers do not have any control over the person who completes the questionnaire
(Neuman, 2001).
3.4.2 Interviews
Interviews can be used to describe and understand the experiences of the interviewee
(Kvale, 1996). They can be used as a follow up from a questionnaire to look further into
the responses of the subjects (McNamara, 1999). Interviews have been categorised as
unstructured, semi-structured, or structured interview (Bernard, 1988; Fontana & Frey,
2005; Crabtree & Miller, 1999). In an unstructured interview, the interviewee has the
freedom to talk freely to the interviewer’s question (Bryman & Bell, 2007). The
unstructured interview is more casual and flexible and the interviewee can express their
views freely. Semi-structured interviews are usually planned in advance for an allotted
time, at an allotted place. They are coordinated around a set of pre-planned questions
and the remaining questions come out of the conversation between the interviewer and
the interviewee (Dicicco-Bloom & Crabtree, 2006). In semi-structured interviews, all the
participants are asked identical questions formatted in such a way that the responses
were open-ended (Gall, Gall, & Borg, 2003). In this type of interview, the interviewer can
adjust the order of the questions based on respondents’ answers and dig deeper into a
given situation.
FACTORS INFLUENCING MATHEMATICS ACHIEVEMENT OF SECONDARY SCHOOL STUDENTS IN INDIA 60
The time required to code interview data is arguably the main disadvantage
associated with the semi-structured interview (Creswell, 2003). Because the composition
of the open-ended questions allows the respondent to give their responses in detail, it can
be difficult for the researcher to identify similar codes from the transcripts of the
interviews. Another disadvantage in a semi-structured interview is that the follow-up
questions depend on the responses of the interviewee and hence vary from participant to
participant. Other disadvantages of semi-structured interviews include the length of time
required to conduct the interviews and interviewer bias. In a structured interview there is
a pre-determined set of questions which are to be covered within the set time (Bryman &
Bell, 2007).
3.5 Instruments
The details of the instruments used in the study are explained in the following
sections. The instruments included a student questionnaire, a questionnaire for a parent,
and a student achievement test in mathematics. The first section details the sources of
the questionnaire instruments used, and the second describes the interview schedules. It
was out of the scope of this thesis to describe all the instruments used to measure the
variables of interest in previous studies.
3.5.1 Questionnaires
This section begins with a description of existing instruments that were used as the
basis for the questionnaires in the current study. Subsequent sections describe the actual
instruments that were used.
FACTORS INFLUENCING MATHEMATICS ACHIEVEMENT OF SECONDARY SCHOOL STUDENTS IN INDIA 61
3.5.1.1 Existing questionnaire instruments.
3.5.1.1.1 Shortened Form of the Fennema-Sherman Attitudes Scales.
The Fennema-Sherman Attitudes Scales (FSMAS) (Fennema & Sherman, 1976) were
formulated to study gender differences among secondary school students in relation to
affective factors relevant to achievement in mathematics (Mulhern & Rae, 1998). There
were nine scales in the FSMAS instrument: Attitude Towards Success in Mathematics
scale; Mathematics as a Male Domain scale; Mother, Father, and Teacher scales;
Confidence in Learning Mathematics scale; Mathematics Anxiety scale; Effectance
Motivation in Mathematics scale; and Usefulness of Mathematics scale, containing 12
items each. The Cronbach alpha coefficients of the individual scales ranged from 0.87 to
0.93.
Mulhern and Rae (1998) developed a shorter version of the Fennema-Sherman
Attitudes Scale and validated it with a sample of 196 school children from the Republic
of Ireland. The seven scales in the Shortened Form of the Fennema-Sherman Attitudes
Scales (FSMAS) are Attitude Towards Success in Mathematics scale; Mathematics as a
Male Domain scale, Mathematics Anxiety scale, Mother, Father and Teacher scale,
Confidence in Learning Mathematics scale, Usefulness of Mathematics and Effectance
Motivation in Mathematics scale, with 12 items each.
The Mulhern and Rae study reported a Cronbach alpha coefficient of 0.93 for the
whole scale and the individual scales were reported to have alpha coefficients ranging
from 0.79 to 0.93. These scales have been used individually (Drisko, 1993), in a set of two
or more (Iben, 1991), or as a complete scale (Sherman, 1982). Researchers have modified
and used the FSMAS for different subject areas (Lirgg, 1993; Sticker, Rock, & Burton,
1993) and for various age groups (Elliot, 1990; Sherman, 1983). The present study used
FACTORS INFLUENCING MATHEMATICS ACHIEVEMENT OF SECONDARY SCHOOL STUDENTS IN INDIA 62
the Attitude Towards Success in Mathematics scale; Mathematics Anxiety scale; Parent
scale (adapted from Mother, Father and Teacher scales); Confidence in Learning
Mathematics scale; Usefulness of Mathematics, and Effectance Motivation in
Mathematics scale from the Mulhern and Rae study to measure the constructs attitude
towards mathematics, mathematics anxiety, and parental involvement.
3.5.1.1.2 Parental Authority Questionnaire.
The Parental Authority Questionnaire (PAQ) (Buri, 1991) was developed to measure
the three prototypes of parental authority; authoritarian, authoritative and permissive as
proposed by Baumrind (1971). The scale items were designed to measure parenting style
as perceived by the sons and daughters (Buri, 1991). The PAQ as a single scale was
based on the conceptualisation of parenting style on a continuum of most controlling to
least controlling. PAQ consisted of 30 items; 10 items each to measure authoritarian
parenting style, authoritative parenting style, and permissive parenting style. There were
two forms of the Parental Authority Questionnaire- one form to assess a father’s parental
authority and the other to assess a mother’s parental authority. A 5-point Likert scale
was used to collect responses from participants.
The test-retest reliability coefficients and Cronbach alpha values for the six PAQ
scales from the Buri study were highly respectable; 0.81 and 0.75 for mother’s
permissiveness, 0.86 and 0.85 for mother’s authoritarianism, 0.78 and 0.82 for mother’s
authoritativeness, 0.77 and 0.74 for father’s permissiveness, 0.85 and 0.87 for father’s
authoritarianism, 0.92 and 0.85 for father’s authoritativeness.
3.5.1.2 Existing achievement test instruments.
3.5.1.2.1 Programme for International Student Assessment.
The Programme for International Student Assessment (PISA) is an initiative of the
FACTORS INFLUENCING MATHEMATICS ACHIEVEMENT OF SECONDARY SCHOOL STUDENTS IN INDIA 63
Organisation for Economic Co-operation and Development (OCED) to keep track of the
educational outcomes of the member countries. The PISA 2009 assessment in
mathematics covered various overarching ideas: quantity, space and shape, change and
relationships and uncertainty. The assessment was being carried out under a commonly
agreed international framework in terms of student achievement. PISA is an
internationally standardised assessment tool for 15-year-old students in school and
work-based programmes (PISA, 2009). It assesses student’s content knowledge in the
areas of reading, mathematics and science as well as their skills in applying their
knowledge to new life situations. PISA also provides information about family’s, social,
economic, and cultural background, school, learning styles, skills, and attitudes. PISA
therefore, helps in understanding the interaction between student outcomes, home, and
school, thereby contributing to policy making and implementation with a view to
improve student outcomes. Experts from participating countries ensure the international
validity of the PISA instruments, taking into account the differing curricular and cultural
setting of the participating countries. The study was intended to be positioned in an
international context. PISA was selected as the achievement test instrument because it is
an internationally standardised assessment tool used widely in the international context.
3.6 Instruments for the present study
3.6.1 Student questionnaire
The student questionnaire was adapted from the Shortened Form of
Fennema-Sherman Attitudes Scales (Mulhern & Rae, 1998) and Parental Authority
Questionnaire (Buri, 1991). It consisted of eight scales measuring the constructs, attitude
towards mathematics, mathematics anxiety, and parental involvement. The two scales
FACTORS INFLUENCING MATHEMATICS ACHIEVEMENT OF SECONDARY SCHOOL STUDENTS IN INDIA 64
measuring attitude towards mathematics were the Attitude towards maths and success in
mathematics (sattitude) scale and the Usefulness of mathematics (susefulness) scale. The
three scales measuring mathematics anxiety were the Anxiety (sanxiety) scale, the
Confidence in learning mathematics (sconfidence) scale, and the Effectance motivation in
mathematics (smotivation) scale. The three scales measuring parental involvement were
the Parent behaviour (sparentbeh) scale, the Parent attitudes (sparentattitude) scale,
and the Parenting style (sparsty) scale. The complete student questionnaire is included
in Appendix A. The students were asked to rate their agreement with each of the
statements in the questionnaire on a 5-point scale with choices comprising Strongly
Disagree, Disagree, Undecided, Agree, and Strongly Agree. The items were coded so that
higher scores indicated greater measure of the construct.
Some of the items were reworded for the present study to make the statements
clearer to the respondents. Some examples of items that were reworded for use in the
student questionnaire are given in Table 3.1. The positively worded item ‘I can get good
grades in mathematics’ in the confidence in learning mathematics (sconfidence) scale was
reworded to ‘I am sure I could get good grades in maths’ to affirm the positive nature of
the item. The phrase ‘uneasy and confused’ in the next item was replaced by the word
‘confused’ to give the statement more clarity. As either the student’s father or mother was
asked to respond to the parent questionnaire, the word ‘mother’ was replaced by ‘parents’.
The word ‘do’ was replaced by ‘score’ for clarity in the last item as the word ‘do’ might
be interpreted by the students as doing class work, instead of their achievement scores.
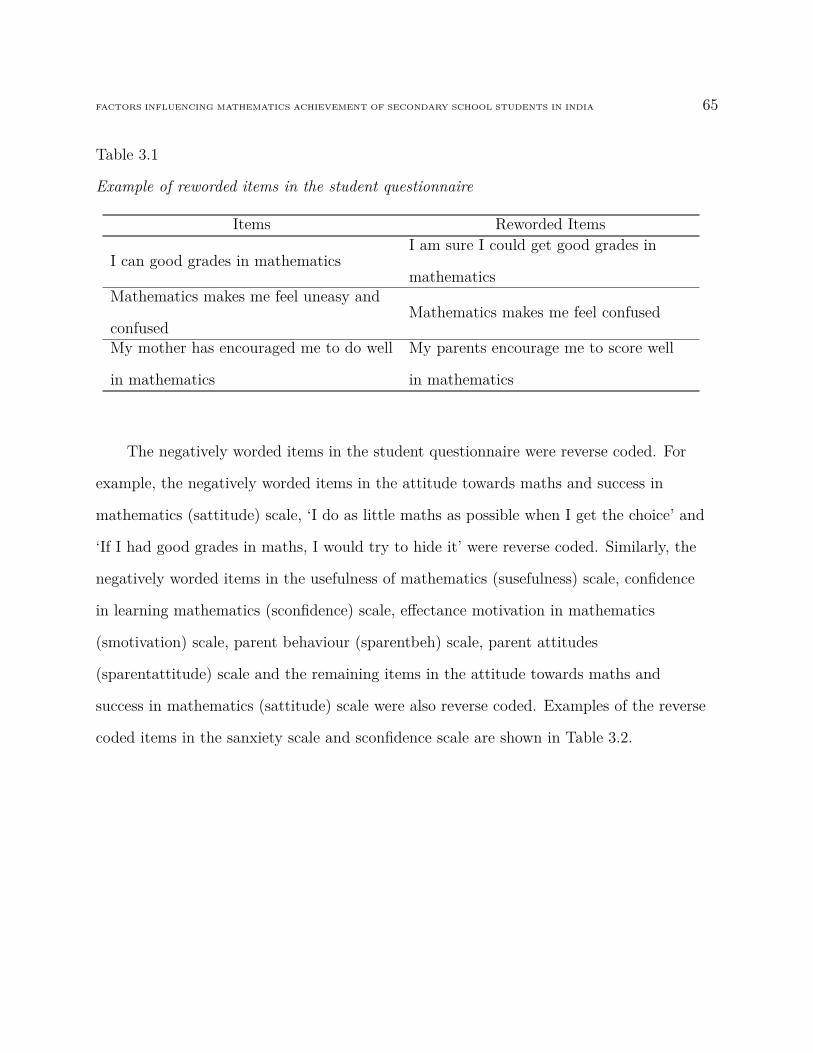
FACTORS INFLUENCING MATHEMATICS ACHIEVEMENT OF SECONDARY SCHOOL STUDENTS IN INDIA 65
Table 3.1
Example of reworded items in the student questionnaire
Items Reworded Items
I can good grades in mathematicsI am sure I could get good grades in
mathematicsMathematics makes me feel uneasy and
confusedMathematics makes me feel confused
My mother has encouraged me to do well
in mathematics
My parents encourage me to score well
in mathematics
The negatively worded items in the student questionnaire were reverse coded. For
example, the negatively worded items in the attitude towards maths and success in
mathematics (sattitude) scale, ‘I do as little maths as possible when I get the choice’ and
‘If I had good grades in maths, I would try to hide it’ were reverse coded. Similarly, the
negatively worded items in the usefulness of mathematics (susefulness) scale, confidence
in learning mathematics (sconfidence) scale, effectance motivation in mathematics
(smotivation) scale, parent behaviour (sparentbeh) scale, parent attitudes
(sparentattitude) scale and the remaining items in the attitude towards maths and
success in mathematics (sattitude) scale were also reverse coded. Examples of the reverse
coded items in the sanxiety scale and sconfidence scale are shown in Table 3.2.
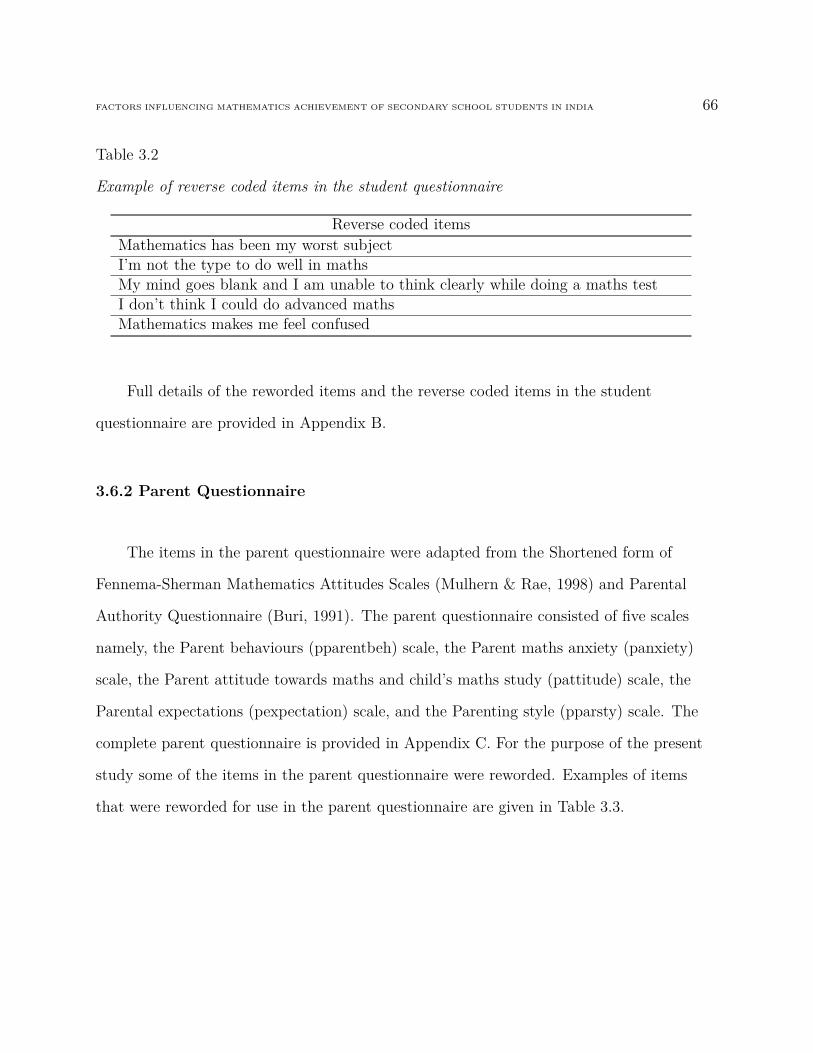
FACTORS INFLUENCING MATHEMATICS ACHIEVEMENT OF SECONDARY SCHOOL STUDENTS IN INDIA 66
Table 3.2
Example of reverse coded items in the student questionnaire
Reverse coded itemsMathematics has been my worst subjectI’m not the type to do well in mathsMy mind goes blank and I am unable to think clearly while doing a maths testI don’t think I could do advanced mathsMathematics makes me feel confused
Full details of the reworded items and the reverse coded items in the student
questionnaire are provided in Appendix B.
3.6.2 Parent Questionnaire
The items in the parent questionnaire were adapted from the Shortened form of
Fennema-Sherman Mathematics Attitudes Scales (Mulhern & Rae, 1998) and Parental
Authority Questionnaire (Buri, 1991). The parent questionnaire consisted of five scales
namely, the Parent behaviours (pparentbeh) scale, the Parent maths anxiety (panxiety)
scale, the Parent attitude towards maths and child’s maths study (pattitude) scale, the
Parental expectations (pexpectation) scale, and the Parenting style (pparsty) scale. The
complete parent questionnaire is provided in Appendix C. For the purpose of the present
study some of the items in the parent questionnaire were reworded. Examples of items
that were reworded for use in the parent questionnaire are given in Table 3.3.
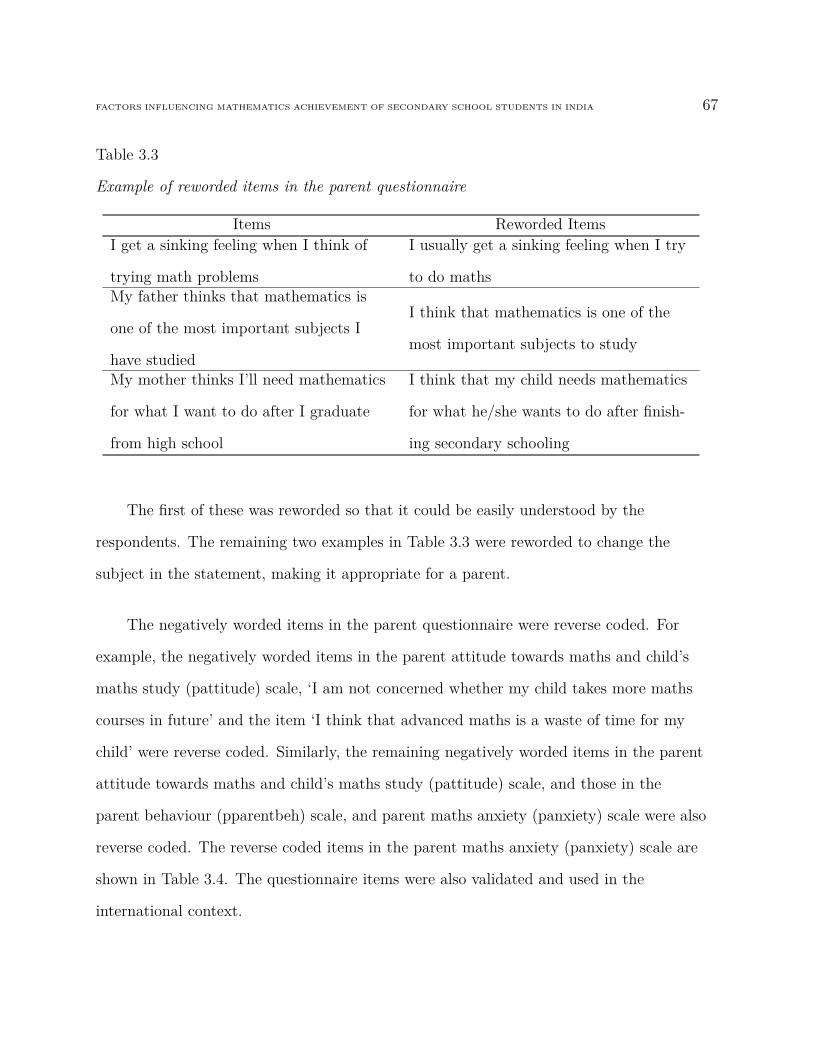
FACTORS INFLUENCING MATHEMATICS ACHIEVEMENT OF SECONDARY SCHOOL STUDENTS IN INDIA 67
Table 3.3
Example of reworded items in the parent questionnaire
Items Reworded ItemsI get a sinking feeling when I think of
trying math problems
I usually get a sinking feeling when I try
to do mathsMy father thinks that mathematics is
one of the most important subjects I
have studied
I think that mathematics is one of the
most important subjects to study
My mother thinks I’ll need mathematics
for what I want to do after I graduate
from high school
I think that my child needs mathematics
for what he/she wants to do after finish-
ing secondary schooling
The first of these was reworded so that it could be easily understood by the
respondents. The remaining two examples in Table 3.3 were reworded to change the
subject in the statement, making it appropriate for a parent.
The negatively worded items in the parent questionnaire were reverse coded. For
example, the negatively worded items in the parent attitude towards maths and child’s
maths study (pattitude) scale, ‘I am not concerned whether my child takes more maths
courses in future’ and the item ‘I think that advanced maths is a waste of time for my
child’ were reverse coded. Similarly, the remaining negatively worded items in the parent
attitude towards maths and child’s maths study (pattitude) scale, and those in the
parent behaviour (pparentbeh) scale, and parent maths anxiety (panxiety) scale were also
reverse coded. The reverse coded items in the parent maths anxiety (panxiety) scale are
shown in Table 3.4. The questionnaire items were also validated and used in the
international context.
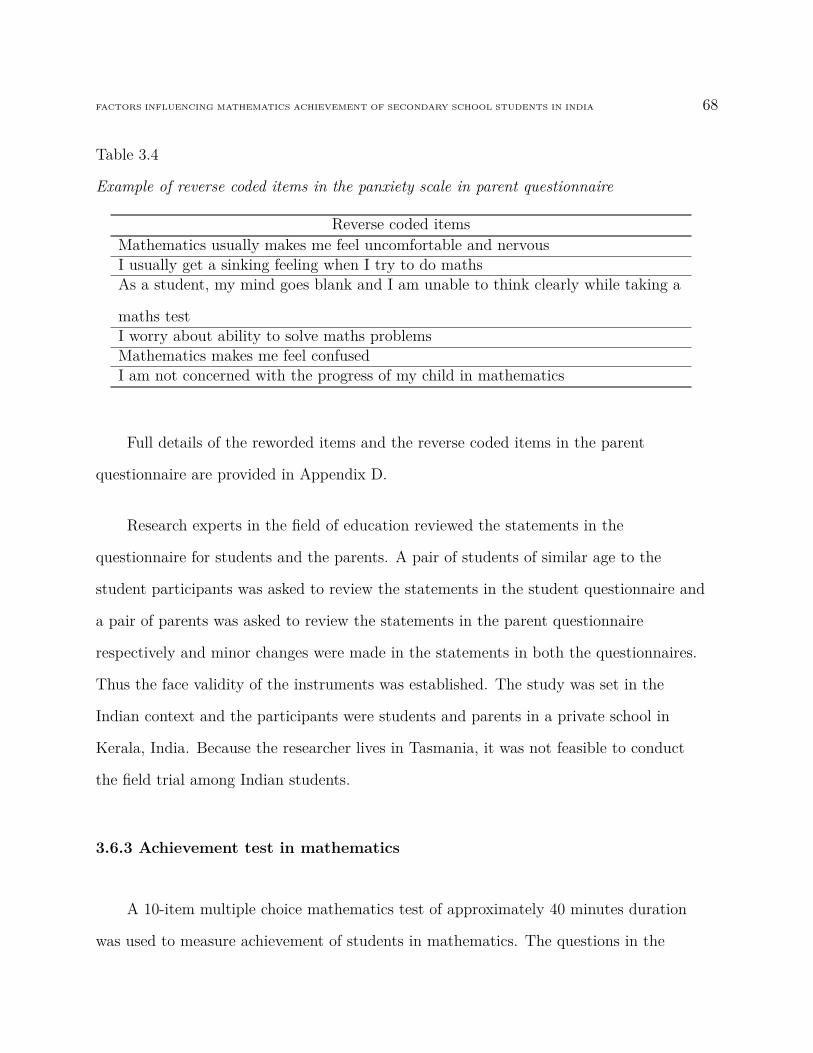
FACTORS INFLUENCING MATHEMATICS ACHIEVEMENT OF SECONDARY SCHOOL STUDENTS IN INDIA 68
Table 3.4
Example of reverse coded items in the panxiety scale in parent questionnaire
Reverse coded itemsMathematics usually makes me feel uncomfortable and nervousI usually get a sinking feeling when I try to do mathsAs a student, my mind goes blank and I am unable to think clearly while taking a
maths testI worry about ability to solve maths problemsMathematics makes me feel confusedI am not concerned with the progress of my child in mathematics
Full details of the reworded items and the reverse coded items in the parent
questionnaire are provided in Appendix D.
Research experts in the field of education reviewed the statements in the
questionnaire for students and the parents. A pair of students of similar age to the
student participants was asked to review the statements in the student questionnaire and
a pair of parents was asked to review the statements in the parent questionnaire
respectively and minor changes were made in the statements in both the questionnaires.
Thus the face validity of the instruments was established. The study was set in the
Indian context and the participants were students and parents in a private school in
Kerala, India. Because the researcher lives in Tasmania, it was not feasible to conduct
the field trial among Indian students.
3.6.3 Achievement test in mathematics
A 10-item multiple choice mathematics test of approximately 40 minutes duration
was used to measure achievement of students in mathematics. The questions in the
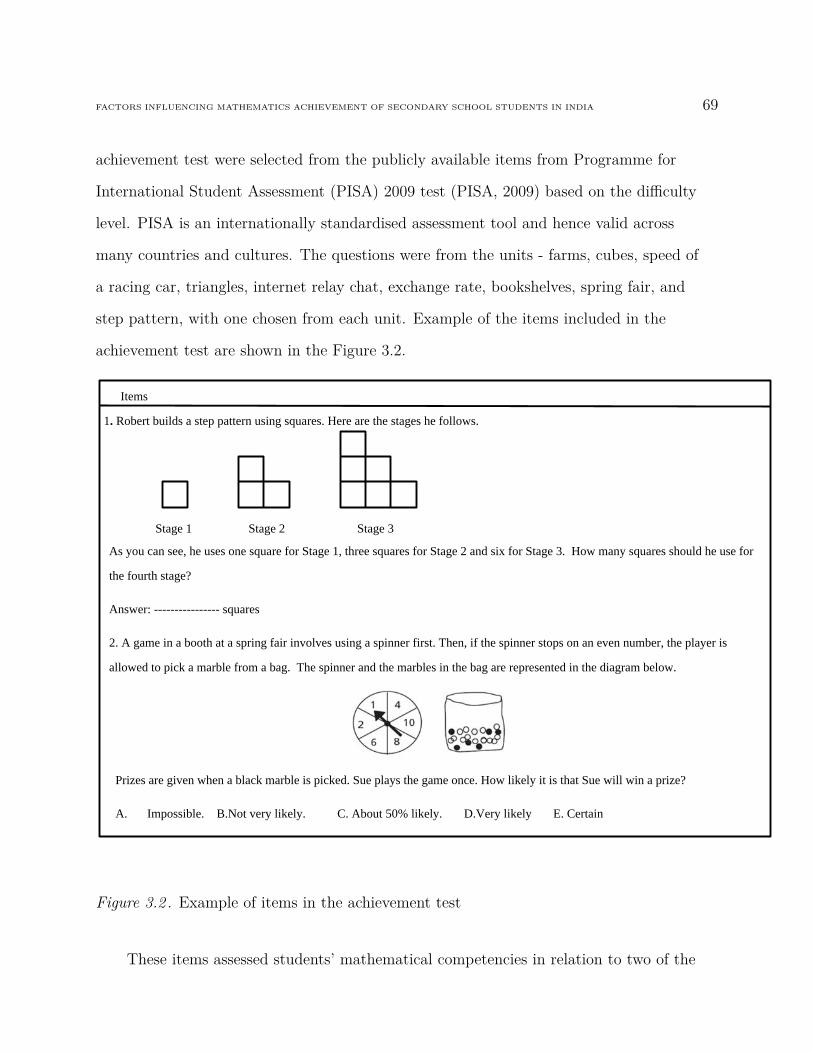
FACTORS INFLUENCING MATHEMATICS ACHIEVEMENT OF SECONDARY SCHOOL STUDENTS IN INDIA 69
achievement test were selected from the publicly available items from Programme for
International Student Assessment (PISA) 2009 test (PISA, 2009) based on the difficulty
level. PISA is an internationally standardised assessment tool and hence valid across
many countries and cultures. The questions were from the units - farms, cubes, speed of
a racing car, triangles, internet relay chat, exchange rate, bookshelves, spring fair, and
step pattern, with one chosen from each unit. Example of the items included in the
achievement test are shown in the Figure 3.2.
Items
1. Robert builds a step pattern using squares. Here are the stages he follows.
Stage 1 Stage 2 Stage 3
As you can see, he uses one square for Stage 1, three squares for Stage 2 and six for Stage 3. How many squares should he use for
the fourth stage?
Answer: ---------------- squares
2. A game in a booth at a spring fair involves using a spinner first. Then, if the spinner stops on an even number, the player is
allowed to pick a marble from a bag. The spinner and the marbles in the bag are represented in the diagram below.
Prizes are given when a black marble is picked. Sue plays the game once. How likely it is that Sue will win a prize?
A. Impossible. B.Not very likely. C. About 50% likely. D.Very likely E. Certain
Figure 3.2 . Example of items in the achievement test
These items assessed students’ mathematical competencies in relation to two of the

FACTORS INFLUENCING MATHEMATICS ACHIEVEMENT OF SECONDARY SCHOOL STUDENTS IN INDIA 70
overarching themes -change and shape; and uncertainty (statistics and probability
theory)- assessed in PISA test. The achievement test in mathematics used in this study
in its complete form is provided in Appendix E.
3.6.4 Interviews
For the purpose of this study, semi-structured interviews were selected, based on the
fact that they allow the researcher more freedom in conducting the interview and can
collect the detailed information on the topic under study by asking probing questions.
Before the interviews were conducted two interview schedules were prepared: one for the
students and one for the parents. Examples of the interview questions for the students
and the parents are given in Figure 3.3 and Figure 3.4 respectively. The complete
interview schedules for the students and the parents are provided in Appendix F.
1. Who helps you with your study?
2. What is your worst subject in school?
3. How do you rate yourself as a mathematics student?
4. How do you feel about it? Why?
5. How do you feel when taking a mathematics test?
Figure 3.3 . Example of questions for the students
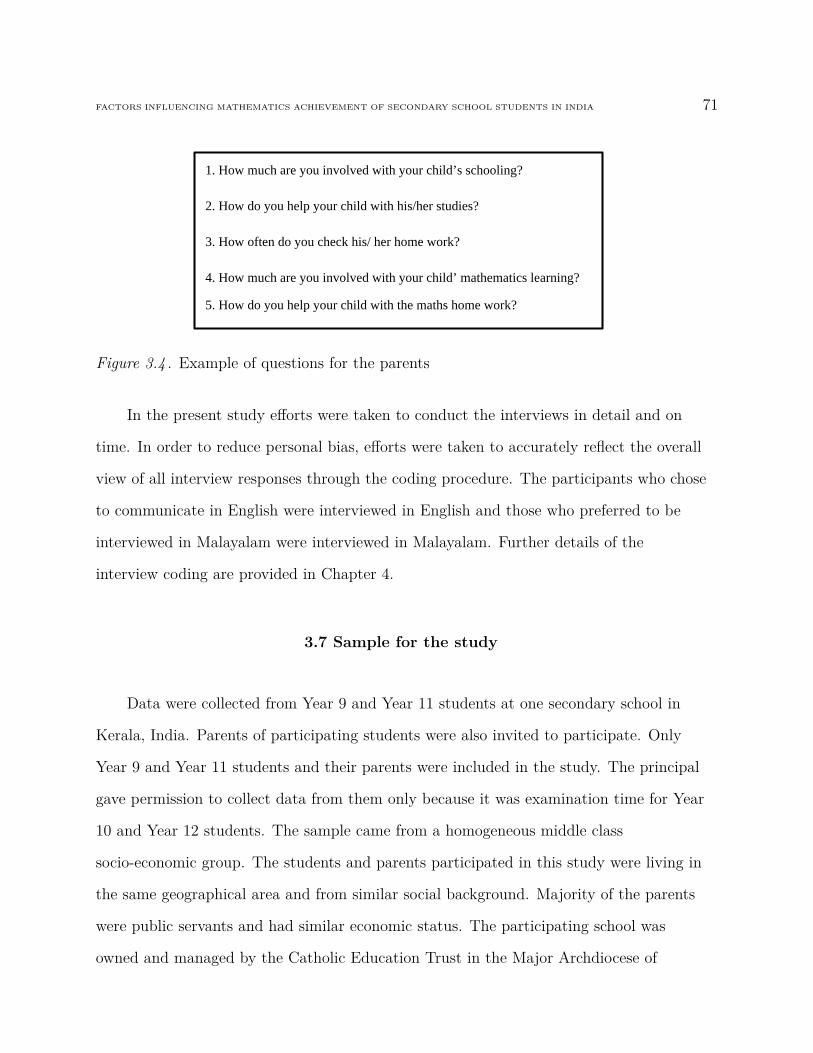
FACTORS INFLUENCING MATHEMATICS ACHIEVEMENT OF SECONDARY SCHOOL STUDENTS IN INDIA 71
1. How much are you involved with your child’s schooling?
2. How do you help your child with his/her studies?
3. How often do you check his/ her home work?
4. How much are you involved with your child’ mathematics learning?
5. How do you help your child with the maths home work?
Figure 3.4 . Example of questions for the parents
In the present study efforts were taken to conduct the interviews in detail and on
time. In order to reduce personal bias, efforts were taken to accurately reflect the overall
view of all interview responses through the coding procedure. The participants who chose
to communicate in English were interviewed in English and those who preferred to be
interviewed in Malayalam were interviewed in Malayalam. Further details of the
interview coding are provided in Chapter 4.
3.7 Sample for the study
Data were collected from Year 9 and Year 11 students at one secondary school in
Kerala, India. Parents of participating students were also invited to participate. Only
Year 9 and Year 11 students and their parents were included in the study. The principal
gave permission to collect data from them only because it was examination time for Year
10 and Year 12 students. The sample came from a homogeneous middle class
socio-economic group. The students and parents participated in this study were living in
the same geographical area and from similar social background. Majority of the parents
were public servants and had similar economic status. The participating school was
owned and managed by the Catholic Education Trust in the Major Archdiocese of
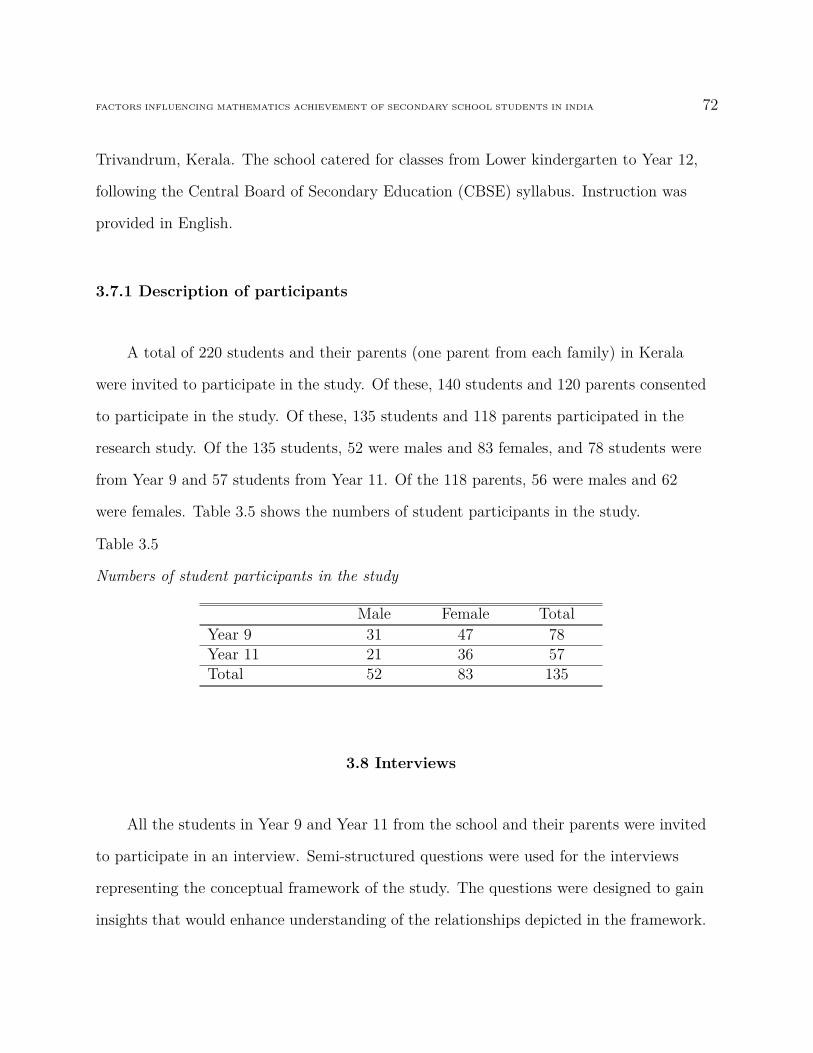
FACTORS INFLUENCING MATHEMATICS ACHIEVEMENT OF SECONDARY SCHOOL STUDENTS IN INDIA 72
Trivandrum, Kerala. The school catered for classes from Lower kindergarten to Year 12,
following the Central Board of Secondary Education (CBSE) syllabus. Instruction was
provided in English.
3.7.1 Description of participants
A total of 220 students and their parents (one parent from each family) in Kerala
were invited to participate in the study. Of these, 140 students and 120 parents consented
to participate in the study. Of these, 135 students and 118 parents participated in the
research study. Of the 135 students, 52 were males and 83 females, and 78 students were
from Year 9 and 57 students from Year 11. Of the 118 parents, 56 were males and 62
were females. Table 3.5 shows the numbers of student participants in the study.
Table 3.5
Numbers of student participants in the study
Male Female TotalYear 9 31 47 78Year 11 21 36 57Total 52 83 135
3.8 Interviews
All the students in Year 9 and Year 11 from the school and their parents were invited
to participate in an interview. Semi-structured questions were used for the interviews
representing the conceptual framework of the study. The questions were designed to gain
insights that would enhance understanding of the relationships depicted in the framework.
FACTORS INFLUENCING MATHEMATICS ACHIEVEMENT OF SECONDARY SCHOOL STUDENTS IN INDIA 73
3.9 Data Collection Procedures
This section describes the procedures used for the data collection. The data
collection process was conducted from December 2011 to January 2012 in India. Ethical
guidelines and policies recommended by the University of Tasmania were strictly adhered
to in the study. The approval of the Tasmanian Human Research Ethics Committee was
obtained for the study (see Appendix G). Permission for data collection was obtained
from the principal of the school. The letter granting permission is provided in Appendix
H. Teachers’ consent was also received to conduct data collection in their respective
classrooms. The teachers’ consent form is provided in Appendix I.
3.9.1 Data collection from students
The student information sheet for the questionnaire and achievement test, parent
consent form for student questionnaire and achievement test (see Appendix J and
Appendix I) were sent home with the students via class teachers. An envelope addressed
to the researcher, care of the school, was also included. Parents were asked to return the
signed student questionnaire and achievement test consent forms, and the completed
parent questionnaire, including the consent form for that instrument in an envelope
addressed to the researcher. They were asked to return the sealed envelope through their
child to the respective class teachers, approximately one week from the date on which the
documents were sent home. The returned envelopes were collected by researcher from the
class teachers.
Once the parental consent was obtained, student participants in the study were
given a brief explanation of the purpose of the study in their classes by the researcher.
FACTORS INFLUENCING MATHEMATICS ACHIEVEMENT OF SECONDARY SCHOOL STUDENTS IN INDIA 74
The students were reminded that their participation was important to the study, but
voluntary. The achievement test was administered to the student participants in their
respective classrooms in a scheduled mathematics lesson. The student consent form for
the achievement test was included as the first page of the test. Appendix I provides the
student consent form for the achievement test. Similarly, the students were administered
the questionnaire in their respective classrooms in a different lesson from the one in
which they completed the achievement test, but on the same day. The lessons were at
least one hour apart. The decision to administer the achievement test and the student
questionnaire on the same day was taken by the researcher because the principal of the
school permitted only one day for data collection. The questionnaire was administered to
the students in different classes during free lessons. Care was taken to keep a gap of at
least one hour between the administration of the achievement test and the questionnaire.
The student consent form for questionnaire was included as the first page of the
questionnaire. Appendix I provides the student consent form for the questionnaire. Both
the questionnaire and the achievement test were administered in English. Of the total of
140 students who consented to participate in the study, 135 (96.4%) students completed
the achievement test and the questionnaire.
3.9.2 Student Interviews
The students were asked at the end of the questionnaire to indicate their willingness
or otherwise to participate in the interview . A sample was selected from those who
indicated their willingness for the interview based on their scores in the achievement test
of the study. Based on their achievement test score the students were grouped into high,
medium, and low achievers. The students whose achievement test score was equal to and
above Mean+2SD were grouped as high achievers, the students whose achievement test
FACTORS INFLUENCING MATHEMATICS ACHIEVEMENT OF SECONDARY SCHOOL STUDENTS IN INDIA 75
score was equal to and below Mean-2SD were grouped as low achievers, and those
students with achievement test score between Mean+2SD and Mean-2SD were grouped
as medium achievers. From those who had consented to participate, four students from
each of the three groups were selected at random for the interview. The parent consent
form for the student interview was sent home with the selected students through the class
teachers. Of the twelve students selected for the interview, only six students had parental
consent to participate in this aspect of the study. Thus six student-parent pairs, two
students (and their parents) from each achievement group participated in the interview.
Although selected in pairs, participants were interviewed separately. The students who
consented for the interview (with parent consent) were interviewed for approximately 30
minutes at their homes. In most cases parents were present while the students were
interviewed because this was their preference.
The interviews started with an informal chat with the student about their interests
and family to make them feel at ease. Students who chose to communicate in English
were interviewed in English and those who preferred to be interviewed in Malayalam were
interviewed in Malayalam. All the interviews were recorded with the students’ permission
using an iPhone. Parent consent forms for student interview and student interview
consent forms are provided as Appendix I.
3.9.3 Data collection from parents
The parents of all students who completed the questionnaire and the achievement
test in the study were sent the parent questionnaire through the students via the class
teachers. It was expected that parents would have taken about 20 minutes to complete
the questionnaire. The parents were asked to return the completed questionnaire to their
FACTORS INFLUENCING MATHEMATICS ACHIEVEMENT OF SECONDARY SCHOOL STUDENTS IN INDIA 76
child’s class teacher in a sealed envelope addressed to the researcher for confidentiality
purposes. The parents were given a week to return the questionnaire to the school with
their child after which they were collected from the school by the researcher. Reminders
were sent through students for non returns. Of the 120 parents who consented, 118 (98.3
%) parents participated in the study. The parent consent form for the questionnaire is
provided in Appendix I.
3.9.4 Parent interviews
The parents who indicated their willingness to participate in an interview were asked
to give their consent by signing the consent form (provided in Appendix I) and returning
it to the school with their child. The parent (either father or mother) of the selected
student interviewees was interviewed at their home straight after their child was
interviewed. The parent interviews took approximately 20-30 minutes. Only on one
occasion was the student participant present during the parent interview. All the
interviews started with an informal chat about the family and participants’ interests to
put the interviewee at ease. The parents who preferred to be interviewed in English were
interviewed in English and those who chose to communicate in Malayalam were
interviewed in Malayalam. All the interviews were audio recorded using an iPhone.
3.10 Summary
This chapter has addressed the research design used in the study. An explanation of
the instruments used for data collection for both students and parents was provided. A
description of the participants and data collection procedures for both questionnaires,
achievement test, and interviews was provided. The next chapter, Chapter 4, describes

FACTORS INFLUENCING MATHEMATICS ACHIEVEMENT OF SECONDARY SCHOOL STUDENTS IN INDIA 77
the data analysis approaches adopted in the study.

FACTORS INFLUENCING MATHEMATICS ACHIEVEMENT OF SECONDARY SCHOOL STUDENTS IN INDIA 78
CHAPTER 4 DATA ANALYSIS PLAN
4.1 Introduction
This chapter describes the procedures associated with data analyses employed in the
study. Descriptive and measurement analyses were used to describe the nature of student
data from the student questionnaire and the achievement test, and parent data obtained
from the parent questionnaire. The hypothesised relationships among the studied
variables were explained using inferential data analysis techniques. The interview data
were analysed using content text analysis. The chapter first describes the quantitative
data analysis steps, followed by the steps in the analysis of the qualitative data obtained
in the study.
4.2 Analysis of quantitative data
The data from all the measures of student and the parent questionnaires were
analysed according to the analysis plan shown in Figure 4.1.
In accordance with the analysis plan, the first step was to prepare the data for
analysis. The prepared student and parent data were subjected to Rasch measurement
analysis separately. In the next step, the Rasch estimates for person ability were
calculated for students and parents. The student and parent data were then collated and
the multivariate normality was checked for further analysis. As shown in the analysis
plan (Figure 4.1), Rasch analysed variables were then compared using multivariate
analysis of variance (MANOVA) and the structural relationships were established using
structural equation modeling.
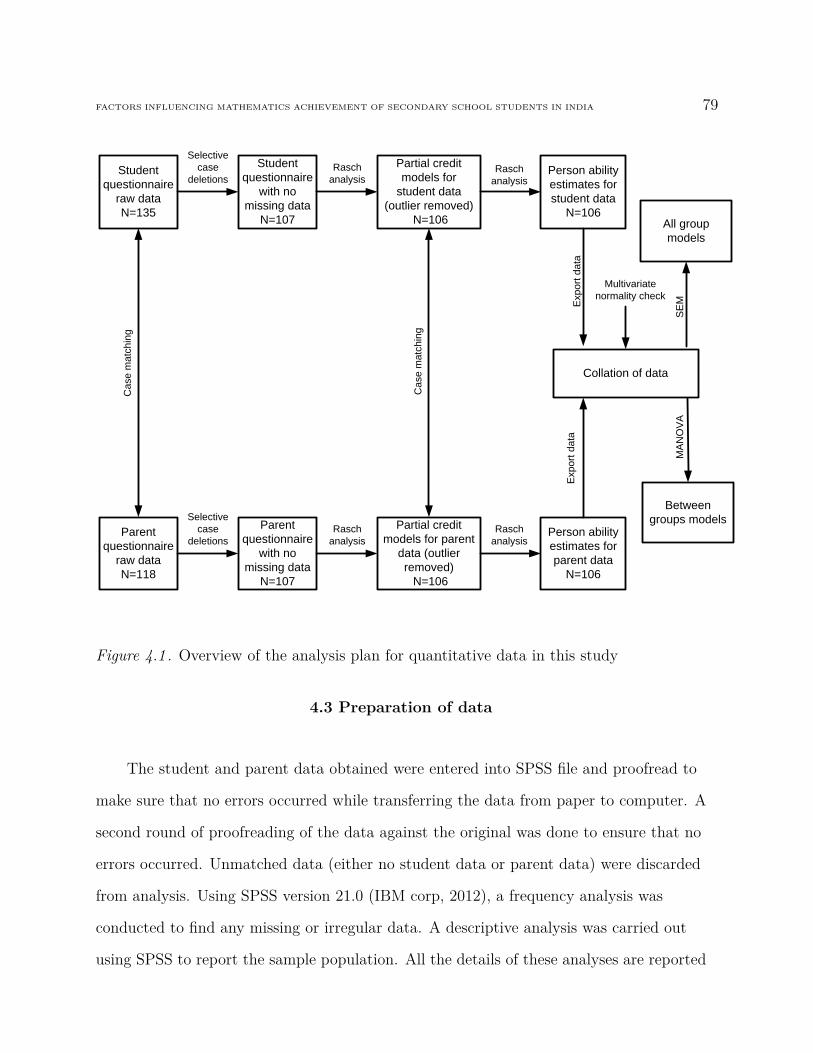
FACTORS INFLUENCING MATHEMATICS ACHIEVEMENT OF SECONDARY SCHOOL STUDENTS IN INDIA 79
Student questionnaire
with no missing data
N=107
Partial credit models for
student data (outlier removed)
N=106
Person ability estimates for student data
N=106
Student questionnaire
raw data N=135
Selective case
deletionsRasch
analysis
Exp
ort d
ata
Parent questionnaire
with no missing data
N=107
Partial credit models for parent
data (outlier removed) N=106
Person ability estimates for parent data
N=106
Parent questionnaire
raw data N=118
Selective case
deletionsRasch
analysis
Rasch analysis
Rasch analysis
Cas
e m
atch
ing
Collation of data
Exp
ort d
ata
All group models
Between groups models
SE
MM
AN
OVA
Cas
e m
atch
ing
Multivariate normality check
Figure 4.1 . Overview of the analysis plan for quantitative data in this study
4.3 Preparation of data
The student and parent data obtained were entered into SPSS file and proofread to
make sure that no errors occurred while transferring the data from paper to computer. A
second round of proofreading of the data against the original was done to ensure that no
errors occurred. Unmatched data (either no student data or parent data) were discarded
from analysis. Using SPSS version 21.0 (IBM corp, 2012), a frequency analysis was
conducted to find any missing or irregular data. A descriptive analysis was carried out
using SPSS to report the sample population. All the details of these analyses are reported
FACTORS INFLUENCING MATHEMATICS ACHIEVEMENT OF SECONDARY SCHOOL STUDENTS IN INDIA 80
in the next chapter, Chapter 5. The next section of this chapter details the analysis
procedures used to describe the data fit to the Rasch model and their performance.
4.4 The Rasch models
Measuring a latent trait (a complex behaviour or concept that can’t be observed
directly) with precision has been a crucial issue in social science research. Generally,
these concepts or behaviours are measured using questionnaires, with items describing the
various aspects of the trait under study. The participants indicate their level of agreement
with each statement by means of raw score. Because the raw score is an ordinal measure
indicating a possible measure of the latent trait, it has little inferential value, and
comparisons about the latent trait under study are difficult (Bond & Fox, 2007).
The introduction of Rasch family of measurement models (Rasch, 1960, 1980; Bond
& Fox, 2007) solved the problem and provided a stronger basis for comparisons. Rasch
measurement models allow the researcher to produce real interval measures and the
Rasch person ability estimates and the item difficulty estimates generated can be used for
further statistical analysis (Bond & Fox, 2007). In the Rasch models based on the
performance of persons and items, a set of measures are produced which define the
position of persons and items on the same measurement scale. This provides an interval
scale in units of logits, the logarithm of the odds of success (Bond & Fox, 2007). The
participants’ data from the student questionnaire and parent questionnaire in this study
were ordinal. Rasch measurement models were used to produce interval measures
allowing better comparisons and more meaningful interpretation. The Rasch modelling
software Winsteps version 3.75.1 was used in this study (Linacre, 2012).
FACTORS INFLUENCING MATHEMATICS ACHIEVEMENT OF SECONDARY SCHOOL STUDENTS IN INDIA 81
4.4.1 Partial Credit Models
The student and parent data in the present study were analysed using the Partial
Credit Model (PCM) (Masters, 1982), an extended version of the Rating Scale Model
(RSM) (Andrich, 1978). The study used 5-point Likert scales with the categories
Strongly Disagree, Disagree, Undecided, Agree, and Strongly Agree indicating increasing
amounts of ability (or agreement). The partial credit model was used to analyse all the
scales in the study because all the five response categories for each item provided in the
response form for the scales, might not have been used by the respondents in the chosen
sample (Bond & Fox, 2007).
The PCM can be expressed as:
log[
Pnik
Pni(k−1)
]= Bn −Dik
where
Pnik is the probability that person n, on encountering item i would respond in
category k,
Pni(k−1) is the probability that response would be in the category k − 1,
Bn is the type of attitude or ability of person n,
Dik is the difficulty of item i, but re-parameterised to include threshold variation, k
of item i, and where n = 0, (Linacre, 2004, p.259-260).
4.4.2 Assumptions of Rasch model
Rasch models are supported by three underlying assumptions. The first assumption
requires that the variable under study should be a one-dimensional construct (Bond &
Fox, 2007). Uni-dimensionality means that one latent trait will be measured at a time
FACTORS INFLUENCING MATHEMATICS ACHIEVEMENT OF SECONDARY SCHOOL STUDENTS IN INDIA 82
(Bond & Fox, 2007; Mueller, 2006). The second assumption of the Rasch model is that
latent variable studied is measurable by a linear measure where a greater amount of the
construct is represented by greater value. Finally, the third assumption requires that the
items measuring the construct are independent of each other (Bond & Fox, 2007). In
other words, items should be designed in such a way that getting a later correct answer is
independent of an earlier correct answer. An instrument could be an efficient
measurement tool if the items comprising the instrument fulfil the above assumptions.
4.4.3 Data fit
Rasch models provide the fit statistics to test the assumption of uni-dimensionality.
The fit statistics (infit and outfit statistics) indicate the extent to which the expected and
observed pattern of responses match (Bond & Fox, 2007; Linacre, 2004). Rasch modelling
software Winsteps (Linacre, 2012) generates fit measures for persons and items, estimates
of item difficulty and person ability, and the person and item reliability indices. The
steps involved in the Rasch analysis of the scales used in the study were estimations of
the overall data fit along with the fit of individual scales and the calibration of person
abilities and item difficulties (Bond & Fox, 2007).
Fit data were obtained by fitting the data from the instruments to the Rasch model.
Well fitted data meant that the instruments used in the study satisfied the basic
assumptions of the Rasch model. Items that departed from the assumptions of the model
would show up in fit statistics. The item fit statistics included item infit and outfit mean
squares and infit and outfit t values. Mean squares are the unstandardised form of the fit,
and t values are the standardised form of the fit. The expected t value of zero and
standard deviation of 1 are recommended for overall fit of the data to the model (Wright

FACTORS INFLUENCING MATHEMATICS ACHIEVEMENT OF SECONDARY SCHOOL STUDENTS IN INDIA 83
& Stone, 1979). For misfitting items, the weighted t value was reported as the estimate of
the items on a scale of -2 and +2 (Bond & Fox, 2007; Linacre, 2004). Items having infit
and outfit t values of more than +2 or less than -2 are considered as poor fitting items
(Bond & Fox, 2007).
4.4.4 Variable map
A variable map or Wright map provided a visual representation of the persons and
items based on the level of their ability and difficulty. Both persons and items were
shown on the same logit scale. The logit scale represents “an interval scale in which the
intervals between the locations on the person-item map have a consistent value or
meaning” (Bond & Fox, 2007, p. 318). Using the logit scale of measurement, the item
difficulty was checked against person ability to understand the nature of the variables in
the study. Persons were represented on the left hand side and the items at the right hand
side in the map. The mean of the items and persons were represented in the map as ‘M’,
one standard deviation as ‘S’, and two standard deviations as ‘T’. The easiest items were
located at the bottom of the scale and most difficult items at the top of the scale (Bond
& Fox, 2007). Figure 4.2 shows a variable map generated by Winsteps.
The Rasch measurement model generates reliability indices that enable the
researcher to understand the spread of the items and persons on the logit scale. The
person reliability index provides a measure of consistency in person ordering if a parallel
set of items were given to the sample to measure the same construct (Bond & Fox, 2007;
Linacre, 1997). Similarly, the item reliability index provides an estimate of the
consistency of the item spread in the scale, if the same set of items were administered to
another sample of the same size with similar characteristics (Linacre, 1997). The person
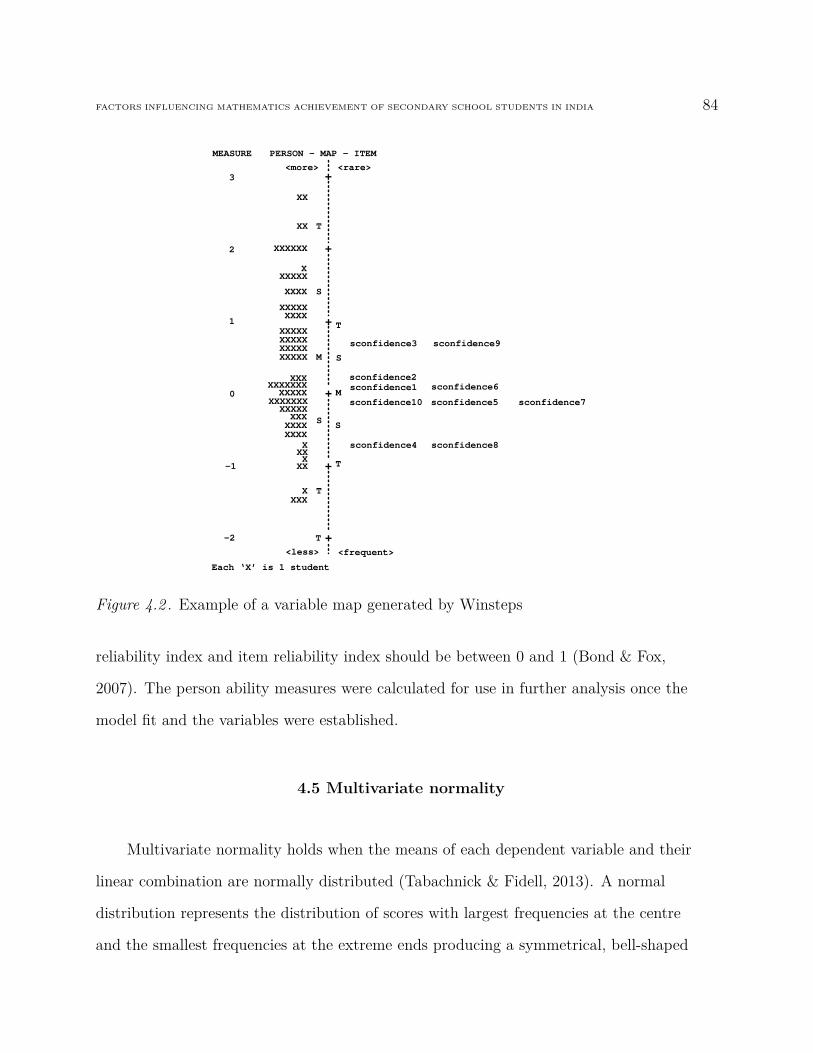
FACTORS INFLUENCING MATHEMATICS ACHIEVEMENT OF SECONDARY SCHOOL STUDENTS IN INDIA 84
+
+
+
+
+
+
<more> <rare>
PERSON – MAP - ITEM
XXXX
X
S
T
M
S
S
XXXX
T
S
<less> <frequent>
Each ‘X’ is 1 student
MEASURE
3
2
1
0
-1
-2
XX
T
XX T
XXXXXX
XXXXX
XXXX
XXXXX
XXXXXXXXXXXXXXXXXXXX
XXXXXXXXXXXX
XXX
M
XXXXXXXXXXXXXXXXXXXXXXX
XXXXXX
T
sconfidence3
sconfidence2sconfidence1
sconfidence10
sconfidence4 sconfidence8
sconfidence5
sconfidence6
sconfidence9
sconfidence7
Figure 4.2 . Example of a variable map generated by Winsteps
reliability index and item reliability index should be between 0 and 1 (Bond & Fox,
2007). The person ability measures were calculated for use in further analysis once the
model fit and the variables were established.
4.5 Multivariate normality
Multivariate normality holds when the means of each dependent variable and their
linear combination are normally distributed (Tabachnick & Fidell, 2013). A normal
distribution represents the distribution of scores with largest frequencies at the centre
and the smallest frequencies at the extreme ends producing a symmetrical, bell-shaped

FACTORS INFLUENCING MATHEMATICS ACHIEVEMENT OF SECONDARY SCHOOL STUDENTS IN INDIA 85
curve. The assumption of normality was essential to avoid Type 1 error. Type 1 error is
rejecting the null hypothesis, when in reality it is true (Frick, 1996; Nickerson, 2000). A
test of significance called multivariate analysis of variance (MANOVA) was based on
multivariate normal distribution and was sensitive to outliers which produce Type 1 error.
Multivariate normality could be supported by the calculation of Mahalanobis
distance (Pallant, 2013; Tabachnick & Fidell, 2013). The Mahalanobis distance indicates
the distance of any one case from the centroid of the rest of the cases, where the centroid
is the intersection point of the means of all the variables (Tabachnick & Fidell, 2013).
Any case with an irregular score pattern will be picked up by this analysis. To check
whether a case was an outlier or not, the Mahalanobis distance needed to be compared
with the chi-square critical value table. If the maximum value for the overall
Mahalanobis distance score (mah_1 score as in SPSS file) was greater than the critical
value, then the case was regarded as an outlier (Pallant, 2013).
4.6 Multivariate analysis of variance
Multivariate analysis of variance (MANOVA) is used to compare groups when there
was more than one dependent variable in the study (Tabachnick & Fidell, 2013).
MANOVA provided information on whether the groups differed significantly on a linear
combination of the dependent or outcome variables. In MANOVA, the emphasis is on the
mean differences and the groups are compared on the basis of means on linear
combination of the outcome variables. The variables in the present study, including
attitude towards mathematics, mathematics anxiety and parental involvement were
compared using MANOVA, the results of which are reported in the next chapter.
Multivariate statistics to test significant differences among groups on the composite
FACTORS INFLUENCING MATHEMATICS ACHIEVEMENT OF SECONDARY SCHOOL STUDENTS IN INDIA 86
dependent variable in MANOVA include Wilkis’Lambda, Pillai’s Trace, Hotelling’s trace,
and Roy’s greatest characteristic root (gcr) criterion. In situations where two groups are
compared, the F test for Wilkis’ Lambda, Pillai’s Trace, and Hotelling’s Trace are
identical. A ‘p’ value less than .05 for the selected statistic indicates significant
differences among the groups. Effect size indicates the amount of variance in the
dependent variable predicted by the independent variable (Pallant, 2013; Tabachnick &
Fidell, 2013). The most common effect size statistics are partial eta squared and Cohen’s
d. Partial eta squared explains the proportion of variance in the dependent variable
based on the independent variable and the value of partial eta squared ranges from 0 to 1
(Pallant, 2013; Tabachnick & Fidell, 2013). Cohen’s d indicates the group mean
differences in terms of standard deviation units (Tabachnick & Fidell, 2013). The present
study reported partial eta squared as the effect size statistic as it was the commonly
reported statistic generated by SPSS program.
4.7 Structural equation modeling
Structural equation modeling (SEM) employs a confirmatory approach to data
analysis rather than an exploratory one. Thus it helps in the analysis of complex and
multidimensional relationships simultaneously and completely (Ullman, 2013). Secondly,
SEM helps in examining the relationships between variables free of measurement errors.
The SEM analysis indicates only the common variance, as the errors had been estimated
and removed (Byrne, 2010). Thirdly, SEM procedures help in integrating both observed
and latent variables in the data analysis as opposed to other methods which used only
observed variables (Byrne, 2010). Finally, SEM approaches help in testing multivariate
relationships (Byrne, 2010). The present study adopted SEM procedures for these
reasons.
FACTORS INFLUENCING MATHEMATICS ACHIEVEMENT OF SECONDARY SCHOOL STUDENTS IN INDIA 87
The important steps involved in structural equation modeling are model
specification, identification and estimation, and model modification. The SEM computer
software AMOS 20.0.1 (Analysis of Moment Structures) (Arbuckle, 2012) was used in
this study. The steps involved in SEM are discussed in the following sections.
4.7.1 Model specification
The first step in SEM involves model specification which means the development of
models predicting relationships among variables and the indicators that best measure the
latent variables. First, the measurement model showing relationships of the indicator
variables to the unobserved variables have to be specified (Bollen, 1989). Once the
measurement model has been specified, the next step is to specify the structural model
by adding variables and more parameters.
4.7.2 Model identification
Model identification involves the process of checking whether a unique solution for
the unknown parameters in the model can be estimated. A model is considered as just
identified if the number of unknown parameters and the data points (i.e., variances and
covariance of the observed variables) are equal (Ullman, 2006). An under-identified model
is one having more unknown parameters than the data points (Byrne, 2010). Finally, an
over identified model has more data points than the number of parameters (Byrne, 2010).
FACTORS INFLUENCING MATHEMATICS ACHIEVEMENT OF SECONDARY SCHOOL STUDENTS IN INDIA 88
4.7.3 Model estimation and evaluation
The next step after the model specification and identification involves estimating the
unknown parameters in the model and evaluating the model fit. The most commonly used
estimation method for SEM is Maximum Likelihood (ML) estimation. A variety of fit
measures generated by AMOS output are used to assess the fit of the model to the data.
The most commonly used fit indices are chi-square (χ2), Comparative fit index (CFI),
Goodness-of-fit index (GFI), incremental fit index (IFI), and root mean squared error of
approximation (RMSEA) as recommended by Byrne (2001) and Hu and Bentler (1999).
In SEM, the difference between the sample covariance matrix S and the implied
covariance matrix Σ(θ) is expressed as the chi-square (χ2) statistic (Byrne, 2010). All
other things being equal, the chi-square statistic is sensitive to sample size. Thus the
chi-square ratio (χ2/df) value (df means degrees of freedom) is also taken into account to
assess the model fit (Bollen, 1989), as the ratio is less influenced by size of the sample.
The chi-square ratio values less than 2.00 are considered as acceptable for good fit
(Bollen, 1989; Hu & Bentler, 1999; Ullman, 2006).
The measure of comparison between the independent model and the empirical model
is represented by Normed fit index (NFI) in SEM. With smaller samples, NFI is found to
underestimate the fit of the model (Byrne, 2010). A revised fit index called Comparative
Fit Index (CFI) which takes into account the sample size can be used (Byrne, 2001,
2010). A CFI value of 0.95 or above is considered as acceptable for well fitting model
(Byrne, 2010). The Incremental Index of Fit (IFI) provides an improved measure of fit
over NFI taking into consideration the issue of sample size and parsimony (Byrne, 2010).
The IFI value of 0.95 and above is considered acceptable for a good fitting model.

FACTORS INFLUENCING MATHEMATICS ACHIEVEMENT OF SECONDARY SCHOOL STUDENTS IN INDIA 89
The Goodness-of-Fit Index (GFI) measures the quantity of sample variance and
covariance as explained by the population covariance matrix (Byrne, 2010). GFI is
considered as an absolute index of fit as the hypothesized model is not compared with
any other model (Byrne, 2010). GFI values range from 0 to 1 and values close to 1.00
indicate a good fitting model (Byrne, 2010).
The Root Mean Square Error of Approximation (RMSEA) estimates the lack of fit
of a model in comparison with the perfect or saturated model (Ullman, 2013). RMSEA
values of 0.06 or less suggest a good fitting model (Hu & Bentler, 1995). Values of
RMSEA from 0.08 to 0.10 indicate a moderate fitting model and values greater than 0.01
suggest a poor fitting model (Browne & Cudek, 1993; MacCallum, Browne, & Sugawara,
1996).
4.7.4 Model modification
This step involves modification of the models to correct the poor fit. AMOS provides
a number of indices which suggest the ways the model could be improved. These include
setting or freeing parameters, which can be done with strong theoretical grounds.
4.8 Multi-group analysis
In estimating the structural equation model, there are two different approaches as
recommended by Anderson and Gerbing (1988); evaluation of the measurement model
and the evaluation of the structural model separately. Testing the measurement model
for equivalence includes assessing factorial invariance across groups (Vandenberg &
Lance, 2000). Measurement invariance tests are essential in comparing groups (Byrne &
FACTORS INFLUENCING MATHEMATICS ACHIEVEMENT OF SECONDARY SCHOOL STUDENTS IN INDIA 90
Watkins, 2003; Widaman & Reise, 1997) and the tests evaluate whether the same factors
are being measured across the groups. Multi-group confirmatory factor analysis
(MGCFA) was used to test measurement invariance. In MGCFA, a number of nested
models are tested, adding increasingly stricter constraints, reflecting more and tighter
levels of cross-group invariance (Crockett, Veed, & Russell, 2010).
The first in the series of tests for measurement invariance is configural invariance.
Configural invariance is used to examine whether the factor structure is same for both
males and females (Bollen, 1989; G. W. Cheung & Rensvold, 2002). Once configural
invariance is established, the next one is metric (weak) invariance. In metric invariance
testing it is determined whether the items have the same relative contribution to the
measure across the groups (Crockett et al., 2010). After achieving metric invariance the
model is tested for scalar invariance, with equality of factor loadings and intercepts across
the groups. The invariance of error variance is tested next with factor loadings, item
intercepts and error variances constrained to equal for both boys and girls. It should be
noted that the test of invariance of error variance is not considered as an essential
requirement for comparing groups (Byrne, 2001).
Once the metric and scalar invariance had been established, it was necessary to
examine whether the latent means across the groups are invariant. As direct estimation
of latent means is not possible, latent means differences across the gender groups are
tested by keeping the male group as the reference group with a latent mean of zero
(Hancock, 1997). Partial invariance is also possible in each step, when some of the
components are not invariant across the groups (Byrne, Shavelson, & Muthen, 1989;
Vandenberg & Lance, 2000).
The hypothesised measurement model for the study is shown in Figure 4.3. The
FACTORS INFLUENCING MATHEMATICS ACHIEVEMENT OF SECONDARY SCHOOL STUDENTS IN INDIA 91
latent variable mathematics anxiety was constructed from three indicators: students’
report of their anxiety (sanxiety), their confidence in learning mathematics (sconfidence),
and their effectance motivation (smotivation). The second latent variable, attitude
towards mathematics, was constructed from four indicators namely, students’ report of
their general attitude towards maths and success in mathematics (sattitude), students’
report of the usefulness of mathematics (susefulness), students’ report of their parents’
attitude towards maths and child’s maths study (sparentattitude), and parents’ report of
their own attitude towards maths and child’s maths study (pattitude). The third latent
variable parental involvement was built from four indicators, students’ report of their
parents’ behaviours in relation to child’s maths learning (sparentbeh), parents’ report of
their own behaviours in relation to child’s maths learning (pparentbeh), their
mathematics anxiety (panxiety), and their expectations of their child’s mathematics
learning and future education (pexpectation). The achievement test score for this study
was represented in the model as achievement measure.
Common method variance (CMV) indicates the variance arising from using the same
method to measure two or more constructs in a single study. To minimise the effects of
CMV, researchers generally use two remedial approaches - procedural or statistical. The
procedural approach involves collecting ratings from multiple informants and the
statistical approach involves controlling for a method factor (Podsakoff, MacKenzie, Lee,
& Podsakoff, 2013). The first reason to include the student measures and parent
measures was to minimise the bias due to common method variance (Podsakoff et al.,
2013). Secondly, the student and parent measures were considered together in this
study’s model to improve the stability of the model (Fox, 1980; Bentler & Freeman,
1983). The stability index should be between -1 and 1 for a model to stable (Ullman,
1996). The model shown in Figure 4.3 has a stability index within the acceptable range.
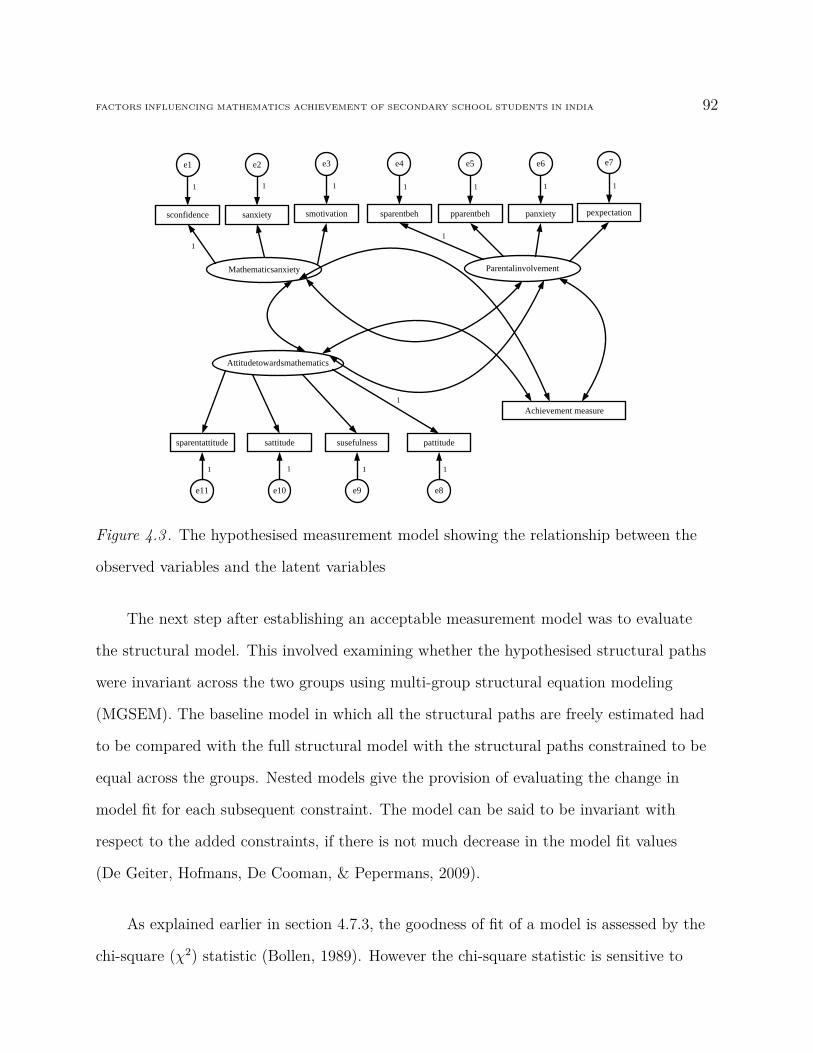
FACTORS INFLUENCING MATHEMATICS ACHIEVEMENT OF SECONDARY SCHOOL STUDENTS IN INDIA 92
Mathematicsanxiety
sconfidence
e1
sanxiety
e2
smotivation
e3
sparentbeh
e4
pparentbeh
e5
sparentattitude
e11
sattitude
e10
susefulness
e9
pattitude
e8
Achievement measure
1
panxiety
e6
pexpectation
e7
1
Attitudetowardsmathematics
Parentalinvolvement
1 1111
1 1 1 1
1
11
Figure 4.3 . The hypothesised measurement model showing the relationship between the
observed variables and the latent variables
The next step after establishing an acceptable measurement model was to evaluate
the structural model. This involved examining whether the hypothesised structural paths
were invariant across the two groups using multi-group structural equation modeling
(MGSEM). The baseline model in which all the structural paths are freely estimated had
to be compared with the full structural model with the structural paths constrained to be
equal across the groups. Nested models give the provision of evaluating the change in
model fit for each subsequent constraint. The model can be said to be invariant with
respect to the added constraints, if there is not much decrease in the model fit values
(De Geiter, Hofmans, De Cooman, & Pepermans, 2009).
As explained earlier in section 4.7.3, the goodness of fit of a model is assessed by the
chi-square (χ2) statistic (Bollen, 1989). However the chi-square statistic is sensitive to
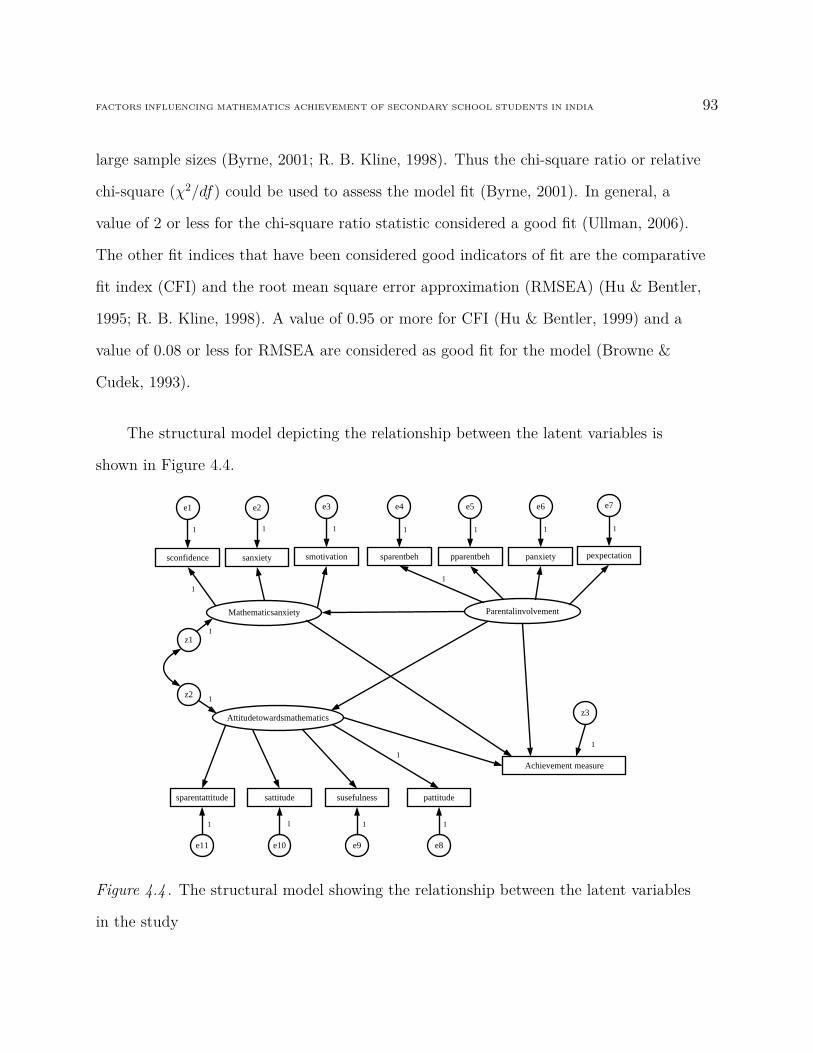
FACTORS INFLUENCING MATHEMATICS ACHIEVEMENT OF SECONDARY SCHOOL STUDENTS IN INDIA 93
large sample sizes (Byrne, 2001; R. B. Kline, 1998). Thus the chi-square ratio or relative
chi-square (χ2/df) could be used to assess the model fit (Byrne, 2001). In general, a
value of 2 or less for the chi-square ratio statistic considered a good fit (Ullman, 2006).
The other fit indices that have been considered good indicators of fit are the comparative
fit index (CFI) and the root mean square error approximation (RMSEA) (Hu & Bentler,
1995; R. B. Kline, 1998). A value of 0.95 or more for CFI (Hu & Bentler, 1999) and a
value of 0.08 or less for RMSEA are considered as good fit for the model (Browne &
Cudek, 1993).
The structural model depicting the relationship between the latent variables is
shown in Figure 4.4.
Mathematicsanxiety
sconfidence
e1
sanxiety
e2
smotivation
e3
sparentbeh
e4
pparentbeh
e5
sparentattitude
e11
sattitude
e10
susefulness
e9
pattitude
e8
Achievement measure
1
panxiety
e6
pexpectation
e7
1
Attitudetowardsmathematics
Parentalinvolvement
1 1111
1 1 1 1
1
11
z1
z2
z3
1
1
1
Figure 4.4 . The structural model showing the relationship between the latent variables
in the study

FACTORS INFLUENCING MATHEMATICS ACHIEVEMENT OF SECONDARY SCHOOL STUDENTS IN INDIA 94
In the case of nested models, the measure used to evaluate the difference in fit
between the models is the difference in χ2 (∆χ2) between the models with difference in
degrees of freedom (∆df) (Hoyle, 1995). A statistically significant value of ∆χ2 means
that there is significant difference in the compared models (Mattern & Schau, 2002).
Taking into consideration the sensitivity of ∆χ2 to non-normally distributed data
(Bollen, 1989; G. W. Cheung & Rensvold, 2002), another measure that has been
considered for evaluating the fit of nested models is difference in CFI (∆CFI)
(G. W. Cheung & Rensvold, 2002). A non-significant change in CFI (∆CFI) with a value
of less than 0.01 can used for testing the invariance (G. W. Cheung & Rensvold, 2002).
4.9 Analysis of qualitative data
The main aim of the qualitative data was to complement the quantitative findings of
this study. The interview data from students and parents in this study were transcribed
as text files and then imported to NVivo version 10.0 (QSR International, 2012). Data
from the interviews conducted in Malayalam were transcribed in Malayalam and then
translated to English. The interview transcripts were not reviewed by the participants
because the researcher was in Australia and contact details (email or postal address) were
not provided by the participants. The full interview transcripts of students and parents
were provided in Appendix K. The coded interview data were not included in the thesis.
Thematic analysis is usually used for analysing qualitative data; especially interview
data. A theme means a key idea emerging from the data (Willis, 2010). In certain cases,
themes emerge from the literature review and analysis involves exploring these themes
amongst the collected data (Fereday & Muir-Cochrane, 2006). In other cases, themes
emerge from repeated reading and coding of the interview data (Fisk & Neville, 2011;

FACTORS INFLUENCING MATHEMATICS ACHIEVEMENT OF SECONDARY SCHOOL STUDENTS IN INDIA 95
Patton, 1980). In this study the interview responses were first coded, by the researcher,
based on pre-determined themes based on the literature. The pre-determined themes
were maths attitude, usefulness of maths, maths anxiety, self-confidence, helps in maths
work, home work, parent behaviours, parent expectation, parent supervision, and
decision making. A second round of examination of the data resulted in coding based on
emerging themes from the data itself. The themes that emerged were future ambition,
teacher, and maths course. The interviews were conducted in Malayalam, the mother
tongue of the participants. So it was not feasible to use a second coder to check the
reliability. Extensive discussions were conducted with senior researchers in the faculty
before and after the coding of the interview data.
The next step in the qualitative analysis was the comparison among cases in the
study. Case comparisons enable the researcher to explore similarities and differences in
the phenomena under study demonstrated by the cases (Gibbs, 2002). To compare cases,
first the concepts related to the codes were identified. Secondly, the common themes
among the persons were compared (Miles & Huberman, 1994).
This section discussed the approaches employed for the analysis of interview data in
the study. The chapter as a whole explained the data analysis approaches adopted for the
quantitative and qualitative data in the study. The next chapter, Chapter 5, presents the
results of the study.
FACTORS INFLUENCING MATHEMATICS ACHIEVEMENT OF SECONDARY SCHOOL STUDENTS IN INDIA 96
CHAPTER 5 RESULTS OF THE STUDY
5.1 Introduction
This chapter describes the results of the study in terms of the descriptive statistics,
Rasch analysis results, results of an analysis of multivariate normality, multivariate
analysis of variance results, structural equation modeling results, and results from the
qualitative data analysis. The first section includes the details of the participating
students and parents. The next section includes the results of Rasch modelling, followed
by results of multivariate normality analysis and multivariate analysis of variance. The
remaining two sections deal with the structural equation modeling results and the
qualitative analysis results respectively.
5.2 Descriptive statistics
This section details the sample of the study, Year 9 and Year 11 students and their
parents, from a co-educational Catholic school in Kerala, India.
5.2.1 Student participants
As described in Chapter 3, a sealed envelope containing the parent consent forms for
student questionnaire and achievement test, student information sheet for the
questionnaire and the achievement test, and the parent questionnaire was sent home
through all the students in Year 9 and Year 11. After a week, the signed parental consent
forms for the child and the completed parent questionnaire in the sealed envelopes
addressed to the researcher were collected by the respective class teachers. Of the 135
FACTORS INFLUENCING MATHEMATICS ACHIEVEMENT OF SECONDARY SCHOOL STUDENTS IN INDIA 97
students who completed the questionnaire and the achievement test in their respective
classes, data from 107 students (79.3%) were used for further analysis in the study
because a parent also completed a questionnaire. Of the 107 students, 44 (41.1%) were
male and 63 (58.9%) were female. There were 63 (58.9%) students from Year 9 and 44
(41.1%) students from Year 11. The average age of the students was 14.89 years
(SD=1.03). Also the average age of Year 9 students was 14.08 years (SD=0.28) and that
of Year 11 students was 16 years (SD=0.48).
5.2.2 Parent participants
Parent questionnaires were sent home in a sealed envelope with all the students in
Year 9 and Year 11. Parents were asked to return the completed questionnaire within a
week to the respective class teachers. From the 118 parents who completed the
questionnaire, data from a total of 107 (90.7%) parents were used for further analysis in
the study, after matching with the student data. Of the 107 parents, 51 (47.7%) were
fathers and 54 (50.5%) were mothers. The remaining two were a grandmother and a
foster parent.
5.3 Results of Rasch analysis
This section describes the results obtained from fitting the data from the student
questionnaire and parent questionnaire to the Partial Credit Model (PCM). Winsteps
version 3.75.1 (Linacre, 2012) was used to generate the results.
FACTORS INFLUENCING MATHEMATICS ACHIEVEMENT OF SECONDARY SCHOOL STUDENTS IN INDIA 98
5.3.1 Student questionnaire data
The student questionnaire comprised eight subscales and the students were asked to
rate their agreement with each of the statements in the subscales on a 5-point Likert
scale with the choices Strongly Disagree, Disagree, Undecided, Agree, and Strongly
Agree. The two subscales attitude towards maths and success in mathematics
(sattitude) scale and usefulness mathematics (susefulness) scale measured the
construct attitude towards mathematics. The construct mathematics anxiety was
measured using the subscales, anxiety (sanxiety), confidence in learning mathematics
(sconfidence), and effectance motivation (smotivation) scale. Lastly, the three
subscales, parent behaviours (sparentbeh), parent attitudes (sparentattitude), and
parenting style (sparsty) were used to measure the students’perceptions of their parents’
involvement in their mathematics learning.
The reliability of the subscales used in this study was assessed by Cronbach alpha
reliability coefficient. A Cronbach alpha coefficient of 0.70 or greater was considered as
acceptable (Byrne, 2001; P. Kline, 1993; Pallant, 2013). In the present study, the student
questionnaire had a Cronbach alpha reliability coefficient of 0.92 for the whole scale and
the individual subscales had Cronbach alpha coefficients ranging from 0.60 to 0.83,
excluding parenting style (sparsty) scale. The parenting style (sparsty) scale with 15
items had a Cronbach alpha coefficient of 0.48 and was not found to influence any of the
other factors and therefore, removed from the analysis. Data from the remaining
subscales were subjected to Rasch analysis and the overall fit statistics were obtained. A
student with infit and outfit mean square of 5.99 and infit t value of 8.6 and an outfit t
value of 8.4 was found. These values were out of the acceptable range of mean square
value and the acceptable value of zero for the t statistics. Thus this student’s data from
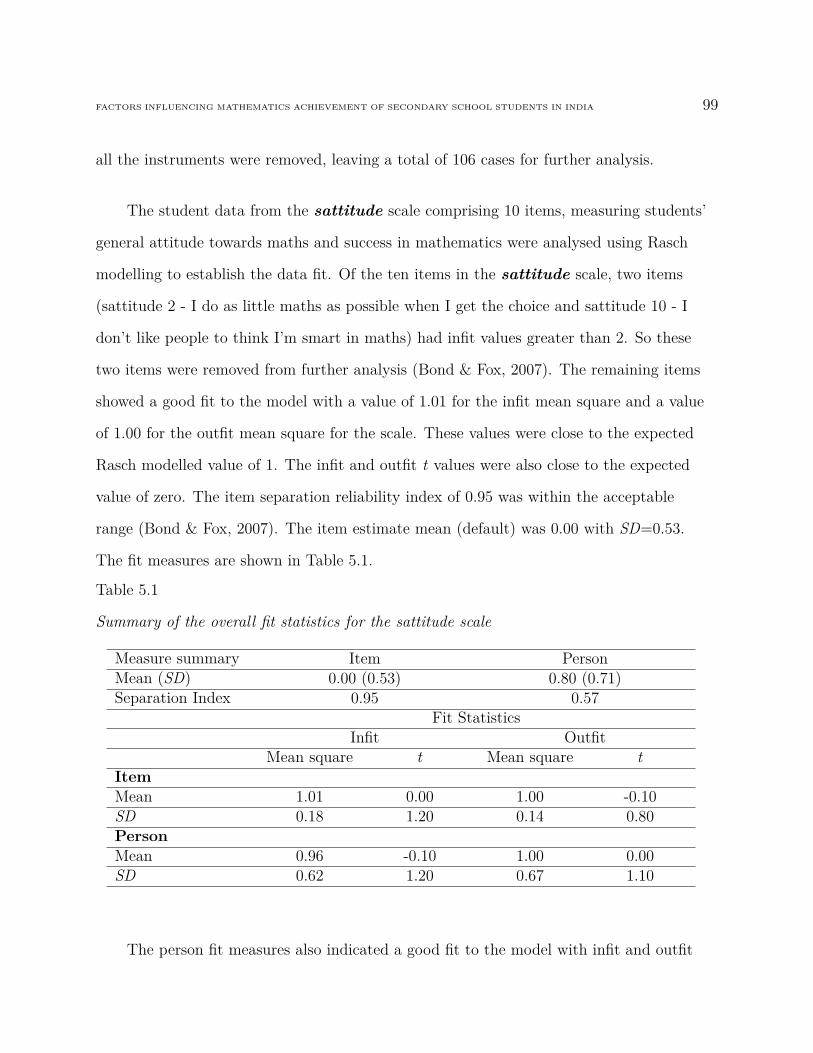
FACTORS INFLUENCING MATHEMATICS ACHIEVEMENT OF SECONDARY SCHOOL STUDENTS IN INDIA 99
all the instruments were removed, leaving a total of 106 cases for further analysis.
The student data from the sattitude scale comprising 10 items, measuring students’
general attitude towards maths and success in mathematics were analysed using Rasch
modelling to establish the data fit. Of the ten items in the sattitude scale, two items
(sattitude 2 - I do as little maths as possible when I get the choice and sattitude 10 - I
don’t like people to think I’m smart in maths) had infit values greater than 2. So these
two items were removed from further analysis (Bond & Fox, 2007). The remaining items
showed a good fit to the model with a value of 1.01 for the infit mean square and a value
of 1.00 for the outfit mean square for the scale. These values were close to the expected
Rasch modelled value of 1. The infit and outfit t values were also close to the expected
value of zero. The item separation reliability index of 0.95 was within the acceptable
range (Bond & Fox, 2007). The item estimate mean (default) was 0.00 with SD=0.53.
The fit measures are shown in Table 5.1.
Table 5.1
Summary of the overall fit statistics for the sattitude scale
Measure summary Item PersonMean (SD) 0.00 (0.53) 0.80 (0.71)Separation Index 0.95 0.57
Fit StatisticsInfit Outfit
Mean square t Mean square tItemMean 1.01 0.00 1.00 -0.10SD 0.18 1.20 0.14 0.80PersonMean 0.96 -0.10 1.00 0.00SD 0.62 1.20 0.67 1.10
The person fit measures also indicated a good fit to the model with infit and outfit

FACTORS INFLUENCING MATHEMATICS ACHIEVEMENT OF SECONDARY SCHOOL STUDENTS IN INDIA 100
mean square values of 0.96 and 1.00, close to the expected value of 1.00 in Rasch
modelling. The infit t value of -0.10 and the outfit t value of 0.00 were close to the
expected value of zero. The calculated person separation reliability index of 0.57 was low
compared to the acceptable range (Bond & Fox, 2007). The Cronbach alpha reliability
coefficient for persons was 0.67. The person estimate mean of 0.80 (SD=0.71) showed
that the sample of students found the items relatively easy to endorse (Bond & Fox,
2007; Phillipson, 2008). The variable map showing the distribution of items and persons
in the sattitude scale is given in Figure 5.1.
+
+
+
+
+
+
<more> <rare>
PERSON – MAP - ITEM
XXX
X
T
XXX
S
XXXXX
XXXXXXXXX
XXXXXXXX
XXXXXXXXX
T sattitude3
M
S
SMX
XXXXXXX
XXXXXXX
XXXXXXXXXXXXXXXXXX
XXXXXXXXXXXXXXXXXXXXXXXX sattitude1
sattitude5
XXXXX
XXX
XX
XT
S
sattitude7sattitude4sattitude8
sattitude9
sattitude6
<less> <frequent>
Each ‘X’ is 1 student
MEASURE
4
3
2
1
0
-1
Figure 5.1 . Variable map showing the distribution of items and persons for sattitude
scale
The items were represented on the right hand side based on their difficulty level.
The difficult items were placed on top of the scale and the easiest items at the bottom of

FACTORS INFLUENCING MATHEMATICS ACHIEVEMENT OF SECONDARY SCHOOL STUDENTS IN INDIA 101
the scale. The students were represented on the left hand side by x. For further analysis
the person ability measures were calculated.
The 8-item sattitude scale showed good fit to the Rasch model, and the item and
person separation reliabilities were acceptable. The Cronbach alpha reliability was 0.67.
These findings indicate that the items were working together in consistent ways to
provide a measurement scale that could be used to draw inferences about respondents.
The students found the items relatively easy to endorse, as shown by the discrepancy
between the item and person means. Of the items ‘Maths is the easiest subject at
school’(sattitude 3) was the most difficult for the students to support, located towards
the top of the scale.
The data from the susefulness scale with 10 items, measuring students’ perception
of the usefulness of mathematics were analysed to measure the fit. The overall fit
statistics showed acceptable fit as the fit measures were satisfactory. The item infit (1.03)
and outfit (1.01) mean square values showed an acceptable fit as the values were close to
1. The t values also indicated satisfactory fit with values 0.20 and 0.10. In addition, the
item estimate mean was 0.00 by default with a SD of 0.40. The separation reliability
index for item was 0.92 which was in the acceptable range (Bond & Fox, 2007). Table 5.2
shows the overall fit statistics for the susefulness scale.
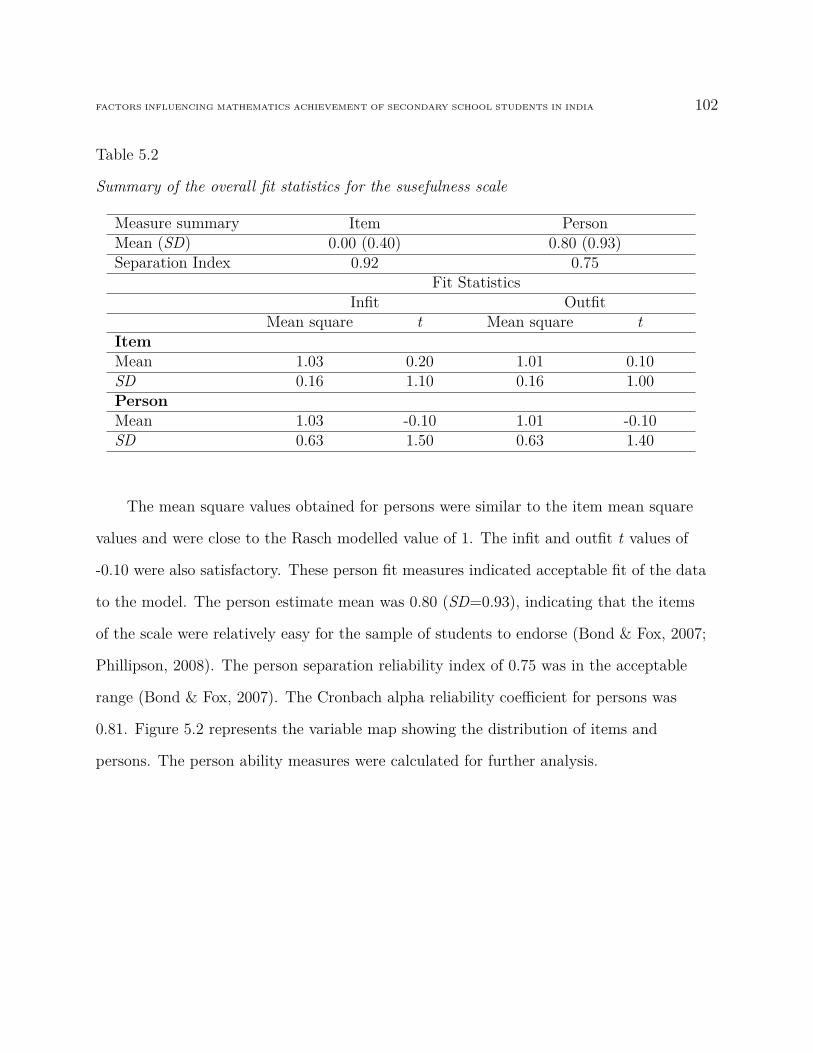
FACTORS INFLUENCING MATHEMATICS ACHIEVEMENT OF SECONDARY SCHOOL STUDENTS IN INDIA 102
Table 5.2
Summary of the overall fit statistics for the susefulness scale
Measure summary Item PersonMean (SD) 0.00 (0.40) 0.80 (0.93)Separation Index 0.92 0.75
Fit StatisticsInfit Outfit
Mean square t Mean square tItemMean 1.03 0.20 1.01 0.10SD 0.16 1.10 0.16 1.00PersonMean 1.03 -0.10 1.01 -0.10SD 0.63 1.50 0.63 1.40
The mean square values obtained for persons were similar to the item mean square
values and were close to the Rasch modelled value of 1. The infit and outfit t values of
-0.10 were also satisfactory. These person fit measures indicated acceptable fit of the data
to the model. The person estimate mean was 0.80 (SD=0.93), indicating that the items
of the scale were relatively easy for the sample of students to endorse (Bond & Fox, 2007;
Phillipson, 2008). The person separation reliability index of 0.75 was in the acceptable
range (Bond & Fox, 2007). The Cronbach alpha reliability coefficient for persons was
0.81. Figure 5.2 represents the variable map showing the distribution of items and
persons. The person ability measures were calculated for further analysis.
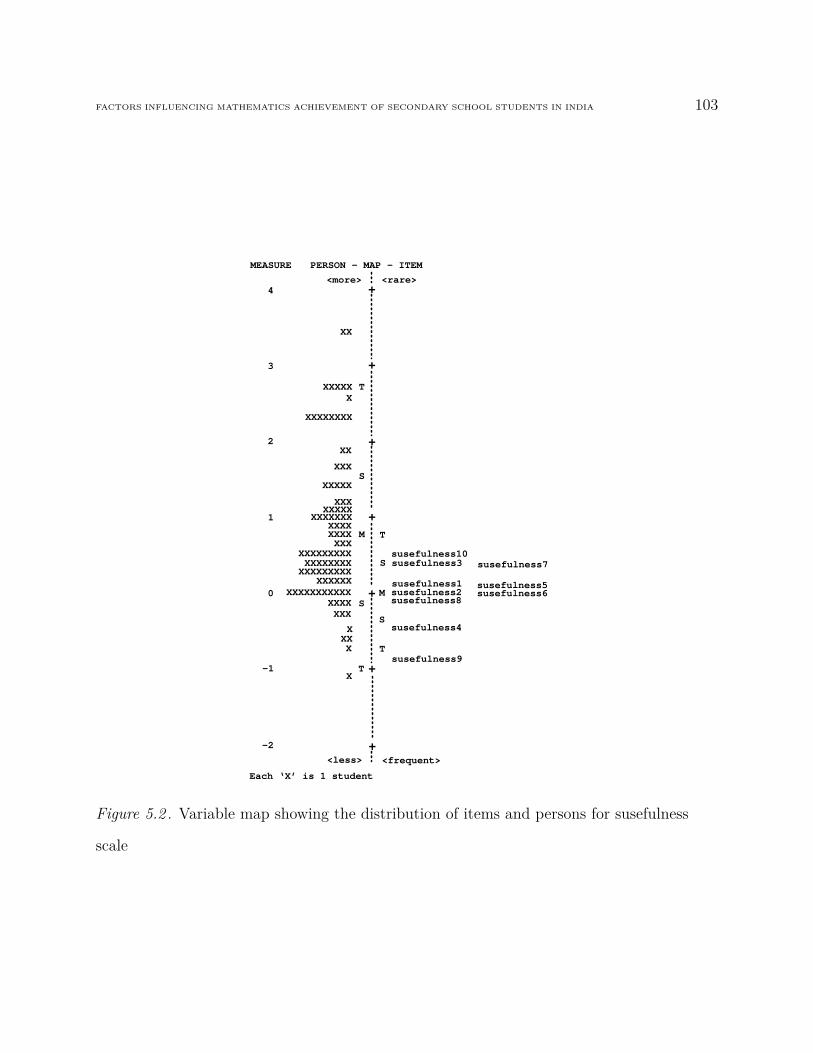
FACTORS INFLUENCING MATHEMATICS ACHIEVEMENT OF SECONDARY SCHOOL STUDENTS IN INDIA 103
+
+
+
+
+
+
<more> <rare>
PERSON – MAP - ITEM
XXXXXX
T
XX
S
XXXXXXX
XXXXXXXX
XXX
TM
S
SM
XXXXXX
XXXX
XXXXXXXXX
XXXX
X
XXX
XT
S
<less> <frequent>
Each ‘X’ is 1 student
MEASURE
4
3
2
1
0
-1
XX
XXXXX
XXXXXXXX
XXXXXXX
XXXXXXXXXXXXXXXXX
XXXXXXXXXXX
XXX
+-2
T
susefulness10susefulness3
susefulness1susefulness2susefulness8
susefulness4
susefulness9
susefulness7
susefulness5susefulness6
Figure 5.2 . Variable map showing the distribution of items and persons for susefulness
scale

FACTORS INFLUENCING MATHEMATICS ACHIEVEMENT OF SECONDARY SCHOOL STUDENTS IN INDIA 104
The 10-item susefulness scale showed good fit to the Rasch model, and the item and
person separation reliabilities were acceptable. The Cronbach alpha reliability was 0.81.
These findings indicate that the items were working together in consistent ways to provide
a measurement scale that could be used to draw inferences about respondents. The
students found the items relatively easy to endorse, as shown by the discrepancy between
the item and person means. The item ‘I expect to have little use for mathematics when I
get out of school’(susefulness 10) was the most difficult for the students to endorse.
The sconfidence scale with 10 items measured students’ confidence in learning
mathematics and the data were analysed to measure the fit of the data to the model.
Satisfactory overall fit statistics suggested good fit of the data to the model. The item
infit and outfit fit mean square values obtained were 1.02 and 1.00 respectively, close to
the expected value of 1. The infit t value of 0.10 and the outfit t value of 0.00 were also
acceptable as these values were close to zero. The item estimate mean by default was 0.00
with a SD of 0.46. The item separation reliability index of 0.94 was within the acceptable
range (Bond & Fox, 2007). The summary of the overall fit statistics is given in Table 5.3.
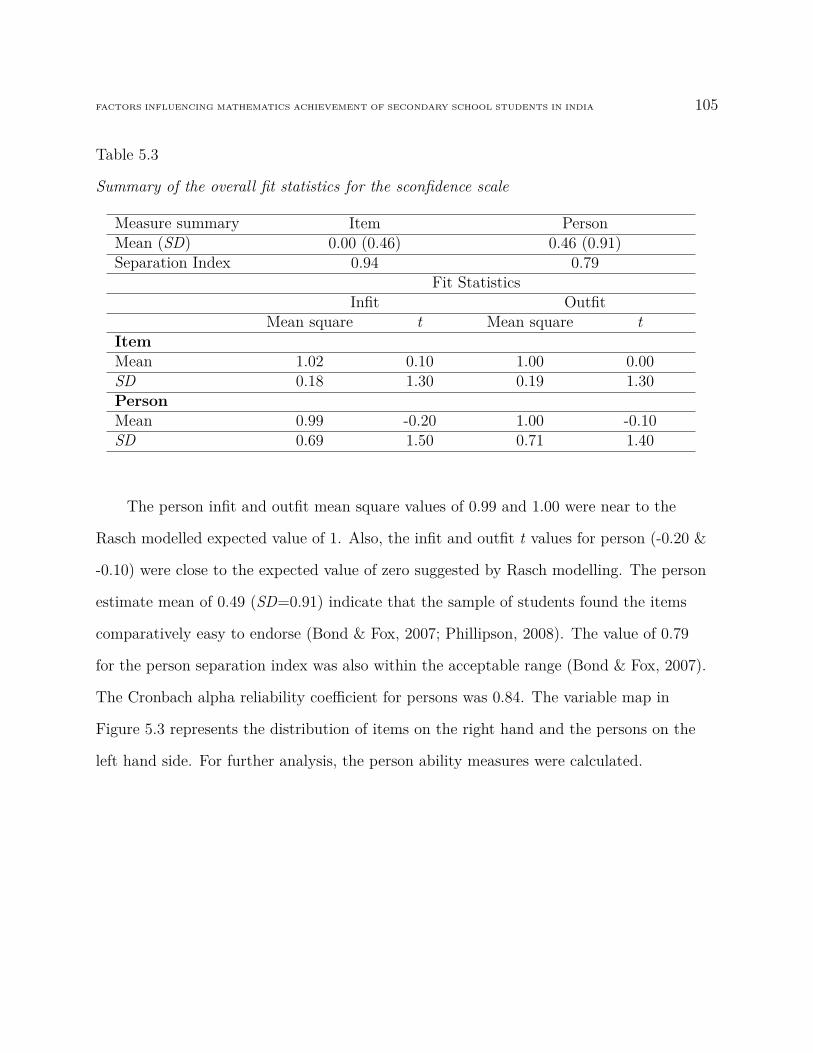
FACTORS INFLUENCING MATHEMATICS ACHIEVEMENT OF SECONDARY SCHOOL STUDENTS IN INDIA 105
Table 5.3
Summary of the overall fit statistics for the sconfidence scale
Measure summary Item PersonMean (SD) 0.00 (0.46) 0.46 (0.91)Separation Index 0.94 0.79
Fit StatisticsInfit Outfit
Mean square t Mean square tItemMean 1.02 0.10 1.00 0.00SD 0.18 1.30 0.19 1.30PersonMean 0.99 -0.20 1.00 -0.10SD 0.69 1.50 0.71 1.40
The person infit and outfit mean square values of 0.99 and 1.00 were near to the
Rasch modelled expected value of 1. Also, the infit and outfit t values for person (-0.20 &
-0.10) were close to the expected value of zero suggested by Rasch modelling. The person
estimate mean of 0.49 (SD=0.91) indicate that the sample of students found the items
comparatively easy to endorse (Bond & Fox, 2007; Phillipson, 2008). The value of 0.79
for the person separation index was also within the acceptable range (Bond & Fox, 2007).
The Cronbach alpha reliability coefficient for persons was 0.84. The variable map in
Figure 5.3 represents the distribution of items on the right hand and the persons on the
left hand side. For further analysis, the person ability measures were calculated.

FACTORS INFLUENCING MATHEMATICS ACHIEVEMENT OF SECONDARY SCHOOL STUDENTS IN INDIA 106
+
+
+
+
+
+
<more> <rare>
PERSON – MAP - ITEM
XXXX
X
S
T
M
S
S
XXXX
T
S
<less> <frequent>
Each ‘X’ is 1 student
MEASURE
3
2
1
0
-1
-2
XX
T
XX T
XXXXXX
XXXXX
XXXX
XXXXX
XXXXXXXXXXXXXXXXXXXX
XXXXXXXXXXXX
XXX
M
XXXXXXXXXXXXXXXXXXXXXXX
XXXXXX
T
sconfidence3
sconfidence2sconfidence1
sconfidence10
sconfidence4 sconfidence8
sconfidence5
sconfidence6
sconfidence9
sconfidence7
Figure 5.3 . Variable map showing the distribution of items and persons for sconfidence
scale
The 10-item sconfidence scale in this study showed good fit to the Rasch model, and
item and person separation reliabilities were acceptable. The Cronbach alpha reliability
was 0.84. These findings indicate that the items were working together in consistent ways
to provide a measurement scale that could be used to draw inferences about respondents.
The students found the items comparatively easy to support, as shown by the
discrepancy between the item and person means. The items ‘I think I can handle difficult
mathematics’(sconfidence 3) and ‘For some reason even though I study hard, mathematics
is difficult for me’(sconfidence 9) were more difficult for the students to endorse.
The student data from the sanxiety scale with 10 items, measuring students’

FACTORS INFLUENCING MATHEMATICS ACHIEVEMENT OF SECONDARY SCHOOL STUDENTS IN INDIA 107
anxiety in mathematics was analysed using Rasch modeling to establish the data fit. The
item sanxiety 5 had an infit value of 2.78 and was removed from further analysis (Bond &
Fox, 2007). The overall fit statistics for the sanxiety scale with 9 items measuring
students’ anxiety in maths were satisfactory indicating a good fit of the data to the
model. The item infit and outfit mean square values of 1.02 were near to the Rasch
modelled expected value of 1.00. The infit and outfit t value of 0.10 for item was also
close to the expected value of zero in Rasch modelling suggesting a good fit of the data to
the model. The item mean estimate was 0.00 (default) with a SD of 0.32. The item
separation reliability index of 0.88 was within the acceptable range (Bond & Fox, 2007).
The summary of the overall fit statistics is given in Table 5.4.
Table 5.4
Summary of the overall fit statistics for the sanxiety scale
Measure summary Item PersonMean (SD) 0.00 (0.32) 0.30 (0.94)Separation Index 0.88 0.79
Fit StatisticsInfit Outfit
Mean square t Mean square tItemMean 1.02 0.10 1.02 0.10SD 0.15 1.20 0.17 1.20PersonMean 1.01 -0.20 1.01 -0.10SD 0.71 1.50 0.71 1.50
The infit and outfit mean square values of 1.02 for person were in the expected range
of Rasch modelled value of 1.00. The infit and outfit t values were also close to the
expected value of zero. The calculated person separation reliability index of 0.79 was in
the expected range (Bond & Fox, 2007). The Cronbach alpha reliability coefficient for
persons was 0.85. The person estimate mean with a value of 0.30 suggested that the
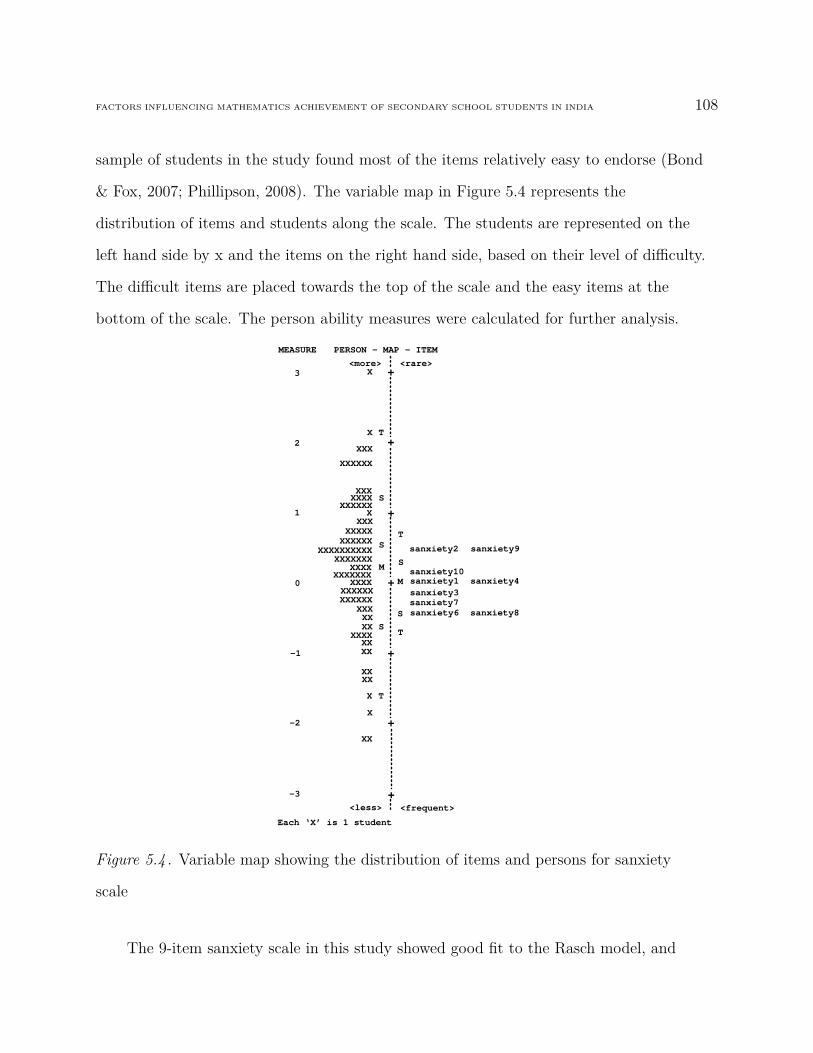
FACTORS INFLUENCING MATHEMATICS ACHIEVEMENT OF SECONDARY SCHOOL STUDENTS IN INDIA 108
sample of students in the study found most of the items relatively easy to endorse (Bond
& Fox, 2007; Phillipson, 2008). The variable map in Figure 5.4 represents the
distribution of items and students along the scale. The students are represented on the
left hand side by x and the items on the right hand side, based on their level of difficulty.
The difficult items are placed towards the top of the scale and the easy items at the
bottom of the scale. The person ability measures were calculated for further analysis.
+
+
+
+
+
+
<more> <rare>
PERSON – MAP - ITEM
ST
M S
S
M
X
XX
X
T
S
<less> <frequent>
Each ‘X’ is 1 student
MEASURE
3
2
1
0
-1
-2
+-3
T
sanxiety2
X
X T
XXX
XXXXXX
XXXXXXXXXXXXXX
S
XXXXXXXXXXX
XXXXXXXXXXX
XXXXXXXXXXXXXXXXXXXXX
XXX
XXXX
XXXXXXXXXXX
XXXXXXXXXXXX
XX
XX
sanxiety1sanxiety10
sanxiety3sanxiety7sanxiety6 sanxiety8
sanxiety4
sanxiety9
Figure 5.4 . Variable map showing the distribution of items and persons for sanxiety
scale
The 9-item sanxiety scale in this study showed good fit to the Rasch model, and
FACTORS INFLUENCING MATHEMATICS ACHIEVEMENT OF SECONDARY SCHOOL STUDENTS IN INDIA 109
item and person separation reliabilities were acceptable. The Cronbach alpha reliability
was 0.85. These findings indicate that the items were working together in consistent ways
to provide a measurement scale that could be used to draw inferences about respondents.
The students found the items relatively easy to endorse, as shown by the discrepancy
between the item and person means. The items ‘I never get nervous during a maths
test’(sanxiety 2) and ‘I worry about my ability to solve maths problems’(sanxiety 9) were
more difficult for the students to endorse.
The smotivation scale’s fit statistics were satisfactory suggesting a good fit of the
data to the model. The scale had 10 items and measured students’ motivation in learning
mathematics. The item mean square values and the t values were within the acceptable
range of the Rasch modelled value for mean square and t values. The infit and outfit
mean square values of item were 1.00 and 1.03 and the infit and outfit t values were zero
and 0.20. The item estimate mean by default was zero with SD of 0.28. The item
separation reliability index obtained was within the acceptable range with a value of 0.88
(Bond & Fox, 2007). The summary of the fit statistics is given in Table 5.5.
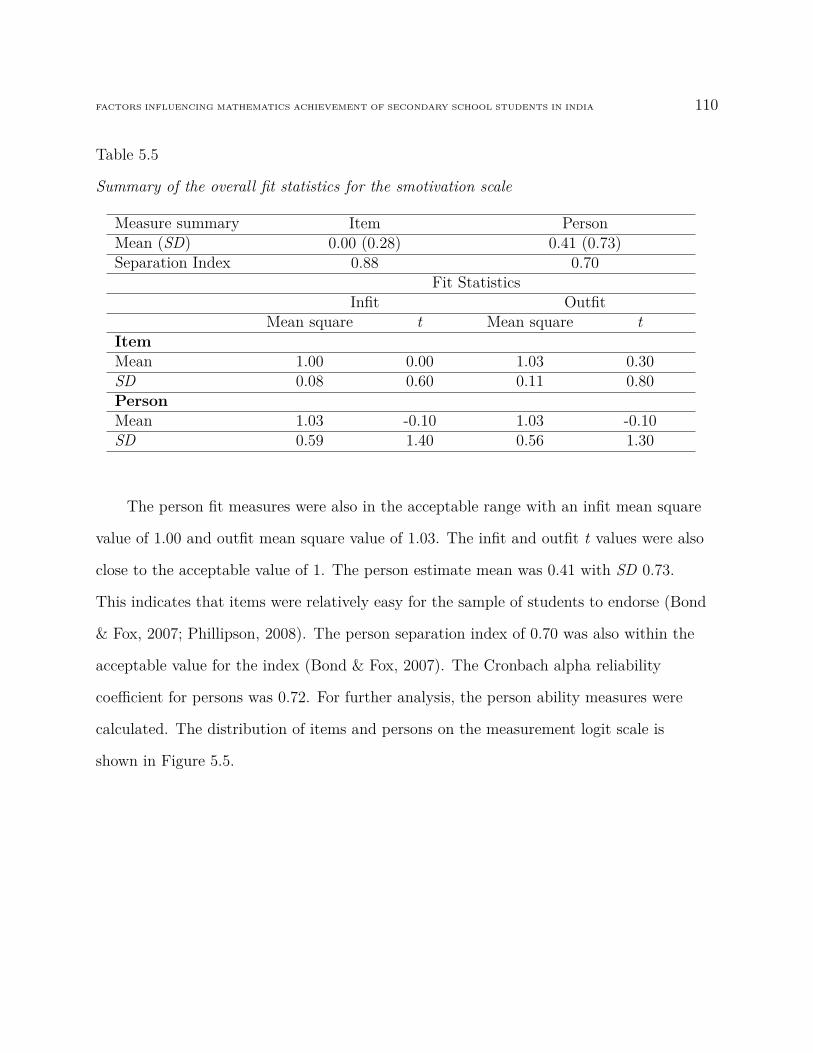
FACTORS INFLUENCING MATHEMATICS ACHIEVEMENT OF SECONDARY SCHOOL STUDENTS IN INDIA 110
Table 5.5
Summary of the overall fit statistics for the smotivation scale
Measure summary Item PersonMean (SD) 0.00 (0.28) 0.41 (0.73)Separation Index 0.88 0.70
Fit StatisticsInfit Outfit
Mean square t Mean square tItemMean 1.00 0.00 1.03 0.30SD 0.08 0.60 0.11 0.80PersonMean 1.03 -0.10 1.03 -0.10SD 0.59 1.40 0.56 1.30
The person fit measures were also in the acceptable range with an infit mean square
value of 1.00 and outfit mean square value of 1.03. The infit and outfit t values were also
close to the acceptable value of 1. The person estimate mean was 0.41 with SD 0.73.
This indicates that items were relatively easy for the sample of students to endorse (Bond
& Fox, 2007; Phillipson, 2008). The person separation index of 0.70 was also within the
acceptable value for the index (Bond & Fox, 2007). The Cronbach alpha reliability
coefficient for persons was 0.72. For further analysis, the person ability measures were
calculated. The distribution of items and persons on the measurement logit scale is
shown in Figure 5.5.

FACTORS INFLUENCING MATHEMATICS ACHIEVEMENT OF SECONDARY SCHOOL STUDENTS IN INDIA 111
+
+
+
+
+
+
<more> <rare>
PERSON – MAP - ITEM
.
S
T
M S
S
M
T
S
smotivation1
<less> <frequent>
Each “#” IS 2. EACH “.” 1.
MEASURE
4
3
2
1
0
-1
.
.
.#
..##
##
.
.
T
##########
..#####
.#############
##########.
.##
smotivation2smotivation4smotivation9smotivation5smotivation3smotivation10smotivation6
smotivation7
smotivation8
T
Figure 5.5 . Variable map showing the distribution of items and persons for smotivation
scale
The 10-item smotivation scale in this study showed good fit to the Rasch model, and
item and person separation reliabilities were acceptable. The Cronbach alpha reliability
was 0.72. These findings indicate that the items were working together in consistent ways
to provide a measurement scale that could be used to draw inferences about respondents.
The students found the items relatively easy to endorse, as shown by the discrepancy
between the item and person means. The item ‘I don’t understand how some people can
spend so much time on maths and seem to enjoy it’(smotivation 7) was the most difficult
for the students to agree or disagree with.

FACTORS INFLUENCING MATHEMATICS ACHIEVEMENT OF SECONDARY SCHOOL STUDENTS IN INDIA 112
The data from the sparentbeh scale with 10 items were analysed using Rasch
modelling to establish the fit of the data to the model. The scale measured students’
perception of their parents’ behaviours in relation to their maths learning. The item infit
and outfit mean square values obtained were 1.00 and 1.01 respectively. The above values
were close to the expected value of 1 in Rasch modelling. Rasch modelling requires an
ideal value of zero for infit and outfit t values. Against this, the value obtained was 0.10
for both infit and outfit measure, which was close to the expected value of zero. These
values indicate a good fit of the data to the model (Bond & Fox, 2007). The item
estimate mean was 0.00 (default) with SD of 0.75. The item separation reliability index
of 0.98 was also within the acceptable range (Bond & Fox, 2007). The fit statistics
summary is shown in Table 5.6.
Table 5.6
Summary of the overall fit statistics for the sparentbeh scale
Measure summary Item PersonMean (SD) 0.00 (0.75) 0.66 (0.62)Separation Index 0.98 0.58
Fit StatisticsInfit Outfit
Mean square t Mean square tItemMean 1.00 0.10 1.01 0.10SD 0.17 1.20 0.20 1.30PersonMean 1.05 0.00 1.01 0.00SD 0.67 1.30 0.61 1.10
The person fit statistics calculated for the sparentbeh scale indicated a good fit to
the model with a value of 1.05 for infit mean square and 1.01 for outfit mean square. The
t value was zero for both infit and outfit measures. The person estimate mean was 0.66,
indicating that the students found the items comparatively easy to endorse (Bond & Fox,
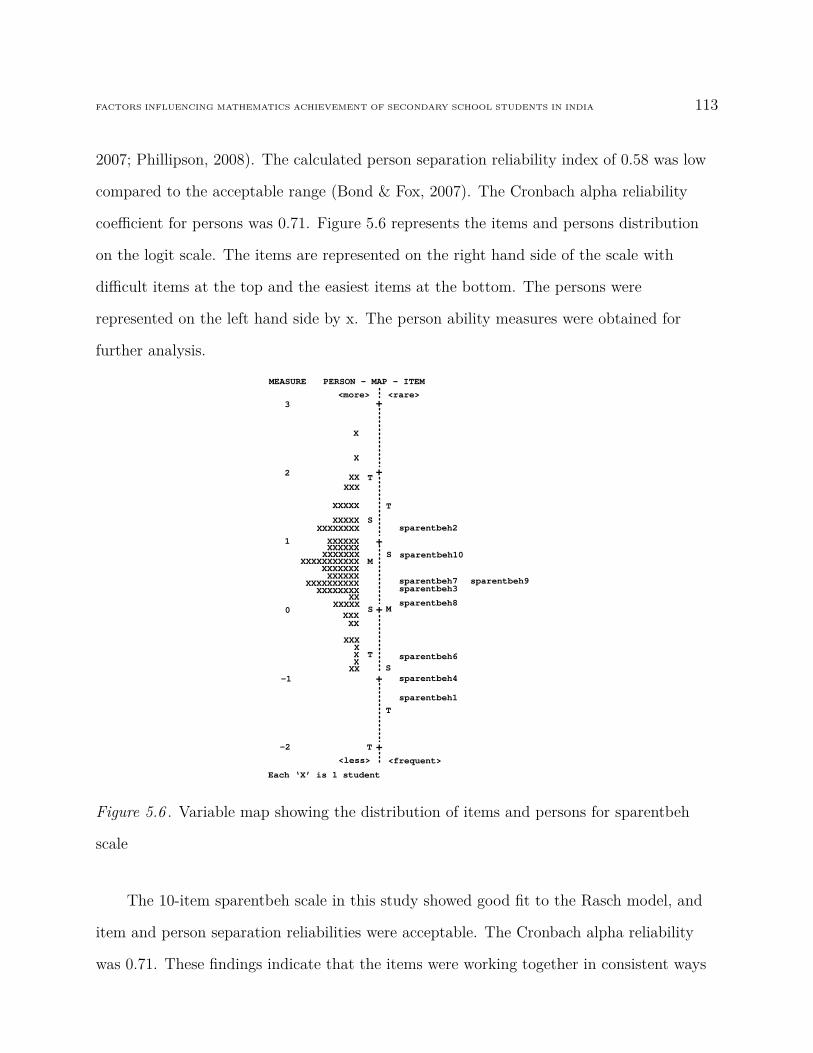
FACTORS INFLUENCING MATHEMATICS ACHIEVEMENT OF SECONDARY SCHOOL STUDENTS IN INDIA 113
2007; Phillipson, 2008). The calculated person separation reliability index of 0.58 was low
compared to the acceptable range (Bond & Fox, 2007). The Cronbach alpha reliability
coefficient for persons was 0.71. Figure 5.6 represents the items and persons distribution
on the logit scale. The items are represented on the right hand side of the scale with
difficult items at the top and the easiest items at the bottom. The persons were
represented on the left hand side by x. The person ability measures were obtained for
further analysis.
+
+
+
+
+
+
<more> <rare>
PERSON – MAP - ITEM
XX
S
T
M
S
S
T
S
<less> <frequent>
Each ‘X’ is 1 student
MEASURE
3
2
1
0
-1
-2
X
T
X
T
XXXXX
M
T
sparentbeh1
XXX
XXXXXXXXXXXXXX
XXXXX
XXXXXXXXXXXXX
XXXXXXXXXXXXXXXXXXXXXXXX
XXXXXXXXXXXXXXXXXX
XXXXXXXXXXXX
XXXXXXXX
sparentbeh4
sparentbeh6
sparentbeh8
sparentbeh3sparentbeh7
sparentbeh10
sparentbeh2
sparentbeh9
Figure 5.6 . Variable map showing the distribution of items and persons for sparentbeh
scale
The 10-item sparentbeh scale in this study showed good fit to the Rasch model, and
item and person separation reliabilities were acceptable. The Cronbach alpha reliability
was 0.71. These findings indicate that the items were working together in consistent ways

FACTORS INFLUENCING MATHEMATICS ACHIEVEMENT OF SECONDARY SCHOOL STUDENTS IN INDIA 114
to provide a measurement scale that could be used to draw inferences about respondents.
The students found the items comparatively easy to endorse, as shown by the
discrepancy between the item and person means. The item ‘My parents check my maths
homework regularly’(sparentbeh 2) was the most difficult for the students to endorse.
The sparentattitude scale with 10 items measured students’ perception of their
parents’ attitude towards maths and their child’s maths study. The overall fit statistics
obtained for the sparentattitude scale indicated that the data fitted the Rasch model
well. This was evident from the mean square and t values obtained for the items. The
item infit mean square value of 1.06 and the item outfit mean square value of 1.02 were
close to the expected value of 1.00 in Rasch modelling. The infit and outfit t values were
in the acceptable range. The item mean estimate was zero (default) with a SD of 0.39.
The item separation reliability index of 0.90 was in the acceptable range (Bond & Fox,
2007). The overall fit statistics for the scale is shown in Table 5.7.
Table 5.7
Summary of the overall fit statistics for the sparentattitude scale
Measure summary Item PersonMean (SD) 0.00 (0.39) 1.12 (0.79)Separation Index 0.90 0.61
Fit StatisticsInfit Outfit
Mean square t Mean square tItemMean 1.06 0.30 1.02 0.10SD 0.20 1.10 0.14 0.90PersonMean 1.03 0.00 1.02 0.00SD 0.67 1.30 0.71 1.30
The person fit measures were also indicated good fit of the data with mean square
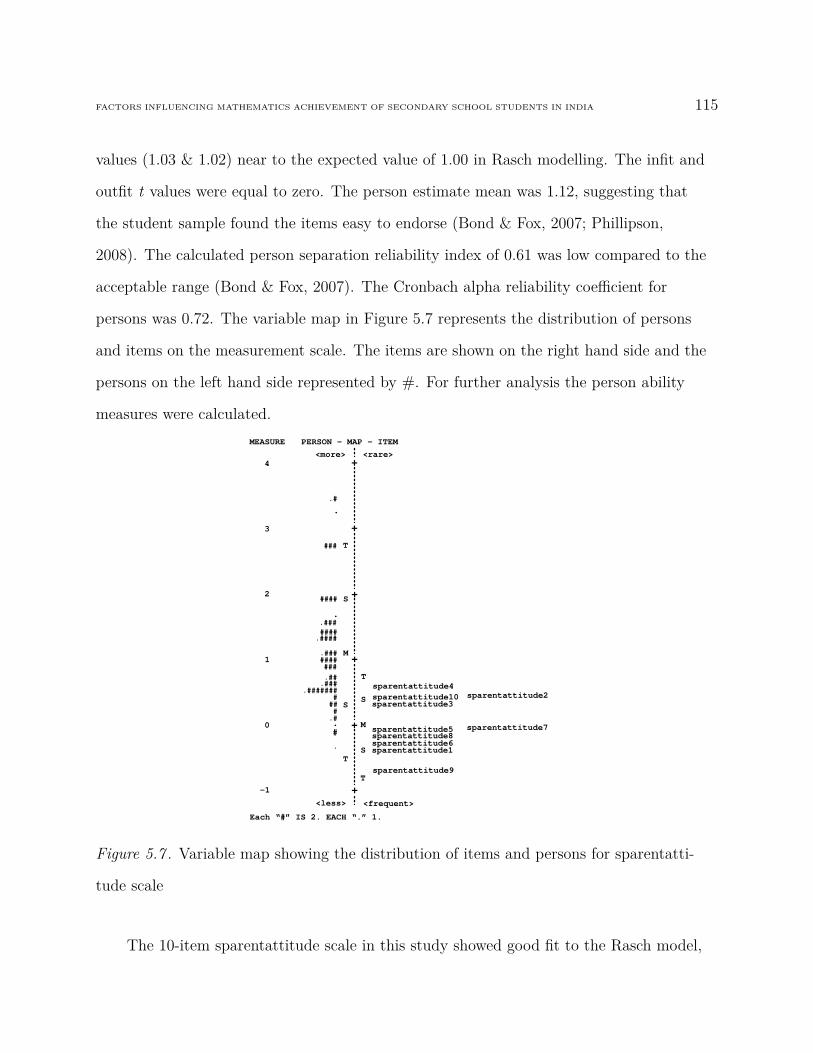
FACTORS INFLUENCING MATHEMATICS ACHIEVEMENT OF SECONDARY SCHOOL STUDENTS IN INDIA 115
values (1.03 & 1.02) near to the expected value of 1.00 in Rasch modelling. The infit and
outfit t values were equal to zero. The person estimate mean was 1.12, suggesting that
the student sample found the items easy to endorse (Bond & Fox, 2007; Phillipson,
2008). The calculated person separation reliability index of 0.61 was low compared to the
acceptable range (Bond & Fox, 2007). The Cronbach alpha reliability coefficient for
persons was 0.72. The variable map in Figure 5.7 represents the distribution of persons
and items on the measurement scale. The items are shown on the right hand side and the
persons on the left hand side represented by #. For further analysis the person ability
measures were calculated.
+
+
+
+
+
+
<more> <rare>
PERSON – MAP - ITEM
.
S
T
M
SS
M
TS
sparentattitude9
<less> <frequent>
Each “#” IS 2. EACH “.” 1.
MEASURE
4
3
2
1
0
-1
####
T
.#######
###
#
.
T
.#
###
.###
.########.###
.####
.#.####
.###.##
sparentattitude1sparentattitude6sparentattitude8sparentattitude5
sparentattitude3sparentattitude10sparentattitude4
sparentattitude2
sparentattitude7
Figure 5.7 . Variable map showing the distribution of items and persons for sparentatti-
tude scale
The 10-item sparentattitude scale in this study showed good fit to the Rasch model,
FACTORS INFLUENCING MATHEMATICS ACHIEVEMENT OF SECONDARY SCHOOL STUDENTS IN INDIA 116
and item and person separation reliabilities were acceptable. The Cronbach alpha
reliability was 0.72. These findings indicate that the items were working together in
consistent ways to provide a measurement scale that could be used to draw inferences
about respondents. The students found the items comparatively easy to endorse, as
shown by the discrepancy between the item and person means. The item ‘My parents
think I am the kind of person who could do well in mathematics’(sparentattitude 4) was
the most difficult for the students to agree or disagree with.
5.3.2 Parent questionnaire data
The parent questionnaire comprised five scales namely, parent behaviours
(pparentbeh) scale, parent maths anxiety (panxiety) scale, parental expectations
(pexpectation) scale, and parent attitude towards maths and child’s maths study
(pattitude) scale and parenting style (pparsty) scale . The pparentbeh scale measured
parents’ behaviours in relation to their child’s maths learning, panxiety scale measured
parents’ anxiety in mathematics, the pexpectation scale measured parental expectations
for his/her child’s mathematics learning and future education, the pattitude scale
measured parents’ attitude towards maths and his/her child’s maths study and the
pparsty scale measured parents’perceptions of their involvement in their child’s
mathematics learning.
The Cronbach alpha coefficient for the whole scale was 0.89 and the individual scales
had Cronbach alpha coefficients ranging from 0.52 to 0.86, with the exception of the
pparsty scale. The pparsty scale with 12 items had a Cronbach alpha coefficient of 0.19
and was, therefore, removed from the analysis. The Cronbach alpha coefficient for the
pexpectation scale with 4 items was 0.52. A total of 106 parents’ data were used for
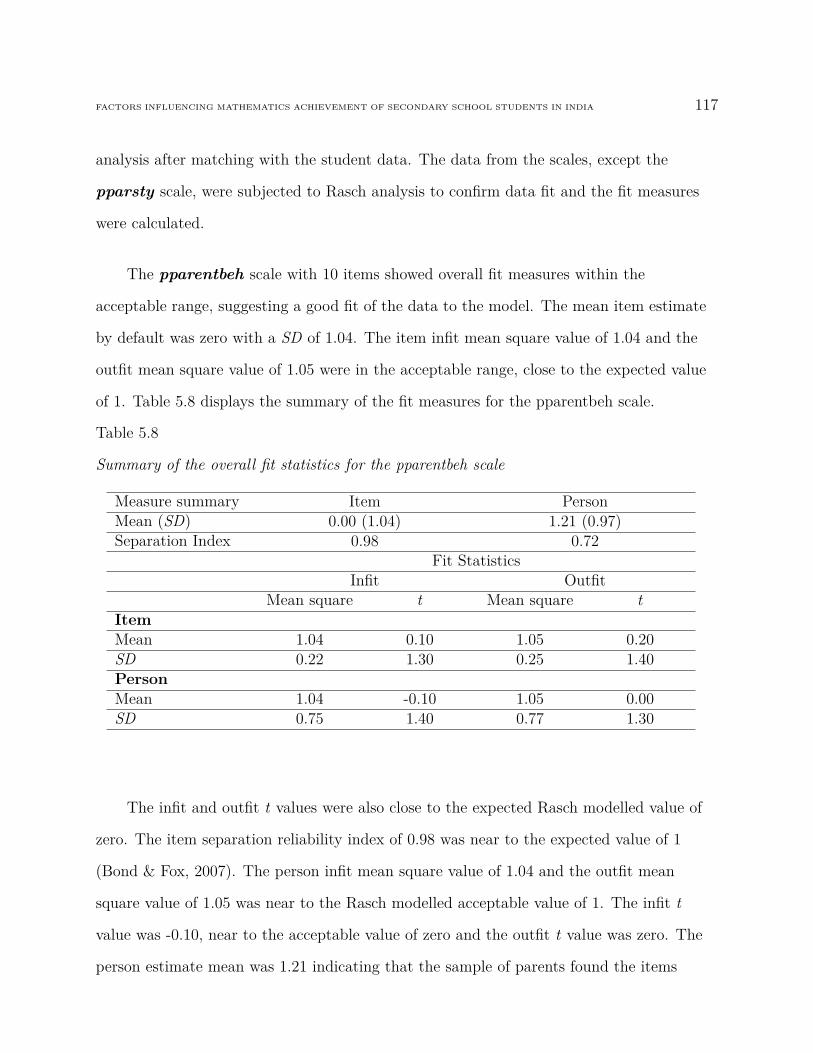
FACTORS INFLUENCING MATHEMATICS ACHIEVEMENT OF SECONDARY SCHOOL STUDENTS IN INDIA 117
analysis after matching with the student data. The data from the scales, except the
pparsty scale, were subjected to Rasch analysis to confirm data fit and the fit measures
were calculated.
The pparentbeh scale with 10 items showed overall fit measures within the
acceptable range, suggesting a good fit of the data to the model. The mean item estimate
by default was zero with a SD of 1.04. The item infit mean square value of 1.04 and the
outfit mean square value of 1.05 were in the acceptable range, close to the expected value
of 1. Table 5.8 displays the summary of the fit measures for the pparentbeh scale.
Table 5.8
Summary of the overall fit statistics for the pparentbeh scale
Measure summary Item PersonMean (SD) 0.00 (1.04) 1.21 (0.97)Separation Index 0.98 0.72
Fit StatisticsInfit Outfit
Mean square t Mean square tItemMean 1.04 0.10 1.05 0.20SD 0.22 1.30 0.25 1.40PersonMean 1.04 -0.10 1.05 0.00SD 0.75 1.40 0.77 1.30
The infit and outfit t values were also close to the expected Rasch modelled value of
zero. The item separation reliability index of 0.98 was near to the expected value of 1
(Bond & Fox, 2007). The person infit mean square value of 1.04 and the outfit mean
square value of 1.05 was near to the Rasch modelled acceptable value of 1. The infit t
value was -0.10, near to the acceptable value of zero and the outfit t value was zero. The
person estimate mean was 1.21 indicating that the sample of parents found the items
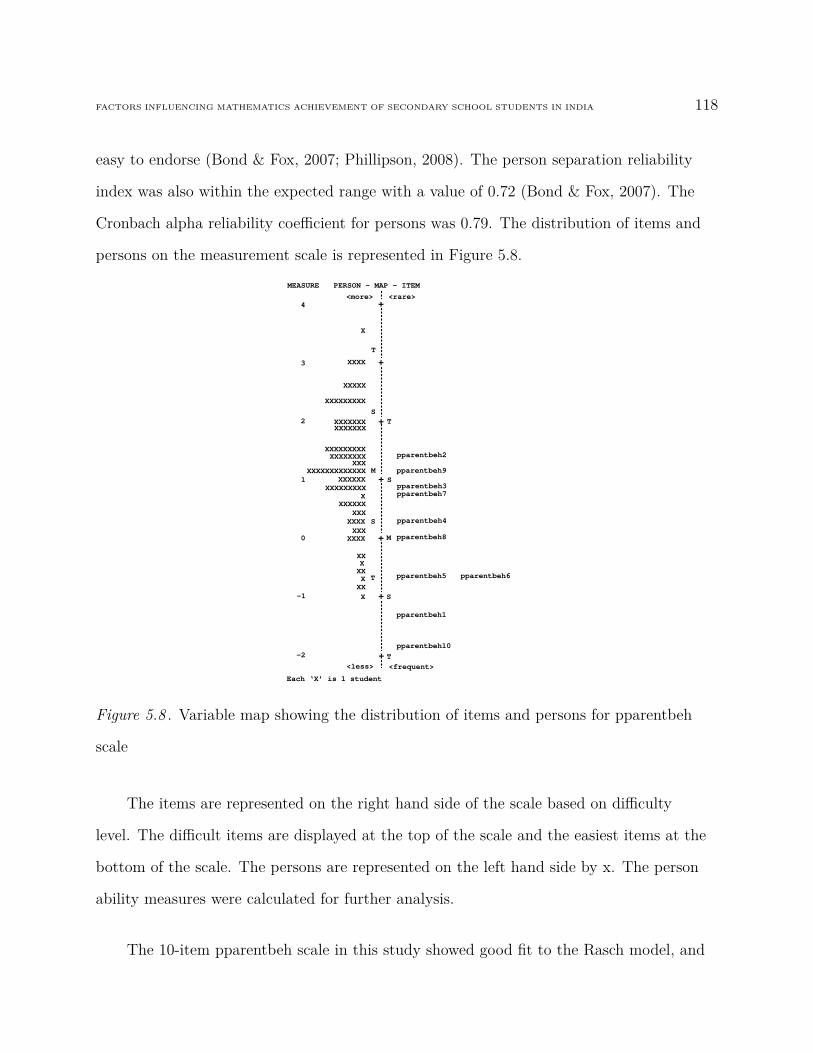
FACTORS INFLUENCING MATHEMATICS ACHIEVEMENT OF SECONDARY SCHOOL STUDENTS IN INDIA 118
easy to endorse (Bond & Fox, 2007; Phillipson, 2008). The person separation reliability
index was also within the expected range with a value of 0.72 (Bond & Fox, 2007). The
Cronbach alpha reliability coefficient for persons was 0.79. The distribution of items and
persons on the measurement scale is represented in Figure 5.8.
+
+
+
+
+
+
<more> <rare>
PERSON – MAP - ITEM
XXXXX
T
S
XXXXXX
XXXXXXX T
MS
S
MXXXX
X
X
XXX
T
S
<less> <frequent>
Each ‘X’ is 1 student
MEASURE
4
3
2
1
0
-1
X
XXX
XXX
XX
+-2 T
pparentbeh1
XXXX
XXXXXXXXX
XXXXXXX
XXXXXXXXXXXXX
XXXXXXXXXXXXXXXXX
XXXXXXX
XXXXXXX
XXXXXXXXX
XX
pparentbeh10
pparentbeh5 pparentbeh6
pparentbeh8
pparentbeh4
pparentbeh3pparentbeh7
pparentbeh9
pparentbeh2
Figure 5.8 . Variable map showing the distribution of items and persons for pparentbeh
scale
The items are represented on the right hand side of the scale based on difficulty
level. The difficult items are displayed at the top of the scale and the easiest items at the
bottom of the scale. The persons are represented on the left hand side by x. The person
ability measures were calculated for further analysis.
The 10-item pparentbeh scale in this study showed good fit to the Rasch model, and
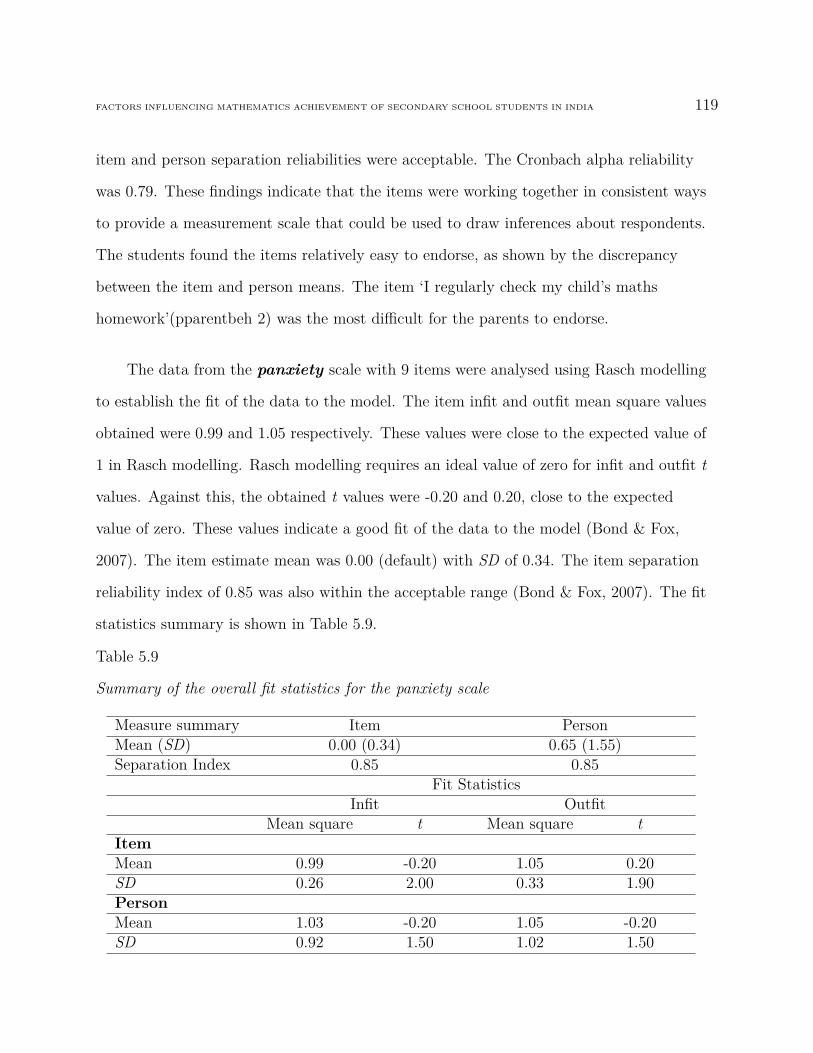
FACTORS INFLUENCING MATHEMATICS ACHIEVEMENT OF SECONDARY SCHOOL STUDENTS IN INDIA 119
item and person separation reliabilities were acceptable. The Cronbach alpha reliability
was 0.79. These findings indicate that the items were working together in consistent ways
to provide a measurement scale that could be used to draw inferences about respondents.
The students found the items relatively easy to endorse, as shown by the discrepancy
between the item and person means. The item ‘I regularly check my child’s maths
homework’(pparentbeh 2) was the most difficult for the parents to endorse.
The data from the panxiety scale with 9 items were analysed using Rasch modelling
to establish the fit of the data to the model. The item infit and outfit mean square values
obtained were 0.99 and 1.05 respectively. These values were close to the expected value of
1 in Rasch modelling. Rasch modelling requires an ideal value of zero for infit and outfit t
values. Against this, the obtained t values were -0.20 and 0.20, close to the expected
value of zero. These values indicate a good fit of the data to the model (Bond & Fox,
2007). The item estimate mean was 0.00 (default) with SD of 0.34. The item separation
reliability index of 0.85 was also within the acceptable range (Bond & Fox, 2007). The fit
statistics summary is shown in Table 5.9.
Table 5.9
Summary of the overall fit statistics for the panxiety scale
Measure summary Item PersonMean (SD) 0.00 (0.34) 0.65 (1.55)Separation Index 0.85 0.85
Fit StatisticsInfit Outfit
Mean square t Mean square tItemMean 0.99 -0.20 1.05 0.20SD 0.26 2.00 0.33 1.90PersonMean 1.03 -0.20 1.05 -0.20SD 0.92 1.50 1.02 1.50
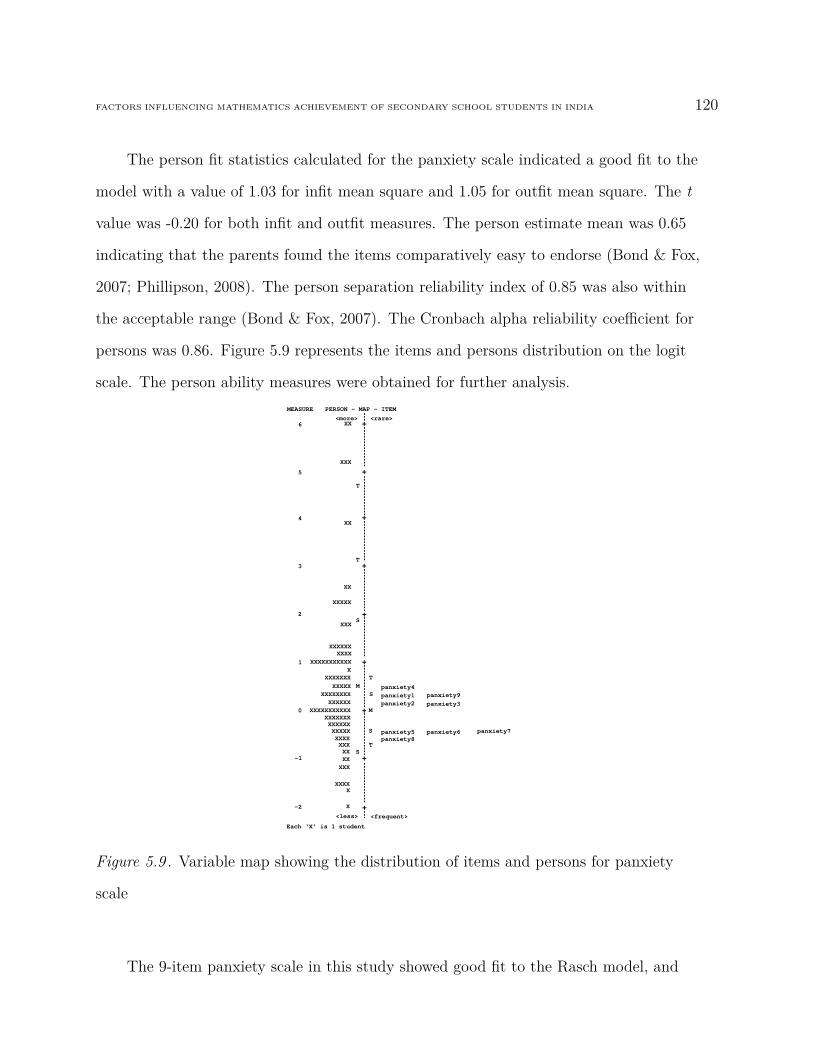
FACTORS INFLUENCING MATHEMATICS ACHIEVEMENT OF SECONDARY SCHOOL STUDENTS IN INDIA 120
The person fit statistics calculated for the panxiety scale indicated a good fit to the
model with a value of 1.03 for infit mean square and 1.05 for outfit mean square. The t
value was -0.20 for both infit and outfit measures. The person estimate mean was 0.65
indicating that the parents found the items comparatively easy to endorse (Bond & Fox,
2007; Phillipson, 2008). The person separation reliability index of 0.85 was also within
the acceptable range (Bond & Fox, 2007). The Cronbach alpha reliability coefficient for
persons was 0.86. Figure 5.9 represents the items and persons distribution on the logit
scale. The person ability measures were obtained for further analysis.
+
+
+
+
+
+
<more> <rare>
PERSON – MAP - ITEM
XXXXX
T
XX
S
XXXXXXXXXXX
XXX
TM
S
S
M
XXXXXX
S
<less> <frequent>
Each ‘X’ is 1 student
MEASURE
4
3
2
1
0
-1
XX
XXXXX
XXX
XXXX
X
XXXXXXXX
+-2
T
+
+T
6
5
XX
XXXXXXXXXXXXXXXXX
XXXXXXX
XXXXXXX
XXXXXXXXXXXXXXXXXXXXXX
X
XXX
XXXXX
panxiety8panxiety5
panxiety2panxiety1panxiety4
panxiety6 panxiety7
panxiety3panxiety9
Figure 5.9 . Variable map showing the distribution of items and persons for panxiety
scale
The 9-item panxiety scale in this study showed good fit to the Rasch model, and
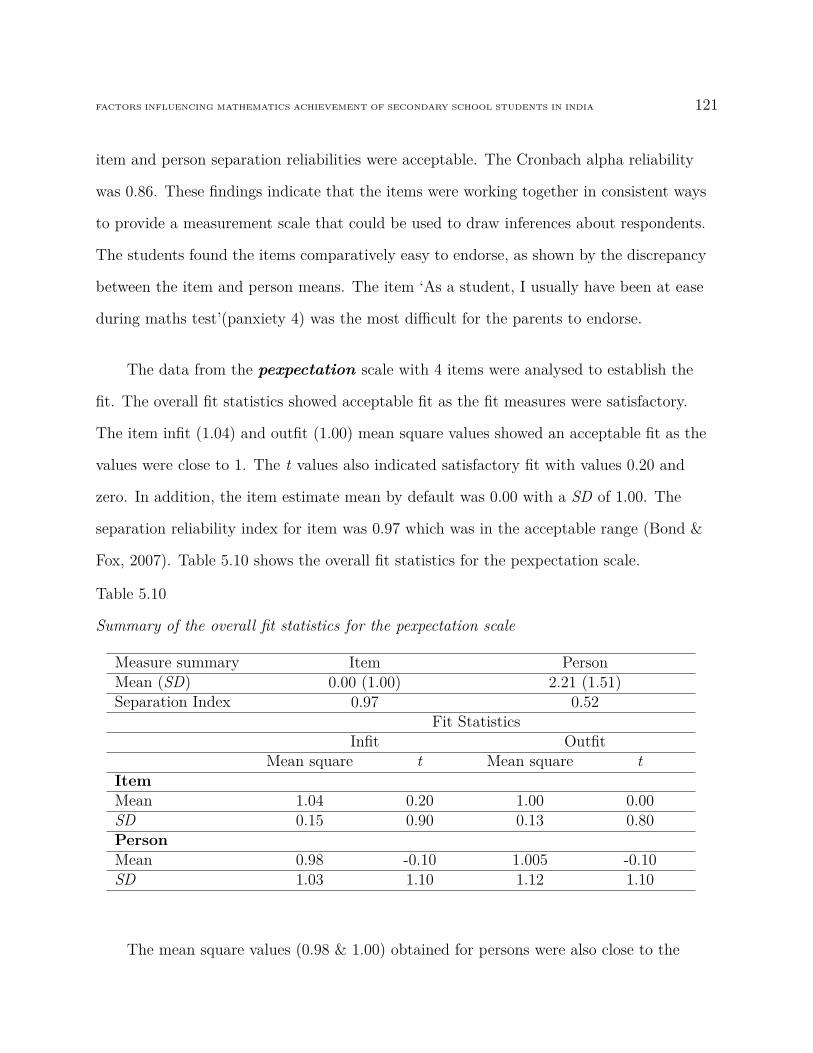
FACTORS INFLUENCING MATHEMATICS ACHIEVEMENT OF SECONDARY SCHOOL STUDENTS IN INDIA 121
item and person separation reliabilities were acceptable. The Cronbach alpha reliability
was 0.86. These findings indicate that the items were working together in consistent ways
to provide a measurement scale that could be used to draw inferences about respondents.
The students found the items comparatively easy to endorse, as shown by the discrepancy
between the item and person means. The item ‘As a student, I usually have been at ease
during maths test’(panxiety 4) was the most difficult for the parents to endorse.
The data from the pexpectation scale with 4 items were analysed to establish the
fit. The overall fit statistics showed acceptable fit as the fit measures were satisfactory.
The item infit (1.04) and outfit (1.00) mean square values showed an acceptable fit as the
values were close to 1. The t values also indicated satisfactory fit with values 0.20 and
zero. In addition, the item estimate mean by default was 0.00 with a SD of 1.00. The
separation reliability index for item was 0.97 which was in the acceptable range (Bond &
Fox, 2007). Table 5.10 shows the overall fit statistics for the pexpectation scale.
Table 5.10
Summary of the overall fit statistics for the pexpectation scale
Measure summary Item PersonMean (SD) 0.00 (1.00) 2.21 (1.51)Separation Index 0.97 0.52
Fit StatisticsInfit Outfit
Mean square t Mean square tItemMean 1.04 0.20 1.00 0.00SD 0.15 0.90 0.13 0.80PersonMean 0.98 -0.10 1.005 -0.10SD 1.03 1.10 1.12 1.10
The mean square values (0.98 & 1.00) obtained for persons were also close to the

FACTORS INFLUENCING MATHEMATICS ACHIEVEMENT OF SECONDARY SCHOOL STUDENTS IN INDIA 122
Rasch modelled value of 1. The infit and outfit t values of -0.10 were also satisfactory.
These person fit measures indicated acceptable fit of the data to the model. The person
estimate mean was 2.21, indicating that the items of the scale were easy for the sample of
parents to endorse (Bond & Fox, 2007; Phillipson, 2008). The person separation
reliability index of 0.52 was low compared to the acceptable range (Bond & Fox, 2007).
The Cronbach alpha reliability coefficient for persons was 0.52.
+
+
+
+
+
+
<more> <rare>
PERSON – MAP - ITEM
S
M T
T
S
S
M
S
<less> <frequent>
MEASURE
4
3
2
1
0
-1
+-2 T
+T
5
pexpectation3
.#
.####
####
.####
##########
####
.##
###
#
.
Each “#” IS 3. EACH “.” IS 1 TO 2
pexpectation1
pexpectation4
pexpectation2
Figure 5.10 . Variable map showing the distribution of items and persons for pexpecta-
tion scale
Figure 5.10 represents the variable map showing the distribution of items and
persons. The items are represented on the right hand side of the scale with difficult items
at the top and the easiest items at the bottom. The persons were represented on the left
hand side by #. The ability measures for persons were calculated for further analysis.

FACTORS INFLUENCING MATHEMATICS ACHIEVEMENT OF SECONDARY SCHOOL STUDENTS IN INDIA 123
The 4-item pexpectation scale in this study showed good fit to the Rasch model, and
item and person separation reliabilities were acceptable. The Cronbach alpha reliability
was 0.52. These findings indicate that the items were working together in consistent ways
to provide a measurement scale that could be used to draw inferences about respondents.
The students found the items comparatively easy to endorse, as shown by the discrepancy
between the item and person means. The item ‘I think that my child will study advanced
maths courses in university’(pexpectation 2) was the most difficult for parents to endorse.
The overall fit measures for the pattitude scale with 10 items were within the
acceptable range suggesting a good fit of the data to the model. The infit and outfit mean
square for the item were 1.02 and 1.08 respectively. These values were close to the Rasch
modelled acceptable value of 1. The infit and outfit t values of 0.4 and 0.8 for the item
were also close to the expected value of zero. The mean item estimate was 0.00 (default)
with a SD of 0.63. The item separation reliability index of 0.94 was close to the expected
value of 1 in Rasch modelling (Bond & Fox, 2007). The infit and outfit measures for
person were also within the acceptable range. The person infit and outfit values of 1.07
and 1.08 were in the acceptable range. The infit and outfit t values for person were the
exact value of zero. The person estimate mean was 1.79 indicating that the sample of
parents found the items very easy to endorse (Bond & Fox, 2007; Phillipson, 2008). The
separation reliability index for the person of 0.72 was also within the expected range
(Bond & Fox, 2007). The Cronbach alpha reliability coefficient for persons was 0.80. The
summary of the fit measures for the pattitude scale is shown in Table 5.11.
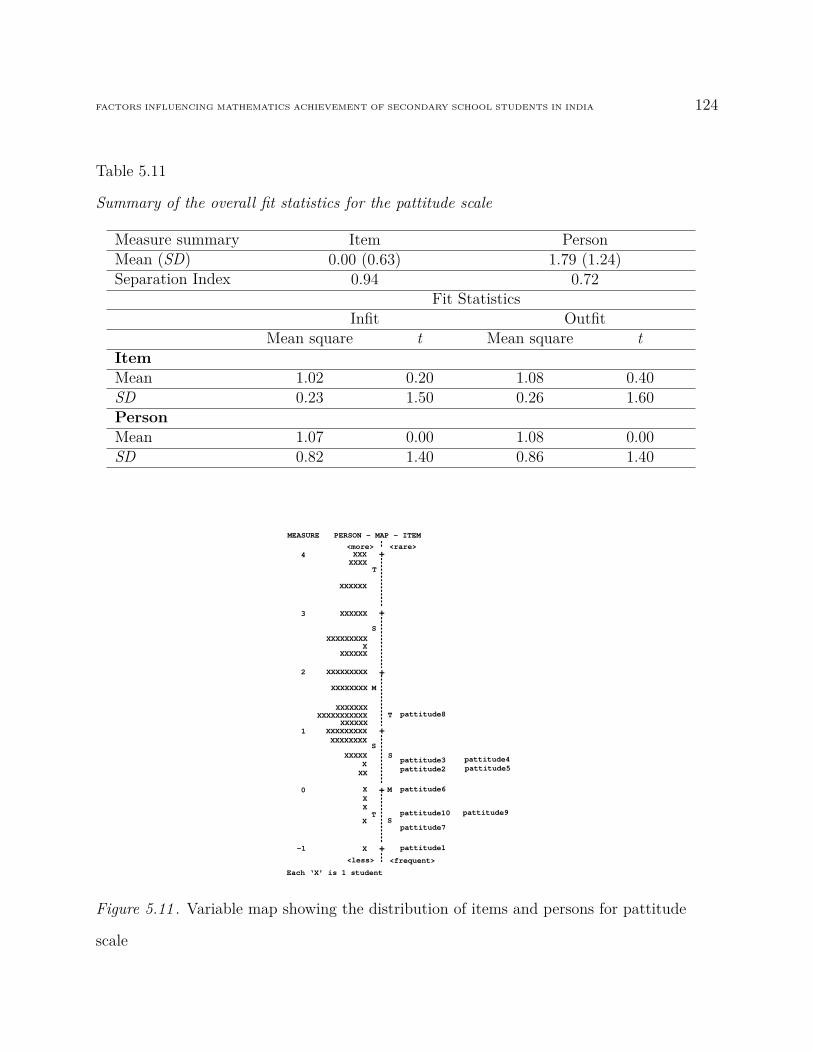
FACTORS INFLUENCING MATHEMATICS ACHIEVEMENT OF SECONDARY SCHOOL STUDENTS IN INDIA 124
Table 5.11
Summary of the overall fit statistics for the pattitude scale
Measure summary Item PersonMean (SD) 0.00 (0.63) 1.79 (1.24)Separation Index 0.94 0.72
Fit StatisticsInfit Outfit
Mean square t Mean square tItemMean 1.02 0.20 1.08 0.40SD 0.23 1.50 0.26 1.60PersonMean 1.07 0.00 1.08 0.00SD 0.82 1.40 0.86 1.40
+
+
+
+
+
+
<more> <rare>
PERSON – MAP - ITEM
XXXX
X
T
S
XXXXXXXXXXX
XXXXXXXX
T
M
SS
MX
XX
XXXXX
XXXXXXXX
X
X
TS
pattitude7
<less> <frequent>
Each ‘X’ is 1 student
MEASURE
4
3
2
1
0
-1
XXX
XXXXXX
XXXXXX
XXXXXXXXX
XXXXXX
XXXXXXXXX
XXXXXXXXXXXXXXX
XXXXXXX
X
XX
pattitude1
pattitude10
pattitude6
pattitude3pattitude2
pattitude9
pattitude4pattitude5
pattitude8
Figure 5.11 . Variable map showing the distribution of items and persons for pattitude
scale

FACTORS INFLUENCING MATHEMATICS ACHIEVEMENT OF SECONDARY SCHOOL STUDENTS IN INDIA 125
The variable map in Figure 5.11 shows the distribution of items and persons along
the measurement scale. Based on the difficulty of the items, they were represented on the
right hand side. The persons were represented on the left hand side by x. The person
ability measures were calculated for further analysis.
The 10-item pattitude scale in this study showed good fit to the Rasch model, and
item and person separation reliabilities were acceptable. The Cronbach alpha reliability
was 0.80. These findings indicate that the items were working together in consistent ways
to provide a measurement scale that could be used to draw inferences about respondents.
The students found the items comparatively easy to endorse, as shown by the
discrepancy between the item and person means. The item ‘I am not concerned whether
my child takes more maths courses in future’(pattitude 8) was the most difficult for the
parents to endorse. The overall fit statistics for all the items in the student questionnaire
and the parent questionnaire, from the Rasch analysis are provided in Appendix L and
Appendix M respectively.
5.3.3 Achievement test data
The data obtained from the student achievement test were analysed using Rasch
modelling. The overall fit statistics was satisfactory, indicating a good fit of the data to
the model. The mean square fit measures for the items were close to the expected value
of 1 in Rasch modelling. The infit t value of -0.50 and the outfit t value of -0.30 were also
close to the expected value of zero. The estimate mean of item was zero by default with a
SD of 0.57. The item separation reliability index of 0.97 was within the acceptable range
(Bond & Fox, 2007). The overall fit statistics summary is shown in Table 5.12. The
person fit measures were also in the acceptable range. The person infit mean square value
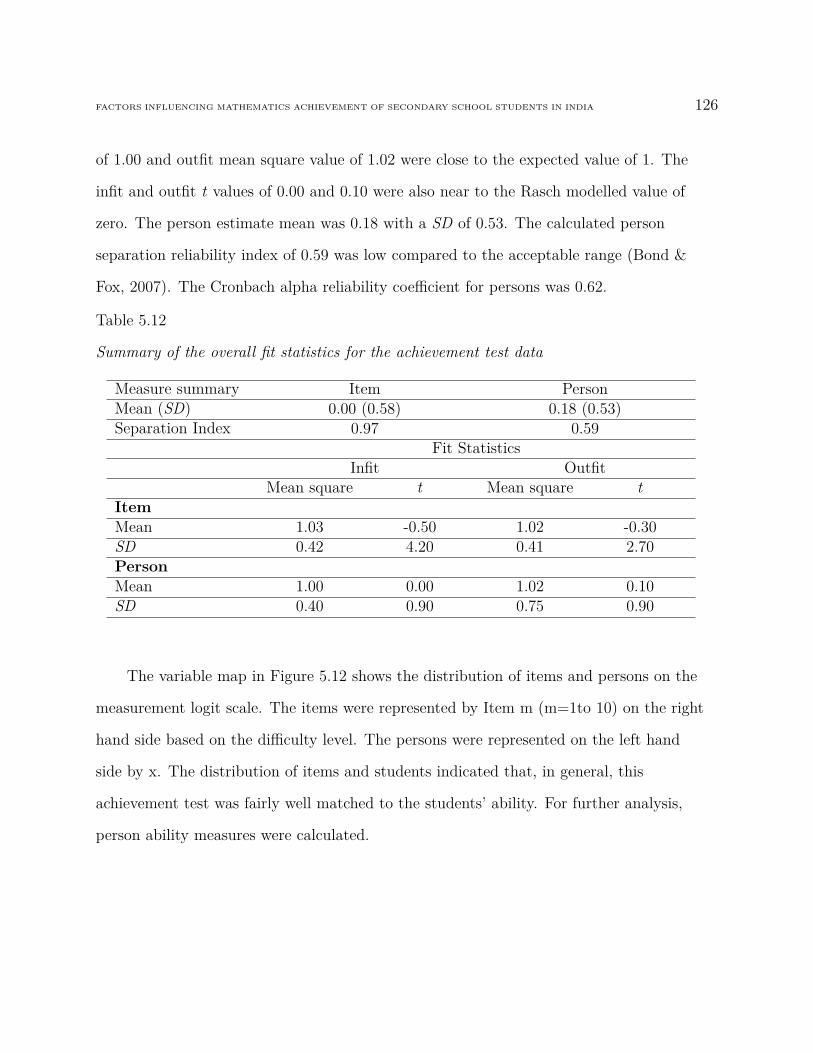
FACTORS INFLUENCING MATHEMATICS ACHIEVEMENT OF SECONDARY SCHOOL STUDENTS IN INDIA 126
of 1.00 and outfit mean square value of 1.02 were close to the expected value of 1. The
infit and outfit t values of 0.00 and 0.10 were also near to the Rasch modelled value of
zero. The person estimate mean was 0.18 with a SD of 0.53. The calculated person
separation reliability index of 0.59 was low compared to the acceptable range (Bond &
Fox, 2007). The Cronbach alpha reliability coefficient for persons was 0.62.
Table 5.12
Summary of the overall fit statistics for the achievement test data
Measure summary Item PersonMean (SD) 0.00 (0.58) 0.18 (0.53)Separation Index 0.97 0.59
Fit StatisticsInfit Outfit
Mean square t Mean square tItemMean 1.03 -0.50 1.02 -0.30SD 0.42 4.20 0.41 2.70PersonMean 1.00 0.00 1.02 0.10SD 0.40 0.90 0.75 0.90
The variable map in Figure 5.12 shows the distribution of items and persons on the
measurement logit scale. The items were represented by Item m (m=1to 10) on the right
hand side based on the difficulty level. The persons were represented on the left hand
side by x. The distribution of items and students indicated that, in general, this
achievement test was fairly well matched to the students’ ability. For further analysis,
person ability measures were calculated.
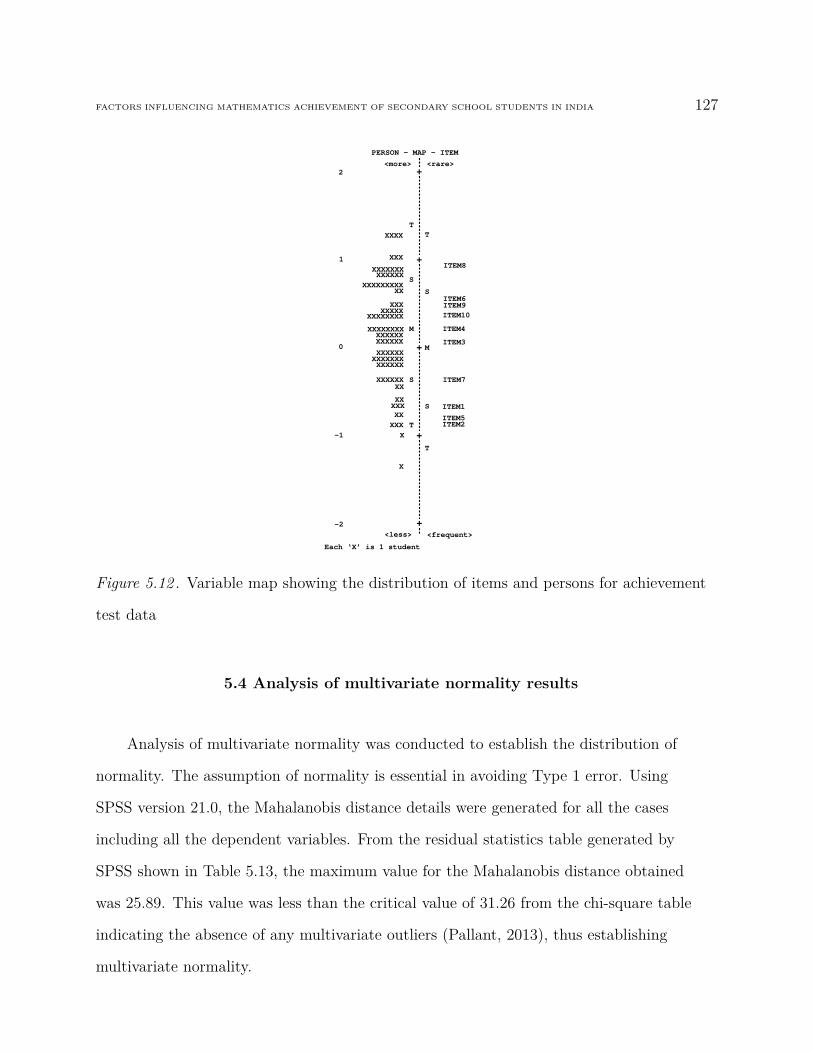
FACTORS INFLUENCING MATHEMATICS ACHIEVEMENT OF SECONDARY SCHOOL STUDENTS IN INDIA 127
+
+
+
+<less> <frequent>
Each ‘X’ is 1 student
+<more> <rare>
PERSON – MAP - ITEM
2
1
0
-1
-2
XXX
XXXX
XXXXXXXXXXXX
XXXXXXXX
XXXXXXXXXXXXX
XXX
XXXXXXXXXXX
XXXXXXXXXXXXX
XXXXXXXXXXXXXXXXXXX
XXXXXXXX
XXXXXXX
XXXX
X
T
S
M
S
TT
S
M
S
T
ITEM2ITEM5
ITEM1
ITEM7
ITEM3
ITEM4
ITEM10ITEM9ITEM6
ITEM8
Figure 5.12 . Variable map showing the distribution of items and persons for achievement
test data
5.4 Analysis of multivariate normality results
Analysis of multivariate normality was conducted to establish the distribution of
normality. The assumption of normality is essential in avoiding Type 1 error. Using
SPSS version 21.0, the Mahalanobis distance details were generated for all the cases
including all the dependent variables. From the residual statistics table generated by
SPSS shown in Table 5.13, the maximum value for the Mahalanobis distance obtained
was 25.89. This value was less than the critical value of 31.26 from the chi-square table
indicating the absence of any multivariate outliers (Pallant, 2013), thus establishing
multivariate normality.
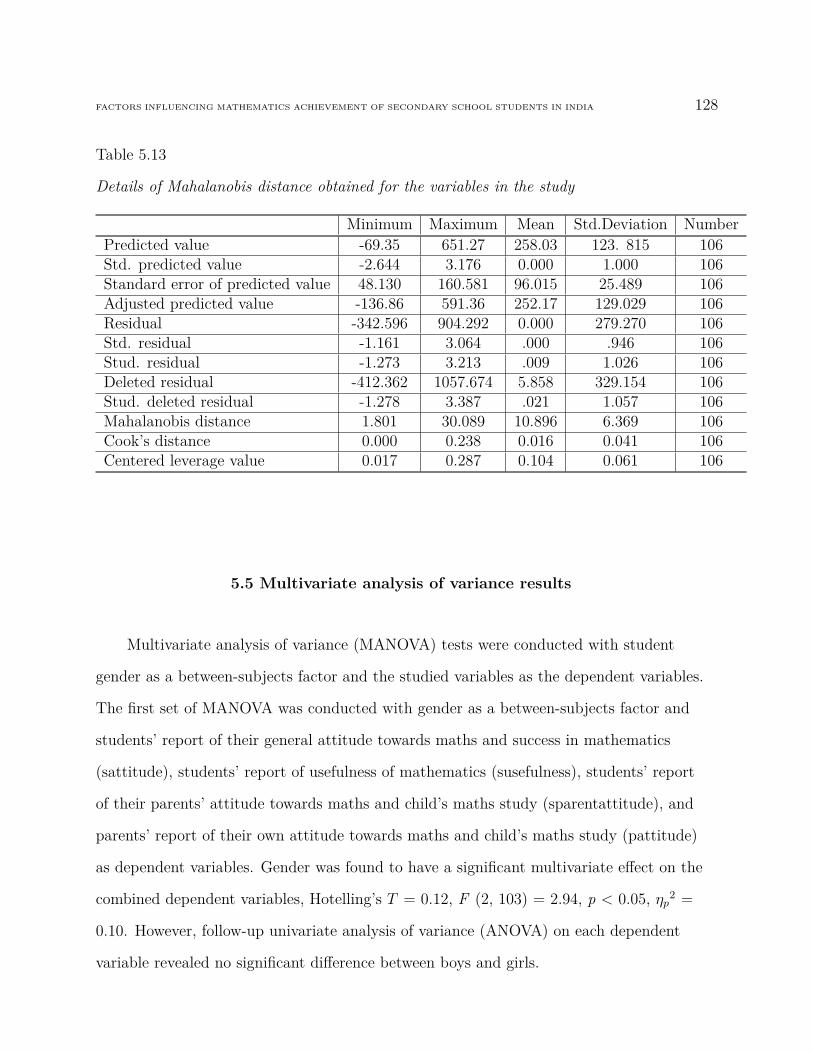
FACTORS INFLUENCING MATHEMATICS ACHIEVEMENT OF SECONDARY SCHOOL STUDENTS IN INDIA 128
Table 5.13
Details of Mahalanobis distance obtained for the variables in the study
Minimum Maximum Mean Std.Deviation NumberPredicted value -69.35 651.27 258.03 123. 815 106Std. predicted value -2.644 3.176 0.000 1.000 106Standard error of predicted value 48.130 160.581 96.015 25.489 106Adjusted predicted value -136.86 591.36 252.17 129.029 106Residual -342.596 904.292 0.000 279.270 106Std. residual -1.161 3.064 .000 .946 106Stud. residual -1.273 3.213 .009 1.026 106Deleted residual -412.362 1057.674 5.858 329.154 106Stud. deleted residual -1.278 3.387 .021 1.057 106Mahalanobis distance 1.801 30.089 10.896 6.369 106Cook’s distance 0.000 0.238 0.016 0.041 106Centered leverage value 0.017 0.287 0.104 0.061 106
5.5 Multivariate analysis of variance results
Multivariate analysis of variance (MANOVA) tests were conducted with student
gender as a between-subjects factor and the studied variables as the dependent variables.
The first set of MANOVA was conducted with gender as a between-subjects factor and
students’ report of their general attitude towards maths and success in mathematics
(sattitude), students’ report of usefulness of mathematics (susefulness), students’ report
of their parents’ attitude towards maths and child’s maths study (sparentattitude), and
parents’ report of their own attitude towards maths and child’s maths study (pattitude)
as dependent variables. Gender was found to have a significant multivariate effect on the
combined dependent variables, Hotelling’s T = 0.12, F (2, 103) = 2.94, p < 0.05, ηp2 =
0.10. However, follow-up univariate analysis of variance (ANOVA) on each dependent
variable revealed no significant difference between boys and girls.
FACTORS INFLUENCING MATHEMATICS ACHIEVEMENT OF SECONDARY SCHOOL STUDENTS IN INDIA 129
The next set of MANOVA was carried out with students’ report of their maths
anxiety (sanxiety), students’ report of their confidence in learning mathematics
(sconfidence), and students’ report of their motivation (smotivation) as dependent
variables and gender as between-subjects factor. Gender did not have any significant
effect on the combined variables, Hotelling’s T= 0.03, F (3, 102) = 1.14, ns, ηp2= 0.03.
There was no significant difference between the boys and girls in any of the dependent
variables when considered independently.
The final set of MANOVA was conducted with student gender as a between-subjects
factor and students’ report of their parent behaviours in child’s maths learning
(sparentbeh), parents’ report of their maths anxiety (panxiety), parent behaviours in
their child’s maths learning (pparentbeh), and parent expectation for their child’s
mathematics learning and future education (pexpectation) as independent variables.
There was a statistically significant difference between boys and girls on the combined
variables, Hotelling’s T= 0.13, F (4,101) = 3.18, p<0.05, ηp2= 0.11. Examining the
results of the dependent variables separately, using a Bonferroni adjusted alpha value of
0.013, statistically significant difference was found between the groups in parent anxiety,
F(1, 104)= 8.77, p< 0.05, ηp2= 0.08. Fathers (M = 1.17, SD = 1.96) were found to
report higher levels of anxiety than mothers (M = 0.29, SD = 1.09).
5.6 Results of multi-group analysis
5.6.1 Preliminary analysis
Descriptive statistics of all the variables in the study are shown in Tables 5.14. Table
5.14 shows the mean, standard deviation, skewness, and kurtosis of the variables in the
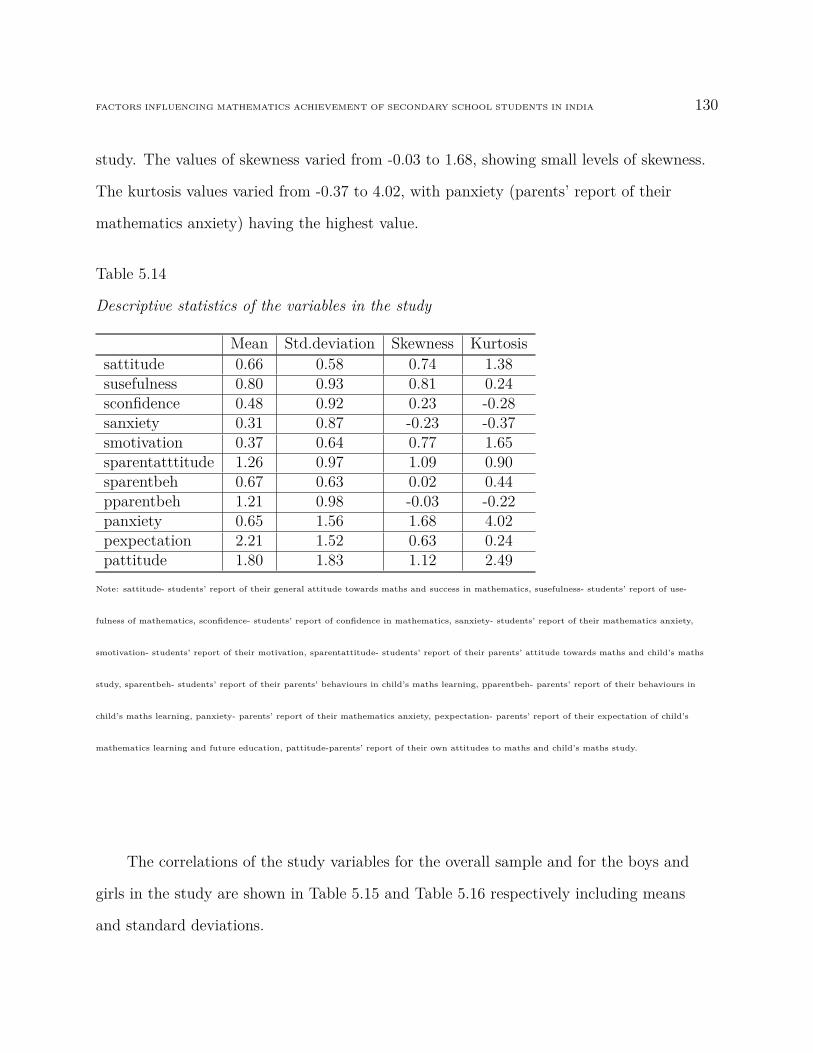
FACTORS INFLUENCING MATHEMATICS ACHIEVEMENT OF SECONDARY SCHOOL STUDENTS IN INDIA 130
study. The values of skewness varied from -0.03 to 1.68, showing small levels of skewness.
The kurtosis values varied from -0.37 to 4.02, with panxiety (parents’ report of their
mathematics anxiety) having the highest value.
Table 5.14
Descriptive statistics of the variables in the study
Mean Std.deviation Skewness Kurtosissattitude 0.66 0.58 0.74 1.38susefulness 0.80 0.93 0.81 0.24sconfidence 0.48 0.92 0.23 -0.28sanxiety 0.31 0.87 -0.23 -0.37smotivation 0.37 0.64 0.77 1.65sparentatttitude 1.26 0.97 1.09 0.90sparentbeh 0.67 0.63 0.02 0.44pparentbeh 1.21 0.98 -0.03 -0.22panxiety 0.65 1.56 1.68 4.02pexpectation 2.21 1.52 0.63 0.24pattitude 1.80 1.83 1.12 2.49
Note: sattitude- students’ report of their general attitude towards maths and success in mathematics, susefulness- students’ report of use-
fulness of mathematics, sconfidence- students’ report of confidence in mathematics, sanxiety- students’ report of their mathematics anxiety,
smotivation- students’ report of their motivation, sparentattitude- students’ report of their parents’ attitude towards maths and child’s maths
study, sparentbeh- students’ report of their parents’ behaviours in child’s maths learning, pparentbeh- parents’ report of their behaviours in
child’s maths learning, panxiety- parents’ report of their mathematics anxiety, pexpectation- parents’ report of their expectation of child’s
mathematics learning and future education, pattitude-parents’ report of their own attitudes to maths and child’s maths study.
The correlations of the study variables for the overall sample and for the boys and
girls in the study are shown in Table 5.15 and Table 5.16 respectively including means
and standard deviations.
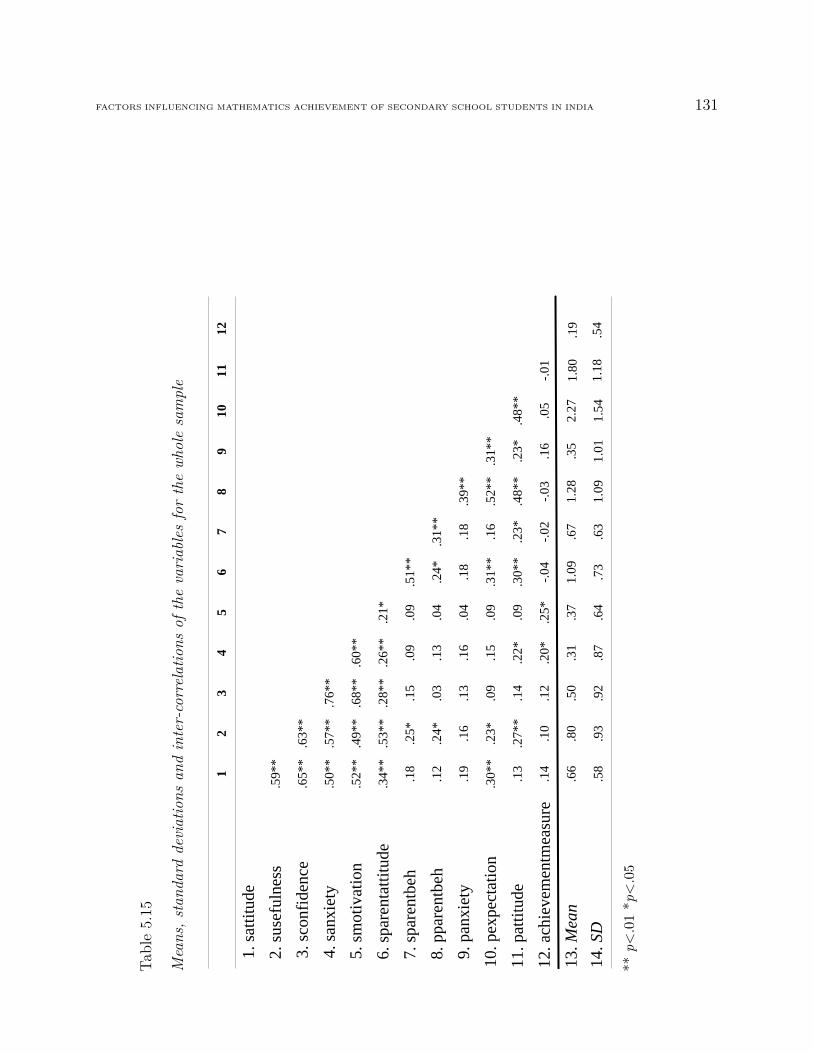
FACTORS INFLUENCING MATHEMATICS ACHIEVEMENT OF SECONDARY SCHOOL STUDENTS IN INDIA 131
Table5.15
Means,s
tand
arddeviations
andinter-correlations
ofthevariablesforthewh
olesample
12
34
56
78
910
1112
1. sa
ttitu
de2.
suse
fuln
ess
.59*
*
.63*
*.6
5**
.57*
*.7
6**
.50*
*
.49*
*.6
8**
.60*
*.5
2**
.53*
*.2
8**
.26*
*.2
1*.3
4**
.25*
.15
.09
.09
.51*
*.1
8
.24*
.03
.13
.04
.24*
.31*
*.1
2
.16
.13
.16
.04
.18
.18
.39*
*.1
9
.23*
.09
.15
.09
.31*
*.1
6.5
2**
.31*
*.3
0**
.27*
*.1
4.2
2*.0
9.3
0**
.23*
.48*
*.2
3*.4
8**
.13
.10
.12
.20*
.25*
-.04
-.02
-.03
.16
.05
-.01
.14
3. sc
onfid
ence
4. sa
nxie
ty5.
smot
ivat
ion
6. sp
aren
tatti
tude
7. sp
aren
tbeh
8. p
pare
ntbe
h9.
pan
xiet
y10
. pex
pect
atio
n11
. pat
titud
e12
. ach
ieve
men
tmea
sure
13. M
ean
.66
.80
.50
.31
.37
1.09
.67
1.28
.35
2.27
.58
.93
.92
.87
.64
.73
.63
1.09
1.01
1.54
1.80
.19
1.18
.54
14. S
D
**p<
.01
*p<
.05
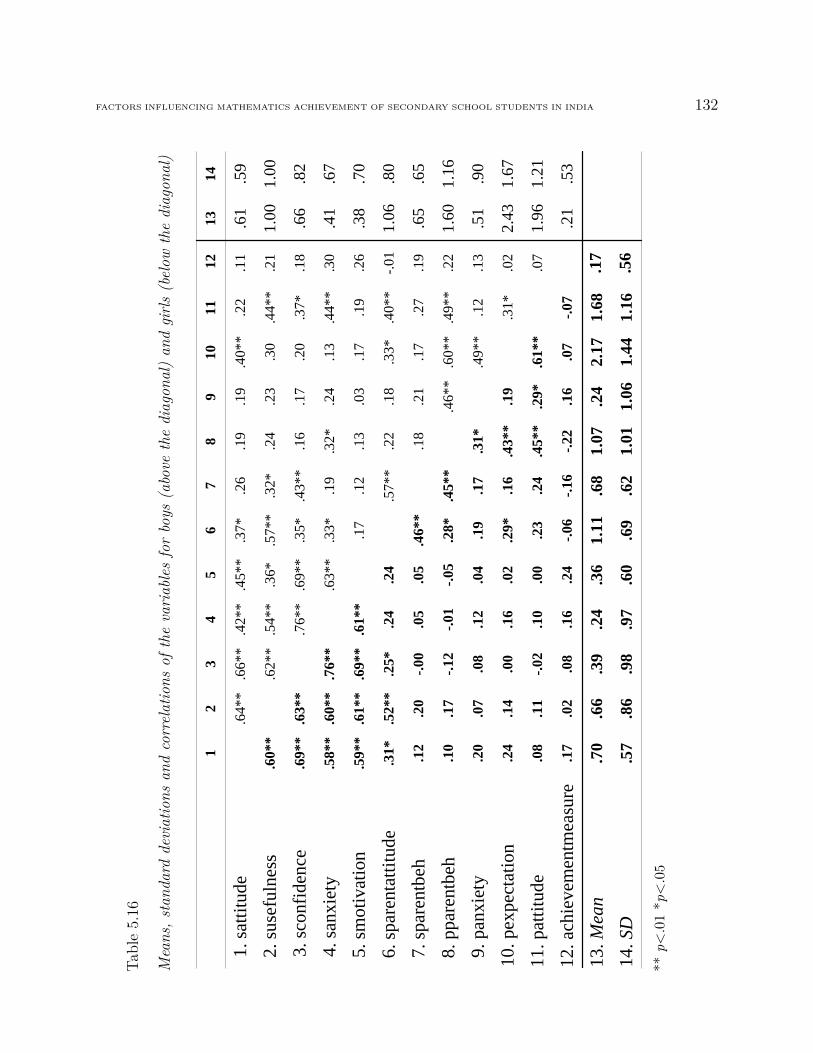
FACTORS INFLUENCING MATHEMATICS ACHIEVEMENT OF SECONDARY SCHOOL STUDENTS IN INDIA 132Ta
ble5.16
Means,s
tand
arddeviations
andcorrelations
ofthevariablesforboys
(above
thediagon
al)an
dgirls
(below
thediagon
al)
12
34
56
78
910
1112
1314
.64*
*1.
satti
tude
2. su
sefu
lnes
s
.66*
*.4
2**
.45*
*.3
7*.2
6.1
9.1
9.4
0**
.22
.11
.61
.59
.62*
*.5
4**
.36*
.57*
*.3
2*.2
4.2
3.3
0.4
4**
.21
1.00
1.00
.60*
*
.63*
*.7
6**
.69*
*.3
5*.4
3**
.16
.17
.20
.37*
.18
.66
.82
.69*
*
.60*
*.7
6**
.63*
*.3
3*.1
9.3
2*.2
4.1
3.4
4**
.30
.41
.67
.58*
*
.61*
*.6
9**
.61*
*.1
7.1
2.1
3.0
3.1
7.1
9.2
6.3
8.7
0.5
9**
.52*
*.2
5*.2
4.2
4.5
7**
.22
.18
.33*
.40*
*-.0
11.
06.8
0.3
1*
.20
-.00
.05
.05
.46*
*.1
8.2
1.1
7.2
7.1
9.6
5.6
5.1
2
.17
-.12
-.01
-.05
.28*
.45*
*.4
6**
.60*
*.4
9**
.22
1.60
1.16
.10
.07
.08
.12
.04
.19
.17
.31*
.49*
*.1
2.1
3.5
1.9
0.2
0
.14
.00
.16
.02
.29*
.16
.43*
*.1
9.3
1*.0
22.
431.
67.2
4
.11
-.02
.10
.00
.23
.24
.45*
*.2
9*.6
1**
.07
1.96
1.21
.08
.02
.08
.16
.24
-.06
-.16
-.22
.16
.07
-.07
.17
3. sc
onfid
ence
4. sa
nxie
ty5.
smot
ivat
ion
6. sp
aren
tatti
tude
7. sp
aren
tbeh
8. p
pare
ntbe
h9.
pan
xiet
y10
. pex
pect
atio
n11
. pat
titud
e12
. ach
ieve
men
tmea
sure
13. M
ean
14. S
D.7
0.6
6.3
9.2
4.3
61.
11.6
81.
07.2
42.
17
.57
.86
.98
.97
.60
.69
.62
1.01
1.06
1.44
1.68
.17
.56
1.16
.21
.53
**p<
.01
*p<
.05

FACTORS INFLUENCING MATHEMATICS ACHIEVEMENT OF SECONDARY SCHOOL STUDENTS IN INDIA 133
All the student variables (sattitude, susefulness, sconfidence, sanxiety) were highly
and significantly associated with each other at the 0.01 level. This result is not
unexpected. The same result was seen when boys and girls are considered separately,
although students’ perceptions of the usefulness of mathematics is slightly less
significantly associated with motivation for boys than it is for girls.
There are some differences, however, when the parent variables are considered.
Students’ perceptions of their parents’ behaviour are significantly correlated with
students’ perceptions of usefulness overall, but this influence seems to be coming from
boys rather than girls, for whom no significant association was seen. Students’
perceptions of their parents’ behaviour was also strongly associated with confidence for
boys but not for girls. A similar finding was seen between parents’ expectation and boys’
attitudes to mathematics. These findings suggest that there may be different interaction
patterns between parents and boys compared with girls. In particular, parents may have
higher expectations for boys.
The correlations indicate that overall student anxiety and student motivation were
significantly associated with mathematics achievement at the 0.05 level. Again this is not
an unexpected finding. None of the other variable appeared to be significantly associated
with mathematics achievement, although it is worth noting that students’ perceptions of
their parents behaviour and parents’ reports of their behaviour appear to be negatively
associated with girls’ achievement, and positively associated with boys’ achievement.
Again the students’ perception of their parents’ attitude to mathematics and parents’
reports of their attitude to mathematics were negatively associated with girls’
achievement, and for the boys students’ perception of their parents attitude to
mathematics was negatively associated with their achievement, but parents’ reports of
their attitude to mathematics were positively associated with their achievement, though
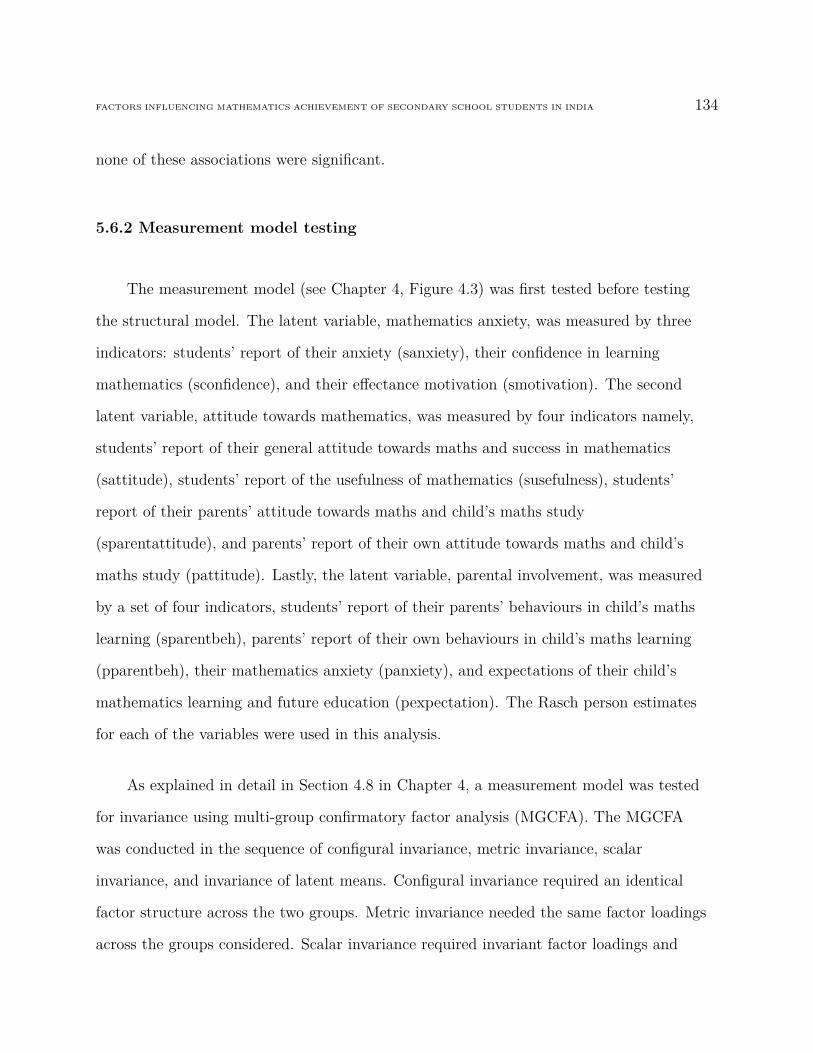
FACTORS INFLUENCING MATHEMATICS ACHIEVEMENT OF SECONDARY SCHOOL STUDENTS IN INDIA 134
none of these associations were significant.
5.6.2 Measurement model testing
The measurement model (see Chapter 4, Figure 4.3) was first tested before testing
the structural model. The latent variable, mathematics anxiety, was measured by three
indicators: students’ report of their anxiety (sanxiety), their confidence in learning
mathematics (sconfidence), and their effectance motivation (smotivation). The second
latent variable, attitude towards mathematics, was measured by four indicators namely,
students’ report of their general attitude towards maths and success in mathematics
(sattitude), students’ report of the usefulness of mathematics (susefulness), students’
report of their parents’ attitude towards maths and child’s maths study
(sparentattitude), and parents’ report of their own attitude towards maths and child’s
maths study (pattitude). Lastly, the latent variable, parental involvement, was measured
by a set of four indicators, students’ report of their parents’ behaviours in child’s maths
learning (sparentbeh), parents’ report of their own behaviours in child’s maths learning
(pparentbeh), their mathematics anxiety (panxiety), and expectations of their child’s
mathematics learning and future education (pexpectation). The Rasch person estimates
for each of the variables were used in this analysis.
As explained in detail in Section 4.8 in Chapter 4, a measurement model was tested
for invariance using multi-group confirmatory factor analysis (MGCFA). The MGCFA
was conducted in the sequence of configural invariance, metric invariance, scalar
invariance, and invariance of latent means. Configural invariance required an identical
factor structure across the two groups. Metric invariance needed the same factor loadings
across the groups considered. Scalar invariance required invariant factor loadings and

FACTORS INFLUENCING MATHEMATICS ACHIEVEMENT OF SECONDARY SCHOOL STUDENTS IN INDIA 135
intercepts across the two groups. Lastly, latent mean differences were tested by
constraining the latent mean for the male group to zero as the male group was kept as
the reference group (Hancock, 1997). The model fit was assessed by examining the
relative chi-square (i.e., χ2/df) value, as the chi-square values were sensitive to sample
size (Byrne, 2001; R. B. Kline, 1998). In addition, the comparative fit index (CFI) and
the root mean square error approximation (RMSEA) were used to assess the overall fit of
the model. A CFI value of 0.95 or greater (Hu & Bentler, 1999), and an RMSEA value of
0.08 or less was considered as a good fit of the model (Browne & Cudek, 1993). In the
case of nested models, difference in CFI (i.e., ∆CFI) was considered to evaluate the fit of
the models (G. W. Cheung & Rensvold, 2002). A non-significant change in CFI (∆CFI)
with a value of less than 0.01 was used for testing the invariance (G. W. Cheung &
Rensvold, 2002).
The hypothesised measurement model was first tested for configural invariance.
That is, the model was tested to check whether the factor structure was identical for both
boys and girls. The model provided a poor fit with fit values, χ2(98) = 196.98, p = 0.00,
χ2/df = 2.0, CFI = 0.79, RMSEA = 0.098 (90% CI = 0.078, 0.118). The indicators
students’ report of their parent attitude towards maths and child’s maths study and the
parents’ report of their attitude towards maths and child’s maths study were removed
due to poor factor loadings. The resultant measurement model was then evaluated and
the model provided an acceptable fit, χ2 (60) = 76.36, p< 0.10, χ2/df = 1.27, CFI =
0.96, RMSEA = 0.051 (90% CI = 0.000, 0.083). All factor loadings showed identical
pattern across boys and girls. Thus configural invariance has been established, showing
that the model has the same factor structure for both boys and girls. The modified
measurement model showing the relationship between the observed variables and the
latent variables is shown in Figure 5.13.
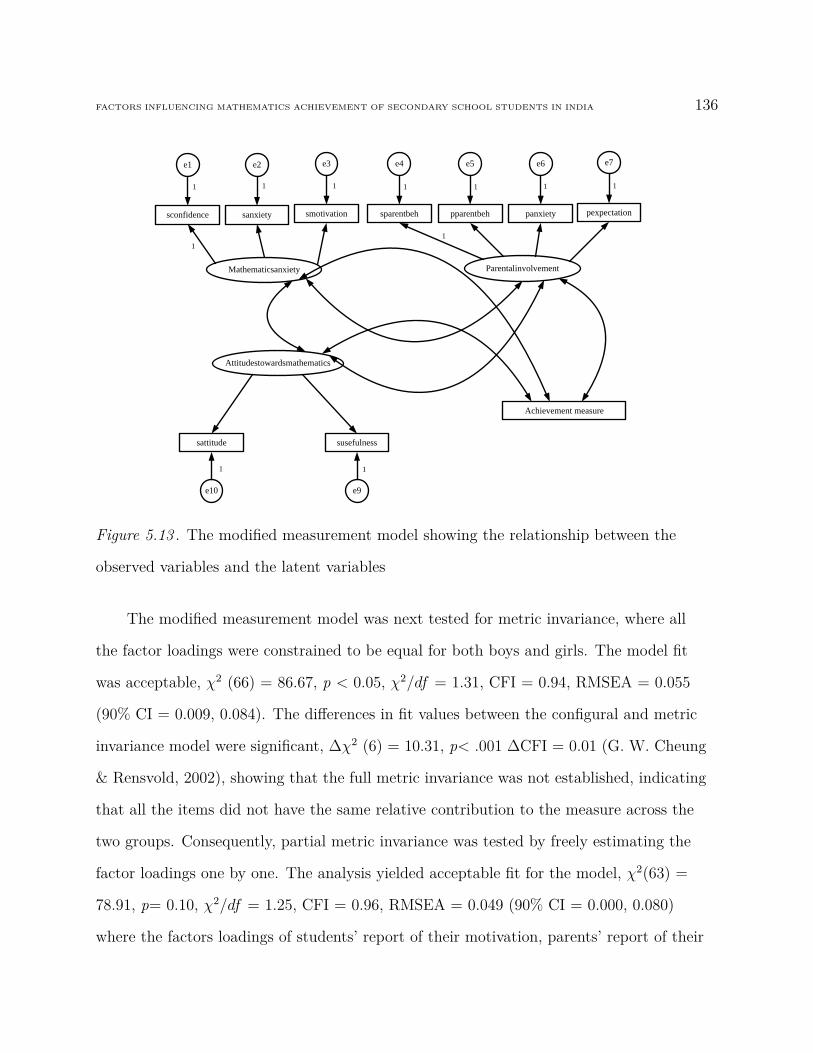
FACTORS INFLUENCING MATHEMATICS ACHIEVEMENT OF SECONDARY SCHOOL STUDENTS IN INDIA 136
Mathematicsanxiety
sconfidence
e1
sanxiety
e2
smotivation
e3
sparentbeh
e4
pparentbeh
e5
sattitude
e10
susefulness
e9
Achievement measure
1
panxiety
e6
pexpectation
e7
1
Attitudestowardsmathematics
Parentalinvolvement
1 1111
1 1
11
Figure 5.13 . The modified measurement model showing the relationship between the
observed variables and the latent variables
The modified measurement model was next tested for metric invariance, where all
the factor loadings were constrained to be equal for both boys and girls. The model fit
was acceptable, χ2 (66) = 86.67, p < 0.05, χ2/df = 1.31, CFI = 0.94, RMSEA = 0.055
(90% CI = 0.009, 0.084). The differences in fit values between the configural and metric
invariance model were significant, ∆χ2 (6) = 10.31, p< .001 ∆CFI = 0.01 (G. W. Cheung
& Rensvold, 2002), showing that the full metric invariance was not established, indicating
that all the items did not have the same relative contribution to the measure across the
two groups. Consequently, partial metric invariance was tested by freely estimating the
factor loadings one by one. The analysis yielded acceptable fit for the model, χ2(63) =
78.91, p= 0.10, χ2/df = 1.25, CFI = 0.96, RMSEA = 0.049 (90% CI = 0.000, 0.080)
where the factors loadings of students’ report of their motivation, parents’ report of their
FACTORS INFLUENCING MATHEMATICS ACHIEVEMENT OF SECONDARY SCHOOL STUDENTS IN INDIA 137
mathematics anxiety and expectation of their child’s mathematics learning and future
education were variant across groups of boys and girls. The differences in the fit values
between this model and the configural invariant model were not significant, ∆χ2 (3) =
2.55, ns, ∆CFI = 0.00 (G. W. Cheung & Rensvold, 2002), indicating that partial
invariance was achieved.
The next step in the testing of the measurement model was to test for scalar
invariance. Scalar invariance was tested with the factor loadings and intercepts equal
across both groups. The model fit was acceptable, χ2 (72) = 102.75, p < .010, χ2/df =
1.43, CFI = 0.92, RMSEA = 0.064 (90% CI = 0.032, 0.091). The differences in the fit
values between the scalar invariant model and the partial metric invariant model were
significant, ∆χ2 (9) = 23.84, p<.001, ∆CFI = 0.04 (G. W. Cheung & Rensvold, 2002),
showing that the full scalar invariance was not supported. Therefore, partial scalar
invariance was evaluated by freely estimating the intercepts one after another. The fit
values of the final model were good, χ2 (69) = 84.89, p = 0.10, χ2/df = 1.23, CFI = 0.96,
RMSEA = 0.047 (90% CI = 0.000, 0.078), where the intercepts of students’ report of
their general attitude towards maths and success in mathematics, parents’ report of their
anxiety, and parents’ report of their behaviours in their child’s maths learning were
variant across the groups. Thus, partial scalar invariance was achieved based on the
non-significant change in the fit indices, ∆χ2(6) = 5.98, ns, ∆CFI = 0.00 (G. W. Cheung
& Rensvold, 2002).
Once partial scalar invariance was established, the model was tested to examine
whether the latent construct means were different across the two groups. The invariance
of latent means was achieved by fixing the latent means for the boys to be zero. The fit
values obtained showed a good fit, χ2(66) = 81.05, ns, χ2/df = 1.23, CFI = 0.96,
RMSEA = 0.047 (90% CI= 0.000, 0.078). The changes in fit values between this model
FACTORS INFLUENCING MATHEMATICS ACHIEVEMENT OF SECONDARY SCHOOL STUDENTS IN INDIA 138
and the partial scalar invariant model were non-significant, ∆χ2 (3) = 3.84, ns, ∆CFI =
0.00 (G. W. Cheung & Rensvold, 2002), showing that all the latent means were invariant
for the groups.
5.6.3 Structural model testing
After establishing an acceptable measurement model, the next step was to test
structural invariance across the groups. Testing of structural invariance involved
examining whether the hypothesised structural paths were invariant for boys and girls. In
the first model, all the regression paths across the latent factors were freely estimated.
The fit of this model to the data was good, χ2 (66) = 81.05, ns, χ2/df = 1.23, CFI =
0.96, RMSEA = 0.047 (90% CI=0.000, 0.078). This baseline model was then compared
with a fully constrained structural model where all the paths were constrained to be equal
across the two groups. The fit of the fully constrained model was good, χ2 (71) = 86.52,
ns, χ2/df = 1.22, CFI = 0.96, RMSEA = 0.046 (90% CI = 0.000, 0.076). The fit value
differences between the baseline model and the full structural model were not significant,
∆χ2 (5) = 5.02, ns, ∆CFI = 0.00 (G. W. Cheung & Rensvold, 2002), indicating that all
the structural paths were invariant for both boys and girls. The unstandardised
regression coefficients enable researchers to compare the strength of one effect across
multiple groups, whereas the standardised regression coefficients enable researchers to
compare the strength of the effects of various predictors on the dependent variable within
the same group. Thus, it would be wise to display unstandardized regression coefficients
to compare effects of given variables across groups (R. B. Kline, 2010). The final
structural model with unstandardised regression coefficients is shown in Figure 5.14.

FACTORS INFLUENCING MATHEMATICS ACHIEVEMENT OF SECONDARY SCHOOL STUDENTS IN INDIA 139
Mathematicsanxiety
sanxiety
0.17
0.20***
-0.04Achievement measure
1 1.54
Attitudestowardsmathematics
Parentalinvolvement
sconfidence pparentbehsparentbehsmotivation panxiety pexpectation
z1
z2
sattitude susefulness
z3
0.67*
-0.04
1
1
1
1 11.27 0.62 3.18 1.52 2.87
0.33
Figure 5.14 . Structural model showing the relationship between the variables in the
study
Figure 5.14 indicates that parental involvement was significantly and positively
associated with attitude towards mathematics but had no significant association with
mathematics anxiety. A significant positive correlation was found between mathematics
anxiety and attitude towards mathematics. The relationship between parental
involvement and mathematics achievement was non-significant. Mathematics anxiety was
not significantly associated with mathematics achievement. The association of attitude
towards mathematics and achievement in mathematics was not significant either.
The previous section presented the results from multi-group analysis. The
multi-group analysis included evaluation of the measurement model as well as the
structural model. The next section presents the findings from the interview data of the
study, which complement the quantitative results.
FACTORS INFLUENCING MATHEMATICS ACHIEVEMENT OF SECONDARY SCHOOL STUDENTS IN INDIA 140
5.7 Findings from the qualitative data
This section describes the findings from the interview data of the study. The
qualitative results were used to complement the quantitative findings of the study. The
results are presented in the order of the major themes identified. The results of the
interview data were presented under the headings of the variables of interest as the
researcher found it best to present the findings from the qualitative data. Certain themes
like future ambition, teacher, and maths course were mentioned by just one or two
parents. They were, therefore, not used to explain the findings of the study even though
these themes were identified during the analysis of the data.
Based on the achievement scores and described in subsection 3.9.2 of Chapter 3, the
students were grouped as high achievers, average achievers, and low achievers. From those
students who consented, a total of twelve pairs (a student and a parent of each) from the
three groups were selected for the interview. Finally, six pairs comprising a student and
his/her father or mother were interviewed for the study. The student and one parent were
interviewed at their residence separately. The student interviews were approximately 30
minutes in duration and the parent interviews approximately 20 minutes. The interview
participants were Maya and her father Baby, Meenu and her mother Jaya, Tony and his
mother Jane, Mary and her mother Lizy, Hema and her mother Rani, and Honey and her
father Mathew. Except for Mary and Honey, either father or mother chose to be present
during the student interview. All the names used here are fictitious, to protect the
identity of the participants. The findings from the interview data of each student-parent
pair are presented in the following sections in the order in which they were interviewed.
FACTORS INFLUENCING MATHEMATICS ACHIEVEMENT OF SECONDARY SCHOOL STUDENTS IN INDIA 141
5.7.1 Maya and her father Baby
When Maya was interviewed, she was 14 years old and was studying in Year 9. She
was the youngest child in her family and had an older brother. Her father was a public
servant and her mother was a housewife. Her score in the mathematics achievement test
in for this study was very poor. She scored in the bottom 20% in the test for this study.
Maya’s father, Baby, was present during her interview.
5.7.1.1 Attitude towards mathematics.
Maya rated herself as an average student in mathematics. She admitted that her
understanding of mathematics was not good and that she found the subject hard. She
said, “I don’t know mathematics very much. But I am not bad in maths.” In her opinion,
mathematics was an important subject, which was clearly expressed in her words; “I
think mathematics in important in my future work.” Her father also had similar views
about mathematics. He said, “Mathematics is the most important subject. I always ask
my children to work hard in mathematics.” Maya named English as her worst subject in
the school. She was also of the opinion that a lot of hard work was needed to succeed in
mathematics.
5.7.1.2 Mathematics anxiety.
Maya admitted that she was always nervous during mathematics tests but she was
confident that she could do better if she worked hard. She said, “I can do better, I could.”
5.7.1.3 Parental involvement.
When Maya was asked about her parents’ involvement in her mathematics home
work, she replied that her parents never helped with or checked her home work but, her
older brother helped her with her home work and other activities related to mathematics.

FACTORS INFLUENCING MATHEMATICS ACHIEVEMENT OF SECONDARY SCHOOL STUDENTS IN INDIA 142
Baby said that as parents he and his wife regularly monitored Maya’s mathematics
progress. Baby was not directly involved in the mathematics learning of his daughter. He
said, “What I meant by helping is that .... I can’t help by teaching them maths, but .....
I help them in other ways.” Baby also said that he had arranged extra tutoring for Maya
because he was unable to help with Maya’s mathematics study. He allotted and
monitored the time Maya spent on other activities like watching TV. Only Saturdays and
Sundays were allotted for activities outside of studies. Maya’s parents were not directly
involved in helping her with her mathematics learning, but they provided extra tutorial
support and encouraged her to work hard to do well. Maya said that her parents were
strict with her because she had much to study. Maya appreciated her parents’
expectations and was eager to improve her results.
In relation to attendance of parent teacher meetings, Baby said that he consulted
Maya’s teachers only when they received her progress report. He also indicated that he
encouraged Maya to do well in mathematics. In his words, “I’m encouraging her to get
more marks and to improve in maths.” Baby said he expected Maya to achieve well in
school and Maya confirmed this, saying that her parents expected her to do all questions
in mathematics and score top marks. Maya said that she would work hard to achieve her
ambition to be a doctor. Baby added that he would help Maya in all respects to achieve
her goal which was emphasised in his words, “My daughter’s ambition is to become a
doctor. I will help her for that.” He also said, “I used to enquire my children’s opinion
and I gave priority to their opinion. I won’t force them to choose my opinion. Their
opinion was important.”
FACTORS INFLUENCING MATHEMATICS ACHIEVEMENT OF SECONDARY SCHOOL STUDENTS IN INDIA 143
5.7.2 Meenu and her mother Jaya
Meenu was 16 years old studying in Year 11 at the time of the interview. Her father
was a public servant and her mother worked as a school teacher. She had an older
brother studying engineering. She scored in the top 15% in the achievement test for this
study. Meenu’s mother, Jaya, was present during her interview.
5.7.2.1 Attitude towards mathematics.
Overall Meenu considered mathematics an easy subject, but she found certain topics
and problems difficult to understand and would skip those topics. She said “I find it
difficult to study that ..... those portions like geometry, calculus.” When asked whether
mathematics was useful for future work, Meenu was unable to give an answer. She was
also of opinion that students need to work hard in mathematics. Meenu rated history as
her worst subject.
5.7.2.2 Mathematics anxiety.
It appeared that Meenu had difficulty with mathematics examinations. She said that
her mind went blank during mathematics tests and she forgot the equations and formulas
to solve the problems. She said “I feel .... I feel my mind went blank and I’ll forget all the
equations ....” Meenu added that she found it difficult to complete a whole test in the
time allowed, although she knew how to solve the problems.
5.7.2.3 Parental involvement.
Meenu indicated that her parents didn’t check her home work or help with her
mathematics work, but they had arranged extra tutoring for her in mathematics. Jaya
explained that she asked Meenu to work out problems in mathematics repeatedly rather
than learning it by heart. Jaya said, “I used to tell her only if you repeatedly do the
FACTORS INFLUENCING MATHEMATICS ACHIEVEMENT OF SECONDARY SCHOOL STUDENTS IN INDIA 144
problems in maths it would be easy for you. She had a tendency to study by-heart, but
as I’ve advised her to study by doing, she is not studying by-heart anymore. She studies
well for the exam, but she makes mistakes.” Jaya said that she was unable to teach
Meenu higher mathematics, only the basics. She also admitted that nobody in the family
was an expert in mathematics.
Jaya explained that she monitored the time Meenu spent on activities other than
studies, especially the time Meenu spent on the internet as well as what she watched on
it. She had even prepared a timetable for Meenu. When Meenu was asked why her
parents monitored the time she spent on watching TV or internet, she was reluctant to
answer the question. But eventually she said, “How can I say that?” Meenu may have
felt that her mother wouldn’t like her talking about their supervision. When asked about
consultations with her daughter’s teachers, Jaya said she met them when Meenu received
her progress reports. Jaya indicated that she did not compel Meenu to study, but advised
her to work hard to achieve her desire. She added that they would give Meenu freedom
to choose the subjects of her interest after Year 12. Meenu said that her parents expected
her to achieve more than 90% in mathematics and to become a doctor. Jaya talked more
about the inefficiency of Meenu’s teachers than her daughters’ achievement. Jaya was of
opinion that Meenu’s maths teacher was not effective in clearing the doubts of the
students. She said that maths teachers at her daughter’s school were not good. Meenu’s
parents expected her to achieve high scores in mathematics and to become a doctor.
Their expectations were communicated to Meenu through consistent reinforcement.
FACTORS INFLUENCING MATHEMATICS ACHIEVEMENT OF SECONDARY SCHOOL STUDENTS IN INDIA 145
5.7.3 Tony and his mother Jane
Tony was 14 years of age, studying in Year 9 when he was interviewed. His father
was an electrician and his mother was a housewife. Tony had an older sister studying
engineering. He scored in the bottom 25% in the achievement test in mathematics for
this study. Jane, Tony’s mother, was present during his interview.
5.7.3.1 Attitude towards mathematics.
Tony considered mathematics a useful subject. He said that mathematics was
important in day-to-day life for buying things. Tony rated himself as an average student
in mathematics and was confident that he could improve his results. He considered his
worst subject in school to be social sciences.
5.7.3.2 Mathematics anxiety.
Tony admitted that he felt anxious during mathematics tests and made mistakes
because of his anxiety. As a result he had to redo the questions and at times he was
unable to complete tests on time.
5.7.3.3 Parental involvement.
Tony said that his parents didn’t help with his mathematics study, but they had
arranged extra tutoring for him. Tony said his parents never checked his home work, but
Jane said that she checked his home work each week. She said, “I used to check his
maths marks because it is important for their future studies.” She was of opinion that
Tony had to improve his mathematics performance, and she consulted Tony’s teachers
once every 2 months to discuss his performance in mathematics. Jane indicated that she
gave advice to her son to study well, and that she monitored his activities. Tony had a
set timetable for watching TV, playing games and for socialising. Jane also mentioned
FACTORS INFLUENCING MATHEMATICS ACHIEVEMENT OF SECONDARY SCHOOL STUDENTS IN INDIA 146
that her son thought that she over advised him.
Tony’s ambition was to become a doctor. When asked about the reason behind his
choice, Tony replied that his only reason was the salary. Tony was unable to answer the
question about his parents’ expectations, but Jane indicated that they didn’t have any
particular profession for Tony in their mind. They were willing to support Tony in
whatever interested him. She said, “It’s up to him, because he should learn what he is
interested in. It’s not our interest, it’s their interests.” They expected him to work hard
in whatever he chose. Tony’s parents consistently communicated to him the importance
of working hard in all subjects and having high achievement.
5.7.4 Mary and her mother Lizy
Mary was 16 years of age at the time of interview and was studying in Year 11 and
was the only child in her family. Her mother was a clerical assistant in a government
organisation and her father was a public servant. She scored in the top 15% in the
achievement test for this study. Neither Mary’s mother nor father was present during her
interview.
5.7.4.1 Attitude towards mathematics.
Mathematics was an easy subject for Mary and she rated herself as a good student in
mathematics. She considered mathematics as a useful subject that is helpful in
day-to-day living, in studying other subjects, and for developing problem solving ability.
History was considered by Mary to be her worst subject in school.
5.7.4.2 Mathematics anxiety.
Mary admitted that she was not nervous during mathematics tests. She said, “I’m
FACTORS INFLUENCING MATHEMATICS ACHIEVEMENT OF SECONDARY SCHOOL STUDENTS IN INDIA 147
not at all nervous while writing the exam. I felt quite normal.” She was confident that
she could score more than 80% in mathematics.
5.7.4.3 Parental involvement.
Mary indicated that neither of her parents helped her in her mathematics study nor
checked her mathematics homework. However, Lizy said she checked Mary’s homework
daily. She said that she was not able to teach Mary mathematics, but only science
subjects. Mary said that her parents had arranged extra tutoring in mathematics for her.
Mary said that her tuition master, her mathematics teacher, and her friends helped her
in mathematics study. Lizy indicated that she was involved in all aspects of her
daughters’ study. She said, “I’m involved in all the activities of my child in the school. I
used to buy the books required for her studies and I also went to the school and
contacted the teachers about her progress.”
Lizy was satisfied with her daughter’s performance in mathematics. She said that
Mary scored good marks in mathematics and was doing well in the subject. Mary also
indicated that her parents were satisfied with her achievement. Mary’s parents supervised
her non-academic activities. They had given her permission to watch TV for 2 hours only
on weekends and to socialise with friends. In Mary’s opinion her parents wanted her to
work hard to achieve A’s and A+’s in her studies. When asked about her ambition, Mary
replied that she wanted to become a doctor. She explained that her parents also expected
her to choose the profession of a doctor. She said, “It is my mother. She love ... she says
that she ... she wanted to become a doctor, but she can’t do that, she can’t do it, but she
is asking me, I’m not telling that she is ... She wanted to become a doctor, but she can’t
...” Lizy also expressed her desire for Mary to become a doctor, saying, “I don’t have any
particular desire. She wishes to join medicine. I support that. When I was a student I
too wished to become a doctor, but I couldn’t. I don’t compel her to become such and

FACTORS INFLUENCING MATHEMATICS ACHIEVEMENT OF SECONDARY SCHOOL STUDENTS IN INDIA 148
such, but from her earlier days I managed to generate an ambition in her. So now she is
interested in going to medicine.” Mary’s mother communicated her expectations and
attitudes to Mary through strict supervision of her behaviour.
5.7.5 Hema and her mother Rani
Hema was studying in Year 11 and was 16 years old at the time of the interview. Her
father was working in the Middle East and her mother was a house-wife. She had one
older brother. Hema was an average student in mathematics and her score in the
mathematics achievement test for this study was close to the mean. Hema’s mother,
Rani, was present during her interview.
5.7.5.1 Attitude towards mathematics.
Hema considered mathematics as an interesting subject and rated herself as an
average student. She added that she liked to do maths and found it interesting. She
regarded mathematics as a useful subject, helpful in everything she did. Mathematics was
the most difficult subject for Rani, but she indicated that mathematics was important as
it helped in securing jobs in the banking or engineering sector. Hema considered Physics
as her worst subject in school. She explained that she was unable to understand anything
in Physics. When asked whether her difficulty in Physics was because of mathematical
problems in the subject, she replied that it was due to the method of teaching.
5.7.5.2 Mathematics anxiety.
Hema said that she was not at all anxious during mathematics test. Her mind was
free during the test and was confident in her mathematical ability. She said, “If I study
then I can write it well.”
FACTORS INFLUENCING MATHEMATICS ACHIEVEMENT OF SECONDARY SCHOOL STUDENTS IN INDIA 149
5.7.5.3 Parental involvement.
Hema’s mother had been able to help Hema with mathematics work until Year 8.
From Year 9 her parents arranged extra tutoring for her in mathematics. Her teachers
and friends also helped her with mathematics work. Rani said she would check Hema’s
homework, but now she was not doing it daily. Instead, Rani supervised the overall
activities of her daughter. She said, “I watch all activities of my child. During exam
times we monitor her a lot. I used to check her homework before, but nowadays I don’t
check her homework daily. I tell her to study maths thoroughly and to go to school and
talk to the teachers.” She also encouraged Hema to finish all her assignments in time.
Rani seemed not to be satisfied with Hema’s recent performance in mathematics. She
said that her daughter was not spending enough time in learning mathematics, but was
interested in watching TV and socialising with friends. Hema’s ambition was to become a
doctor or an engineer. She explained that she liked computer engineering very much and
at the same time she liked to help others. But Rani expected Hema to score above 80%
in Year 12 and to get a government job in future. Though Hema wanted to be a doctor
or an engineer, she also agreed with her mother. She mentioned, “nowadays medicine and
engineering, they are not at all that valuable, I think nowadays they are ... they’re easily
available. I think ... I think so, and if we get a government job then we can ... we can ...
it will be a permanent one.” Her parents consistently communicated their expectations
and attitudes to her and had put in place practices that helped Hema to work hard.
5.7.6 Honey and her father Mathew
Honey was 13 years of age and was studying in Year 9 when she was interviewed.
She was the only child in her family. Her father was a public servant and her mother was
FACTORS INFLUENCING MATHEMATICS ACHIEVEMENT OF SECONDARY SCHOOL STUDENTS IN INDIA 150
a housewife. Honey was an average student in mathematics and her score in the
achievement test in mathematics for the study placed her in the average achievement
category. Neither Honey’s father nor mother was present during the interview.
5.7.6.1 Attitude towards mathematics.
Honey rated herself as an average student in mathematics. She considered
mathematics to be an important subject if one was good at it. Mathew thought that
Honey was not good at mathematics. He said, “For maths, she is not that good. So I’ve a
little tension about it.” Honey rated chemistry as the most difficult subject for her in
school.
5.7.6.2 Mathematics anxiety.
Honey admitted that she felt tense while taking mathematics tests. She said she
found it difficult to do the tests because she forgot what she had studied. She explained
that when she sat for a mathematics examination, her mind would go blank and she was
not able to do well in the examination. She was not satisfied with her own performance.
5.7.6.3 Parental involvement.
Honey’s parents were not much involved in her mathematics learning. She said that
her parents didn’t check her homework or help her with mathematics work, but they
always insisted that she finished her homework and learned mathematics. Mathew
admitted that he was not involved in his daughter’s mathematics studies, but he could
teach her social sciences. He said he did not have enough time to help her and indicated
his inability to teach higher mathematics. Mathew added that his wife helped Honey
more than he did with the school subjects. When asked about her parent’s behaviours in
monitoring activities other than studies, Honey said, “always telling me to study. Don’t
watch TV all time. Because studying is very important”.
FACTORS INFLUENCING MATHEMATICS ACHIEVEMENT OF SECONDARY SCHOOL STUDENTS IN INDIA 151
Honey’s parents had arranged extra tutoring in mathematics and Honey said that
tuition teacher helped her with mathematics. Mathew explained that, “For maths, she is
not that good. So I’ve a little tension about it, but I can’t teach her maths. So I’ve
arranged tuition for maths and tell her to study well on maths.” Honey also admitted
that her parents were not happy with her performance in mathematics. When Honey
received her progress reports Mathew would consult Honey’s mathematics teacher and
discuss her performance. Mathew expected his daughter to study well according to her
interests. He also added that not everyone can become an engineer or a doctor or reach
high administrative positions. He wanted his daughter to have a good job. Honey also
talked about her parents’ expectations in a similar way. She said, “My father use to say
he doesn’t have any specific desires. He says I should get a good job, I need to stand on
my own feet, and that’s all.” Her father had communicated his expectations and attitudes
to her consistently through his parenting behaviours.
5.8 Summary of the findings from the qualitative data
Overall the students indicated mathematics was a useful subject. They agreed that
mathematics was helpful in the study of other subjects and also in securing a good job
for the future. The students expressed mixed feelings about their performance in
mathematics. For example, four of the six students interviewed, Maya, Tony, Hema, and
Honey, rated themselves as average students in mathematics. The actual performance of
Maya, Tony and Honey on the achievement test used in the study were below average.
Meenu and Mary rated herself as an above average student in mathematics and Meenu,
Mary and Hema performed in the above average category in the subject according to the
test used in this study. The achievement test results in the study for Meenu and Mary
were consistent with their own estimation of their ability in mathematics.
FACTORS INFLUENCING MATHEMATICS ACHIEVEMENT OF SECONDARY SCHOOL STUDENTS IN INDIA 152
Students had mixed reactions when asked about their mathematics anxiety. Maya
admitted that she was nervous during mathematics tests. Meenu also reported
experiencing difficulty during mathematics tests. Mathematics anxiety affected her to the
extent that during mathematics tests she forgot the formulas and equations.
Nevertheless, she was able to score above 80% in mathematics. The same was expressed
by Tony who added that he made mistakes in mathematics tests because of anxiety. As
for Honey she said she forgot everything she learned while attempting a mathematics
test. On the contrary, Mary and Hema were never nervous during mathematics tests.
None of the parents were directly involved in the mathematics learning of their
children. All the parents found it difficult to teach the secondary mathematics content.
Mary’s mother mentioned that she was able to help her daughter with science subjects
and Mathew, Honey’s father, helped her with social science. None of the parents were
involved in checking homework or helping their children with mathematics work. In all
cases, it was their older siblings, teachers, friends or tuition masters who helped the
students with mathematics.
All the parents wanted their children to work hard and achieve their best in studies.
They instilled their beliefs and expectations to the children in a similar fashion. They
had communicated to their children that studies were important, encouraged their
children to work hard, score good marks and secure a good job. All of the parents
expected their children to achieve highly in mathematics. They tended to be strict and
observant of their child’s extra-curricular activities. All of the parents who were
interviewed strictly limited their children’s time spent watching TV, engaging in online
activities, and socialising with friends. In Maya’s case only Saturdays and Sundays were
allotted for extra-curricular activities and Meenu had permission to watch TV only for 2
hours during weekends. Hema and Tony had a time table for activities outside their
FACTORS INFLUENCING MATHEMATICS ACHIEVEMENT OF SECONDARY SCHOOL STUDENTS IN INDIA 153
studies. Only one of the parents consulted their child’s mathematics teacher other than
when progress reports were received. The parents expressed their willingness to support
their children in the pursuit of their dream.
5.9 Conclusion
This Chapter has presented the results of the study from quantitative and
qualitative data obtained. The empirical model (see section 5.6.3) showed that parental
involvement has a significant positive relationship with attitude towards mathematics.
No significant association was observed between mathematics anxiety and parental
involvement. Mathematics anxiety and attitude towards mathematics were found to be
positively correlated. The model also showed that none of the variables had a significant
relationship with the mathematics achievement of the students. No gender differences
were observed in any of the variables studied. From the qualitative data, it was found
that parents expressed high expectations about their children’s education and future
career and the students were mindful of these. The next chapter, Chapter 6, discusses the
findings of the study in relation to the research questions defined in Chapter 1 based on
the conceptual framework presented in Section 1.2 in Chapter 1 and shown in Figure 1.1.
FACTORS INFLUENCING MATHEMATICS ACHIEVEMENT OF SECONDARY SCHOOL STUDENTS IN INDIA 154
CHAPTER 6 DISCUSSION AND CONCLUSION
6.1 Introduction
As discussed in Chapter 2, previous research has demonstrated the importance of
mathematics achievement for secondary school students in relation to tertiary
mathematics success, achievement in science subjects, future career choices, and quality
of life (Halpern et al., 2007; Murrane et al., 1995). Nevertheless, the number of students
opting for the most demanding mathematics courses and mathematics related subjects at
the higher secondary level has declined in many countries (e.g., Goodrum, Druhan, &
Abbs, 2011; Lowell & Salzman, 2007; Schleicher & Ikeda, 2009; Smith, 2011). India has
also experienced a decline in the number of graduates choosing mathematics related
career options (e.g., Garg & Gupta, 2003; Mishra, 2011).
A majority of the research studies on mathematics anxiety, attitude towards
mathematics, and parental involvement as factors influencing mathematics achievement
have been carried out in western contexts. There is a dearth of such studies on these
variables among Indian students, particularly at the secondary level. Furthermore, in
research to date, the variables mathematics anxiety, attitude towards mathematics and
parental involvement have been studied separately to understand the influence of each on
mathematics achievement, and in pairs to understand their interaction with each other or
their combined effect on mathematics achievement. There appear to be no studies
conducted among secondary school students that combine variables mathematics anxiety,
attitude towards mathematics, and parental involvement, and particularly in India. This
study investigated the influence of Indian secondary school students’ mathematics
anxiety, attitude towards mathematics, and parental involvement on their mathematics

FACTORS INFLUENCING MATHEMATICS ACHIEVEMENT OF SECONDARY SCHOOL STUDENTS IN INDIA 155
achievement. Additionally, the study investigated the inter-relationships among these
constructs and the effect of gender on these relationships.
6.2 Overview of the findings of the current study
This chapter begins with a brief overview of the study’s findings in comparison with
those of other studies. Subsequent sections address each of the research questions in turn.
These were:
1. How does parental involvement in learning influence mathematics achievement of
secondary school students in India?
2. How does attitude towards mathematics influence mathematics achievement of
secondary school students in India?
3. How does mathematics anxiety influence mathematics achievement of secondary
school students in India?
4. How do parental involvement, attitude towards mathematics and mathematics
anxiety interact to influence the mathematics achievement of secondary school
students in India?
5. Are there gender differences in relation to any of these variables and/or their
relationships?
The study found that mathematics anxiety was not significantly associated with
mathematics achievement of the students. The association of attitude towards
mathematics and achievement in mathematics was also not statistically significant. These
FACTORS INFLUENCING MATHEMATICS ACHIEVEMENT OF SECONDARY SCHOOL STUDENTS IN INDIA 156
findings of the non-significant relationship of mathematics anxiety to achievement in
mathematics, and attitude towards mathematics to achievement in mathematics are not
in agreement with majority of the findings in the broader research context. For example,
the non-significant relationship between mathematics anxiety and mathematics
achievement contradicts the findings of H. Z. Ho et al. (2000) and Woodard (2004), who
found a significant negative association between mathematics anxiety and achievement in
mathematics. Other researchers have observed a significant positive relationship between
attitude towards mathematics and mathematics achievement (e.g., Nicolaidou &
Philippou, 2003; Singh et al., 2002).
The inconsistencies in the relationship between mathematics anxiety and
mathematics achievement, and between attitude towards mathematics and mathematics
achievement in the present study and the above mentioned studies could be due to the
differences in the conceptualisation and measurement of the constructs, or the
participants. For instance, the current study looked at the relationship between
mathematics anxiety and achievement in mathematics among Year 9 and Year 11
students in India. Mathematics anxiety was measured by students’ perception of their
anxiety, their confidence in learning mathematics, and their motivation, and parents’
perception of their own mathematics anxiety in this study. An achievement test in
mathematics measured the mathematics performance of the participants. Ho and his
colleagues (2000) in their cross-national study compared the dimensions and levels of
mathematics anxiety and its association with mathematics achievement among 6th
graders in China, Taiwan, and United States. Mathematics anxiety was measured using
the 11-item Maths Anxiety Questionnaire (MAQ) representing the cognitive and affective
dimensions of the construct. Mathematics achievement of the participants was measured
using a mathematics test comprising two forms (Test 1 & Test 2), administered within a
FACTORS INFLUENCING MATHEMATICS ACHIEVEMENT OF SECONDARY SCHOOL STUDENTS IN INDIA 157
gap of 4-6 weeks. Woodard (2004) studied the relationship between mathematics anxiety
and achievement in mathematics among undergraduate students in the US and the
differences in mathematics anxiety in terms of gender and age, using the 98-item
Mathematical Anxiety Rating Scale(MARS).
In assessing the relationship between attitude towards mathematics and
mathematics achievement,the current study measured attitude towards mathematics in
terms of students’ perception of their general attitude towards maths and success in
mathematics, and their perception of usefulness of mathematics, students’ perception of
their parents’ attitude to maths and their child’s maths study, and parents’ perception of
their own attitude to maths and child’s maths study. The mathematics performance of
the participants was measured using an achievement test in mathematics. In the
Nicolaidu and Philippou (2003) study, attitude towards mathematics was measured using
three scales: an eleven point scale measuring their attitudes, a scale of five pictures
measuring expressions about the subject, a third scale of 5-point Likert-type statements
measuring feelings towards the subject. The participants’ problem solving ability was
measured using a combination of ten word-problems, nine routine problems, and one
procedure problem. On the other hand, Singh and her colleagues in their 2002 study
measured the construct using three items asking the participants their preparedness to
maths class, usefulness of maths in future, and their interest in the subject. The
participants in Nicolaidu and Philippou (2003) study were fifth grade students and Singh
et al. (2002) study were eighth graders, whereas the participants of this study were Year
9 and Year 11 students in India.
In this study, the relationship between parental involvement and mathematics
achievement was non-significant. This is inconsistent with the results of studies that have
found a positive association between specific parental involvement activities such as

FACTORS INFLUENCING MATHEMATICS ACHIEVEMENT OF SECONDARY SCHOOL STUDENTS IN INDIA 158
parent-child communication and parental encouragement in mathematics learning and
mathematics achievement (X. Fan & Chen, 2001; Jeynes, 2005). The inconsistencies in
the results may be due to the fact that in Fan and Chen (2001) study parental
involvement was indicated by parental aspiration/expectation for their child’s educational
achievement, and parental home supervision and in Jeynes (2005) study the construct
was conceptualised as parental communication, and spending time with their children,
parental style, parental expectations, and parental involvement in school activities.
Whereas in the present study, parental involvement was conceptualised in a broader sense
in terms of parental participation in school-related activities (such as monitoring of home
study and attending parent-teacher interviews), parental encouragement of academic
success, and parental expectations of educational attainment and parenting style.
The results of the present study is also inconsistent with that of Catsambis (1988)
who reported a negative association between academic achievement of eighth graders and
parental involvement indicated by parents’ supervision of their children’s academic and
behavioural activities (e.g., maintaining good grade average, doing chores at home,
completing homework) using National Educational Longitudinal Study of 1988
(NELS:88) data. In 2008, in a research synthesis of studies of parental involvement in
homework, Patall, Cooper, and Robinson (2008) found a negative association between
parental involvement in home work and mathematics achievement in the three studies
that used either National Educational Longitudinal Study (NELS:88) data or any one of
the National Educational Longitudinal Study (NELS) follow-up data on the same sample
(in 1990, 1992, 1999, or 2000). In addition, they also found a negative relationship
between parental involvement in homework and mathematics achievement in the meta
analysis of another set of correlational studies in the synthesis (Patall, Cooper, &
Robinson, 2008). Thus there is inconsistency in the results in relation to parental
FACTORS INFLUENCING MATHEMATICS ACHIEVEMENT OF SECONDARY SCHOOL STUDENTS IN INDIA 159
involvement and mathematics achievement. In both cases Patall, Cooper, and Robinson
(2008) assessed how parental involvement in homework influenced mathematics
achievement. The present study used a broader conceptualisation of parental involvement
as explained in Chapter 1, section 1.2.3.
A significant positive correlation was found in the present study between
mathematics anxiety and attitude towards mathematics which is inconsistent with most
of the research findings in the literature. For example, this finding contradicts the finding
of a negative correlation between mathematics anxiety and attitude towards mathematics
by Durrani and Tariq (2009) and Kargar, Tarmizi, and Bayat (2010). The participants in
the present study were Year 9 and Year 11 students, whereas Durrani and Tariq’s (2009)
and Kargar et al. (2010) studies involved undergraduate students. The contradictory
findings could also be due to the differences in the measurement of the constructs.
Durrani and Tariq’s (2009) study measured mathematics anxiety using three subscales
namely maths text anxiety , numerical task anxiety, and maths course anxiety. Kargar
and his colleagues (2010) used two subscales namely, Learning Math Anxiety scale and
Math Evaluation Anxiety scale to measure the construct. The current study used the
subscales the Anxiety scale, the Confidence in learning mathematics scale, the Effectance
motivation in mathematics scale and Parent maths anxiety scale. In measuring attitude
towards mathematics, Durrani and Tariq’s (2009) study used four subscales measuring
confidence in the subject, usefulness of the subject, motivation for further mathematics
study, and mathematics enjoyment. On the other hand, Kargar and his colleagues (2010)
study used three subscales namely, Self confidence scale, Value-Enjoyment scale, and
Motivation scale and the present study used four subscales measuring students’
perception of their general attitude towards maths and success in mathematics, parents’
attitude to maths and child’s maths study, usefulness of mathematics, and parents’
FACTORS INFLUENCING MATHEMATICS ACHIEVEMENT OF SECONDARY SCHOOL STUDENTS IN INDIA 160
perception of their own attitude to maths and child’s maths study.
There is a paucity of research studies investigating the influence of parental
involvement on mathematics anxiety and attitude towards mathematics. In a recent
study investigating whether mathematics anxiety serves as a mediator in the relationship
between parental involvement and mathematics achievement Vukovic, Roberts, and
Wright (2013) found that parental involvement reduced mathematics anxiety in
influencing mathematics achievement among second grade students in the United States.
The present study found a non-significant association between parental involvement and
mathematics anxiety involving secondary school students. The differences in the findings
could be due to cultural differences in which parents were involved, or age of the
participants. The participants in Vukovic, Robert, and Wright’s (2013) study were
second graders of an ethnic minority and from a low-income background living in the
United States, whereas the present study involved Year 9 and Year 11 students from a
middle class socio-economic group in India. The parents in the Vukovic, Robert, and
Wright’s (2013) study were directly involved in the mathematics learning of their child.
In the current study the parents were not directly involved in their child’s learning in
mathematics, but acted as providers. The association between parental involvement and
attitude towards mathematics was significant and positive in this study. These findings
are discussed in detail in the following sections.
6.2.1 Research Question: 1 How does parental involvement in learning
influence the mathematics achievement of secondary school students in India?
The current study investigated the association between parental involvement and
mathematics achievement and found no significant relationship between the variables.
FACTORS INFLUENCING MATHEMATICS ACHIEVEMENT OF SECONDARY SCHOOL STUDENTS IN INDIA 161
This result supports the findings of, for example, El Nokali, Bachman, and Votruba-Drzal
(2010), who found that parental involvement was not significantly related to mathematics
achievement among elementary school students in the United States. In their study
parental involvement dimensions included were parental encouragement of a child’s
education, parental investment (value placed on education by parents), and parents’
educational attitudes (parents’ educational goals for their child). Hemalatha and Sabitha
(2009) also found that parental involvement had no significant relationship with the
academic achievement of Year 9 students in Kerala, India, the same region as was the
location of the current study.
Research studies have also reported the positive influence of parental involvement in
the mathematics achievement of students in general. For example, studies have found
that parental involvement in the form of parental encouragement to pursue higher
education, communication between parent and child influences mathematics achievement
of high school students (e.g., Jeynes, 2005; Catsambis, 2001).
The construct was defined in Hemalatha and Sabitha’s (2009) study as the amount
of participation of parents’ in their child’s study and other activities. The present study
produced a similar finding even though it used a broader conceptualisation of parental
involvement in terms of parental involvement as parental participation in school-related
activities (such as monitoring of home study and attending parent-teacher interviews),
parental encouragement of academic success, and parental expectations of educational
attainment and parenting style.
Generally, involvement of parents in the education of their children in terms of
specific behaviours decreases as the students progress through their schooling (Griffith,
1998; Stevenson & Baker, 1987). The non-significant relationship between parental

FACTORS INFLUENCING MATHEMATICS ACHIEVEMENT OF SECONDARY SCHOOL STUDENTS IN INDIA 162
involvement and mathematics achievement in this study may have been because the
parents were not directly involved in the mathematics learning of these students who
were in Year 9 or Year 11, but rather acted as resource providers and motivators. In
particular, the qualitative results from the parent data in this study indicated that
parents were indirectly helping the students in their mathematics education by arranging
extra tutorials, buying text books, and encouraging them to score better.
6.2.2 Research Question: 2 How does attitude towards mathematics influence
mathematics achievement of secondary school students in India?
The effect of attitude towards mathematics on the mathematics achievement of
students was investigated in this study. The study found a non-significant relationship
between attitude towards mathematics and mathematics achievement. This result is in
agreement with the findings of Chagwiza, Mutambara, Tatira, and Nyaumwe (2013) who
also found no significant relationship between attitude towards mathematics and
achievement in mathematics for secondary school students from three urban schools in
Bindura, Zimbabwe. The finding of the current study is, however, contrary to the broad
consensus of the literature. For example, K. C. Cheung (1988) found that attitude
towards mathematics positively influenced mathematics achievement of Grade 7 students
based on the second International Association for the Evaluation of Educational
Achievement (IEA) mathematics study, the Second International Mathematics Study
(SIMS), data from Hong Kong, showing that the more positive attitude students have for
mathematics, the higher will be their mathematics achievement. More recently, in the
Trends in International Mathematics and Science Study (TIMSS), it was found that
among the Year 8 students in the participating countries, on an average, attitude towards
mathematics was found to have a positive influence on mathematics achievement
FACTORS INFLUENCING MATHEMATICS ACHIEVEMENT OF SECONDARY SCHOOL STUDENTS IN INDIA 163
(Thomson, Hillman, & Wernert, 2012).
In the TIMSS study (Thomson, Hillman, & Wernert, 2012), the construct attitude
towards mathematics was conceptualised in terms of students’ attitude towards
mathematics in general, the value of mathematics for improving lives, and self-confidence
in mathematics. Attitude towards mathematics was conceptualised in this study as
general attitude towards maths and success in mathematics, and usefulness of
mathematics; self confidence in mathematics was not included in the conceptualisation of
the construct. In the present study, attitude towards mathematics was measured using
four measures, students’ perception of their general attitude towards maths and success
in mathematics, and their perception of usefulness of mathematics, students’ perception
of their parents’ attitude to maths and their child’s maths study, and parents’ perception
of their own attitude to maths and child’s maths study. The inconsistency in the findings,
compared with previous studies, could be due to these differences in the conceptualisation
and to differences in the measures employed for the assessment of the construct in the
studies. The participants in the Trends in International Mathematics and Science Study
(TIMSS) study were Year 8 students, whereas the present study involved Year 9 and
Year 11 students. In addition, the current study used students’ and parents’ self reports
to measure the construct, whereas the TIMSS study (Thomson, Hillman, & Wernert,
2012) used only students’ reports. In addition, the qualitative results of this study
suggest that at least some Indian students are motivated to work hard and achieve highly
in mathematics even when they find it difficult. A tendency to work hard even when
one’s attitude to the subject is negative could result in relatively high achievement.
FACTORS INFLUENCING MATHEMATICS ACHIEVEMENT OF SECONDARY SCHOOL STUDENTS IN INDIA 164
6.2.3 Research Question: 3 How does mathematics anxiety influence
mathematics achievement of secondary school students in India?
The study tested the association between mathematics anxiety and the mathematics
achievement of secondary school students and found a non-significant relationship
between the variables. This is in contrast to the previously reported research findings.
For example, Ma (1999) found a significant, but small negative correlation between
mathematics anxiety and achievement in mathematics in his meta-analysis of the studies
of mathematics anxiety. The participants in Ma’s study were students from Grade 4 to
Grade 12 in the United States, Thailand, Australia, Lebanon, Israel, and New Zealand.
Among Indian students, researchers have also reported a negative correlation between
mathematics anxiety and achievement in mathematics (Karimi & Venkatesan, 2009;
Khatoon & Mahmood, 2010), that is higher, the level of anxiety, the lower the
achievement.
In a culture like India that emphasises a person’s intellectual abilities and assigns
positions in society based on academic achievement, it is very common for students to
experience stress in academic endeavours (Deb, Chatterjee, & Walsh, 2010; Verma, 1998).
Indian parents maintain high expectations about their child’s academic performance to
get admission to esteemed courses like medicine, engineering or law in prestigious
institutions (Deb et al., 2010; Verma, Sharma, & Larson, 2002). Thus the Indian children
may feel pressured to live up to their parents’ expectations (Liu, 1998) and this might
contribute to mathematics anxiety. In India more emphasis is placed on academic
achievement than on extra curricular activities (Verma et al., 2002). Consistent with
these findings, interview data in this study revealed that parents had high expectations
concerning their children’s academic achievement and future careers and that the
FACTORS INFLUENCING MATHEMATICS ACHIEVEMENT OF SECONDARY SCHOOL STUDENTS IN INDIA 165
students were willing to fulfil their parent’s expectations. Some researchers suggest that
certain level of anxiety can act as a motivating factor (H. Z. Ho et al., 2000; J. Lee,
2009). Because academic success is regarded as a necessity in the Indian context, it could
be that students in this study, but not in those of Karimi and Venkatesan (2009) and
Khatoon and Mahmood (2010), were determined to study well and to prove themselves,
and hence achieved highly even though they experienced anxiety.
6.2.4 Research Question: 4 How do parental involvement, attitude towards
mathematics and mathematics anxiety interact to influence the mathematics
achievement of secondary school students in India?
The present study investigated the relationship between mathematics anxiety,
attitude towards mathematics, and parental involvement. The findings revealed a
significant positive correlation between mathematics anxiety and attitude towards
mathematics, that is higher the anxiety in relation to mathematics, the more positive the
attitude towards mathematics. This contradicts the findings of most earlier studies. For
example, Durrani and Tariq (2009) found that greater mathematics anxiety was
associated with poorer attitude towards mathematics in the context of the development
of perceptions of competence in numeracy skills among undergraduate students at the
University of Central Lancashire. Kargar et al. (2010) also found a negative correlation
between mathematics anxiety and attitude towards mathematics among university
students in Malaysia. The participants in Durrani and Tariq’s (2009) and Kargar et
al.(2010) studies were undergraduate students, whereas the participants of this study
were Year 9 and Year 11 students in India.
Durrani and Tariq (2009) in their study measured mathematics anxiety using a
FACTORS INFLUENCING MATHEMATICS ACHIEVEMENT OF SECONDARY SCHOOL STUDENTS IN INDIA 166
mathematics anxiety scale with three subscales namely, maths text anxiety (measuring
fear pertaining to preparing for or taking a test in mathematics/numeracy), numerical
task anxiety (measuring apprehension relating to execution of numerical operations), and
maths course anxiety (measuring stress associated with studying and learning in or for a
maths class. They used an attitude towards mathematics scale with four subscales
measuring, personal confidence about the subject matter, usefulness of the subject’s
content, motivation to pursue studies in mathematics, and enjoyment of
mathematics/numeracy to evaluate the variable attitude towards mathematics (Durrani
& Tariq, 2009). Kargar et al. (2010) measured mathematics anxiety using Mathematics
Anxiety Rating Scale (MARS-R) with two subscales; Learning Math Anxiety scale and
Math Evaluation Anxiety scale. The researchers assessed attitude towards mathematics
using Mathematics Attitudes Questionnaire (MAQ) with the subscales, Self confidence
scale, Value-Enjoyment scale, and Motivation scale (Kargar et al., 2010). In the current
study mathematics anxiety was measured by students’ perception of their anxiety, their
confidence in learning mathematics, and their motivation, and parents’ perception of
their own mathematics anxiety. Attitude towards mathematics was measured in the
current study in terms of students’ perception of their general attitude towards maths
and success in mathematics, and usefulness of mathematics, students’ perception of their
parents’ attitude to maths and child’s maths study, and parents’ perception of their own
attitude to maths and child’s maths study.
In summary the key differences in the constructs are that the current study used
both students’ and parents’ self reports in measuring the constructs, whereas the Durrani
and Tariq’s (2009) and Kargar et al.(2010) studies used only students’ self reports. In
this study the measures confidence in mathematics and motivation in mathematics
learning were used to assess mathematics anxiety, but the two measures were included in

FACTORS INFLUENCING MATHEMATICS ACHIEVEMENT OF SECONDARY SCHOOL STUDENTS IN INDIA 167
the Durrani and Tariq’s (2009) and Kargar et al.(2010) studies to evaluate the construct
attitudes to mathematics. The measure enjoyment in mathematics was used to assess
attitudes to mathematics by Kargar et al. and Durrani and Tariq, not in the current one.
In addition, as mentioned earlier, Year 9 and Year 11 students participated in this study,
whereas undergraduate students were the participants in Durrani and Tariq’s (2009) and
Kargar et al. (2010) studies. These differences in the constructs and their measurement,
and the sample could have contributed to the inconsistent results across the studies.
Not much work has been done to understand the relationship between mathematics
anxiety and parental involvement. This study found that the relationship between
mathematics anxiety and parental involvement was not significant. The finding of this
study is not consistent with the general consensus of the literature. For example, this
finding is not in agreement with the results of Vukovic, Roberts, and Wright (2013).
They studied the role of mathematics anxiety in the relationship between parental
involvement and mathematics achievement among second grade students and their
parents in the United States. The researchers found that parental involvement reduces
mathematics anxiety of the participants particularly for more difficult mathematics
topics. The participants in Vukovic, Robert, and Wright’s (2013) study were of an ethnic
minority and from a low-income background living in north-eastern United States. The
participants in this study were students in Year 9 and Year 11 and their parents in India
from a middle class socio-economic group, so the disparity is perhaps unsurprising. In
addition, Vukovic, Robert, and Wright (2013) measured mathematics anxiety using items
tapping worry and physical symptoms in relation to anxiety. Parental involvement was
measured in terms of parent’s involvement in child’s education, home support and
expectations, and valence (beliefs) toward school. In the present study mathematics
anxiety was measured by students’ perception of their anxiety, their confidence in
FACTORS INFLUENCING MATHEMATICS ACHIEVEMENT OF SECONDARY SCHOOL STUDENTS IN INDIA 168
learning mathematics, and their motivation, and parents’ perception of their
mathematics anxiety. Parental involvement was measured in the current study in terms
of parental participation in school-related activities (such as monitoring of home study
and attending parent-teacher interviews), parental encouragement of academic success,
and parental expectations of educational attainment and parenting style. These
differences in the measurement of the constructs and the sample may have contributed to
the different results.
In the Indian scenario education is considered a responsibility, a duty to the family, a
way of gaining social mobility and acceptance, and a form of recognition (Faria, 2001).
Higher education is associated with high social status, financial gain, and improved career
opportunities (Dhesi, 2001). Students are, therefore, under pressure from family,teachers
and society to excel in their studies. They also face strong competition from their peers
to achieve more in their studies. High achievement in mathematics is considered
important for further education and career opportunities. All these factors could
contribute to anxiety in mathematics among the students. The influence of parental
involvement on mathematics anxiety may be insignificant in comparison to other factors
described here and could be the reason for the non-significant relationship between
parental involvement and mathematics anxiety.
The study, however, showed a significant positive relationship between attitude
towards mathematics and parental involvement. In the Indian cultural context, parents
typically have high expectations for their children’s educational achievement. They
convey their expectations to their children through regular reinforcement of academic
success and hard work. The parents in this study were found to not be directly involved
in the mathematics learning of their children. Rather they provided extra tutorials in
mathematics, and bought books and other materials for their study. Above all, the
FACTORS INFLUENCING MATHEMATICS ACHIEVEMENT OF SECONDARY SCHOOL STUDENTS IN INDIA 169
parents constantly communicated their expectations to their children and monitored their
educational progress. Even though the students are constantly under pressure to excel in
their studies and hence likely to have been anxious, the constant communication of
parental expectations and academic excellence could contribute to a positive attitude to
mathematics in the students by promoting the idea that high achievement in
mathematics is important for further educational opportunities. This could be the reason
for the significant association among parental involvement and attitude towards
mathematics in this study.
6.2.5 Research Question: 5 Are there gender differences in relation to any of
these variables and/or their relationships?
No gender difference was found in relation to attitude towards mathematics among
the participants of the study. This finding was in agreement with the results of previous
research studies. For example, Farooq and Shah (2008) found no significant gender
difference in attitude towards mathematics among Year 10 students in Pakistan.
Similarly, Mohammed and Waheed (2011), reported that boys and girls at the secondary
level in Maldives (an island nation 400 km south-west of India), did not significantly
differ in their attitude towards mathematics. The cultural context, in terms of valuing of
education and the system of education, in India, Pakistan, and Maldives is comparatively
similar. In addition, Tapia (2004) reported no significant difference in attitudes towards
mathematics among the male and female undergraduate students in her study in the
United States. Nicolaidou and Philippou (2003), in Cyprus, also found no significant
difference in attitude towards mathematics between fifth grade boys and girls.
On the other hand, in the recent TIMSS, Year 8 Australian males were found to
FACTORS INFLUENCING MATHEMATICS ACHIEVEMENT OF SECONDARY SCHOOL STUDENTS IN INDIA 170
have more positive attitude towards mathematics than their female counterparts
(Thomson, Hillman, & Wernert, 2012). The TIMSS measured students’ attitude towards
mathematics in general, their perceptions of the value of mathematics for improving lives,
and their self-confidence in mathematics. The present study used the measures, students’
perception of general attitude towards maths and success in maths, and usefulness of
mathematics, students’ perception of their parents attitude to maths and their child’s
maths study, and parents’ perception of their own attitudes to maths and child’s maths
study, to assess attitude towards mathematics among the participants. Self-confidence
was not included as a measure to evaluate attitude towards mathematics, and students’
and parents’ self reports were used to measure the construct in the present study. These
differences in the conceptualisation and measurement of the construct could have
contributed to the disagreement in the findings. In addition, the differing cultural
contexts of India and Australia could have added to the inconsistent findings.
No significant gender difference in mathematics anxiety was observed among the
participants in this study. This finding is in agreement with the results of some other
studies that have explored gender difference in mathematics anxiety. For example, Chinn
(2009) found no significant difference in mathematics anxiety among secondary school
students in England and Birgin, Baloglu, Cathoglu, and Gurbuz (2010) found no gender
difference in mathematics anxiety among students from Grade 6 to Grade 8 in Turkey.
Researchers are not in agreement regarding gender difference in mathematics anxiety
among students. For example, some researchers have reported that girls have more
mathematics anxiety than boys (e.g., Hopko, 2003; Pajares & Miller, 1994; Tapia, 2004;
OECD, 2014), others have reported that boys have more anxiety in mathematics than
girls (Deb et al., 2010). Different findings are likely due to the differing
conceptualisations and measures of the construct.
FACTORS INFLUENCING MATHEMATICS ACHIEVEMENT OF SECONDARY SCHOOL STUDENTS IN INDIA 171
For example, the finding of this study is inconsistent with that of Woodard (2004),
who found girls had more mathematics anxiety than boys among post-secondary
developmental mathematics students in the United States (Developmental or remedial
mathematics courses have been offered to students who didn’t meet the enrolment
criteria to tertiary mathematics courses)(Woodard, 2004). The Mathematics Anxiety
Rating Scale (MARS) developed by Richardson and Suinn (F. Richardson & Suinn, 1972)
was used to measure the mathematics anxiety of students in Woodard’s (2004) study.
Richardson and Suinn’s (1972) Mathematics Anxiety Rating Scale (MARS) was designed
to measure participants’ anxious responses to mathematics in academic and everyday life
situations. In the current study mathematics anxiety focussed on mathematics learning
contexts and was measured by students’ perception of their anxiety, their confidence in
learning mathematics, and their motivation, and parents’ perception of their
mathematics anxiety. Even though the participants in the current study and Woodard
(2004) study were secondary school students aged above 13 years, the inconsistent
findings could be because of the differences in the measurement of the construct.
This study also failed to find any gender difference in parental involvement among
the participants of the study. This finding is consistent with the results of Olatoye and
Ogunkola’s (2008) study who found that no gender difference existed in parental
involvement for junior secondary school students in Ogun State in Nigeria (Olatoye &
Ogunkola, 2008). The result of the current study is however, inconsistent with other
studies that have found significant gender differences in parental involvement among the
participants. For example, some researchers have found that parents were more involved
with their daughters than with sons in school related matters (e.g., Carter &
Wojtkiewicz, 2000; P. Keith & Lichtman, 1994). Both these studies used data from the
National Educational Longitudinal Study of 1988 (NELS:88) data base. However, the
FACTORS INFLUENCING MATHEMATICS ACHIEVEMENT OF SECONDARY SCHOOL STUDENTS IN INDIA 172
participants in Carter and Wojtkiewicz’s (2000) study were Grade 8 students in the
United States, and Keith and Lichtman’s (1994) study included 8th grade
Mexican-American students, rather than Years 9 and 11 Indian students. Others have
found more parental involvement with sons in terms of academic supervision, higher
expectations,and school activities (e.g., Schoolland, 1990; Verma & Gupta, 1990). Both
of these studies were conducted among Asian students; Schoolland’s (1990) study
included Japanese high school students, whereas participants in Verma and Gupta’s
(1990) study were high school students in India. The recent economic and social changes
in India have brought about more equal educational opportunities for women. This has
resulted in an increase in the number of educated and working women in the present
generation and thus parents becoming more equally involved in the education of sons and
daughters. This trend is especially so in the state which was the site of the present study.
This could have contributed to the absence of any gender difference in parental
involvement among the participants.
Consistent with the findings of Venkatsh and Karimi (2010), who found no gender
difference in mathematics achievement among secondary school students from three
states Tamilnadu, Kerala, and Karnataka in India, this study also found that the boys
and girls did not differ significantly in their achievement in mathematics. Other Indian
studies have also failed to find any significant gender difference in mathematics
achievement. For example, Choudhury and Das (2012) also reported the absence of a
significant gender difference in mathematics achievement among secondary school
students in Assam, India. Elsewhere, Mullis et al. (2000) found no significant gender
difference among Turkish students in their mathematics achievement based on the Trends
in International Mathematics and Science Study (TIMSS) data. Contrary to these
findings, significant gender differences were observed among Year 8 students in

FACTORS INFLUENCING MATHEMATICS ACHIEVEMENT OF SECONDARY SCHOOL STUDENTS IN INDIA 173
mathematics achievement in some countries in the most recent TIMSS (Mullis, Martin,
Foy, & Arora, 2012). For example, boys significantly outperformed girls in mathematics
in New Zealand, Korea, Lebanon, Italy and Chile. On the other hand, Year 8 girls
performance in mathematics was significantly higher than boys in Singapore, Malaysia,
Jordan, Indonesia, Bahrain,and Armenia. It appears that in some countries that
participate in TIMSS, gender differences in mathematics achievement have changed over
time. Because India has not been a participant in the TIMSS studies, it is not possible to
say whether this is also the case in India.
6.2.6 Research Question: 6 Gender differences in the inter-relationship among
the variables
Consideration of whether the relationship of mathematics anxiety, attitude towards
mathematics, and parental involvement with mathematics achievement differed for the
boys and the girls, revealed no significant gender difference in any of the relationships for
the participants in this study.
The non-significant gender difference in the relationship between mathematics
anxiety and mathematics achievement in this study, is consistent with the findings of the
meta analysis of the studies of mathematics anxiety by Ma (1999) among Grades 4 to
Grade 12 students in the United States, Thailand, Australia, Lebanon, Israel, and New
Zealand. The current study found no significant gender difference in the relationship
between attitude towards mathematics and mathematics achievement, which is in
agreement with the meta analysis of Ma and Kishor (1997). The present study also found
no significant difference in the parental involvement and mathematics achievement
relationship among secondary school students, which is in agreement with the findings of
FACTORS INFLUENCING MATHEMATICS ACHIEVEMENT OF SECONDARY SCHOOL STUDENTS IN INDIA 174
other research studies. For example, T. Z. Keith et al. (1998), in a longitudinal study,
found no significant differences in the relationships between the variables among high
school students in US.
There appears to have been little research on the influence of gender on the
inter-relationship between mathematics anxiety and attitude towards mathematics,
mathematics anxiety and parental involvement, and attitude towards mathematics and
parental involvement. The present study found no significant difference for boys and girls
in the relationship between mathematics anxiety and attitude towards mathematics.
Similarly, no significant gender difference was observed in the relationship between
mathematics anxiety and parental involvement in the study. In addition, the study failed
to find any significant gender difference in the association between attitude towards
mathematics and parental involvement.
6.3 Limitations of the study
The findings of the study need to be interpreted taking its limitations into
consideration. Firstly, the sample was restricted to students in Year 9 and Year 11 and
their parents, from a single urban private school. Secondly, causality in the relationship
between the variables cannot be established because of the cross-sectional nature of the
study, but it is possible to understand the correlational relationships among the variables.
A more comprehensive measure of mathematics achievement may have given stronger
findings. In this study only a single measure of achievement in mathematics was used.
For example, teacher reports of students’ mathematics achievement could have been
included as a second measure of mathematics achievement thereby enhancing the validity
of the findings. The student questionnaire and achievement test in mathematics were
FACTORS INFLUENCING MATHEMATICS ACHIEVEMENT OF SECONDARY SCHOOL STUDENTS IN INDIA 175
administered on the same day, one week before the second term examinations. It is
possible that the students’ responses may have been influenced by stress because of the
term examinations, rather than anxiety in mathematics. In spite of these limitations the
study established a foundation for further research. Possible directions for this research
are described in the next section.
6.4 Recommendations for further research
Recommendations for further research arising from the study include investigating
the relationship between the variables over a wider geographical area within India, and
including both public and private schools, and also schools in both urban and rural areas.
In particular,it is possible that there may be differences in the parental involvement
practices among students from urban and rural areas and there may be differences
between states due to differing educational policies and histories, as well as differing
cultural contexts. A longitudinal study of the variables and their long term impact on
mathematics achievement among secondary school students would help in understanding
casual relationships among the variables. It would also be interesting to replicate the
study with different measuring instruments than those used in the present study.
The study could be replicated with the inclusion of Year 10 and Year 12 students to
investigate the relationship among the variables. This could be of interest because in
Kerala, students have to appear for their Secondary Examination in Grade 10 to secure
admission to their preferred academic course for senior secondary school. In Grade 12
they have to sit the Higher Secondary Examination to get admission to prestigious
courses like medicine, engineering, and law. Competition is fierce because performance in
the Secondary Examination determines admission to prestigious self-financing higher
FACTORS INFLUENCING MATHEMATICS ACHIEVEMENT OF SECONDARY SCHOOL STUDENTS IN INDIA 176
secondary schools (run by individuals, trusts or churches) and performance in Higher
Secondary Examination determines admission to prestigious courses in high quality
universities. One might therefore expect more parental participation in their children’s
studies in Years 10 and 12 compared with Years 9 and 11. The high stake examination
context of Years 10 and 12 could particularly effect how parental involvement relates to
mathematics achievement of these students.
Further, research studies in western contexts have shown that factors such as
teacher-student relationship (Hamre & Pianta, 2001; Hughes & Kwok, 2006), teacher
competency (B. Nye, Konstantopoulos, & Hedges, 2004; Sanders & Rivers, 1996), peer
support (Hill & Rowe, 1998), and the socio-economic status and educational level of
parents (Demir, Kilic, & Unal, 2010; Guo & Harris, 2000; Starkey & Klein, 2000)
influence academic achievement of students. It would be, therefore, interesting to
investigate the influence of these factors on mathematics achievement of secondary school
students in India and their interaction with the variables considered in this study. Further
exploration of a comparative study between India and for example, Australia may help in
understanding the role of cultural differences in the relationship among the variables.
6.5 Conclusion
The study investigated how the variables mathematics anxiety, attitude towards
mathematics, and parental involvement influenced mathematics achievement of secondary
school students in India. Previous research has demonstrated the effect of these variables
on mathematics achievement of students with significant as well as non-significant results.
This study found a non-significant relationship between mathematics anxiety and
mathematics achievement. The relationships among attitude towards mathematics and

FACTORS INFLUENCING MATHEMATICS ACHIEVEMENT OF SECONDARY SCHOOL STUDENTS IN INDIA 177
mathematics achievement, and between parental involvement and mathematics
achievement were also not significant. The study found a significant, positive relationship
between parental involvement and attitude towards mathematics, and a significant
positive correlation between mathematics anxiety and attitude towards mathematics.
The findings may help parents to adopt parental involvement practices that could help in
developing a more positive attitude towards mathematics. Teachers may use findings of
the study to help the students in their mathematics learning. They could adjust their
teaching strategies to develop positive attitudes to the learning of mathematics among
their students, but both parents and teachers need to be mindful that enhancing positive
attitude to mathematics conceptualised as beliefs in its usefulness and importance may be
associated with greater mathematics anxiety. Care needs to be exercised in keeping the
mathematics anxiety level of the students to a comfortable point that motivates them.

FACTORS INFLUENCING MATHEMATICS ACHIEVEMENT OF SECONDARY SCHOOL STUDENTS IN INDIA 178
References
Abu-Hilal, M. M. (2000). A structural model for predicting mathematics achievement:
Its relation to anxiety and self-concept in mathematics. Psychological Reports, 86 ,
835-847.
Aiken, L. R. (1970). Attitude towards mathematics. Review of Educational Research, 40 ,
551-596.
Ajzen, I., & Fishbein, M. (1980). Understanding attitudes and predicting social behaviour.
Englewood Cliffs, NJ: Prentice-Hall.
Anderson, J., & Gerbing, D. (1988). Structural equation modeling in practice: A review
and recommended two-step approach. Psychological Bulletin, 103 , 411-423.
Andrich, D. A. (1978). A rating formation of ordered response categories.
Psychometrika, 43 , 561-573.
Anwer, M., Iqubal, M., & Harrison, C. (2012). Students’ attitude towards science: A case
of Pakistan. Pakistan Journal of Social and Clinical Psychology, 9 , 3-9.
Arbuckle, J. L. (2012). Amos 21.0. (Chicago, III: Saltwaters Corp.)
Ashcraft, M. H. (2002). Math anxiety: Personal, educational and cognitive consequences.
Current Directions in Psychological Science, 11 , 181-185.
Ashcraft, M. H., & Kirk, E. (2001). The relationships among working memory, maths
anxiety and performance. Journal of Experimental Psychology, 130 , 224-237.
Asher, N. (2002). Class acts: Indian American high school students negotiate
professional and ethnic identities. Urban Education, 37 , 267-295.
Aye, K. M., Lau, S., & Nie, Y. (2008). Relations of authoritative parenting style to
student outcomes. (Tech. Rep.). New York City. (Paper presented at the Annual
Meeting of the American Educational Research Association)
Baloglu, M., & Koack, R. A. (2006). Multivariate investigation of the differences in

FACTORS INFLUENCING MATHEMATICS ACHIEVEMENT OF SECONDARY SCHOOL STUDENTS IN INDIA 179
mathematics anxiety. Personality and Individual Differences, 40 , 1325-1335.
Bandalos, D. L., Yates, K., & Thorndike-Christ, T. (1995). Effects of math self-concept,
perceived self-efficacy, and attributions of failure and success on test anxiety.
Journal of Educational Psychology, 87 , 611-623.
Barkatsas, A., Gialamas, V., & Kasimatis, K. (2008). Learning secondary mathematics
with technology: Exploring the complex interrelationship between students’
attitudes, engagement, gender and achievement. Computers and Education, 52 ,
562-570. (doi:10.1016/j.compedu.2008.11.001)
Barry, S., & Chapman, J. (2007). Predicting university performance. ANZIAM , J-49 ,
C36- C50.
Baumrind, D. (1971). Current patterns of parental authority. Developmental Psychology
Monographs, 4 , 1-103.
Baumrind, D. (1978). Parental disciplinary patterns and social competence in children.
Youth and Society, 9 , 239-276.
Baumrind, D. (1991). The influence of parenting style on adolescent competence and
substance use. Journal of Adolescence, 11 , 56-95.
Beaton, A. E., & O’Dwyer, L. (2002). Separating school, classroom and student
variances and their relationship to socioeconomic status. In D. F. Robitaille &
A. E. Beaton (Eds.), Secondary analysis of the TIMSS data (p. 211-231). Boston,
MA: Kluwer Academic.
Bekdemir, M. (2010). The pre-service teachers’ mathematics anxiety related to depth of
negative experiences in mathematics classroom while they were students.
Educational Studies in Mathematics, 75 , 311-328.
Benbow, C. P., & Minor, L. L. (1986). Mathematically talented males and females and
achievement in high school sciences. American Educational Research Journal, 23 ,
425-436.
FACTORS INFLUENCING MATHEMATICS ACHIEVEMENT OF SECONDARY SCHOOL STUDENTS IN INDIA 180
Bentler, P. M., & Freeman, E. H. (1983). Tests for stability in linear structural equation
systems. Psychometrika, 48 , 143-145.
Bernard, H. (1988). Research methods in cultural anthropology. Newbury Park, CA:
Sage.
Berndt, T., & Keefe, K. (1995). Friends’ influence on adolescents’ adjustment to school.
Educational Psychologist, 34 , 15-28.
Bernstein, J., Reilly, L., & Cote-Bonanno, J. (1992). Barriers to women entering the
workforce: Math anxiety. (Report No. No. CE 064 012). Montclair, NJ: Montclair
State College, Life Skills Center. (Eric Document Reproduction Service No. ED 359
381.)
Betz, N. E. (1978). Prevalence, distribution and correlation of math anxiety among
college students. Journal of Counseling Psychology, 25 , 441-448.
Beverley, J. W. (2002). Modelling mathematics achievement: An Australian study of
learning environment in education (Unpublished PhD thesis). Curtin University of
Technology.
Birgin, O., Baloglu, M., Cathoglu, H., & Gurbuz, R. (2010). An investigation of
mathematics anxiety among sixth through eighth grade students in Turkey.
Learning and Individual Differences, 20 , 654-658.
Bollen, K. A. (1989). Structural equations with latent variables. New York: John Wiley &
Sons.
Bond, T. G., & Fox, C. M. (2007). Applying the Rasch model: Fundamental measurement
in the human sciences (2nd ed.). Mahwah, NJ: Erlbaum.
Brace, I. (2004). Questionnaire design: How to plan, structure, and write survey material
for effective market research. London & Sterling, VA: Kogan Page.
Bronstein, P., Ginsburg, G., & Herrera, I. (2005). Parental predictors of motivational
orientation in early adolescence: A longitudinal study. Journal of Youth and
FACTORS INFLUENCING MATHEMATICS ACHIEVEMENT OF SECONDARY SCHOOL STUDENTS IN INDIA 181
Adolescence, 34 , 559-575.
Brown, M. C. (1994). Parental involvement as a variable in reading readiness: A review
of related literature. Information Analyses. (ERIC Document Reproduction Service
No.: ED 384-850.)
Browne, M. W., & Cudek, R. (1993). Alternative ways of assessing model fit. In
K. A. Bollen & J. S. Long (Eds.), Testing structural equation models (p. 136-162).
Newbury Park, CA: Sage.
Bryman, A., & Bell, E. (2007). Business research methods (2nd ed.). Oxford University
Press.
Buri, J. R. (1991). Parental authority questionnaire. Journal of Personality Assessment,
57 , 110-119.
Byrne, B. M. (2001). Structural equation modeling with AMOS: Basic concepts,
applications and programming. Mahwah, NJ: Erlbaum.
Byrne, B. M. (2010). Structural equation modeling with AMOS: Basic concepts,
applications and programming. (Taylor & Francis, Eds.). NY: Routledge.
Byrne, B. M., Shavelson, R. J., & Muthen, B. (1989). Testing for the equivalence of
factor covariance and mean structures: The issue of partial measurement
invariance. Psychological Bulletin, 105 , 456-466.
Byrne, B. M., & Watkins, D. (2003). The issue of measurement invariance revisited.
Journal of Cross-Cultural Psychology, 34 , 155-175.
Cain-Caston, M. (1993). Parent and student attitudes towards mathematics as they
relate to third grade mathematics. Journal of Instructional Psychology, 20 , 96-102.
Campbell, K., & Evans, C. (1997). Gender issues in the classroom: A comparison of
mathematics anxiety. Education, 117 , 332-339.
Cappellari, L., Lucifora, C., & Pozzoli, D. (2008). Determinants of grades in maths for
students in economics. (Retrieved from
FACTORS INFLUENCING MATHEMATICS ACHIEVEMENT OF SECONDARY SCHOOL STUDENTS IN INDIA 182
htttp://papers.ssrn.com/sol3/papers.cfm?abstract_id=1127227)
Carter, R. S., & Wojtkiewicz, R. A. (2000). Parental involvement within adolescents’
education: Do daughters or sons get more help? Adolescence, 35 , 129-137.
Cates, G. L., & Rhymer, K. N. (2003). Examining the relationship between mathematics
anxiety and mathematics performance: An instructional hierarchy perspective.
Journal of Behavioural Education, 12 , 23-34.
Catsambis, S. (1988). Expanding knowledge of parental involvement in secondary
education: effects on high school academic success (Tech. Rep. No. 27). Center for
Research on the Education of Students Placed at Risk, Baltimore, USA: Johns
Hopkins University.
Catsambis, S. (2001). Expending knowledge of parental involvement in children’s
secondary education: Connections with high school seniors academic success. Social
Psychology of Education, 5 , 149-177.
Chagwiza, C. J., Mutambara, L., Tatira, B., & Nyaumwe, L. J. (2013). An analysis of
attitudes and mathematics achievement of ’O’ level pupils: Insight from some
Bindura urban secondary schools. International Journal of Academic Research in
Progressive Education and Development, 2 , 223-235.
Chen, W., & Gregory, A. (2010). Parental involvement as a protective factor during the
transition to high school. Journal of Educational Research, 103 , 53-62.
Cheung, G. W., & Rensvold, R. B. (2002). Evaluating goodness-of-fit indexes for testing
measurement invariance. Structural Equation Modeling, 9 , 233-255.
Cheung, K. C. (1988). Outcomes of schooling: Mathematics achievement and attitude
towards mathematics learning in Hong Kong. Educational Studies in Mathematics,
19 , 209-219.
Chinn, S. (2009). Mathematics anxiety in secondary students in England. Dyslexia, 15 ,
61- 68.
FACTORS INFLUENCING MATHEMATICS ACHIEVEMENT OF SECONDARY SCHOOL STUDENTS IN INDIA 183
Choudhury, R., & Das, D. (2012). Influence of attitude towards matematics and study
habit on the achievement in mathematics at the secondary stage. International
Journal of Engineering Research, 6 , 192-196.
Cohen, L., & Manion, L. (1994). Research methods in education (4th ed.). London:
Routledge.
Coleman, J. S. (1988). Social capital in the creation of human capital. American Journal
of Sociology, 94 (suppl. 95), 95-120.
Cooper, S., & Robinson, D. (1991). The relationship of mathematics self-efficacy beliefs
to mathematics anxiety and performance. Measurement and Evaluation in
Counseling and Development, 24 , 5-11.
Crabtree, B., & Miller, W. (1999). Doing qualitative research (2nd ed.). Thousand Oaks,
California: Sage.
Creswell, J. W. (2003). Research design: Qualitative, quantitative, and mixed methods
approaches. (2nd ed.). Thousand Oaks, CA: Sage.
Creswell, J. W., & Clark, V. P. (2007). Designing and conducting mixed methods
research. Thousand Oaks, CA: Sage.
Crockett, L., Veed, G. J., & Russell, S. (2010). Do measures of parenting have the same
meaning for European, Chinese, and Filipino American adolescents? Tests of
measurement equivalence. In S. T. R. et al. (Ed.), Asian American parenting and
parent-adolescent relationship (p. 17-35). Springer.
Darling, N., & Steinberg, L. (1993). Parenting style as context: An integrative model.
Psychological Bulletin, 113 , 75-77.
Deb, S., Chatterjee, P., & Walsh, K. (2010). Anxiety among high school students in
India: Comparisons across gender, school type, social strata and perceptions of
quality time with parents. Australian Journal of Educational and Developmental
Psychology, 10 , 18-31.
FACTORS INFLUENCING MATHEMATICS ACHIEVEMENT OF SECONDARY SCHOOL STUDENTS IN INDIA 184
De Geiter, S., Hofmans, J., De Cooman, R., & Pepermans, R. (2009). Measurement
invariance of the pay satisfaction questionnaire across gender: Explaining the
“contented female worker paradox” more thoroughly. Educational and Psychological
Measurement, 69 , 843-854.
Deighan, W. P. (1970). An examination of the relationship between teachers’ attitude
towards arithmetic and the attitudes of their students towards arithmetic. (Doctoral
dissertation). Case Western Reserve University. (Dissertation Abstracts
International. (31, 3333A))
Demir, I., Kilic, S., & Unal, H. (2010). Effects of students’ and schools’ characteristics on
mathematics achievement: Findings from PISA 2006. Procedia Social and
Behavioral Sciences, 2 , 3099-3103.
Department of Education, Science and Training. (2006). Youth attitudes survey:
Population study on the perceptions of science, mathematics and technology study at
school and career decision making. (Tech. Rep.). Canberra, ACT: DEST.
Dhesi, A. S. (2001). Expectations and post-school choice: Some data from India.
Education and Training, 43 , 14-24.
Dicicco-Bloom, B., & Crabtree, B. F. (2006). The qualitative research interview. Medical
Education, 40 , 314-321.
Dornbusch, S. M., Ritter, P. L., Leiderman, P. H., Robert, D. F., & Fraleigh, M. J.
(1987). The relation of parenting style to adolescent school performance. Child
development, 58 , 1244-1257.
Dossey, J. A., Mullis, I. V. S., Linquist, M. M., & Chambers, D. L. (1988). The
mathematics report card: Are you measuring up? Trends and achievement based on
the 1986 National Assessment (Tech. Rep.). (Report No. 17-M-01)
Dreger, R. M., & Aiken, L. R. (1957). The identification of number anxiety in a college
population. Journal of Educational Psychology, 48 , 344-351.

FACTORS INFLUENCING MATHEMATICS ACHIEVEMENT OF SECONDARY SCHOOL STUDENTS IN INDIA 185
Drisko, J. W. (1993). Personality and gender differences: Comparing clinicians and
researchers. Smith College Studies in Social Work, 63 , 147-161.
Durrani, N., & Tariq, V. (2009). Relationships between undergraduates’ mathematics
anxiety and their attitudes towards developing numeracy skills and perceptions of
numerical competence . Madrid, Spain. (Proceedings of ICERI2009 Conference)
Eccles, J. S., & Jacobs, J. E. (1986). Social forces shape math attitudes and
performance. Journal of Women in Culture and Society, 11 , 367-380.
Elliot, J. C. (1990). Affect and mathematics achievement of non-traditional college
students. Journal for Research in Mathematics Education, 21 , 160-165.
El Nokali, N. E., Bachman, H. J., & Votruba-Drzal, E. (2010). Parent involvement and
childrens’ academic and social development in elementary school. Child
development, 81 , 968-1005.
Else-Quest, N. M., Hyde, J., & Linn, M. C. (2010). Cross- national patterns of gender
differences in mathematics: A meta- analysis. Psychological Bulletin, 136 , 103-127.
Epstein, J. L. (1987). Toward a theory of family-school connections: Teacher practices
and parent involvement. In K. Hurrelmann, F. Kaufmann, & F. Losel (Eds.), Social
intervention: Potential and constraints. (p. 121-136). New York: DeGruyter.
Epstein, J. L. (1991). Effects on student achievement, of teachers’ practice, of parent
involvement. In S. B. Silvern (Ed.), Advances in reading/language research; literacy
through family, community, and school interaction (p. 261-276). Greenwich, CT:
JAI Press.
Epstein, J. L. (1992). School and family partnerships encyclopedia of educational research
(6th ed.). New York: Macmillan.
Epstein, J. L. (1995). School/ family /community partnerships: Caring for the children
we share. Phi Delta Kappan, 76 , 701-712.
Fan, W., & William, C. M. (2010). The effects of parental involvement on students’

FACTORS INFLUENCING MATHEMATICS ACHIEVEMENT OF SECONDARY SCHOOL STUDENTS IN INDIA 186
academic self-efficacy, engagement and intrinsic motivation. Educational
Psychology, 30 , 53-74.
Fan, X. (2001). Parental involvement and students’ academic achievement: A growth
modeling analysis. The Journal of Experimental Education, 70 , 27-61.
Fan, X., & Chen, M. (2001). Parental involvement and students’ academic achievement:
A meta-analysis. Educational Psychology Review, 13 , 1-22.
Fan, X., Chen, M., & Matsumoto, A. R. (1997). Gender differences in mathematics
achievement: Findings from the national education longitudinal study of 1988. The
Journal of Experimental Education, 65 , 229-242.
Fantuzzo, J. W., King, J. A., & Heller, L. R. (1992). Effects of reciprocal peer tutoring
on mathematics and school adjustment: A component analysis. Journal of
Educational Psychology, 84 , 331-339.
Faria, A. I. (2001). The future of Indian ethnicity in Australia: An educational and
cultural perspective. International Educational Journal, 2 , 134-143. (Educational
Research Conference 2001 Special Issue)
Farooq, M. S., & Shah, S. Z. (2008). Students’ attitude towards mathematics. Pakistan
Economic and Social Review, 46 , 75-83.
Fehrmann, P., Keith, T. Z., & Reimers, T. M. (1987). Home influence on school learning:
Direct and indirect effects of parental involvement on high school grades. Journal of
Educational Research, 80 , 330-337.
Fennema, E., Carpenter, E. T., Jacob, V. R., Frank, M. L., & Levi, L. W. (1998). A
longitudinal study of gender differences in young children’s mathematical thinking.
Educational Researcher , 27 , 6-11.
Fennema, E., & Sherman, J. A. (1976). Fennema-Sherman Mathematics Attitude Scales:
Instruments designed to measure attitudes towards the learning of mathematics by
males and females. JSAS Catalog of Selected Documents in Psychology, 6 , 3b.
FACTORS INFLUENCING MATHEMATICS ACHIEVEMENT OF SECONDARY SCHOOL STUDENTS IN INDIA 187
Fereday, J., & Muir-Cochrane, E. (2006). Demonstrating rigor using thematic analysis:
A hybrid approach of inductive and deductive coding and theme development.
International Journal of Qualitative Methods, 5 , 80-92.
Fishel, M., & Raimirez, L. (2005). Evidence-based parent involvement interventions with
school-aged children. School Psychology Quarterly, 20 , 37-402.
Fisk, G. M., & Neville, L. B. (2011). Effects of customer entitlement on service worker’s
physical and psychological well-being: A study of Waitstaff employees. Journal of
Occupational Health Psychology., 16 , 391-405.
Fontana, A., & Frey, J. (2005). The interview: From neutral stance to political
involvement. In Denzin & Lincoln (Eds.), The sage handbook of qualitative research
(p. 695-727). Thousand Oaks, CA: Sage.
Forgasz, H. J., & Hill, J. C. (2013). Factors implicated in high mathematics achievement.
International Journal of Science and Mathematics Education, 11 , 481-499.
Fox, J. (1980). Effect analysis in structural equation models. Sociological Methods and
Research, 9 , 3-28.
Fox, J., Murray, C., & Warm, A. (2003). Conducting research using web-based
questionnaires: Practical, methodological, and ethical considerations. International
Journal of Social Research Methodology, 6 , 167-180.
Fredricks, J. A., & Eccles, J. S. (2002). Children’s competence and value beliefs from
childhood through adolescence: Growth trajectories in two male-sex-typed domains.
Developmental Psychology, 38 , 519-533.
Frick, R. W. (1996). The appropriate use of null hypothesis testing. Psychological
Methods, 1 , 379-390.
Friman, P., Hayes, S., & Wilson, K. (1998). Why behaviour analysts should study
emotion: The example of anxiety. Journal of Applied Behaviour Analysis, 31 , 137 -
156.
FACTORS INFLUENCING MATHEMATICS ACHIEVEMENT OF SECONDARY SCHOOL STUDENTS IN INDIA 188
Fullarton, S., Walker, M., Ainley, J., & Hillman, K. (2003). Patterns of participation in
Year 12. (LSAY Research Report No 33). Camberwell, Victoria: Australian
Council for Educational Research.
Gall, M. D., Gall, J. P., & Borg, W. (2003). Educational research: An introduction. (7th
ed.). White Plains, NY: Longman.
Gallagher, A. M., & DeLisi, R. (1994). Gender differences in scholastic aptitude test,
mathematics problem solving among high ability students. Journal of Educational
Psychology, 86 , 204-211.
Garg, K. C., & Gupta, B. M. (2003). Decline in science education in India - A case of
study at + 2 and undergraduate level. Current Science, 84 , 1198-1201.
Gibbs, G. R. (2002). Qualitative data analysis: Explorations with NVivo. Buckingham,
UK: Open University press.
Ginsburg, G. S., & Bronstein, P. (1993). Family factors related to children’s intrinsic/
extrinsic motivational orientation and academic performance. Child development,
64 , 1461-1474.
Goldstein, L. (1999). The relational zone the relational zone: The role of caring
relationships in the co-construction of mind. American Educational Research
Journal, 36 , 647-673.
Goodrum, D., Druhan, A., & Abbs, J. (2011). The status and quality of year 11 and year
12 science in Australian schools (Tech. Rep.). Canberra, ACT: Australian Academy
of Science.
Gray, M. (1996). Gender and mathematics: Mythology and misogyny towards gender
equity in mathematics education: An ICMI study (G. Hanna, Ed.). Boston, MA:
Kluwer Academic. (p. 27 - 38)
Griffith, J. (1998). The relation of school structure and social environment to parent
involvement in elementary schools. Elementary School Journal, 99 , 53-80.

FACTORS INFLUENCING MATHEMATICS ACHIEVEMENT OF SECONDARY SCHOOL STUDENTS IN INDIA 189
Grolnick, W. S., Ryan, R. M., & Deci, E. L. (1991). Inner resources for school
achievement: Motivational mediators of children’s perceptions of their parents.
Journal of Educational Psychology, 83 , 508-517.
Grolnick, W. S., & Slowiaczek, M. L. (1994). Parents’ involvement in children’s
schooling: A multidimensional conceptualisation and motivational model. Child
development, 65 , 237-252.
Guo, G., & Harris, K. (2000). The mechanisms mediating the effects of poverty on
children’s intellectual development. Demography, 37 , 431-447.
Hackett, G. (1985). Role of mathematics self-efficacy in the choice of math-related
majors of college women and men: A path analysis. Journal of Counseling
Psychology, 32 , 47 - 56.
Hackett, G., & Betz, N. E. (1989). An exploration of the mathematics self-efficacy/
mathematics performance correspondence. Journal for Research in Mathematics
Education, 20 , 261-273.
Halpern, D. F., Benbow, C. P., Geary, D. C., Gur, R., Hyde, J. S., & Gernsbacher, M. A.
(2007). The science of sex differences in science and mathematics. Psychological
Science in the Public Interest, 8 , 1-51.
Hammouri, H. (2004). Attitudinal and motivational variables related to mathematics
achievement in Jordan: Findings from the Third International Mathematics and
Science Study (TIMSS). Educational Research, 46 , 241-257.
Hamre, B. K., & Pianta, R. C. (2001). Early teacher-child relationships and the
trajectory of children’s school outcomes through eighth grade. Child development,
72 , 625-638.
Hancock, G. R. (1997). Structural equation modeling methods of hypothesis testing of
latent variable means. Measurement and Evaluation in Counselling and
Development, 30 , 91-105.
FACTORS INFLUENCING MATHEMATICS ACHIEVEMENT OF SECONDARY SCHOOL STUDENTS IN INDIA 190
Hannula, M. S. (2002). Attitude towards mathematics: Emotions, expectations and
values. Educational Studies in Mathematics, 49 , 25-46.
Hart, L. (1989). Describing the affective domain. Saying what we mean. In McLeod &
Adams (Eds.), Affect and mathematical problem solving (p. 37 -45). New York.
Haynes, A. F., Mullins, A. G., & Stein, B. S. (2004). Differential models for math
anxiety in male and female college students. Sociological Spectrum, 24 , 295-318.
Hemalatha, P. K., & Sabitha, V. S. (2009). Impact of parental involvement of academic
achievement of secondary school students. Indian Journal of Multidisciplinary
Reserach, 5 , 21-25.
Hembree, R. (1990). The nature, effects, and relief of mathematics anxiety. Journal for
Research in Mathematics Education, 21 , 33-46.
Hill, P. W. (1994). The contribution teachers make to school effectiveness. Symposium
paper presented at the Seventh International Congress for School Effectiveness and
Improvement (ICSEI). (Melbourne, 3-6 January)
Hill, P. W., & Rowe, K. J. (1998). Modelling student progress in studies of educational
effectiveness. School Effectiveness and School Improvement, 9 , 310-333.
Ho, E.-S., & Wilms, J. D. (1996). Effects of parental involvement on eighth-grade
achievement. Sociology of Education, 69 , 126-141.
Ho, H. Z., Senturk, D., Lam, A. G., Zimmer, J. M., Hong, S., & Okamoto, Y. (2000).
The affective and cognitive dimensions of math anxiety: A cross-national study.
Journal for Research in Mathematics Education, 31 , 362-379.
Hoover-Dempsey, K. V., & Sandler, H. M. (1995). Parental involvement in children’s
education: Why does it make a difference? Teachers College Record, 97 , 310-331.
Hoover-Dempsey, K. V., & Sandler, H. M. (1997). Why do parents become involved in
their children’s education? Review of Educational Research, 67 , 3-42.
Hopko, D. (2003). Confirmatory factor analysis of the math anxiety rating scale -

FACTORS INFLUENCING MATHEMATICS ACHIEVEMENT OF SECONDARY SCHOOL STUDENTS IN INDIA 191
revised. Educational and Psychological Measurement, 63 , 336-351.
Hoyle, R. H. (1995). The structural equation modeling approach: Basic concepts and
fundamental issues. In R. K. Hoyle (Ed.), Structural equation modeling: Concepts,
issues, and applications (p. 1-15). Thousand Oaks, CA: Sage.
Hu, I., & Bentler, P. M. (1995). Evaluating model fit. In R. H. Hoyle (Ed.), Structural
equation modeling: Concepts, issues, and applications (p. 76-99). Thousand Oaks,
CA: Sage.
Hu, I., & Bentler, P. M. (1999). Cutoff criteria for fit indexes in covariance structure
analysis: Conventional criteria versus new alternatives. Structural Equation
Modeling, 6 , 1-55.
Hubbard, L. (1999). College aspirations among low-income African American high school
students: Gendered strategies for success. Anthropology and Educational Quarterly,
30 , 363-383.
Hughes, J. N., & Kwok, O. (2006). Classroom engagement mediates the effect of
teacher-student support on elementary stuents’ peer acceptance: A prospective
analysis. Journal of School Psychology, 43 , 465-480.
Hyde, J. S., Fennema, E., & Lamon, S. (1990). Gender differences in mathematics
performance: A meta-analysis. Psychological Bulletin, 107 , 139-155.
Hyde, J. S., Fennema, E., Ryan, M., Frost, L. A., & Hopp, C. (1990). Gender
comparisons of mathematics attitudes and affect. Psychology of Women Quarterly,
14 , 299 - 324.
Iben, M. F. (1991). Attitudes and mathematics. Comparative Education, 27 , 135-151.
IBM corp. (2012). IBM SPSS Statistics for Windows. Armonk, NY: IBM Corp. (Version
21.0)
Indian Government. (2005). Education in Kerala. (Retrieved 16 October, 2012, from
http://india.gov.in/knowindia/state_uts.php?id=54)
FACTORS INFLUENCING MATHEMATICS ACHIEVEMENT OF SECONDARY SCHOOL STUDENTS IN INDIA 192
Ingoldby, B., Schvaneveldt, B., Supple, A., & Bush, K. (2003). The relationship between
parenting behaviours and adolescent achievement and self-efficacy in Chile and
Ecuador. Marriage and Family Review, 35 , 139-159.
Jackson, C. D., & Leiffingwell, R. J. (1999). The role of instructors in creating math
anxiety in students from kindergarten through college. Mathematics Teacher , 92 ,
583 - 586.
Jacobs, N., & Harvey, D. (2005). Do parents make a difference to children’s academic
achievement? Differences between parents of higher and lower achieving students.
Educational Studies, 31 , 431-448.
Jennison, M. H., & Beswick, K. (2009). Students’ perception of the impacts of parents,
teachers and teaching upon their anxiety about and the learning of fractions. In R.
Hunter, B. Bicknell & T. Burgess (Ed.), Crossing divides: Proceedings of the 32nd
Annual Conference of the Mathematics Education Research Group of Australasia.
(Vol. 1, p. 265-272). Sydney: MERGA.
Jeynes, W. H. (2005). Parental involvement and student achievement: A meta-analysis.
(Tech. Rep.). Cambridge, MA: Harvard Family Research Project: Family
Involvement Research Digest. (Retrieved from
www.gse.harvard.edu/hfrp/publications resources/publications series)
Jeynes, W. H. (2007). The relationship between parental involvement and urban
secondary school student academic achievement: A meta-analysis. Urban
Education., 42 , 82-110.
Kargar, M., Tarmizi, R. A., & Bayat, S. (2010). Relationship between mathematical
thinking, mathematics anxiety and mathematics attitudes among university
students. Procedia Social and Behavioral Sciences, 8 , 537-542.
Karimi, A., & Venkatesan, S. (2009). Mathematics anxiety, mathematics performance
and academic hardiness in high school students. International Journal of

FACTORS INFLUENCING MATHEMATICS ACHIEVEMENT OF SECONDARY SCHOOL STUDENTS IN INDIA 193
Educational Science, 1 , 33-37.
Keith, P., & Lichtman, M. (1994). Does parental involvement influence the academic
achievement of Mexican-American eighth graders? Results from the national
education longitudinal study. School Psychology Quarterly, 9 , 256-272.
Keith, T. Z., & Keith, P. B. (1993). Does parental involvement affect eighth-grade
student achievement? Structural analysis of national data. School Psychology
Review, 22 , 474-496.
Keith, T. Z., Keith, P. B., Quirk, K. J., Sperduto, J., Santillo, S., & Killings, S. (1998).
Longitudinal effects of parental involvement on high school grades: Similarities and
differences across gender and ethnic groups. Journal of School Psychology, 36 ,
335-363.
Kenney-Benson, G. A., Pomerantz, E. M., Ryan, A. M., & Patrick, H. (2006). Sex
differences in math performance: The role of children’s approach to schoolwork.
Developmental Psychology, 42 , 11-26.
Khatoon, T., & Mahmood, S. (2010). Mathematics anxiety among secondary school
students in India and its relationship to achievement in mathematics. European
Journal of Social Sciences, 16 , 75-86.
Kifer, E. W. (2002). Students’ attitudes and perceptions. In D. F. Robitaille & A. E.
Beaton (Ed.), Secondary analysis of the TIMSS data. Boston, MA: Kluwer
Academic.
Kim, E.-Y. (1993). Career choice among second-generation Korean-Americans:
Reflections of a cultural model of success. Anthropology and Education Quarterly,
24 , 224-248.
Kline, P. (1993). The handbook of psychological testing. London: Routledge.
Kline, R. B. (1998). Principles and practice of structural equation modeling. New York:
Guilford Press.

FACTORS INFLUENCING MATHEMATICS ACHIEVEMENT OF SECONDARY SCHOOL STUDENTS IN INDIA 194
Kline, R. B. (2010). Principles and practice of structural equation modeling. (3rd ed.).
New York: Guilford Press.
Kulum, G. (1980). Research on mathematics attitude. In R. J. Shumway (Ed.), Research
in mathematics education (p. 356-387). Reston, VA: National Council of Teachers
of Mathematics, Inc.
Kvale, S. (1996). Interviews: An introduction to quantitative research interviewing.
Thousand Oaks, CA: Sage.
Lamb, S., & Fullarton, S. (2002). Classroom and school factors affecting mathematics
achievement: A comparative study of Australia and the United States using
TIMSS. Australian Journal of Education, 46 , 154-171.
Lazarus, M. (1974). Mathphobia : Some personal speculations. National Elementary
Principal, 53 , 16-22.
Leder, G. C. (1987). Attitudes towards mathematics. In T. A. Romberg & D. M. Stewart
(Ed.), The monitoring of school mathematics (Vol. 2, p. 261-277). Madison.
Lee, B. Y. (1992). The effects of learner control and adaptive information in mathematics
computer-assisted instruction on achievement and task-related anxiety (Doctoral
dissertation). Florida Institute of Technology. (Dissertation Abstracts
International, 52, 3236A.)
Lee, J. (2009). Universals and specifics of math self-concept, math self-efficacy, and math
anxiety across 41 PISA 2003 participating countries. Learning and Individual
Differences, 19 , 355-365.
Lemaire, L. (2003). Interview with Philippe Tonduer. European Mathematical Society,
Newsletter, 49.
Lent, R. W., Lopez, F. G., & Bieschke, K. J. (1993). Predicting mathematics-related
choice and success behaviors: Test of an expanded social cognitive model. Journal
of Vocational Behavior , 42 , 223-236.
FACTORS INFLUENCING MATHEMATICS ACHIEVEMENT OF SECONDARY SCHOOL STUDENTS IN INDIA 195
Levin, I., Levy-Shiff., Appelbaum-Peled, T., Katz, I., Komar, M., & Meiran, N. (1997).
Antecedents and consequences of maternal involvement in children’s homework: A
longitudinal analysis. Journal of Applied Developmental Psychology, 18 , 207-227.
Levin, K. A. (2006). Study design111: Cross-sectional studies. Evidence-Based Dentistry,
7 , 24-25.
Levpuscek, M. P., & Zupancic, M. (2009). Math achievement in early adolescence: The
role of parental involvement, teachers’ behavior, and students’ motivational beliefs
about math. The Journal of Early Adolescence, 29 , 541-570.
Levy, F., & Murnane, R. J. (2004). The new division of labor: How computers are
creating the next job market. Princeton, NJ: University Press.
Lin, N. (1976). Foundations of social research. New York: McGraw-Hill.
Linacre, J. M. (1997). Cronbach alpha or Rasch reliability: Which tells the "truth"?
Rasch Measurement Transactions, 11 , 580-581.
Linacre, J. M. (2004). Estimation methods for Rasch measures. In E. V. Smith & R. M.
Smith (Ed.), Introduction to Rasch measurements: Theory, models and application
(p. 25-47). Maple Grove, MN: JAM Press.
Linacre, J. M. (2012). Rasch model computer program (Version 3.74.0). Chicago, III:
Winstep.com.
Lirgg, C. D. (1993). Effects of same-sex versus co-ed physcial education on the self
perceptions of high school students. Research Quarterly for Exercise and Sport, 64 ,
234-324.
Liu, R. W. (1998). Educational and career expectations of Chinese-American college
students. Journal of College Student Development, 39 , 577-588.
Lowell, B. L., & Salzman, H. (2007). Into the eye of the storm: Assessing the evidence on
science and engineering education, quality, and workforce demand. (Retrieved from
http://www.urban.org/publications/411562.html)
FACTORS INFLUENCING MATHEMATICS ACHIEVEMENT OF SECONDARY SCHOOL STUDENTS IN INDIA 196
Luigi, M., Francesca, D., Maria, C. S., Elenora, P., Valentina, G. D., & Benedetto, V.
(2007). The role of anxiety symptoms in school performance in a community
sample of children and adolescents. BMC Public Health, 7 , 347.
Ma, X. (1999). A meta-analysis of the relationship between anxiety toward mathematics
and achievement in mathematics. Journal for Research in Mathematics Education,
30 , 525-540.
Ma, X. (2001). Participation in advanced mathematics: Do expectations and influence of
students, peers, teachers and parents matter? Contemporary Educational
Psychology, 26 , 132-146.
Ma, X. (2008). Within-school gender gaps in reading, mathematics, and science literacy.
Comparative Education Review, 52 , 437-460.
Ma, X., & Kishor, N. (1997). Assessing the relationship between attitude toward
mathematics and achievement in mathematics: A meta analysis. Journal for
Research in Mathematics Education, 28 , 26-47.
Ma, X., & Klinger, D. A. (2000). Hierarchical linear modelling of student and school
effects on academic achievement. Canadian Journal of Education, 25 , 41-55.
Ma, X., & Xu, J. (2004a). The causal ordering of mathematics anxiety and mathematics
achievement: A longitudinal panel analysis. Journal of Adolescence, 27 , 165-179.
Ma, X., & Xu, J. (2004b). Determining the causal ordering between attitude toward
mathematics and achievement in mathematics. American Journal of Education,
110 , 256-280.
MacCallum, R. C., Browne, M. W., & Sugawara, H. M. (1996). Power analysis and
determination of sample size for covariance structure modeling. Psychological
Methods, 1 , 130-149.
Maccoby, E. E., & Martin, J. A. (1983). Socialization in the context of the family:
Parent-child interaction. In P. H. Mussen (Ed.), Handbook of child psychology:
FACTORS INFLUENCING MATHEMATICS ACHIEVEMENT OF SECONDARY SCHOOL STUDENTS IN INDIA 197
Socialisation, personality, and social development. Wiley, New York.
Mahad, N. F., Abdullah, F., & Abdul Kadir, S. A. (2012). Attitude of A-level medicine
students towards learning the mathematical subjects. International Journal of
Education (Educational Assessment Section), 2 , 166-187.
Martin, M., Mullis, I., Gregory, K., Hoyle, C., & Shen, C. (2000). Effective schools in
science and mathematics. (Massachusetts: Boston College.)
Masters, G. N. (1982). A Rasch model for partial credit scoring. Psychometrika, 47 ,
149-174.
Mato, M. D., & de la Torre, E. (2010). Evaluation of attitudes towards mathematics and
academic performance. PNA, 5 , 25-36.
Mattern, N., & Schau, C. (2002). Gender difference in attitude-achievement relationships
over time among white middle-school students. Journal of Research in Science
Teaching, 39 , 324-340.
McCarty, R. (2007). When anxiety causes your brain to jam, use your heart: Institute of
HeartMath. (Retrieved on 16th January 2012, from
http://www.macquarieinstitute.com)
McLeod, D. B. (1992). Research on affect in mathematics education: A
reconceptualisation. In D. A. Grouws (Ed.), Handbook of research on mathematics
teaching and learning (p. 575-596). New York: Macmillan Publishing Company.
McNamara, C. (1999). General guidelines for conducting interviews. St.Paul, MN: The
management assistance program for nonprofits. (Retrieved from
http://www.managementhelp.org/evaluatn/intriview.htm)
McNeal Jr, R. B. (1999). Parental involvement as social capital: Differential effectiveness
on science achievement, truancy, and dropping out. Social Forces, 78 , 117-144.
Miles, M. B., & Huberman, M. A. (1994). Qualitative data analysis: An expanded source
book. Thousand Oaks, CA: Sage.
FACTORS INFLUENCING MATHEMATICS ACHIEVEMENT OF SECONDARY SCHOOL STUDENTS IN INDIA 198
Mishra, B. K. (2011). Important to improve quality of mathematics education:
Academicians. The Times of India. (Retrieved from http://www.timesofindia.
indiatimes.com/articleshow/11146612.cms)
Mohammed, L., & Waheed, H. (2011). Secondary students’ attitude towards
mathematics in a selected school of Maldives. International Journal of Humanities
and Social Science, 15 , 277-281.
Mueller, C. A. (2006). Practical intelligence in the superintendency: Employing Rasch
modeling to create and validate the tacit knowledge inventory for school
superintendents. (Retrieved from ProQuest Digital dissertations)
Mulhern, F., & Rae, G. (1998). Development of a shortened form of the Fennema-
Sherman Mathematics Attitudes Scales. Educational and Psychological
Measurement, 58 , 295-306.
Muller, C. (1998). Gender differences in parental involvement and adolescents’
mathematics achievement. Sociology of Education, 71 , 336-356.
Mullis, I., Martin, M., Fierros, E., Goldberg, A., & Stemler, S. (2000). Gender differences
in achievement: IEA Third International Mathematics and Science Study, TIMSS
(Rapport technique). (Chestnut Hill, MA: Boston College.)
Mullis, I., Martin, M., Foy, P., & Arora, A. (2012). TIMSS 2011 International Results in
Mathematics (Tech. Rep.). Chestnut Hill, MA: TIMSS and PIRLS International
Study Center, Boston College.
Murrane, R. J., Willett, J. B., & Levy, F. (1995). The growing importance of cognitive
skills in wage determination. The Review of Economics and Statistics, 77 , 251-266.
National Center for Education Statistics. (2001). The nation’s report card: 2000
mathematics assessment results. (Retrieved from
http://www.nces.ed.gov/nationsreportcard/pdf/main2000/2001517.pdf)
Neale, D. (1969). The role of attitudes in learning mathematics. The Arithmetic

FACTORS INFLUENCING MATHEMATICS ACHIEVEMENT OF SECONDARY SCHOOL STUDENTS IN INDIA 199
Teacher , 16 , 631- 641.
Neuman, L. (2001). Social research methods: Qualitative and quantitative approaches
(4th ed.). Massachusetts: Allyn & Bacon.
Newstead, K. (1998). Comparison of young children’s mathematics anxiety across
different teaching approaches (Unpublished Doctoral dissertation). Cambridge
University.
Ng, L. K. (2012). Mathematics anxiety in secondary school students. In J. Dindyal, L. P.
Chenug, & S. F. Ng (Ed.), Mathematics education: Expanding horizons. Singapore:
MERGA. (Proceedings of the 35th annual conference of the mathematics
Education Research group of Australasia)
Nickerson, R. S. (2000). Null hypothesis significance testing: A review of an old and
continuing controversy. Psychological Methods, 5 , 241-301.
Nicolaidou, M., & Philippou, G. (2003). Attitudes towards mathematics, self-efficacy and
achievement in problem solving. European Research in Mathematics, III , 1-11.
Nisbitt, R. E. (2003). The geography of thought: How Asians and Westeners think
differently..... and why. Maine, London: Nicholas Brealey.
Nye, B., Konstantopoulos, S., & Hedges, L. V. (2004). How large are teacher effects?
Educational Evaluation and Policy Analysis, 26 , 237-257.
Nye, C., Turner, H., & Schwartz, J. (2007). Approaches to parent involvement for
improving the academic performance of elementary school age children in grades
K-6. London, England: The Collaboration. (Retrieved from
http://campbellcollaboration.org/doc pdf/Nye PIReview.pdf)
OECD. (2014). PISA 2012 results. What students know and can do: Student performance
in mathematics, reading, and science (Volume 1, Revised edition, February, 2014,
PISA). OECD Publishing. (http:// dx.doi.org/ 10.1787/9789264201118-en)
OECD Global Science Forum. (2006). Evolution of student interest in science and
FACTORS INFLUENCING MATHEMATICS ACHIEVEMENT OF SECONDARY SCHOOL STUDENTS IN INDIA 200
technology studies (policy report). OECD Global Science Forum. (Tech. Rep.).
(Retrieved 18th November 2010, from
http://www.oecd.org/dataoecd/16/30/36645825.pdf)
Olatoye, R. A., & Ogunkola, B. J. (2008). Parental involvement, interest in schooling and
science achievement of junior secondary school students in Ogun State, Nigeria.
College Teaching Methods and Styles Journal, 4 , 33-39.
Osborne, J., & Collins, S. (2001). Pupils’ views of the role and value of the science
curriculum: A focus group study. International Journal of Science Education, 23 ,
441-467.
Pajares, F., & Miller, M. D. (1994). Role of self-efficacy and self-concept beliefs in
mathematical problem solving: A path analysis. Journal of Educational Psychology,
86 , 193 - 203.
Pallant, J. (2013). SPSS survival manual: A step by step guide to data analysis using
IBM SPSS. (5th ed.). Sydney, Australia: Allen & Unwin.
Papanastasiou, C. (2002). School, teaching and family influence on students attitudes
towards science: Based on TIMSS data Cyprus. Studies in Educational Evaluation,
28 , 71-86.
Patall, E. A., Cooper, H., & Robinson, J. C. (2008). Parental involvement in homework:
A research synthesis. Review of Educational Research, 78 , 1039-1101.
Patton, M. O. (1980). Qualitative evaluation methods. Beverly Hills, CA: Sage.
Phillipson, S. (2008). Parental role in academic achievement within a specific cultural
context. (Unpublished PhD thesis). University of New England.
Pietsch, J., Walker, R., & Chapman, E. (2003). The relationship among self-concept,
self-efficacy, and performance in mathematics during secondary school. Journal of
Educational Psychology, 95 , 589-603.
Pinar, C. (2011). Eighth grade mathematics achievement gaps across race, ethnicity, and
FACTORS INFLUENCING MATHEMATICS ACHIEVEMENT OF SECONDARY SCHOOL STUDENTS IN INDIA 201
gender. Multicultural Learning and Teaching, 6 , 2161-2412.
PISA. (2009). Take the test: Sample questions from OECD’s PISA assessments (Tech.
Rep.). (-ISBN 978-92-64-05080-8- ľOECD 2009.)
Podsakoff, P. M., MacKenzie, S. B., Lee, J.-Y., & Podsakoff, N. P. (2013). Common
method biases in behavioral research: A critical review of the literature and
recommended remedies. Journal of Applied Psychology, 88 , 879-903.
Pomerantz, E. M., Moorman, E. A., & Litwack, S. D. (2007). The how, whom, and why
of parents’ involvement in children’s academic lives. Review of Educational
Research, 77 , 373-410.
Popper, K. (2002). The logic of scientific discovery. London: Routledge.
Preis, C., & Biggs, B. (2001). Can instructors help learners to overcome math anxiety?
Australian Teacher Education Association Journal, 28 , 6-10.
QSR International. (2012). NVivo qualitative data analysis software.
Quilter, D., & Harper, E. (1988). "Why we didn’t like mathematics, and why we can’t do
it". Educational Research, 30 , 121-134.
Ramalingam, K. (2005). Teen suicides mount in Tamilnadu. (Retrieved from
www.indiatogether.org/2005/feb/chi_pressure.htm)
Ramanujam, R. (2012). Mathematics education in India: An overview. In R.Ramanujam
& R. Subramaniam (Eds.), Mathematics education in India: Status and outlook
(p. 1-12). Mumbai, India: Homi Bhabha Centre for Science Education.
Randhawa, B. R. S. (1991). Gender differences in academic achievement: A closer look
at mathematics. Alberta Journal of Educational Research, 38 , 241-257.
Rasch, G. (1960). Probabilistic models for some intelligence and attainment tests.
Copenhagen, Danish Institute for Educational Research.
Rasch, G. (1980). Probabilistic models for some intelligence and attainment tests
(Expanded ed.). Chicago: University of California.

FACTORS INFLUENCING MATHEMATICS ACHIEVEMENT OF SECONDARY SCHOOL STUDENTS IN INDIA 202
Reitman, D., Rhode, P., Hupp, S. D. A., & Altobello, C. (2002). Development and
validation of the parental authority questionnaire-revised. Journal of
Psychopathology and Behavioural Assessment, 24 , 119-127.
Reynolds, A. J., & Walberg, H. J. (1991). A structural model of high school mathematics
outcomes. Journal of Educational Research, 85 , 150-158.
Richardson, F., & Suinn, R. (1972). The mathematics anxiety rating scale: Psychometric
data. Journal of Counseling Psychology(19), 551-554.
Richardson, F. C., & Woolfolk, R. L. (1980). Mathematics anxiety. In I.G.Sarason (Ed.),
Test anxiety: Theory, research, and application. Hillsdale, NJ: Erlbaum.
Rodrigues, S., & Khaliq, A. (2012). Secondary school students’ attitudes towards
mathematics in Quetta, Pakistan. International Researcher , 1 , 11-18.
Sanders, W. L., & Rivers, J. C. (1996). Cumulative and residual effects of teachers on
future student academic achievement. (Research progress report). Tennessee:
University of Tennessee Value-Added Research and Assessment Center. (Retrieved
from
http://www.cgp.upenn.edu/pdf/Sanders_Rivers-TVASS_teacher%20effects.pdf)
Sands, T., & Plunkett, S. W. (2005). A new scale to measure adolescent reports of
academic support by mothers, fathers, teachers, and friends in Latino immigrants
families. Hispanic Journal of Behavioural Sciences, 27 , 244-253.
Santrock, J. W., & Yussen, S. R. (1984). Children and adolescents: A developmental
perspective. Dubuque, IA: W.M.C. Brown.
Schleicher, A., & Ikeda, M. (2009). Viewing the Japenese school system through the prism
of PISA (Tech. Rep.). Organisation for Economic Co-operation and Development.
(Retrieved from http://www.oecd.org/japan/46623994.pdf)
Schneider, B., & Lee, Y. (1990). A model for academic success: The school and home
environment of East Asian students. Anthropology and Education Quarterly, 21 ,
FACTORS INFLUENCING MATHEMATICS ACHIEVEMENT OF SECONDARY SCHOOL STUDENTS IN INDIA 203
358-377.
Schoolland, K. (1990). Shogun’s ghost: The dark side of Japanese education. New York:
Bergin & Garvey.
Shashanni, L. (1995). Gender differences in mathematics experience and attitude and
their relation to computer attitude. Educational Technology, 35 , 32-38.
Sherman, J. (1982). Continuing in mathematics: A longitudinal study of the attitudes of
high school girls. Psychology of Women Quarterly, 7 , 132-140.
Sherman, J. (1983). Factors predicting girls’ and boys’ enrolment in college preparatory
mathematics. Psychology of Women Quarterly, 7 , 272-281.
Simon, B. S. (2001). Family involvement in high school: Predictors and effects. NASSP
Bulletin, 85 , 8-19.
Singh, K., Granville, M., & Dika, S. (2002). Mathematics and science achievement:
Effects of motivation, interest and academic engagement. Journal of Educational
Research, 95 , 323-332.
Smith, E. (2011). Staying in the science stream: patterns of participation in A-level
science subjects in the UK. Educational Studies, 37 , 59-71.
Speilberger, C. D. (1972). Anxiety as an emotional state. New York: Academic Press.
Spelke, E. S. (2005). Sex differences in intrinsic aptitude for mathematics and science?
American Psychologist, 60 , 950 - 958.
Starkey, P., & Klein, A. (2000). Fosetring parental support for children’s mathematical
development: An intervention with head start families. Early Education and
Development, 11 , 659-680.
Steinberg, L., Elmen, D. J., & Mounts, N. S. (1989). Authoritative parenting,
psychological maturity, and academic success among adolescents. Child
Development, 60 , 1424-1436.
Steinberg, L., Lamborn, S. D., Dornbusch, S. M., & Darling, N. (1992). Impact of
FACTORS INFLUENCING MATHEMATICS ACHIEVEMENT OF SECONDARY SCHOOL STUDENTS IN INDIA 204
parenting practices on adolescent achievement: Authoritative parenting, school
involvement, and encouragement to succeed. Child Development, 63 , 1266 - 1281.
Steinberg, L., Varua, M. E., & Yong, J. (2010). Mathematics aptitude, attitude,
secondary schools and student success in quantitative methods for business subject
in an Australian Catholic University experience. Paper presented at the 39th
Australian conference of economics. (Sydney, 27-29 September.)
Stevenson, D., & Baker, D. (1987). The family-school relation and the child’s school
performance. Child Development, 58 , 1348-1357.
Sticker, L. J., Rock, D. A., & Burton, N. W. (1993). Sex differences in predictions of
college grades from Scholastic Aptitude Test scores. Journal of Educational
Psychology, 85 , 710-718.
Strage, A., & Brandt, T. S. (1999). Authoritative parenting and college students’
academic adjustment and success. Journal of Educational Psychology, 91 , 146-156.
Strange, V., Forest, S., Oakley, A., & The Ripple Study Team. (2003). Using research
questionnaires with young people in schools: The influence of social context.
International Journal of Social Research Methodology, 6 , 337-346.
Suydam, M. N., & Weaver, J. F. (1975). Research on mathematics learning. In J.N.
Payne (Ed.), Mathematics learning in early childhood: Thirty Seventh Yearbook
(p. 44-67). Reston, VA.
Tabachnick, B., & Fidell, L. S. (2013). Using multivariate statistic. (6th ed.). New
Jersey, NJ: Pearson.
Tapia, M. (2004). The relationship of math anxiety and gender. Academic Exchange
Quarterly, 8 , 187-195.
Thomson, S., Hillman, K., & Wernert, N. (2012). Monitoring Australian Year 8 student
achievement internationally: TIMSS 2011 (Tech. Rep.). Camberwell, Australia:
Australian Council for Educational Research.
FACTORS INFLUENCING MATHEMATICS ACHIEVEMENT OF SECONDARY SCHOOL STUDENTS IN INDIA 205
Thurmond, V. A. (2001). The point of triangulation. Journal of Nursing Scholarship, 33 ,
254-256.
Tocci, C. M., & Engelhard Jr., G. (1991). Achievement, parental support, and gender
differences in attitudes toward mathematics. Journal of Educational Research, 84 ,
280-286.
Trivette, P., & Anderson, E. (1995). The effects of four components of parental
involvement on eighth grade student achievement. School Psychology Review, 24 ,
299-317.
Trusty, J. (1999). Effects of parental involvement on late adolescents educational
expectations. Journal of Research and Development in Education, 32 , 224-233.
Turner, E. A., Chandler, M., & Heffer, R. W. (2009). The influence of parenting styles,
achievement motivation, and self-efficacy on academic performance in college
students. Journal of College Student Development, 50 , 337- 346.
Turner, J., Midgley, C., Meyer, D., Gheen, M., Anderman, E., & Kang, Y. (2002). The
classroom environment and students’ reports of avoidance strategies in
mathematics: A multidimensional study. Journal of Educational Psychology, 94 ,
88-106.
Ullman, J. (1996). Structural equation modeling. In B. G.Tabachnick & L. S. Fidell
(Eds.), Using multivariate statistics (p. 709-811). Harper Collins, NY.
Ullman, J. (2006). Structural equation modeling. In B.G.Tabachnick & L.S. Fidell (Ed.),
Using multivariate statistics (p. 653-771). Boston, MA: Allyn & Bacon.
Ullman, J. (2013). Structural equation modeling. In B.G.Tabachnick & L.S. Fidell (Ed.),
Using multivariate statistics (p. 681-785). Boston, MA: Pearson.
Uusimaki, L. (2004). Addressing pre-service student teachers’ negative beliefs and
anxieties about mathematics. Masters thesis, Centre for Mathematics, Science and
Technology, Queensland University of Technology.
FACTORS INFLUENCING MATHEMATICS ACHIEVEMENT OF SECONDARY SCHOOL STUDENTS IN INDIA 206
Vandenberg, R. J., & Lance, C. E. (2000). A review and synthesis of the measurement
invariance literature: Suggestions, practices, and recommendations for
organizations research. Organisational Research Methods, 3 , 4-70.
Venkatsh, K. G., & Karimi, A. (2010). Mathematics anxiety, mathematics performance
and overall academic performance in high school students. Journal of the Indian
Academy of Applied Psychology, 36 , 147-150.
Verma, S. (1998). Life skills for psychosocial competence in the youth: An intervention
study. (Report submitted to The Johann Jacobs Foundation, Zurich, Switzerland.)
Verma, S., & Gupta, J. (1990). Some aspects of high academic stress and symptoms.
Journal of Personality and Clinical Studies, 6 , 7-12.
Verma, S., Sharma, D., & Larson, R. (2002). School stress in India: Effects on time and
daily emotions. International Journal of Behavioural Development, 26 , 500-508.
Vukovic, R. K., Roberts, S. O., & Wright, L. (2013). From parental involvement to
children’s mathematical performance: The role of mathematics anxiety. Early
Education and Development, 24 , 446-467.
Wang, J. (2007). A trend study of self-concept and mathematics achievement in a
cross-cultural context. Mathematics Education Research Journal, 19 , 33-47.
Wentzel, K. (1999). Social influences on school adjustment: Commentary. Educational
Psychologist, 34 , 59-69.
Wheeler, P. (1992). Promoting parent involvement in secondary schools. NASSP
Bulletin, 76 , 28-35.
Widaman, K. F., & Reise, S. P. (1997). Exploring the measurement invariance of
psychological instruments: Applications in the substance use domain. In
K. J. Bryant, M. Windle, & S. G. West (Eds.), The science of prevention:
Methodological advances from alcohol and substance abuse research (p. 281-324).
Washington, DC: American Psychological Association.
FACTORS INFLUENCING MATHEMATICS ACHIEVEMENT OF SECONDARY SCHOOL STUDENTS IN INDIA 207
Wilkins, J. L. M., & Ma, X. (2003). Modeling change in student attitude toward and
beliefs in mathematics. The Journal of Educational Research, 97 , 52-63.
Williams, T., & Williams, K. (2010). Self-efficacy and performance in mathematics:
Reciprocal determinism in 33 nations. Journal of Educational Psychology, 102 ,
453-466.
Willingham, W., & Cole, N. (1997). Gender and fair assessment. Mahwah, NJ: Erlbaum.
Willis, K. (2010). Analysing qualitative data. In M. Walter (Ed.), Social research
methods: An Australian perspective (p. 407-432). Melbourne, Australia: Oxford
University Press.
Wilson, T., & MacGillivray, H. (2007). Counting the basics: mathematical skills among
tertiary entrants. International Journal of Mathematical Education in Science and
Technology, 38 , 19-41.
Wither, D. P. (1998). A longitudinal study of the relationship between mathematics
achievement and mathematics anxiety from years 6 to 10. (Unpublished PhD
Thesis). University of Adelaide.
Wolf, F. M., & Blixt, S. L. (1981). A cross-sectional cross-lagged panel analysis of
mathematics achievement and attitudes: Implications for the interpretation of the
direction of predictive validity. Educational and Psychological Measurement, 41 ,
829-834.
Woodard, T. (2004). The effects of maths anxiety on post secondary developmental
students as related to achievement, gender and age. Inquiry, 9 . (ERIC
Documentation Reproduction Service No. EJ 878645)
Wright, B. D., & Stone, M. (1979). Best test design. Chicago, IlI: MESA Press.
Yan, W., & Lin, Q. (2005). Parental involvement and mathematics achievement:
Contrast across racial and ethnic groups. The Journal of Educational Research, 99 ,
116-127.
FACTORS INFLUENCING MATHEMATICS ACHIEVEMENT OF SECONDARY SCHOOL STUDENTS IN INDIA 208
Yenug, W. J., Linver, M. R., & Brooks-Gunn, J. (2002). How money matters for young
children’s development: Parental investment and family processes. Child
development, 73 , 1861-1879.
Yin, R. K. (2006). Mixed methods research: Are the methods genuinely integrated or
merely parallel? Research in the schools, 13 , 41-47.
Zakaria, E., & Nordin, N. M. (2008). The effects of mathematics anxiety on
matriculation students as related to motivation and achievement. Eurasia Journal
of Mathematics Science and Technology Education, 4 , 27-30.
Zan, R., & Martino, P. D. (2007). Attitude towards mathematics: Overcoming
positive/negative dichotomy. The Montana Mathematics Enthusiasts Monograph.
(3, p.157-168. The Montana Council of Teacher of Mathematics)
Zettle, R. D., & Houghton, L. L. (1998). The relationship between mathematics anxiety
and social desirability as a function of gender. College Student Journal, 32 , 81-86.
FACTORS INFLUENCING MATHEMATICS ACHIEVEMENT OF SECONDARY SCHOOL STUDENTS IN INDIA 209
Appendix
Appendix A: Student Questionnaire
UNIVERSITY OF TASMANIA
The influence of parental involvement, and students’ mathemat-
ics anxiety and attitude towards mathematics, on their mathe-
matics achievement in India.
STUDENT QUESTIONNAIRE
Thank you for taking part in the study

FACTORS INFLUENCING MATHEMATICS ACHIEVEMENT OF SECONDARY SCHOOL STUDENTS IN INDIA 210
This questionnaire is designed to understand the influence of parental involvement,
students’ mathematics anxiety and attitude towards mathematics on their mathematics
achievement. This is a measure of personal belief; obviously there are no right or wrong
answers. Be sure not to omit any items. All your answers will be kept confidential.
DIRECTIONS: On the following pages you will find several statements that you may
or may not agree with. You are asked to determine how strongly you feel about the
statement from strongly disagree to strongly agree. Please express the extent of your
agreement with each statement by placing a tick mark (X) under the column that best
describes your answer.
For example:
Statement Strongly
disagree
Disagree Undecided Agree Strongly
agreeEx I don’t like doing word
problems in mathematics
X
1. If you want to change your answer, please cross out the tick mark and mark another
column.
2. ‘Parent’ is defined for this study as biological parents or one who nurtures and cares
for the child.
3. Please provide the following information:
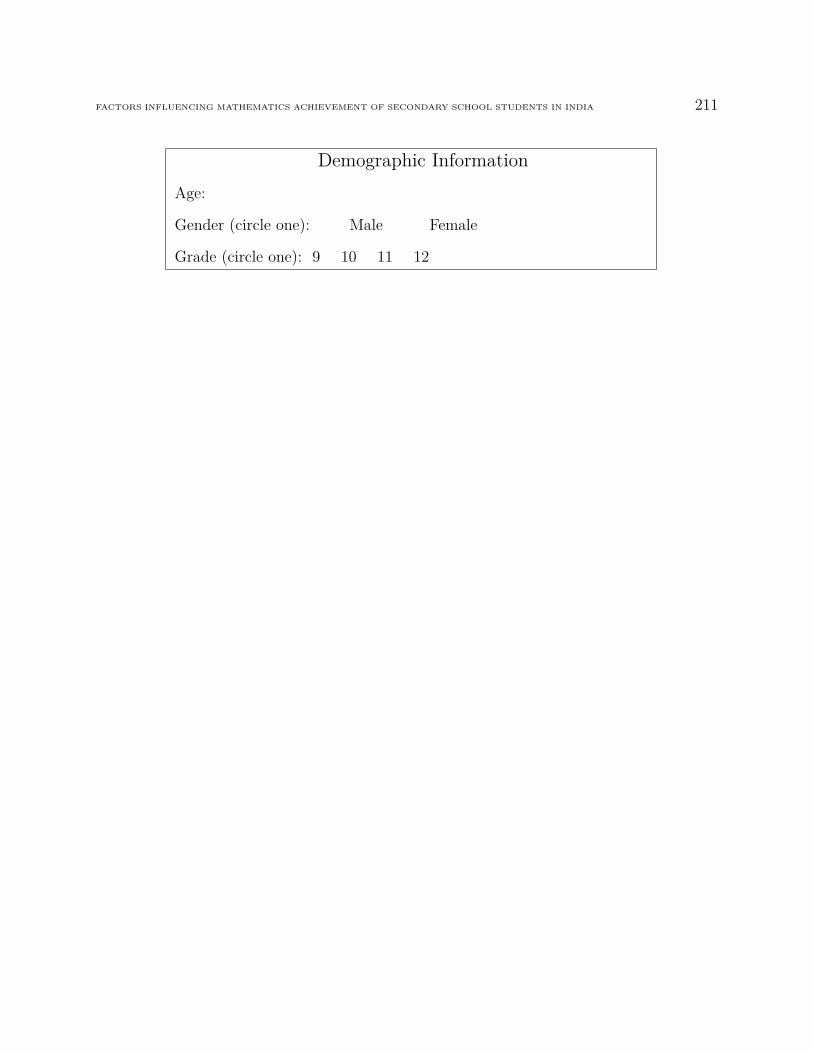
FACTORS INFLUENCING MATHEMATICS ACHIEVEMENT OF SECONDARY SCHOOL STUDENTS IN INDIA 211
Demographic InformationAge:
Gender (circle one): Male Female
Grade (circle one): 9 10 11 12

FACTORS INFLUENCING MATHEMATICS ACHIEVEMENT OF SECONDARY SCHOOL STUDENTS IN INDIA 212
Student Questionnaire 1 - Page 1 of 8
Instructions: Please place a tick mark (X) in the column indicating how much you
agree or disagree with each of the statement.
Statement Strongly
disagree
Disagree Undecided Agree Strongly
agree1 I like learning maths more than
any other subject2 Generally I feel secure while
attempting maths3 My parents encourage me to
score well in maths4 Mathematics doesn’t scare me at
all5 My parents think that mathe-
matics is one of the most impor-
tant subjects to study6 I like maths puzzles7 I’ll need mathematics for my
future career8 My parents feel that in a well-
run home the children should
have their way in the family as
often as the parents do.9 I do as little maths as possible
when I get the choice
1Source: Mulhern, F., & Rae, G. (1998). Shortened form of the Fennema- Sherman Mathematics Atti-
tude Scales. Educational and Psychological Measurement, 58(2). c©1998 Sage Publications, Inc. & Buri,
J. R (1991). Parental Authority Questionnaire, Journal of Personality Assessment, 57(1). c©Lawrence
Erlbaum Associates, Inc

FACTORS INFLUENCING MATHEMATICS ACHIEVEMENT OF SECONDARY SCHOOL STUDENTS IN INDIA 213
Student Questionnaire 2 - Page 1 of 8
Instructions: Please place a tick mark (X) in the column indicating how much you
agree or disagree with each of the statement.
Statement Strongly
disagree
Disagree Undecided Agree Strongly
agree10 My parents do not direct the
behaviours, activities and desires
of the children in the family.11 I am sure I could do advanced
mathematics12 My parents would get upset if I
tried to disagree with them13 I never get nervous during a
maths test14 My parents think I’ll need math-
ematics for what I want to do
after I finish secondary schooling15 Mathematics is interesting and
enjoyable to me16 My parents check my maths
homework regularly
2Source: Mulhern, F., & Rae, G. (1998). Shortened form of the Fennema- Sherman Mathematics Atti-
tude Scales. Educational and Psychological Measurement, 58(2). c©1998 Sage Publications, Inc. & Buri,
J. R (1991). Parental Authority Questionnaire, Journal of Personality Assessment, 57(1). c©Lawrence
Erlbaum Associates, Inc
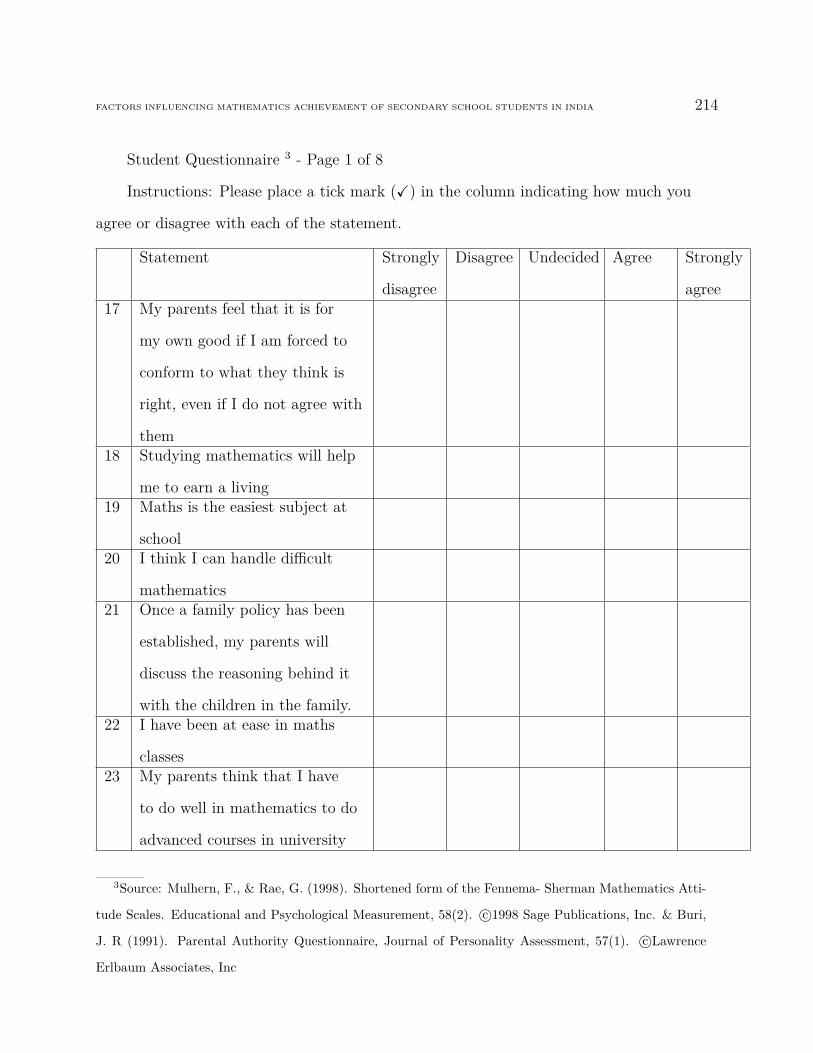
FACTORS INFLUENCING MATHEMATICS ACHIEVEMENT OF SECONDARY SCHOOL STUDENTS IN INDIA 214
Student Questionnaire 3 - Page 1 of 8
Instructions: Please place a tick mark (X) in the column indicating how much you
agree or disagree with each of the statement.
Statement Strongly
disagree
Disagree Undecided Agree Strongly
agree17 My parents feel that it is for
my own good if I am forced to
conform to what they think is
right, even if I do not agree with
them18 Studying mathematics will help
me to earn a living19 Maths is the easiest subject at
school20 I think I can handle difficult
mathematics21 Once a family policy has been
established, my parents will
discuss the reasoning behind it
with the children in the family.22 I have been at ease in maths
classes23 My parents think that I have
to do well in mathematics to do
advanced courses in university
3Source: Mulhern, F., & Rae, G. (1998). Shortened form of the Fennema- Sherman Mathematics Atti-
tude Scales. Educational and Psychological Measurement, 58(2). c©1998 Sage Publications, Inc. & Buri,
J. R (1991). Parental Authority Questionnaire, Journal of Personality Assessment, 57(1). c©Lawrence
Erlbaum Associates, Inc
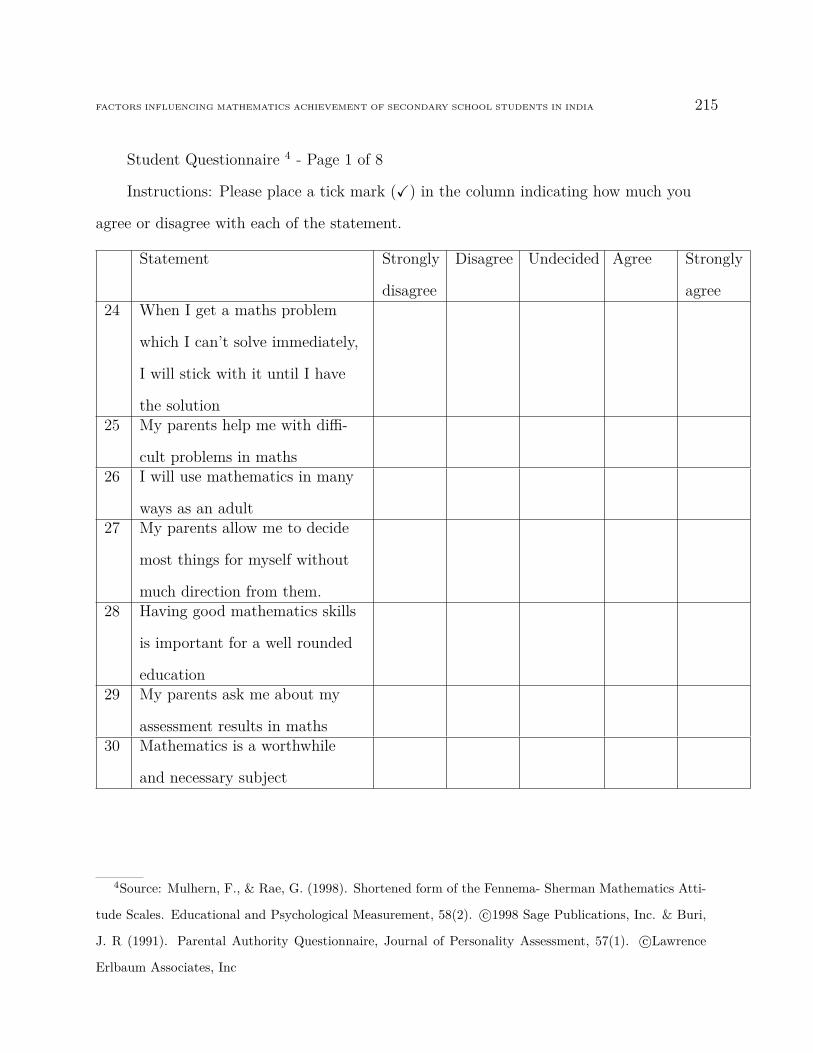
FACTORS INFLUENCING MATHEMATICS ACHIEVEMENT OF SECONDARY SCHOOL STUDENTS IN INDIA 215
Student Questionnaire 4 - Page 1 of 8
Instructions: Please place a tick mark (X) in the column indicating how much you
agree or disagree with each of the statement.
Statement Strongly
disagree
Disagree Undecided Agree Strongly
agree24 When I get a maths problem
which I can’t solve immediately,
I will stick with it until I have
the solution25 My parents help me with diffi-
cult problems in maths26 I will use mathematics in many
ways as an adult27 My parents allow me to decide
most things for myself without
much direction from them.28 Having good mathematics skills
is important for a well rounded
education29 My parents ask me about my
assessment results in maths30 Mathematics is a worthwhile
and necessary subject
4Source: Mulhern, F., & Rae, G. (1998). Shortened form of the Fennema- Sherman Mathematics Atti-
tude Scales. Educational and Psychological Measurement, 58(2). c©1998 Sage Publications, Inc. & Buri,
J. R (1991). Parental Authority Questionnaire, Journal of Personality Assessment, 57(1). c©Lawrence
Erlbaum Associates, Inc
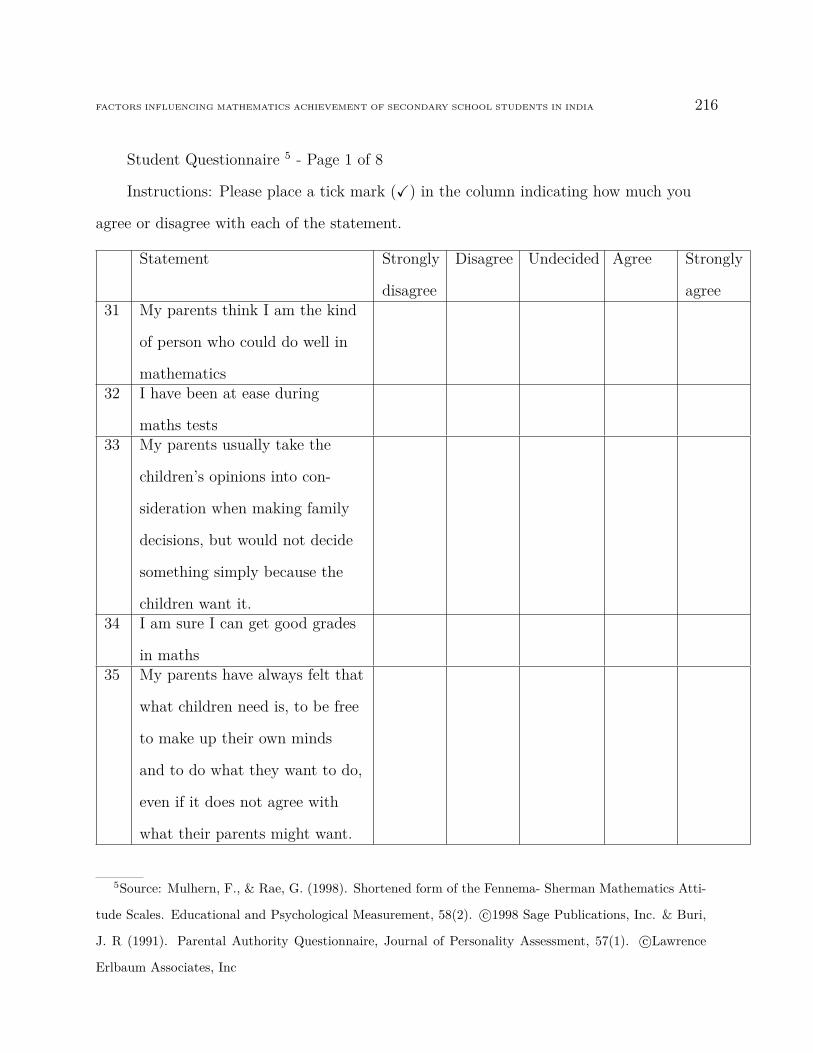
FACTORS INFLUENCING MATHEMATICS ACHIEVEMENT OF SECONDARY SCHOOL STUDENTS IN INDIA 216
Student Questionnaire 5 - Page 1 of 8
Instructions: Please place a tick mark (X) in the column indicating how much you
agree or disagree with each of the statement.
Statement Strongly
disagree
Disagree Undecided Agree Strongly
agree31 My parents think I am the kind
of person who could do well in
mathematics32 I have been at ease during
maths tests33 My parents usually take the
children’s opinions into con-
sideration when making family
decisions, but would not decide
something simply because the
children want it.34 I am sure I can get good grades
in maths35 My parents have always felt that
what children need is, to be free
to make up their own minds
and to do what they want to do,
even if it does not agree with
what their parents might want.
5Source: Mulhern, F., & Rae, G. (1998). Shortened form of the Fennema- Sherman Mathematics Atti-
tude Scales. Educational and Psychological Measurement, 58(2). c©1998 Sage Publications, Inc. & Buri,
J. R (1991). Parental Authority Questionnaire, Journal of Personality Assessment, 57(1). c©Lawrence
Erlbaum Associates, Inc
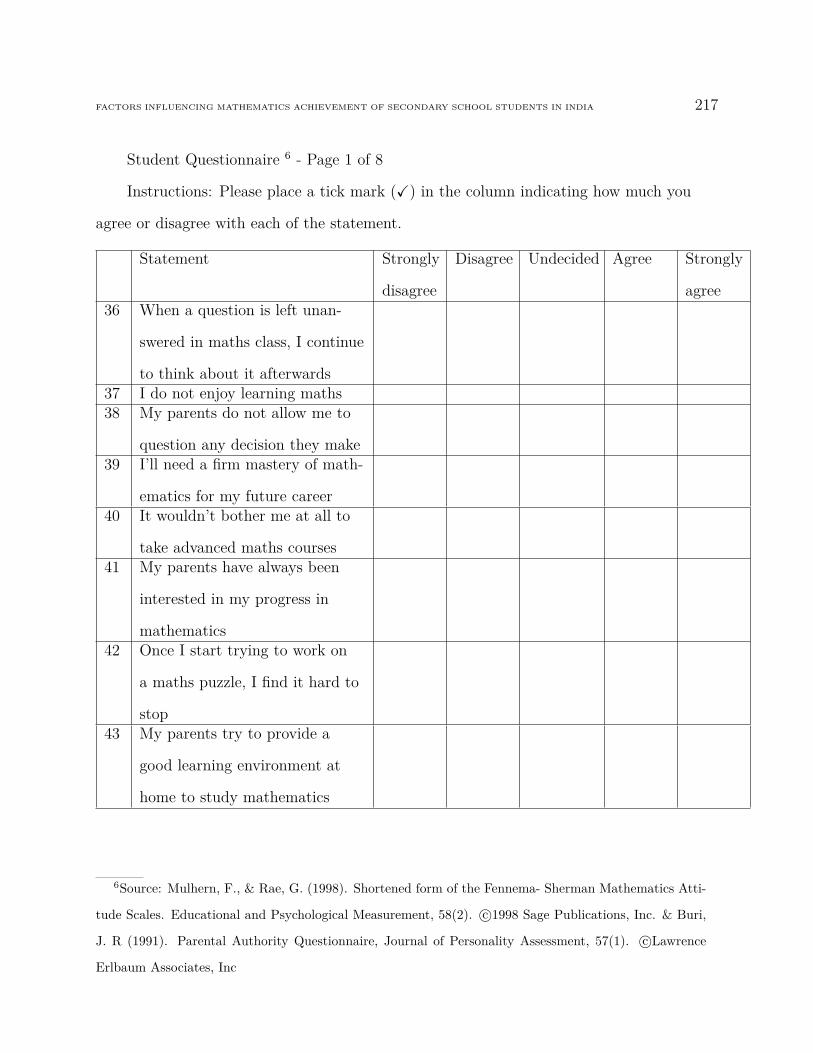
FACTORS INFLUENCING MATHEMATICS ACHIEVEMENT OF SECONDARY SCHOOL STUDENTS IN INDIA 217
Student Questionnaire 6 - Page 1 of 8
Instructions: Please place a tick mark (X) in the column indicating how much you
agree or disagree with each of the statement.
Statement Strongly
disagree
Disagree Undecided Agree Strongly
agree36 When a question is left unan-
swered in maths class, I continue
to think about it afterwards37 I do not enjoy learning maths38 My parents do not allow me to
question any decision they make39 I’ll need a firm mastery of math-
ematics for my future career40 It wouldn’t bother me at all to
take advanced maths courses41 My parents have always been
interested in my progress in
mathematics42 Once I start trying to work on
a maths puzzle, I find it hard to
stop43 My parents try to provide a
good learning environment at
home to study mathematics
6Source: Mulhern, F., & Rae, G. (1998). Shortened form of the Fennema- Sherman Mathematics Atti-
tude Scales. Educational and Psychological Measurement, 58(2). c©1998 Sage Publications, Inc. & Buri,
J. R (1991). Parental Authority Questionnaire, Journal of Personality Assessment, 57(1). c©Lawrence
Erlbaum Associates, Inc
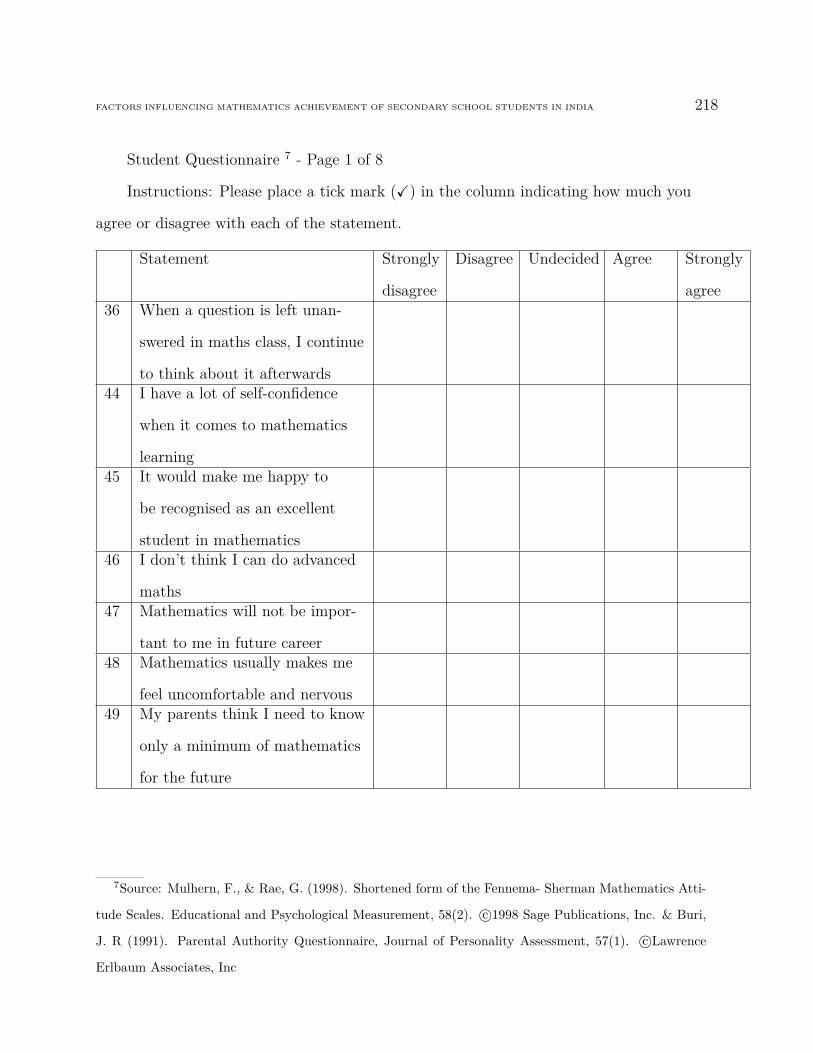
FACTORS INFLUENCING MATHEMATICS ACHIEVEMENT OF SECONDARY SCHOOL STUDENTS IN INDIA 218
Student Questionnaire 7 - Page 1 of 8
Instructions: Please place a tick mark (X) in the column indicating how much you
agree or disagree with each of the statement.
Statement Strongly
disagree
Disagree Undecided Agree Strongly
agree36 When a question is left unan-
swered in maths class, I continue
to think about it afterwards44 I have a lot of self-confidence
when it comes to mathematics
learning45 It would make me happy to
be recognised as an excellent
student in mathematics46 I don’t think I can do advanced
maths47 Mathematics will not be impor-
tant to me in future career48 Mathematics usually makes me
feel uncomfortable and nervous49 My parents think I need to know
only a minimum of mathematics
for the future
7Source: Mulhern, F., & Rae, G. (1998). Shortened form of the Fennema- Sherman Mathematics Atti-
tude Scales. Educational and Psychological Measurement, 58(2). c©1998 Sage Publications, Inc. & Buri,
J. R (1991). Parental Authority Questionnaire, Journal of Personality Assessment, 57(1). c©Lawrence
Erlbaum Associates, Inc

FACTORS INFLUENCING MATHEMATICS ACHIEVEMENT OF SECONDARY SCHOOL STUDENTS IN INDIA 219
Student Questionnaire 8 - Page 1 of 8
Instructions: Please place a tick mark (X) in the column indicating how much you
agree or disagree with each of the statement.
Statement Strongly
disagree
Disagree Undecided Agree Strongly
agree36 When a question is left unan-
swered in maths class, I continue
to think about it afterwards49 My parents think I need to know
only a minimum of mathematics
for the future50 The challenge of mathematics
problems does not appeal to me51 My parents encourage me to
work hard on maths problems
even though the problems are
difficult52 I’m not the type of person to do
well in mathematics53 I’d proud to be the outstanding
student in mathematics54 My parents direct the activities
and decisions of the children in
the family through reasoning
8Source: Mulhern, F., & Rae, G. (1998). Shortened form of the Fennema- Sherman Mathematics Atti-
tude Scales. Educational and Psychological Measurement, 58(2). c©1998 Sage Publications, Inc. & Buri,
J. R (1991). Parental Authority Questionnaire, Journal of Personality Assessment, 57(1). c©Lawrence
Erlbaum Associates, Inc
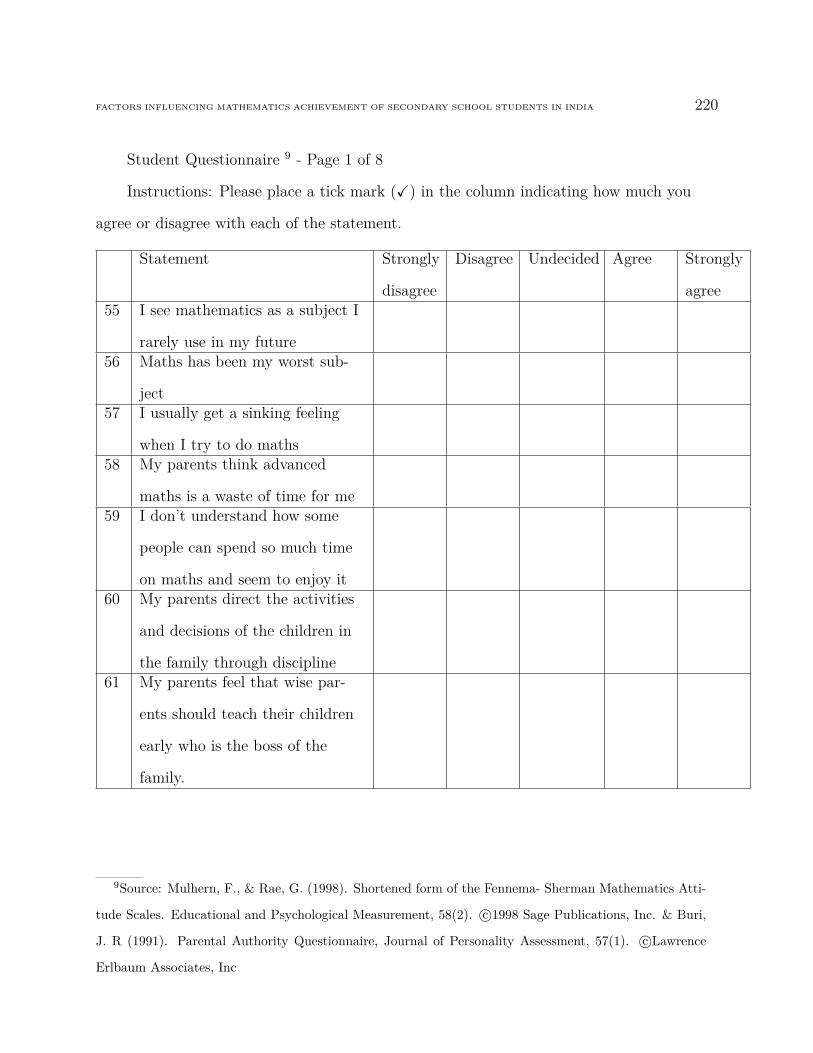
FACTORS INFLUENCING MATHEMATICS ACHIEVEMENT OF SECONDARY SCHOOL STUDENTS IN INDIA 220
Student Questionnaire 9 - Page 1 of 8
Instructions: Please place a tick mark (X) in the column indicating how much you
agree or disagree with each of the statement.
Statement Strongly
disagree
Disagree Undecided Agree Strongly
agree55 I see mathematics as a subject I
rarely use in my future56 Maths has been my worst sub-
ject57 I usually get a sinking feeling
when I try to do maths58 My parents think advanced
maths is a waste of time for me59 I don’t understand how some
people can spend so much time
on maths and seem to enjoy it60 My parents direct the activities
and decisions of the children in
the family through discipline61 My parents feel that wise par-
ents should teach their children
early who is the boss of the
family.
9Source: Mulhern, F., & Rae, G. (1998). Shortened form of the Fennema- Sherman Mathematics Atti-
tude Scales. Educational and Psychological Measurement, 58(2). c©1998 Sage Publications, Inc. & Buri,
J. R (1991). Parental Authority Questionnaire, Journal of Personality Assessment, 57(1). c©Lawrence
Erlbaum Associates, Inc
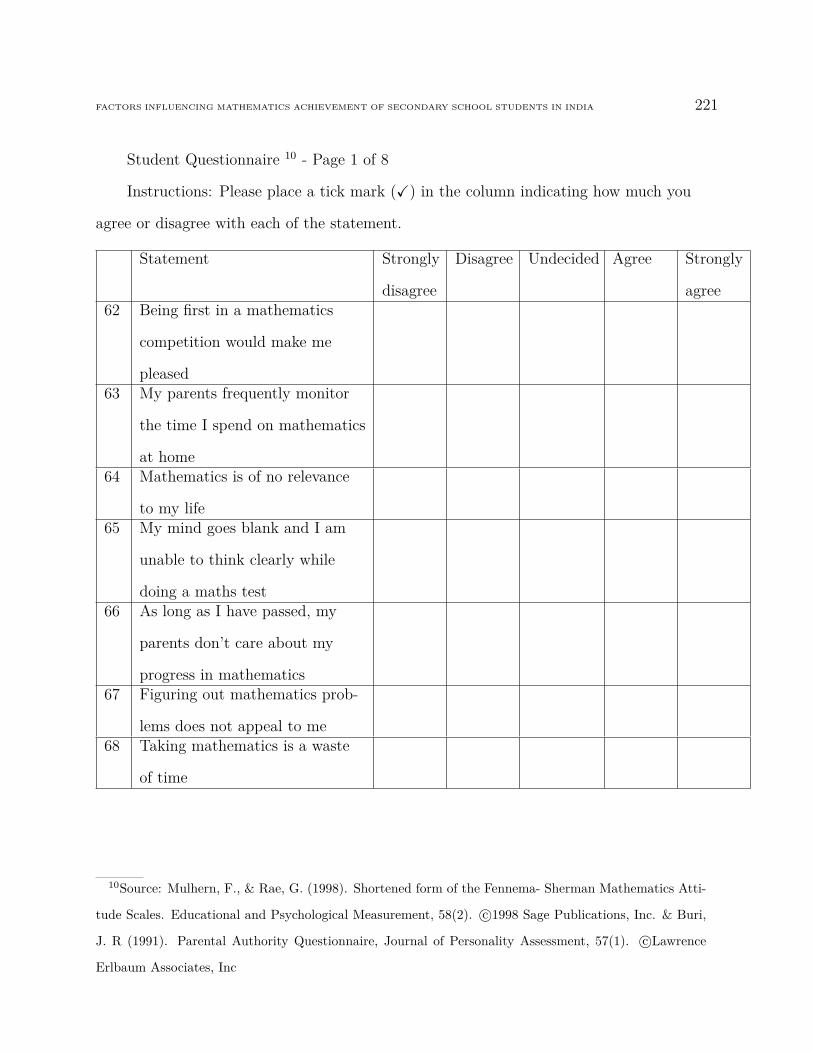
FACTORS INFLUENCING MATHEMATICS ACHIEVEMENT OF SECONDARY SCHOOL STUDENTS IN INDIA 221
Student Questionnaire 10 - Page 1 of 8
Instructions: Please place a tick mark (X) in the column indicating how much you
agree or disagree with each of the statement.
Statement Strongly
disagree
Disagree Undecided Agree Strongly
agree62 Being first in a mathematics
competition would make me
pleased63 My parents frequently monitor
the time I spend on mathematics
at home64 Mathematics is of no relevance
to my life65 My mind goes blank and I am
unable to think clearly while
doing a maths test66 As long as I have passed, my
parents don’t care about my
progress in mathematics67 Figuring out mathematics prob-
lems does not appeal to me68 Taking mathematics is a waste
of time
10Source: Mulhern, F., & Rae, G. (1998). Shortened form of the Fennema- Sherman Mathematics Atti-
tude Scales. Educational and Psychological Measurement, 58(2). c©1998 Sage Publications, Inc. & Buri,
J. R (1991). Parental Authority Questionnaire, Journal of Personality Assessment, 57(1). c©Lawrence
Erlbaum Associates, Inc

FACTORS INFLUENCING MATHEMATICS ACHIEVEMENT OF SECONDARY SCHOOL STUDENTS IN INDIA 222
Student Questionnaire 11 - Page 1 of 8
Instructions: Please place a tick mark (X) in the column indicating how much you
agree or disagree with each of the statement.
Statement Strongly
disagree
Disagree Undecided Agree Strongly
agree62 Being first in a mathematics
competition would make me
pleased63 My parents frequently monitor
the time I spend on mathematics
at home64 Mathematics is of no relevance
to my life65 My mind goes blank and I am
unable to think clearly while
doing a maths test66 As long as I have passed, my
parents don’t care about my
progress in mathematics67 Figuring out mathematics prob-
lems does not appeal to me68 Taking mathematics is a waste
of time
11Source: Mulhern, F., & Rae, G. (1998). Shortened form of the Fennema- Sherman Mathematics Atti-
tude Scales. Educational and Psychological Measurement, 58(2). c©1998 Sage Publications, Inc. & Buri,
J. R (1991). Parental Authority Questionnaire, Journal of Personality Assessment, 57(1). c©Lawrence
Erlbaum Associates, Inc
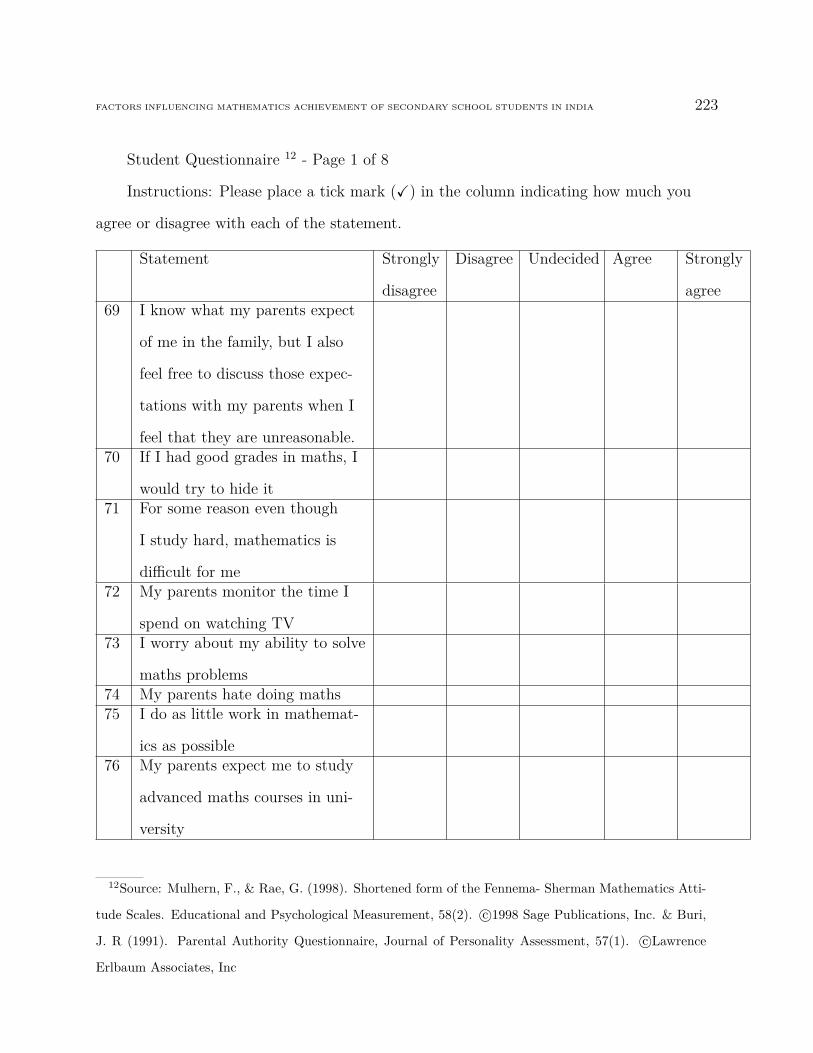
FACTORS INFLUENCING MATHEMATICS ACHIEVEMENT OF SECONDARY SCHOOL STUDENTS IN INDIA 223
Student Questionnaire 12 - Page 1 of 8
Instructions: Please place a tick mark (X) in the column indicating how much you
agree or disagree with each of the statement.
Statement Strongly
disagree
Disagree Undecided Agree Strongly
agree69 I know what my parents expect
of me in the family, but I also
feel free to discuss those expec-
tations with my parents when I
feel that they are unreasonable.70 If I had good grades in maths, I
would try to hide it71 For some reason even though
I study hard, mathematics is
difficult for me72 My parents monitor the time I
spend on watching TV73 I worry about my ability to solve
maths problems74 My parents hate doing maths75 I do as little work in mathemat-
ics as possible76 My parents expect me to study
advanced maths courses in uni-
versity
12Source: Mulhern, F., & Rae, G. (1998). Shortened form of the Fennema- Sherman Mathematics Atti-
tude Scales. Educational and Psychological Measurement, 58(2). c©1998 Sage Publications, Inc. & Buri,
J. R (1991). Parental Authority Questionnaire, Journal of Personality Assessment, 57(1). c©Lawrence
Erlbaum Associates, Inc
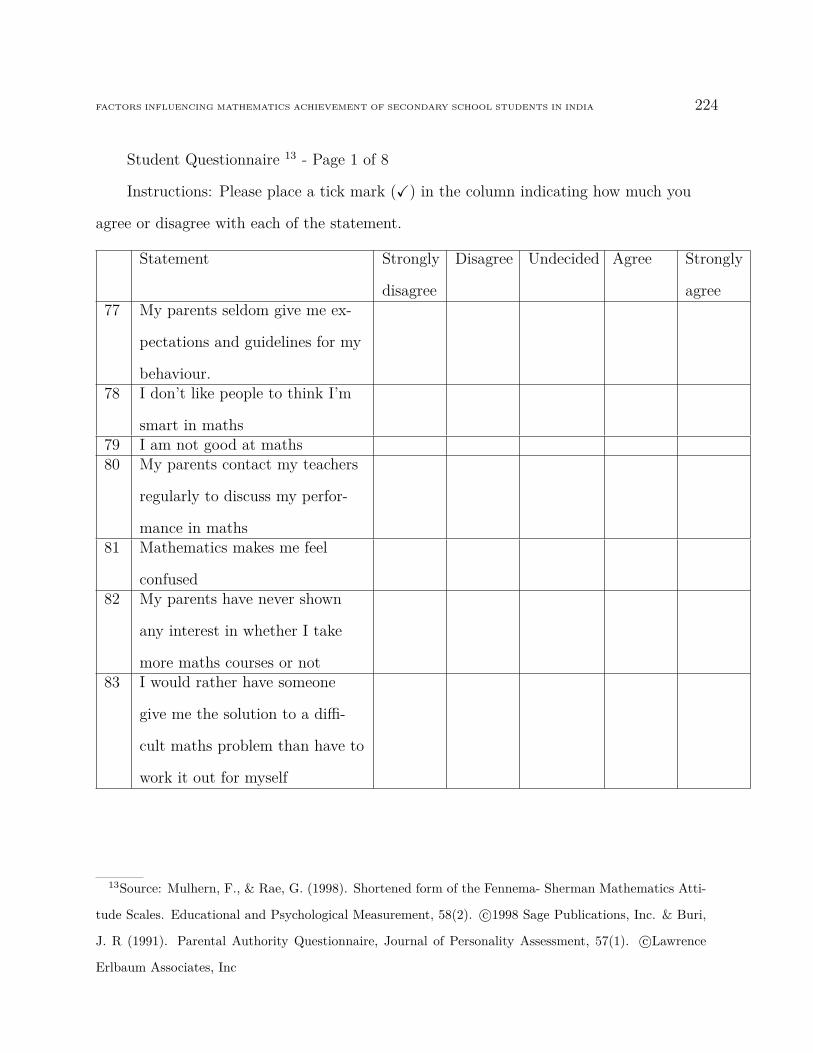
FACTORS INFLUENCING MATHEMATICS ACHIEVEMENT OF SECONDARY SCHOOL STUDENTS IN INDIA 224
Student Questionnaire 13 - Page 1 of 8
Instructions: Please place a tick mark (X) in the column indicating how much you
agree or disagree with each of the statement.
Statement Strongly
disagree
Disagree Undecided Agree Strongly
agree77 My parents seldom give me ex-
pectations and guidelines for my
behaviour.78 I don’t like people to think I’m
smart in maths79 I am not good at maths80 My parents contact my teachers
regularly to discuss my perfor-
mance in maths81 Mathematics makes me feel
confused82 My parents have never shown
any interest in whether I take
more maths courses or not83 I would rather have someone
give me the solution to a diffi-
cult maths problem than have to
work it out for myself
13Source: Mulhern, F., & Rae, G. (1998). Shortened form of the Fennema- Sherman Mathematics Atti-
tude Scales. Educational and Psychological Measurement, 58(2). c©1998 Sage Publications, Inc. & Buri,
J. R (1991). Parental Authority Questionnaire, Journal of Personality Assessment, 57(1). c©Lawrence
Erlbaum Associates, Inc

FACTORS INFLUENCING MATHEMATICS ACHIEVEMENT OF SECONDARY SCHOOL STUDENTS IN INDIA 225
Student Questionnaire 14 - Page 1 of 8
Instructions: Please place a tick mark (X) in the column indicating how much you
agree or disagree with each of the statement.
Statement Strongly
disagree
Disagree Undecided Agree Strongly
agree84 I expect to have little use for
mathematics when I get out of
school85 My parents give me clear di-
rections for my behaviours and
activities, but they will also un-
derstand when I disagree with
them.
(Note: End of questionnaire, please go to the next page)
14Source: Mulhern, F., & Rae, G. (1998). Shortened form of the Fennema- Sherman Mathematics Atti-
tude Scales. Educational and Psychological Measurement, 58(2). c©1998 Sage Publications, Inc. & Buri,
J. R (1991). Parental Authority Questionnaire, Journal of Personality Assessment, 57(1). c©Lawrence
Erlbaum Associates, Inc
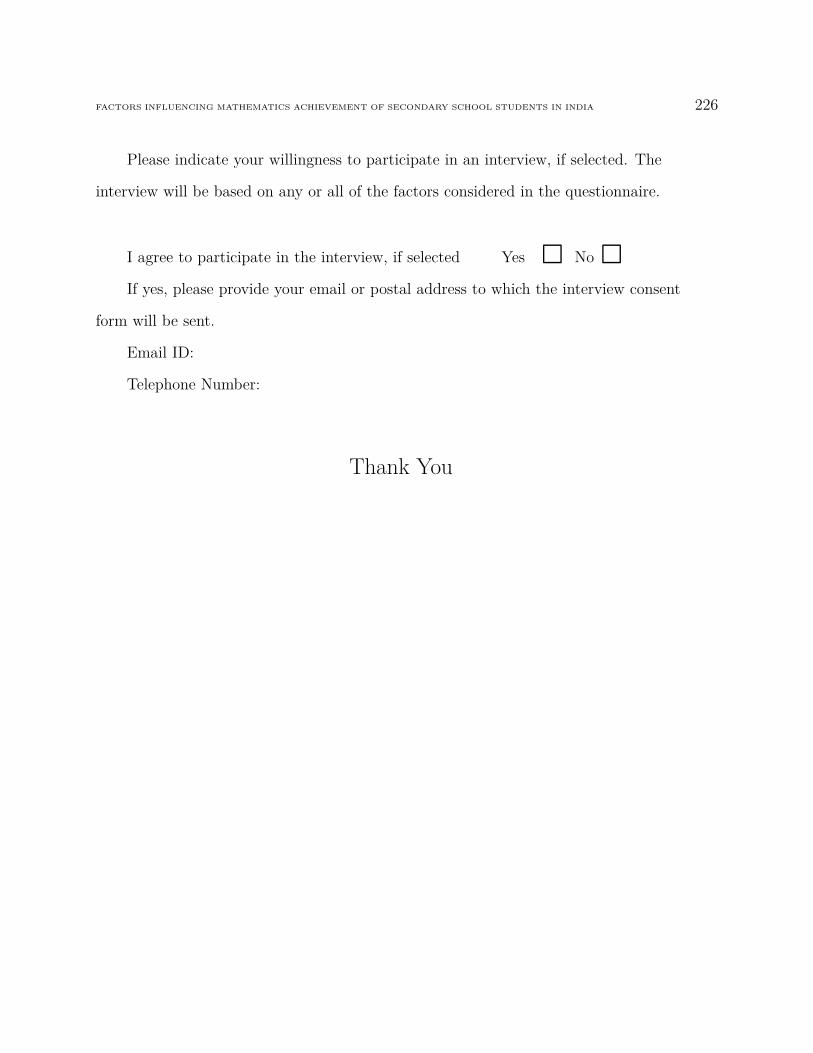
FACTORS INFLUENCING MATHEMATICS ACHIEVEMENT OF SECONDARY SCHOOL STUDENTS IN INDIA 226
Please indicate your willingness to participate in an interview, if selected. The
interview will be based on any or all of the factors considered in the questionnaire.
I agree to participate in the interview, if selected Yes 2 No 2If yes, please provide your email or postal address to which the interview consent
form will be sent.
Email ID:
Telephone Number:
Thank You
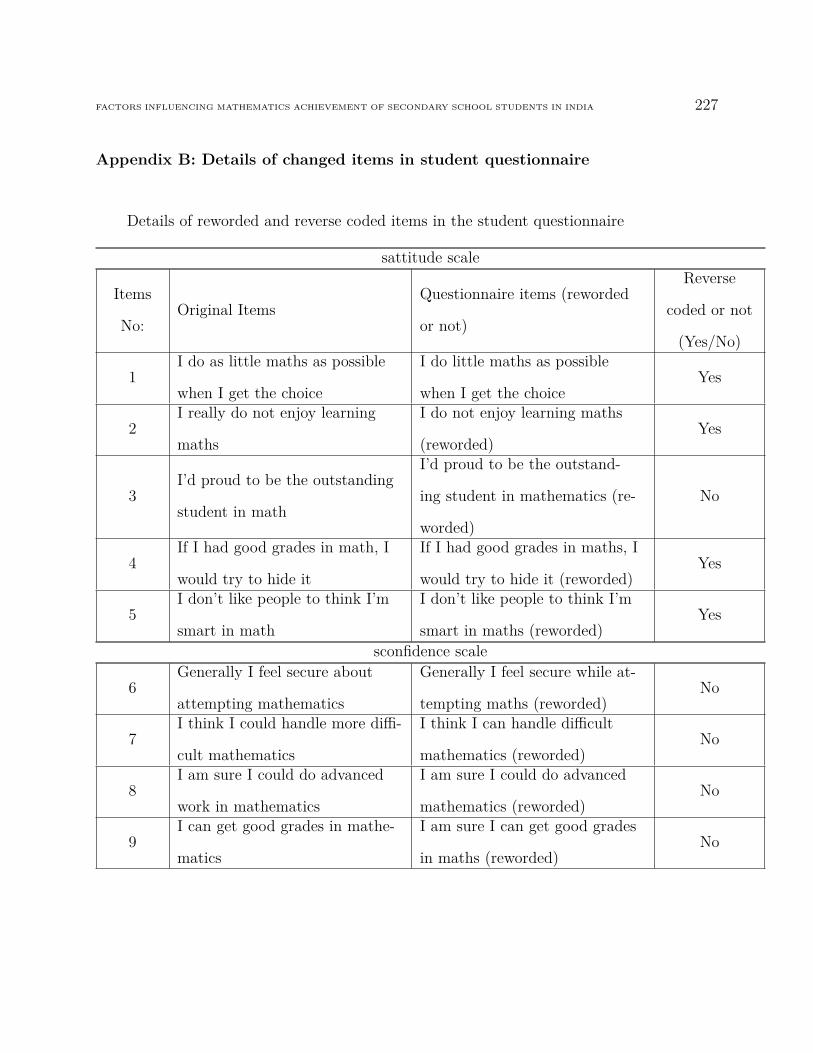
FACTORS INFLUENCING MATHEMATICS ACHIEVEMENT OF SECONDARY SCHOOL STUDENTS IN INDIA 227
Appendix B: Details of changed items in student questionnaire
Details of reworded and reverse coded items in the student questionnaire
sattitude scale
Items
No:Original Items
Questionnaire items (reworded
or not)
Reverse
coded or not
(Yes/No)
1I do as little maths as possible
when I get the choice
I do little maths as possible
when I get the choiceYes
2I really do not enjoy learning
maths
I do not enjoy learning maths
(reworded)Yes
3I’d proud to be the outstanding
student in math
I’d proud to be the outstand-
ing student in mathematics (re-
worded)
No
4If I had good grades in math, I
would try to hide it
If I had good grades in maths, I
would try to hide it (reworded)Yes
5I don’t like people to think I’m
smart in math
I don’t like people to think I’m
smart in maths (reworded)Yes
sconfidence scale
6Generally I feel secure about
attempting mathematics
Generally I feel secure while at-
tempting maths (reworded)No
7I think I could handle more diffi-
cult mathematics
I think I can handle difficult
mathematics (reworded)No
8I am sure I could do advanced
work in mathematics
I am sure I could do advanced
mathematics (reworded)No
9I can get good grades in mathe-
matics
I am sure I can get good grades
in maths (reworded)No

FACTORS INFLUENCING MATHEMATICS ACHIEVEMENT OF SECONDARY SCHOOL STUDENTS IN INDIA 228
10I have a lot of self-confidence
when it comes to math
I have a lot of self-confidence
when it comes to mathematics
learning (reworded)
No
11I don’t think I could do ad-
vanced mathematics
I don’t think I can do advanced
maths (reworded)Yes
12I’m not the type to do well in
math
I’m not the type of person to do
well in mathematics (reworded)Yes
13 Math has been my worst subjectMaths has been my worst sub-
ject (reworded)Yes
14
For some reason even though I
study , math seems unusually
hard for me
For some reason even though
I study hard, mathematics is
difficult for me (reworded)
Yes
15 I am no good at mathsI am not good at maths (re-
worded)Yes
susefulness scale
16I’ll need mathematics for my
future work
I’ll need mathematics for my
future career (reworded)No
17Knowing mathematics will help
me earn a living
Studying mathematics will help
me to earn a living (reworded)No
18I’ll need a firm mastery of math-
ematics for my future work
I’ll need a firm mastery of math-
ematics for my future career (re-
worded)
No
19Mathematics is of no relevance
to my life
Mathematics is of no relevance
to my lifeYes
20
I see mathematics as a subject
I rarely use in daily life as an
adult
I see mathematics as a subject
I rarely use in my future (re-
worded)
Yes
21Mathematics will not be impor-
tant to me in my life’s work
Mathematics will not be impor-
tant to me in future career (re-
worded)
Yes
22Taking mathematics is a waste
of time
Taking mathematics is a waste
of timeYes
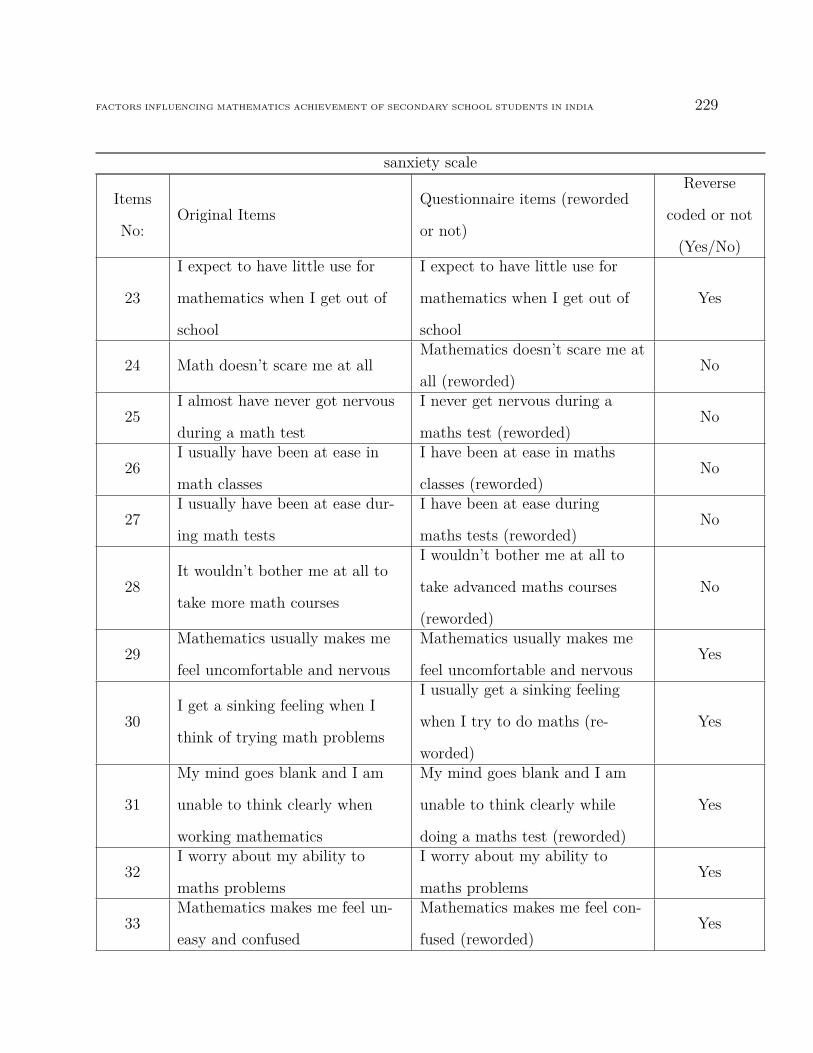
FACTORS INFLUENCING MATHEMATICS ACHIEVEMENT OF SECONDARY SCHOOL STUDENTS IN INDIA 229
sanxiety scale
Items
No:Original Items
Questionnaire items (reworded
or not)
Reverse
coded or not
(Yes/No)
23
I expect to have little use for
mathematics when I get out of
school
I expect to have little use for
mathematics when I get out of
school
Yes
24 Math doesn’t scare me at allMathematics doesn’t scare me at
all (reworded)No
25I almost have never got nervous
during a math test
I never get nervous during a
maths test (reworded)No
26I usually have been at ease in
math classes
I have been at ease in maths
classes (reworded)No
27I usually have been at ease dur-
ing math tests
I have been at ease during
maths tests (reworded)No
28It wouldn’t bother me at all to
take more math courses
I wouldn’t bother me at all to
take advanced maths courses
(reworded)
No
29Mathematics usually makes me
feel uncomfortable and nervous
Mathematics usually makes me
feel uncomfortable and nervousYes
30I get a sinking feeling when I
think of trying math problems
I usually get a sinking feeling
when I try to do maths (re-
worded)
Yes
31
My mind goes blank and I am
unable to think clearly when
working mathematics
My mind goes blank and I am
unable to think clearly while
doing a maths test (reworded)
Yes
32I worry about my ability to
maths problems
I worry about my ability to
maths problemsYes
33Mathematics makes me feel un-
easy and confused
Mathematics makes me feel con-
fused (reworded)Yes

FACTORS INFLUENCING MATHEMATICS ACHIEVEMENT OF SECONDARY SCHOOL STUDENTS IN INDIA 230
sparentattitude scale
Items
No:Original Items
Questionnaire items (reworded
or not)
Reverse
coded or not
(Yes/No)
34
My father/mother thinks that
mathematics is one of the most
important subjects I have stud-
ied
My parents think that mathe-
matics is one of the most im-
portant subjects to study (re-
worded)
No
35
My mother thinks that I’ll need
mathematics for what I want to
do after I graduate from high
school
My parents think I’ll need math-
ematics for what I want to do
after I finish secondary schooling
(reworded)
No
36
My father/mother thinks I’m
the kind of person who could do
well in mathematics
My parents think I’m the kind
of person who could do well in
mathematics (reworded)
No
37
My father/mother has always
been in interested in my progress
in mathematics
My parents has always been in-
terested in my progress in math-
ematics (reworded)
No
38
My father/mother thinks I need
to know just a minimum amount
of math
My parents think I need to know
only a minimum of mathematics
for the future (reworded)
Yes
39
My father/mother thinks ad-
vanced math is a waste time for
me
My parents think advanced
maths is a waste of time (re-
worded)
Yes
40
As long as I have passed, my
father/mother hasn’t cared how
I have done in math
As long as I have passed, my
parents don’t care about my
progress in mathematics (re-
worded)
Yes

FACTORS INFLUENCING MATHEMATICS ACHIEVEMENT OF SECONDARY SCHOOL STUDENTS IN INDIA 231
sparentattitude scale
Items
No:Original Items
Questionnaire items (reworded
or not)
Reverse
coded or not
(Yes/No)
41My father /mother hates to do
math
My parents hate doing maths
(reworded)Yes
42
My father/mother has shown no
interest in whether I take more
math courses
My parents have never shown
any interest in whether I take
more maths courses or not (re-
worded)
Yes

FACTORS INFLUENCING MATHEMATICS ACHIEVEMENT OF SECONDARY SCHOOL STUDENTS IN INDIA 232
Appendix C: Parent Questionnaire
UNIVERSITY OF TASMANIA
The influence of parental involvement, and students’ mathemat-
ics anxiety and attitude towards mathematics, on their mathe-
matics achievement in India.
PARENT QUESTIONNAIRE
Thank you for taking part in the study
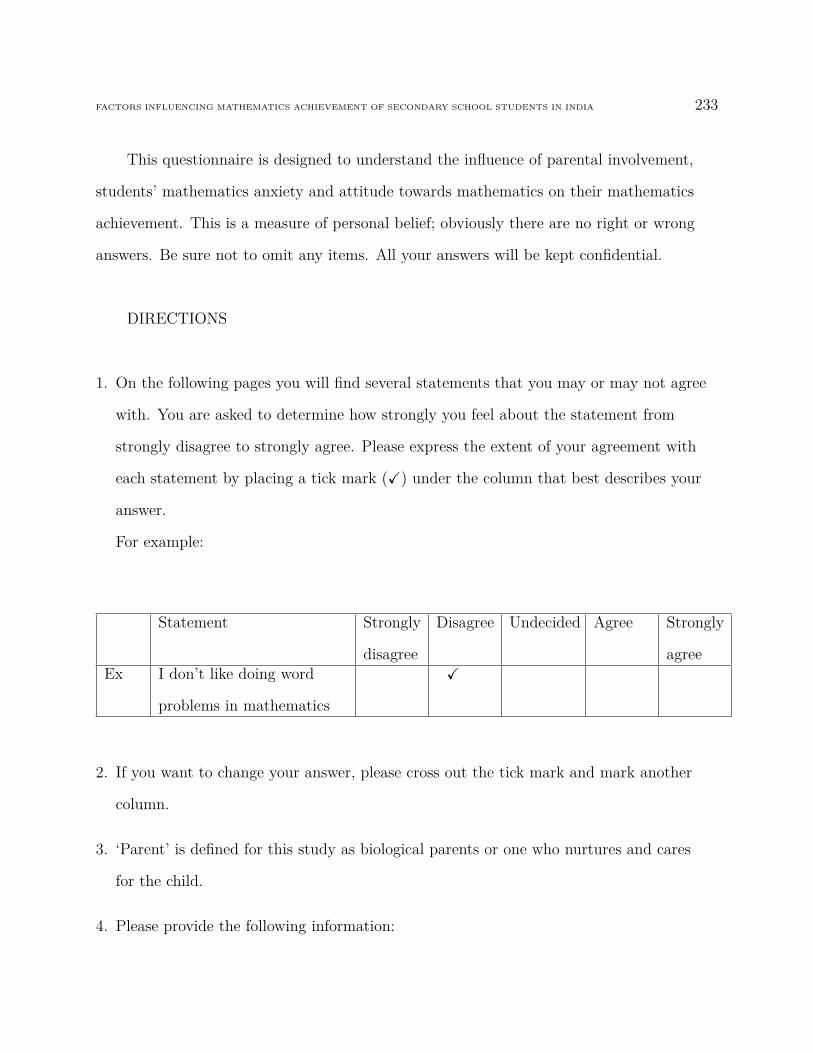
FACTORS INFLUENCING MATHEMATICS ACHIEVEMENT OF SECONDARY SCHOOL STUDENTS IN INDIA 233
This questionnaire is designed to understand the influence of parental involvement,
students’ mathematics anxiety and attitude towards mathematics on their mathematics
achievement. This is a measure of personal belief; obviously there are no right or wrong
answers. Be sure not to omit any items. All your answers will be kept confidential.
DIRECTIONS
1. On the following pages you will find several statements that you may or may not agree
with. You are asked to determine how strongly you feel about the statement from
strongly disagree to strongly agree. Please express the extent of your agreement with
each statement by placing a tick mark (X) under the column that best describes your
answer.
For example:
Statement Strongly
disagree
Disagree Undecided Agree Strongly
agreeEx I don’t like doing word
problems in mathematics
X
2. If you want to change your answer, please cross out the tick mark and mark another
column.
3. ‘Parent’ is defined for this study as biological parents or one who nurtures and cares
for the child.
4. Please provide the following information:
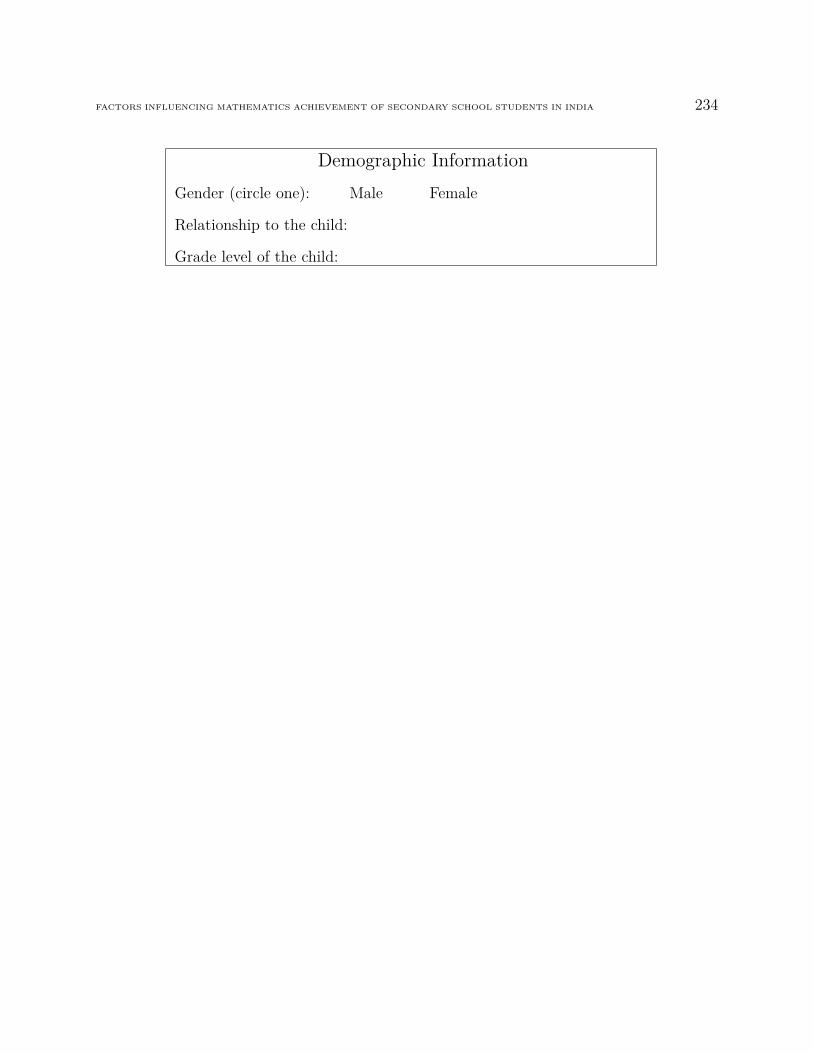
FACTORS INFLUENCING MATHEMATICS ACHIEVEMENT OF SECONDARY SCHOOL STUDENTS IN INDIA 234
Demographic InformationGender (circle one): Male Female
Relationship to the child:
Grade level of the child:

FACTORS INFLUENCING MATHEMATICS ACHIEVEMENT OF SECONDARY SCHOOL STUDENTS IN INDIA 235
Parent Questionnaire15 - Page 1 of 5
Instructions: Please place a tick mark(X) in the column indicating how much you
agree or disagree with each of the statement.
Statement Strongly
disagree
Disagree Undecided Agree Strongly
agree1 I think that mathematics is one
of the most important subjects
to study2 I am not concerned whether my
child takes more maths courses
in future3 I try to provide my child with
a good learning environment at
home to study mathematics4 As a student I was never nervous
during a maths test5 I direct the activities and de-
cisions of the children in the
family through reasoning and
discipline.6 I feel that in a well- run family
the children should have their
way in the family as often as the
parents do.
15Source: Mulhern, F., & Rae, G. (1998). Shortened form of the Fennema- Sherman Mathematics Atti-
tude Scales. Educational and Psychological Measurement, 58(2). c©1998 Sage Publications, Inc. & Buri,
J. R (1991). Parental Authority Questionnaire, Journal of Personality Assessment, 57(1). c©Lawrence
Erlbaum Associates, Inc
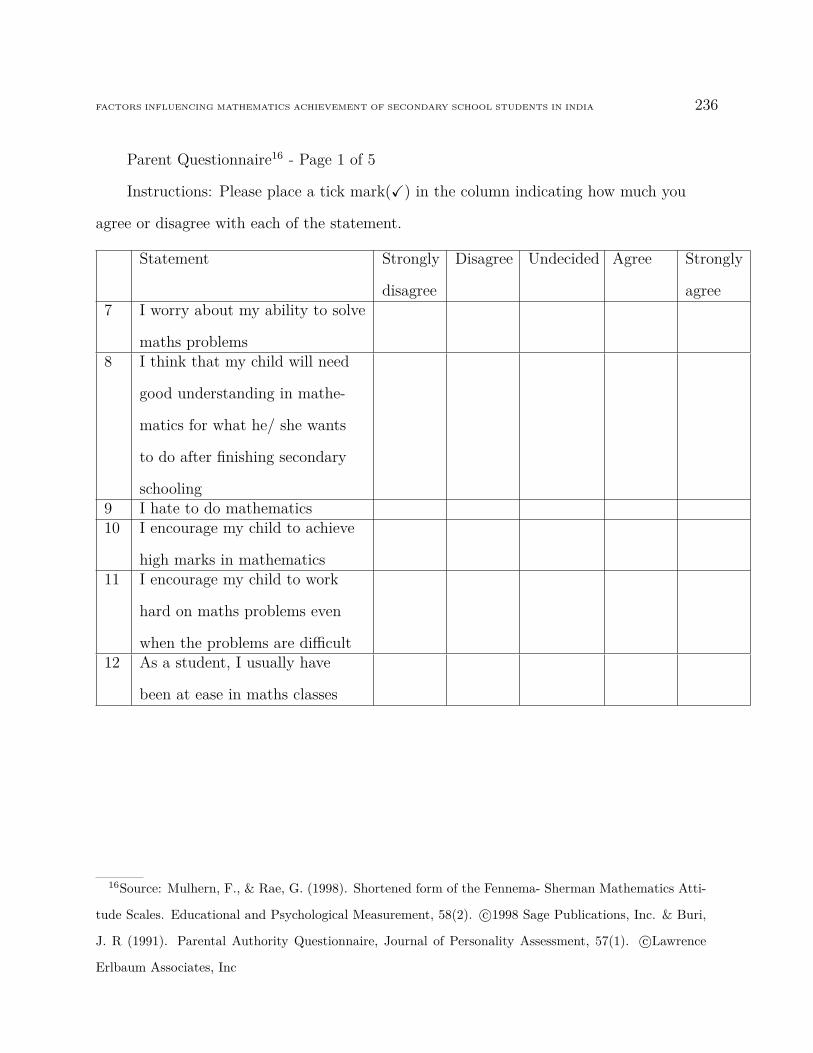
FACTORS INFLUENCING MATHEMATICS ACHIEVEMENT OF SECONDARY SCHOOL STUDENTS IN INDIA 236
Parent Questionnaire16 - Page 1 of 5
Instructions: Please place a tick mark(X) in the column indicating how much you
agree or disagree with each of the statement.
Statement Strongly
disagree
Disagree Undecided Agree Strongly
agree7 I worry about my ability to solve
maths problems8 I think that my child will need
good understanding in mathe-
matics for what he/ she wants
to do after finishing secondary
schooling9 I hate to do mathematics10 I encourage my child to achieve
high marks in mathematics11 I encourage my child to work
hard on maths problems even
when the problems are difficult12 As a student, I usually have
been at ease in maths classes
16Source: Mulhern, F., & Rae, G. (1998). Shortened form of the Fennema- Sherman Mathematics Atti-
tude Scales. Educational and Psychological Measurement, 58(2). c©1998 Sage Publications, Inc. & Buri,
J. R (1991). Parental Authority Questionnaire, Journal of Personality Assessment, 57(1). c©Lawrence
Erlbaum Associates, Inc

FACTORS INFLUENCING MATHEMATICS ACHIEVEMENT OF SECONDARY SCHOOL STUDENTS IN INDIA 237
Parent Questionnaire17 - Page 1 of 5
Instructions: Please place a tick mark(X) in the column indicating how much you
agree or disagree with each of the statement.
Statement Strongly
disagree
Disagree Undecided Agree Strongly
agree13 I will always make clear to my
child what is expected of him/
her in the family, but I also
will give him/ her freedom to
discuss those expectations with
me when they feel that those
expectations were unreasonable.14 Even if my child did not agree
with me, I feel that it was for
their own good if they were
forced to conform to what I
thought was right.15 I think that my child has to
do well in mathematics to do
advanced courses in university16 I am not concerned with the
progress of my child in mathe-
matics
17Source: Mulhern, F., & Rae, G. (1998). Shortened form of the Fennema- Sherman Mathematics Atti-
tude Scales. Educational and Psychological Measurement, 58(2). c©1998 Sage Publications, Inc. & Buri,
J. R (1991). Parental Authority Questionnaire, Journal of Personality Assessment, 57(1). c©Lawrence
Erlbaum Associates, Inc

FACTORS INFLUENCING MATHEMATICS ACHIEVEMENT OF SECONDARY SCHOOL STUDENTS IN INDIA 238
Parent Questionnaire18 - Page 1 of 5
Instructions: Please place a tick mark(X) in the column indicating how much you
agree or disagree with each of the statement.
Statement Strongly
disagree
Disagree Undecided Agree Strongly
agree17 I think that my child needs only
a pass in maths18 I frequently monitor the time my
child spends on mathematics at
home19 As a student, I usually have
been at ease during maths tests20 I seldom give my child expecta-
tions and guidelines for his/her
behaviour.21 Once a family policy has been
established, I usually discuss the
reasoning behind the policy with
the children in the family.22 I think that my child is the kind
of person who could do well in
mathematics
18Source: Mulhern, F., & Rae, G. (1998). Shortened form of the Fennema- Sherman Mathematics Atti-
tude Scales. Educational and Psychological Measurement, 58(2). c©1998 Sage Publications, Inc. & Buri,
J. R (1991). Parental Authority Questionnaire, Journal of Personality Assessment, 57(1). c©Lawrence
Erlbaum Associates, Inc
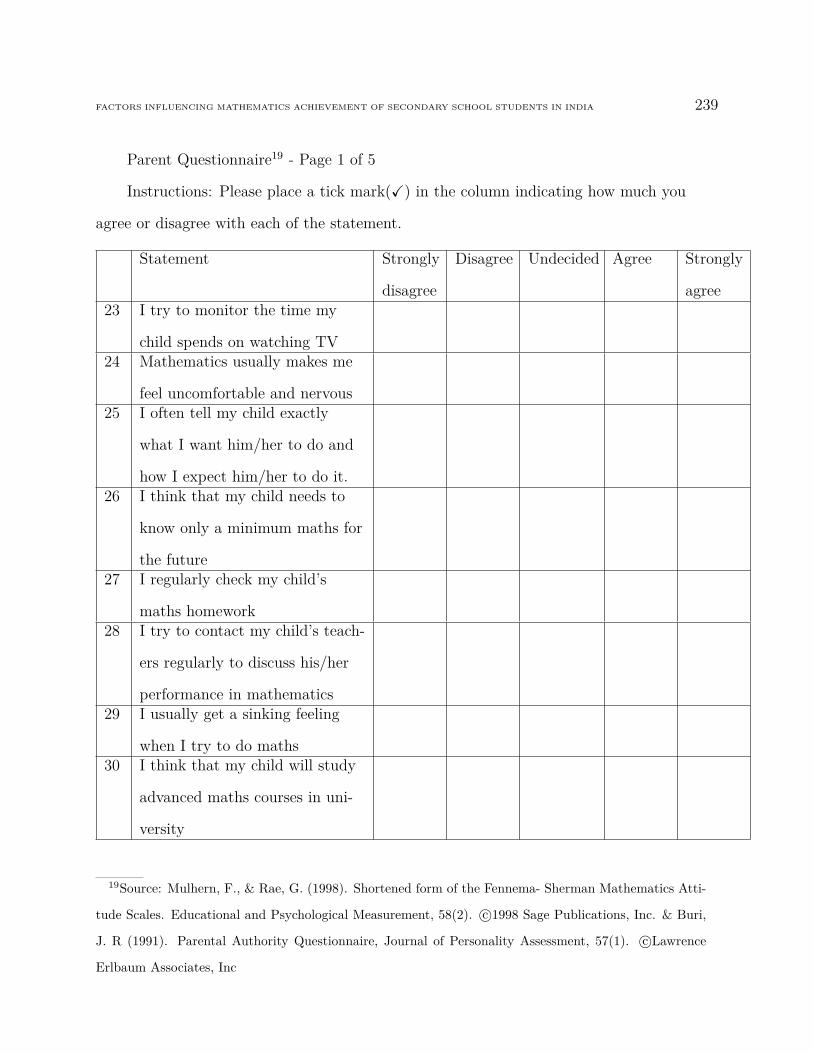
FACTORS INFLUENCING MATHEMATICS ACHIEVEMENT OF SECONDARY SCHOOL STUDENTS IN INDIA 239
Parent Questionnaire19 - Page 1 of 5
Instructions: Please place a tick mark(X) in the column indicating how much you
agree or disagree with each of the statement.
Statement Strongly
disagree
Disagree Undecided Agree Strongly
agree23 I try to monitor the time my
child spends on watching TV24 Mathematics usually makes me
feel uncomfortable and nervous25 I often tell my child exactly
what I want him/her to do and
how I expect him/her to do it.26 I think that my child needs to
know only a minimum maths for
the future27 I regularly check my child’s
maths homework28 I try to contact my child’s teach-
ers regularly to discuss his/her
performance in mathematics29 I usually get a sinking feeling
when I try to do maths30 I think that my child will study
advanced maths courses in uni-
versity
19Source: Mulhern, F., & Rae, G. (1998). Shortened form of the Fennema- Sherman Mathematics Atti-
tude Scales. Educational and Psychological Measurement, 58(2). c©1998 Sage Publications, Inc. & Buri,
J. R (1991). Parental Authority Questionnaire, Journal of Personality Assessment, 57(1). c©Lawrence
Erlbaum Associates, Inc
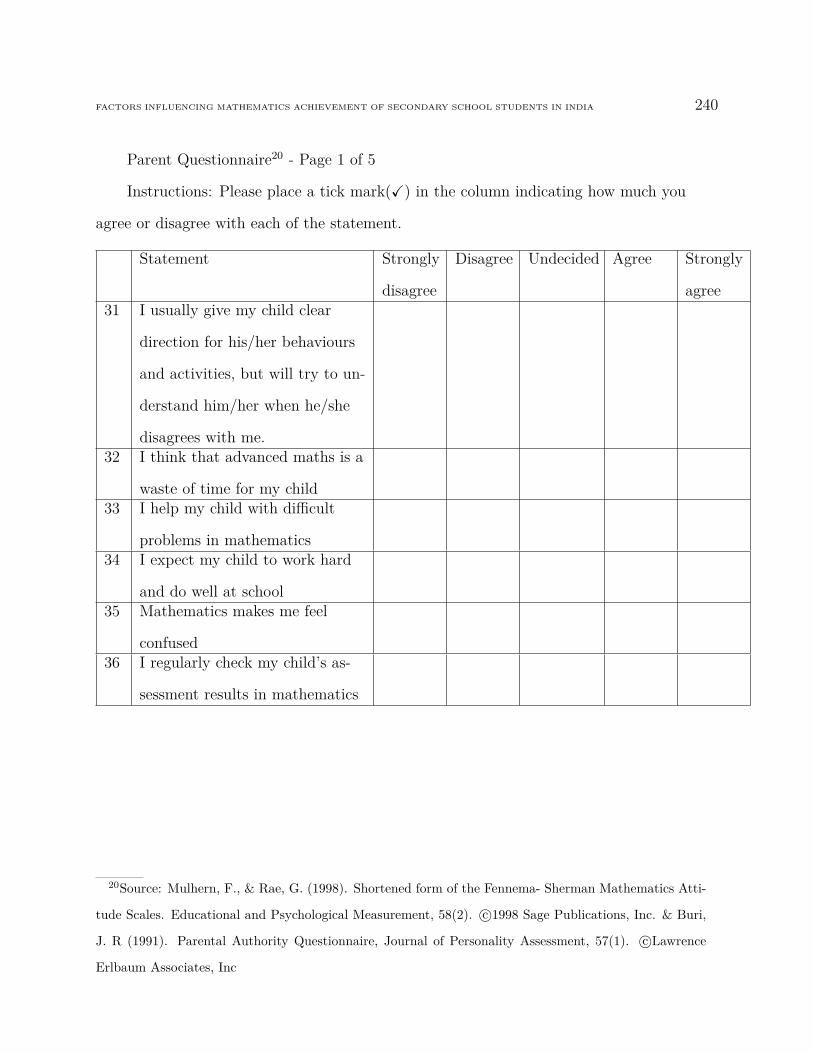
FACTORS INFLUENCING MATHEMATICS ACHIEVEMENT OF SECONDARY SCHOOL STUDENTS IN INDIA 240
Parent Questionnaire20 - Page 1 of 5
Instructions: Please place a tick mark(X) in the column indicating how much you
agree or disagree with each of the statement.
Statement Strongly
disagree
Disagree Undecided Agree Strongly
agree31 I usually give my child clear
direction for his/her behaviours
and activities, but will try to un-
derstand him/her when he/she
disagrees with me.32 I think that advanced maths is a
waste of time for my child33 I help my child with difficult
problems in mathematics34 I expect my child to work hard
and do well at school35 Mathematics makes me feel
confused36 I regularly check my child’s as-
sessment results in mathematics
20Source: Mulhern, F., & Rae, G. (1998). Shortened form of the Fennema- Sherman Mathematics Atti-
tude Scales. Educational and Psychological Measurement, 58(2). c©1998 Sage Publications, Inc. & Buri,
J. R (1991). Parental Authority Questionnaire, Journal of Personality Assessment, 57(1). c©Lawrence
Erlbaum Associates, Inc
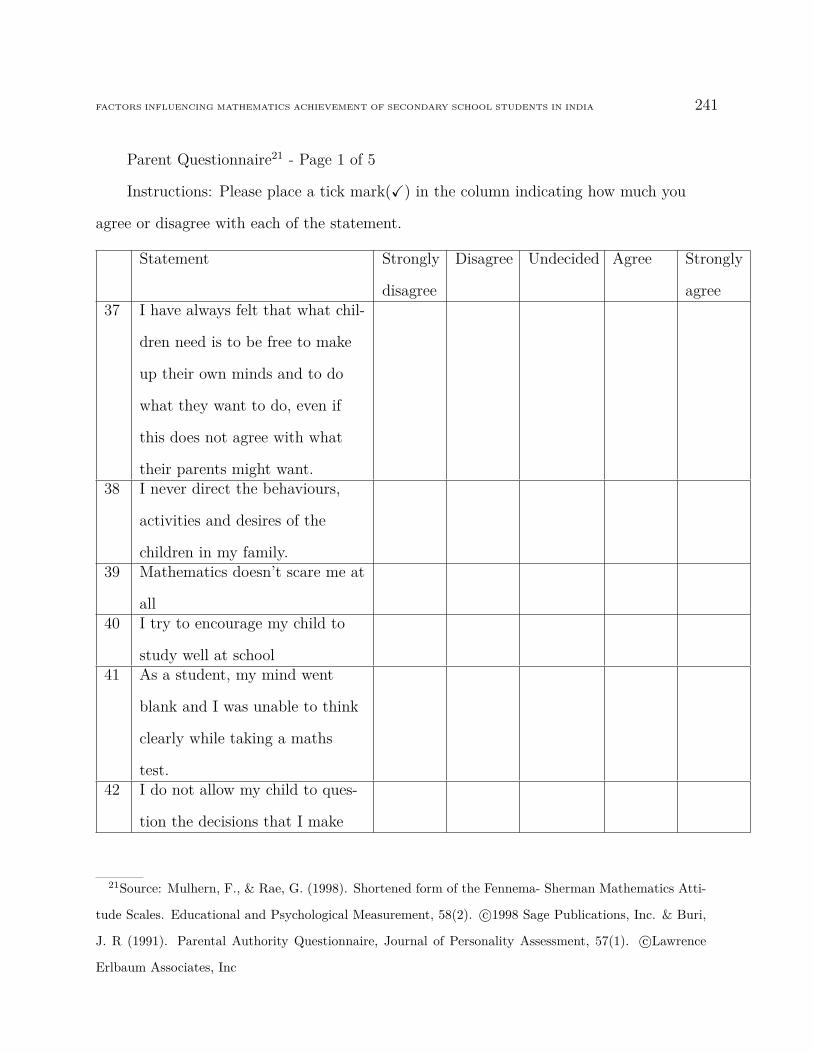
FACTORS INFLUENCING MATHEMATICS ACHIEVEMENT OF SECONDARY SCHOOL STUDENTS IN INDIA 241
Parent Questionnaire21 - Page 1 of 5
Instructions: Please place a tick mark(X) in the column indicating how much you
agree or disagree with each of the statement.
Statement Strongly
disagree
Disagree Undecided Agree Strongly
agree37 I have always felt that what chil-
dren need is to be free to make
up their own minds and to do
what they want to do, even if
this does not agree with what
their parents might want.38 I never direct the behaviours,
activities and desires of the
children in my family.39 Mathematics doesn’t scare me at
all40 I try to encourage my child to
study well at school41 As a student, my mind went
blank and I was unable to think
clearly while taking a maths
test.42 I do not allow my child to ques-
tion the decisions that I make
21Source: Mulhern, F., & Rae, G. (1998). Shortened form of the Fennema- Sherman Mathematics Atti-
tude Scales. Educational and Psychological Measurement, 58(2). c©1998 Sage Publications, Inc. & Buri,
J. R (1991). Parental Authority Questionnaire, Journal of Personality Assessment, 57(1). c©Lawrence
Erlbaum Associates, Inc
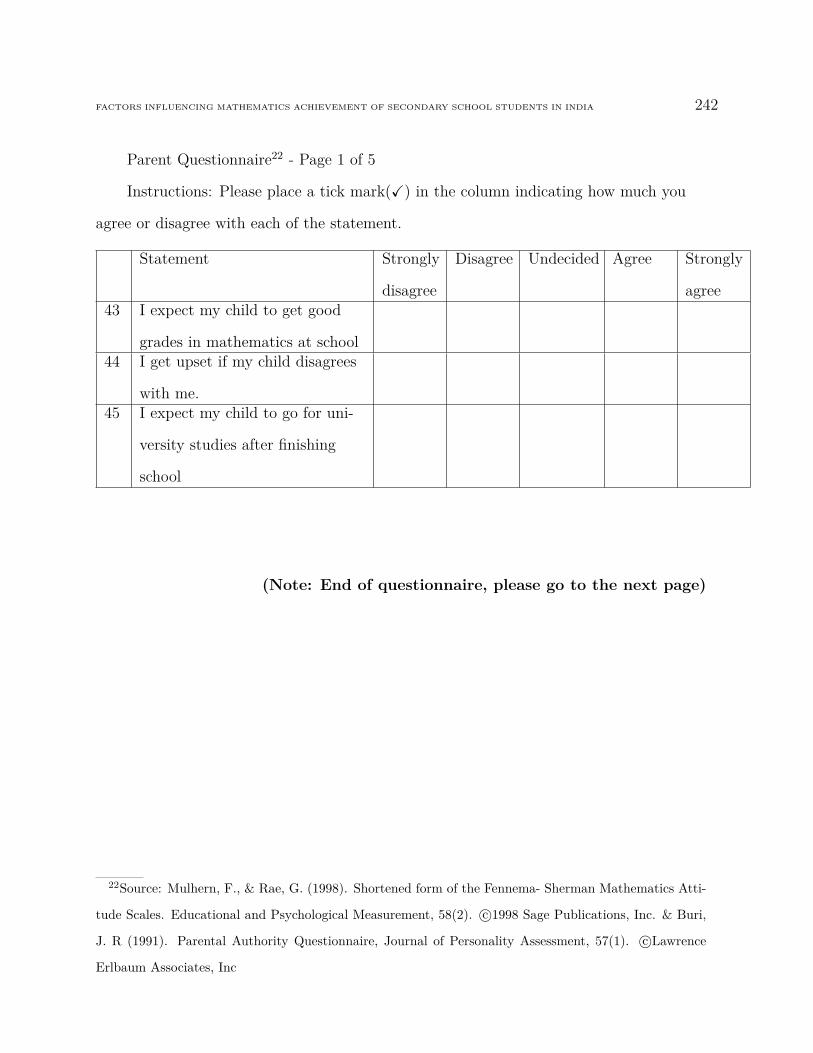
FACTORS INFLUENCING MATHEMATICS ACHIEVEMENT OF SECONDARY SCHOOL STUDENTS IN INDIA 242
Parent Questionnaire22 - Page 1 of 5
Instructions: Please place a tick mark(X) in the column indicating how much you
agree or disagree with each of the statement.
Statement Strongly
disagree
Disagree Undecided Agree Strongly
agree43 I expect my child to get good
grades in mathematics at school44 I get upset if my child disagrees
with me.45 I expect my child to go for uni-
versity studies after finishing
school
(Note: End of questionnaire, please go to the next page)
22Source: Mulhern, F., & Rae, G. (1998). Shortened form of the Fennema- Sherman Mathematics Atti-
tude Scales. Educational and Psychological Measurement, 58(2). c©1998 Sage Publications, Inc. & Buri,
J. R (1991). Parental Authority Questionnaire, Journal of Personality Assessment, 57(1). c©Lawrence
Erlbaum Associates, Inc
FACTORS INFLUENCING MATHEMATICS ACHIEVEMENT OF SECONDARY SCHOOL STUDENTS IN INDIA 243
Please indicate your willingness to participate in a recorded interview if selected.
The audio taped interview will be based on any or all of the factors considered in this
questionnaire.
I agree to participate in the interview, if selected Yes 2 No 2If yes, please provide your preferred contact details (email or telephone) to arrange
the interview.
Email ID:
Telephone Number:
Thank You
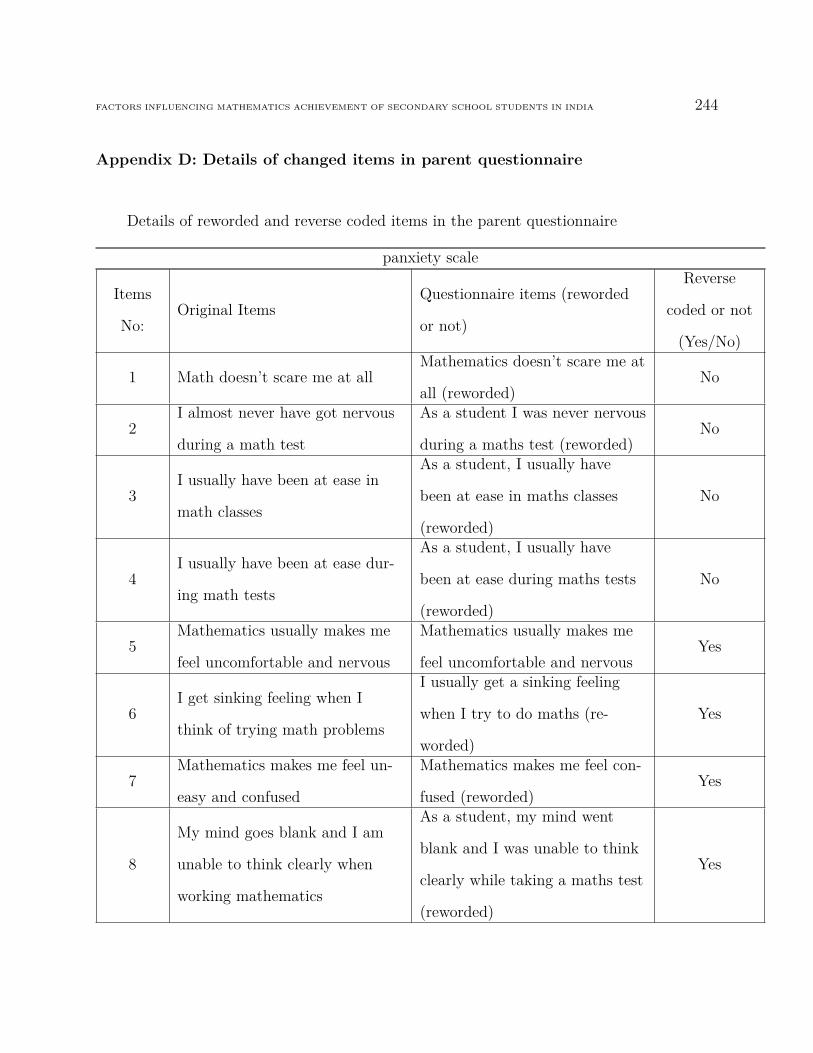
FACTORS INFLUENCING MATHEMATICS ACHIEVEMENT OF SECONDARY SCHOOL STUDENTS IN INDIA 244
Appendix D: Details of changed items in parent questionnaire
Details of reworded and reverse coded items in the parent questionnaire
panxiety scale
Items
No:Original Items
Questionnaire items (reworded
or not)
Reverse
coded or not
(Yes/No)
1 Math doesn’t scare me at allMathematics doesn’t scare me at
all (reworded)No
2I almost never have got nervous
during a math test
As a student I was never nervous
during a maths test (reworded)No
3I usually have been at ease in
math classes
As a student, I usually have
been at ease in maths classes
(reworded)
No
4I usually have been at ease dur-
ing math tests
As a student, I usually have
been at ease during maths tests
(reworded)
No
5Mathematics usually makes me
feel uncomfortable and nervous
Mathematics usually makes me
feel uncomfortable and nervousYes
6I get sinking feeling when I
think of trying math problems
I usually get a sinking feeling
when I try to do maths (re-
worded)
Yes
7Mathematics makes me feel un-
easy and confused
Mathematics makes me feel con-
fused (reworded)Yes
8
My mind goes blank and I am
unable to think clearly when
working mathematics
As a student, my mind went
blank and I was unable to think
clearly while taking a maths test
(reworded)
Yes

FACTORS INFLUENCING MATHEMATICS ACHIEVEMENT OF SECONDARY SCHOOL STUDENTS IN INDIA 245
Appendix E: Achievement Test
Achievement Test In Mathematics
Time: 40 min
Answer the following questions in the space provided23. Show your working out
wherever necessary.
Q: 1 Here you see a photograph of a farmhouse with a roof in the shape of a
pyramid.
Below is a student’s mathematical model of the farmhouse roof with measurements added.
A B
CD
T
E F
GH
K L
MN
12 m
12 m
12 m
23Source: TAKE THE TEST: SAMPLE QUESTIONS FROM OECD’S PISA ASSESSMENTS - ISBN
978-92-64-05080-8 - ľ OECD 2009

FACTORS INFLUENCING MATHEMATICS ACHIEVEMENT OF SECONDARY SCHOOL STUDENTS IN INDIA 246
The attic floor, ABCD in the model, is a square. The beams that support the roof
are the edges of a block (rectangular prism) EFGHKLMN. E is the middle of AT, F is
the middle of BT, G is the middle of CT and H is the middle of DT. All the edges of the
pyramid in the model have length 12 m.
A. Calculate the area of the attic floor ABCD.
The area of the attic floor ABCD = m2
B. Calculate the length of EF, one of the horizontal edges of the block.
The length of EF = m
Q: 2 In this photograph you see six dice, labelled (a) to (f). For all dice there is a
rule:
The total number of dots on two opposite faces of each die is always seven. Write in
each box the number of dots on the bottom face of the dice corresponding to the
photograph.
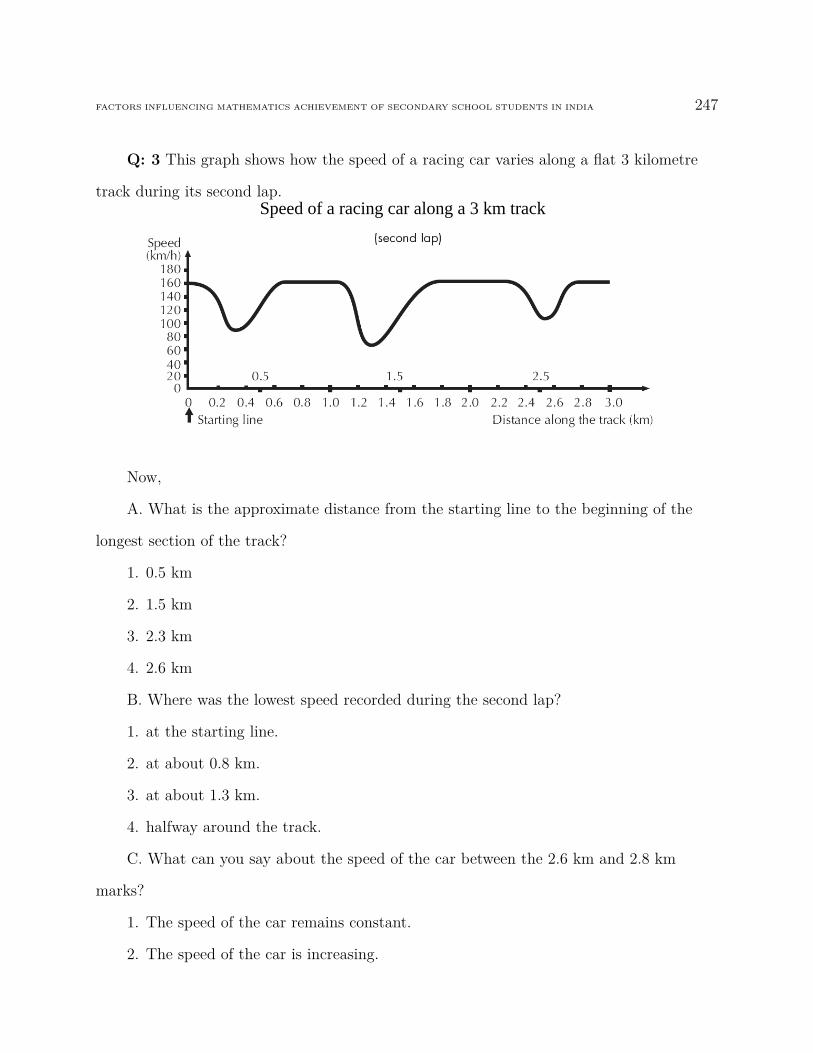
FACTORS INFLUENCING MATHEMATICS ACHIEVEMENT OF SECONDARY SCHOOL STUDENTS IN INDIA 247
Q: 3 This graph shows how the speed of a racing car varies along a flat 3 kilometre
track during its second lap.Speed of a racing car along a 3 km track
Now,
A. What is the approximate distance from the starting line to the beginning of the
longest section of the track?
1. 0.5 km
2. 1.5 km
3. 2.3 km
4. 2.6 km
B. Where was the lowest speed recorded during the second lap?
1. at the starting line.
2. at about 0.8 km.
3. at about 1.3 km.
4. halfway around the track.
C. What can you say about the speed of the car between the 2.6 km and 2.8 km
marks?
1. The speed of the car remains constant.
2. The speed of the car is increasing.

FACTORS INFLUENCING MATHEMATICS ACHIEVEMENT OF SECONDARY SCHOOL STUDENTS IN INDIA 248
3. The speed of the car is decreasing.
4. The speed of the car cannot be determined from the graph.
D. Here are pictures of five tracks:
Along which one of these tracks was the car driven to produce the speed graph
shown earlier. Circle the letter of the figure to indicate your answer.
Q: 4 Mei- Ling from Singapore was preparing to go to South Africa for 3 months as
an exchange student. She needed to change some Singapore dollars (SGD) to South
African rand (ZAR).
A. Mei- Leing found out that the exchange rate between Singapore dollars and South
African rand was: 1 SGD = 4.2 ZAR. Mei- Ling changed 3000 Singapore dollars into
South African rand at this exchange rate. How much money in South African rand did
Mei-Ling get?
Answer:

FACTORS INFLUENCING MATHEMATICS ACHIEVEMENT OF SECONDARY SCHOOL STUDENTS IN INDIA 249
B. On returning to Singapore after 3 months, Mei-Ling had 3900 ZAR left. She
changed this back to Singapore dollars, noting that the exchange rate had changed to: 1
SGD = 4.0 ZAR. How much money in Singapore dollars did Mei-Ling get?
Answer:
C. During these 3 months the exchange rate had changed from 4.2 to 4.0 ZAR per
SGD. Was it in Mei-Ling’s favour that the exchange rate now was 4.0 ZAR instead of 4.2
ZAR, when she changed her South African rand back to Singapore dollars? Give an
explanation to support your answer.
Answer:
D. In Mei-Lin’s school, her science teacher gives tests that are marked out of 100.
Mei-Lin has an average of 60 marks on her first four Science tests. On the fifth test she
got 80marks. What is the average of Mei-Lin’s marks after all five tests?
Average Mark:
Q: 5 Robert builds a step pattern using squares. Here are the stages he follows.
As you can see, he uses one square for Stage 1, three squares for Stage 2 and six for
Stage 3. How many squares should he use for the fourth stage?
Answer: —————- squares
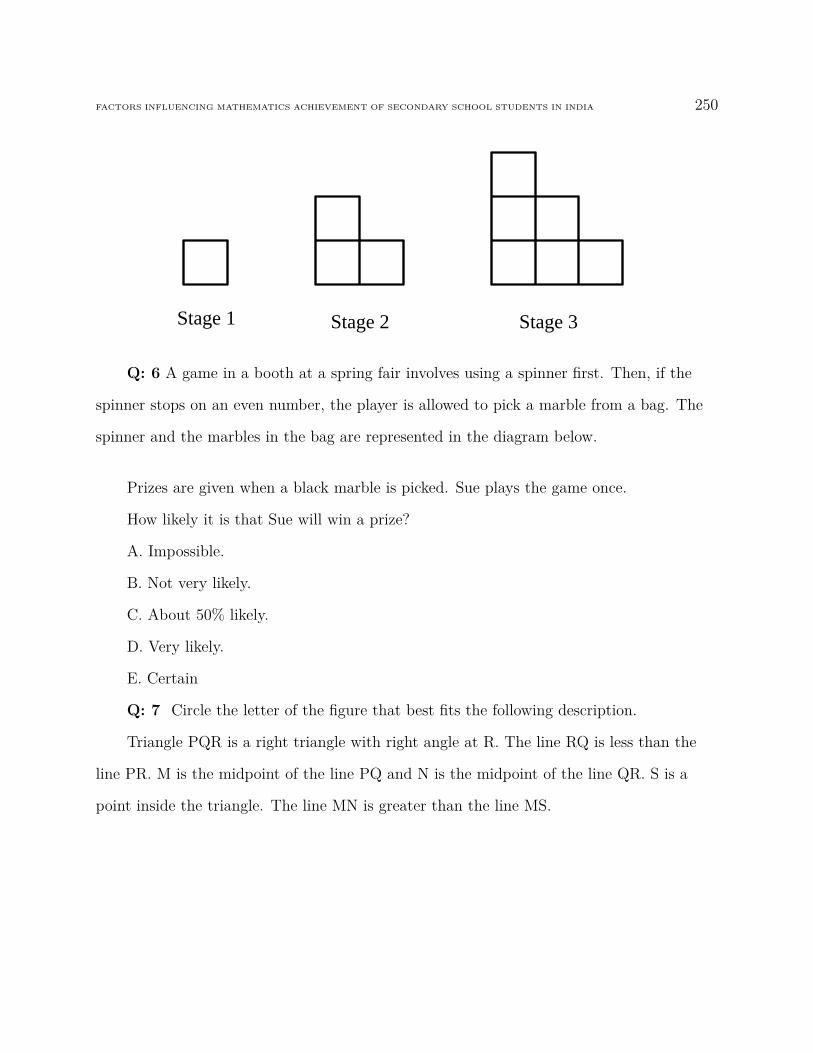
FACTORS INFLUENCING MATHEMATICS ACHIEVEMENT OF SECONDARY SCHOOL STUDENTS IN INDIA 250
Stage 1 Stage 2 Stage 3
Q: 6 A game in a booth at a spring fair involves using a spinner first. Then, if the
spinner stops on an even number, the player is allowed to pick a marble from a bag. The
spinner and the marbles in the bag are represented in the diagram below.
Prizes are given when a black marble is picked. Sue plays the game once.
How likely it is that Sue will win a prize?
A. Impossible.
B. Not very likely.
C. About 50% likely.
D. Very likely.
E. Certain
Q: 7 Circle the letter of the figure that best fits the following description.
Triangle PQR is a right triangle with right angle at R. The line RQ is less than the
line PR. M is the midpoint of the line PQ and N is the midpoint of the line QR. S is a
point inside the triangle. The line MN is greater than the line MS.
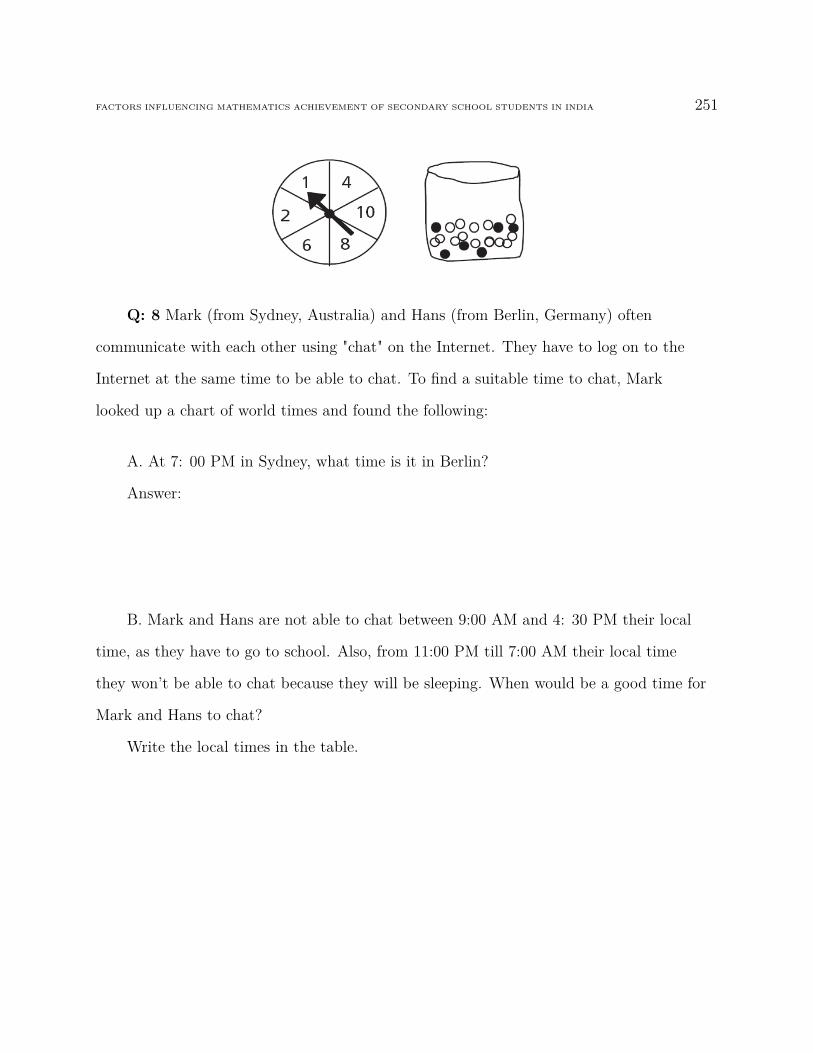
FACTORS INFLUENCING MATHEMATICS ACHIEVEMENT OF SECONDARY SCHOOL STUDENTS IN INDIA 251
Q: 8 Mark (from Sydney, Australia) and Hans (from Berlin, Germany) often
communicate with each other using "chat" on the Internet. They have to log on to the
Internet at the same time to be able to chat. To find a suitable time to chat, Mark
looked up a chart of world times and found the following:
A. At 7: 00 PM in Sydney, what time is it in Berlin?
Answer:
B. Mark and Hans are not able to chat between 9:00 AM and 4: 30 PM their local
time, as they have to go to school. Also, from 11:00 PM till 7:00 AM their local time
they won’t be able to chat because they will be sleeping. When would be a good time for
Mark and Hans to chat?
Write the local times in the table.
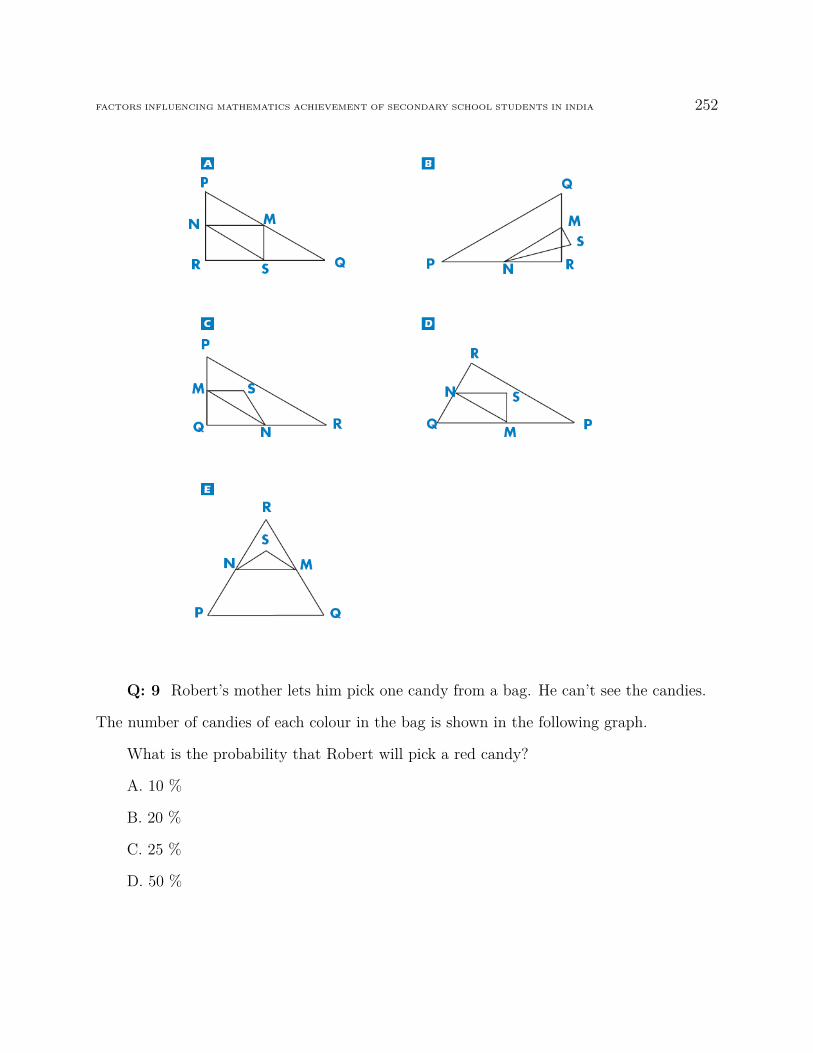
FACTORS INFLUENCING MATHEMATICS ACHIEVEMENT OF SECONDARY SCHOOL STUDENTS IN INDIA 252
Q: 9 Robert’s mother lets him pick one candy from a bag. He can’t see the candies.
The number of candies of each colour in the bag is shown in the following graph.
What is the probability that Robert will pick a red candy?
A. 10 %
B. 20 %
C. 25 %
D. 50 %
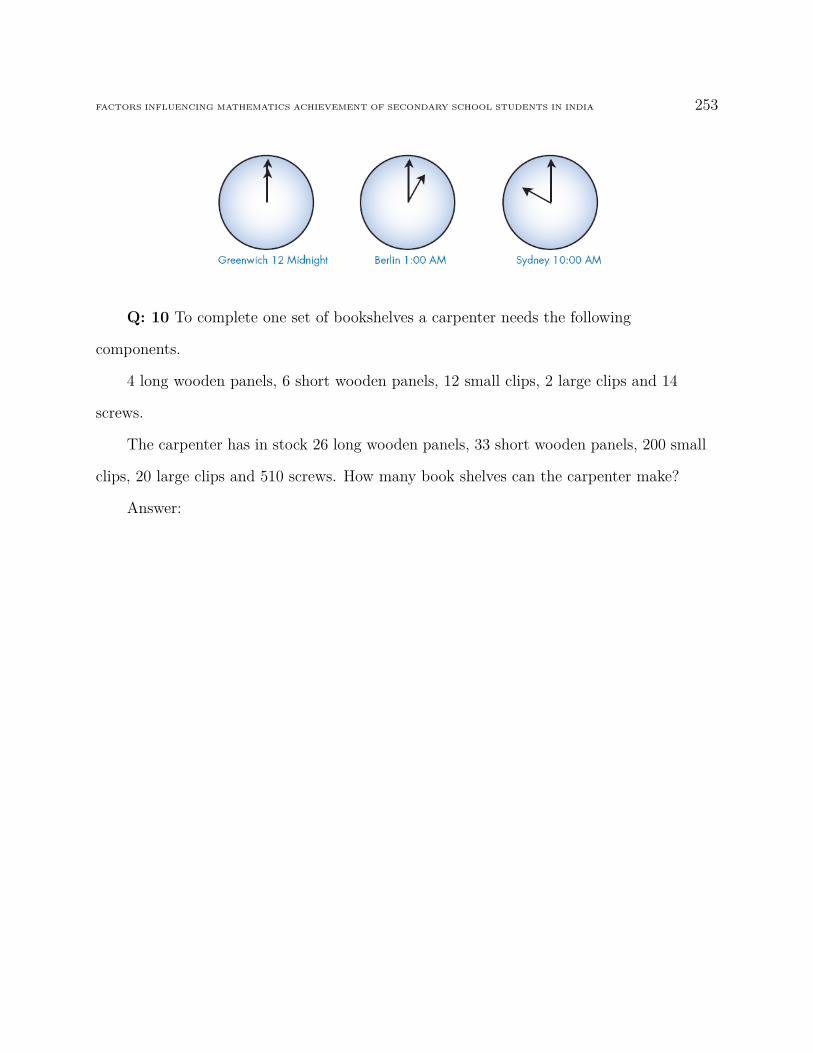
FACTORS INFLUENCING MATHEMATICS ACHIEVEMENT OF SECONDARY SCHOOL STUDENTS IN INDIA 253
Q: 10 To complete one set of bookshelves a carpenter needs the following
components.
4 long wooden panels, 6 short wooden panels, 12 small clips, 2 large clips and 14
screws.
The carpenter has in stock 26 long wooden panels, 33 short wooden panels, 200 small
clips, 20 large clips and 510 screws. How many book shelves can the carpenter make?
Answer:

FACTORS INFLUENCING MATHEMATICS ACHIEVEMENT OF SECONDARY SCHOOL STUDENTS IN INDIA 254
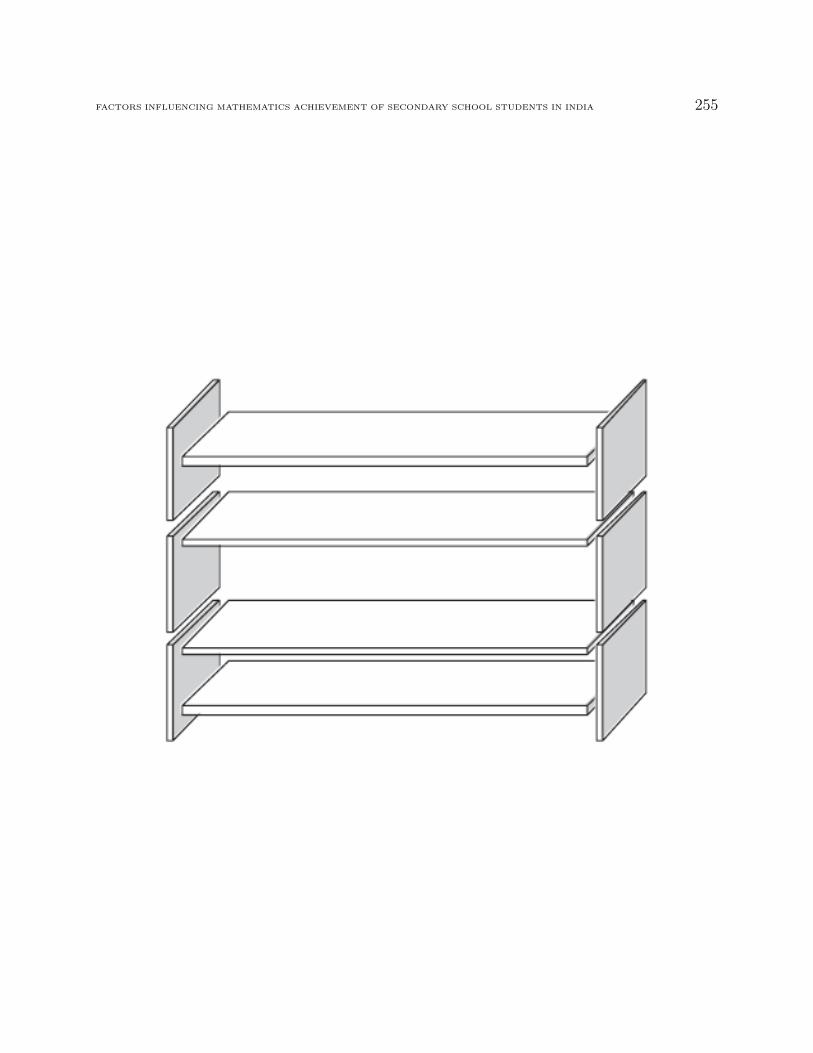
FACTORS INFLUENCING MATHEMATICS ACHIEVEMENT OF SECONDARY SCHOOL STUDENTS IN INDIA 255
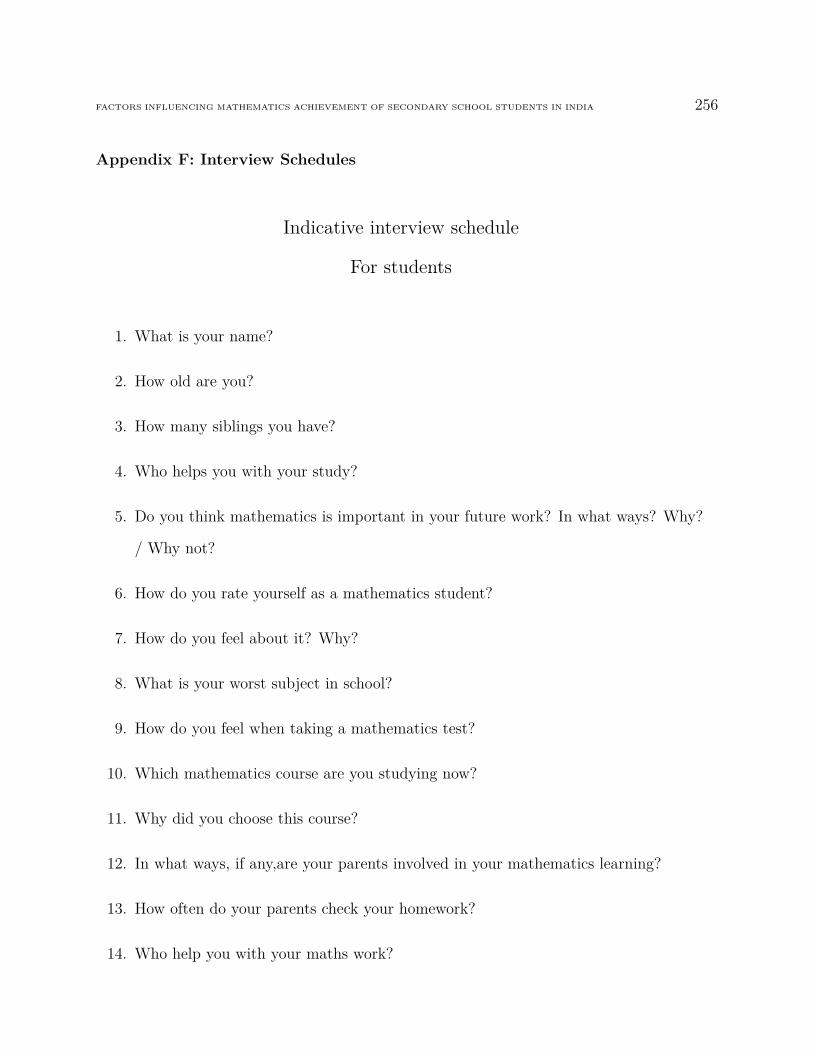
FACTORS INFLUENCING MATHEMATICS ACHIEVEMENT OF SECONDARY SCHOOL STUDENTS IN INDIA 256
Appendix F: Interview Schedules
Indicative interview schedule
For students
1. What is your name?
2. How old are you?
3. How many siblings you have?
4. Who helps you with your study?
5. Do you think mathematics is important in your future work? In what ways? Why?
/ Why not?
6. How do you rate yourself as a mathematics student?
7. How do you feel about it? Why?
8. What is your worst subject in school?
9. How do you feel when taking a mathematics test?
10. Which mathematics course are you studying now?
11. Why did you choose this course?
12. In what ways, if any,are your parents involved in your mathematics learning?
13. How often do your parents check your homework?
14. Who help you with your maths work?
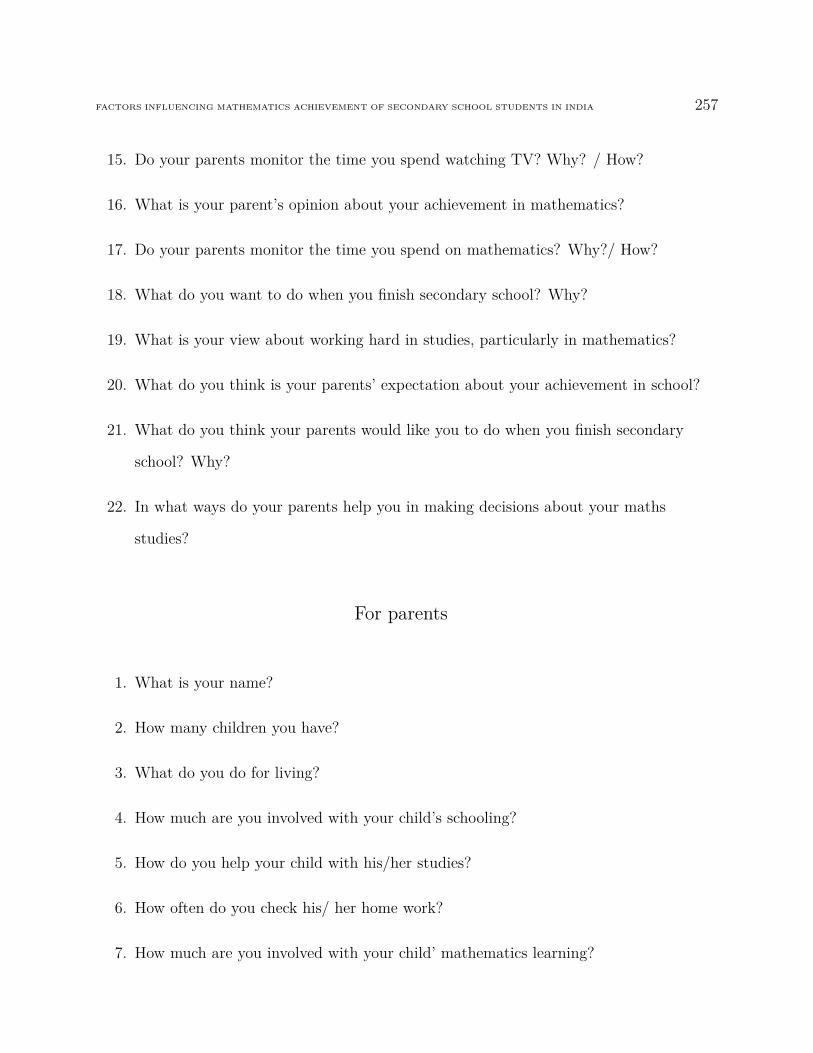
FACTORS INFLUENCING MATHEMATICS ACHIEVEMENT OF SECONDARY SCHOOL STUDENTS IN INDIA 257
15. Do your parents monitor the time you spend watching TV? Why? / How?
16. What is your parent’s opinion about your achievement in mathematics?
17. Do your parents monitor the time you spend on mathematics? Why?/ How?
18. What do you want to do when you finish secondary school? Why?
19. What is your view about working hard in studies, particularly in mathematics?
20. What do you think is your parents’ expectation about your achievement in school?
21. What do you think your parents would like you to do when you finish secondary
school? Why?
22. In what ways do your parents help you in making decisions about your maths
studies?
For parents
1. What is your name?
2. How many children you have?
3. What do you do for living?
4. How much are you involved with your child’s schooling?
5. How do you help your child with his/her studies?
6. How often do you check his/ her home work?
7. How much are you involved with your child’ mathematics learning?

FACTORS INFLUENCING MATHEMATICS ACHIEVEMENT OF SECONDARY SCHOOL STUDENTS IN INDIA 258
8. How do you help your child with the maths home work?
9. Do you check the assessment results of your child in mathematics? Why?
10. What is your opinion about your child’s achievement in mathematics?
11. How often do you monitor the time your child spends on mathematics?
12. How do you monitor the time your child spends on activities other than studies like
watching TV, playing games, socialising etc?
13. How often do you consult your child’s teacher about his/her mathematics
performance?
14. What is your view about working hard in studies, particularly in mathematics?
15. What is your opinion about your child’s achievement in mathematics?
16. Which was your worst subject in school?
17. How do you help your child to make decisions about his/her studies?
18. What is your expectation about your child’s achievement in school?
19. What do you want your child to do when he/she finish secondary school? Why?
20. How do you encourage your child in his/her studies?

FACTORS INFLUENCING MATHEMATICS ACHIEVEMENT OF SECONDARY SCHOOL STUDENTS IN INDIA 259
Appendix G: Ethics Approval Letter
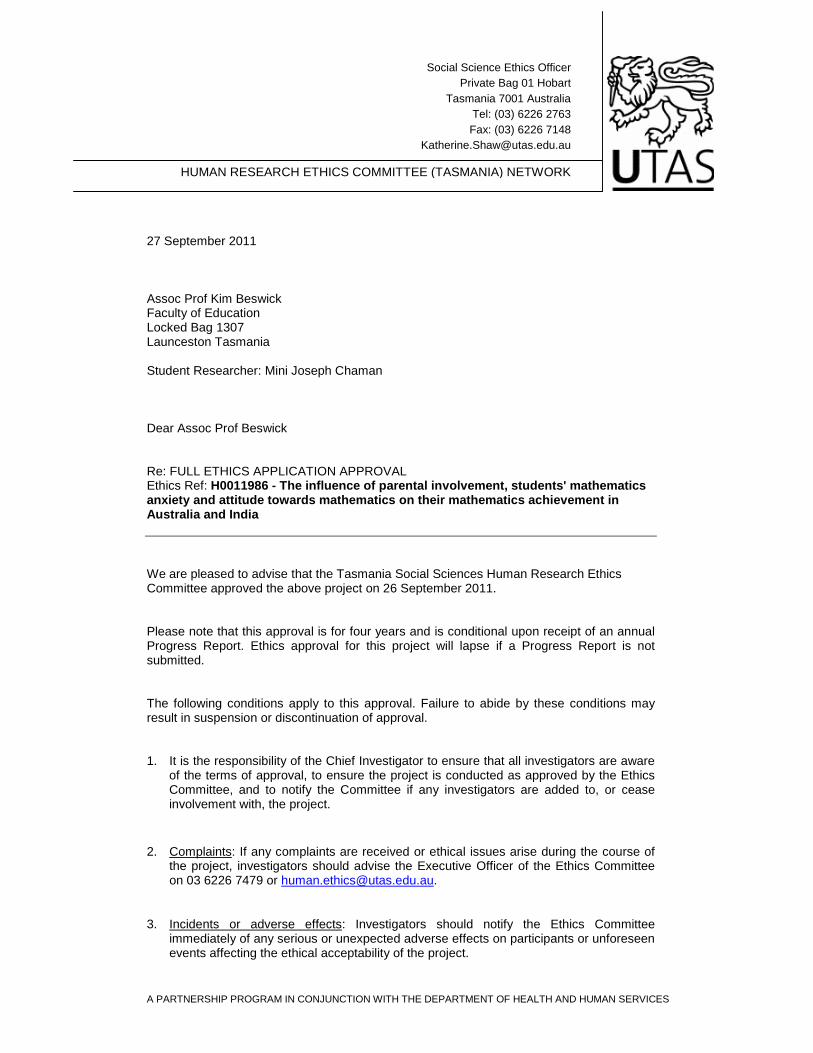
A PARTNERSHIP PROGRAM IN CONJUNCTION WITH THE DEPARTMENT OF HEALTH AND HUMAN SERVICES
27 September 2011 Assoc Prof Kim Beswick Faculty of Education Locked Bag 1307 Launceston Tasmania Student Researcher: Mini Joseph Chaman Dear Assoc Prof Beswick Re: FULL ETHICS APPLICATION APPROVAL Ethics Ref: H0011986 - The influence of parental involvement, students' mathematics anxiety and attitude towards mathematics on their mathematics achievement in Australia and India We are pleased to advise that the Tasmania Social Sciences Human Research Ethics Committee approved the above project on 26 September 2011. Please note that this approval is for four years and is conditional upon receipt of an annual Progress Report. Ethics approval for this project will lapse if a Progress Report is not submitted. The following conditions apply to this approval. Failure to abide by these conditions may result in suspension or discontinuation of approval. 1. It is the responsibility of the Chief Investigator to ensure that all investigators are aware
of the terms of approval, to ensure the project is conducted as approved by the Ethics Committee, and to notify the Committee if any investigators are added to, or cease involvement with, the project.
2. Complaints: If any complaints are received or ethical issues arise during the course of the project, investigators should advise the Executive Officer of the Ethics Committee on 03 6226 7479 or [email protected].
3. Incidents or adverse effects: Investigators should notify the Ethics Committee immediately of any serious or unexpected adverse effects on participants or unforeseen events affecting the ethical acceptability of the project.
Social Science Ethics Officer Private Bag 01 Hobart
Tasmania 7001 Australia Tel: (03) 6226 2763 Fax: (03) 6226 7148
HUMAN RESEARCH ETHICS COMMITTEE (TASMANIA) NETWORK
A PARTNERSHIP PROGRAM IN CONJUNCTION WITH THE DEPARTMENT OF HEALTH AND HUMAN SERVICES
4. Amendments to Project: Modifications to the project must not proceed until approval is obtained from the Ethics Committee. Please submit an Amendment Form (available on our website) to notify the Ethics Committee of the proposed modifications.
5. Annual Report: Continued approval for this project is dependent on the submission of a Progress Report by the anniversary date of your approval. You will be sent a courtesy reminder closer to this date. Failure to submit a Progress Report will mean that ethics approval for this project will lapse.
6. Final Report: A Final Report and a copy of any published material arising from the project, either in full or abstract, must be provided at the end of the project.
Yours sincerely
Katherine Shaw Acting Executive Officer

FACTORS INFLUENCING MATHEMATICS ACHIEVEMENT OF SECONDARY SCHOOL STUDENTS IN INDIA 262
Appendix H: Permission Letter from Principal
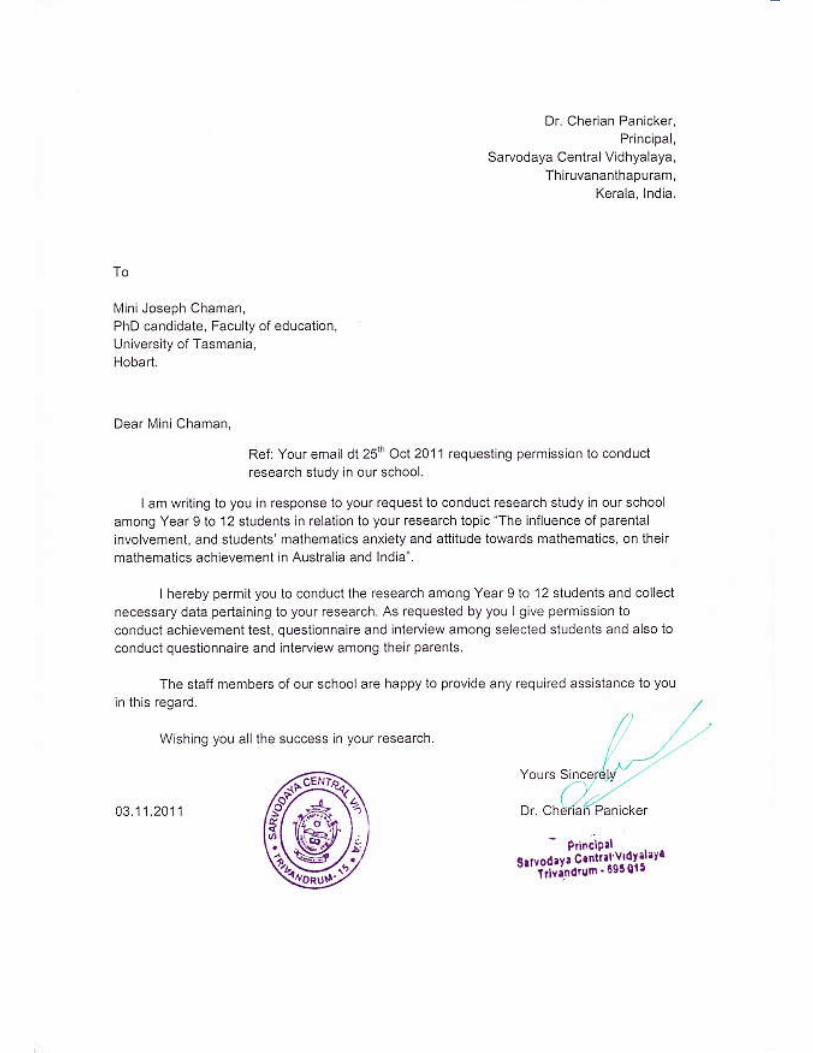
r\f,j.t:;lt'ttt'l'.

FACTORS INFLUENCING MATHEMATICS ACHIEVEMENT OF SECONDARY SCHOOL STUDENTS IN INDIA 264
Appendix I: Consent Forms

TEACHER CONSENT FORM The influence of parental involvement, and students’ mathematics anxiety and attitude towards mathematics, on their mathematics achievement in India.
1. The nature of the project has been explained to me. 2. I understand that my involvement in the study involves distribution and collection of
information sheets, consent forms and completed tests, student questionnaires and parent questionnaires and administering a mathematics achievement test and student questionnaire to mathematics class (es). The test and questionnaire will each take approximately 40 minutes.
3. I understand that my participation in the study involves no risk. 4. I understand that the researcher will maintain my identity confidential and that any
information I supply to the researcher will be used only for the purpose of the research. 5. I agree to assist in the research study.
Name of the teacher: Signature of the teacher: Date: --------------------------------------------------------------------------------------------------------------------------- Name of investigator: Assoc Prof Kim Beswick Signature of investigator: Date: 24.10.2011 Name of investigator: Assoc Prof Rosemary Callingham Signature of investigator: Date: 24.10.2011 Name of investigator: Mrs. Mini Joseph Chaman Signature of investigator: Date: 24.10.2011
Locked Bag 1307 Launceston Tasmania 7275 Australia
FACULTY OF EDUCATION
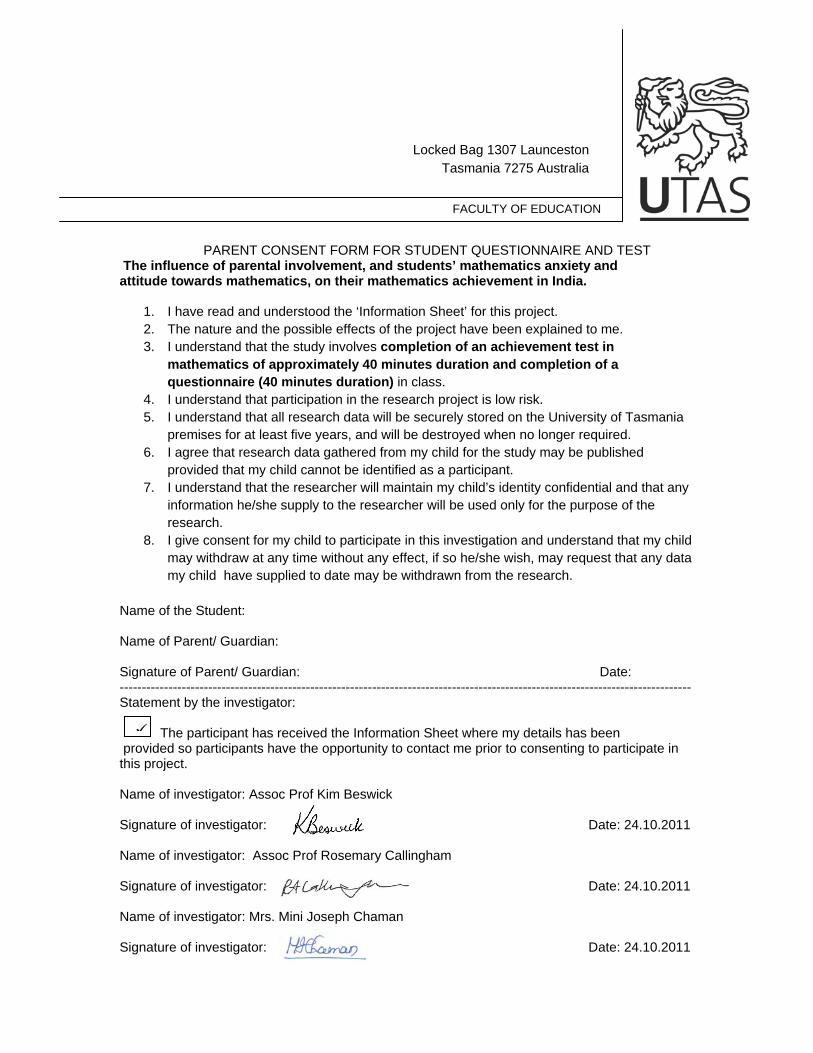
PARENT CONSENT FORM FOR STUDENT QUESTIONNAIRE AND TEST The influence of parental involvement, and students’ mathematics anxiety and attitude towards mathematics, on their mathematics achievement in India.
1. I have read and understood the ‘Information Sheet’ for this project. 2. The nature and the possible effects of the project have been explained to me. 3. I understand that the study involves completion of an achievement test in
mathematics of approximately 40 minutes duration and completion of a questionnaire (40 minutes duration) in class.
4. I understand that participation in the research project is low risk. 5. I understand that all research data will be securely stored on the University of Tasmania
premises for at least five years, and will be destroyed when no longer required. 6. I agree that research data gathered from my child for the study may be published
provided that my child cannot be identified as a participant. 7. I understand that the researcher will maintain my child’s identity confidential and that any
information he/she supply to the researcher will be used only for the purpose of the research.
8. I give consent for my child to participate in this investigation and understand that my child may withdraw at any time without any effect, if so he/she wish, may request that any data my child have supplied to date may be withdrawn from the research.
Name of the Student: Name of Parent/ Guardian: Signature of Parent/ Guardian: Date: --------------------------------------------------------------------------------------------------------------------------------- Statement by the investigator: The participant has received the Information Sheet where my details has been provided so participants have the opportunity to contact me prior to consenting to participate in this project. Name of investigator: Assoc Prof Kim Beswick Signature of investigator: Date: 24.10.2011 Name of investigator: Assoc Prof Rosemary Callingham Signature of investigator: Date: 24.10.2011 Name of investigator: Mrs. Mini Joseph Chaman Signature of investigator: Date: 24.10.2011
Locked Bag 1307 Launceston Tasmania 7275 Australia
FACULTY OF EDUCATION

STUDENT CONSENT FORM FOR TEST The influence of parental involvement, and students’ mathematics anxiety and attitude towards mathematics, on their mathematics achievement in India.
1. I have read and understood the ‘Information Sheet’ for this project. 2. The nature and the possible effects of the project have been explained to me. 3. I understand that the study involves completion of an achievement test in
mathematics of approximately 40 minutes duration. 4. I understand that participation in the research project is low risk. 5. I understand that all research data will be securely stored on the University of Tasmania
premises for at least five years, and will be destroyed when no longer required. 6. I agree that research data gathered from me for the study may be published provided that
I cannot be identified as a participant. 7. I understand that the researcher will maintain my identity confidential and that any
information I supply to the researcher will be used only for the purpose of the research. 8. I agree to participate in this investigation and understand that I may withdraw at any time
without any effect, if so I wish, may request that any data I have supplied to date may be withdrawn from the research.
Name of the Student: Signature of Student: Date: --------------------------------------------------------------------------------------------------------------------------------- Statement by the investigator: The participant has received the Information Sheet where my details has been provided so participants have the opportunity to contact me prior to consenting to participate in this project. Name of investigator: Assoc Prof Kim Beswick Signature of investigator: Date: 24.10.2011 Name of investigator: Assoc Prof Rosemary Callingham Signature of investigator: Date: 24.10.2011 Name of investigator: Mrs. Mini Joseph Chaman Signature of investigator: Date: 24.10.2011
Locked Bag 1307 Launceston Tasmania 7275 Australia
FACULTY OF EDUCATION

STUDENT CONSENT FORM FOR QUESTIONNAIRE The influence of parental involvement, and students’ mathematics anxiety and attitude towards mathematics, on their mathematics achievement in India.
1. I have read and understood the ‘Information Sheet’ for this project. 2. The nature and the possible effects of the project have been explained to me. 3. I understand that the study involves completion of a questionnaire of approximately
40 minutes duration. 4. I understand that participation in the research project is low risk. 5. I understand that all research data will be securely stored on the University of Tasmania
premises for at least five years, and will be destroyed when no longer required. 6. I agree that research data gathered from me for the study may be published provided that
I cannot be identified as a participant. 7. I understand that the researcher will maintain my identity confidential and that any
information I supply to the researcher will be used only for the purpose of the research. 8. I agree to participate in this investigation and understand that I may withdraw at any time
without any effect, if so I wish, may request that any data I have supplied to date may be withdrawn from the research.
Name of the Student: Signature of Student: Date: --------------------------------------------------------------------------------------------------------------------------------- Statement by the investigator: The participant has received the Information Sheet where my details has been provided so participants have the opportunity to contact me prior to consenting to participate in this project. Name of investigator: Assoc Prof Kim Beswick Signature of investigator: Date: 24.10.2011 Name of investigator: Assoc Prof Rosemary Callingham Signature of investigator: Date: 24.10.2011 Name of investigator: Mrs. Mini Joseph Chaman Signature of investigator: Date: 24.10.2011
Locked Bag 1307 Launceston Tasmania 7275 Australia
FACULTY OF EDUCATION
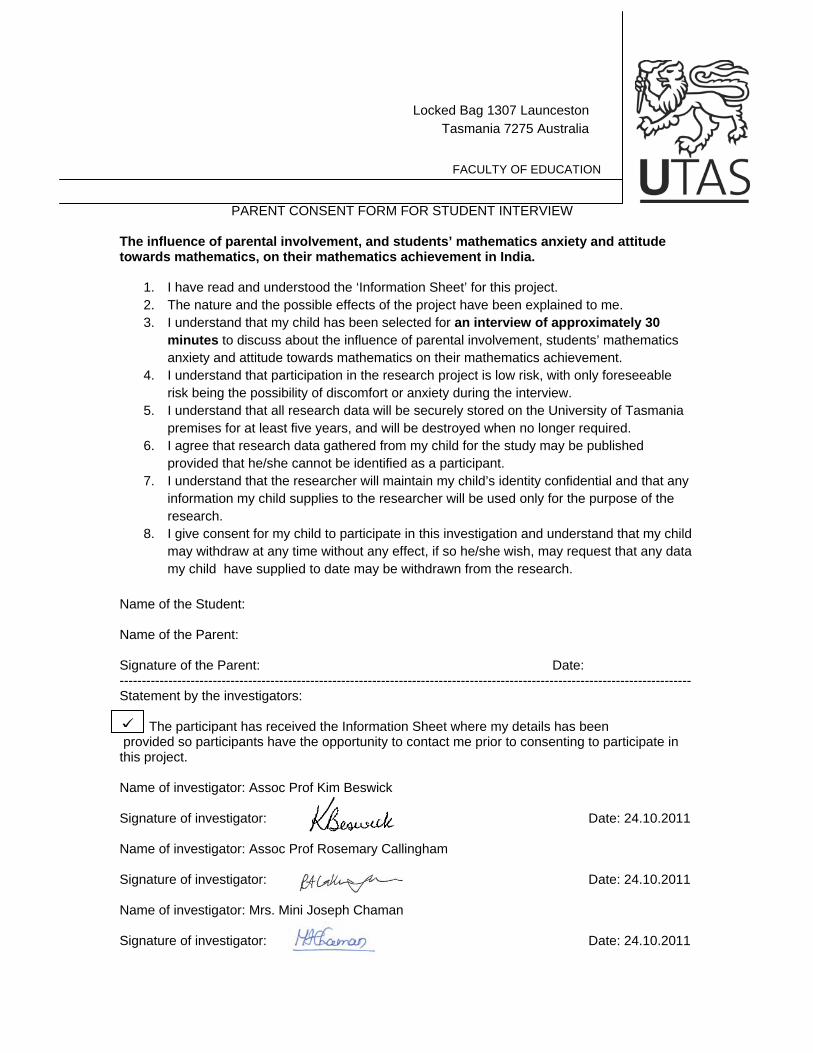
PARENT CONSENT FORM FOR STUDENT INTERVIEW The influence of parental involvement, and students’ mathematics anxiety and attitude towards mathematics, on their mathematics achievement in India.
1. I have read and understood the ‘Information Sheet’ for this project. 2. The nature and the possible effects of the project have been explained to me. 3. I understand that my child has been selected for an interview of approximately 30
minutes to discuss about the influence of parental involvement, students’ mathematics anxiety and attitude towards mathematics on their mathematics achievement.
4. I understand that participation in the research project is low risk, with only foreseeable risk being the possibility of discomfort or anxiety during the interview.
5. I understand that all research data will be securely stored on the University of Tasmania premises for at least five years, and will be destroyed when no longer required.
6. I agree that research data gathered from my child for the study may be published provided that he/she cannot be identified as a participant.
7. I understand that the researcher will maintain my child’s identity confidential and that any information my child supplies to the researcher will be used only for the purpose of the research.
8. I give consent for my child to participate in this investigation and understand that my child may withdraw at any time without any effect, if so he/she wish, may request that any data my child have supplied to date may be withdrawn from the research.
Name of the Student: Name of the Parent: Signature of the Parent: Date: --------------------------------------------------------------------------------------------------------------------------------- Statement by the investigators: The participant has received the Information Sheet where my details has been provided so participants have the opportunity to contact me prior to consenting to participate in this project. Name of investigator: Assoc Prof Kim Beswick Signature of investigator: Date: 24.10.2011 Name of investigator: Assoc Prof Rosemary Callingham Signature of investigator: Date: 24.10.2011 Name of investigator: Mrs. Mini Joseph Chaman Signature of investigator: Date: 24.10.2011
Locked Bag 1307 Launceston Tasmania 7275 Australia
FACULTY OF EDUCATION
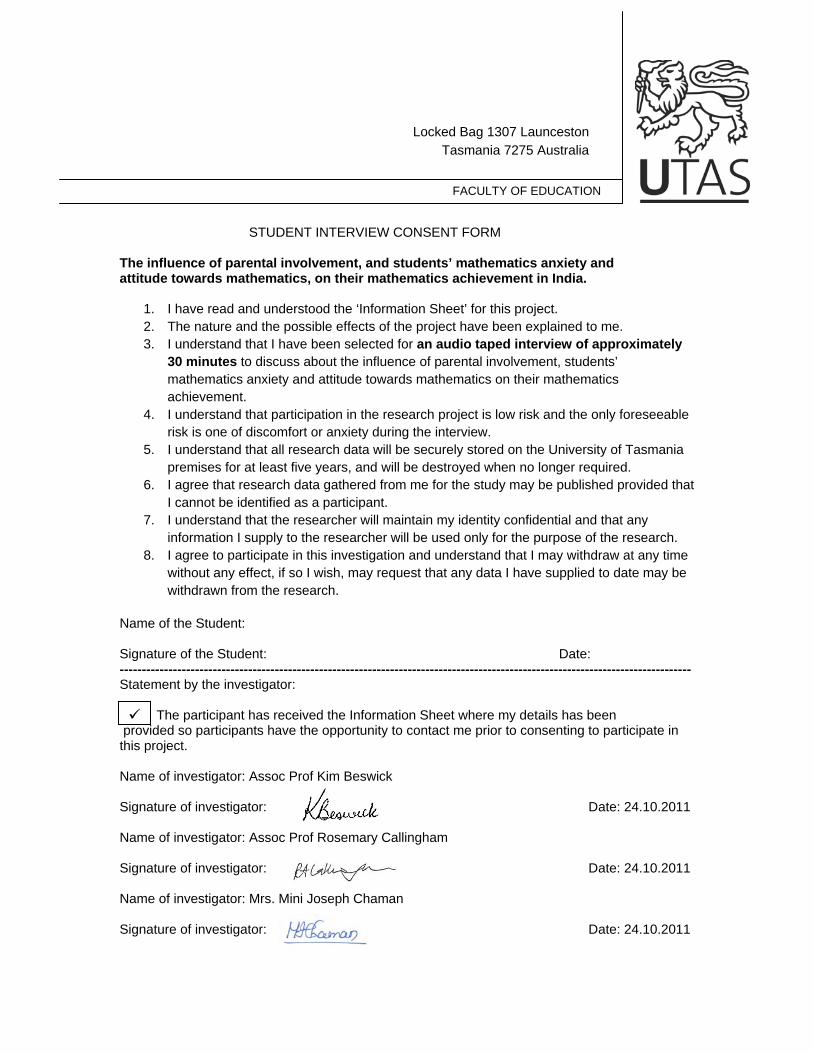
STUDENT INTERVIEW CONSENT FORM The influence of parental involvement, and students’ mathematics anxiety and attitude towards mathematics, on their mathematics achievement in India.
1. I have read and understood the ‘Information Sheet’ for this project. 2. The nature and the possible effects of the project have been explained to me. 3. I understand that I have been selected for an audio taped interview of approximately
30 minutes to discuss about the influence of parental involvement, students’ mathematics anxiety and attitude towards mathematics on their mathematics achievement.
4. I understand that participation in the research project is low risk and the only foreseeable risk is one of discomfort or anxiety during the interview.
5. I understand that all research data will be securely stored on the University of Tasmania premises for at least five years, and will be destroyed when no longer required.
6. I agree that research data gathered from me for the study may be published provided that I cannot be identified as a participant.
7. I understand that the researcher will maintain my identity confidential and that any information I supply to the researcher will be used only for the purpose of the research.
8. I agree to participate in this investigation and understand that I may withdraw at any time without any effect, if so I wish, may request that any data I have supplied to date may be withdrawn from the research.
Name of the Student: Signature of the Student: Date: --------------------------------------------------------------------------------------------------------------------------------- Statement by the investigator: The participant has received the Information Sheet where my details has been provided so participants have the opportunity to contact me prior to consenting to participate in this project. Name of investigator: Assoc Prof Kim Beswick Signature of investigator: Date: 24.10.2011 Name of investigator: Assoc Prof Rosemary Callingham Signature of investigator: Date: 24.10.2011 Name of investigator: Mrs. Mini Joseph Chaman Signature of investigator: Date: 24.10.2011
Locked Bag 1307 Launceston Tasmania 7275 Australia
FACULTY OF EDUCATION
PARENT CONSENT FORM FOR QUESTIONNAIRE The influence of parental involvement, and students’ mathematics anxiety and attitude towards mathematics, on their mathematics achievement in India.
1. I have read and understood the ‘Information Sheet’ for this project. 2. The nature and the possible effects of the project have been explained to me. 3. I understand that the study involves completion of a questionnaire (about 20
minutes duration). 4. I understand that participation in this aspect of the research project involves no
foreseeable risk. 5. I understand that all research data will be securely stored on the University of
Tasmania premises for at least five years, and will be destroyed when no longer required.
6. I agree that research data gathered from me for the study may be published provided that I cannot be identified as a participant.
7. I understand that the researcher will maintain my identity confidential and that any information I supply to the researcher will be used only for the purpose of the research.
8. I agree to participate in this investigation and understand that I may withdraw at any time without any effect, if so I wish, may request that any data I have supplied to date may be withdrawn from the research.
Name of Parent/ Guardian: Signature of Parent/ Guardian: Date: --------------------------------------------------------------------------------------------------------------------------- Statement by the investigator: The participant has received the Information Sheet where my details has been provided so the participant have the opportunity to contact me prior to consenting to participate in this project. Name of investigator: Assoc Prof Kim Beswick Signature of investigator: Date: 24.10.2011 Name of investigator Assoc Prof Rosemary Callingham Signature of investigator: Date: 24.10.2011 Name of investigator: Mrs. Mini Joseph Chaman Signature of investigator: Date: 24.10.2011
Locked Bag 1307 Launceston Tasmania 7275 Australia
FACULTY OF EDUCATION

PARENT INTERVIEW CONSENT FORM The influence of parental involvement, and students’ mathematics anxiety and attitude towards mathematics, on their mathematics achievement in India.
1. I have read and understood the ‘Information Sheet’ for this project. 2. The nature and the possible effects of the project have been explained to me. 3. I understand that I have been selected for an audio taped interview of approximately
30 minutes to discuss the influence of parental involvement, mathematics anxiety and attitude towards mathematics on mathematics achievement.
4. I understand that participation in the research project is low risk, with only foreseeable risk being the possibility of discomfort or anxiety during the interview.
5. I understand that all research data will be securely stored on the University of Tasmania premises for at least five years, and will be destroyed when no longer required.
6. I agree that research data gathered from me for the study may be published provided that I cannot be identified as a participant.
7. I understand that the researcher will maintain my identity confidential and that any information I supply to the researcher will be used only for the purpose of the research.
8. I agree to participate in this investigation and understand that I may withdraw at any time without any effect, if so I wish, may request that any data I have supplied to date may be withdrawn from the research.
Name of Parent/ Guardian: Signature of Parent/ Guardian: Date: Please provide your preferred contact details (email or telephone) to negotiate a mutually convenient time and place for the interview. Email ID: Telephone Number: -------------------------------------------------------------------------------------------------------------------------------- Statement by the investigator: The participant has received the Information Sheet where my details has been provided so participants have the opportunity to contact me prior to consenting to participate in this project. Name of the investigator: Assoc Prof Kim Beswick Signature of the investigator: Date: 24.10.2011 Name of the investigator: Assoc Prof Rosemary Callingham Signature of the investigator: Date: 24.10.2011 Name of the investigator: Mrs. Mini Joseph Chaman Signature of the investigator: Date: 24.10.2011
Locked Bag 1307 Launceston Tasmania 7275 Australia
FACULTY OF EDUCATION
FACTORS INFLUENCING MATHEMATICS ACHIEVEMENT OF SECONDARY SCHOOL STUDENTS IN INDIA 273
Appendix J: Information Sheets

STUDENT INFORMATION SHEET FOR TEST, QUESTIONNIARE AND INTERVIEW The influence of parental involvement, and students’ mathematics anxiety and attitude towards mathematics, on their mathematics achievement in India. You are invited to participate in a research study to investigate the influence of parental involvement, mathematics anxiety and attitude towards mathematics on students' mathematics achievement. The study is being conducted in partial fulfillment of a PhD for Mrs Mini Joseph Chaman under the supervision of Associate Professors Kim Beswick and Rosemary Callingham. What is the purpose of the study? The purpose of the study is to investigate whether parental involvement, mathematics anxiety and attitude towards mathematics influence students’ mathematics achievement. Why have I been invited to participate in this study? Your school has agreed to participate in the study. You are eligible to participate in the study because you are studying mathematics in Years 9-12. What does this study involve? If you agree to participate in this study, you will be asked to complete mathematics test that should take approximately 40 minutes and to complete a questionnaire of approximately 40 minutes on your attitude to mathematics. The test is only for the research and your performance on it will not affect your grade or result in mathematics. You may also be invited to participate in an audio taped interview of approximately 30 minutes to discuss about your attitude to mathematics. It is important to understand that your involvement in the study is voluntary. While we would be pleased to have you participate and we respect your right to decline. Your decision not to participate will not have any consequences for your mathematics results. If you decide to discontinue your participation at any time, you may do so without providing an explanation. All information will be treated in a confidential manner and your name will not be used anywhere in the research. All research data will be stored in locked filing cabinets and password protected files at the Sandy Bay campus of University of Tasmania. All the data collected (hard copies, text files and audio tapes) will be destroyed after five years from the date of publication of the study.
Locked Bag 1307 Launceston Tasmania 7275 Australia
FACULTY OF EDUCATION
Are there any possible benefits from participation in this study? You may come to a better understanding of your interaction with mathematics in relation to mathematics anxiety, attitude towards mathematics and parental involvement and may get insights to improve your mathematics learning. What if I have questions about the study? If you have any questions relating to this study, feel free to contact any of the investigators, on +61 3 62262536 or Email: [email protected] or +61 3 63243167 or Email: [email protected] or +61 3 63243051 or Email: [email protected]. We would be happy to discuss any aspect of the research with you. This study has been approved by the Tasmanian Social Science Human Research Ethics Committee. If you have concerns or complaints about the conduct of this study, should contact the Executive Officer of the HREC (Tasmania) Network on +61 3 6226 7479 or Email: [email protected]. The Executive Officer is the person nominated to receive complaints from research participants. You will need to quote HREC Project Number: H0011986. Thank you for taking the time to consider this study. If you wish to take part in the study, please sign the consent form at the front of the test and questionnaire. This information sheet is for you to keep.
PARENT INFORMATION SHEET FOR STUDENT INTERVIEW The influence of parental involvement, and students’ mathematics anxiety and attitude towards mathematics, on their mathematics achievement in India. Your child is invited to participate in an interview to investigate the influence of parental involvement, mathematics anxiety and attitude towards mathematics on students' mathematics achievement. The study is being conducted in partial fulfillment of a PhD for Mrs Mini Joseph Chaman under the supervision of Associate Professors Kim Beswick and Rosemary Callingham. What is the purpose of the study? The purpose of the study is to investigate whether parental involvement, mathematics anxiety and students’ attitude towards mathematics influence their mathematics achievement. Why has my child been invited to participate in this study? Your child’s school has agreed to participate in this study. You child is eligible to participate in the study because the participants for the study are chosen to be secondary school students in Years 9-12. What does this study involve? You child will be invited to participate in an audio taped interview for approximately 30 minutes regarding his/her attitude to and feelings about mathematics which will take place at a convenient time for all involved. It is important to understand that your child’s involvement in the study is voluntary, while we would be pleased to have your child’s participation and we respect your right to decline. If your child decides to discontinue his/her participation at any time, he/she may do so without providing an explanation. All information will be treated in a confidential manner and your child’s name will not be used anywhere in the research. All research data will be stored in locked filing cabinets and password protected files at the Sandy Bay campus of University of Tasmania. All the data collected (hard copies, text files and audio tapes) will be destroyed after five years from the date of publication of the study. Are there any possible benefits from participation in this study? Your child may come to a better understanding of his/her interaction with mathematics. This study may lead to possible discussions between you and your child about mathematics learning. In the unlikely event that your child experiences anxiety or any discomfort during the interview he/she will be able to ask that the interview be discontinued, decline to answer any or all questions or to withdraw data already provided.
Locked Bag 1307 Launceston Tasmania 7275 Australia
FACULTY OF EDUCATION

What if I have questions about the study? If you have any questions relating to this study, feel free to contact any of the investigators, on +61 3 62262536 or Email: [email protected] or +61 3 63243167 or Email: [email protected] or +61 3 63243051 or Email: [email protected]. We would be happy to discuss any aspect of the research with you. This study has been approved by the Tasmanian Social Science Human Research Ethics Committee. If you have concerns or complaints about the conduct of this study, should contact the Executive Officer of the HREC (Tasmania) Network on +61 3 6226 7479 or Email: [email protected]. The Executive Officer is the person nominated to receive complaints from research participants. You will need to quote HREC Project Number: H0011986. Thank you for taking the time to consider this study. If you wish your child to take part in the study, please sign the attached consent form, place it in the envelope provided and return it to your child’s mathematics teacher who will pass it on to the researchers. This information sheet is for you to keep.
PARENT INFORMATION SHEET FOR QUESTIONNAIRE AND INTERVIEW The influence of parental involvement, and students’ mathematics anxiety and attitude towards mathematics, on their mathematics achievement in India. You are invited to participate in a research study to investigate the influence of parental involvement, anxiety and attitude towards mathematics on students' mathematics achievement. The study is being conducted by in partial fulfillment of a PhD for Mrs Mini Joseph Chaman under the supervision of Associate Professors Kim Beswick, and Rosemary Callingham. What is the purpose of the study? The purpose of the study is to investigate whether parental involvement, students’ mathematics anxiety and attitude towards mathematics influence their mathematics achievement. The study also aims to investigate the interrelationship between the above mentioned factors and to understand whether cultural differences affect the role of parental involvement, mathematics anxiety and students’ attitude towards mathematics in influencing their mathematics achievement. Why have I been invited to participate in this study? The study investigates the influence of parental involvement on mathematics achievement of students. As the parent of a secondary / higher secondary student, the information provided by you is vital for the study to understand parental influence and thus will help to improve the mathematics learning of secondary school students. What does this study involve? If you agree to participate in this study, you will be asked to complete the enclosed questionnaire of approximately 20 minutes on parental involvement, mathematics anxiety and attitude towards mathematics. You may also be asked to participate in an interview for approximately 30 minutes regarding any or all of the above mentioned areas, which will take place at a convenient time for all involved. It is important to understand that your involvement in the study is voluntary, while we would be pleased to have you participate and we respect your right to decline. If you decide to decline your participation at any time, you may do so without providing an explanation. All information will be treated in a confidential manner and your name will not be used anywhere in the research. All research data will be stored in locked filing cabinets and password protected files at the Sandy Bay campus of University of
Locked Bag 1307 Launceston Tasmania 7275 Australia
FACULTY OF EDUCATION
Tasmania. All the data collected (hard copies, text files and audio tapes) will be destroyed after five years from the date of publication of the study. Are there any possible benefits from participation in this study? You may come to a better understanding of your involvement in your child’s mathematics achievement and things to be done to help your child. In the unlikely event that you experience anxiety or any discomfort during the interview you will be able to ask that the interview be discontinued, decline to answer any or all questions or to withdraw the data already provided. What if I have questions about the study? If you have any questions relating to this study, feel free to contact either myself on +61 3 62262536 or Email: [email protected] or +61 3 63243167 or Email: [email protected] or +61 3 63243051 or Email: [email protected]. We would be happy to discuss any aspect of the research with you. This study has been approved by the Tasmanian Social Science Human Research Ethics Committee. If you have concerns or complaints about the conduct of this study, should contact the Executive Officer of the HREC (Tasmania) Network on +61 3 62267479 or Email: [email protected]. The Executive Officer is the person nominated to receive complaints from research participants. You will need to quote HREC Project Number: H0011986. Thank you for taking the time to consider this study. This information sheet is for you to keep.
FACTORS INFLUENCING MATHEMATICS ACHIEVEMENT OF SECONDARY SCHOOL STUDENTS IN INDIA 280
Appendix K: Interview transcripts
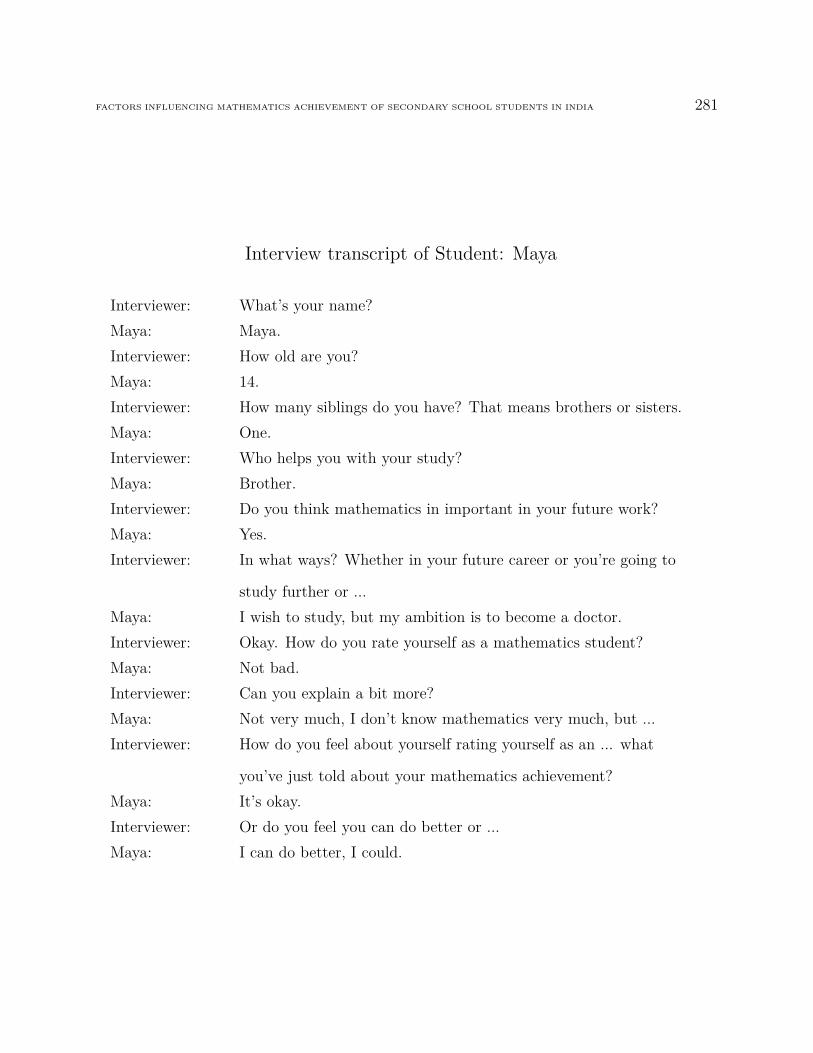
FACTORS INFLUENCING MATHEMATICS ACHIEVEMENT OF SECONDARY SCHOOL STUDENTS IN INDIA 281
Interview transcript of Student: Maya
Interviewer: What’s your name?Maya: Maya.Interviewer: How old are you?Maya: 14.Interviewer: How many siblings do you have? That means brothers or sisters.Maya: One.Interviewer: Who helps you with your study?Maya: Brother.Interviewer: Do you think mathematics in important in your future work?Maya: Yes.Interviewer: In what ways? Whether in your future career or you’re going to
study further or ...Maya: I wish to study, but my ambition is to become a doctor.Interviewer: Okay. How do you rate yourself as a mathematics student?Maya: Not bad.Interviewer: Can you explain a bit more?Maya: Not very much, I don’t know mathematics very much, but ...Interviewer: How do you feel about yourself rating yourself as an ... what
you’ve just told about your mathematics achievement?Maya: It’s okay.Interviewer: Or do you feel you can do better or ...Maya: I can do better, I could.

FACTORS INFLUENCING MATHEMATICS ACHIEVEMENT OF SECONDARY SCHOOL STUDENTS IN INDIA 282
Interviewer: What is your worst subject in school?Maya: English.Interviewer: How do you feel when taking a mathematics test?Maya: Nervous.Interviewer: Which mathematics course are you studying now? You just ex-
plain what ... which year and what you’re studying in your maths
class? Can you explain that ... do you want me to repeat?Maya: Yes.Interviewer: Which mathematics course are you studying now?Maya: Mathematics ...Interviewer: Course. That means what all subjects, what all topics you’re
studying in your maths class?Maya: Algebraic expressions, then geometries, triangles, circles.Interviewer: In what ways are your parents involved in your mathematics
learning? Do you’ve anything to say?Maya: No.Interviewer: How often do your parents check your homework?Maya: They never look.Interviewer: Who helps you with your mathematics work? That means daily
work, homework or whatever related to maths?Maya: My brother.Interviewer: Do your parents monitor the time you spend watching TV?Maya: Yes.Interviewer: Why?Maya: We’ve a lot to study, so that they will monitor.Interviewer: Monitor how you watch the TV. How do they monitor the...your
time spending on watching TV?Maya: There is time limit for me to see the TV.

FACTORS INFLUENCING MATHEMATICS ACHIEVEMENT OF SECONDARY SCHOOL STUDENTS IN INDIA 283
Interviewer: Okay. What’s your parents’ opinion about your achievement in
maths?Maya: They will ask me to improve.Interviewer: Okay. What are your views about working hard in studies par-
ticularly in maths? What is your view about working hard in
studies particularly in maths, whether you have to work hard in
your studies or is it ...Maya: Work hard.Interviewer: You have to work hard. Why do they say you have to work hard
in studies? Why? Why do you have to work hard?Maya: To score good marks.Interviewer: For what? Do you want me to go to the next one?Maya: Yes.Interviewer: What do you think is your parents’ expectation about your
achievement in school? What do they think you can achieve in
school?Maya: Hard work, achieve the top.Interviewer: Okay. What do you think your parents would like you to do when
you finish secondary school? That’s when you finish Year-12,
what do you think your parents expect you to do?Maya: Parents ...Interviewer: We will go the next one. In what ways do your parents help in
making decisions about your maths studies?Maya: Maths studies?Interviewer: In what ways your parents help you in making decisions about
your maths studies? Whether they ask you to study hard or do
on the problems or do on the...all the exercises in your maths
book or ...Maya: All the exercises in maths.Interviewer: Okay. Thank you.
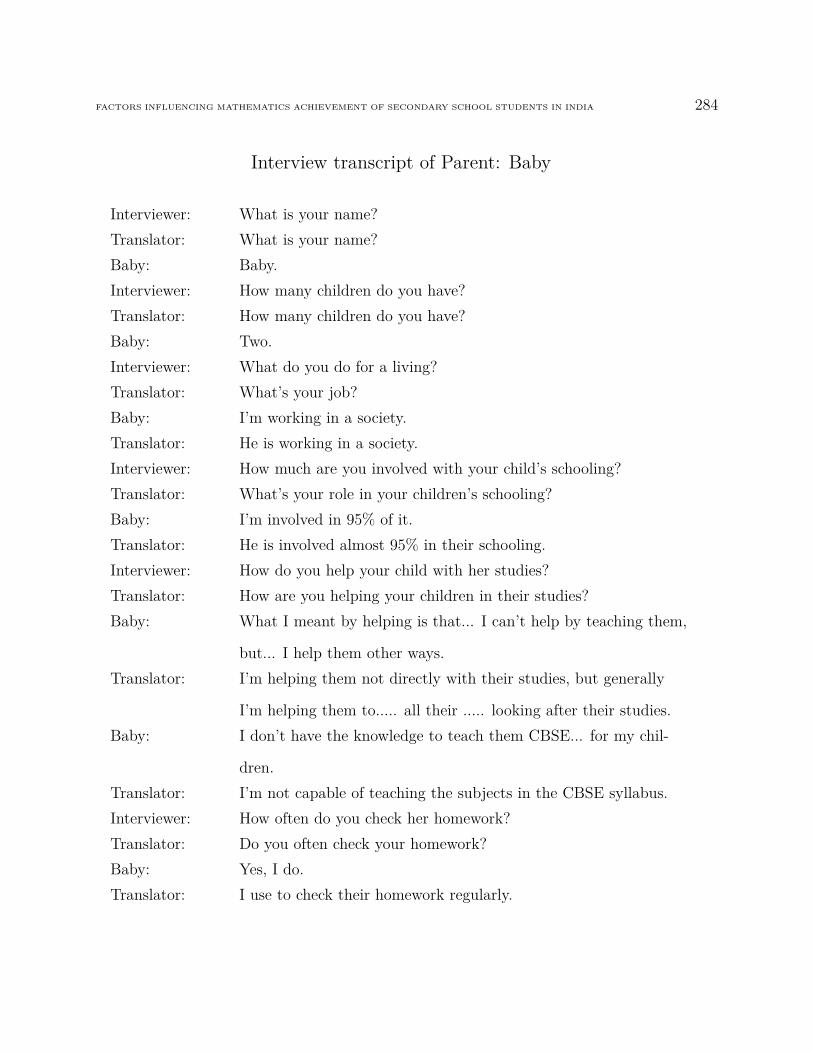
FACTORS INFLUENCING MATHEMATICS ACHIEVEMENT OF SECONDARY SCHOOL STUDENTS IN INDIA 284
Interview transcript of Parent: Baby
Interviewer: What is your name?Translator: What is your name?Baby: Baby.Interviewer: How many children do you have?Translator: How many children do you have?Baby: Two.Interviewer: What do you do for a living?Translator: What’s your job?Baby: I’m working in a society.Translator: He is working in a society.Interviewer: How much are you involved with your child’s schooling?Translator: What’s your role in your children’s schooling?Baby: I’m involved in 95% of it.Translator: He is involved almost 95% in their schooling.Interviewer: How do you help your child with her studies?Translator: How are you helping your children in their studies?Baby: What I meant by helping is that... I can’t help by teaching them,
but... I help them other ways.Translator: I’m helping them not directly with their studies, but generally
I’m helping them to..... all their ..... looking after their studies.Baby: I don’t have the knowledge to teach them CBSE... for my chil-
dren.Translator: I’m not capable of teaching the subjects in the CBSE syllabus.Interviewer: How often do you check her homework?Translator: Do you often check your homework?Baby: Yes, I do.Translator: I use to check their homework regularly.
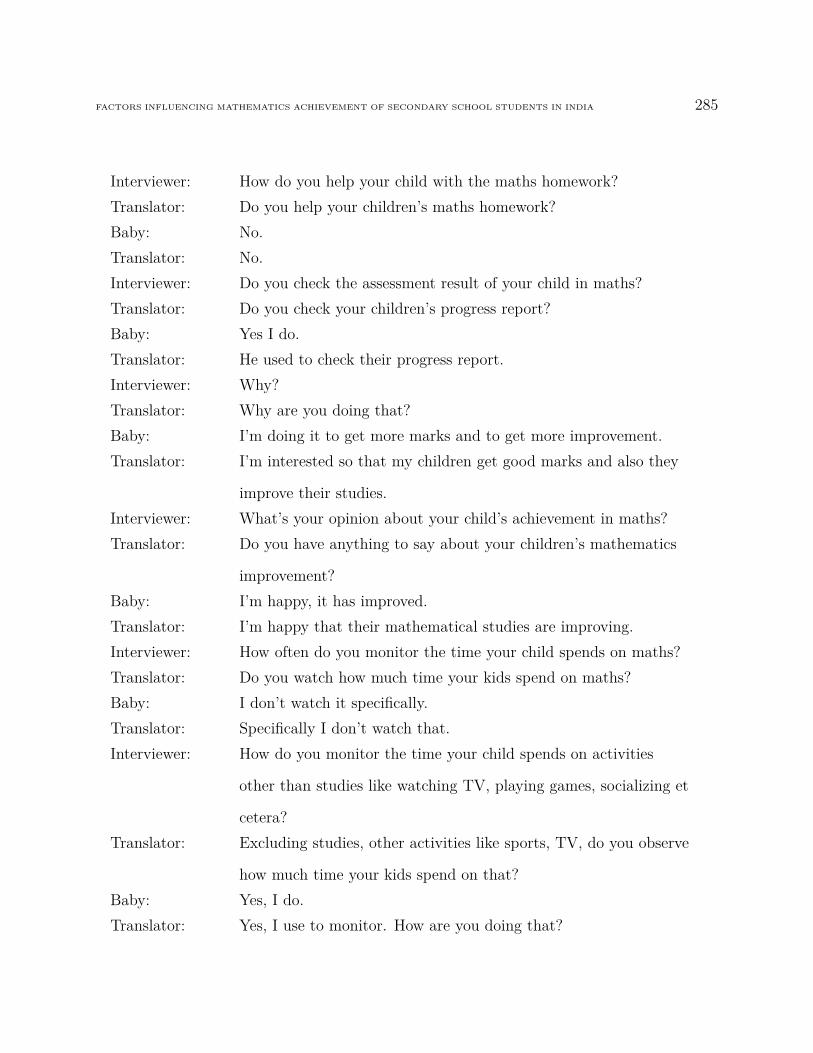
FACTORS INFLUENCING MATHEMATICS ACHIEVEMENT OF SECONDARY SCHOOL STUDENTS IN INDIA 285
Interviewer: How do you help your child with the maths homework?Translator: Do you help your children’s maths homework?Baby: No.Translator: No.Interviewer: Do you check the assessment result of your child in maths?Translator: Do you check your children’s progress report?Baby: Yes I do.Translator: He used to check their progress report.Interviewer: Why?Translator: Why are you doing that?Baby: I’m doing it to get more marks and to get more improvement.Translator: I’m interested so that my children get good marks and also they
improve their studies.Interviewer: What’s your opinion about your child’s achievement in maths?Translator: Do you have anything to say about your children’s mathematics
improvement?Baby: I’m happy, it has improved.Translator: I’m happy that their mathematical studies are improving.Interviewer: How often do you monitor the time your child spends on maths?Translator: Do you watch how much time your kids spend on maths?Baby: I don’t watch it specifically.Translator: Specifically I don’t watch that.Interviewer: How do you monitor the time your child spends on activities
other than studies like watching TV, playing games, socializing et
cetera?Translator: Excluding studies, other activities like sports, TV, do you observe
how much time your kids spend on that?Baby: Yes, I do.Translator: Yes, I use to monitor. How are you doing that?
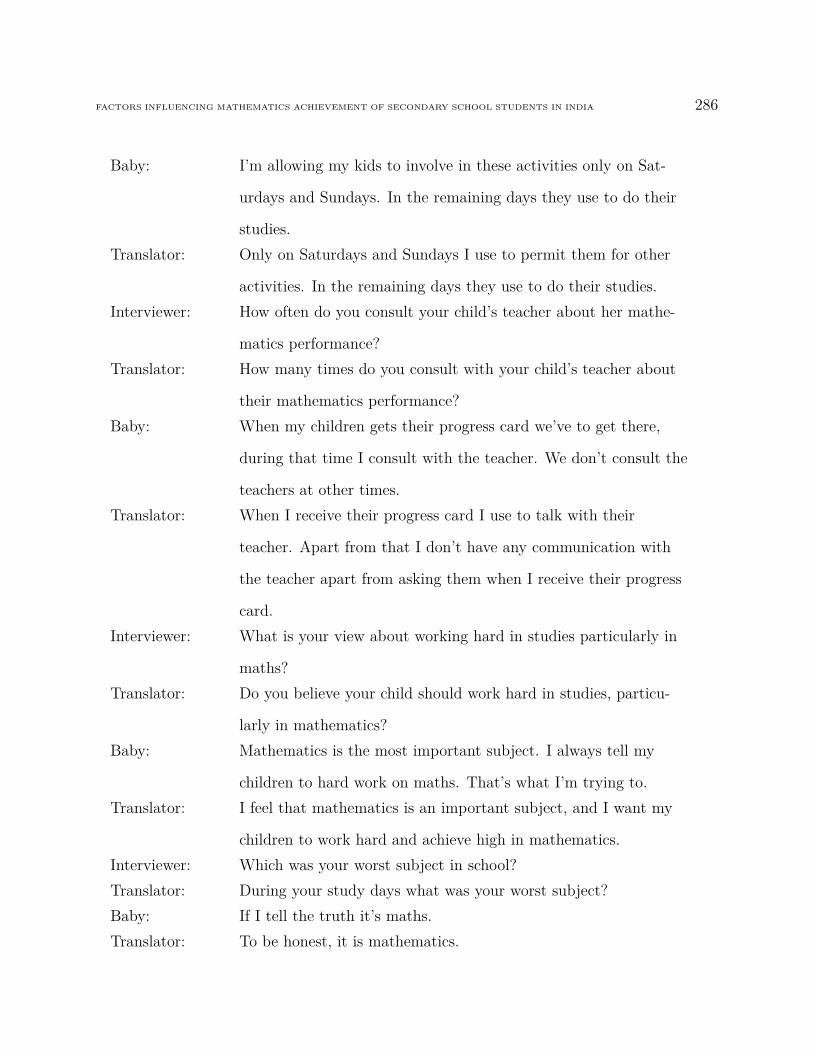
FACTORS INFLUENCING MATHEMATICS ACHIEVEMENT OF SECONDARY SCHOOL STUDENTS IN INDIA 286
Baby: I’m allowing my kids to involve in these activities only on Sat-
urdays and Sundays. In the remaining days they use to do their
studies.Translator: Only on Saturdays and Sundays I use to permit them for other
activities. In the remaining days they use to do their studies.Interviewer: How often do you consult your child’s teacher about her mathe-
matics performance?Translator: How many times do you consult with your child’s teacher about
their mathematics performance?Baby: When my children gets their progress card we’ve to get there,
during that time I consult with the teacher. We don’t consult the
teachers at other times.Translator: When I receive their progress card I use to talk with their
teacher. Apart from that I don’t have any communication with
the teacher apart from asking them when I receive their progress
card.Interviewer: What is your view about working hard in studies particularly in
maths?Translator: Do you believe your child should work hard in studies, particu-
larly in mathematics?Baby: Mathematics is the most important subject. I always tell my
children to hard work on maths. That’s what I’m trying to.Translator: I feel that mathematics is an important subject, and I want my
children to work hard and achieve high in mathematics.Interviewer: Which was your worst subject in school?Translator: During your study days what was your worst subject?Baby: If I tell the truth it’s maths.Translator: To be honest, it is mathematics.
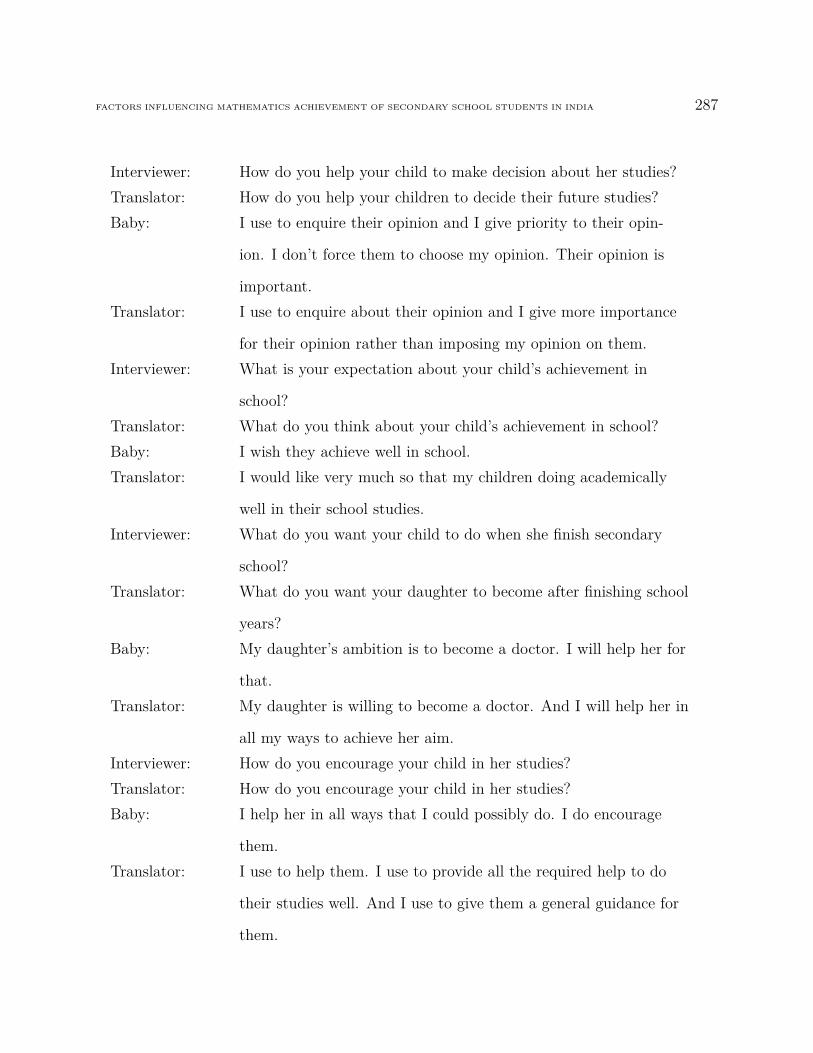
FACTORS INFLUENCING MATHEMATICS ACHIEVEMENT OF SECONDARY SCHOOL STUDENTS IN INDIA 287
Interviewer: How do you help your child to make decision about her studies?Translator: How do you help your children to decide their future studies?Baby: I use to enquire their opinion and I give priority to their opin-
ion. I don’t force them to choose my opinion. Their opinion is
important.Translator: I use to enquire about their opinion and I give more importance
for their opinion rather than imposing my opinion on them.Interviewer: What is your expectation about your child’s achievement in
school?Translator: What do you think about your child’s achievement in school?Baby: I wish they achieve well in school.Translator: I would like very much so that my children doing academically
well in their school studies.Interviewer: What do you want your child to do when she finish secondary
school?Translator: What do you want your daughter to become after finishing school
years?Baby: My daughter’s ambition is to become a doctor. I will help her for
that.Translator: My daughter is willing to become a doctor. And I will help her in
all my ways to achieve her aim.Interviewer: How do you encourage your child in her studies?Translator: How do you encourage your child in her studies?Baby: I help her in all ways that I could possibly do. I do encourage
them.Translator: I use to help them. I use to provide all the required help to do
their studies well. And I use to give them a general guidance for
them.

FACTORS INFLUENCING MATHEMATICS ACHIEVEMENT OF SECONDARY SCHOOL STUDENTS IN INDIA 288
Interview transcript of Student: Meenu
Interviewer: What is your name?Meenu: Meenu.Interviewer: How old are you?Meenu: 16.Interviewer: How many siblings do you have?Meenu: One.Interviewer: Who helps you with your study?Meenu: Father.Interviewer: Please raise your voice when you speak. Do you think mathemat-
ics is important in your future work?Meenu: Yes.Interviewer: In what ways? You have to explain why you think maths is more
important in your future life, whether you’re going to use it for
your career or further study or...Meenu: I don’t know.Interviewer: Okay. How do you rate yourself as a mathematics student? Just
again, say what you think about yourself in maths?Meenu: I think maths is an easy subject, but I find it very difficult to
solve the problems in my examinations.Interviewer: Is it only in particular topic or... I mean, geometry or algebra or
all maths as a whole you’re finding it hard to solve the...Meenu: No, particular problem.Interviewer: Can you explain which topic you find hard to study? How do
you feel about yourself rating... your rating as a maths student?
What do you think? When you’re saying in maths you’re finding
it hard to solve problems in the examination, can you say that
how do you feel? We can share your thoughts. You’re not having
anything to say? What’s your worst subject in the school?Meenu: History.
FACTORS INFLUENCING MATHEMATICS ACHIEVEMENT OF SECONDARY SCHOOL STUDENTS IN INDIA 289
Interviewer: Okay. How do you feel when taking a mathematics test?Meenu: How do I feel...Interviewer: How do you feel when taking a mathematics test?Meenu: I feel... I feel my mind went blank.Interviewer: Do you feel nervous or tensed or... and when you feel nervous
you’re finding it hard to solve... solve the problems or...Meenu: I’ll forget all the equations...Interviewer: Okay.Meenu: Formulas.Interviewer: Okay. Because you’re getting tensed is it affecting the final re-
sult? Have you thought about that?Meenu: No.Interviewer: Even though you’re forgetting the equations and everything
you’re able to finish the whole test, is what happening or you
won’t be able to finish the whole test?Meenu: I don’t get enough time to complete all the questions.Interviewer: Just because you’re getting tensed, not because you don’t know
it?Meenu: I know it.Interviewer: You know all the... you’ve studied everything and you know the
portions, but because you’re nervous you won’t be able to finish
the test, is that what you mean?Meenu: Not like that. I... I will split [Ph] some of the portions.Interviewer: When you’re studying, why?Meenu: I find it difficult to study that... those portions.Interviewer: Okay. Which mathematics course are you studying? That means
which are the topics you’re studying in maths, like algebra, ge-
ometry, anything else you’re studying in Year-11. I think there
maybe specific topics, coordinates in geometry and something...Meenu: Yes, coordinates.
FACTORS INFLUENCING MATHEMATICS ACHIEVEMENT OF SECONDARY SCHOOL STUDENTS IN INDIA 290
Interviewer: Anything else other than these?Meenu: Limits and elementary...Interviewer: Pardon.Meenu: Limits and derivatives.Interviewer: Okay. Functions or... do you have differentiation?Meenu: Yes.Interviewer: Calculus, I think. Okay. In what ways if any are your parents
involved in your mathematics learning? How your parents are
helping in your maths learning?Meenu: No, they don’t help me.Interviewer: How often do your parents check your homework?Meenu: How long...Interviewer: Maybe everyday or regularly or once in a week or...Meenu: Not at all.Interviewer: Who help you with your maths work?Meenu: Tuition.Interviewer: Do your parents monitor the time you spend watching TV?Meenu: Yes.Interviewer: Why? They may have a reason for monitoring the time you
spend on watching TV, why?Meenu: No, I cannot...Interviewer: You cannot say why they are monitoring the time?Meenu: How can I say that?Interviewer: I think my mother is not going to... Whether they ask you to
study during the week or during the weekends you’re...you can
spend some time watching the TV or... what do you watch... you
won’t watch the TV at all, what happens?Meenu: My TV is not working properly...
FACTORS INFLUENCING MATHEMATICS ACHIEVEMENT OF SECONDARY SCHOOL STUDENTS IN INDIA 291
Interviewer: I think you’ve to raise your voice a bit so that I can get it better.
What is your parents’ opinion about your achievement in maths?
Whether they’re satisfied or whether they want you to improve
or...Meenu: They want... want me to improve.Interviewer: Do your parents’ monitor the time you spend in mathematics?
Whether they check how much, how long you will spend doing
maths or...Meenu: Yes.Interviewer: Can you explain why they’re checking the time you spend on do-
ing maths? It’s better to (07:50) _____ move from there. What
do you want to do when you finish secondary school, when you...
when you finish Year-12?Meenu: Ambition?Interviewer: Yeah.Meenu: Doctor.Interviewer: Why? Do you’ve a reason for choosing the profession of a doctor?
There maybe a reason behind it, is it? What’s the reason?Meenu: No reason.Interviewer: What’s your view about working hard in studies, particularly in
maths? Whether the students have to work hard in studies or...Meenu: Students have to work hard.Interviewer: Okay. What about in maths?Meenu: Maths, they’ve to... they’ve to do their daily problems.Interviewer: Okay.Meenu: Any portions taught in school.
FACTORS INFLUENCING MATHEMATICS ACHIEVEMENT OF SECONDARY SCHOOL STUDENTS IN INDIA 292
Interviewer: Do they have to work hard on the daily on what is taught in the
class, what’s the purpose of that? If you’re studying history there
is no need to study everyday.Meenu: No.Interviewer: You can read it at the... maybe at the end of the week or... why
we’ve to work hard in maths? What is... what do you think is
your parents’ expectation about your achievement in the school?Meenu: Expectations?Interviewer: What they think about, how... how much you’ve to achieve, what
they’ve... they’re thinking of achieving from your part?Meenu: They want me to be... they want me to score above 90%.Interviewer: Okay. What do you think your parents would like you to do when
you finish secondary school? What do they want you to do when
you finish Year-12?Meenu: Go for medicine.Interviewer: Can you say why they’re... they’re having that expectation of
yourself doing medicine? In what ways your parents help you in
making decisions about your maths studies?Meenu: Making...Interviewer: ... decisions about your maths studies? Whether they give you
some instruction how to study maths or how to prepare for the
exams, and do they give any suggestions for you?Meenu: Yes.Interviewer: Can you explain?Meenu: Doing problems...Interviewer: Okay. They ask you to do more problems to get better results for
the exam?Meenu: Yes.Interviewer: Okay.
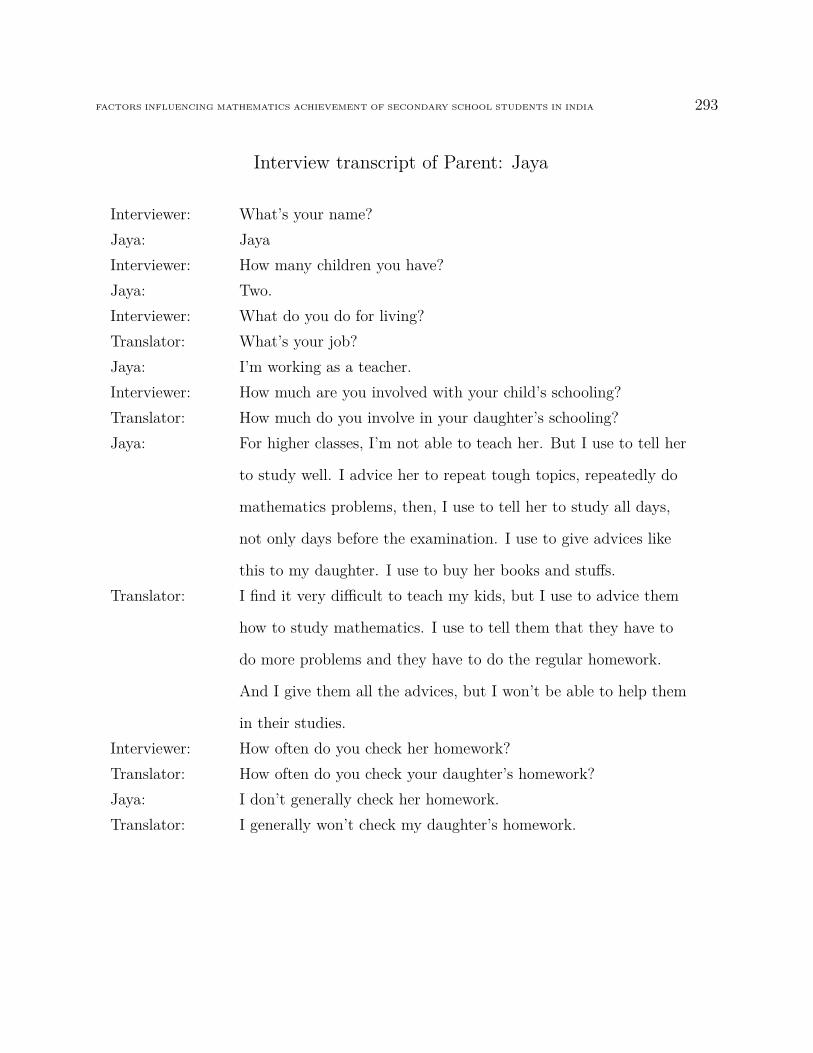
FACTORS INFLUENCING MATHEMATICS ACHIEVEMENT OF SECONDARY SCHOOL STUDENTS IN INDIA 293
Interview transcript of Parent: Jaya
Interviewer: What’s your name?Jaya: JayaInterviewer: How many children you have?Jaya: Two.Interviewer: What do you do for living?Translator: What’s your job?Jaya: I’m working as a teacher.Interviewer: How much are you involved with your child’s schooling?Translator: How much do you involve in your daughter’s schooling?Jaya: For higher classes, I’m not able to teach her. But I use to tell her
to study well. I advice her to repeat tough topics, repeatedly do
mathematics problems, then, I use to tell her to study all days,
not only days before the examination. I use to give advices like
this to my daughter. I use to buy her books and stuffs.Translator: I find it very difficult to teach my kids, but I use to advice them
how to study mathematics. I use to tell them that they have to
do more problems and they have to do the regular homework.
And I give them all the advices, but I won’t be able to help them
in their studies.Interviewer: How often do you check her homework?Translator: How often do you check your daughter’s homework?Jaya: I don’t generally check her homework.Translator: I generally won’t check my daughter’s homework.
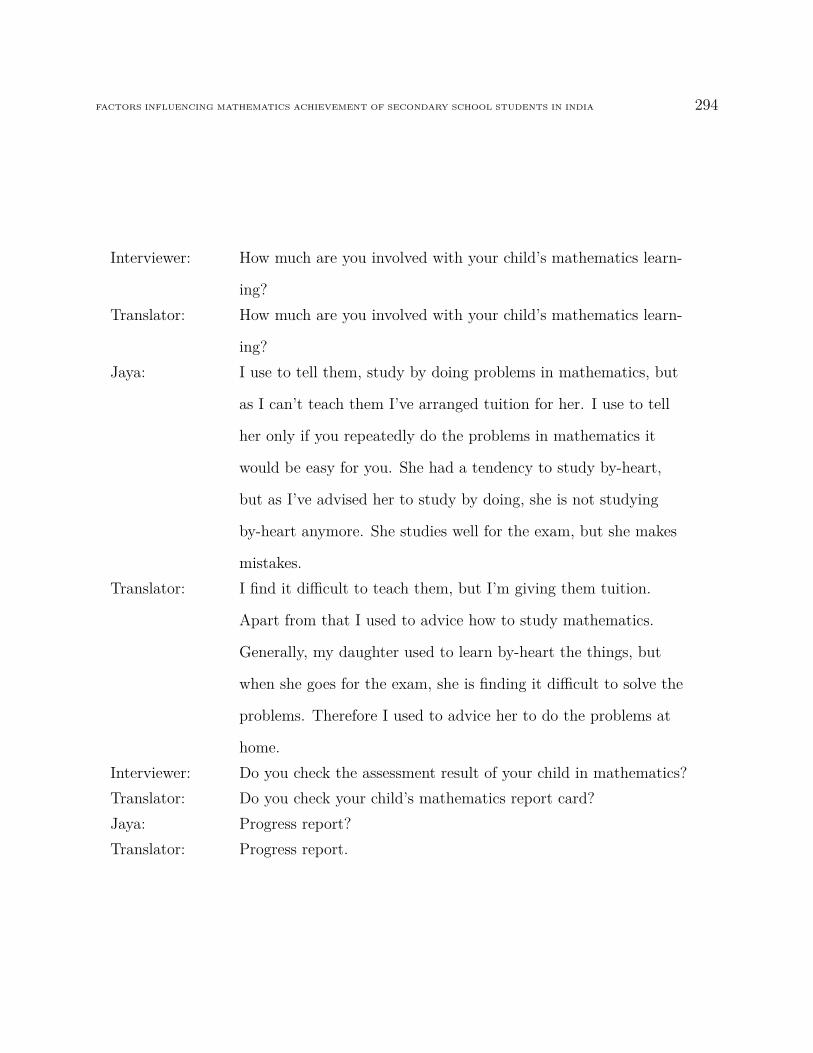
FACTORS INFLUENCING MATHEMATICS ACHIEVEMENT OF SECONDARY SCHOOL STUDENTS IN INDIA 294
Interviewer: How much are you involved with your child’s mathematics learn-
ing?Translator: How much are you involved with your child’s mathematics learn-
ing?Jaya: I use to tell them, study by doing problems in mathematics, but
as I can’t teach them I’ve arranged tuition for her. I use to tell
her only if you repeatedly do the problems in mathematics it
would be easy for you. She had a tendency to study by-heart,
but as I’ve advised her to study by doing, she is not studying
by-heart anymore. She studies well for the exam, but she makes
mistakes.Translator: I find it difficult to teach them, but I’m giving them tuition.
Apart from that I used to advice how to study mathematics.
Generally, my daughter used to learn by-heart the things, but
when she goes for the exam, she is finding it difficult to solve the
problems. Therefore I used to advice her to do the problems at
home.Interviewer: Do you check the assessment result of your child in mathematics?Translator: Do you check your child’s mathematics report card?Jaya: Progress report?Translator: Progress report.
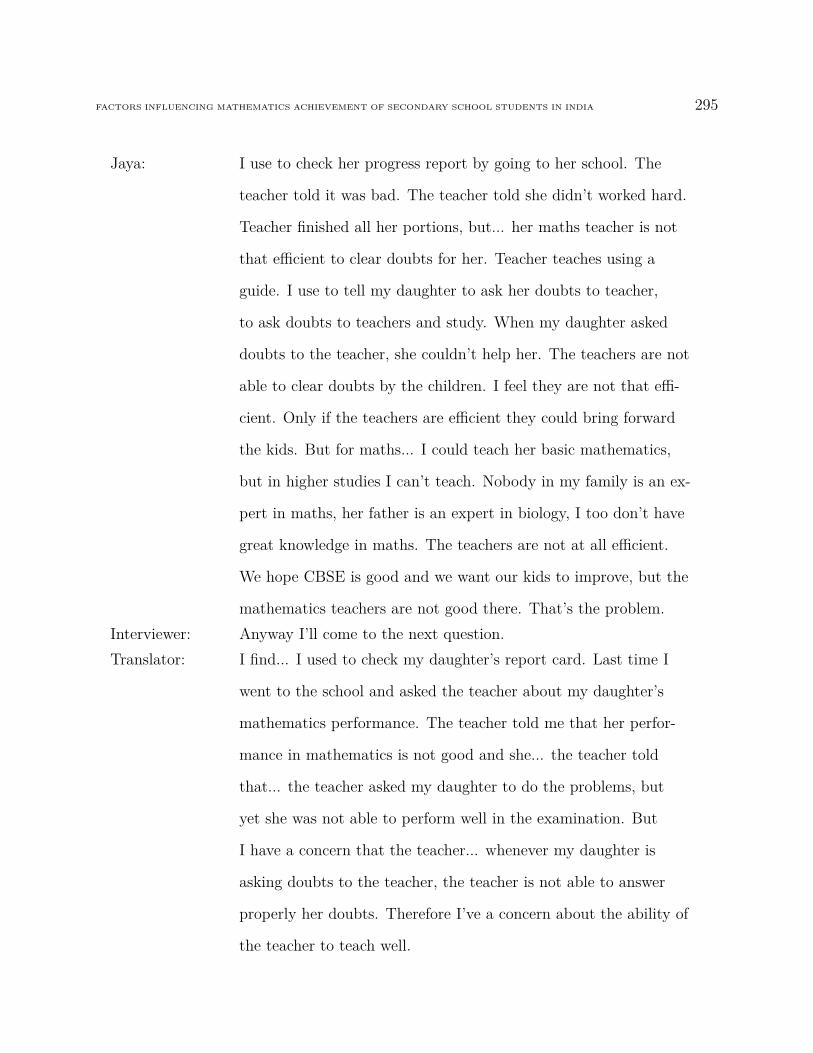
FACTORS INFLUENCING MATHEMATICS ACHIEVEMENT OF SECONDARY SCHOOL STUDENTS IN INDIA 295
Jaya: I use to check her progress report by going to her school. The
teacher told it was bad. The teacher told she didn’t worked hard.
Teacher finished all her portions, but... her maths teacher is not
that efficient to clear doubts for her. Teacher teaches using a
guide. I use to tell my daughter to ask her doubts to teacher,
to ask doubts to teachers and study. When my daughter asked
doubts to the teacher, she couldn’t help her. The teachers are not
able to clear doubts by the children. I feel they are not that effi-
cient. Only if the teachers are efficient they could bring forward
the kids. But for maths... I could teach her basic mathematics,
but in higher studies I can’t teach. Nobody in my family is an ex-
pert in maths, her father is an expert in biology, I too don’t have
great knowledge in maths. The teachers are not at all efficient.
We hope CBSE is good and we want our kids to improve, but the
mathematics teachers are not good there. That’s the problem.Interviewer: Anyway I’ll come to the next question.Translator: I find... I used to check my daughter’s report card. Last time I
went to the school and asked the teacher about my daughter’s
mathematics performance. The teacher told me that her perfor-
mance in mathematics is not good and she... the teacher told
that... the teacher asked my daughter to do the problems, but
yet she was not able to perform well in the examination. But
I have a concern that the teacher... whenever my daughter is
asking doubts to the teacher, the teacher is not able to answer
properly her doubts. Therefore I’ve a concern about the ability of
the teacher to teach well.

FACTORS INFLUENCING MATHEMATICS ACHIEVEMENT OF SECONDARY SCHOOL STUDENTS IN INDIA 296
Interviewer: Which was your worst subject in school?Translator: In your school days what was your worst subject?Jaya: English grammar and Chemistry.Translator: I don’t like English grammar and Chemistry.Interviewer: How do you help your child to make decisions about her studies?Translator: How do you advice your kids about their future studies?Jaya: After Year-12... after Year-10 we didn’t force her to take a spe-
cific subject. We let her choose. After Year-12 also we give the
choice to my kid to select their topic. I use to tell her in order to
achieve your desire you’ve to study hard. And I use to tell her
only by getting good marks she would be able to go to college. I
use to tell her college education is important. I never compel her
anything to do, we just let her choose.Translator: When my daughter finished her year 10th studies we did not com-
pel her to do or compel her to select some particular subjects.
We have left it to our daughter to select her own subjects. Now
when she completes year 12 also we won’t be compelling her to
select some particular course. It is up to her to select the subjects
or the career which she wants. Now she has an ambition. If at
all she wants to accomplish that ambition she has to really work
hard. We are advising her to work hard to achieve that ambition.
If she is doing good, she can go or reach that goal, otherwise she
has to go to college studies, but college studies also equally good.
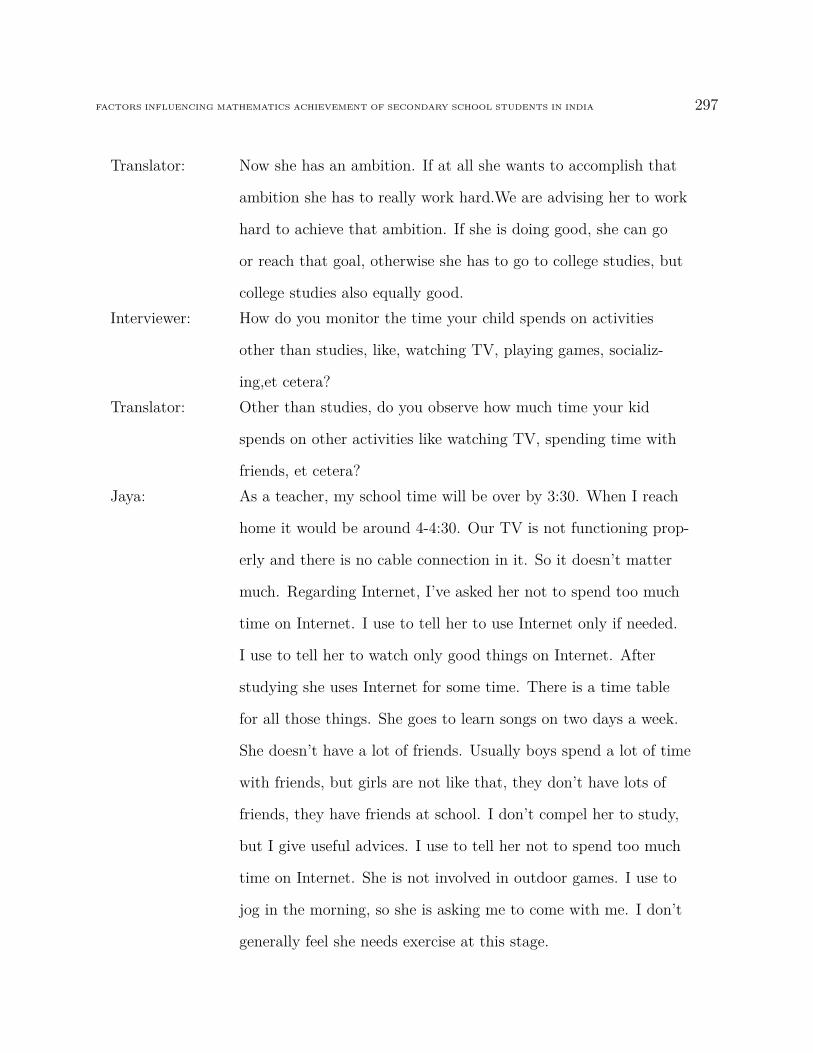
FACTORS INFLUENCING MATHEMATICS ACHIEVEMENT OF SECONDARY SCHOOL STUDENTS IN INDIA 297
Translator: Now she has an ambition. If at all she wants to accomplish that
ambition she has to really work hard.We are advising her to work
hard to achieve that ambition. If she is doing good, she can go
or reach that goal, otherwise she has to go to college studies, but
college studies also equally good.Interviewer: How do you monitor the time your child spends on activities
other than studies, like, watching TV, playing games, socializ-
ing,et cetera?Translator: Other than studies, do you observe how much time your kid
spends on other activities like watching TV, spending time with
friends, et cetera?Jaya: As a teacher, my school time will be over by 3:30. When I reach
home it would be around 4-4:30. Our TV is not functioning prop-
erly and there is no cable connection in it. So it doesn’t matter
much. Regarding Internet, I’ve asked her not to spend too much
time on Internet. I use to tell her to use Internet only if needed.
I use to tell her to watch only good things on Internet. After
studying she uses Internet for some time. There is a time table
for all those things. She goes to learn songs on two days a week.
She doesn’t have a lot of friends. Usually boys spend a lot of time
with friends, but girls are not like that, they don’t have lots of
friends, they have friends at school. I don’t compel her to study,
but I give useful advices. I use to tell her not to spend too much
time on Internet. She is not involved in outdoor games. I use to
jog in the morning, so she is asking me to come with me. I don’t
generally feel she needs exercise at this stage.
FACTORS INFLUENCING MATHEMATICS ACHIEVEMENT OF SECONDARY SCHOOL STUDENTS IN INDIA 298
Translator: Regarding watching TV, at present our TV is not working and
also we don’t have any cable connection. But even if TV is there
I used to regulate the timings which my daughter is spending
before TV. Apart from that we have an Internet connection. I
have advised my daughter to use the internet properly and to see
only the things which she really needs to look into the internet
and we used to advise her not to waste her time on the internet,
and the internet should be used only for the necessary things.
Apart from regarding socializing, my daughter doesn’t have much
neighborhood where she can make friends. She has friends in her
school. Apart from that, she doesn’t have many friends near our
house. And regarding games, specifically my daughter is not play-
ing any particular game. I used to go for exercising or walking.
My daughter used to request me to take her also along with me
for walking, but generally I don’t feel that she needs any exercise
at this stage.

FACTORS INFLUENCING MATHEMATICS ACHIEVEMENT OF SECONDARY SCHOOL STUDENTS IN INDIA 299
Interview transcript of Student: Tony
Interviewer: What is your name?Tony: Tony.Interviewer: How old are you?Tony: 14.Interviewer: How many siblings do you’ve?Translator: How many brothers do you have?Tony: One.Translator: One... I’ve one sibling.Interviewer: Who helps you with your study?Translator: Who helps you in your studies?Tony: Nobody.Translator: Nobody helps me.Interviewer: Do you think mathematics is important in your future work?Tony: Yes.Translator: Do you want to continue in English? Okay. Whenever there is
some difficulty...Interviewer: I think when we have difficulty in understanding we’ll translate to
Malayalam, okay?Tony: Okay.Interviewer: In what ways you say mathematics is important? You can answer
in Malayalam, he will translate. Whether it’s going to help you in
your future...Tony: Yes.

FACTORS INFLUENCING MATHEMATICS ACHIEVEMENT OF SECONDARY SCHOOL STUDENTS IN INDIA 300
Interviewer: ... career or future studies when you go to college or... in which
way you think maths is important?Translator: You can tell in Malayalam.Tony: Price of things...Interviewer: You can say whatever comes to your mind. Your daily work or
when you go to shops or...Tony: Yeah. For buying things and all maths is important.Translator: I feel that it is important for commercial use as well as for other
remaining things maths is important.Interviewer: I think you’ve to raise your voice then only it will get recorded,
okay? How do you rate yourself as a maths student?Translator: How do you rate your level in maths? Is it medium or high
achiever or low achiever, how do you view it?Tony: Average.Translator: He thinks he is an average student.Interviewer: How do you feel about your own rating as a maths student?Translator: As a maths student how do you evaluate yourself?Tony: Slightly above than average.Interviewer: No... what my question is you are saying you are an average
student, how do you feel? That means whether you feel you can
improve or you want to continue as an average student or...Tony: I can improve.
FACTORS INFLUENCING MATHEMATICS ACHIEVEMENT OF SECONDARY SCHOOL STUDENTS IN INDIA 301
Interviewer: You can... you feel that you can improve?Tony: Yes.Interviewer: Why you’re feeling that you can improve? Because you’re think-
ing you can improve...Tony: Yes.Interviewer: ... there maybe a reason, why you feel that? Do you think you’ve
the ability to do better or...Tony: Yes.Interviewer: Okay. What is your worst subject in school?Tony: Social science.Interviewer: How do you feel when taking a mathematics test?Tony: Anxiety.Interviewer: Once you’re anxious, then... what happens when you are anx-
ious?Tony: Mistake will happen...Interviewer: You’ve to say in complete sentence. When you’re anxious what
happens, when you’re reading the question, when you’re solving
the problem what happens when you’re anxious?Tony: When I do, mistakes happen because of my anxiousness.Translator: He finds that he commits mistakes when he is anxious during
tests.Interviewer: And because you’re anxious you’re making mistakes, will you be
able to complete the test in that particular time period?Tony: Sometimes.Interviewer: You’re able to finish?Tony: Yes.
FACTORS INFLUENCING MATHEMATICS ACHIEVEMENT OF SECONDARY SCHOOL STUDENTS IN INDIA 302
Interviewer: Other times? Do you feel because you’re anxious or you don’t
know how to do it, what’s the reason... main reason?Tony: As mistakes happen, I have to redo it and it consumes a lot of
time.Translator: Since he is making mistakes... many mistakes, he is not able to
complete the test in time.Interviewer: Okay. Which mathematics course are you studying now? I’m
asking... I’ll explain the question, that’s which all topics you’re
studying in maths like algebra, geometry...Tony: Quadrilaterals, areas of parallelogram, triangles, circles, geometry.Interviewer: And in what ways if any are your parents involved in your mathe-
matics learning?Translator: Do your father and mother help you in your maths studies?Tony: They’ve arranged tuition.Translator: They’ve provided us tuition.Interviewer: How often do your parents check your homework?Tony: They don’t check.Translator: They won’t check my homework.Interviewer: Who help... help you with your maths work?Tony: Tuition sir.Interviewer: Do your parents monitor the time you spend watching TV?Tony: Yes.
FACTORS INFLUENCING MATHEMATICS ACHIEVEMENT OF SECONDARY SCHOOL STUDENTS IN INDIA 303
Interviewer: Why?Tony: If I’m watching TV during my study time, they will monitor me.Translator: If I’m watching TV during my study time, they will monitor me.Interviewer: Can you just explain how they monitor the time you spend on
TV? Or else they won’t allow you to watch the TV during the
weekdays?Translator: How do your parents decide the time you spend watching TV is
high? Or else they always monitor it? How do they control?Tony: They’ve given me a specific time.Translator: They have given me a specific time during which I’m permitted
to watch TV.Interviewer: What is your parents’ opinion about your achievement in mathe-
matics?Tony: They ask to improve.Interviewer: Do your parents monitor the time you spend on mathematics?Tony: Not in mathematics, but overall they do.Translator: They don’t monitor me specifically for mathematics; in overall
studies they monitor my performance.Interviewer: Can you explain why they are checking you’re... the time you
spend on studies?Tony: They say I should study all subjects very well.Translator: They want me to give importance for all the subjects.Interviewer: What do you want to do when you finish secondary school? That
means when you finish Year-12.Tony: Medicine.Interviewer: Why?Tony: My ambition is to be a doctor... to become a doctor.
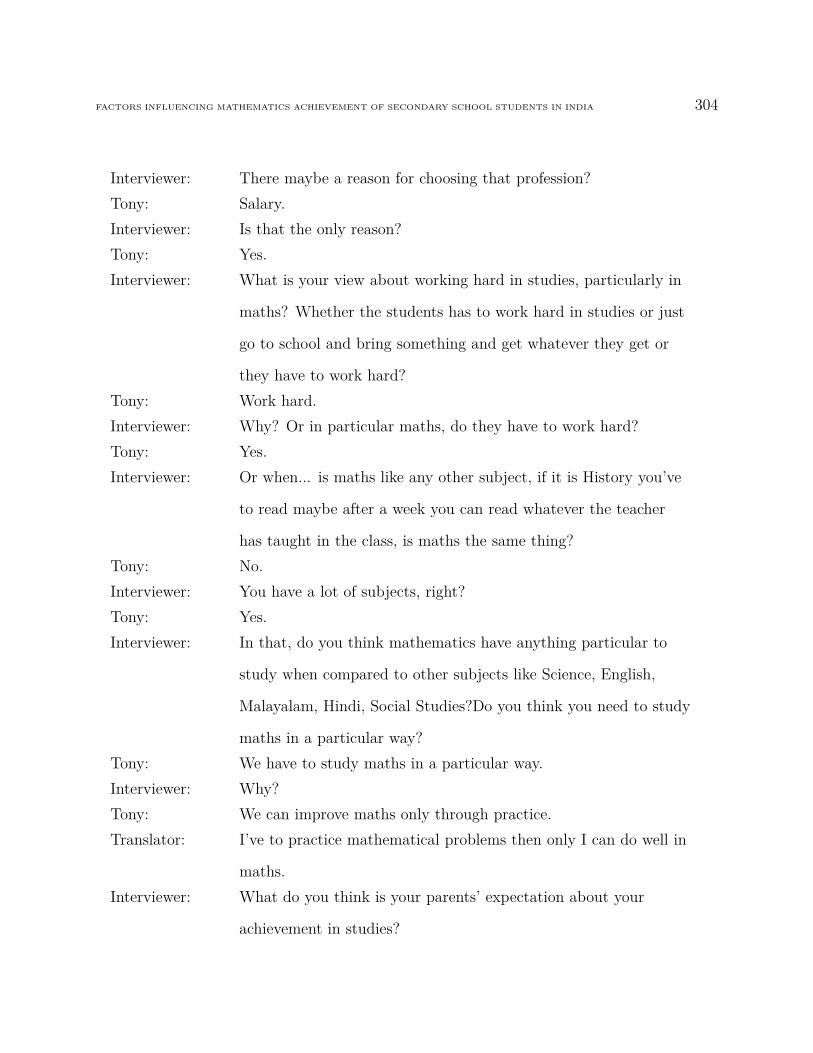
FACTORS INFLUENCING MATHEMATICS ACHIEVEMENT OF SECONDARY SCHOOL STUDENTS IN INDIA 304
Interviewer: There maybe a reason for choosing that profession?Tony: Salary.Interviewer: Is that the only reason?Tony: Yes.Interviewer: What is your view about working hard in studies, particularly in
maths? Whether the students has to work hard in studies or just
go to school and bring something and get whatever they get or
they have to work hard?Tony: Work hard.Interviewer: Why? Or in particular maths, do they have to work hard?Tony: Yes.Interviewer: Or when... is maths like any other subject, if it is History you’ve
to read maybe after a week you can read whatever the teacher
has taught in the class, is maths the same thing?Tony: No.Interviewer: You have a lot of subjects, right?Tony: Yes.Interviewer: In that, do you think mathematics have anything particular to
study when compared to other subjects like Science, English,
Malayalam, Hindi, Social Studies?Do you think you need to study
maths in a particular way?Tony: We have to study maths in a particular way.Interviewer: Why?Tony: We can improve maths only through practice.Translator: I’ve to practice mathematical problems then only I can do well in
maths.Interviewer: What do you think is your parents’ expectation about your
achievement in studies?

FACTORS INFLUENCING MATHEMATICS ACHIEVEMENT OF SECONDARY SCHOOL STUDENTS IN INDIA 305
Translator: About the progress of your studies progress what’s your parents’
opinion? How do they feel?Tony: They feel that I’m average.Translator: They feel that... my standing is an average.Interviewer: What do you think your parents would like you to do when you
finish secondary school?Tony: I don’t know.Interviewer: In what ways do your parents help in making decision about your
maths studies?Translator: For mathematics studies, did your parents help in making any
decision?Tony: They buy me books and all.Translator: They help me in purchasing the books.

FACTORS INFLUENCING MATHEMATICS ACHIEVEMENT OF SECONDARY SCHOOL STUDENTS IN INDIA 306
Interview transcript of Parent : Jane
Interviewer: What is your name?Jane: JaneInterviewer: How many children do you have?Jane: Two.Interviewer: What do you do for living?Translator: What’s your job?Jane: My husband is working for a living.Translator: What’s your husband?Jane: My husband is an electrician in Electricity Board.Translator: My husband is working as an electrician.Interviewer: How much are you involved with your child’s schooling?Translator: How much do you involve in your children’s schooling?Jane: I help them the best I could.Interviewer: What helps do you do?Jane: I wash their dresses, make food for them, and teach them a little
bit as I could.Translator: I use to provide all the necessary help such as washing clothes
and providing all their needs. Apart from that to some extent I
use to help them in their studies.Interviewer: How do you help your child with his studies?Translator: How do you help your children’s with their studies?
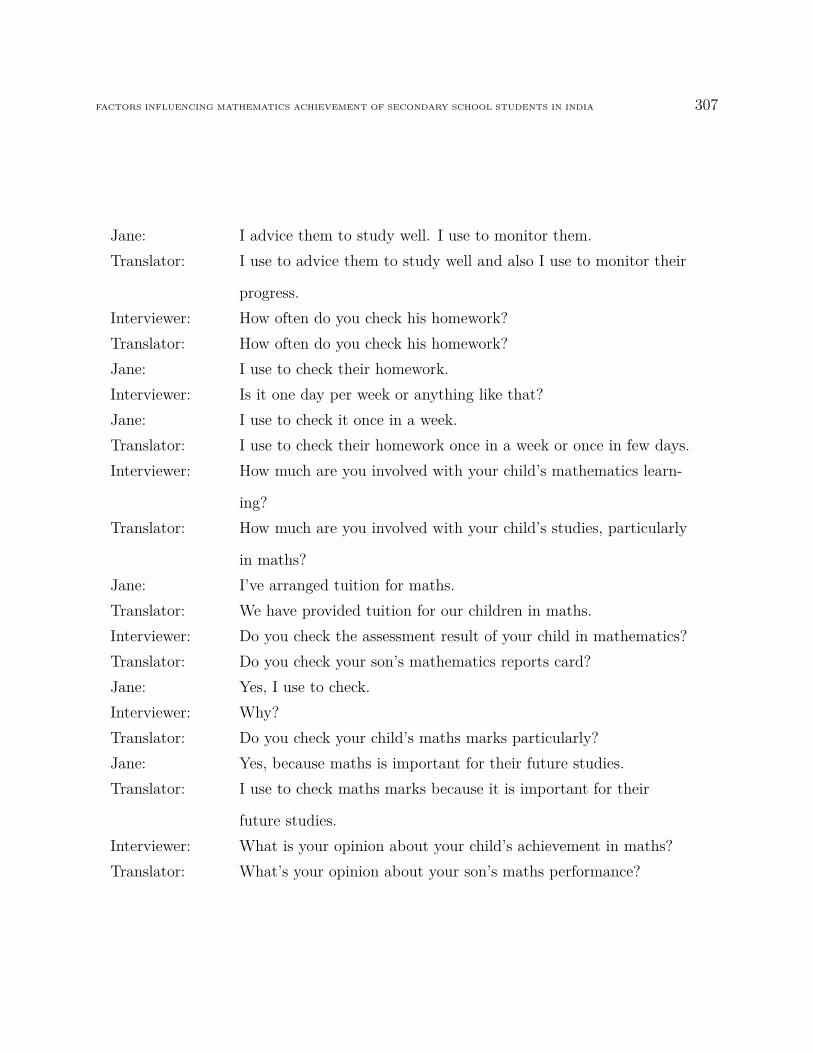
FACTORS INFLUENCING MATHEMATICS ACHIEVEMENT OF SECONDARY SCHOOL STUDENTS IN INDIA 307
Jane: I advice them to study well. I use to monitor them.Translator: I use to advice them to study well and also I use to monitor their
progress.Interviewer: How often do you check his homework?Translator: How often do you check his homework?Jane: I use to check their homework.Interviewer: Is it one day per week or anything like that?Jane: I use to check it once in a week.Translator: I use to check their homework once in a week or once in few days.Interviewer: How much are you involved with your child’s mathematics learn-
ing?Translator: How much are you involved with your child’s studies, particularly
in maths?Jane: I’ve arranged tuition for maths.Translator: We have provided tuition for our children in maths.Interviewer: Do you check the assessment result of your child in mathematics?Translator: Do you check your son’s mathematics reports card?Jane: Yes, I use to check.Interviewer: Why?Translator: Do you check your child’s maths marks particularly?Jane: Yes, because maths is important for their future studies.Translator: I use to check maths marks because it is important for their
future studies.Interviewer: What is your opinion about your child’s achievement in maths?Translator: What’s your opinion about your son’s maths performance?
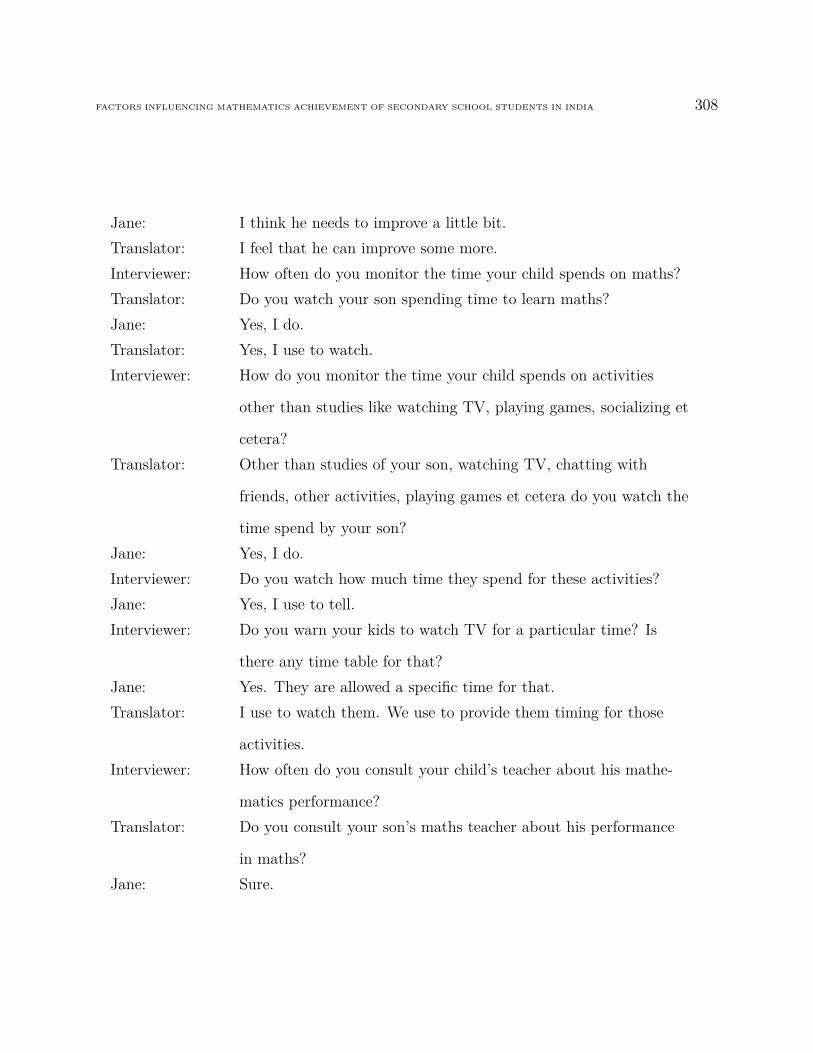
FACTORS INFLUENCING MATHEMATICS ACHIEVEMENT OF SECONDARY SCHOOL STUDENTS IN INDIA 308
Jane: I think he needs to improve a little bit.Translator: I feel that he can improve some more.Interviewer: How often do you monitor the time your child spends on maths?Translator: Do you watch your son spending time to learn maths?Jane: Yes, I do.Translator: Yes, I use to watch.Interviewer: How do you monitor the time your child spends on activities
other than studies like watching TV, playing games, socializing et
cetera?Translator: Other than studies of your son, watching TV, chatting with
friends, other activities, playing games et cetera do you watch the
time spend by your son?Jane: Yes, I do.Interviewer: Do you watch how much time they spend for these activities?Jane: Yes, I use to tell.Interviewer: Do you warn your kids to watch TV for a particular time? Is
there any time table for that?Jane: Yes. They are allowed a specific time for that.Translator: I use to watch them. We use to provide them timing for those
activities.Interviewer: How often do you consult your child’s teacher about his mathe-
matics performance?Translator: Do you consult your son’s maths teacher about his performance
in maths?Jane: Sure.
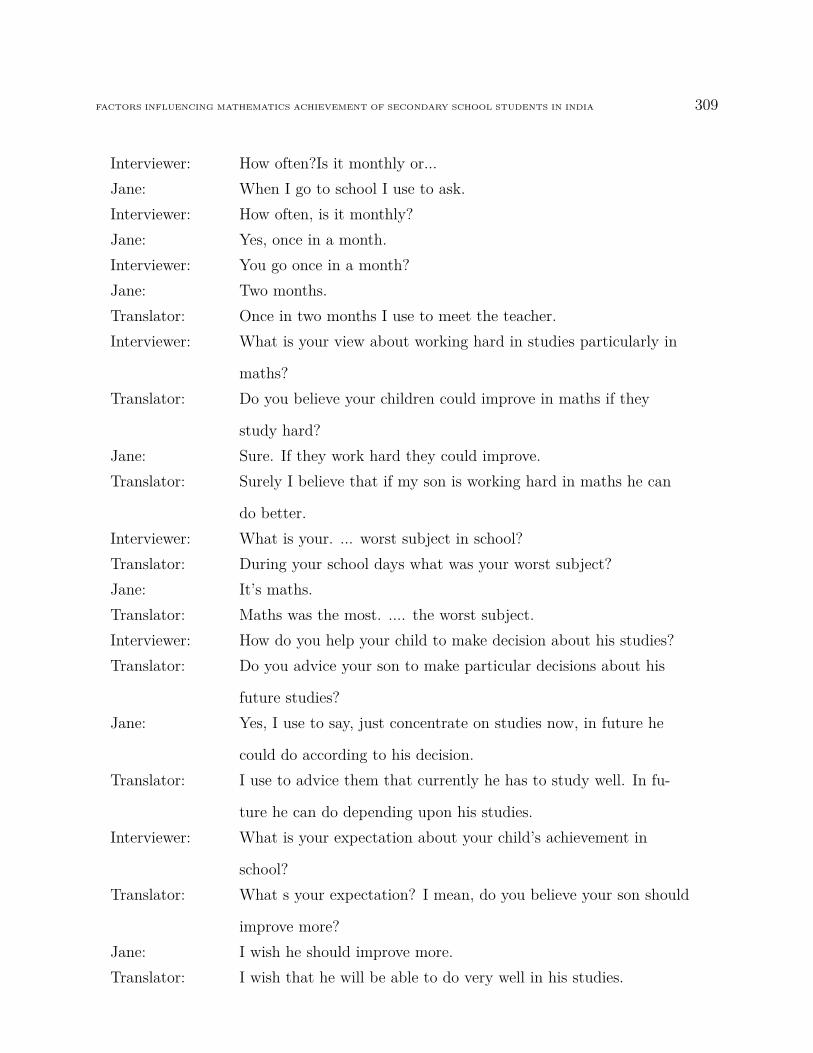
FACTORS INFLUENCING MATHEMATICS ACHIEVEMENT OF SECONDARY SCHOOL STUDENTS IN INDIA 309
Interviewer: How often?Is it monthly or...Jane: When I go to school I use to ask.Interviewer: How often, is it monthly?Jane: Yes, once in a month.Interviewer: You go once in a month?Jane: Two months.Translator: Once in two months I use to meet the teacher.Interviewer: What is your view about working hard in studies particularly in
maths?Translator: Do you believe your children could improve in maths if they
study hard?Jane: Sure. If they work hard they could improve.Translator: Surely I believe that if my son is working hard in maths he can
do better.Interviewer: What is your. ... worst subject in school?Translator: During your school days what was your worst subject?Jane: It’s maths.Translator: Maths was the most. .... the worst subject.Interviewer: How do you help your child to make decision about his studies?Translator: Do you advice your son to make particular decisions about his
future studies?Jane: Yes, I use to say, just concentrate on studies now, in future he
could do according to his decision.Translator: I use to advice them that currently he has to study well. In fu-
ture he can do depending upon his studies.Interviewer: What is your expectation about your child’s achievement in
school?Translator: What s your expectation? I mean, do you believe your son should
improve more?Jane: I wish he should improve more.Translator: I wish that he will be able to do very well in his studies.

FACTORS INFLUENCING MATHEMATICS ACHIEVEMENT OF SECONDARY SCHOOL STUDENTS IN INDIA 310
Interviewer: What do you want your child to do when he finish his secondary
school?Translator: After Year-12, what do you think your son should study?Jane: It depends on him. It will be his choice to select his interested
topics.Translator: It depends upon his interest when he completes his school studies.Interviewer: Why?Translator: Why are you making him select the choice?Jane: It’s up to him, because he should learn what he is interested in.
It’s not our interest, it’s their interests.Translator: It will bring good results if my son is selecting his career or stud-
ies as per his interest rather than imposing my interest.Interviewer: How do you encourage your child in his studies?Translator: How do you encourage your son educationally? Do you advice
him, do you scold him or anything like that?Jane: My son feels that I’m over advising him, which eventually means
that I’m advising a lot.
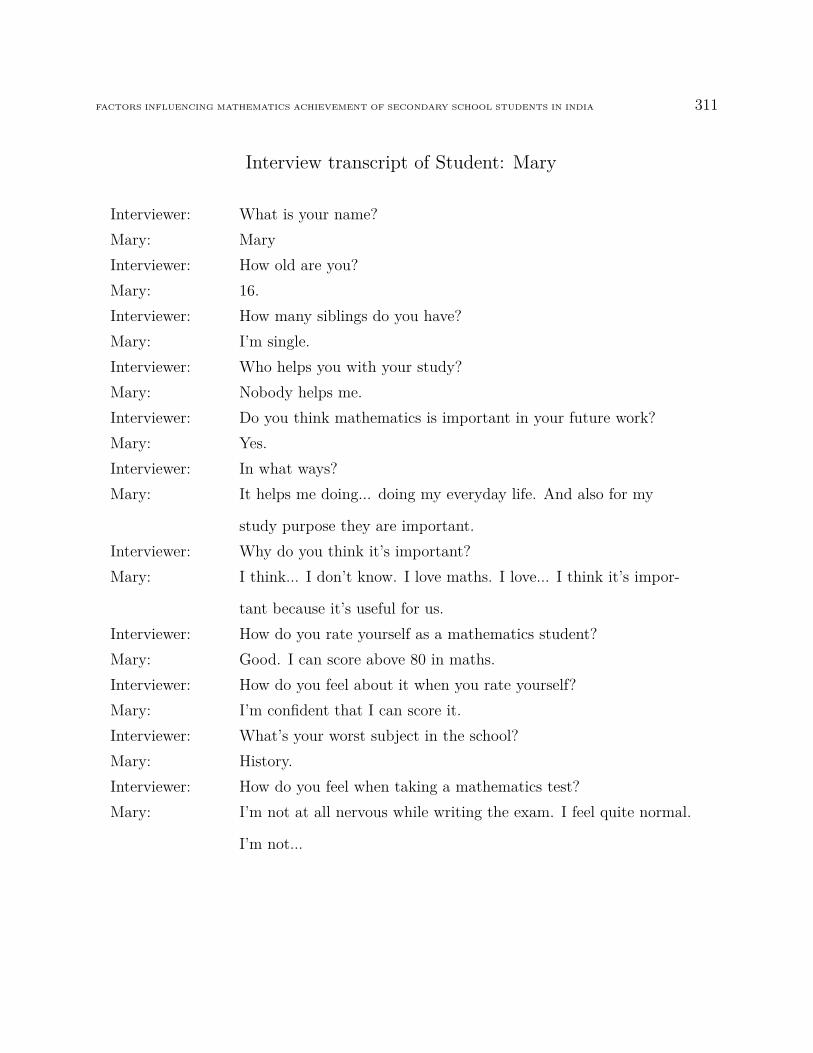
FACTORS INFLUENCING MATHEMATICS ACHIEVEMENT OF SECONDARY SCHOOL STUDENTS IN INDIA 311
Interview transcript of Student: Mary
Interviewer: What is your name?Mary: MaryInterviewer: How old are you?Mary: 16.Interviewer: How many siblings do you have?Mary: I’m single.Interviewer: Who helps you with your study?Mary: Nobody helps me.Interviewer: Do you think mathematics is important in your future work?Mary: Yes.Interviewer: In what ways?Mary: It helps me doing... doing my everyday life. And also for my
study purpose they are important.Interviewer: Why do you think it’s important?Mary: I think... I don’t know. I love maths. I love... I think it’s impor-
tant because it’s useful for us.Interviewer: How do you rate yourself as a mathematics student?Mary: Good. I can score above 80 in maths.Interviewer: How do you feel about it when you rate yourself?Mary: I’m confident that I can score it.Interviewer: What’s your worst subject in the school?Mary: History.Interviewer: How do you feel when taking a mathematics test?Mary: I’m not at all nervous while writing the exam. I feel quite normal.
I’m not...
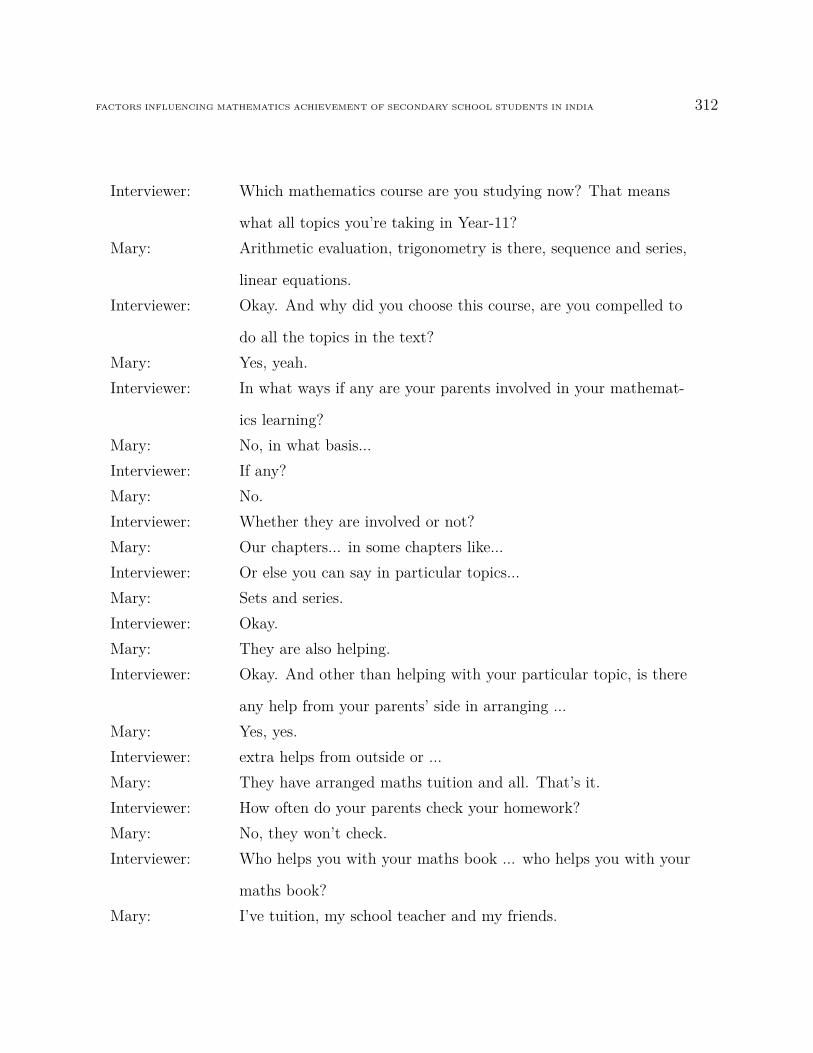
FACTORS INFLUENCING MATHEMATICS ACHIEVEMENT OF SECONDARY SCHOOL STUDENTS IN INDIA 312
Interviewer: Which mathematics course are you studying now? That means
what all topics you’re taking in Year-11?Mary: Arithmetic evaluation, trigonometry is there, sequence and series,
linear equations.Interviewer: Okay. And why did you choose this course, are you compelled to
do all the topics in the text?Mary: Yes, yeah.Interviewer: In what ways if any are your parents involved in your mathemat-
ics learning?Mary: No, in what basis...Interviewer: If any?Mary: No.Interviewer: Whether they are involved or not?Mary: Our chapters... in some chapters like...Interviewer: Or else you can say in particular topics...Mary: Sets and series.Interviewer: Okay.Mary: They are also helping.Interviewer: Okay. And other than helping with your particular topic, is there
any help from your parents’ side in arranging ...Mary: Yes, yes.Interviewer: extra helps from outside or ...Mary: They have arranged maths tuition and all. That’s it.Interviewer: How often do your parents check your homework?Mary: No, they won’t check.Interviewer: Who helps you with your maths book ... who helps you with your
maths book?Mary: I’ve tuition, my school teacher and my friends.

FACTORS INFLUENCING MATHEMATICS ACHIEVEMENT OF SECONDARY SCHOOL STUDENTS IN INDIA 313
Interviewer: Do your parents monitor the time you spend watching TV?Mary: Yes.Interviewer: Why?Mary: They want me to study when I’m watching TV.Interviewer: How they monitor the time you spend on watching TV?Mary: They ask me... they will... they say I don’t watch it for more
than two hours.Interviewer: Is it everyday or...Mary: No.Interviewer ...maybe...Mary: No, I have no time to watch TV...Interviewer: During weekend or...Mary: During Saturday and Sunday.Interviewer: What is your parents’ opinion about your achievement in mathe-
matics?Mary: Good.Interviewer: What do they say about the marks you scored in maths or... are
they happy with it?Mary: Yeah, they are happy.Interviewer: Do your parents monitor the time you spend on maths?Mary: No.Interviewer: Can you say why?Mary: No, they want me to study.Interviewer: What do you want to do when you finish secondary school? That
means Year-12.Mary: I’m going to write entrance and if I’m getting I’ll go to... for
medicine.Interviewer: Can you explain why you choose that profession?Mary: I love... I love that profession...Interviewer: Why?There maybe a reason because you’re choosing medicine,
there will be something in your mind.Mary: I love science group.
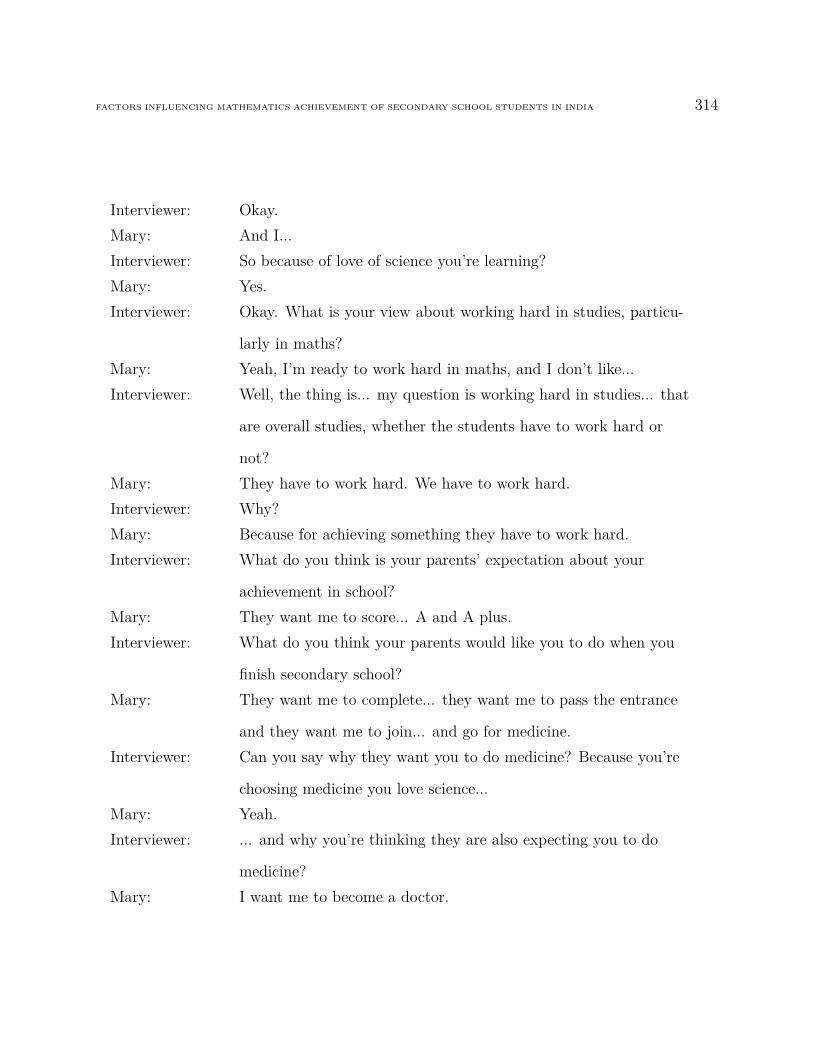
FACTORS INFLUENCING MATHEMATICS ACHIEVEMENT OF SECONDARY SCHOOL STUDENTS IN INDIA 314
Interviewer: Okay.Mary: And I...Interviewer: So because of love of science you’re learning?Mary: Yes.Interviewer: Okay. What is your view about working hard in studies, particu-
larly in maths?Mary: Yeah, I’m ready to work hard in maths, and I don’t like...Interviewer: Well, the thing is... my question is working hard in studies... that
are overall studies, whether the students have to work hard or
not?Mary: They have to work hard. We have to work hard.Interviewer: Why?Mary: Because for achieving something they have to work hard.Interviewer: What do you think is your parents’ expectation about your
achievement in school?Mary: They want me to score... A and A plus.Interviewer: What do you think your parents would like you to do when you
finish secondary school?Mary: They want me to complete... they want me to pass the entrance
and they want me to join... and go for medicine.Interviewer: Can you say why they want you to do medicine? Because you’re
choosing medicine you love science...Mary: Yeah.Interviewer: ... and why you’re thinking they are also expecting you to do
medicine?Mary: I want me to become a doctor.

FACTORS INFLUENCING MATHEMATICS ACHIEVEMENT OF SECONDARY SCHOOL STUDENTS IN INDIA 315
Interviewer: Can you say why?Mary: It is my mother. She loves... she says that she... she wanted to
become a doctor, but she can’t do that, she can’t do it, but she is
asking me, I’m not telling that she is...Interviewer: I know...Mary: ... not forcing me to do it.Interviewer: ... I understand what you’re explaining.Mary: She wanted to become a doctor, but she can’t...Interviewer: They are not forcing you.Mary: Yes.Interviewer: But both your parents and you want to do medicine. In what
ways your parents help in... help you in making decisions about
your maths studies? Whether you have to do this... you have to
do all these subjects or how to study, whether they are giving you
any instruction?Mary: They give me... yeah, they collect books for me, for maths and
all... and for all subjects they collect the book from their friends
and all, and that’s...Interviewer: Thank you so much.
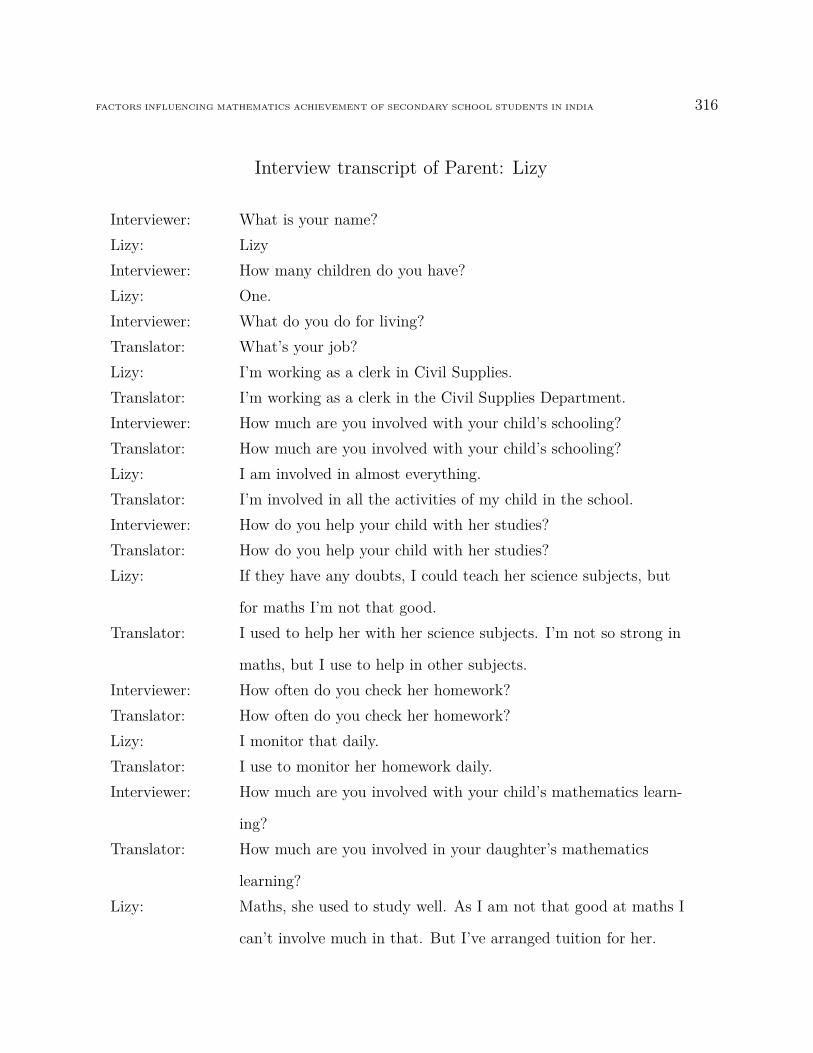
FACTORS INFLUENCING MATHEMATICS ACHIEVEMENT OF SECONDARY SCHOOL STUDENTS IN INDIA 316
Interview transcript of Parent: Lizy
Interviewer: What is your name?Lizy: LizyInterviewer: How many children do you have?Lizy: One.Interviewer: What do you do for living?Translator: What’s your job?Lizy: I’m working as a clerk in Civil Supplies.Translator: I’m working as a clerk in the Civil Supplies Department.Interviewer: How much are you involved with your child’s schooling?Translator: How much are you involved with your child’s schooling?Lizy: I am involved in almost everything.Translator: I’m involved in all the activities of my child in the school.Interviewer: How do you help your child with her studies?Translator: How do you help your child with her studies?Lizy: If they have any doubts, I could teach her science subjects, but
for maths I’m not that good.Translator: I used to help her with her science subjects. I’m not so strong in
maths, but I use to help in other subjects.Interviewer: How often do you check her homework?Translator: How often do you check her homework?Lizy: I monitor that daily.Translator: I use to monitor her homework daily.Interviewer: How much are you involved with your child’s mathematics learn-
ing?Translator: How much are you involved in your daughter’s mathematics
learning?Lizy: Maths, she used to study well. As I am not that good at maths I
can’t involve much in that. But I’ve arranged tuition for her.
FACTORS INFLUENCING MATHEMATICS ACHIEVEMENT OF SECONDARY SCHOOL STUDENTS IN INDIA 317
Translator: I can’t help her much in mathematics. Of course I use to help her
by providing her tuition and help in other subjects.Interviewer: Do you check the assessment result of your child in mathematics?Translator: Do you check your daughter’s maths assessment?Lizy: Yes, I do. She gets good marks in maths.Translator: I use to check her marks in mathematics. Usually she gets good
marks in maths.Interviewer: Why do you check her results on maths?Translator: Why do you check your maths mark specifically?Lizy: Maths is an important subject. It’s very useful in our day to day
life. Problem solving mentality comes with maths. So I feel that
maths is very important. I also try to make her understand how
important maths is in our life.Translator: We give importance to maths because maths is important for
her day to day life. Also by solving mathematical problems her
problem solving skills also will improve. And also we have made
our daughter to understand about the importance of maths.Interviewer: What is your opinion about your child’s achievement in mathe-
matics?Translator: What’s your opinion about daughter’s achievement in maths?Lizy: She studies maths well. Usually she scores good marks at maths.
I’m satisfied.Translator: I’m happy with my daughter’s performance in mathematics. She
is scoring very high marks and she is doing very well in mathe-
matics.Interviewer: How often do you monitor the time your child spends on mathe-
matics?Translator: How often do you monitor the time your daughter spends on
mathematics?

FACTORS INFLUENCING MATHEMATICS ACHIEVEMENT OF SECONDARY SCHOOL STUDENTS IN INDIA 318
Lizy: Yes.Translator: Do you tell her to learn maths thoroughly?Lizy: Yes.Translator: She is devoting more time for her mathematics studies.Interviewer: How do you monitor the time your child spends on activities
other than studies like watching TV, playing games, socializing et
cetera?Translator: Other than studies, in other activities do you monitor the time
your daughter spends?Lizy: Yes. I allow her time for other activities like playing, watching
TV et cetera.Interviewer: How do you allow your daughter to socialize with their friends?Lizy: She has a group of good friends. She uses to meet her friends.Translator: I use to permit her to watch TV, but on a specified time slot. I
use to monitor how she is spending her time on TV. Apart from
that we also permit them to have fellowship with her friends. She
has some group of friends.Lizy: She also has contacts with her old friends, one of her old friend is
in Kottayam, but she has contacts with them too.Translator: Also my daughter use to have contact with her old friends. She
uses to call them over phone. Some of her friends moved to
another town. She is also maintaining her contact with them
also.We use to permit such contacts.Interviewer: How often do you consult your child’s teacher about her mathe-
matics performance?Translator: How often do you consult your daughter’s teacher about her
mathematics performance?Lizy: I use to go to school once in a month.Translator: I use to go to school once in a month.
FACTORS INFLUENCING MATHEMATICS ACHIEVEMENT OF SECONDARY SCHOOL STUDENTS IN INDIA 319
Interviewer: What is your view about working hard in studies particularly in
maths?Translator: What’s your opinion about your daughter in maths, does she
need to work hard to achieve her goals?Lizy: She must hard work. If she works hard then only she could
achieve good marks.Translator: I feel that hard work is very important to achieve good results in
studies.Interviewer: Which was your worst subject in school?Translator: During your school days what was your worst subject?Lizy: Maths was difficult for me, it was tough. So when my daughter
does well in maths I feel so happy. I love her watch studying
maths.Translator: One of the subjects which I found difficult was mathematics even
though I never disliked it. But I’m happy to see that my daugh-
ter is doing very well in maths.Interviewer: What is your expectation about your child’s achievement in
school?Translator: What’s your expectation about your daughter’s achievement?Lizy: She must work hard more. She must try to get more marks.Translator: I want my daughter to work hard and to improve her scores fur-
ther.Interviewer: What do you want your child to do when she finish secondary
school?Translator: After secondary school, what do you want your child to proceed
further?
FACTORS INFLUENCING MATHEMATICS ACHIEVEMENT OF SECONDARY SCHOOL STUDENTS IN INDIA 320
Lizy: I don’t have any particular desire. She wishes to join medicine.
I support that. When I was a student I too wished to become a
doctor, but I couldn’t. I don’t compel her to become such and
such, but from her earlier days I managed to generate an ambi-
tion in her. So now she is interested in going to medicine. Is she
take maths as her main subject, it’s okay for me, if its science...
that’s her interest.Translator: Specifically I don’t have any particular opinion. But my daughter
wants to do medicine. We support that. When I was doing my
studies I was interested in doing medicine. I didn’t get an oppor-
tunity for doing that. But I will be happy if my daughter is able
to do medicine.Interviewer: How do you encourage your child in her studies?Translator: How do you encourage your daughter in her studies, in what
ways?Lizy: Like I said earlier, I use to collect all her details. I don’t disturb
while she is studying. I’m an employee, but I don’t disturb her
anyway. I collect all the materials needed for her study. We used
to advice her about her future. We tell her she should have her
own earning. We make her understand the value of being on her
own foot.Translator: We use to provide all the support materials that are required for
the studies. Generally we don’t disturb her in her studies. We
generally don’t permit her to do any household works because
we want her to completely devote herself to the studies. And
whatever support she needs we use to provide her.Interviewer: Thank you.
FACTORS INFLUENCING MATHEMATICS ACHIEVEMENT OF SECONDARY SCHOOL STUDENTS IN INDIA 321
Interview transcript of Student: Hema
Interviewer: What is your name?Hema: My name is Hema.Interviewer: How old are you?Hema: I’m 16.Interviewer: How many siblings do you have?Hema: One.Interviewer: Brother or sister?Hema: Brother.Interviewer: Who helps you with your study?Hema: My mother.Interviewer: Do you think mathematics is important in your future work?Hema: I think.Interviewer: In what ways?Hema: I like to do maths.It’s interesting.Interviewer: How it helps you in future?Hema: I think every... everything that we do will need maths and will
help.Interviewer: Do you think... sorry, how do you rate yourself as a mathematics
student?Hema: An average.Interviewer: How do you feel about your own rating?Hema: If I study then I can write it well.Interviewer: What is your worst subject in school?Hema: Physics.

FACTORS INFLUENCING MATHEMATICS ACHIEVEMENT OF SECONDARY SCHOOL STUDENTS IN INDIA 322
Interviewer: Can you say why?Hema: I don’t understand anything.Interviewer: Is it because you feel a bit difficult, you find it difficult with
maths...Hema: Yeah, I find it difficult.Interviewer: Is it because of the maths or...Hema: No. Not at all... not the maths, but the way of teaching.Interviewer: How do you feel when taking a mathematics test?Hema: I feel it is easy.Interviewer: I mean, in your mind, how do you feel in mind?Hema: It’s free...Interviewer: You’re not tensed?Hema: No, no tension.Interviewer: Okay. Which... sorry, in what ways if any are your parents in-
volved in your mathematics learning? Whether your parents help
you in doing maths or...Hema: Yeah. They help me in doing... my mother help me in doing
that’s still 8th standard.Interviewer: And what’s happening now?Hema: Now I study.Interviewer: By yourself?Hema: Yeah.Interviewer: Do you’ve any tuition or...Hema: Yeah, I’ve tuition.Interviewer: How often do your parents check your homework?Hema: No.Interviewer: Who helps you with your maths work?Hema: Maths work, mainly its friends and teachers.
FACTORS INFLUENCING MATHEMATICS ACHIEVEMENT OF SECONDARY SCHOOL STUDENTS IN INDIA 323
Interviewer: What about your tuition maths?Hema: Yeah, it includes teachers...Interviewer: Do your parents monitor the time you spend watching TV?Hema: Yeah.Interviewer: Why?Hema: Because I spend more time watching TV.Interviewer: So how do they monitor the time you spend on watching TV?
Whether they will switch it off or whether they ask you to go
and...Hema: They ask me to switch it off.Interviewer: What is your parents’ opinion about your achievement in maths?Hema: I think it’s a good opinion.Interviewer: Whether they are happy with what do you achieve or whether
they want you to do better?Hema: When I got a good mark then they are happy. And when I got
low mark they will beat me because I didn’t study everything.Interviewer: Do your parents monitor the time you spend on maths?Hema: Yeah. All the subjects...Interviewer: Why... why they are checking the time you spend on studies?Hema: I spend time for studies only in the time of examination, so they
check that I’m studying or not.Interviewer: What do you want to do when you finish secondary school? That
means after Year-12.Hema: After 12th I like to write the entrance exam.
FACTORS INFLUENCING MATHEMATICS ACHIEVEMENT OF SECONDARY SCHOOL STUDENTS IN INDIA 324
Interviewer: Okay.Hema: If I didn’t get entrance, then...Interviewer: Which ones?Hema: Both engineering and medicine.Interviewer: Can you say why? Why you’re choosing either engineering or
medicine?Hema: I like... I like computer engineering very much. So I’ll write that.Interviewer: Okay.Hema: And I will try medicine also.Interviewer: Then why you are choosing medicine?Hema: Because I like to help others.Interviewer: What is your view about working hard in studies, particularly in
maths? What is your view, whether the students have to work
hard or not?Hema: The students have to work hard. But they should not get tension
for studying. Mainly the students are... they are more tensed for
writing exams and... working hard and if they got the question
paper they can’t write anything. And that’s...Interviewer: What do you think is your parents’ expectation about your
achievement in school? Expectation that means in future,
whether they’ve a... they’ve something in their mind about how
much you have to achieve or...Hema: I think they need... they are saying that I’ve to... for me...Interviewer: Okay.Hema: In my case I’ve to achieve in high position. So I’ve to make my
life safe.Interviewer: What do you think your parents would like you to do when you
finish Year-12?

FACTORS INFLUENCING MATHEMATICS ACHIEVEMENT OF SECONDARY SCHOOL STUDENTS IN INDIA 325
Hema: They will really ask me to get a job, get a government job.Interviewer: Can you say why?Hema: Because nowadays medicine and engineering, they are not at all
that much valuable, and if we get a government job then we can...
we can... it will be a permanent one.Interviewer: Okay.Hema: They will be not lost [Phone rings] suddenly.Interviewer: I’m going further from your point. Why you’re saying medicine
and engineering are not at all valuable?Hema: I think nowadays they are... they’re easily available. I think... I
think so.Interviewer: In what ways do your parents help you in making decisions about
your maths study... how long you’ve to study or how...Hema: No, they don’t give me any timing to... if we’re studying for five
minutes we have to study that exactly or completely or thor-
oughly.Interviewer: Okay.Hema: They are not giving any timing for that.Interviewer: Okay, thank you.
FACTORS INFLUENCING MATHEMATICS ACHIEVEMENT OF SECONDARY SCHOOL STUDENTS IN INDIA 326
Interview transcript of Parent: Rani
Interviewer: What is your name?Rani: My name is Rani.Interviewer: How many children do you have?Rani: Two.Interviewer: What do you do for living?Translator: What’s your job?Rani: I’m a housewife. We live with my husband’s income.Translator: My husband is employed. My husband is working in Gulf.Interviewer: How much are you involved with your child’s schooling?Translator: How much are you involved with your daughter’s studies?Rani: I watch all activities of my child. During exam times we monitor
her a lot. I used to check her homework before, but nowadays I
don’t check her homework daily. I use to tell her to study maths
thoroughly. I use to go to school and talk with the teachers.Translator: I’m watching all activities of my daughter’s studies. During exam
times I use to monitor their studies and also check their home-
work. And also I will.... I use to go to school and enquire teachers
about her progress.Interviewer: How often do you check her homework?Translator: How often do you check your daughter’s homework, is it once in a
week?Rani: I don’t check daily homework. She usually does her homework.
So I don’t check her homework. I observe her doing projects and
homework well.

FACTORS INFLUENCING MATHEMATICS ACHIEVEMENT OF SECONDARY SCHOOL STUDENTS IN INDIA 327
Translator: I’m not checking their homework daily, but I know that they
are doing their homework on time. But if there are some special
project assignments I use to watch they are doing in time.Interviewer: How much are you involved with your child’s mathematics learn-
ing?Translator: How much are you involved with your daughter’s mathematics
learning?Rani: Till seventh standard maths was seen as a difficult subject, but
after that she scored very high marks in maths. Hard working,
tuition, she has tuition alone in maths, so she had advantage of
that. For her, maths is one of her easiest subjects when compared
to others. Maths is important. She is interested in engineering,
so for that maths is very important. For a government job like
bank test maths is important. In our day to day life maths is
important.Translator: Up to Year-7 maths was a difficult subject for my daughter, but
after Year-7 she started getting good marks in mathematics.
That maybe because of ..since we are providing tuition for her in
mathematics. And moreover that mathematics is an important
subject. She is having willingness to study engineering after .....
when she completes year 12, and mathematics is an important
subject. If at all she wants to go for some government jobs like
bank jobs and other organizations she need very good knowledge
of mathematics.Interviewer: What is your opinion about your child’s achievement in maths?
Whether you are happy or...
FACTORS INFLUENCING MATHEMATICS ACHIEVEMENT OF SECONDARY SCHOOL STUDENTS IN INDIA 328
Translator: What’s your opinion about your daughter’s maths achievement?
Are you happy?Rani: Maths was difficult for her at one time, but after learning it well,
she liked it very well. She got good marks in 10th standard in
maths. For engineering, there are a lot of people who finished
engineering and seeking for a job, some are jobless. And engi-
neering is expensive too. So after we spend a lot and if she didn’t
get a job, so I’m asking her to attend bank test and try to get a
government job. So I’m happy with her achievement in maths.Translator: I’m happy about her achievement in mathematics. I’m happy
because earlier she was finding it difficult to study mathematics.
Later on mathematics became much easier for her. Anyhow for
engineering she needs mathematics, but of course engineering
.....now there are many students who are completing engineering
and still unemployed. But it is better to get through a bank test
and get some government job.Interviewer: How often do you monitor the time your child spends on maths?Translator: How often do you observe the time your child spends on maths?Rani: I think since the last five-six months, she was not doing well at
maths. Till then maths was the subject she spend most of her
time. I think she is not doing that well nowadays in maths.Translator: Since past five months I feel that she is not spending enough time
in mathematics. But before that she uses to do a lot of problems
and spend more time in solving mathematical problems. Then
for her year 10 exams she solved many problems, and I use to
monitor her mathematics studies.
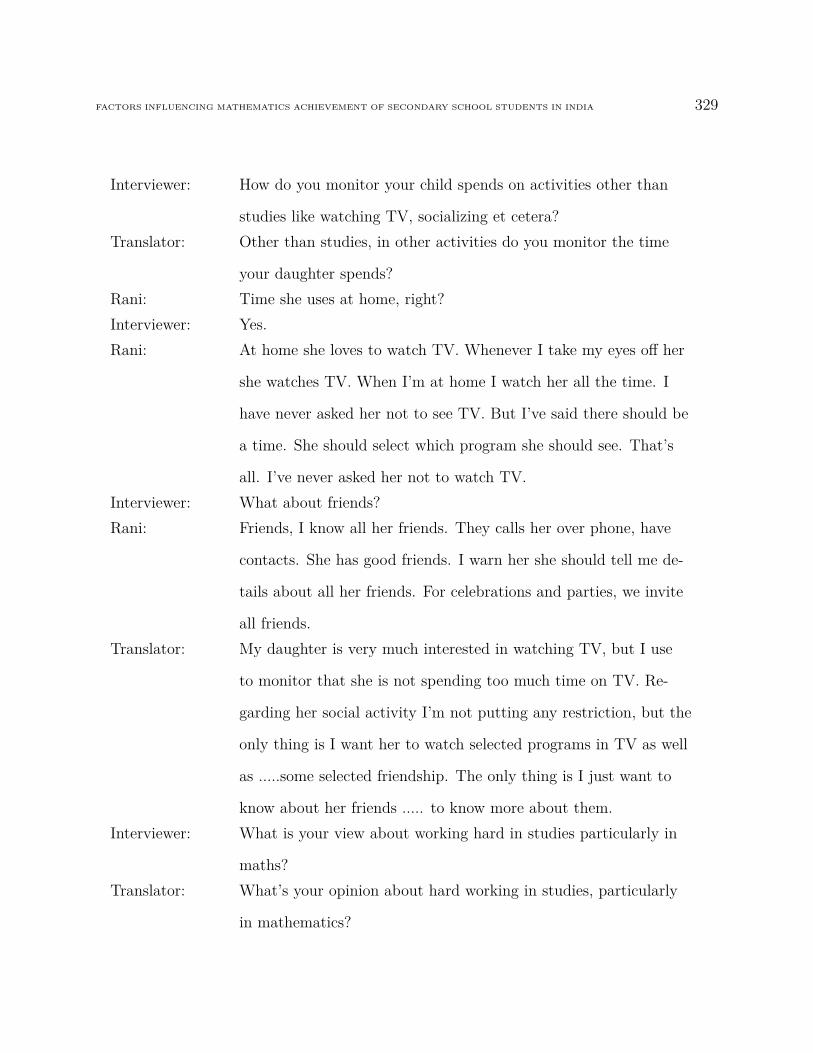
FACTORS INFLUENCING MATHEMATICS ACHIEVEMENT OF SECONDARY SCHOOL STUDENTS IN INDIA 329
Interviewer: How do you monitor your child spends on activities other than
studies like watching TV, socializing et cetera?Translator: Other than studies, in other activities do you monitor the time
your daughter spends?Rani: Time she uses at home, right?Interviewer: Yes.Rani: At home she loves to watch TV. Whenever I take my eyes off her
she watches TV. When I’m at home I watch her all the time. I
have never asked her not to see TV. But I’ve said there should be
a time. She should select which program she should see. That’s
all. I’ve never asked her not to watch TV.Interviewer: What about friends?Rani: Friends, I know all her friends. They calls her over phone, have
contacts. She has good friends. I warn her she should tell me de-
tails about all her friends. For celebrations and parties, we invite
all friends.Translator: My daughter is very much interested in watching TV, but I use
to monitor that she is not spending too much time on TV. Re-
garding her social activity I’m not putting any restriction, but the
only thing is I want her to watch selected programs in TV as well
as .....some selected friendship. The only thing is I just want to
know about her friends ..... to know more about them.Interviewer: What is your view about working hard in studies particularly in
maths?Translator: What’s your opinion about hard working in studies, particularly
in mathematics?
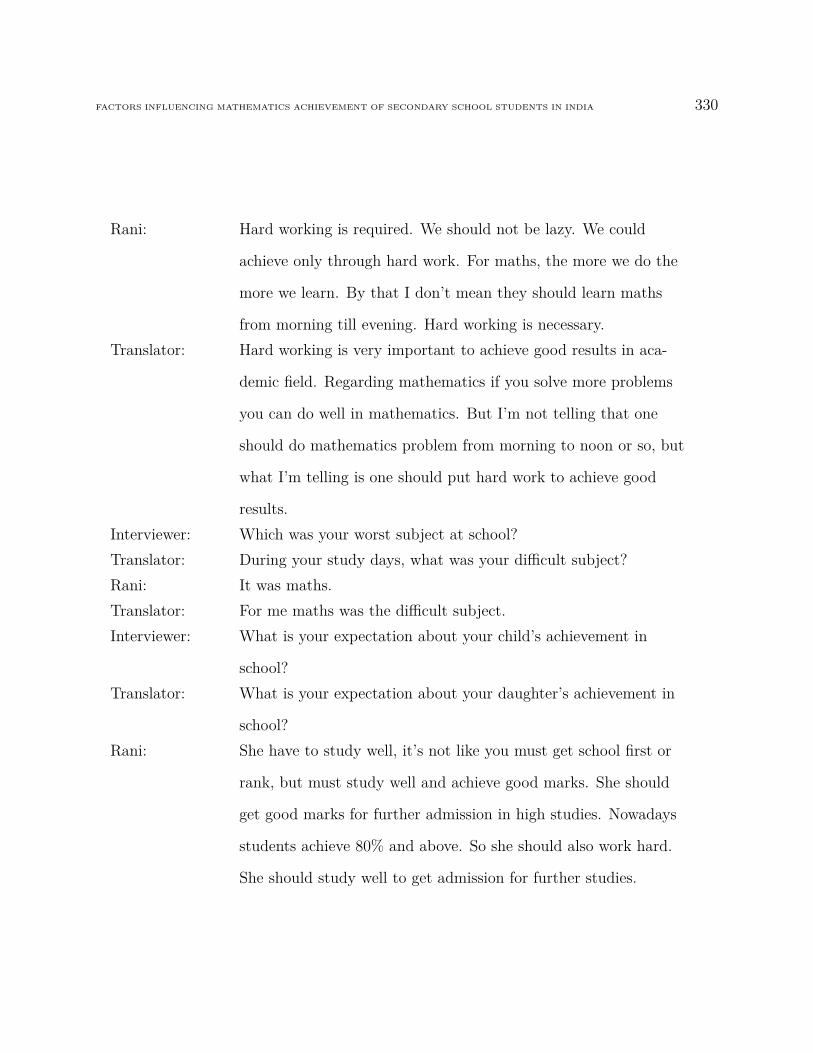
FACTORS INFLUENCING MATHEMATICS ACHIEVEMENT OF SECONDARY SCHOOL STUDENTS IN INDIA 330
Rani: Hard working is required. We should not be lazy. We could
achieve only through hard work. For maths, the more we do the
more we learn. By that I don’t mean they should learn maths
from morning till evening. Hard working is necessary.Translator: Hard working is very important to achieve good results in aca-
demic field. Regarding mathematics if you solve more problems
you can do well in mathematics. But I’m not telling that one
should do mathematics problem from morning to noon or so, but
what I’m telling is one should put hard work to achieve good
results.Interviewer: Which was your worst subject at school?Translator: During your study days, what was your difficult subject?Rani: It was maths.Translator: For me maths was the difficult subject.Interviewer: What is your expectation about your child’s achievement in
school?Translator: What is your expectation about your daughter’s achievement in
school?Rani: She have to study well, it’s not like you must get school first or
rank, but must study well and achieve good marks. She should
get good marks for further admission in high studies. Nowadays
students achieve 80% and above. So she should also work hard.
She should study well to get admission for further studies.
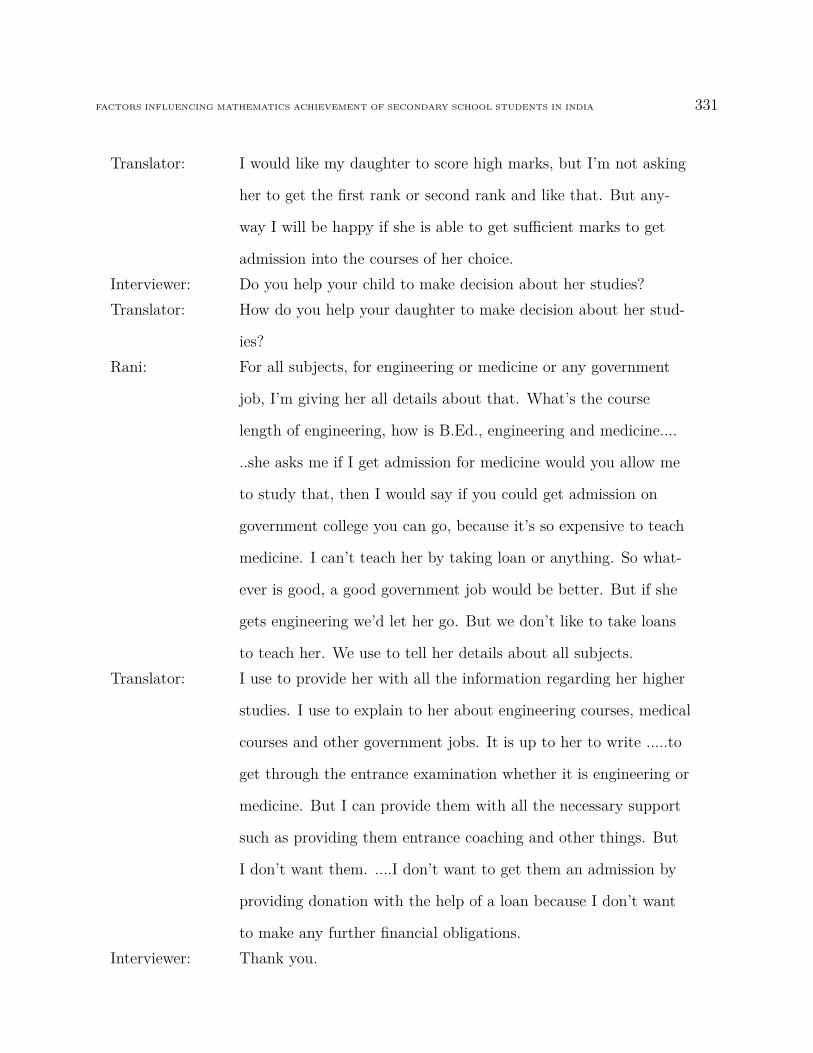
FACTORS INFLUENCING MATHEMATICS ACHIEVEMENT OF SECONDARY SCHOOL STUDENTS IN INDIA 331
Translator: I would like my daughter to score high marks, but I’m not asking
her to get the first rank or second rank and like that. But any-
way I will be happy if she is able to get sufficient marks to get
admission into the courses of her choice.Interviewer: Do you help your child to make decision about her studies?Translator: How do you help your daughter to make decision about her stud-
ies?Rani: For all subjects, for engineering or medicine or any government
job, I’m giving her all details about that. What’s the course
length of engineering, how is B.Ed., engineering and medicine....
..she asks me if I get admission for medicine would you allow me
to study that, then I would say if you could get admission on
government college you can go, because it’s so expensive to teach
medicine. I can’t teach her by taking loan or anything. So what-
ever is good, a good government job would be better. But if she
gets engineering we’d let her go. But we don’t like to take loans
to teach her. We use to tell her details about all subjects.Translator: I use to provide her with all the information regarding her higher
studies. I use to explain to her about engineering courses, medical
courses and other government jobs. It is up to her to write .....to
get through the entrance examination whether it is engineering or
medicine. But I can provide them with all the necessary support
such as providing them entrance coaching and other things. But
I don’t want them. ....I don’t want to get them an admission by
providing donation with the help of a loan because I don’t want
to make any further financial obligations.Interviewer: Thank you.
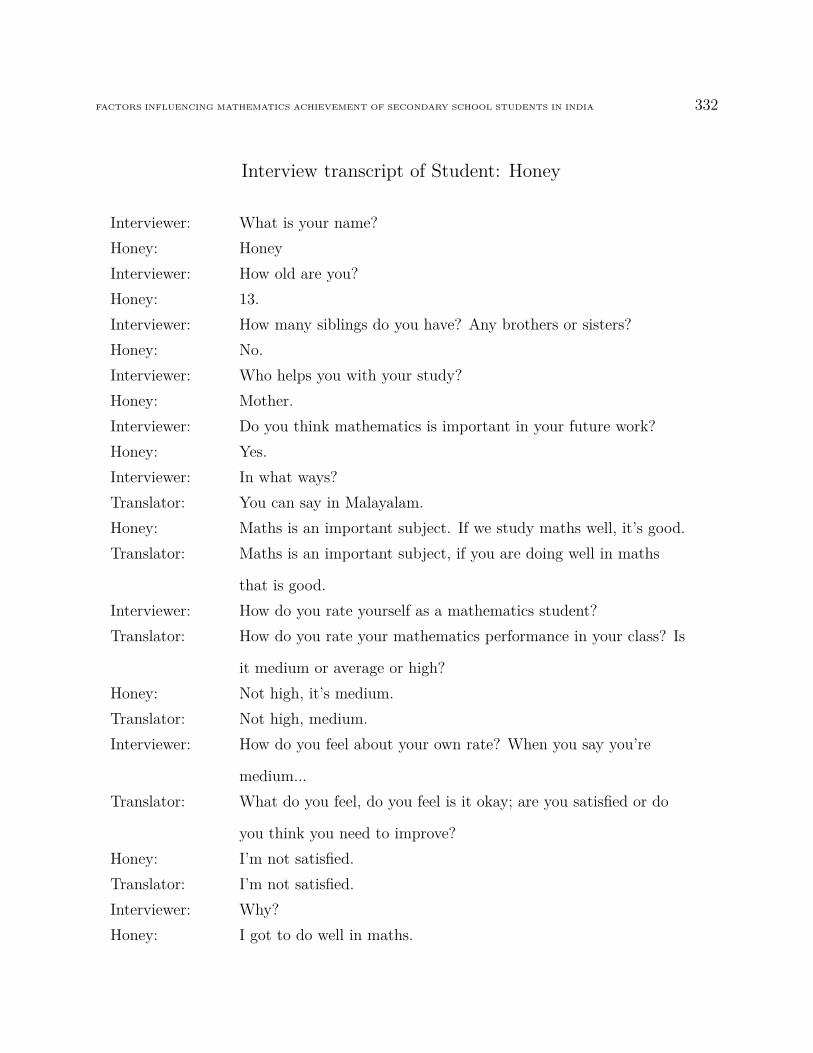
FACTORS INFLUENCING MATHEMATICS ACHIEVEMENT OF SECONDARY SCHOOL STUDENTS IN INDIA 332
Interview transcript of Student: Honey
Interviewer: What is your name?Honey: HoneyInterviewer: How old are you?Honey: 13.Interviewer: How many siblings do you have? Any brothers or sisters?Honey: No.Interviewer: Who helps you with your study?Honey: Mother.Interviewer: Do you think mathematics is important in your future work?Honey: Yes.Interviewer: In what ways?Translator: You can say in Malayalam.Honey: Maths is an important subject. If we study maths well, it’s good.Translator: Maths is an important subject, if you are doing well in maths
that is good.Interviewer: How do you rate yourself as a mathematics student?Translator: How do you rate your mathematics performance in your class? Is
it medium or average or high?Honey: Not high, it’s medium.Translator: Not high, medium.Interviewer: How do you feel about your own rate? When you say you’re
medium...Translator: What do you feel, do you feel is it okay; are you satisfied or do
you think you need to improve?Honey: I’m not satisfied.Translator: I’m not satisfied.Interviewer: Why?Honey: I got to do well in maths.
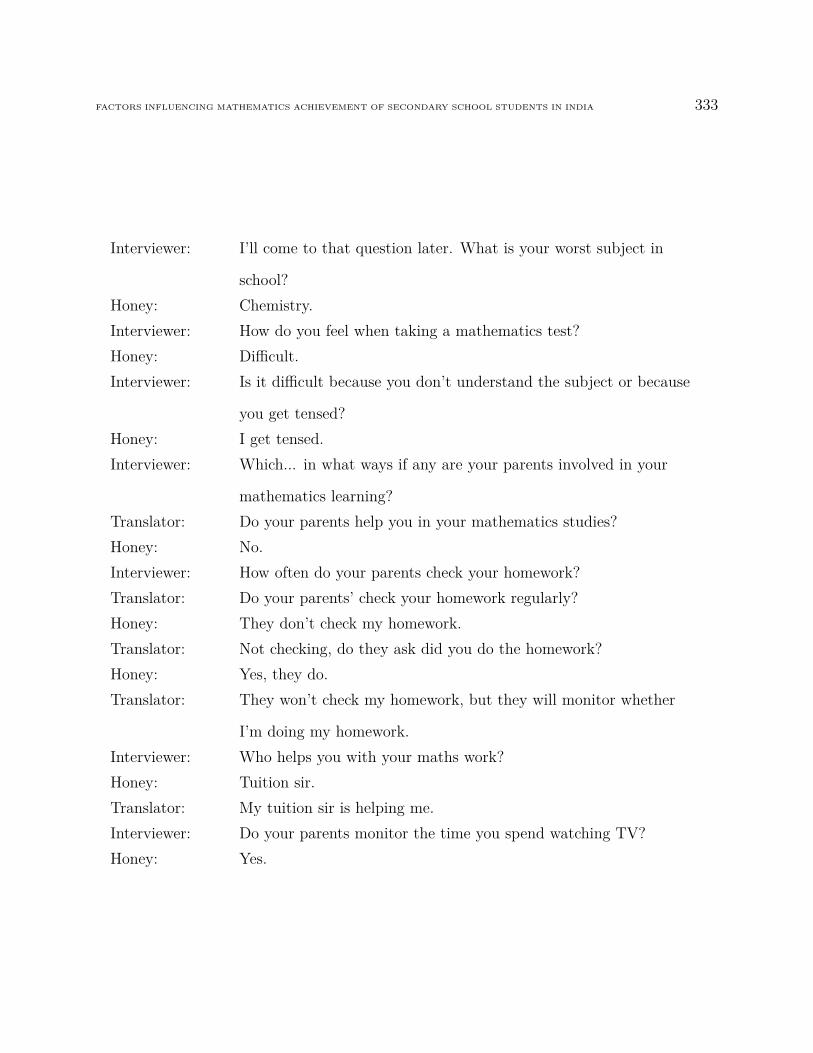
FACTORS INFLUENCING MATHEMATICS ACHIEVEMENT OF SECONDARY SCHOOL STUDENTS IN INDIA 333
Interviewer: I’ll come to that question later. What is your worst subject in
school?Honey: Chemistry.Interviewer: How do you feel when taking a mathematics test?Honey: Difficult.Interviewer: Is it difficult because you don’t understand the subject or because
you get tensed?Honey: I get tensed.Interviewer: Which... in what ways if any are your parents involved in your
mathematics learning?Translator: Do your parents help you in your mathematics studies?Honey: No.Interviewer: How often do your parents check your homework?Translator: Do your parents’ check your homework regularly?Honey: They don’t check my homework.Translator: Not checking, do they ask did you do the homework?Honey: Yes, they do.Translator: They won’t check my homework, but they will monitor whether
I’m doing my homework.Interviewer: Who helps you with your maths work?Honey: Tuition sir.Translator: My tuition sir is helping me.Interviewer: Do your parents monitor the time you spend watching TV?Honey: Yes.

FACTORS INFLUENCING MATHEMATICS ACHIEVEMENT OF SECONDARY SCHOOL STUDENTS IN INDIA 334
Interviewer: Why? Can you say why they’re checking the time you spend
watching TV?Translator: Why do they say you should not watch TV, why do they restrict
those things?Honey: Because studying is very important, so...Interviewer: How do they monitor? They ask you to watch it for half an hour
or...Honey: No, always telling to study. Don’t watch TV all time.Interviewer: What is your parents’ opinion about your achievement in mathe-
matics?Translator: What is your parents’ opinion about your marks you score in
mathematics?Honey: I don’t usually get good marks in maths. Even if I study well and
go to exam, I forget the answers.I don’t know why it’s like that,
maybe due to tension.Translator: Mostly I won’t get good marks in mathematics even though I
study well. But I use to forget whatever I’ve studied during my
exams. I don’t know the reason.Interviewer: What do you want to do when you finish second school? That
means after finishing Year-12.Translator: After your Year-12, what is your ambition?Honey: My ambition is to become a doctor. So maths is not... I think
maths is not important in... to become a doctor.Interviewer: Can you say why you choose that profession? Why you want to
become a doctor? There maybe a reason behind choosing that
profession.Honey: No reason.Interviewer: No reason?

FACTORS INFLUENCING MATHEMATICS ACHIEVEMENT OF SECONDARY SCHOOL STUDENTS IN INDIA 335
Honey: Since... when I was young I used to tell... once my mother was
not well, during that... since that time I used to tell that I want
to become a doctor, but gradually that became my ambition.Translator: To be honest, in the past when my mom was sick I used to tell
I would become a doctor. And so gradually that became my
ambition.Interviewer: What is your view about working hard in studies, particularly in
maths?Translator: What is your opinion about hard working, particularly in mathe-
matics?Honey: Even though I studied well, I don’t achieve well in maths. For ex-
ample, for this exam even though I studied well I couldn’t achieve
well. When I see the maths question paper, I feel tensed and my
mind goes blank.Translator: I think that even though I study very well I feel that there is no
use in that because when I sit in the mathematics exam I feel
everything is blank, I’m not able to do well in maths.Interviewer: What do you think is your parents’ expectation about your
achievement in mathematics?Translator: What do you think your parents’ feel when you see your maths
marks and grade, and reports and such that?Honey: They are sad.Interviewer: They are not...Honey: They are not satisfied.Translator: They are not happy. They are not satisfied.Interviewer: What do you think your parents would like you to do when you
finish secondary school?Translator: What do you think your parents’ like you to learn after finishing
secondary school?
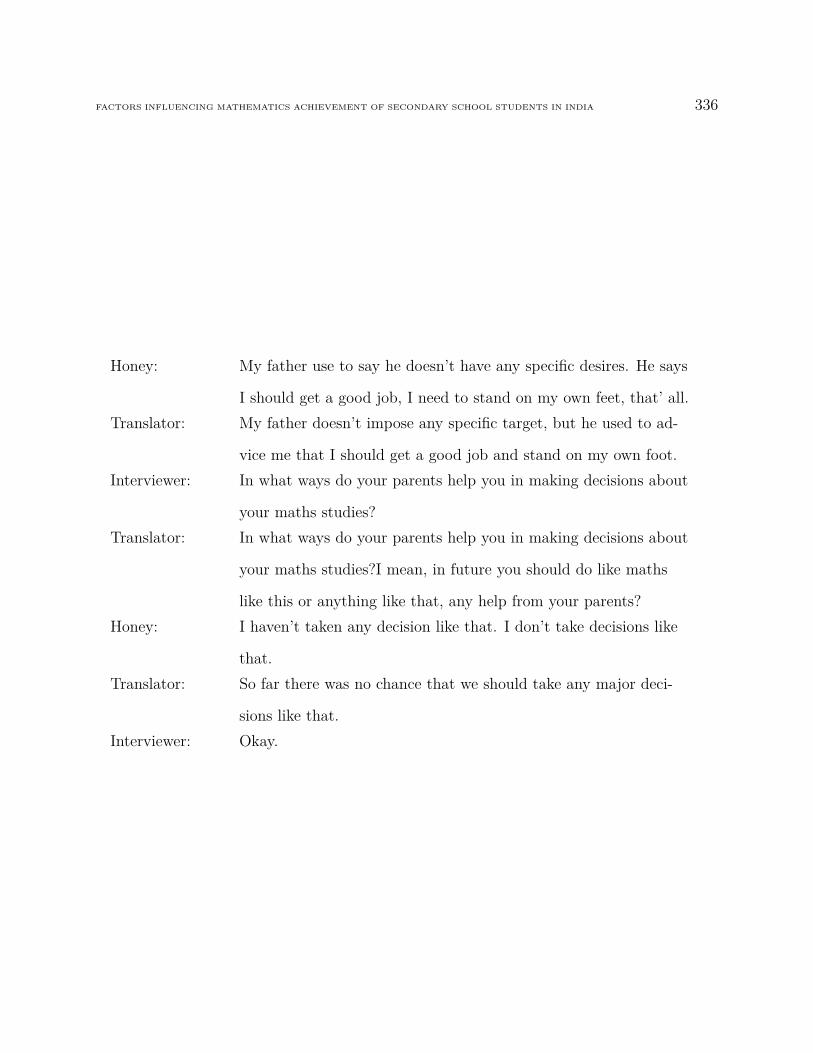
FACTORS INFLUENCING MATHEMATICS ACHIEVEMENT OF SECONDARY SCHOOL STUDENTS IN INDIA 336
Honey: My father use to say he doesn’t have any specific desires. He says
I should get a good job, I need to stand on my own feet, that’ all.Translator: My father doesn’t impose any specific target, but he used to ad-
vice me that I should get a good job and stand on my own foot.Interviewer: In what ways do your parents help you in making decisions about
your maths studies?Translator: In what ways do your parents help you in making decisions about
your maths studies?I mean, in future you should do like maths
like this or anything like that, any help from your parents?Honey: I haven’t taken any decision like that. I don’t take decisions like
that.Translator: So far there was no chance that we should take any major deci-
sions like that.Interviewer: Okay.
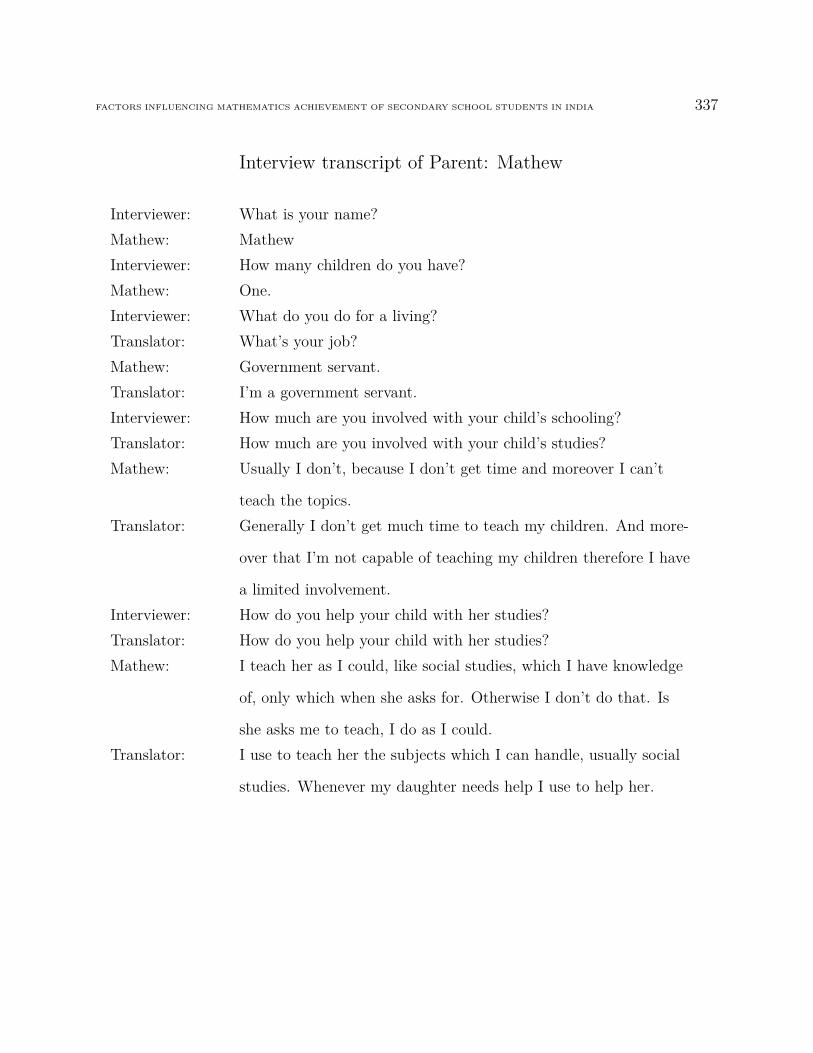
FACTORS INFLUENCING MATHEMATICS ACHIEVEMENT OF SECONDARY SCHOOL STUDENTS IN INDIA 337
Interview transcript of Parent: Mathew
Interviewer: What is your name?Mathew: MathewInterviewer: How many children do you have?Mathew: One.Interviewer: What do you do for a living?Translator: What’s your job?Mathew: Government servant.Translator: I’m a government servant.Interviewer: How much are you involved with your child’s schooling?Translator: How much are you involved with your child’s studies?Mathew: Usually I don’t, because I don’t get time and moreover I can’t
teach the topics.Translator: Generally I don’t get much time to teach my children. And more-
over that I’m not capable of teaching my children therefore I have
a limited involvement.Interviewer: How do you help your child with her studies?Translator: How do you help your child with her studies?Mathew: I teach her as I could, like social studies, which I have knowledge
of, only which when she asks for. Otherwise I don’t do that. Is
she asks me to teach, I do as I could.Translator: I use to teach her the subjects which I can handle, usually social
studies. Whenever my daughter needs help I use to help her.

FACTORS INFLUENCING MATHEMATICS ACHIEVEMENT OF SECONDARY SCHOOL STUDENTS IN INDIA 338
Interviewer: How often do you check her homework?Translator: Do you check your daughter’s homework often?Mathew: No.Translator: No, I don’t check her homework.Interviewer: How do you help your child with the maths studies?Translator: Do you check your daughter’s maths homework?Mathew: I don’t know, so I don’t check.Translator: I’m unable to teach her maths therefore I don’t check her maths
homework.Interviewer: Do you check the assessment result of your child in mathematics?Translator: Do you check your daughter’s progress report and marks?Mathew: Yes, I do.Translator: I use to check her marks.Interviewer: What’s your opinion about your child’s achievement in mathe-
matics?Translator: What’s your opinion about your daughter’s achievement in math-
ematics?Mathew: For maths, she is not that good. So I’ve a little tension about it,
but I can’t teach her maths. So I’ve arranged tuition for maths
and tell her to study well on maths.Translator: Her marks in mathematics are low and I’m a little bit worried
about that. I can’t teach her mathematics, but I have given her
tuition to help improve her mathematics studies.Interviewer: How do you monitor the time your child spends on activities
other than studies like watching TV, playing games or socializing
et cetera?
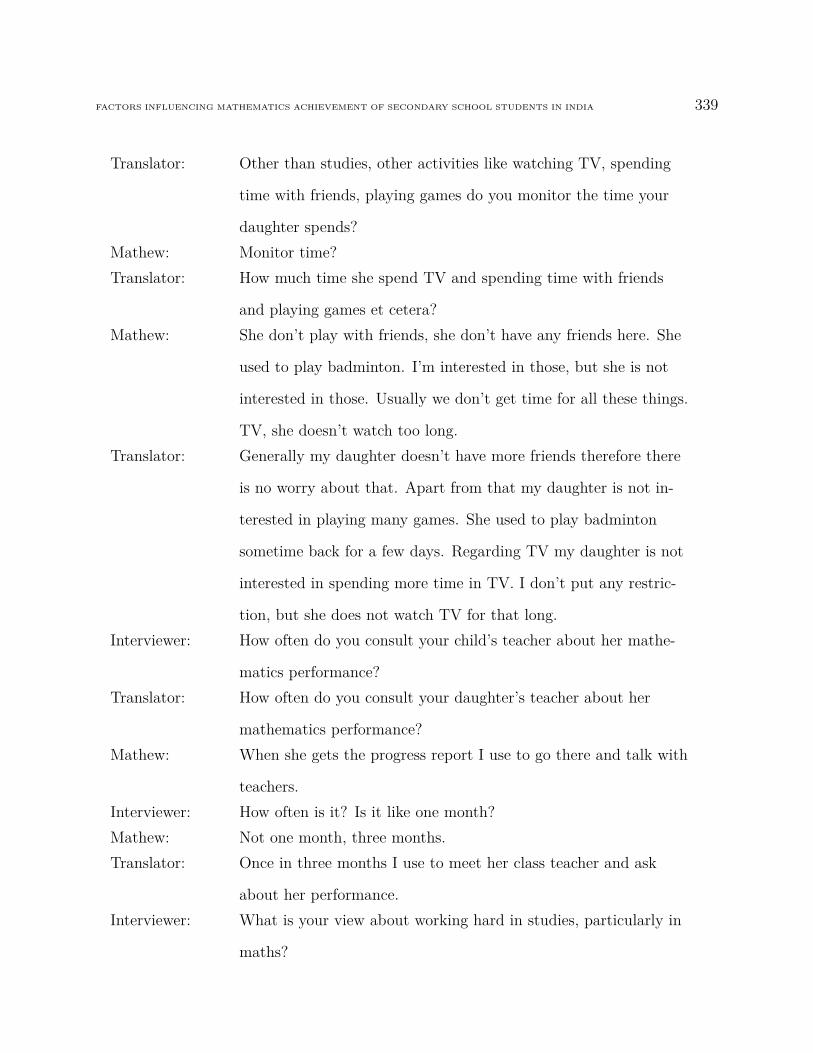
FACTORS INFLUENCING MATHEMATICS ACHIEVEMENT OF SECONDARY SCHOOL STUDENTS IN INDIA 339
Translator: Other than studies, other activities like watching TV, spending
time with friends, playing games do you monitor the time your
daughter spends?Mathew: Monitor time?Translator: How much time she spend TV and spending time with friends
and playing games et cetera?Mathew: She don’t play with friends, she don’t have any friends here. She
used to play badminton. I’m interested in those, but she is not
interested in those. Usually we don’t get time for all these things.
TV, she doesn’t watch too long.Translator: Generally my daughter doesn’t have more friends therefore there
is no worry about that. Apart from that my daughter is not in-
terested in playing many games. She used to play badminton
sometime back for a few days. Regarding TV my daughter is not
interested in spending more time in TV. I don’t put any restric-
tion, but she does not watch TV for that long.Interviewer: How often do you consult your child’s teacher about her mathe-
matics performance?Translator: How often do you consult your daughter’s teacher about her
mathematics performance?Mathew: When she gets the progress report I use to go there and talk with
teachers.Interviewer: How often is it? Is it like one month?Mathew: Not one month, three months.Translator: Once in three months I use to meet her class teacher and ask
about her performance.Interviewer: What is your view about working hard in studies, particularly in
maths?

FACTORS INFLUENCING MATHEMATICS ACHIEVEMENT OF SECONDARY SCHOOL STUDENTS IN INDIA 340
Translator: What is your opinion about working hard in studies, particularly
in maths?Mathew: To my knowledge, maths needs hard work. For maths, children
should work hard. They should repeatedly do them to improve.Interviewer: Do you think students should work hard in all subjects...Mathew: More than any other subjects, I think maths needs hard working.Translator: I feel that working hard is very important for mathematics. And
specifically compared with other subjects mathematics requires
hard work.Interviewer: Which was your worst subject in school?Translator: During your school days, what was your difficult subject?Mathew: It was maths.Translator: Maths was my worst subject.Interviewer: What is your expectation about your child’s achievement in
school?Translator: What is your expectation about your daughter’s achievement in
school?Mathew: I wish she should study very well. There is no particular aim,
like becoming an engineer, or doctor , I don’t think so. What
she is interested she should study, what she could do. Not all
people can get become a collector or become an police officer, so
according to her interest she should study. It’s not like she should
not study anything. She should study according to her interest.
That’s my wish.

FACTORS INFLUENCING MATHEMATICS ACHIEVEMENT OF SECONDARY SCHOOL STUDENTS IN INDIA 341
Translator: Generally I don’t impose a specific target for my daughter. I
don’t say that she should become an engineer or a doctor or an
administrative officer, but depending upon her capability she
should be able to do well to achieve according to her capabilities.Interviewer: How do you encourage your child in her studies?Translator: How do you encourage your daughter in her studies?Mathew: Particularly... I don’t... it’s not me who actually looks all her
subjects, it’s her mother. So she helps her most. Helps from my
side are less. I take her to tuition, buys books for her. Usually
I can’t handle these subjects, so I don’t involve much in it. As I
said earlier, I help her in social studies only if she asks me.Translator: Generally I don’t get involved much in my daughter’s education,
usually it is her mother who advice her regarding her studies. I
use to help her in all ways I can like purchasing the books and
taking her to tuition and so on. And with my limited capabilities
I use to teach her social studies and other subjects which I’m
capable of teaching her.

FACTORS INFLUENCING MATHEMATICS ACHIEVEMENT OF SECONDARY SCHOOL STUDENTS IN INDIA 342
Appendix L: Overall Item Fit Statistics- Students
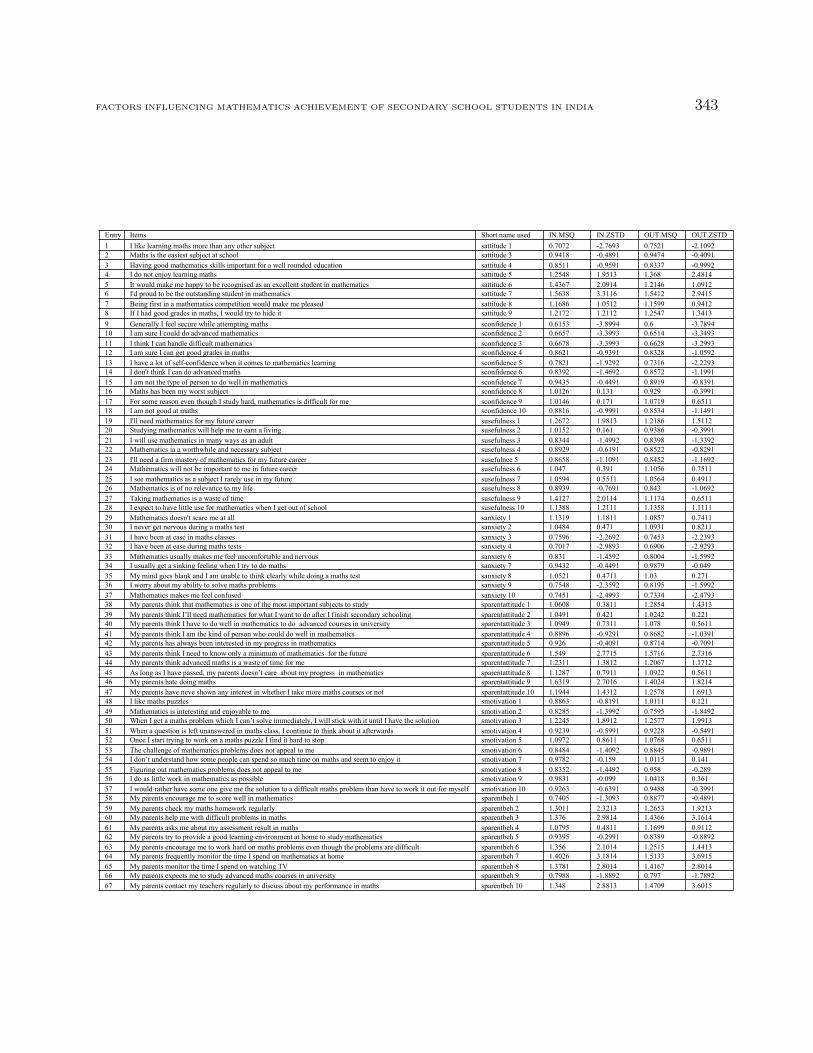
FACTORS INFLUENCING MATHEMATICS ACHIEVEMENT OF SECONDARY SCHOOL STUDENTS IN INDIA 343
Entry Items Short name used IN.MSQ IN.ZSTD OUT.MSQ OUT.ZSTD1 I like learning maths more than any other subject sattitude 1 0.7072 2.7693 0.7521 2.10922 Maths is the easiest subject at school sattitude 3 0.9418 0.4891 0.9474 0.40913 Having good mathematics skills important for a well rounded education sattitude 4 0.8511 0.9591 0.8337 0.99924 I do not enjoy learning maths sattitude 5 1.2548 1.9513 1.368 2.48145 It would make me happy to be recognised as an excellent student in mathematics sattitude 6 1.4367 2.0914 1.2146 1.09126 I'd proud to be the outstanding student in mathematics sattitude 7 1.5638 3.3116 1.5412 2.94157 Being first in a mathematics competition would make me pleased sattitude 8 1.1686 1.0512 1.1599 0.94128 If I had good grades in maths, I would try to hide it sattitude 9 1.2172 1.2112 1.2547 1.34139 Generally I feel secure while attempting maths sconfidence 1 0.6153 3.8994 0.6 3.789410 I am sure I could do advanced mathematics sconfidence 2 0.6657 3.3993 0.6514 3.349311 I think I can handle difficult mathematics sconfidence 3 0.6678 3.3993 0.6628 3.299312 I am sure I can get good grades in maths sconfidence 4 0.8621 0.9391 0.8328 1.059213 I have a lot of selfconfidence when it comes to mathematics learning sconfidence 5 0.7821 1.9292 0.7316 2.229314 I don't think I can do advanced maths sconfidence 6 0.8392 1.4692 0.8572 1.199115 I am not the type of person to do well in mathematics sconfidence 7 0.9435 0.4491 0.8919 0.839116 Maths has been my worst subject sconfidence 8 1.0126 0.131 0.929 0.399117 For some reason even though I study hard, mathematics is difficult for me sconfidence 9 1.0146 0.171 1.0719 0.651118 I am not good at maths sconfidence 10 0.8816 0.9991 0.8534 1.149119 I'll need mathematics for my future career susefulness 1 1.2672 1.9813 1.2186 1.511220 Studying mathematics will help me to earn a living susefulness 2 1.0152 0.161 0.9386 0.399121 I will use mathematics in many ways as an adult susefulness 3 0.8344 1.4992 0.8398 1.339222 Mathematics ia a worthwhile and necessary subject susefulness 4 0.8929 0.6191 0.8522 0.829123 I'll need a firm mastery of mathematics for my future career susefulnee 5 0.8658 1.1091 0.8452 1.169224 Mathematics will not be important to me in future career susefulness 6 1.047 0.391 1.1056 0.751125 I see mathematics as a subject I rarely use in my future susefulness 7 1.0594 0.5511 1.0564 0.491126 Mathematics is of no relevance to my life susefulness 8 0.8939 0.7691 0.843 1.069227 Taking mathematics is a waste of time susefulness 9 1.4127 2.0114 1.1174 0.651128 I expect to have little use for mathematics when I get out of school susefulness 10 1.1388 1.2111 1.1358 1.111129 Mathematics doesn't scare me at all sanxiety 1 1.1319 1.1811 1.0857 0.741130 I never get nervous during a maths test sanxiety 2 1.0484 0.471 1.0931 0.821131 I have been at ease in maths classes sanxiety 3 0.7596 2.2692 0.7453 2.239332 I have been at ease during maths tests sanxiety 4 0.7017 2.9893 0.6906 2.929333 Mathematics usually makes me feel uncomfortable and nervous sanxiety 6 0.831 1.4592 0.8004 1.599234 I usually get a sinking feeling when I try to do maths sanxiety 7 0.9432 0.4491 0.9879 0.04935 My mind goes blank and I am unable to think clearly while doing a maths test sanxiety 8 1.0521 0.4711 1.03 0.27136 I worry about my ability to solve maths problems sanxiety 9 0.7548 2.3592 0.8195 1.599237 Mathematics makes me feel confused sanxiety 10 0.7451 2.4993 0.7334 2.479338 My parents think that mathematics is one of the most important subjects to study sparentattitude 1 1.0608 0.3811 1.2854 1.431339 My parents think I’ll need mathematics for what I want to do after I finish secondary schooling sparentattitude 2 1.0491 0.421 1.0242 0.22140 My parents think I have to do well in mathematics to do advanced courses in university sparentattitude 3 1.0949 0.7311 1.078 0.561141 My parents think I am the kind of person who could do well in mathematics sparentattitude 4 0.8896 0.9291 0.8682 1.039142 My parents has always been interested in my progress in mathematics sparentattitude 5 0.926 0.4091 0.8714 0.709143 My parents think I need to know only a minimum of mathematics for the future sparentattitude 6 1.549 2.7715 1.5716 2.731644 My parents think advanced maths is a waste of time for me sparentattitude 7 1.2311 1.3812 1.2067 1.171245 As long as I have passed, my parents doesn’t care about my progress in mathematics sparentattitude 8 1.1287 0.7911 1.0922 0.561146 My parents hate doing maths sparentattitude 9 1.6319 2.7016 1.4024 1.821447 My parents have neve shown any interest in whether I take more maths courses or not sparentattitude 10 1.1944 1.4312 1.2578 1.691348 I like maths puzzles smotivation 1 0.8863 0.8191 1.0111 0.12149 Mathematics is interesting and enjoyable to me smotivation 2 0.8285 1.3992 0.7595 1.849250 When I get a maths problem which I can’t solve immediately, I will stick with it until I have the solution smotivation 3 1.2245 1.8912 1.2577 1.991351 When a question is left unanswered in maths class, I continue to think about it afterwards smotivation 4 0.9239 0.5991 0.9228 0.549152 Once I start trying to work on a maths puzzle I find it hard to stop smotivation 5 1.0972 0.8611 1.0768 0.651153 The challenge of mathematics problems does not appeal to me smotivation 6 0.8484 1.4092 0.8845 0.989154 I don’t understand how some people can spend so much time on maths and seem to enjoy it smotivation 7 0.9782 0.159 1.0115 0.14155 Figuring out mathematics problems does not appeal to me smotivation 8 0.8352 1.4492 0.958 0.28956 I do as little work in mathematics as possible smotivation 9 0.9831 0.099 1.0418 0.36157 I would rather have some one give me the solution to a difficult maths problem than have to work it out for myself smotivation 10 0.9263 0.6391 0.9488 0.399158 My parents encourage me to score well in mathematics sparentbeh 1 0.7405 1.3093 0.8877 0.489159 My parents check my maths homework regularly sparentbeh 2 1.3011 2.3213 1.2653 1.921360 My parents help me with difficult problems in maths sparentbeh 3 1.376 2.9814 1.4366 3.161461 My parents asks me about my assessment result in maths sparentbeh 4 1.0795 0.4811 1.1699 0.911262 My parents try to provide a good learning environment at home to study mathematics sparentbeh 5 0.9395 0.2991 0.8389 0.889263 My parents encourage me to work hard on maths problems even though the problems are difficult sparentbeh 6 1.356 2.1014 1.2515 1.441364 My parents frequently monitor the time I spend on mathematics at home sparentbeh 7 1.4026 3.1814 1.5133 3.691565 My parents monitor the time I spend on watching TV sparentbeh 8 1.3781 2.8014 1.4167 2.801466 My parents expects me to study advanced maths courses in university sparentbeh 9 0.7988 1.8892 0.797 1.789267 My parents contact my teachers regularly to discuss about my performance in maths sparentbeh 10 1.348 2.8813 1.4709 3.6015

FACTORS INFLUENCING MATHEMATICS ACHIEVEMENT OF SECONDARY SCHOOL STUDENTS IN INDIA 344
Appendix M: Overall Item Fit Statistics- Parents

FACTORS INFLUENCING MATHEMATICS ACHIEVEMENT OF SECONDARY SCHOOL STUDENTS IN INDIA 345
Entry Name Short name used IN.MSQ IN.ZSTD OUT.MSQ OUT.ZSTD1 I think that mathematics is one of the most important subjects to study pattitude 1 0.9476 ‐0.2391 0.9306 ‐0.36912 I think that my child will need good understanding in mathematics for what he/ she wants to do after finishing secondary schooling pattitude 2 1.4119 2.3014 1.4218 2.27143 I think that my child has to do well in mathematics to do advanced courses in university pattitude 3 0.8081 ‐1.2692 0.883 ‐0.68914 I think that my child is the kind of person who could do well in mathematics pattitude 4 0.7786 ‐1.5092 0.7979 ‐1.27925 I think that my child needs to know only a minimum of maths for the future pattitude 5 1.5008 2.6915 1.9683 4.5426 I think that advanced maths is a waste of time for my child pattitude 6 0.9688 ‐0.119 0.9453 ‐0.25917 I think that my child needs only a pass in maths pattitude 7 1.4409 2.1514 1.543 2.74158 I am not concerned whether my child takes more maths courses in future pattitude 8 1.0552 0.5111 1.1122 0.88119 I hate to do mathematics pattitude 9 0.7469 ‐1.4493 0.6643 ‐2.109310 I am not concerned with the progress of my child in mathematics pattitude 10 1.1663 0.9212 1.1912 1.091211 I encourage my child to achieve high marks in mathematics pparentbeh 1 1.0779 0.4811 0.9719 ‐0.10912 I regularly check my child’s maths homework pparentbeh 2 1.1315 1.1411 1.2893 2.091313 I help my child with difficult problems in mathematics pparentbeh 3 0.826 ‐1.5892 0.8077 ‐1.579214 I regularly checks my child’s assessment results in mathematics pparentbeh 4 1.1006 0.7611 1.2118 1.381215 I try to provide my child with a good learning environment at home to study mathematics pparentbeh 5 0.7406 ‐1.5293 0.7008 ‐1.849316 I encourage my child to work hard on maths problems even when the problems are difficult pparentbeh 6 0.8549 ‐0.7791 0.7995 ‐1.169217 I frequently monitor the time my child spends on mathematics at home pparentbeh 7 0.9355 ‐0.5191 1.0672 0.551118 I try to monitor the time my child spends on watching TV pparentbeh 8 1.3164 2.0213 1.4623 2.641519 I try to contact my child’s teachers regularly to discuss about his/her performance in mathematics pparentbeh 9 1.1199 1.0711 1.3423 2.511320 I try to encourage my child to study well at school pparentbeh 10 1.2516 1.3813 1.1907 1.131221 Mathematics doesn’t scare me at all panxiety 1 1.0893 0.8111 1.0847 0.691122 As a student, I was never nervous during a maths test panxiety 2 1.289 2.3913 1.2317 1.761223 As a student, I usually have been at ease in maths classes panxiety 3 0.873 ‐1.1091 0.957 ‐0.29924 As a student, I usually have been at ease during maths test panxiety 4 0.8272 ‐1.6092 0.8196 ‐1.489225 Mathematics usually makes me feel uncomfortable and nervous panxiety 5 0.9427 ‐0.4191 0.9385 ‐0.399126 I usually get a sinking feeling when I try to do maths panxiety 6 1.0721 0.6111 1.0914 0.691127 Mathematics makes me feel confused panxiety 7 0.7591 ‐2.0692 0.7459 ‐1.969328 As a student my mind went blank and I was unable to think clearly while taking a maths test panxiety 8 0.9455 ‐0.3691 1.1053 0.741129 I worry about my ability to solve maths problems panxiety 9 0.9205 ‐0.6891 0.9435 ‐0.419130 I expect my child to work hard and do well at school pexpectation 1 1.1702 0.9312 1.091 0.561131 I think that my child will study advanced maths courses in university pexpectation 2 0.8601 ‐1.2191 1.1041 0.821132 I expect my child to get good grades in mathematics at school pexpectation 3 0.9033 ‐0.4791 0.8698 ‐0.729133 I expect my child to go for university studies after finishing school pexpectation 4 1.059 0.4011 1.1627 0.9612