Losing Weight with Five A’s (5 A’s): Assess, Advise, Agree ...

FACTORS POSITIVELY AFFECTING BEER A’S BRAND
PREFERENCE OF CUSTOMERS IN BANGKOK

FACTORS POSITIVELY AFFECTING BEER A’S BRAND
PREFERENCE OF CUSTOMERS IN BANGKOK
Sunkamol Khongsawatvorakul
This Independent Study Manuscript Presented to
The Graduate School of Bangkok University
in Partial Fulfillment
of the Requirements for the Degree
Master of Business Administration
2017

©2017
Sunkamol Khongsawatvorakul
All Rights Reserved


Khongsawatvorakul, S. M.B.A., May 2017, Graduate School, Bangkok University.
Factors Positively Affecting Beer A’s Brand Preference of Customers in Bangkok
(163 pp.)
Advisor: Penjira Kanthawongs, Ph.D.
ABSTRACT
The researcher studied the positive influence of beer characteristic, branding,
beer types, situation appropriateness statements, packaging, social media, country of
origin, and convenient and practical functions towards beer A’s brand preference of
customers in Bangkok. The population of this study was people who were over 18
years of age and had experience in drinking beer for either once or on regular basis in
Chatuchak, Wattana, and Bang Rak Districts in Bangkok. The sample of this research
was 230 questionnaire respondents distributed at the Energy Complex Building,
Emporium Office Building, and Sathon Square Building between the December 2016
and January 2017. The sample size was gathered using the non-probability sampling
methods in terms of convenience sampling by collecting data only with respondents who
were willing to cooperate with the researcher by completing the questionnaires. The data
analyzed using descriptive statistics and multiple regression analysis were found that
branding (β = 0.596) and social media (β = 0.197) were positively affected brand
preference of the beer brand A’s consumers in Bangkok at .01 level of significant,
explaining 49% of the influence towards brand preference of the customers. However,
beer characteristic, beer types, situation appropriateness statements, packaging, social

media, country of origin, and convenient and practical functions were not found to be
significantly affected brand preference of beer brand A’s customers in Bangkok.
Keywords: Brand Preference, Beer, Social Media, Bangkok

vi
ACKNOWLEDGMENT
I would like to express my gratitude to those who supported this Independent
Study. It would not be successful without the supports, advice and assistance from
everyone for the past two years.
First, I would like to thank Dr. Penjira Kanthawongs who was the advisor of
this research for her time, dedication, efforts, and guidance on this Independent Study.
She also encouraged me to participate in the 5th Annual National Conference on
Business and Accounting at Kasetsart University. This great opportunity is an honor
to my family. Besides, I would like to thank all professors from MBA International
Program at Bangkok University for knowledge and encouragement.
I sincerely thank BASF (THAI) who believes in my potential and offered me a
scholarship for Master of Business Administration. I deeply thank Ms. Kawmai
Tonveerachaisakul, Head of Finance Planning & Analysis at Boonrawd Trading and
Mr. Kongkit Kanchanavatee, Operation Manager of the beer Industry Company, who
dedicated their valuable times to review and correct the questionnaire.
My appreciation also goes to my classmate, Mr. Yossawut Laowicharath, Ms.
Wanvitoo Lerkitjanuwat, and Ms. Wiparat Tanjaiwang for their help and support
during two academic years.
The last appreciation is to my family for their understanding and support,
which driving me to complete this Independent Study.
Sunkamol Khongsawatvorakul
vii
TABLE OF CONTENTS
Page
ABSTRACT iv
ACKNOWLEDGMENT vi
LIST OF TABLES x
LIST OF FIGURES xv
CHAPTER 1: INTRODUCTION 1
1.1 Background 1
1.2 SWOT Analysis 9
1.3 Statement of Problem 15
1.4 Objective of Research 15
1.5 Scope of Research 16
1.6 Research Question 16
1.7 Significant of Research 17
1.8 Limitations of Research 17
1.9 Definition of terms 17
CHAPTER 2: LITERATURE REVIEW 20
2.1 Concept Theories of Beer Characteristic 20
2.2 Concept Theories of Branding 22
2.3 Concept Theories of Beer Types 23
2.4 Concept Theories of Situation Appropriateness Statements 24
2.5 Concept Theories of Packaging 26
2.6 Concept Theories of Social Media 27
2.7 Concept Theories of Country of Origin 29

viii
TABLE OF CONTENTS (Continued)
Page
CHAPTER 2: LITERATURE REVIEW (Continued)
2.8 Concept Theories of Convenient and Practical Functions 30
2.9 Concept Theories of Brand Preference 32
2.10 Related Documents and Previous Researches 33
2.11 Hypothesis 39
2.12 Variable used in Research 40
2.13 Theoretical Framework 41
CHAPTER 3: RESEARCH METHODOLOGY 42
3.1 Research Design 42
3.2 Population and Sample Selection 42
3.3 Research Instrument 43
3.4 Testing Research Instrument 47
3.5 Data Collection 53
3.6 Preparation and Data Analysis 54
3.7 Statistic Method 55
CHAPTER 4: DATA PRESENTATION 60
4.1 Demographic Data 61
4.2 Mean, Standard Deviation and Respondents perception 87
4.3 Analysis of the data based on assumptions 96
4.4 Other Analysis 104
CHAPTER 5: CONCLUSIONS AND RECOMMENDATIONS 108
5.1 Summary of Study 108

ix
TABLE OF CONTENTS (Continued)
Page
CHAPTER 5: CONCLUSIONS AND RECOMMENDATIONS (Continued)
5.2 Hypothesis Assumption 108
5.3 Summary 111
5.4 Recommendations 116
BIBLIOGRAPHY 121
APPENDIX A Survey Questions (English) 132
APPENDIX B Survey Questions (Thai) 142
APPENDIX C Form to Expert Letter 150
BIODATA 163
LICENSE AGREEMENT OF DISSERTATION INDEPENDENT STUDY

x
LIST OF TABLES
Page
Table 1.1: Statistic of Number of Beer Production and Domestic Sales
in Thailand 2
Table 1.2: Singha, Chang, and Heineken SWOT Analysis 9
Table 3.1: Factor Analysis of factors positively affecting beer A’s brand
preference of customers in Bangkok 48
Table 3.2: ANOVA Analysis 58
Table 4.1: Analysis of frequency and percentage in gender 61
Table 4.2: Analysis of frequency and percentage in age 62
Table 4.3: Analysis of frequency and percentage in status 63
Table 4.4: Analysis of frequency and percentage in level of education 63
Table 4.5: Analysis of frequency and percentage in monthly income 64
Table 4.6: Analysis of frequency and percentage in professional status
occupation 65
Table 4.7: Analysis of frequency and percentage in the respondent’s
behavior to frequently drink beer 66
Table 4.8: Analysis of frequency and percentage in the respondent’s
behavior to frequently drink wine 67
Table 4.9: Analysis of frequency and percentage in the respondent’s
behavior to frequently drink whisky 67
Table 4.10: Analysis of frequency and percentage in the respondent’s
behavior to frequently drink vodka 68

xi
LIST OF TABLES (Continued)
Page
Table 4.11: Analysis of frequency and percentage in the respondent’s
behavior to frequently drink others alcohol beverage 69
Table 4.12: Analysis of frequency and percentage in favorite beer for
Heineken brand 69
Table 4.13: Analysis of frequency and percentage in favorite beer for
Singha brand 70
Table 4.14: Analysis of frequency and percentage in favorite beer for
Leo brand 70
Table 4.15: Analysis of frequency and percentage in favorite beer for
Chang brand 71
Table 4.16: Analysis of frequency and percentage in favorite beer for
Carlsberg brand 71
Table 4.17: Analysis of frequency and percentage in favorite beer for
San Miguel 72
Table 4.18: Analysis of frequency and percentage in favorite beer for
Hitachino Nest 72
Table 4.19: Analysis of frequency and percentage in favorite beer for
Estrella Damm 73
Table 4.20: Analysis of frequency and percentage in favorite beer for
Hoegaarden 73
Table 4.21: Analysis of frequency and percentage in favorite beer for
Guinness 74

xii
LIST OF TABLES (Continued)
Page
Table 4.22: Analysis of frequency and percentage in favorite beer for Leffe 74
Table 4.23: Analysis of frequency and percentage in favorite beer for
Stella Artois 75
Table 4.24: Analysis of frequency and percentage in favorite beer for Tiger 75
Table 4.25: Analysis of frequency and percentage in favorite beer for
A.K. Damm 76
Table 4.26: Analysis of frequency and percentage in favorite beer for
others brand 76
Table 4.27: Analysis of frequency and percentage in frequency of
beer consumption 77
Table 4.28: Analysis of frequency and percentage in consume beer on Monday 78
Table 4.29: Analysis of frequency and percentage in consume beer on Tuesday 79
Table 4.30: Analysis of frequency and percentage in consume beer on
Wednesday 79
Table 4.31: Analysis of frequency and percentage in consume beer on Thursday 80
Table 4.32: Analysis of frequency and percentage in consume beer on Friday 80
Table 4.33: Analysis of frequency and percentage in consume beer on Saturday 81
Table 4.34: Analysis of frequency and percentage in consume beer on Sunday 81
Table 4.35: Analysis of frequency and percentage in weekly expenditure of
beer 82
Table 4.36: Analysis of frequency and percentage in self-influence on
beer purchasing 83

xiii
LIST OF TABLES (Continued)
Page
Table 4.37: Analysis of frequency and percentage in the influence of
Families on beer purchasing 84
Table 4.38: Analysis of frequency and percentage in the influence of beer
experts’ review on beer purchasing 84
Table 4.39: Analysis of frequency and percentage in the influence of friends
on beer purchasing 85
Table 4.40: Analysis of frequency and percentage in the others influence on
beer purchasing 86
Table 4.41: Mean, Standard Deviation and Respondents perception of beer
characteristic 87
Table 4.42: Mean, Standard Deviation and Respondents perception of
branding 88
Table 4.43: Mean, Standard Deviation and Respondents perception of
Beer types 89
Table 4.44: Mean, Standard Deviation and Respondents perception of
situation appropriateness statements 90
Table 4.45: Mean, Standard Deviation and Respondents perception of
packaging 91
Table 4.46: Mean, Standard Deviation and Respondents perception of
social media 92
Table 4.47: Mean, Standard Deviation and Respondents perception of
country of origin 93

xiv
LIST OF TABLES (Continued)
Page
Table 4.48: Mean, Standard Deviation and Respondents perception of
convenient and practical functions 94
Table 4.49: Mean, Standard Deviation and Respondents perception of
brand preference 95
Table 4.50: Analysis of correlation between independent variables and the
dependent variable using Pearson's Correlation Coefficient of
beer characteristic, branding, beer types, situation appropriateness
statements, packaging, social media, country of origin, and
convenient and practical functions that positively affecting
brand preference of the beer customers in Bangkok 97
Table 4.51: Beer characteristic, branding, beer types, situation appropriateness
statements, packaging, social media, country of origin, and
convenient and practical functions that positively affecting
brand preference of the beer customers in Bangkok 100
Table 4.52: Multiple Regression Analysis of beer characteristic, branding,
beer types, situation appropriateness statements, packaging,
social media, country of origin, and convenient and practical
functions that positively affecting brand preference of the
beer customers in Bangkok 101
Table 4.53: Testing Collinearity of independent variable 105

xv
LIST OF FIGURES
Page
Figure 1.1: Beer Market Segmentation in Thailand 4
Figure 1.2: The Mainstream Market Segment 5
Figure 2.1: Theoretical framework for brand preference 41
Figure 4.1: Result of Multiple Regression Analysis from Scope of Research 106

CHAPTER 1
INTRODUCTION
This chapter presents background, objectives, significance, limitation and
scope of the research, statement of problem, research questions, as well as definition
of terms.
1.1 Background
According to the report from the Office of Industrial Economics ("2559
industry stat dec for download-web oie", 2017) the total production volumes of beer
in Thailand in 2016 increased from 2,377,082 thousand liters to 2,424,945 thousand
liters or by 1 % from the previous year. Further observation for the total production
volumes of beer in 2015 revealed that the number also rose from 2,237,880 thousand
liters to 2,377,082 thousand liters or by 6 % from 2014. However, the total production
volumes of beer between 2013 and 2014 were negative growth as listed on table 1.1.
Likewise, domestic sales of beer in Thailand in 2016 increased from 2,123,744
million Thai baht to 2,154,294 million Thai baht or a 1 % increase from prior year.
In 2015, domestic sales of beer in Thailand rose from 2,000,487 million baht to be
2,123,744 million baht or a 6 % increase from 2014 whereas the domestic sales of
beer in Thailand from 2013 to 2014 were negative growth as listed on table 1.1
("2559 industry stat dec for download-web oie", 2017). Nevertheless, the negative
growth in production volumes and sales in both years were not considered as a beer
business regression but were the outcome from recession crisis during that time. The
report of Thailand’s economy in 2013 disclosed that the domestic demand in Thailand

2
has slowed down and weakened ("Thailand’s Economic Conditions in 2014", 2014).
Like 2014, The report of Thailand’s economy showed that there was a 0.7% growth
and surprisingly the number remained unchanged for the first half year (" Thailand’s
economic conditions in 2014", 2014). Although, Thailand was predicted to experience
the worst economy in Asia by World Bank in 2016 (Fevre, 2016). The report from
The Office of Industrial Economics interpreted that people were in economic
recession but their willingness to spend on beer still remained at the same level.
In other words, most beer consumers drink beer consistently regardless of current
economic climate ("Countries that consume the most alcohol", 2017).
Table 1.1: Statistic of Number of Beer Production and Domestic Sales in Thailand
Year Production Production Capacity Domestic Sales
1,000 Liters % Diff 1,000 Liters % Utility Million THB % Diff
2010 2,235,690 - 3,918,396 57% 2,032,994 -
2011 2,010,412 -10% 3,558,396 56% 1,869,304 -8%
2012 2,347,722 17% 3,558,396 66% 2,150,163 15%
2013 2,272,544 -3% 3,908,396 58% 2,046,635 -5%
2014 2,237,880 -2% 3,918,396 57% 2,000,487 -2%
2015 2,377,082 6% 3,888,396 61% 2,123,744 6%
2016 2,424,945 2% 3,918,396 62% 2,154,294 1%
Source: The office of industrial economics. (2017). Industrial statistic. Retrieved from
http://www.oie.go.th/academic/statistics.
3
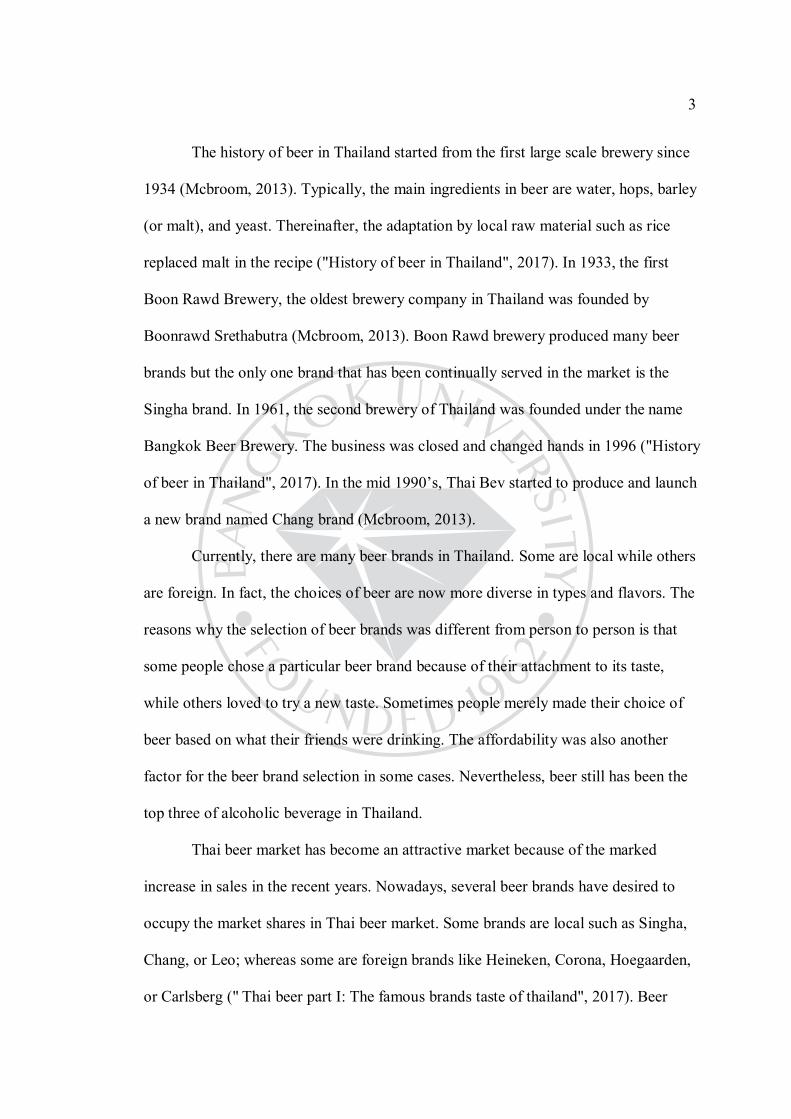
The history of beer in Thailand started from the first large scale brewery since
1934 (Mcbroom, 2013). Typically, the main ingredients in beer are water, hops, barley
(or malt), and yeast. Thereinafter, the adaptation by local raw material such as rice
replaced malt in the recipe ("History of beer in Thailand", 2017). In 1933, the first
Boon Rawd Brewery, the oldest brewery company in Thailand was founded by
Boonrawd Srethabutra (Mcbroom, 2013). Boon Rawd brewery produced many beer
brands but the only one brand that has been continually served in the market is the
Singha brand. In 1961, the second brewery of Thailand was founded under the name
Bangkok Beer Brewery. The business was closed and changed hands in 1996 ("History
of beer in Thailand", 2017). In the mid 1990’s, Thai Bev started to produce and launch
a new brand named Chang brand (Mcbroom, 2013).
Currently, there are many beer brands in Thailand. Some are local while others
are foreign. In fact, the choices of beer are now more diverse in types and flavors. The
reasons why the selection of beer brands was different from person to person is that
some people chose a particular beer brand because of their attachment to its taste,
while others loved to try a new taste. Sometimes people merely made their choice of
beer based on what their friends were drinking. The affordability was also another
factor for the beer brand selection in some cases. Nevertheless, beer still has been the
top three of alcoholic beverage in Thailand.
Thai beer market has become an attractive market because of the marked
increase in sales in the recent years. Nowadays, several beer brands have desired to
occupy the market shares in Thai beer market. Some brands are local such as Singha,
Chang, or Leo; whereas some are foreign brands like Heineken, Corona, Hoegaarden,
or Carlsberg (" Thai beer part I: The famous brands taste of thailand", 2017). Beer

4
market segment in Thailand had been classified into three segments based on selling
prices as detailed in figure 1. The first segment was the premium market segment
specified by the average beer price at 90 baht per bottle as a big package size. The
premium market segment accounted for 5 % of total market value and was dominated
by Heineken brand at 96 % market share. The second segment was the mainstream
market segment, which was the largest proportion in market at 93 % of total market
value. The mainstream market segment specified by the average beer price at 56 baht
per bottle as a big package size. The mainstream market segment has been the most
competitive segment among all segments because of the brand diversity. The largest
share in the mainstream market segment was Leo brand at 66 % followed by Change
brand, Singha brand, and others brands at 27 %, 6 % and 1 % respectively. The last
segmentation was the saving market segment quantified by the average price of beer
at 46 baht per bottle as a big package size. The saving market segment size stood at 2
% of total market value. The entry barrier into this segment was difficult because
Archa brand shared 100 % in this segment ("Mainstream beer news ", 2016).
Figure 1.1: Beer Market Segmentation in Thailand
Source: Mainstream beer news. (2016). Retrieved from http://positioningmag.com/
1091301.

5
Figure 1.2: The Mainstream Market Segment
Source: Mainstream beer news. (2016). Retrieved from http://positioningmag.com/
1091301.
Even though there were various beer brands in Thailand’s market but only few
brands had a significant market shares. In 2015, the highest share in the market
belonged to Boon Rawd Brewery Company Limited counted at 72% followed by Thai
Beverage Public Company Limited at 24% and Thai Asia Pacific Brewery Company
at 4% ("Beer market share in Thailand", 2015).
Boon Rawd Brewery was the first Thai brewery and has continued to
dominate in Thai beer market since 1933. The major beer brands that has been
produced by Boon Rawd Brewery are Singha brand and Leo brand ( Boon Rawd
Brewery, 2014). Since 2015, the main strategies of Singha beer have been adjusted in
order to increase more brand awareness in the target groups who were part of
Generation Y. The strategies were driven through many publicity such as the
sponsorship of sport activities and concert events ("Mainstream beer news", 2016).

6
Thai Bev was founded in 1995 and has been listed as the second powerhouse
in Thai beer market. The products of Thai Bev were Chang brand and Archa brand
("Thai beverage pcl corporate profile", 2015). Recently, Thai Bev has adjusted the
strategies in order to boost competitiveness by redesigning the packaging and
developing beer tastes, calling for more attention from the public by using celebrities
as its presenters, and commencing the marketing activities programs to cover the
whole region of Thailand ("Mainstream beer news", 2016).
Thai ASIA Pacific Brewery Company has been an international company that
has done its marketing of brewing beer in Thailand. The company has started its
business since 1993. The strategies of Thai ASIA Pacific Brewery adopted the
different strategy and executed through the product varieties. The broader brands of
beer merchandised by Thai ASIA Pacific Brewery Company such as Heineken brand,
Tiger brand, Cheers brand, Guinness brand, and Kilkenny brand ("Thai asia pacific
brewery background", 2015). Cheers brand has made an adjustment on the brand
image, packaging, and taste. Moreover the company introduced new beer taste to the
market and made popular by the limited edition ("Mainstream beer news", 2016).
Taxation rate of alcohol beverages in Thailand was considered as high for both
imported and local beer. The import duties for imported beer made up 60% ,which
was the highest import duties compared to other countries ("Import duty & taxes for
lager beer", 2017). The main reason for the high import duties rate was to protect
domestic breweries. Ultimately, this policy has been performed very effectively as the
evidence reveals that all of the dominators in Thai beer market has been the local
breweries for many years (Sonne, 2016). The impact from alcohol taxation rate
directly affected decision making process, which dictated the nature of customers.

7
Their nature is psychological since most customers preferred a cheaper product than
an expensive one. The evidence supports that the combination of alcohol taxation rate
and customers’ nature creates the continuing negative growth of imported beer brands
at 20% (Rinwong, 2016).Moreover, the high tax rate structure of alcohol beverage
was not only protect local breweries but also aimed to control the population of
alcoholic beverage consumers. In 2013, there was a change in an increased taxation
rate of alcoholic beverages produced locally. There are two objectives to this change.
The first one was to generate more tax revenue for the government. According to the
report from 2012, almost 55% of tax was generated from the sales of alcoholic
beverages. The second one was an indirect goal to control the alcohol consumption
per population to improve the health of Thai citizens (Jarurungsipong & Rakthum,
2013).
Another important regulation was the qualification license. All beer
production companies or beer traders had to acquire an alcohol permission license.
This creates the difficulties for many small and new players to break new ground in
Thai market. There are many alcohol regulations in Thailand that affects the beer
industry. Some of those regulations were beer advertising time control, time limit for
beer selling , restriction on area to sell beer, label control with the warning about
drinking and driving, legal drinking age, and the laws on alcohol consumption during
driving (Jarurungsipong & Rakthum, 2013).
Therefore, the increase in sales of beer have attracted many beer brands to
occupy the market shares in Thai beer market. Some brands are local such as Singha,
Chang, or Leo whereas some are foreign like Heineken, Corona, Hoegaarden, or
Carlsberg ("Thai beer part I: The famous brands taste of Thailand", 2017).

8
The premium market segment dominated by Heineken brand while the economic
market segment dominated by Archa brand and the mainstream market segment
dominated by Leo brand. The mainstream market segment was highly competitive
because there are three majors’ brands in this segment: Leo brand, Chang brand, and
Singha brand. However, there are many beer brands in Thai beer market but there are
a few beer companies that have significant market shares. Recently, Thai Bev
adjusted the strategies to boost competitiveness by redesigning the packaging,
developing beer tastes, gaining attention from publicity by using celebrities as its
trademark through social media, and setting up marketing activities in many provinces
("Mainstream beer news", 2016). Unfortunately, taxation rate for alcohol beverage in
Thailand was high for both imported and local production (Sonne, 2016). It has been
difficult for small companies who wants to produce or trade beer in Thailand
especially due to lack of license qualification. Then, the researchers are interested in
the growth and the difficulties of foreign and local brands in Thai beer market ,which
will affect brand preference of beer brand A’s customers in Bangkok (Jarurungsipong
& Rakthum, 2013).

9
1.2 SWOT Analysis
Table 1.2: Singha, Chang, and Heineken SWOT Analysis
Singha Chang Heineken
Strength 1. In-depth beer
industry experience
and insight.
2. Well-managed and
established
distribution channels.
3. Top quality
ingredients.
4. The strength of
brand image
associated with
"International Thai"
identity.
1. A golden medal
awarded beer in the
non-limited degree in
the international beer
competition fair at
Australia in July
1998.
2. Premium Thai
beer, genuinely
imported, was
synonymous with
Thai culture and
pride.
3. Price for
distributions was
cheap and it was
accessible to the
target groups.
1. Leading brand
portfolio.
2. Efficiency brand
equity improvement
from undertaken
various advertising
and promotional
initiatives.
3. Favorable image
from strong brand
portfolio.
4. Large and strong
network of breweries
increased customer
satisfaction and
reduced operation
cost and
transportation cost.
(Continued)

10
Table 1.2 (Continued): Singha, Chang, and Heineken SWOT Analysis
Singha Chang Heineken
Strength 4. Has a sparkling
gold appearance and a
smooth, crisp taste
and was made from
the finest quality
malt, hops and deep
well-water.
5. Strong distribution
channels.
6. Produces Scotch
whisky, vodkas, gins,
and liqueurs with
over 20 distilleries in
Scotland, France,
Poland, and Ireland.
5. Excellent branding
and top of the mind
recall.
Weakness 1. High production
costs of Singha beer.
2. Singha beer was
priced higher than
economy beers.
1. Less known
compared to market
leaders then brand
loyalty was lower
than competitors.
1. Challenge to
maintaining corporate
values, image and
quality standards in
various countries.
(Continued)

11
Table 1.2 (Continued): Singha, Chang, and Heineken SWOT Analysis
Singha Chang Heineken
Weakness 2. Less Innovation
could be a concern for
the brand.
3. Very high potential
of interception from
competitors which
hard to controlled.
2. Has been a leader
susceptible to fake
imitation products.
Opportunity 1. Taxation
according to alcohol
degree and local
production base.
2. Expand market to
overseas markets.
3. The increasing of
Light beer trend.
4. Good knowledge
to develop light beer
and launch as new
products with lower
price than existing
products.
1. To make expansion
by making it widely
available and exported
to countries around
the world including
UK, USA, Europe,
Asia and Australia.
2. Large untapped
international market.
1. Acquisition of
other breweries and
brands.
2. Expand product
line – for new areas
and to accommodate
changes in taste and
preference.
3. Innovations
contribute to the top-
line growth and to the
strength of the
Heineken brand in
particular.
(Continued)

12
Table 1.2 (Continued): Singha, Chang, and Heineken SWOT Analysis
Singha Chang Heineken
Opportunity 5. Offer premium
beer (i.e. Kloster) to
capture premium
segment.
4. Integration
forwards and
backward.
5. Driving top-line
growth by winning
customers at the point
of purchase has been
the key rationale
behind the roll-out of
Heineken’s extra
Cold program.
Threat 1. Regulations of
prohibition to
advertise alcoholic
beverage in
Thailand.
2. Economic
recession.
1. Large no. of
spurious brands in the
same category.
2. Continuous
government
intervention with
regards to tax
regulations.
1. Tax regulations on
the beer industry.
2. Falling trade and
ownership
regulations in foreign
countries.
3. The increasing of
negative perception
in society towards
(Continued)

13
Table 1.2 (Continued): Singha, Chang, and Heineken SWOT Analysis
Singha Chang Heineken
Threat 3. Importation of
foreign beers due to
FTA agreements.
4. Importance
competitor as Thai
Bev company who
ready to fight back
in any strategies.
3. Comparatively
competitive prices of
competitors.
alcohol could prompt
legislators to
restrictive measures.
4. Slowed industry
growth rate effect
from global
economy.
5. Legal issues
dealing with
underage drinking –
retailer’s license may
be revoked or
suspended.
6. The challenge
from other beverage
categories in mature
beer market.
7. Changing of taste
and preference of
consumers.
(Continued)

14
Table 1.2 (Continued): Singha, Chang, and Heineken SWOT Analysis
Singha Chang Heineken
Threat 8. Input costs
(including
transportation and
energy) have
accelerated to
unprecedented levels
in the past few years.
Source: Signha beer: Boon rawd brewery, Thai beer industry with five forces and
swot analysis, tows matrix, perceptual map, positioning. (2009-2016).
Retrieved from https://brightkite.com/essay-on/signha-beer-boon-rawd-
brewery-thai-beer-business-with-five-forces-and-swot-analysis-tows-matrix-
perceptual-map-positioning.
Swot analysis of thaibev thai beverages. (2013). Retrieved from
http://www.managementparadise.com/sayed123/documents/15961/swot-analysis-
of-thaibev-thai-beverages/.
Sankrusme, S. (2016). Strategy to be market leader of chang beer. In Paper presented
at the 2016 CIK AUC Conference Proceedings Entrepreneurship, Responsible
Management, and Economic Development. Retrieved from http://www.cyrusik.
org/wp-content/uploads/2016/11/Strategy-to-Be-Market-Leader-of-Chang-
Beer.pdf.

15
Heineken international swot analysis, usp & competitors. (2011 - 2017). Retrieved
from http://www.mbaskool.com/brandguide/food-and-beverages/4985-
heineken-international.html.
1.3 Statement of Problem
According to the continuous growth of beer sales in Thai market, which makes
it attractive to beer producers. Besides, Thai beer market is considered as a high value
market and the target for the investors. Then, there are many beer brands in Thai beer
market both local and international brands. Moreover, there are new players for the
niche market as well. Then, the competition in Thai beer market is significantly high.
Therefore, the study of influence toward brand preference of customers is interesting
and bring more value and benefits from increase in sales or gain more shares from the
market.
1.4 Objective of Research
The objective of this research was to study factors positively affecting beer
A’s brand preference of customers in Bangkok. The variable factors in the study
included beer characteristic, branding, beer types, situation appropriateness
statements, packaging, social media, country of origin, and convenient and practical
functions towards brand preference of the beer customers in Bangkok.

16
1.5 Scope of Research
1.5.1 Study on the following independent factors that positively affect brand
preference.
1.5.1.1 Beer characteristic
1.5.1.2 Branding
1.5.1.3 Beer types
1.5.1.4 Situation appropriateness statements
1.5.1.5 Packaging
1.5.1.6 Social media
1.5.1.7 Country of origin
1.5.1.8 Convenient and practical functions
1.5.2 The data collected by using survey and questionnaires from 230
respondents who were over 18 years of age and had experience drinking beer either
once or on a regular basis in Bangkok.
1.6 Research Question
1.6.1 Do beer characteristic, branding, beer types, situation appropriateness
statements, packaging, social media, country of origin, and convenient and practical
functions have relationships with consumer brand preference?
1.6.2 Do beer characteristic, branding, beer types, situation appropriateness
statements, packaging, social media, country of origin, and convenient and practical
functions affect consumer brand preference?
17
1.7 Significant of Research
1.7.1 The results of this research could be applied to marketing strategies of
beer industry by enhancing branding or increasing the use of social media from the
strategies according to research factors relationship.
1.7.2 This research is to provide the information on the factors affecting brand
preference of customers.
1.7.3 This research expanded the information on how beer characteristic,
branding, beer types, situation appropriateness statements, packaging, social media,
country of origin, and convenient and practical functions affected consumer brand
preference. This would be beneficial for the future researchers.
1.8 Limitations of Research
First, the data collection had been completed within a certain period of time
under limited resources. Hence, this research had a limited sampling number. In
addition, this research was the preliminary one and only some independent variables
and one dependent variable were considered, mediating, or mediator variables may
not be taken into account in this study.
1.9 Definition of terms
1.9.1 Office of Industrial Economics (oie.go.th) meant for a department of The
Ministry of Industry responsible for increasing efficiency and planning
implementation of Industrial Economics.
1.9.2 World Bank meant for an international financial institution that provides
loans to countries of the world for capital programs. There are two institutions in

18
World Bank, which are the International Bank for Reconstruction and Development
(IBRD) and the International Development Association (IDA).
1.9.3 Gen Y has meant for the generation of people born during the 1980s and
early 1990s. The characteristics vary by region, depending on social and economic
conditions. The generally marked of this generation is an increased use and familiarity
with communications, media, and digital technologies.
1.9.4 Taxation meant by which governments finance their expenditure by
imposing charges on citizens and corporate entities. Governments used taxation to
encourage or discourage certain economic decisions.
1.9.5 Beer Characteristic was referred to the intrinsic attributes of beer based
on physical attribute of beer for instance aroma, carbonation, foam and taste.
1.9.6 Branding was referred to the experience of customers toward product
image and product meaning by contribution from set of product attributes.
1.9.7 Beer Types was referred to beer categories separated from ingredient to
produce beer.
1.9.8 Situation Appropriateness Statements was referred to relationship
between situation and choice decision.
1.9.9 Packaging was referred to materials employed to contain, handle,
protect, and/or transport products.
1.9.10 Social Media was referred to the collection of online communications
channels consecrate to community-based input, interaction, content-sharing and
collaboration.
1.9.11 Country of Origin was referred to country of manufacture, production,
or growth where an article or product comes from.

19
1.9.12 Convenient and Practical Functions was referred to the perception on
easiness of the product finding and use of the product.
1.9.13 Brand Preference was referred to a unique customer’s perception
toward particular brands by believing that a particular brand performs better than the
others in the market.

CHAPTER 2
LITERATURE REVIEW
This chapter presents related literatures, theories, theoretical frameworks, and
previous studies of factors positively affecting beer A’s brand preference of customers
in Bangkok as follow:
2.1 Concept theories of beer characteristic
2.2 Concept theories of branding
2.3 Concept theories of beer types
2.4 Concept theories of situation appropriateness statements
2.5 Concept theories of packaging
2.6 Concept theories of social media
2.7 Concept theories of country of origin
2.8 Concept theories of convenient and practical functions
2.9 Concept theories of brand preference
2.10 Related documents and previous research
2.11 Hypothesis
2.12 Variable used in research
2.13 Theoretical Framework
2.1 Concept Theories of Beer Characteristic
The two elements acted as causes of beer preference were beer characteristics
and purchasing process (Aquilani, Laureti, Poponi & Secondi, 2015). Beer characteristic
denoted to the intrinsic attributes and the extrinsic attributes of beer. The intrinsic

21
attributes referred to physical attributes of beer like aroma, carbonation, foam, and taste
whereas the extrinsic attributes of beer were more related to purchasing decisions such
as brand, price, distribution, packaging, and country of origin (Lee & Lou, 1995).
Currently beer customers were more willing to pay for the intrinsic attributes especially
for the taste and the bitterness, which had a significant impact on customers’ choices
(Gabrielyan, McCluskey, Marsh & Ross, 2014).
Both the impact on individual intrinsic attribute of beer preference and the
combination of intrinsic attributes as a sensory point of view also played a part in beer
choices. Sensory characteristics did not have any pattern but can be described as
drinkability, refreshing, thirst-quenching or cooling properties (Guinard, Souchard,
Picot, Rogeaux & Sieffermann, 1998). Sensorial experience of customers were
important because it had an influence on brand preference through customers’
perception according to their past sensory characteristics and experiences (Sester,
Dacremont, Deroy & Valentin, 2013).
For the sake of creating the competitive advantages in the market, the
awareness of product quality needed to be considered (Fandos & Flavián, 2006).
Product quality was indicated as the standard performance of product or expected
performance of product. The difference between the expectation and the product
performance had a significant impact on the perception of customers as well as an
effect on brand preference (Goetsch & Davis, 2014). Quality could be judged in
various ways depended on timing. Generally, there were three categories of quality
based on timing. The first type of quality was the search quality. The search quality
referred to the purchasing moment related to the intrinsic attributes and the extrinsic
attributes. The second type of quality was the experience quality. The experience

22
quality referred to use or consume moment related to only the intrinsic attributes. The
third type of quality was the credence quality. The credence referred to the reliability
level of media information related to the intrinsic attributes and the extrinsic
attributes (Fandos & Flavián, 2006).
Aquilani et al. (2015) and Gómez-Corona, Escalona-Buendía, García, Chollet
& Valentin (2016) conducted empirical study and found that aroma, perceived
quality, level of bitterness, and alcoholic percentage were all factors explained the
propensity of “purely” commercial beer.
2.2 Concept Theories of Branding
Siegel (2013) found that branding was one of the influent factors on customer
purchasing decision. Whenever customers felt difficult to make a purchase decision
based on the intrinsic attributes then the extrinsic attributes arise with a more
powerful influence (Prentice & Handsjuk, 2016). Branding referred to customers’
experience toward products’ image and product’s meaning contributed from sets of
product attributes. Branding or brand was relevant to logo, color, slogan, and design
(Kladou, Kavaratzis, Rigopoulou & Salonika, 2016). Since branding was the extrinsic
characteristic, then possibly differed from brand to brand. The difference in branding
increased the customers’ recognition of the brand awareness of a particular brand. The
plus sides of the difference of a particular brand was the recognition as the first choice
of purchasing. Many successful brands created the advantages from branding by
constituting the customers’ benefits on the perspective customers from the sense of
remarkableness (Prentice & Handsjuk, 2016).

23
Nevertheless, the crucial aspect of value-added products was the similar level
perception of products which opposed the differentiate strategy (Mudambi, Doyle &
Wong, 1997). Value-added products could be applied to brand equity, which did not
have the same exact meaning as branding. Brand equity was the total value added by
the brand to the core products. Brand equity comprised of brand loyalty, name
awareness, perceive quality, brand association, and other proprietary brand assets
(Aaker, 2009). Brand equity had benefits both producer firms and consumers. Overall,
brand equity affected customer’s confidence by enhancing or reducing the product
value in customers’ perception and the understanding of the information of product
or brand (Mudambi et al., 1997). Furthermore, Prentice and Handsjuk (2016)
investigated the consumption of vodka in Australia and found that branding had an
impact on brand preference.
2.3 Concept Theories of Beer Types
Beer types referred to beer categories divided by beer ingredients. Recently,
trend of the global segmentation of specialty beer and craft beer increased shares over
than the mainstream beer segmentation and the gross sales of craft beer had been
continuously growing. The implication of this trend was the consequence of
customers’ perception of the unique characteristic of craft beer (Gómez-Corona,
Escalona-Buendía, García, Chollet & Valentin, 2016). Craft beer seemed to be
different from other beer by blending the non-traditional raw materials or the selected
ingredient (Aquilani et al., 2015). Beer customers were not only consume beer but
also searched for further details about the products which related to perceive of
perceive sensory. As customers understood that craft beer produced from special-

24
selected ingredients so their perception of craft beer were generally better quality than
commercial beer according to the sensory point of view through the ingredients
(Gómez-Corona et al., 2016).
Donadini, Fumi, Kordialik-Bogacka, Maggi, Lambri and Sckokai (2016)
studied about the interests of consumer in the specialty beer in three European
markets and found that the factors influencing the interests of specialty beer were the
ingredients and the sensory characteristic. Moreover, Lee, Frederick and Ariely
(2006) found that a direct impact of ingredients toward consumers was their
preference. The preference of beer taste could be changed whenever customers knew
the secret ingredient in beer. The changes of preference were influenced by top down
expectation. Hence, some manufacturers preferred to mention the name of
ingredients as a part of product commercial name because they wanted to create the
brand preference. While some ingredients created positive values to the product in
some countries, some might had negative values so the marketing research needed to
be done to find the suitable market intelligence for each local area (Donadini et al.,
2016). Then, Gómez-Corona et al. (2016) concluded that different types of beer such
as wheat, malt, fruit, or craft beer made by different customer choices. Further, in
Mexico consumers looked through beer ingredients before purchasing (Gómez-
Corona et al., 2016).
2.4 Concept Theories of Situation Appropriateness Statements
Most customers did not consume products only because of their function but
also due to their meaning that created identities. Moreover, customers consumed
because of their loyalty (Gómez-Corona et al., 2016). The reasons to drinking alcohol

25
beverage were diversified as social reasons, psychological effects, and pleasure
aspects (Crawford, 1987). While different situations altered customers behaved
heterogeneity because of the difference of the contextual segmentations and the
perception of product advantages across the different situations. The contextual
segmentation organized into group of social influence, environmental factors,
temporal aspects, and accompanying meal time (Giacalone et al., 2015).
Furthermore, the judgment to choose a particular brand was influenced by
situation context and product familiarity (Cardello et al., 2016). Product familiarity
was the product evaluation by relying on the product knowledge of the customers’
awareness. Product familiarity formed from the amount of experiences with focal
products. Product familiarity could be represented through product categories. This
idea can be adapted and applied to the product brand as well. Usually customers were
willing to use and try the familiar products easier than the unfamiliar products
because of the different product knowledge. The explanation for the familiar product
was that customers familiarized with products, which assumed that customers clearly
understood product characteristics then determined the product potential and finally
ended up with a high chance to use it regardless of situation context influencer. In
contrast, the unfamiliar products, such as new products resulted in the opposite way.
For the unfamiliar products, customers might not clearly understood product
characteristics and the product values, which linked to limited product knowledge.
Finally, the outcome of unfamiliar products were the least chance to use the products
(Giacalone et al., 2015).

26
The conclusion of beer business was that the familiar beer was appropriately
perceived for low context situations (Cardello et al., 2016). The situation context of
consumption of familiar beer meant for casual (Giacalone et al., 2015). The novel
beer or innovative beer was appropriately perceived for a high context situations
(Cardello et al., 2016). The situation context of consumption of novel beer was due to
the reason to impress someone, special occasions, an alternative to wine, restaurant
dinner, and for women (Giacalone et al., 2015). Then, Cardello et al. (2016) found
that drinking beer in casual dining, for relaxation, at the parties, to impress someone,
or for special occasion referred to situation appropriateness statements (Cardello
et al., 2016).
2.5 Concept Theories of Packaging
Recently, the packaging functions were not only to contain, protect, and
transport product without any damage. The packaging design was improved in order
to identify and distinguish the product from others in the market (Abidin, Effendi,
Ibrahim & Idris, 2014). Types of packaging had various functions. The first
packaging type was a primary packaging, which was a directly packaging contacted
with product. The second packaging type was a secondary packaging function, which
aimed to protect, created product identity, and conveyed product quality to customers.
The last packaging type was a tertiary packaging function, which was same function
as the secondary packaging type but focused on a commercial chain instead (Ampuero
& Vila, 2006).

27
Normally, customers behavior for food and beverage made purchase after
exploring only the front of the packaging without considering for other alternative
products (Simmonds & Spence, n.d.). In summary, packaging influenced customers
by transmitting product quality to customers’ notion through the visual aids (Prentice
& Handsjuk, 2016). Packaging also performed similarly to brand personality because
of complete product information, which enhanced the experience of customers.
Hence, the proper packaging design was important because it was the effective
channel to communicate product values and customer experiences (Abidin et al.,
2014). Meanwhile, packaging design must be well designed to make a product
recognizable (Ampuero & Vila, 2006).
Packaging was a powerful tool for products and brands communication
(Prentice & Handsjuk, 2016). An indirect advantage was the reduction of the
advertising cost (Ampuero & Vila, 2006). In some cases, the packaging had more
influence on brand decision than the product itself. The connotation of brands
communication from packaging created some meaning in customers’ perception that
could be convenience, friendly environment, natural environment, nation,
authenticity, prestige, value, and others (Abidin et al., 2014). In addition, packaging
influenced brand preference (Prentice & Handsjuk, 2016).
2.6 Concept Theories of Social Media
Social media was heavily involved in current lifestyle for both urban living
and rural living, so social media was counted as a powerful medium for the effective
communication between product and customers (Prentice & Handsjuk, 2016). The
augmentation of social media marketing had been the popularity marketing trends for

28
alcohol beverage business (Nicholls, 2012). Popularity of social media came from
cost efficiency, geographic expansion, and business opportunities (Barreda, Bilgihan,
Nusair & Okumus, 2016). The challenges from the widespread and active use of
social media marketing on alcohol beverage was the younger target audiences
(Nicholls, 2012). Some countries legislated an alcohol marketing regulations in order
to control the effort and exposure of alcohol in social media marketing (Brodmerkel
& Carah, 2013).
The crucial advantage of social media was to allow more customers’
interaction by comments about products and brands. At the same time, the company
still maintained non-interactive section such as information, activities, and news on
the social media as well. The consequence from both perspectives of social media
established and strengthened the relationship with customers (Barreda et al., 2016).
Furthermore, customer’s interaction was a valuable tools and cost less to construct
brand preference (Prentice & Handsjuk, 2016). Likewise, social media induced brand
recognition in the virtue of advertising and media commentary (Kladou et al., 2016).
However, the disturbance of using social media could create risks from the negative
comments when customers experienced any product issue so that marketers must
noticed and planed well to resolve this threat (Powers, Advincula, Austin, Graiko &
Snyder, 2012). Then, customers’ interaction could be a link to customers’ brand
preference. Besides, social media influenced brand preference (Prentice & Handsjuk,
2016).

29
2.7 Concept Theories of Country of Origin
In fact, the country of origin was a simple basis to specify the product
characteristic information and was referred from product source. However, the country
of origin had influence on product judgment and was accepted as country of origin
affected by country image (Manrai, Lascu & Manrai, 1998). Country image was a
product appreciation of a particular country, which was a consequence from the past
experiences and perception of the country’s production combined with the strength of
market (Roth & Romeo, 1992). Negative country image gained less reliability and
faced with the limited successful products and services in global market whereas a
positive country image enhanced the broad success of products and services in global
market from better reliability. Preference of a group of countries were also affected by
the different product categories that were evaluated differently based on a group of
countries (Manrai et al., 1998). The inference of country of origin toward brand
referred to the loyalty of brand image, product quality, and product judgment, which
associated with the rich brand’s history (Prentice & Handsjuk, 2016).
It is generally accepted that today’s market was highly competitive, hence the
strategies such as product differentiation and value-added products were mandatory to
be applied. Value-added products did not mean for special quality products to
compete in many markets but the importance was to create the unique identity of
products (van Ittersum, Candel & Meulenberg, 2003). The aspects of products were
identical for almost all aspects except for the country of origin, which was evaluated
differently (Johansson, Douglas & Nonaka, 1985). The fast track to create the unique
identity was the use of the information from a country of origin by communicating to

30
reliable information of the product either from the source of production, source of raw
materials, or components (van Ittersum et al., 2003).
In addition, the complexity of brand preference depended upon product
information guided by more availability of product information. A product with more
product information made brand preference much easier than a product with individual
product information. The product’s country of origin would make it easier for
consumers to make brand preference because it contained both product quality
information and product attribute information. Product quality information was the
obvious information to stimulate decision making. Meanwhile, product attributes
information referred back to country image used in the judgment (Manrai et al., 1998).
Moreover, as for the country of origin, Calvo Porral and Levy-Mangin (2015)
concluded that customers perceived to have more loyalty to global beer brands than
local beer brands because customers had more trust in global beer brands than local
beer brands examples in multiple countries such as Holland, Spain, or Germany
(Calvo Porral & Levy-Mangin, 2015). Besides, the country of origin factor influenced
brand preference (Prentice & Handsjuk, 2016).
2.8 Concept Theories of Convenient and Practical Functions
The habit of consumers basically were influenced by the combination between
functional and emotional conceptualizations (Thomson, 2010). The inference described
that customers did not only consumed or used the products because of the intrinsic and
the extrinsic attributes of the product itself. In addition, most consumers consumed
due to the association with both the functional and emotional conceptualization (Gutjar
et al., 2015). Functional conceptualizations were described as what a product can do for

31
customers, which stimulated the consumption or use. On the other hand, emotional
conceptualizations were described as what the products communicated to customers
(Thomson, 2010). The emotional part was closed to the feeling. However, emotional
side was not the effect from the product attributes. In fact, emotion was initiated by the
emotional conceptualization referred to the specific responses to subjective product and
for a short period of time (Silva et al., 2016).
Convenience was an important factor for consumers to make a choice among
the same product performance in the market (Osman et al., 2014). The concept of
convenience was highly important for today’s market as mentioned by Anderson and
Shugan (1991). The convenience concept pointed at the comfort experienced by
customers, which derived from both or one of the product characteristics and the
whole process of product purchase (Swoboda & Morschett, 2001). In brief, the
convenience was related to the quality of consuming time, value in form of money
and mental effort associated with consumption process (Osman et al., 2014).
Convenience also was considered as a factor to motivate the brand preference (Spáčil
& Teichmannová, 2016). The supporting evidence was from the study from Hjelmar
(2011) found that the nature of customers who preferred organic food product because
of convenient purchase from the nearby supermarket and they would give up if they
could not find at the nearby supermarket or confronted with the inconvenient
purchasing. Moreover, the study from Van Trijp (1994) found that customers
preferred a beverage packaging, which was perceived as a convenient packaging.

32
2.9 Concept Theories of Brand Preference
The motivation of consumers was supported by two aspects. The first aspect
was a rational model, which was evaluated on an objective criteria or product
attributes in order to make a decision on the optimal brand (Bhat & Reddy, 1998).
The second aspect was an emotional aspect, which referred the subjective criteria
such as taste, pride, and consumer desire. The evaluation of the emotional aspect was
varied from consumer to consumer because there was no the emotional standard
(Schiffman & Kanuk, 1994).
Anyhow both aspects related to customers’ attitude toward the product or
brand. A function of consumer’s attitude always associated with and influenced the
consumer behaviors (Ajzen, 2011). This could elaborate that customer’s attitude
performed as a predictor of buying behavior. The notion of this belief was that a
successful brand focused on a group of consumers who had a good attitude toward a
particular product or brand in order to motivate them to buy more. A good attitude
just continued for a certain period. In order to make a longer commitment with
consumers, so it required the development plans to create the loyalty (Bennett &
Bove, 2002).
Customer loyalty toward a particular brand reflected through brand preference.
The measurement of brand preference was hard to determine, but this could be done
by indirectly quantifying repurchasing and the referral program. Brand preference was
the important factor because it could promote repurchasing intention and also had an
impact on the referral program of the enhancement or its avoidance (Prentice &
Handsjuk, 2016). The development plan to create brand preference was the focal
point. The different product categories needed a variety of models in the process of

33
development. Hence, the six models to build brand preference were a guideline. The
models were developed based on the different perspectives, which were divided into a
need association, a mood association, a subconscious motivation, a behavior
modification, a cognitive processing, and a model emulation (Alreck & Settle, 1999).
The highest objective in the brand management was a creation of brand loyalty.
The intention to build brand loyalty was to gain more advantages on brand equity.
Brand loyalty was a long-term commitment of consumers to the brand (Theng So,
Grant Parsons & Yap, 2013). Brand loyalty was one dimension of brand equity, which
was the conceptual theory about of assets linking to brand whether to increase or
decrease product values. The rest of four dimensions of brand equity were brand
asset, brand awareness, brand quality, and brand association (Wang & Wei, 2008).
Normally, brand equity was considered when compared product values among the
same product category in the market (Calvo Porral & Levy-Mangin, 2015). Brand
equity initiated a brand confidence to confirm the better performance among other
competitors and exhibited the uniqueness of the brand in some situations (Wang, Wei
& Yu, 2008).
2.10 Related Documents and Previous Researches
Prentice and Handsjuk (2016) studied on Vodka purchasing behavior and
brand preference in Australia. The factors were branding, country of origin, packaging
and social media. The study conducted through an online survey method from
Facebook users. Participants in this study were 400 individuals who were 18 years
and older, legally consumed or purchased Vodka in Australia, and had access to
Facebook. The results showed that branding was the most effective influent factor on

34
the attitude toward Vodka and the loyal behavior. In addition, branding was a
powerful influent factor on brand preference and purchasing frequency. Furthermore,
the study showed that packaging and social media had the impact on brand
preference. Nonetheless, the result from the study showed that country of origin had
no effect on brand preference. Lastly, the study found that positive attitude stimulated
consumer’s brand preference of Vodka. The result from this research could promote
alcohol market to focus on mentioned factors and applied the suitable strategy.
Aquilani et al. (2015) studied the consumer preference perspective on the craft
beer in Italy by comparing consumer profiles between purely commercial beer
consumers and commercial beer consumers who had already tasted craft beer. The
study factors were brand, price, availability in bars, pubs and restaurants, availability
in stores, and packaging. The study method was a random survey. Participants in this
study were 444 visitors who attended Dire-Fare-Mangire event in Italy organized by
Slow Food. The result showed that the attractive factors on possibility of purely
commercial beer drinkers to taste craft beer were aroma, perceive quality, frequent
beer drinking, and drinking by oneself. The various flavor of craft beer was a factor
making beer consumer’s preferred craft beer more than commercial beer. Craft beer
was perceived as higher quality than commercial beer because beer consumers
believed that craft beer was produced from selective raw materials and better
production process. The benefit of this research could apply to beer producers in
order to understand the new trend of beer market.
Gómez-Corona et al. (2016) studied about motivations and benefits of craft
beer consumption compared to industrial beer consumption for beer consumers in
Mexico. The research conducted by questionnaire method to 207 beer consumers who
35
attended Beer Festival at Mexico City. Study areas in this study were potentials to
consume alcohol and beer, beer drinking habits, and the awareness and consumption
profile of craft beer in consumers. The study presented that there was three motivative
influencers induced to try in craft beer which were the desire for more knowledge, the
new taste experience, and the way to move away from the mainstream beer
consumption. Further, the difference between craft beer consumers and mainstream
consumers was the purpose of consumption. Craft beer consumers consumed for the
purpose of product meaning, the identities connection, and the uniqueness perception
meanwhile the mainstream consumers consumed because of the opposite reasons.
Calvo Porral and Levy-Mangin (2015) investigated on the consumers
perception and the evaluation of local and global brands in European market. The
study processed by collecting information from questionnaires. The study applied the
survey methods. Participants in this research were 307 individuals who consumed
beer, aged over 18 years old, and resided in Spain. The period to collect data was
during March 2012. There had only 281 questionnaires were valid to use as data,
which were separated into 129 participants represented for local beer brands and 152
participants represented for global beer brands. The independent variables in this
study were brand awareness, perceive quality, brand organizational association by
referred to brand image, and brand loyalty while brand equity, willingness to pay the
premium price and purchase intention were the dependent variables. The first result of
research revealed that customers in Spain did not consider the values of global brand
better than the values of local brand. The consequence was customers did not willing
to pay for the global brand as the premium price although was a global successful
company. The second result revealed that the perception of brand image for local

36
brand was higher than global brand. The reason behind this was the limited
understanding of preference, habits, and taste in the host country.
Gómez-Corona et al. (2016) studied about the influence of culture and
consumption habits impacted on beer representation. The research were conducted by
interview method through 300 male participants who aged between 19 to 51 years old,
consumed beer at least once a month, had experience with industrial beer or craft
beer. Sample target group were separated to collect data from two countries, 150
participants from Mexico City and other 150 participants were from Paris. The
interview questions consisted of the session of giving free word associating with the
use of craft beer, the session of ranking evoke words based on the importance, and
the session of scoring to each evoke words. The result of research exhibited that
consumers from the same culture shared the similar social representation on craft beer
although had different consumption habits. Moreover, the result shown that craft beer
consumers could not share any social representation across the different cultures but
industrial beer consumers could share one social representation across the different
cultures. The indication for beer consumers in Mexico and France were separated into
two groups. The first group was the craft beer consumers who had more structure of
social representation and maintained consumption habits. The second group was the
industrial beer consumers who had less social representation structure and high
probability to change in habits. The researcher also found that social representative of
craft beer differenced across the cultures.
Cardello et al. (2016) researched about the effectiveness of each factor that
measured the differences of New Zealand beer. Factors in this research were
familiarity and novelty measurement, affective and attitudinal measurement,

37
situational appropriateness measurement, and emotional related variable
measurement. This research collected data from beer testing set up by researchers.
Participants in this research were 203 beer enthusiasts who must preferred and
regularly consumed beer at least once a night, must be able to recall at least three beer
styles, and must be interested in trying new beer. The result of research was presented
by three groups. The first group was the attitudinal data explained that the familiarity
or novelty and degree of simple or complex judgment were quantified through the
classification task and highly associated with the specific situational uses. The second
group was situation data explained that the familiar beer that appropriated for casual
and everyday situations were opposite from novel beer that appropriated for special
occasions at most. The last group was emotional data explained that the difference in
active, passive and pleasant level. Familiar beer associated with passive emotion but
novel beer associated with active emotion.
Silva et al. (2016) studied about functional conceptualization and emotional
conceptualization of non-alcoholic beer compared with beer and wine. This study was
a qualitative study and applied the focus group interview method to collect data.
Question structure of focus group interview consisted of the introduction part, the
context questions part, the motivation questions part, the emotions questions part, and
a summary part. Participants for focus group interview were 56 individuals included
both Dutch and Portuguese. Participants were divided into 30 female individuals and
26 male individuals. They were divided into regularly consumed beer at 54
individuals and regularly consumed wine at 54 individuals, and regularly consumed
non-alcoholic beer at 28 individuals. The result revealed that there were different
conceptualization among three focus groups. The successful product as beer and wine

38
had richer conceptual content. On the contrary, non-alcoholic beer was limited in
conceptual content, more on functional, and less in emotional. Hence, there was not a
successful product. Furthermore, the study discovered that wine associated with
positive low arousal emotion response whereas beer associated with positive high
arousal emotion response. Lastly, non-alcoholic beer did not have any associated with
arousal emotion and had shown a negative response. The benefit from result was for
beverage producers who were both alcohol beverage and non-alcohol beverage
producers focused on eliciting a rich conceptualization containing emotional sets of
positive connection with consumers for the success.
Thanaratakkharathawi and Kanthawongs (2016) studied on the influence of
after-sales quality, seller morality, online shopping via Instagram, trust, peer
recommendations, product risk, ease-of-use, user generated content support, and
perceived risk affecting purchase intention of clothing products of consumers in
Chatuchak Market in Bangkok. The data in this research were collected by using
survey method with 270 sample size. Hypotheses testing analyzed by Multiple
Regression Analysis. The result showed that most of the participants were female,
aged between 31-35 years old, single, got bachelor's degree, worked as a private
company employee, earned the income was between 20,001-30,000 baht, made
purchasing cloths on Instagram was between 1-2 times per month, and spent on
purchasing was between 501-10,000 baht. After analysis at 0.01 level of significance
by Multiple Regression, only perceived risk, user-generated content support, and peer
recommendations had positive influence on purchase intention of clothing consumers.
The result from this research benefited the business owners on Instagram.
39
Notar and Kanthawongs (2016) studied the influence of private label image,
social image, perceived quality, brand awareness, corporate social responsibility,
price premium, prestige sensitivity, controlled-communication, and word-of-mouth
communications toward purchase intention of high quality food products brand A of
consumers in Bangkok. The data were collected by using survey method with 340
respondents. Hypotheses testing analyzed by Multiple Regression Analysis. The result
showed that most of the participants were females, aged between 20-25 years old,
single, got bachelor's degree, worked as a private company employee, earned the
income was not over than 25,000 baht, purchased the quality food product as once a
week, and spent on purchasing between 101-300 baht. After analysis at 0.01 level of
significance by Multiple Regression, only price premium, word-of-mouth
communications, and brand awareness had positive influence on purchasing intention
of high quality food products. The result from this research benefited the food
business industry.
2.11 Hypothesis
From related literature, related theories, theories framework, and previous
studies can be hypothesized as follows.
2.11.1 There is a positive relationship between beer characteristic and brand
preference.
2.11.2 There is a positive relationship between branding and brand preference.
2.11.3 There is a positive relationship between beer types and brand preference.
2.11.4 There is a positive relationship between situation appropriateness
statements and brand preference.

40
2.11.5 There is a positive relationship between packaging and brand preference.
2.11.6 There is a positive relationship between social media and brand preference.
2.11.7 There is a positive relationship between country of origin and brand
preference.
2.11.8 There is a positive relationship between convenient and practical functions
and brand preference.
2.11.9 Beer characteristic, branding, beer types, situation appropriateness
statements, packaging, social media, country of origin and convenient and practical
functions has positive influence towards brand preference of the beer customers in
Bangkok.
2.12 Variable used in Research
2.12.1 Independent Variable classify by
2.12.1.1 Beer characteristic
2.12.1.2 Branding
2.12.1.3 Beer types
2.12.1.4 Situation appropriateness statements
2.12.1.5 Packaging
2.12.1.6 Social media
2.12.1.7 Country of origin
2.12.1.8 Convenient and practical function
2.12.2 Dependent Variable is brand preference.

41
2.13 Theoretical Framework
Figure 2.1: Theoretical framework for brand preference
Independent Variables Dependent Variable
Beer Characteristic
Branding
Beer Types
Situation Appropriateness Statements
Brand Preference
Packaging
Social Media
Country of Origin
Convenient and Practical
Functions

CHAPTER 3
RESEARCH METHODOLOGY
This chapter presents the applied method to study factors positively affecting
beer A’s brand preference of customers in Bangkok. The research method is described
step by step.
3.1 Research Design
3.2 Population and Sample Selection
3.3 Research Instrument
3.4 Testing Research Instrument
3.5 Data Collection
3.6 Preparation and Data Analysis
3.7 Statistic Method
3.1 Research Design
This research objective was to explore factors positively affecting beer A’s
brand preference of customers in Bangkok. The methodology of this research was
based on the quantitative approach. This research used a survey method and collection
of data through questionnaires.
3.2 Population and Sample Selection
3.2.1 Population and Sample Selection in Research
Population in this research were people who were over 18 years old and had
experiences with beer: either one-time drinking experience or regular drinkers in
43
Chatuchak, Wattana, and Bang Rak Districts in Bangkok. The sample was gathered
by using the non-probability sampling methods in terms of convenience sampling by
collecting data only with respondents who were willing to cooperate with the
researchers by completing the questionnaires (Saunders, Lewis & Thornhill, 2006;
Trochim, 2006).
3.2.2 Sample Size in Research
The sample size for this study was calculated based on a Cohen (1977)
formula to determine the sample size from 40 pilot questionnaires completed by
people who were over 18 years old and had experiences with beer: either one-time
drinking experience or regular drinkers in Chatuchak, Wattana, and Bang Rak
Districts in Bangkok. Then the sample size was calculated by using G*power version
3.1.9.2, created by Cohen (1977) and approved by several researchers (Faul,
Erdfelder, Buchner & Lang, 2009; Wiratchai, 2012), with the Power (1– β) of 0.87,
Alpha (α) of 0.13, Number of Test Predictor of 8, Effect Size of 0.06085 (Calculated
by Partial R2 of 0.057). Then, the result showed that the minimum number of the total
sample size was 230 (Cohen, 1977). Thus, 230 sets of questionnaire had been
collected.
3.3 Research Instrument
This research was conducted under the research instruments as following order
3.3.1 Finding influential principle factors related to the study by exploring
published documents such as articles and journals about brand preference, beer, social
media, and Bangkok.

44
3.3.2 Constructing the questionnaire based on related principles, beer
characteristic, branding, beer types, situation appropriateness statements, packaging,
social media, country of origin, and convenient and practical functions. Alongside the
process of questionnaire construction, advisor’s guidance was given until the first
approval from the advisor.
3.3.3 Validating the questionnaire by beer experts, Ms. Kawmai
Tonveerachaisakul, Head of Finance Planning & Analysis at Boonrawd Trading and
Mr. Kongkit Kanchanavatee, Operation Manager of beer industry company gave the
advices in terms of the business views to develop questionnaires content to be more
precise.
3.3.4 Finalizing questionnaire according to the comments from the experts
together with the advisor’s guidance. After that, conducted a reliability testing of each
variable in individual factors from 40 pilot respondents. The reliability test referred to
Cronbach's Alpha Coefficient. Value of Cronbach's Alpha was between 0≤α≤ 1,
higher value means higher reliability and closely related to the section.
3.3.5 Verification and probability were tested in order to re-grouping of
questions in each factor to align with Factor Analysis on 40 pilot questionnaires to
enhance the validity and the consistency with research study theory.
As mentioned earlier, this research applied questionnaire to investigate. The
questionnaires was associated and constructed with the interesting and related
principles, which comprised of fifty-one questions. The questions were divided into
four parts:

45
Part 1: Demographic question; this part contained 6 close-ended response
questions in general information of respondents, which were gender, age, status, level
of education, monthly income, and professional status occupation.
Part 2: Consumption behavior question; this part consisted of 6 close-ended
response questions in a purpose to measure beer consumption behavior of
respondents. The collected information consisted of frequency of alcoholic beverage
consuming type, favorite beer brand, frequency of beer consumption, weekly
expenditure of beer, and beer purchasing intention influencer.
Part 3: Investigating factor question; the objective of this part was to obtain
the attitude from beer customers toward to each variable from 38 close-ended
response questions consisted of
Beer characteristic 4 Questions
Branding 4 Questions
Beer types 4 Questions
Situation appropriateness statements 5 Questions
Packaging 4 Questions
Social media 4 Questions
Country of origin 4 Questions
Convenient and practical functions 5 Questions
Brand preference 4 Questions
The measurement evaluated from interval scale of the usage a five-level Likert
Scale to measure the level of agreement.
Highest Agreeable Level 5 points
High Agreeable Level 4 points

46
Moderate Agreeable Level 3 points
Low Agreeable Level 2 points
Lowest Agreeable Level 1 points
Applied Class Interval formula with five points scales to calculate the
measurement of each variable to classify the respondents’ agreeable perception level.
Class Interval (width of the range) = (Max – Min) / level
= (5 – 1) / 5
= 0.8
In the section that used Interval Scale, researcher used the mean score
justification level of agreeable perception according to following ranges:
Average mean score at 4.21-5.00 described as participant’s perception of
agreeable level on beer characteristic, branding, beer types, situation appropriateness
statements, packaging, social media, country of origin, convenient and practical
functions, and brand preference were at the highest level.
Average mean score at 3.41-4.20 described as participant’s perception of
agreeable level on beer characteristic, branding, beer types, situation appropriateness
statements, packaging, social media, country of origin, convenient and practical
functions, and brand preference were at the high level.
Average mean score at 2.61-3.40 described as participant’s perception of
agreeable level on beer characteristic, branding, beer types, situation appropriateness
statements, packaging, social media, country of origin, convenient and practical
functions, and brand preference were at the normal level.
Average mean score at 1.81-2.60 described as participant’s perception of
agreeable level on beer characteristic, branding, beer types, situation appropriateness

47
statements, packaging, social media, country of origin, convenient and practical
functions, and brand preference were at the low level.
Average mean score at 1.00-1.80 described as participant’s perception of
agreeable level on beer characteristic, branding, beer types, situation appropriateness
statements, packaging, social media, country of origin, convenient and practical
functions, and brand preference were at the lowest level.
Part 4: An Open–Ended Response Question; a question was prepared for
participant’s advices or comments about the study.
3.4 Testing Research Instrument
The concept of testing research instrument determined the reliability of
questionnaire to ensure that questionnaires appropriated to support this research by
utilizing Cronbach's Alpha Coefficient and factor load value from Factor Analysis.
After analyzed the first 40 pilot respondents. The Cronbach's Alpha Coefficient of
beer characteristic equaled to 0.661, branding equaled to 0.896, beer types equaled to
0.736, situation appropriateness statement equaled to 0.667, packaging equaled to
0.830, social medias equaled to 0.966, country of origin equaled to 0.853, convenient
and practical functions equaled to 0.833, and brand preference equaled to 0.909. The
entire alpha coefficients of this research was more than 0.65 there by passed a
recommended level and had proven to be a reliable study (Craig & Moores, 2006).
Factor load value from a Factor Analysis was another factor aimed to analyze
questions in questionnaire in order to construct the reliable component of questions
for each factors. This research conducted Factor Analysis by the number of question
for each factors as below.

48
1) Beer characteristic 4 Questions
2) Branding 4 Questions
3) Beer types 4 Questions
4) Situation appropriateness statements 5 Questions
5) Packaging 4 Questions
6) Social media 4 Questions
7) Country of origin 4 Questions
8) Convenient and Practical Functions 5 Questions
9) Brand Preference 4 Questions
All of 38 questions were analyzed by using Principle Component Analysis.
Setting Eigenvalue at 1, the lowest value. Then, used Varimax Orthogonal rotation to
ensure that every set of questions was the most suitable component. The notion of
result after 5 axis rotation was that researcher must considered factor loading value of
each question and maybe rearranged the component with the condition that each
factor loading value exceed 0.3 (Chen, Srinivasan, Elkasabany & Berenson, 1999;
Chung et al., 2008; Kline, 2014).
Table 3.1: Factor Analysis of factors positively affecting beer A’s brand preference of
customers in Bangkok
BC BD BM SA PK SM CO CP BF
BC1 0.316
BC2 0.819
(Continued)

49
Table 3.1 (Continued): Factor Analysis of factors positively affecting beer A’s brand
preference of customers in Bangkok
BC BD BM SA PK SM CO CP BF
BC3 0.290
BC4 0.511
BD1 0.663
BD2 0.819
BD3 0.837
BD4 0.594
BM1 0.694
BM2 0.693
BM3 0.752
BM4 0.324
SA1 0.942
SA2 0.363
SA3 0.012
SA4 0.160
SA5 0.077
PK1 0.296
PK2 0.254
PK3 0.890
PK4 0.832
(Continued)

50
Table 3.1 (Continued): Factor Analysis of factors positively affecting beer A’s brand
preference of customers in Bangkok
BC BD BM SA PK SM CO CP BF
SM1 0.854
SM2 0.835
SM3 0.889
SM4 0.805
CO1 0.754
CO2 0.780
CO3 0.438
CO4 0.631
CP1 0.183
CP2 0.421
CP3 0.599
CP4 0.783
CP5 0.801
BF1 0.853
BF2 0.796
BF3 0.844
BF4 0.860

51
From table 3.1: The explanation of each factor was stated below:
Beer characteristic
From factor analysis of beer characteristic, independent factor could be
formed as one group by consisting of four questions, which were "I buy beer because
of its aroma" (BC1), "I like beer which is not too bitter" (BC2), "I buy beer because of
its alcoholic percentage" (BC3), and "I buy beer because of product quality" (BC4).
Branding
From factor analysis of branding, independent factor could be formed as one
group by consisting of four questions, which were "I choose brand of beer based on
the brand's trustworthiness" (BD1), "I choose brand of beer based on the brand's
reputation" (BD2), "I am very familiar with a particular beer brand" (BD3), and "I
have a clear image of the type of people who drink a particular beer brand" (BD4).
Beer types
From factor analysis of beer types, independent factor could be formed as one
group by consisting of four questions, which were "I prefer wheat beer" (BM1), "I
prefer malted beer" (BM2), "I prefer fruit beer" (BM3), and "I prefer craft beer"
(BM4).
Situation appropriateness statements
From factor analysis of situation appropriateness statements, independent
factor could be formed as one group by consisting of five questions, which were "I
drink beer when I am at a casual dining restaurant" (SA1), "I drink beer when I need
to relax alone at home" (SA2), "I drink beer when I am at parties" (SA3), "I drink beer
when I want to impress someone" (SA4) and "I drink beer for a special occasion"
(SA5).

52
Packaging
From factor analysis of packaging, independent factor could be formed as one
group by consisting of four questions which, were "Buying beer with extravagant
packaging makes me feel good about myself" (PK1), "I associate qualities in
packaging of beer with qualities I see in myself" (PK2), "When I see beer packaging
that is really well designed I have a strong urge to buy it" (PK3), and "Beer's
packaging design can be a source of satisfaction for me" (PK4).
Social media
From factor analysis of social media, independent factor could be formed as
one group by consisting of four questions which, were "I use social media to enhance
my relationship with beer brand" (SM1), "I use social media to enhance my
understanding of beer brand" (SM2), "I use social media to follow up activities related
to beer brand’s products" (SM3), and "I use social media to keep up to date with beer
brand’s products release" (SM4).
Country of origin
From factor analysis of country of origin, independent factor could be formed
as one group by consisting of four questions which, were "Beer from Holland is the
best quality" (CO1), "Beer from Spain is the best quality" (CO2), "Beer from
Germany is the best quality" (CO3), and "Beer from Thailand is the best quality"
(CO4).
Convenient and practical functions
From factor analysis convenient and practical functions, independent factor
could be formed as one group by consisting of five questions, which were "I like beer
because it is easy to drink" (CP1), "I prefer to order beer because it is available to

53
order in most places" (CP2), "I drink beer because it is inexpensive drink" (CP3), and
"I drink beer because it is expensive drink" (CP4), and "I drink beer because it is easy
to transport" (CP5).
Brand preference
From factor analysis brand preference, independent factor could be formed as
one group by consisting of four questions, which were "I would buy a particular beer
brand rather than any other brands available" (BF1), "I am willing to recommend
others to buy a particular beer brand" (BF2), "I definitively purchase a particular beer
brand in the future" (BF3), and "I am likely to purchase a particular beer brand in the
future" (BF4).
3.5 Data Collection
This research combined two types of data collection.
3.5.1 Primary Data was the direct data that was obtained from respondents
collected with many different methods but this research used questionnaire as a main
source. The steps to do data collection were as follow:
3.5.1.1 Researcher studied intensively from related articles, documents,
and concepts to create research objective and scheme of this research in appropriate
questionnaires. 230 sets of questionnaires were responded and collected in the mid of
December until the end of January 2017.
3.5.1.2 Fulfillment and correctness by checking each responded
questionnaires and incorporated the advices from an advisor and the experts prior to
the data analysis.

54
3.5.1.3 Process for the data input from completed questionnaires. Then
completed the data analysis with suitable computer program.
3.5.2 Secondary Data was readily available data, which could be collected
from articles, researches, reports, books, and the internet. However, data must related
to the beer, customer decision, and brand preference. Meanwhile, data should
supported to narrow the research scope and research references.
3.6 Preparation and Data Analysis
Data analysis of this research was more on statistical analysis by applying
SPSS software. The steps have been described as follow:
1) Classified the completed and usable questionnaires as the group of focused
questionnaires.
2) Coding focused questionnaires.
3) Saved coding on the questionnaires in SPSS by using Statistical Significant
Level of .01.
4) The primary data was obtained from questionnaires and have been analyzed
for the statistics.
4.1) Descriptive Statistic Analysis
4.1.1) Demographic Question, which was about demography
and general information were analyzed by using Frequency and Percentage.
4.1.2) Consumption Behavior Question was analyzed by using
frequency and Percentage.
4.1.3) Investigation Factor Question, which was the scale
questions about beer characteristic, branding, beer types, situation appropriateness

55
statements, packaging, social media, country of origin, convenient and practical
functions, and brand preference were analyzed by using Mean and Standard
Deviation (S.D)
4.1.4) Open–Ended Response Question was analyzed to find
the other related factors to the study.
4.2) Inferential Statistic Analysis
4.2.1) Each independent variable consisted of beer characteristic,
branding, beer types, situation appropriateness statements, packaging, social media,
country of origin, and convenient and practical functions were analyzed by using
Pearson Product-Moment Correlation Coefficient.
4.2.2) Together all of independent variables (beer characteristic,
branding, beer types, situation appropriateness statements, packaging, social media,
country of origin, and convenient and practical functions) with a dependent variable
(brand preference) was analyzed by using Multiple Regression Analysis.
3.7 Statistic Method
Statistical analysis methods in this research consisted of
3.7.1 The Reliability of the Test applied Cronbach's Alpha Coefficient
(Vanichbuncha, 2009)

56
Reliability value of total questionnaire
Number of question
Total variability of questionnaire
Variability of total questionnaire
3.7.2 Descriptive Statistics Analysis
3.7.2.1 Percentage
P percentage
f percentage frequency
N frequency
3.7.2.2 Mean
Mean
Total group score
Number of group score

57
3.7.2.3 Standard Deviation
S.D. Standard deviation
X Score
n Number of score in each group
∑ Total amount
3.7.3 Inferential Statistics
3.7.3.1 Multiple Regression Analysis (MRA) was an analysis progress
to find relationship between Dependent Variable and Independent Variable
(Vanichbuncha, 2009).
Ý = b0+b1X1+b2X2+ ··· +bkXk
Ý predicted dependent variable
b0 value of Y when all of the independent variables are
equal to zero
b1 ,..., bk estimated regression coefficients
X0 ,…, Xk predictor variables

58
3.7.3.2 ANOVA Analysis had hypothesis that H0: β1 = β2 =…= βk =
0 compare to H1: with at least 1 βi at ≠ 0 (i=1,…,k)
Table 3.2: ANOVA Analysis
Source of
Variance
Df
Sum Square:
SS
Mean Square:
MS
F–Statistics
Regression K SSR MSR = SSR
K F = MSR
MSE Error/ Residual n-k-1 SSE
MSE = SSE
n-k-1
Total n-1 SST
Source: Vanichbuncha, K. (2008). Multivariate analysis. Thailand: Thammasarn.
k number of independent variable
n number of example
SST Sum Square of Total
SSR Sum Square of Regression
SSE Sum Square of Error/ Sum Square of Residual
MSR Mean Square of Regression
MSE Mean Square of Error
F F-Statistic

59
3.7.3.3 Pearson Product-Moment Correlation Coefficient
Rxy Pearson Correlation Coefficient
x Values in the first set of data
y Values in second set of data
n Total number of value
The value of Pearson Correlation Coefficient was between –1≤ r ≤ 1.
The positive and negative value of r determined the direction of relationship.
Positive r showed that 2 variables have same direction of relationship.
Negative r showed that 2 variables have opposite direction of
relationship.
The size of the relationship could be determined by value of r
r value nearly +1 showed that 2 variables have close relationship in the
same direction.
r value nearly -1 showed that 2 variables have least relationship in
opposite direction.
r value equaled to 0 mean there was no correlation between 2
variables.
r value closed to 0 mean that 2 variables had few relationship.

CHAPTER 4
DATA PRESENTATION
This chapter presents the research data result to answer the research questions
which purpose to explore factors positively affecting beer A’s brand preference of
customers in Bangkok. The data was collected from 230 respondents through the
survey questionnaire method. The respondents specified to individuals who were over
18 years old and had experiences with beer: either one-time drinking experience or
regular drinkers in Chatuchak, Wattana, and Bang Rak Districts in Bangkok. The
closed – end questionnaire which consisted of a multiple questions part and a Likert
scale questions part with the total of 50 questions were applied to collect the data to
analyze and resulted in form of quantitative research.
The value of Cronbach's Alpha Coefficient of 8 factors were shown as
follows. Beer characteristic equaled to 0.652, branding equaled to 0.895, beer types
equaled to 0.718, situation appropriateness statements equaled to 0.654, packaging
equaled to 0.896, social media equaled to 0.960, country of origin equaled to 0.807,
convenient and practical functions equaled to 0.807, and brand preference equaled to
0.946. Every factors exceeded the minimal coefficient, 0.65. Then, all alpha
coefficients passed the recommended level and had proven to be reliable (Craig &
Moores, 2006).
According to all study factors passed reliable level as proven by the above
paragraph thus data presentation done by data statistics and were presented in
descriptive statistics and inferential statistics which were completed by SPSS Window
version 16.0. Whereby descriptive statistics were presented by frequency, percentage,

61
mean and standard deviation. By which inferential statistics were presented by
Pearson Product-Moment Correlation Coefficient and Multiple Regression. Data were
presented as below.
4.1 Demographic Data
Data were presented in frequencies and percentage of gender, age, status, level
of education, monthly income, professional status occupation, frequency behavior of
consumption in each type of alcoholic beverage, favorite beer brand, frequency of
beer consumption, frequency of beer consume in each day of week, weekly
expenditure of beer, and the influencer on beer purchasing intention.
Table 4.1: Analysis of frequency and percentage in gender
Frequency Percent
Valid
Percent
Cumulative
Percent
Valid Male 123 53.5 53.5 53.5
Female 107 46.5 46.5 100.0
Total 230 100.0 100.0
From Table 4.1, data presented from 230 respondents were divided to male at
123 respondents or 53.5% of population sample and females 107 respondents or
46.5% of population sample. The results showed that, male had higher potential to
consume beer than female.

62
Table 4.2: Analysis of frequency and percentage in age
Frequency Percent
Valid
Percent
Cumulative
Percent
Valid 18-23 19 8.3 8.3 8.3
24-29 70 30.4 30.4 38.7
30-39 111 48.3 48.3 87.0
40-49 26 11.3 11.3 98.3
More
than 50 4 1.7 1.7 100.0
From Table 4.2, data presented that from 230 respondents showed that the age
between 30-39 years old which accounted as 48.3% of population sample was the
highest potential group for beer consumption. The second group was the age between
24-29 years old which accounted as 30.4% of population sample. The third group was
the age between 40-49 years old which accounted as 11.3% of population sample. The
implication was that the group of the adult and middle-age were a large portion to
experience with beer.

63
Table 4.3: Analysis of frequency and percentage in status
Frequency Percent Valid
Percent
Cumulative
Percent
Valid Single 158 68.7 68.7 68.7
Married 68 29.6 29.6 98.3
Divorced/Widowed
/Separated 4 1.7 1.7 100.0
Total 230 100.0 100.0
From Table 4.3, data presented that most of population sample which were
158 respondents or 68.7% of population sample were single. On the other hand, 68
respondents or 29.6% of population sample were married. Only few of respondents, 4
respondent or 1.7% of population sample were divorced.
Table 4.4: Analysis of frequency and percentage in level of education
Frequency Percent Valid
Percent
Cumulative
Percent
Valid Under Bachelor Degree 14 6.1 6.1 6.1
Bachelor Degree 139 60.4 60.4 66.5
Master Degree 74 32.2 32.2 98.7
Doctorate Degree 3 1.3 1.3 100.0
Total 230 100.0 100.0

64
From Table 4.4, data presented that from 230 respondents, the largest group
was the bachelor degree group which formed by 139 respondents accounted as 60.4%
of population sample. Follow by the master degree group which formed by 74
respondents accounted as 32.2% of population sample. Follow by the under bachelor
degree group formed by 14 respondents accounted as 6.1% of population sample. The
smallest group was the doctorate degree group formed by only 3 respondents
accounted only as 1.3% of population sample.
Table 4.5: Analysis of frequency and percentage in monthly income
Frequency Percent Valid
Percent
Cumulative
Percent
Valid Less than 15,000 11 4.8 4.8 4.8
15,001 - 30,000 75 32.6 32.6 37.4
30,001 - 50,000 71 30.9 30.9 68.3
50,001 - 100,000 52 22.6 22.6 90.9
100,001 - 150,000 16 7.0 7.0 97.8
150,001 - 200,000 2 .9 .9 98.7
200,001 - 500,000 2 .9 .9 99.6
More than 500,000 1 .4 .4 100.0
Total 230 100.0 100.0
From Table 4.5, 230 respondents were classified by monthly income. The
largest group was the group of income range between 15,001-30,000 baht composed

65
of 75 respondents or 32.6% of population sample. The second group composed of 71
respondents or 30.9% of population sample who earned the income range between
30,001-50,000 baht. The third group composed of 52 respondents or 22.6% of
population sample who earned the income range between 50,001-100,000 baht. The
fourth group was the group of 16 respondents or 7% of population sample who earned
the income range between 100,001-150,000 baht. The fifth group was the group of
income range between 150,001-200,000 and 200,001-500,000 baht composed by 2
respondents or 0.9% for both groups. The last group was the group of income range
more than 500,000 baht composed only 1 respondent or 0.4% of population sample.
Table 4.6: Analysis of frequency and percentage in professional status occupation
Frequency Percent Valid
Percent
Cumulative
Percent
Valid State enterprise
Employee 14 6.1 6.1 6.1
Private Employee 185 80.4 80.4 86.5
Self-Employed 16 7.0 7.0 93.5
Searching for job 2 .9 .9 94.3
Students 10 4.3 4.3 98.7
Etc. 3 1.3 1.3 100.0
Total 230 100.0 100.0

66
From Table 4.6, from 230 population sample showed that almost of
respondents who worked as private employees as 185 respondents accounted for
80.4% of population sample. Whereas, respondents who worked as self-employee at
16 respondents accounted for 7% of population sample. Respondents who worked as
state enterprise employees were at 14 respondents accounted for 6.1%. Respondents
who were students were at 10 respondents accounted for 4.3% of population sample.
Moreover, there had 3 respondents who were uncategorized group as accounted for
1.3% of population sample. The least group was the individuals who searched for job
were 2 respondents accounted for 0.9% of population sample.
Table 4.7: Analysis of frequency and percentage in the respondent’s behavior to
frequently drink beer
Frequency Percent Valid
Percent
Cumulative
Percent
Valid Not frequency 25 10.9 10.9 10.9
Frequency 205 89.1 89.1 100.0
Total 230 100.0 100.0
From Table 4.7, data presented that from 230 respondents were divided to 205
respondents who frequently consumed beer accounted as 89.1% of population sample
and 25 respondents who infrequently consumed beer accounted as 10.9% of
population sample. The indication was that most of individuals frequently consumed
beer.

67
Table 4.8: Analysis of frequency and percentage in the respondent’s behavior to
frequently drink wine
Frequency Percent Valid
Percent
Cumulative
Percent
Valid Not frequency 171 74.3 74.3 74.3
Frequency 59 25.7 25.7 100.0
Total 230 100.0 100.0
From Table 4.8, data presented that from 230 respondents were divided to 171
respondents who consumed wine as infrequently accounted as 74.3% of population
sample and 59 respondents who frequently consumed wine accounted as 25.7 % of
population sample. The indication was that most of individuals infrequently
consumed wine.
Table 4.9: Analysis of frequency and percentage in the respondent’s behavior to
frequently drink whisky
Frequency Percent Valid
Percent
Cumulative
Percent
Valid Not frequency 179 77.8 77.8 77.8
Frequency 51 22.2 22.2 100.0
Total 230 100.0 100.0

68
From Table 4.9, data presented that from 230 respondents were divided to 179
respondents who consumed whisky as infrequently accounted as 77.8% of population
sample and 51 respondents who consumed whisky as frequently accounted as 22.2 %
of population sample. The indication was that most of individuals infrequently
consumed whisky.
Table 4.10: Analysis of frequency and percentage in the respondent’s behavior to
frequently drink vodka
Frequency Percent Valid
Percent
Cumulative
Percent
Valid Not frequency 201 87.4 87.4 87.4
Frequency 29 12.6 12.6 100.0
Total 230 100.0 100.0
From Table 4.10, data presented that from 230 respondents were divided to
201 respondents who infrequently consumed vodka accounted as 87.4% of population
sample and 29 respondents who frequently consumed vodka accounted as 12.6 % of
population sample. The indication was that most of individuals infrequently
consumed vodka behavior.

69
Table 4.11: Analysis of frequency and percentage in the respondent’s behavior to
frequently drink others alcohol beverage
Frequency Percent Valid
Percent
Cumulative
Percent
Valid Not frequency 217 94.3 94.3 94.3
Frequency 13 5.7 5.7 100.0
Total 230 100.0 100.0
From Table 4.11, data presented that from 230 respondents were divided to a
group of individuals who infrequently consumed other beverage accounted as 217
respondents or 94.3% of population sample and a group of individuals who frequently
consumed other beverage 13 respondents accounted as 5.7 % of population sample.
The indication was that most of individuals infrequently consumed others alcohol
beverage.
Table 4.12: Analysis of frequency and percentage in favorite beer for Heineken brand
Frequency Percent Valid
Percent
Cumulative
Percent
Valid Non-Favorite 105 45.7 45.7 45.7
Favorite 125 54.3 54.3 100.0
Total 230 100.0 100.0

70
From Table 4.12, data presented that 125 respondents or 54.3% of population
sample favored in Heineken whereas 105 respondents or 45.7% of population sample
disfavored in Heineken. The indication was that Heineken was a favorite brand.
Table 4.13: Analysis of frequency and percentage in favorite beer for Singha brand
Frequency Percent Valid
Percent
Cumulative
Percent
Valid Non-Favorite 141 61.3 61.3 61.3
Favorite 89 38.7 38.7 100.0
Total 230 100.0 100.0
From Table 4.13, data presented that 141 respondents or 61.3% of population
sample disfavored in Singha whereas 89 respondents or 38.7% of population sample
favored in Singha. The indication was that Singha was a non-favorite brand.
Table 4.14: Analysis of frequency and percentage in favorite beer for Leo brand
Frequency Percent Valid
Percent
Cumulative
Percent
Valid Non-Favorite 138 60.0 60.0 60.0
Favorite 92 40.0 40.0 100.0
Total 230 100.0 100.0

71
From Table 4.14, data presented that 138 respondents or 60% of population
sample disfavored in Leo whereas 92 respondents or 40% of population sample
favored in Leo. The indication was that Leo was a non-favorite brand.
Table 4.15: Analysis of frequency and percentage in favorite beer for Chang brand
Frequency Percent Valid
Percent
Cumulative
Percent
Valid Non-Favorite 174 75.7 75.7 75.7
Favorite 56 24.3 24.3 100.0
Total 230 100.0 100.0
From Table 4.15, data presented that 174 respondents or 75.7% of population
sample disfavored in Chang whereas 56 respondents or 24.3% of population sample
favored in Chang. The indication was that Chang was a non-favorite brand.
Table 4.16: Analysis of frequency and percentage in favorite beer for Carlsberg brand
Frequency Percent Valid
Percent
Cumulative
Percent
Valid Non-Favorite 211 91.7 91.7 91.7
Favorite 19 8.3 8.3 100.0
Total 230 100.0 100.0

72
From Table 4.16, data presented that 211 respondents or 91.7% of population
sample disfavored in Carlsberg whereas 19 respondents or 8.3% of population sample
favored in Carlsberg. The indication was that Carlsberg was a non-favorite brand.
Table 4.17: Analysis of frequency and percentage in favorite beer for San Miguel
Frequency Percent Valid
Percent
Cumulative
Percent
Valid Non-Favorite 217 94.3 94.3 94.3
Favorite 13 5.7 5.7 100.0
Total 230 100.0 100.0
From Table 4.17, data presented that 217 respondents or 94.3% of population
sample disfavored in San Miguel whereas 13 respondents or 5.7% of population
sample favored in San Miguel. The indication was that San Miguel was a non-favorite
brand.
Table 4.18: Analysis of frequency and percentage in favorite beer for Hitachino Nest
Frequency Percent Valid
Percent
Cumulative
Percent
Valid Non-Favorite 224 97.4 97.4 97.4
Favorite 6 2.6 2.6 100.0
Total 230 100.0 100.0

73
From Table 4.18, data presented that 224 respondents or 97.4% of population
sample disfavored in Hitachino Nest whereas only 6 respondents or 2.6% of population
sample favored in Hitachino Nest. The indication was that Hitachino Nest was a non-
favorite brand.
Table 4.19: Analysis of frequency and percentage in favorite beer for Estrella Damm
Frequency Percent Valid
Percent
Cumulative
Percent
Valid Non-Favorite 223 97.0 97.0 97.0
Favorite 7 3.0 3.0 100.0
Total 230 100.0 100.0
From Table 4.19, data presented that 223 respondents or 97% of population
sample disfavored in Estrella Damm whereas only 7 respondents or 3% of population
sample favored in Estrella Damm. The indication was that Estrella Damm was a non-
favorite brand.
Table 4.20: Analysis of frequency and percentage in favorite beer for Hoegaarden
Frequency Percent Valid
Percent
Cumulative
Percent
Valid Non-Favorite 124 53.9 53.9 53.9
Favorite 106 46.1 46.1 100.0
Total 230 100.0 100.0

74
From Table 4.20, data presented that 124 respondents or 53.9% of population
sample disfavored in Hoegaarden whereas 106 respondents or 46.1% of population
sample favored in Hoegaarden. The indication was that Hoegaarden was a non-
favorite brand.
Table 4.21: Analysis of frequency and percentage in favorite beer for Guinness
Frequency Percent Valid
Percent
Cumulative
Percent
Valid Non-Favorite 216 93.9 93.9 93.9
Favorite 14 6.1 6.1 100.0
Total 230 100.0 100.0
From Table 4.21, data presented that 216 respondents or 93.9% of population
sample disfavored in Guinness whereas 106 respondents or 46.1% of population sample
favored in Guinness. The indication was that Guinness was a non-favorite brand.
Table 4.22: Analysis of frequency and percentage in favorite beer for Leffe
Frequency Percent Valid
Percent
Cumulative
Percent
Valid Non-Favorite 216 93.9 93.9 93.9
Favorite 14 6.1 6.1 100.0
Total 230 100.0 100.0

75
From Table 4.22, data presented that 216 respondents or 93.9% of population
sample disfavored in Leffe whereas 106 respondents or 46.1% of population sample
favored in Leffe. The indication was that Leffe was a non-favorite brand.
Table 4.23: Analysis of frequency and percentage in favorite beer for Stella Artois
Frequency Percent Valid
Percent
Cumulative
Percent
Valid Non-Favorite 210 91.3 91.3 91.3
Favorite 20 8.7 8.7 100.0
Total 230 100.0 100.0
From Table 4.23, data presented that 210 respondents or 91.3% of population
sample disfavored in Stella Artois whereas 20 respondents or 8.7% of population
sample favored in Stella Artois. The indication was that Stella Artois was a non-
favorite brand.
Table 4.24: Analysis of frequency and percentage in favorite beer for Tiger
Frequency Percent Valid
Percent
Cumulative
Percent
Valid Non-Favorite 221 96.1 96.1 96.1
Favorite 9 3.9 3.9 100.0
Total 230 100.0 100.0

76
From Table 4.24, data presented that 221 respondents or 96.1% of population
sample disfavored in Tiger whereas 9 respondents or 3.9% of population sample
favored in Tiger. The indication was that Tiger was a non-favorite brand.
Table 4.25: Analysis of frequency and percentage in favorite beer for A.K. Damm
Frequency Percent Valid
Percent
Cumulative
Percent
Valid Non-Favorite 227 98.7 98.7 98.7
Favorite 3 1.3 1.3 100.0
Total 230 100.0 100.0
From Table 4.25, data presented that 227 respondents or 98.7% of population
sample disfavored in A.K. Damm whereas 3 respondents or 1.3% of population
sample favored in A.K. Damm. The indication was that A.K. Damm was a non-
favorite brand.
Table 4.26: Analysis of frequency and percentage in favorite beer for others brand
Frequency Percent Valid
Percent
Cumulative
Percent
Valid Non-Favorite 217 94.3 94.3 94.3
Favorite 13 5.7 5.7 100.0
Total 230 100.0 100.0

77
From Table 4.26, data presented that 217 respondents or 94.3% of population
sample disfavored in others beer brand whereas 13 respondents or 5.7% of population
sample favored in others beer brand. The indication was that the others beer brand
were a non-favorite brand.
Table 4.27: Analysis of frequency and percentage in frequency of beer consumption
Frequency Percent Valid
Percent
Cumulative
Percent
Valid Daily 4 1.7 1.7 1.7
Once a week 33 14.3 14.3 16.1
Several times per week 44 19.1 19.1 35.2
Once a month 40 17.4 17.4 52.6
Several times per month 40 17.4 17.4 70.0
Once a year 6 2.6 2.6 72.6
Several times per year 9 3.9 3.9 76.5
Only on special occasions 53 23.0 23.0 99.6
etc. 1 .4 .4 100.0
Total 230 100.0 100.0
From Table 4.27, the largest group was a group of respondents who frequently
consumed only special occasions at 53 respondents or 23%. The second group was a
group of respondents who frequently consumed several times per week at 44
respondents or 19.1%. The third groups was the groups of respondents who frequently

78
consumed once a month and consumed several times per month at 40 respondents or
17.4%. The fourth group was the group of respondents who frequently consumed
several times per year at 9 respondents or 3.9%. The fifth group was the group of
respondents who frequently consumed once a year at 6 respondents or 2.6%. The
sixth group was the group of respondents who frequently consumed daily at 4
respondents or 1.7%. There was only 1 respondent or 0.4% who frequently consumed
with another frequency which not mentioned in this questionnaire.
Table 4.28: Analysis of frequency and percentage in consume beer on Monday
Frequency Percent Valid
Percent
Cumulative
Percent
Valid No 212 92.2 92.2 92.2
Yes 18 7.8 7.8 100.0
Total 230 100.0 100.0
From Table 4.28, total population sample at 230 respondents showed that
almost of respondents not consumed beer on Monday at 212 respondents or 92.2%
whereas 18 respondents or 7.8% consumed beer on Monday.

79
Table 4.29: Analysis of frequency and percentage in consume beer on Tuesday
Frequency Percent Valid
Percent
Cumulative
Percent
Valid No 211 91.7 91.7 92.2
Yes 19 8.3 8.3 100.0
Total 230 100.0 100.0
From Table 4.29, total population sample at 230 respondents showed that
almost of respondents not consumed beer on Tuesday at 211 respondents or 91.7%
whereas 19 respondents or 8.3% consumed beer on Tuesday.
Table 4.30: Analysis of frequency and percentage in consume beer on Wednesday
Frequency Percent Valid
Percent
Cumulative
Percent
Valid No 211 91.7 91.7 91.7
Yes 19 8.3 8.3 100.0
Total 230 100.0 100.0
From Table 4.30, total population sample at 230 respondents showed that
almost of respondents not consumed beer on Wednesday at 211 respondents or 91.7%
whereas 19 respondents or 8.3% consumed beer on Wednesday.

80
Table 4.31: Analysis of frequency and percentage in consume beer on Thursday
Frequency Percent Valid
Percent
Cumulative
Percent
Valid No 214 93.0 93.0 93.0
Yes 16 7.0 7.0 100.0
Total 230 100.0 100.0
From Table 4.31, total population sample at 230 respondents showed that
almost of respondents not consumed beer on Thursday at 214 respondents or 93%
whereas 16 respondents or 7% consumed beer on Thursday.
Table 4.32: Analysis of frequency and percentage in consume beer on Friday
Frequency Percent Valid
Percent
Cumulative
Percent
Valid No 64 27.8 27.8 27.8
Yes 166 72.2 72.2 100.0
Total 230 100.0 100.0
From Table 4.32, total population sample at 230 respondents showed that most
of respondents consumed beer on Friday at 166 respondents or 72.2% whereas 64
respondents or 27.8% not consumed beer on Friday.

81
Table 4.33: Analysis of frequency and percentage in consume beer on Saturday
Frequency Percent Valid
Percent
Cumulative
Percent
Valid No 78 33.9 33.9 33.9
Yes 152 66.1 66.1 100.0
Total 230 100.0 100.0
From Table 4.33, total population sample at 230 respondents showed that most
of respondents consumed beer on Saturday at 152 respondents or 66.1% whereas 78
respondents or 33.9% not consumed beer on Saturday.
Table 4.34: Analysis of frequency and percentage in consume beer on Sunday
Frequency Percent Valid
Percent
Cumulative
Percent
Valid No 193 83.9 83.9 83.9
Yes 37 16.1 16.1 100.0
Total 230 100.0 100.0
From Table 4.34, total population sample at 230 respondents showed that most
of respondents not consumed beer on Sunday at 193 respondents or 83.9% whereas 37
respondents or 16.1% consumed beer on Sunday.

82
Table 4.35: Analysis of frequency and percentage in weekly expenditure of beer
Baht per week Frequency Percent Valid
Percent
Cumulative
Percent
Valid Less than 50 23 10.0 10.0 10.0
51 - 200 37 16.1 16.1 26.1
201 - 500 65 28.3 28.3 54.3
501 - 1,000 57 24.8 24.8 79.1
1,001 - 1,500 29 12.6 12.6 91.7
1,501 - 2,000 8 3.5 3.5 95.2
2,001 - 3,000 6 2.6 2.6 97.8
etc. 5 2.2 2.2 100.0
Total 230 100.0 100.0
From Table 4.35, the result showed that the largest group was the group of
respondents who weekly spent on beer between 201-500 baht at 65 respondents or
28.3%. The second group was the group of respondents who weekly spent on beer
between 501-1,000 baht at 57 respondents or 24.8%. The third group was the group of
respondents who weekly spent on beer between 51-200 baht at 37 respondents or
16.1%. The fourth group was the group of respondents who weekly spent on beer
between 1,001-1,500 baht at 29 respondents or 12.6%. The fifth group was the group
of respondents who weekly spent less than 50 baht at 23 respondents or 10%. The
sixth group was the group of respondents who weekly spent on beer between 1,501-
2,000 baht at 8 respondents or 3.5%. The seventh group was the group of respondents

83
who weekly spent on beer between 2,001-3,000 baht at 6 respondents or 2.6%. The
last group was the group of respondents who weekly spent on beer more than 3,000
baht at 5 respondents or 2.2%.
Table 4.36: Analysis of frequency and percentage in self-influence on beer purchasing
Frequency Percent Valid
Percent
Cumulative
Percent
Valid Not Influence 66 28.7 28.7 28.7
Influence 164 71.3 71.3 100.0
Total 230 100.0 100.0
From Table 4.36, total population sample at 230 respondents were divided into
two groups. The largest group was the respondents who were influenced by
themselves toward beer purchasing at 164 respondents or 71.3%. Another group was
the respondents who did not influenced by themselves at 66 respondents or 28.7%.
The indication was that the buyers had the influence on beer brand preference.

84
Table 4.37: Analysis of frequency and percentage in the influence of Families on beer
purchasing
Frequency Percent Valid
Percent
Cumulative
Percent
Valid Not Influence 218 94.8 94.8 94.8
Influence 12 5.2 5.2 100.0
Total 230 100.0 100.0
From Table 4.37, total population sample at 230 respondents were divided into
two groups. The largest group was the group of respondents who did not influenced
by families toward beer purchasing at 218 respondents or 94.8%. Another group was
the group of respondents who were influenced by families at 12 respondents or 5.2%.
The indication was that families had no influence on beer brand preference.
Table 4.38: Analysis of frequency and percentage in the influence of beer experts’
review on beer purchasing
Frequency Percent Valid
Percent
Cumulative
Percent
Valid Not Influence 224 97.4 97.4 97.4
Influence 6 2.6 2.6 100.0
Total 230 100.0 100.0

85
From Table 4.38, total population sample at 230 respondents were divided into
two groups. The largest group was the group of respondents who did not influenced
by beer experts’ review toward beer purchasing at 224 respondents or 97.4%. Another
group was the group of respondents who were influenced by beer experts’ review at 6
respondents or 2.6%. The indication was that the review from beer experts had no
influence on beer brand preference.
Table 4.39: Analysis of frequency and percentage in the influence of friends on beer
purchasing
Frequency Percent Valid
Percent
Cumulative
Percent
Valid Not Influence 120 52.2 52.2 52.2
Influence 110 47.8 47.8 100.0
Total 230 100.0 100.0
From Table 4.39, total population sample at 230 respondents were divided into
two groups. The largest group was the group of respondents who did not influenced
by friends toward beer purchasing at 120 respondents or 52.2%. Another group was
the group of respondents who were influenced by friends at 110 respondents or
47.8%. The indication was that friends had no influence on beer brand preference.

86
Table 4.40: Analysis of frequency and percentage in the others influence on beer
purchasing
Frequency Percent Valid
Percent
Cumulative
Percent
Valid Not Influence 221 96.1 96.1 96.1
Influence 9 3.9 3.9 100.0
Total 230 100.0 100.0
From Table 4.40, total population sample at 230 respondents were divided into
two groups. The largest group was the group of respondents who did not influenced
by others factor toward beer purchasing at 221 respondents or 96.1%. Another group
was the group of respondents who were influenced by others factor at 9 respondents
or 3.9%. The indication was that the others influence factors had no influence on beer
brand preference.
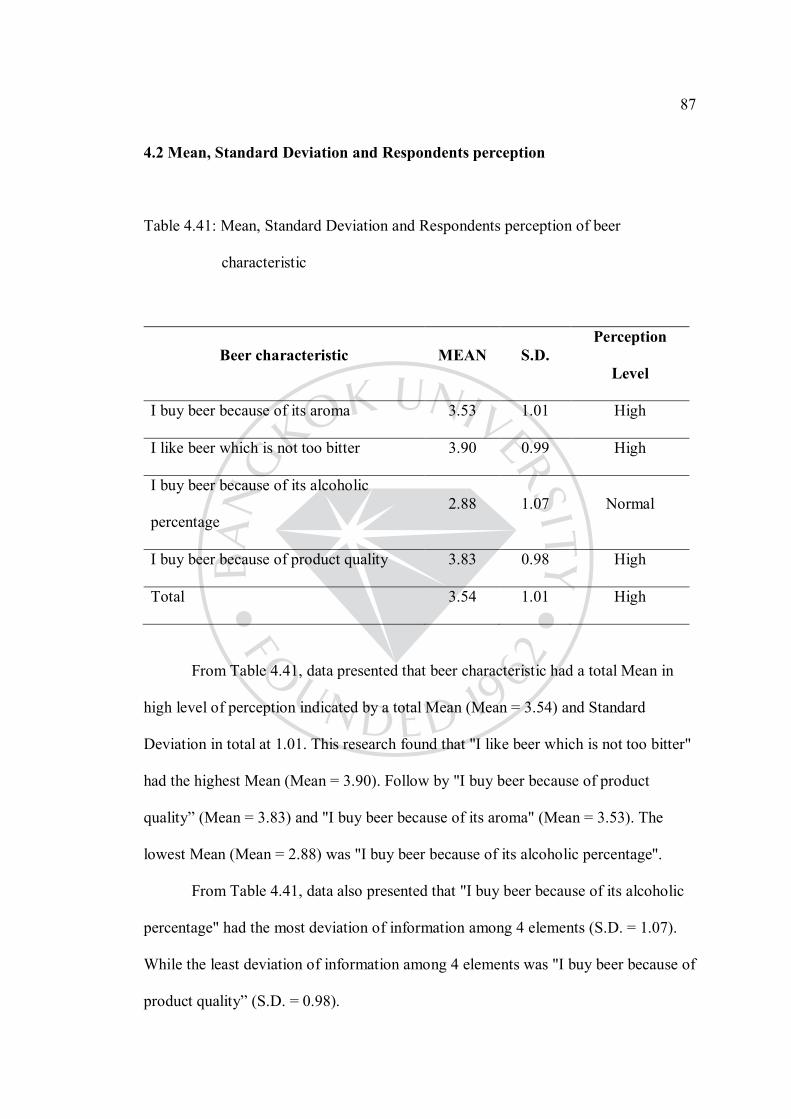
87
4.2 Mean, Standard Deviation and Respondents perception
Table 4.41: Mean, Standard Deviation and Respondents perception of beer
characteristic
Beer characteristic MEAN S.D. Perception
Level
I buy beer because of its aroma 3.53 1.01 High
I like beer which is not too bitter 3.90 0.99 High
I buy beer because of its alcoholic
percentage 2.88 1.07 Normal
I buy beer because of product quality 3.83 0.98 High
Total 3.54 1.01 High
From Table 4.41, data presented that beer characteristic had a total Mean in
high level of perception indicated by a total Mean (Mean = 3.54) and Standard
Deviation in total at 1.01. This research found that "I like beer which is not too bitter"
had the highest Mean (Mean = 3.90). Follow by "I buy beer because of product
quality” (Mean = 3.83) and "I buy beer because of its aroma" (Mean = 3.53). The
lowest Mean (Mean = 2.88) was "I buy beer because of its alcoholic percentage".
From Table 4.41, data also presented that "I buy beer because of its alcoholic
percentage" had the most deviation of information among 4 elements (S.D. = 1.07).
While the least deviation of information among 4 elements was "I buy beer because of
product quality” (S.D. = 0.98).

88
Table 4.42: Mean, Standard Deviation and Respondents perception of branding
Branding MEAN S.D. Perception
Level
I choose beer brand A based on the brand's
trustworthiness 3.51 1.03 High
I choose beer brand A based on the brand's
reputation 3.42 1.03 High
I am very familiar with beer brand A 3.53 1.06 High
I have a clear image of the type of people
who drink beer brand A 3.11 1.12 Normal
Total 3.39 1.06 Normal
From Table 4.42, data presented that branding had a total Mean in normal
level of perception indicated by a total Mean (Mean = 3.39) and Standard Deviation
in total at 1.06. This research found that "I am very familiar with beer brand A" had
the highest Mean (Mean = 3.53). Follow by "I choose beer brand A based on the
brand’s trustworthiness" (Mean = 3.51) and "I choose beer brand A based on the
brand's reputation” (Mean = 3.42). The lowest Mean (Mean = 3.11) was "I have a
clear image of the type of people who drink beer brand A".
From Table 4.42, data also presented that "I have a clear image of the type of
people who drink beer brand A" had the most deviation of information among 4
elements (S.D. = 1.12). While the least deviation of information among 4 elements

89
were "I choose beer brand A based on the brand's trustworthiness" and "I choose beer
brand A based on the brand's reputation" (S.D. = 1.03).
Table 4.43: Mean, Standard Deviation and Respondents perception of Beer types
Beer types MEAN S.D. Perception
Level
I prefer wheat beer 3.12 0.95 Normal
I prefer malted beer 3.16 0.93 Normal
I prefer fruit beer 2.96 1.12 Normal
I prefer craft beer 3.12 1.11 Normal
Total 3.09 1.03 Normal
From Table 4.43, data presented that beer types had a total Mean in normal
level of perception indicated by a total Mean (Mean = 3.09) and Standard Deviation
in total at 1.03. This research found that "I prefer malted beer" had the highest Mean
(Mean = 3.16). Follow by "I prefer wheat beer" and "I prefer craft beer" had the same
Mean (Mean = 3.12). The lowest Mean (Mean = 2.96) was "I prefer fruit beer".
From Table 4.43, data also presented that "I prefer fruit beer" had the most
deviation of information among 4 elements (S.D. = 1.12). While the least deviation of
information among 4 elements was "I prefer malted beer" (S.D. = 0.93).

90
Table 4.44: Mean, Standard Deviation and Respondents perception of situation
appropriateness statements
Situation appropriateness statements MEAN S.D. Perception
Level
I drink beer when I am at a casual dining
restaurant 3.18 1.44 Normal
I drink beer when I need to relax alone at
home 2.67 1.38 Normal
I drink beer when I am at parties 4.26 0.93 Highest
I drink beer when I want to impress someone 2.52 1.31 Low
I drink beer for a special occasion 4.16 0.95 High
Total 3.36 1.20 Normal
From Table 4.44, data presented that situation appropriateness statements had
a total Mean in normal level of perception indicated by a total Mean (Mean = 3.36)
and Standard Deviation in total at 1.20. This research found that "I drink beer when I
am at parties" had the highest Mean (Mean = 4.26). Follow by "I drink beer for a
special occasion" (Mean = 4.16). Next were "I drink beer when I am at a casual dining
restaurant" (Mean = 3.18) and "I drink beer when I need to relax alone at home"
(Mean = 2.67). The lowest Mean (Mean = 2.52) was "I drink beer when I want to
impress someone".
From Table 4.44, data also presented that "I drink beer when I am at a casual
dining restaurant" had the most deviation of information among 5 elements (S.D. =

91
1.44). While the least deviation of information among 5 elements was "I drink beer
when I am at parties" (S.D. = 0.93).
Table 4.45: Mean, Standard Deviation and Respondents perception of packaging
Packaging MEAN S.D. Perception
Level
Buying beer with extravagant packaging
makes me feel good about myself 3.30 1.05 Normal
I associate qualities in packaging of beer
with qualities I see in myself 3.27 1.02 Normal
When I see beer packaging that is really well
designed I have a strong urge to buy it 3.46 0.97 High
Beer's packaging design can be a source of
satisfaction for me 3.48 0.97 High
Total 3.38 1.00 Normal
From Table 4.45, data presented that packaging had a total Mean in normal
level of perception indicated by a total Mean (Mean = 3.38) and Standard Deviation
in total at 1.00. This research found that "Beer's packaging design can be a source of
satisfaction for me" had the highest Mean (Mean = 3.48). Follow by "When I see beer
packaging that is really well designed I have a strong urge to buy it" (Mean = 3.46)
and "Buying beer with extravagant packaging makes me feel good about myself"

92
(Mean = 3.30). The lowest Mean (Mean = 3.27) was "I associate qualities in
packaging of beer with qualities I see in myself".
From Table 4.45, data also presented that "Buying beer with extravagant
packaging makes me feel good about myself" had the most deviation of information
among 4 elements (S.D. = 1.05). While the least deviation of information among 4
elements were "When I see beer packaging that is really well designed I have a strong
urge to buy it" and "Beer's packaging design can be a source of satisfaction for me"
had the same Standard Deviation (S.D. = 0.97).
Table 4.46: Mean, Standard Deviation and Respondents perception of social media
Social media MEAN S.D. Perception
Level
I use social media to enhance my
relationship with beer brand A 2.33 1.03 Low
I use social media to enhance my
understanding of beer brand A 2.30 1.01 Low
I use social media to follow up activities
related to beer brand A’s products 2.36 1.08 Low
I use social media to keep up to date with
beer brand A’s product releases 2.34 1.11 Low
Total 2.33 1.06 Low

93
From Table 4.46, data presented that packaging had a total Mean in low level
of perception indicated by a total Mean (Mean = 2.33) and Standard Deviation in total
at 1.06. This research found that "I use social media to follow up activities related to
beer brand A’s products" had the highest Mean (Mean = 2.36). Follow by "I use
social media to keep up to date with beer brand A’s product releases" (Mean = 2.34)
and "I use social media to enhance my relationship with beer brand A" (Mean = 2.33).
The lowest Mean (Mean = 2.30) was "I use social media to enhance my understanding
of beer brand A".
From Table 4.46, data also presented that "I use social media to keep up to
date with beer brand A’s product releases" had the most deviation of information
among 4 elements (S.D. = 1.11). While the least deviation of information among 4
elements was "I use social media to enhance my understanding of beer brand A" (S.D.
= 1.01).
Table 4.47: Mean, Standard Deviation and Respondents perception of country of origin
Country of origin MEAN S.D. Perception
Level
Beer from Holland is the best quality 3.27 0.88 Normal
Beer from Spain is the best quality 3.02 0.83 Normal
Beer from Germany is the best quality 3.64 1.00 High
Beer from Thailand is the best quality 3.29 0.90 Normal
Total 3.30 0.90 Normal

94
From Table 4.47, data presented that country of origin had a total Mean in
normal level of perception indicated by a total Mean (Mean = 3.30) and Standard
Deviation in total at 0.90. This research found that "Beer from Germany is the best
quality" had the highest Mean (Mean = 3.64). Follow by "Beer from Thailand is the
best quality" (Mean = 3.29) and "Beer from Holland is the best quality" (Mean =
3.27). The lowest Mean (Mean = 3.02) was "Beer from Spain is the best quality".
From Table 4.47, data also presented that "Beer from Germany is the best
quality" had the most deviation of information among 4 elements (S.D. = 1.00). While
the least deviation of information among 4 elements was "Beer from Spain is the best
quality" (S.D. = 0.83).
Table 4.48: Mean, Standard Deviation and Respondents perception of convenient and
practical functions
Convenient and practical functions MEAN S.D. Perception
Level
I like beer because it is easy to drink 3.80 1.02 High
I prefer to order beer because it is available
to order in most places 3.70 1.09 High
I drink beer because it is inexpensive drink 3.44 1.08 High
I drink beer because it is expensive drink 2.67 0.99 Normal
I drink beer because it is easy to transport 3.46 1.13 High
Total 3.41 1.06 High

95
From Table 4.48, data presented that convenient and practical functions had a
total mean in high level of perception indicated by a total Mean (Mean = 3.41) and
Standard Deviation in total at 1.06. This research found that "I like beer because it is
easy to drink" had the highest Mean (Mean = 3.80). Follow by "I prefer to order beer
because it is available to order in most places" (Mean = 3.70), "I drink beer because it
is easy to transport" (Mean = 3.46), and "I drink beer because it is inexpensive drink"
(Mean = 3.44). The lowest Mean (Mean = 2.67) was "I drink beer because it is
expensive drink".
From Table 4.48, data also presented that "I drink beer because it is easy to
transport" had the most deviation of information among 5 elements (S.D. = 1.13).
While the least deviation of information among 5 elements was "I drink beer because
it is expensive drink" (S.D. = 0.99).
Table 4.49: Mean, Standard Deviation and Respondents perception of brand preference
Brand preference MEAN S.D. Perception
Level
I would buy a beer brand A rather than any other
brands available 3.03 1.13 Normal
I am willing to recommend others to buy beer
brand A 3.03 1.09 Normal
I definitively purchase beer brand A in the future 3.13 1.08 Normal
I am likely to purchase beer brand A in the future 3.20 1.06 Normal
Total 3.10 1.09 Normal

96
From Table 4.49, data presented that brand preference had a total Mean in
normal level of perception indicated by a total Mean (Mean = 3.10) and Standard
Deviation in total at 1.09. This research found that "I am likely to purchase beer brand
A in the future" had the highest Mean (Mean = 3.20). Follow by "I definitively
purchase beer brand A in the future" (Mean = 3.13). The lowest Mean (Mean = 3.03)
were "I would buy a beer brand A rather than any other brands available" and "I am
willing to recommend others to buy beer brand A" which had the same Mean.
From Table 4.49, data also presented that "I would buy a beer brand A rather
than any other brands available" had the most deviation of information among 4
elements (S.D. = 1.13). While the least deviation of information among 4 elements
was "I am likely to purchase beer brand A in the future" (S.D. = 1.06).
4.3 Analysis of the data based on assumptions
The assumption consisted of beer characteristic, branding, beer types, situation
appropriateness statements, packaging, social media, country of origin, convenient
and practical functions, and brand preference.
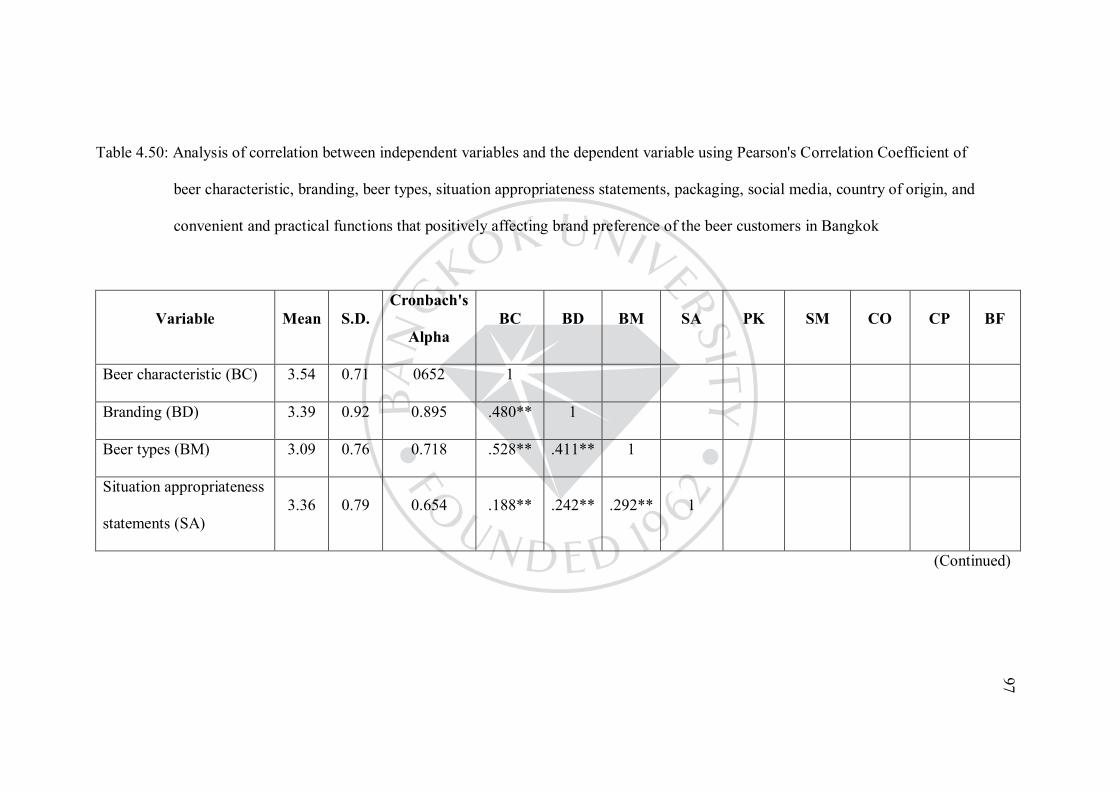
Table 4.50: Analysis of correlation between independent variables and the dependent variable using Pearson's Correlation Coefficient of
beer characteristic, branding, beer types, situation appropriateness statements, packaging, social media, country of origin, and
convenient and practical functions that positively affecting brand preference of the beer customers in Bangkok
Variable Mean S.D. Cronbach's
Alpha BC BD BM SA PK SM CO CP BF
Beer characteristic (BC) 3.54 0.71 0652 1
Branding (BD) 3.39 0.92 0.895 .480** 1
Beer types (BM) 3.09 0.76 0.718 .528** .411** 1
Situation appropriateness
statements (SA) 3.36 0.79 0.654 .188** .242** .292** 1
(Continued)
97

98
Table 4.50 (Continued): Analysis of correlation between independent variables and the dependent variable using Pearson's Correlation
Coefficient of beer characteristic, branding, beer types, situation appropriateness statements, packaging, social
media, country of origin, and convenient and practical functions that positively affecting brand preference of the
beer customers in Bangkok
Variable Mean S.D. Cronbach's
Alpha BC BD BM SA PK SM CO CP BF
Packaging (PK) 3.38 0.84 0.896 .422** .543** .365** .196** 1
Social media (SM) 2.33 1.00 0.960 .269** .446** .358** .260** .475** 1
Country of origin (CO) 3.30 0.72 0.807 .320** .423** .418** .350** .410** .424** 1
Convenient and practical
functions (CP) 3.41 0.80 0.807 .292** .284** .324** .480** .218** .346** .466** 1
Brand preference (BF) 3.10 1.00 0.946 .201** .651** .260** .232** .411** .469** .355** .267** 1
**Correlation is significant at the .01 level.
98

99
From table 4.50, the explanation was expressed as below
Hypothesis 1, beer characteristic has a positive relationship toward brand
preference or not. The analysis exhibited that beer characteristic had a positive
relationship toward brand preference referred from Pearson's Correlation Coefficient,
0.201 at .01 statistical significant level.
Hypothesis 2, branding has a positive relationship toward brand preference or
not. The analysis exhibited that branding had a positive relationship toward brand
preference referred from Pearson's Correlation Coefficient, 0.651 at .01 statistical
significant level.
Hypothesis 3, beer types has a positive relationship toward brand preference or
not. The analysis exhibited that beer types had a positive relationship toward brand
preference referred from Pearson's Correlation Coefficient, 0.260 at .01 statistical
significant level.
Hypothesis 4, situation appropriateness statements has a positive relationship
toward brand preference or not. The analysis exhibited that situation appropriateness
statements had a positive relationship toward brand preference referred from Pearson's
Correlation Coefficient, 0.232 at .01 statistical significant level.
Hypothesis 5, packaging has a positive relationship toward brand preference
or not. The analysis exhibited that packaging had a positive relationship toward brand
preference referred from Pearson's Correlation Coefficient, 0.411 at .01 statistical
significant level.
Hypothesis 6, social media has a positive relationship toward brand preference
or not. The analysis exhibited that social media had a positive relationship toward

100
brand preference referred from Pearson's Correlation Coefficient, 0.469 at .01
statistical significant level.
Hypothesis 7, country of origin has a positive relationship toward brand
preference or not. The analysis exhibited that country of origin had a positive
relationship toward brand preference referred from Pearson's Correlation Coefficient,
0.355 at .01 statistical significant level.
Hypothesis 8, convenient and practical functions has a positive relationship
toward brand preference or not. The analysis exhibited that convenient and practical
functions had a positive relationship toward brand preference referred from Pearson's
Correlation Coefficient, 0.267 at .01 statistical significant level.
Table 4.51: Beer characteristic, branding, beer types, situation appropriateness
statements, packaging, social media, country of origin, and convenient
and practical functions that positively affecting brand preference of the
beer customers in Bangkok
Model Sum of
Squares df
Mean
Square F Sig.
1 Regression
Residual
Total
114.317 8 14.290 26.545 .000a
118.969 221 .538
233.285 229
From table 4.51, ANOVA analysis confirmed that independent variables,
which consisted of beer characteristic, branding, beer types, situation appropriateness

101
statements, packaging, social media, country of origin, and convenient and practical
functions had influence on dependent variable, which was brand preference due to
Sig. of the equation equaled 0.000 at .01 significant level.
Table 4.52: Multiple Regression Analysis of beer characteristic, branding, beer types,
situation appropriateness statements, packaging, social media, country of
origin, and convenient and practical functions that positively affecting
brand preference of the beer customers in Bangkok
Dependent Variable: Brand preference, R = 0.700, R2 = 0.490, Constant = 0.728
Independent
Variables R R2 Β
Std
Error t Sig
Toler
ance VIF
(Constant) 0.325 2.236 0.026
Beer
characteristic
(BC)
0.201 0.040 -0.180 0.088 -2.925 0.004* 0.609 1.643
Branding (BD) 0.651 0.424 0.596* 0.069 9.379 0.000* 0.572 1.748
Beer types (BM) 0.260 0.068 -0.014 0.081 -0.235 0.814 0.618 1.618
Situation
appropriateness
statements (SA)
0.232 0.054 0.031 0.072 0.557 0.578 0.734 1.362
Packaging (PK) 0.411 0.169 0.046 0.072 0.735 0.463 0.593 1.687
(Continued)

102
Table 4.52 (Continued): Multiple Regression Analysis of beer characteristic,
branding, beer types, situation appropriateness statements,
packaging, social media, country of origin, and convenient
and practical functions that positively affecting brand
preference of the beer customers in Bangkok
Dependent Variable: Brand preference, R = 0.700, R2 = 0.490, Constant = 0.728
Independent
Variables R R2 Β
Std
Error t Sig
Toler
ance VIF
Social media
(SM) 0.469 0.220 0.197* 0.060 3.307 0.001* 0.653 1.531
Country of
origin (CO) 0.355 0.126 0.032 0.086 0.519 0.604 0.614 1.628
Convenient and
practical
functions (CP)
0.267 0.071 0.048 0.076 0.800 0.425 0.637 1.569
*significant at the .01 level
From table 4.52, Multiple Regression Analysis could be determined the proper
model aimed for the prediction of brand preference. The ideas of brand preference had
been the causes of brand preference of beer consumers in Bangkok. The analysis
showed that three independent variables had significant effect toward brand preference
at the .01 level and could be as the predictors for brand preference. The predictors for
brand preference were beer characteristic (Sig. = 0.004), branding (Sig. = 0.000), and

103
social media (Sig. = 0.001). On the contrary, the rest independent variables had no
positive influence on brand preference then they could not be as the predictors. The
independent variables disabled be as predictors for brand preference were beer types
(Sig. = 0.814), situation appropriateness statements (Sig. = 0.578), packaging (Sig. =
0.463), country of origin (Sig = 0.604), and convenient and practical functions (Sig. =
0.425).
Since this research aimed to study for factors positively affecting brand
preference of customers in Bangkok. Hence, the principal of this research focused
the positive standardized beta coefficients (β). From table 4.52, Multiple Regression
Analysis showed that three independent variables which were beer characteristic
(β = -0.180), branding (β = 0.596), and social media (β = 0.197) could be the predictors
toward brand preference. Nevertheless, only two independent variables acted as
predictors in this research which were branding (β = 0.596) and social media (β =
0.197). Although, the Multiple Regression Analysis showed that beer characteristic
had positively affected toward brand preference at significant level of .01 but the
standardized beta coefficient of beer characteristic was a negative value (β = -0.180)
which made beer characteristic acted as a suppressor variable. Suppressor variable
was the uncorrelated variable. The function of suppressor was to improve the overall
prediction by restraining some errors in the other factors (Pandey & Elliott, 2010).
Hence, the conclusion was that beer characteristic had no positive influence on brand
preference at statistical significant level of .01 and disabled to use as a predictor for
brand preference in this research. Eventually, the most two effective predictive
independent variables in this research were branding (β = 0.596) and social media

104
(β = 0.197) as respectively. Branding and social media explained the positive influence
on brand preference of the customers at 49.0%. The other 51.0% were influenced by
the other variables that were not used in this research. The standard error was ±0.325
then the result was as the following equation.
Y (Brand preference) = 0.728 + 0.596 (Branding) + 0.197 (Social media)
The implications from the above equation were as below
If, branding was increased by 1 point and other factors remained the same then
resulted in brand preference would be increased by 0.596 point.
If, social media was increased by 1 point and other factors remained the same
then resulted in brand preference would be increased by 0.197 point.
Data from table 4.52 used to test the following hypothesis.
Hypothesis 9, by using Multiple Regression Analysis, the result showed that
branding and social media had positive influence toward brand preference at
statistical significant level of .01. Whereas, beer characteristic, beer types, situation
appropriateness statements, packaging, country of origin, and convenient and practical
functions had no positive influence on brand preference at .01 statistical significant.
4.4 Other Analysis
As of principle of Multiple Linear Regression advised that the relationship
among group of independent variables were prohibited. By mean of the relationship
among independent variables was understood as Multicollinearity (Chaisamran,
2016). In the case of high multicollinearity was denoted as high degree of relationship
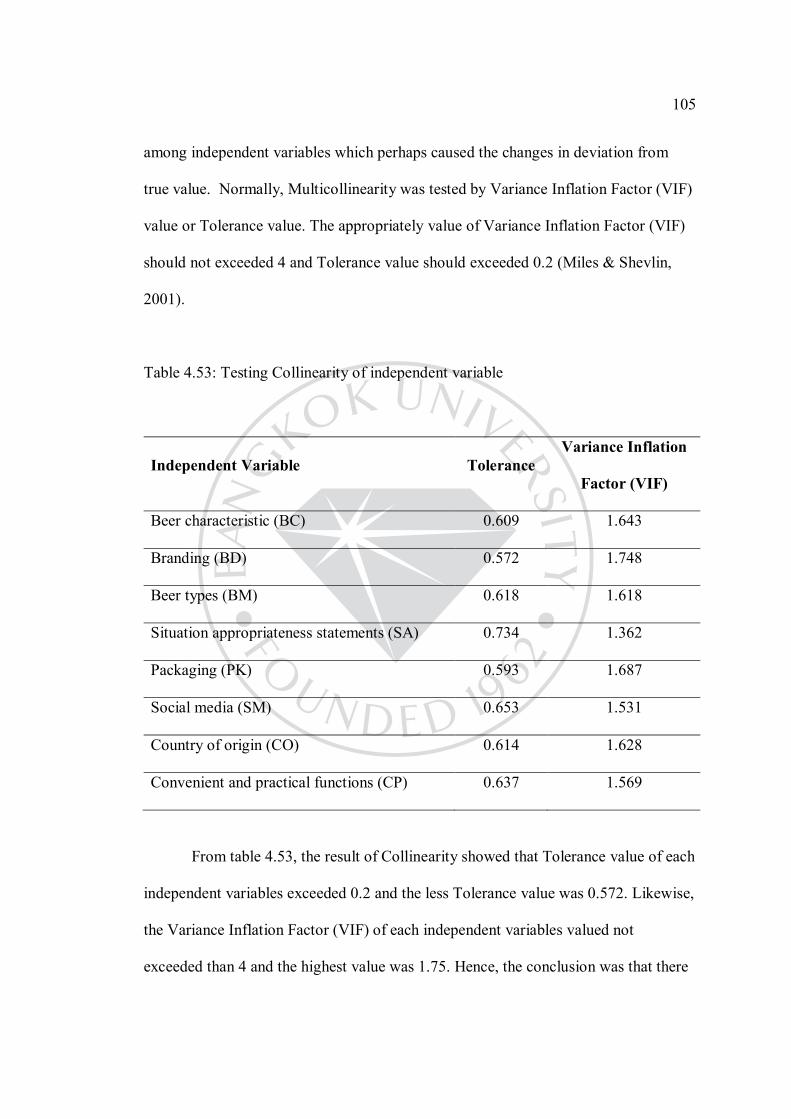
105
among independent variables which perhaps caused the changes in deviation from
true value. Normally, Multicollinearity was tested by Variance Inflation Factor (VIF)
value or Tolerance value. The appropriately value of Variance Inflation Factor (VIF)
should not exceeded 4 and Tolerance value should exceeded 0.2 (Miles & Shevlin,
2001).
Table 4.53: Testing Collinearity of independent variable
Independent Variable Tolerance Variance Inflation
Factor (VIF)
Beer characteristic (BC) 0.609 1.643
Branding (BD) 0.572 1.748
Beer types (BM) 0.618 1.618
Situation appropriateness statements (SA) 0.734 1.362
Packaging (PK) 0.593 1.687
Social media (SM) 0.653 1.531
Country of origin (CO) 0.614 1.628
Convenient and practical functions (CP) 0.637 1.569
From table 4.53, the result of Collinearity showed that Tolerance value of each
independent variables exceeded 0.2 and the less Tolerance value was 0.572. Likewise,
the Variance Inflation Factor (VIF) of each independent variables valued not
exceeded than 4 and the highest value was 1.75. Hence, the conclusion was that there

106
had no Multicollinearity among independent variables in this research then was able
to apply Multiple Regression Analysis.
Figure 4.1: Result of Multiple Regression Analysis from Scope of Research
Country of Origin
Brand Preference
H8: β = 0.048 , r = 0.267
Beer Characteristic
Branding
Beer Types
Situation Appropriateness Statements
Social Media
Packaging
Convenient and Practical Functions
H1: β = -0.180 , r = 0.201
H2: β = 0.596, r = 0.651
H3: β = -0.014, r = 0.260
H5: β = 0.046 , r = 0.411
H4: β = 0.031 , r = 0.232
H7: β = 0.032 , r = 0.355
H6: β = 0.197 , r = 0.469
Influence or positive relation
No influence or no positive relation

107
From Figure 4.1, presented that only branding and social media had positive
influence on brand preference of the beer customers in Bangkok. Whereas, beer
characteristic, beer types, situation appropriateness statements, packaging, country of
origin, and convenient and practical functions had no positive influence on brand
preference of the beer customers in Bangkok.

CHAPTER 5
CONCLUSIONS AND RECOMMENDATIONS
This is the final chapter which summarizes and presents the main points from
research analysis. This research aims to answer to the assumptions of this independent
study. The final part of this chapter comprises of the future research recommendation.
5.1 Summary of Study
The purpose of this research was to study the positive influent factors of beer
characteristic, branding, beer types, situation appropriateness statements, packaging,
social media, country of origin, and convenient and practical functions on beer A’s
brand preference of customers in Bangkok. The research was conducted by surveying
with questionnaire method. The population sample were collected from 230
respondents who were over 18 years of age and had experienced drinking beer for
either once or on regular basis at Chatuchak, Wattana, and Bang Rak Districts in
Bangkok. The sample size was gathered by the non-probability sampling. Then, data
was analyzed in quantitative approach by SPSS program.
5.2 Hypothesis Assumption
The interesting factors in this research were beer characteristic, branding, beer
types, situation appropriateness statements, packaging, social media, country of origin,
and convenient and practical functions influenced on brand preference. The collected
data focused on male respondents aged between 30-39 years old, single with bachelor
degree. Their salary ranged from 15,001 to 30,000 baht per month, and all had jobs

109
private companies. Their beer brand preference was beer brand A. They would drink
on special occasion, and regularly consumed it on Friday and Saturday, and had
weekly expenses on beer at from 201 to 500 baht. They could make a purchase
decision by themselves. Research results based on hypothesis concluded that.
Hypothesis 1, beer characteristic factor has a positive relationship toward
brand preference or not. The result from the analysis showed that beer characteristic
had a positive relationship toward brand preference at .01 significant level. So, the
hypothesis was accepted.
Hypothesis 2, branding factor has a positive relationship toward brand
preference or not. The result from the analysis showed that branding had a positive
relationship toward brand preference at .01 significant level. So, the hypothesis was
accepted.
Hypothesis 3, beer types factor has a positive relationship toward brand
preference or not. The result from the analysis showed that beer types had a positive
relationship toward brand preference at .01 significant level. So, the hypothesis was
accepted.
Hypothesis 4, situation appropriateness statements factor has a positive
relationship toward brand preference or not. The result from the analysis showed that
situation appropriateness statements had a positive relationship toward brand
preference at .01 significant level. So, the hypothesis was accepted.
Hypothesis 5, packaging factor has a positive relationship toward brand
preference or not. The result from the analysis showed that packaging had a positive
relationship toward brand preference at .01 significant level. So, the hypothesis was
accepted.

110
Hypothesis 6, social media factor has a positive relationship toward brand
preference or not. The result from the analysis showed that social media had a
positive relationship toward brand preference at .01 significant level. So, the
hypothesis was accepted.
Hypothesis 7, country of origin factor has a positive relationship toward brand
preference or not. The result from the analysis showed that country of origin had a
positive relationship toward brand preference at .01 significant level. So, the
hypothesis was accepted.
Hypothesis 8, convenient and practical functions factor has a positive
relationship toward brand preference or not. The result from the analysis showed that
convenient and practical functions had a positive relationship toward brand preference
at .01 significant level. So, the hypothesis was accepted.
Hypothesis 9, Beer characteristic, branding, beer types, situation
appropriateness statements, packaging, social media, country of origin and convenient
and practical functions has positive influence towards brand preference of the beer
customers in Bangkok. The result from the analysis showed that factors that
performed as predictors of brand preference (Y) were branding and social media,
which explained by the positive influence at 49%. Another 51% was influenced by the
other variables that were not used in this research. The standard error was ±0.325 by
using the following equation.
Y (Brand preference) = 0.728 + 0.596 (Branding) + 0.197 (Social media)

111
5.3 Summary
This research studied the positive influent factors of beer characteristic,
branding, beer types, situation appropriateness statements, packaging, social media,
country of origin, and convenient and practical functions on beer A’s brand
preference of customers in Bangkok. The research was conducted by surveying with
questionnaire method. The population sample were collected from 230 respondents
who were over 18 years of age and had experienced drinking beer for either once or
on regular basis in Chatuchak, Wattana, and Bang Rak Districts in Bangkok. Then,
data was analyzed in quantitative approach by SPSS program and found the
interesting information as follows.
Hypothesis 1, beer characteristic has a positive relationship on brand
preference or not. The results from Pearson correlation analysis showed that beer
characteristic had no positive relationship toward brand preference at .01 statistical
significant level, which accepted hypothesis. Beer characteristic defined the intrinsic
attribute of beer, which was the important factor for customers to prefer or not prefer
a particular beer brand (Aquilani et al., 2015). Meanwhile, the willingness to pay for
the intrinsic attribute increased especially because of taste and bitterness (Gabrielyan
et al., 2014). Because of a variety of beer brands in Thai market, which caused
customers some difficulties to recognize beer characteristic of a particular brand. Beer
customers in Bangkok acknowledged that all beer brands in market were similar in
characteristic.
Hypothesis 2, branding has a positive relationship on brand preference or not.
The results from Pearson correlation analysis showed that branding had a positive
relationship toward brand preference at .01 statistical significant level, which accepted

112
hypothesis. Branding referred to customers’ experience toward products’ image and
products’ meaning, which contributed to the sets of product attributes (Kladou et al.,
2016). As mentioned that there had been many beer brands in Thai beer market. To
make brand preference required experiences or connection between brands and
customers. The aim of branding was to make the differentiation among the same
product category that had been recognized by customers. The product recognition or
product differentiation depended upon the strategy of branding. This information was
confirmed by the research from Siegel et al. (2013) that customers made purchase
based on the extrinsic attributes such as branding when there had been no difference
in the intrinsic attributes, product characteristics or product performance.
Hypothesis 3, beer types has a positive relationship on brand preference or not.
The results from Pearson correlation analysis showed that beer types had no positive
relationship toward brand preference at .01 statistical significant level, which accepted
hypothesis. Beer types referred to beer categories separated from raw material used to
produce beer. Currently, the behavior of beer customers was more of the search for
product information, which connected to perceive sensory (Gómez-Corona et al.,
2016). Nevertheless, the interesting level of information was varied by individual
because this factor was not a significant and effective factor affecting customers in
Bangkok. In conclusion, customers in Bangkok did not want to know the in-depth
details. The major reason to consume beer for customers in Bangkok was merely for
pleasure.
Hypothesis 4, situation appropriateness statements has a positive relationship
on brand preference or not. The results from Pearson correlation analysis showed that
situation appropriateness statements had no positive relationship toward brand
113
preference at .01 statistical significant level, which accepted hypothesis. The
judgment to choose a particular brand was influenced by the situation context and the
product familiarity (Cardello et al., 2016). Nonetheless, beer customers in Bangkok
more relied on product familiarity in order to choose a particular beer brand for a
situation. Further, the plenty of available beer brands in Bangkok caused customers
confused then customers always preferred the familiar brand as a priority in
eventually.
Hypothesis 5, packaging has a positive relationship on brand preference or
not. The results from Pearson correlation analysis showed that packaging had no
positive relationship toward brand preference at .01 statistical significant level, which
accepted hypothesis. The buying behavior of customers for food and beverage was
that they normally chose after exploring only the front of packaging and without
considering the alternative products (Simmonds & Spence, n.d.). However, not every
customer made their choices based on only the packaging. Nowadays, almost all beer
producers designed the similar packaging so there was no difference for customers to
recognize and could not base their judgment based on the packaging. Just a few beer
producers came up with unique packaging with the expectation to attract buyers due
to the packaging. Although most of customers preferred luxury packaging designed
but could not afford because of high price.
Hypothesis 6, social media has a positive relationship on brand preference or
not. The results from Pearson correlation analysis showed that social media had a
positive relationship toward brand preference at .01 statistical significant level, which
accepted hypothesis. Social media was counted as a powerful medium to send
message about the products to the customers (Prentice & Handsjuk, 2016). Nowadays,

114
the lifestyle of people revolved around social media among those living in both urban
and rural areas. The number of social media users in Bangkok was significantly
higher than that in other provinces. Furthermore, time spent on social media was
lesser but gave out positive result. Also, it had an impact on the large group of target
audiences. The culture of people today had changed. They believed any information
presented on social media without any doubt. They wanted to follow the trends, on
social media. Then, to make a particular beer brand well-known should be in a public
space like social media where connection was made with consumers in Bangkok.
Hypothesis 7, country of origin has a positive relationship on brand preference
or not. The results from Pearson correlation analysis showed that country of origin had
no positive relationship toward brand preference at .01 statistical significant level,
which accepted hypothesis. Country of origin referred to a generic and specific product
characteristic information, which derived from the sources of product (Manrai et al.,
1998). Also, this connected to the past experiences received from the perception of
particular countries in terms of product acceptable level (Roth & Romeo, 1992).
However, customers in Bangkok gave less attention to the origin of beer. Conversely,
most customers were interested in the activities more than the origin because they gave
more benefits to them.
Hypothesis 8, convenient and practical functions has a positive relationship on
brand preference or not. The results from Pearson correlation analysis showed that
convenient and practical functions had no positive relationship toward brand
preference at .01 statistical significant level, which accepted hypothesis. Convenient
and practical functions meant for the comfort ability of customers toward the
products. Commonly, customers preferred products that made them felt more

115
comfortable (Silva et al., 2016). In fact, every beer producers in Bangkok chose the
same pattern in order to create the perception of comfort in the products either during
purchasing stage or period of time that the product was consumed. Lastly, there was
no difference in convenient perception level because they were perceived as a
standard service.
Hypothesis 9, by applying multiple regression analysis on the hypothesis
found that factors influenced brand preference were branding and social media at
statistic significant level of .01. Like Siegel et al. (2013), this showed that branding
was the important influent factor on brand preference even though there was no
difference in product characteristic or product performance. Furthermore, branding
was the image and meaning of the product, which derived from a set of product
attributes (Kladou et al., 2016). Customers noticed the differences of branding. Then
their relationship with particular brands could be expressed due to level of their
experience with the brand. Hence, the experiences could be created through
communication. Currently, the most efficient communication was through social
media (Prentice & Handsjuk, 2016). Customers accessed to social media to follow
news about the products, related activities to enhance brand image, and the
information for a product judgment. Then this should been applied on social media to
create experiences in the mind of the customers. Together with social media or
branding or both factors could enhance the experiences of customers toward brand
and led to brand preference.
116
5.4 Recommendations
5.4.1 Recommendations for business
The result of the research on the positive influence on beer characteristic,
branding, beer types, situation appropriateness statements, packaging, social media,
country of origin, and convenient and practical functions on brand preference of beer
customers in Bangkok showed that branding and social media had an impact on brand
preference of beer consumers. Therefore, beer manufacturers and importers need to
consider and develop the strategies for branding and social media as their marketing
strategies. They should focus on creating the uniqueness of the beer brand from
external appearances such as logo, tagline, and product image in order to connect with
target group customers and enhance the level of brand awareness. Also the beer
manufacturers and importers should launch a clear message, offer an easy access to
communication, and allow broad communication to customers by utilizing social
media, which was the most effective communication tools in this era.
5.4.1.1 Beer manufacturers and importers should focus more on
branding strategies because branding has more influence on brand preference according
to the equation result. The objective of branding is to create the meaning of brand in
customers’ mind and connect between customers and the brand. Branding strategies
and development of beer brands could be based on trustworthiness, reputation,
familiarity, and brand image.
Trustworthiness and reputation could be both represented in the
development. Brand reputation could be developed from beer taste, quality of
ingredients, quality of products, quality of packaging, and product consistency.
Customers will keep repurchase if they are satisfied with the product from a particular

117
brand. Therefore, a consistency of product is very important. Any major or minor
change of the products need to be announced. Customers will not trust the brand, if the
product has gone through any changes without the announcement. Good reputation of
the product can develop long-term trust, which can lead to be brand loyalty. Moreover,
social responsibility should be part of the plan to form reputation. Beer manufacturers
and importers have to be concerned with a group of non-beer drinkers in order to avoid
the resistance from this group.
Familiarity could be developed from customers’ experiences. There are
many ways to create experiences among customers. Beer sampling at the events such
as a concert or small party can be effective because customers have a chance to try the
product. It also creates the opportunity for the next purchase and advertise the product
at the same time. Expanding distribution channel is important as well. The place to
sell beer should not be limited to supermarkets, convenient stores or liquor stores. It
can be in the restaurants, pubs, bars, hotels, and hostel, etc. The other channels should
belong to the event organizers because they have to set up many events and parties.
The last suggestion for branding is about brand image. Brand image
must be clear in order to make brand identity and differentiate itself from others.
Brand image is very important because it can create originality among brands.
Nowadays, customers purchase a particular beer brand because that brand reflects
customers’ individual identity through its image. To make brand image clear starts
from brand’s direction, brand’s target group, brand logo, tagline, related events and
advertisement.

118
5.4.1.2 Social media is another important factor that influences brand
preference. Lifestyle of residents in Bangkok are changing. They are more connected
with social media such as Facebook, Instagram, and Line. The most effective social
media is Facebook because it has an interactive communication, which is the system
of posting comments and pictures. Currently, social media is the most effective outlet
and very cost effective used to communicate in order to enhance brand awareness and
brand preference among customers.
Hence, beer manufacturers and importers should utilize social media to
enhance relationship between brand and customers, enhance the understanding of
customers on brands, allow customers to follow up related activities, which are set up
by brands, and open up a channel for them to receive updates from the brands. Then,
beer brands need to set up multi-channels of social media where a staff or team can
monitor. The contents of each social media can promote knowledge, news about the
products, and brand activities. The team who is responsible for maintaining social
media will communicate and receive feedback from customers to learn about the data
of the market size, market trend, weakness, competitors, and threats. This data will be
useful in the adjustment of future marketing strategy.
However, the use of social media needs control and monitoring. There
is a risk to receive negative comments, which could be damage trust and loyalty on
the brand. Then, the team must be trained on how to respond to negative comments.
5.4.2 Recommendations for future research
Researchers should consider the following issues in the future research
5.4.2.1 Respondents of this research were respondents who worked as
the staff in an office building and mostly consumed beer in special occasion. Then

119
their brand preference was based on some criteria whereas the group of party lovers
might prefer on be selective about the brand because of its price range and product
size. Accordingly, the reasons of brand preference toward beer may be different from
the respondents who consumed only in special occasions and who consumed for
parties. As a result, researcher recommend to collect data from the respondents who
are at a party or restaurant to compare with the existing data.
5.4.2.2 In this research, only branding and social media could predict
consumer brand preference. Some respondents mentioned to the other factors such as
the unit selling price, choice of packaging size, product promotions, and brand
activities in the open-ended question of the questionnaire. According to this, the unit
selling price, choice of packaging size, product promotions, and brand activities might
have influence on consumer brand preference and should be added in the future
research.
5.4.2.3 During factor analysis, this research found that some questions
had factor loading value less than 0.3, which should be deleted from the group or
using confirmatory factor analysis in the future research. The questions that were not
exceed factor loading value are question 3: I drink beer when I am at parties (SA3)
and question 5: I drink beer for a special occasion (SA5) in situation appropriateness
statements grouping and question 4: I drink beer because it is expensive drink (CP4)
in convenient and practical functions grouping.
5.4.2.4 Theories and knowledge on branding and social media’s effects
towards brand preference had been expanded. Future research should add some
mentioned factors, which were not used in this research to find the relation.
Furthermore, the future research could include data collection in other big cities like

120
Chonburi, Prachuap Khiri Khan and Chiang Mai to compare the results in different
regions of Thailand based on different drinking culture based on location. Also, the
data can be collected, compared, and analyzed between the Thai and the foreign beer
consumers in Thailand because of different cultures based on nationality.

121
BIBLIOGRAPHY
2559 industry stat dec for download-web oie. (2017). Retrieved from
http://www.oie.go.th/academic/statistics.
Aaker, D. A. (2009). Managing brand equity: Simon and Schuster. New York:
The Free Press.
Abidin, S. Z., Effendi, R. A. A. R. A., Ibrahim, R., & Idris, M. Z. (2014). A semantic
approach in perception for packaging in the SME's food industries in
malaysia: A case study of malaysia food product branding in united kingdom.
Procedia - Social and Behavioral Sciences, 115, 115-130.
Ajzen, I. (2011). The theory of planned behaviour: Reactions and reflections.
Psychology & Health, 26, 1113-1127.
Allan, C. (2009). Adapting to the new retail market. Retrieved from www.ecu.edu/cs-
cas/.../adaptingtothenewretailmarket-091014143001-phpapp02.pdf.
Alreck, P. L., & Settle, R. B. (1999). Strategies for building consumer brand
reference. Journal of Product & Brand Management, 8(2), 130-144.
Ampuero, O., & Vila, N. (2006). Consumer perceptions of product packaging.
Journal of Consumer Marketing, 23(2), 100-112.
Anderson, E. W., & Shugan, S. M. (1991). Repositioning for changing preferences: The
case of beef versus poultry. Journal of Consumer Research, 18(2), 219-232.
Aquilani, B., Laureti, T., Poponi, S., & Secondi, L. (2015). Beer choice and
consumption determinants when craft beers are tasted: An exploratory study of
consumer preferences. Food Quality and Preference, 41, 214-224.

122
Barreda, A. A., Bilgihan, A., Nusair, K., & Okumus, F. (2016). Online branding:
Development of hotel branding through interactivity theory. Tourism
Management, 57, 180-192.
Beer market share in thailand. (2015). Retrieved from http://marketeer.co.th/archives/
44681.
Bennett, R., & Bove, L. (2002). Identifying the key issues for measuring loyalty.
Australasian Journal of Market Research, 9(2), 27-44.
Bhat, S., & Reddy, S. K. (1998). Symbolic and functional positioning of brands.
Journal of Consumer Marketing, 15(1), 32-43.
Boon Rawd Brewery. (2014). Boon rawd brewery company profile. Retrieved from
http://www.boonrawd.co.th /en/boonrawd-brewery-home.php.
Brodmerkel, S., & Carah, N. (2013). Alcohol brands on facebook: the challenges of
regulating brands on social media. Journal of Public Affairs, 13(3), 272-281.
Calvo Porral, C., & Levy-Mangin, J.-P. (2015). Global brands or local heroes?:
evidence from the Spanish beer market. British Food Journal, 117(2), 565-
587.
Cardello, A. V., Pineau, B., Paisley, A. G., Roigard, C. M., Chheang, S. L., & Guo, L. F.,
et al. (2016). Cognitive and emotional differentiators for beer: An exploratory
study focusing on “uniqueness”. Food Quality and Preference, 54, 23-38.
Chaisamran, C. (2016). Factors positively affecting purchase Intention of automobile
consumers at thailand international motor expo 2015 in bangkok. Retrieved
from http://dspace.bu.ac.th/jspui/bitstream/123456789/2082/1/chiratt_chai
.pdf.

123
Chen, W., Srinivasan, S. R., Elkasabany, A., & Berenson, G. S. (1999). Cardiovascular
risk factors clustering features of insulin resistance syndrome (syndrome X) in a
biracial (black-white) population of children, adolescents, and young adults the
Bogalusa heart study. American Journal of Epidemiology, 150(7), 667-674.
Chung, F., Yegneswaran, B., Liao, P., Chung, S. A., Vairavanathan, S., & Islam, S.,
et al.(2008). Stop questionnaire: A tool to screen patients for obstructive sleep
apnea. The Journal of the American Society of Anesthesiologists, 108(5), 812-821.
Cohen, J. (1977). Statistical power analysis for the behavioral sciences academic.
New York: Press.
Countries that consume the most alcohol. (2017). Retrieved from http://www.cnbc.com
/2013/05/08/CountriesThatConsumetheMostAlcohol.html?slide=1.
Craig, J. B., & Moores, K. (2006). A 10-year longitudinal investigation of strategy,
systems, and environment on innovation in family firms. Family Business
Review, 19(1), 1-10.
Crawford, A. (1987). Attitudes about alcohol: A general review. Drug and alcohol
dependence, 19(4), 279-311.
Donadini, G., Fumi, M., Kordialik-Bogacka, E., Maggi, L., Lambri, M., & Sckokai, P.
(2016). Consumer interest in specialty beers in three European markets. Food
Research International, 85, 301-314.
Fandos, C., & Flavián, C. (2006). Intrinsic and extrinsic quality attributes, loyalty and
buying intention: an analysis for a PDO product. British Food Journal, 108(8),
646-662.
124
Faul, F., Erdfelder, E., Buchner, A., & Lang, A.-G. (2009). Statistical power analyses
using G* Power 3.1: Tests for correlation and regression analyses. Behavior
Research Methods, 41(4), 1149-1160.
Fevre, J. L. (2016). Thailand weakest asean economy in 2016 – world bank.
Retrieved from https://aecnewstoday.com/2016/thailandweakestaseaneconomy
in2016worldbank/.
Gabrielyan, G., McCluskey, J. J., Marsh, T. L., & Ross, C. F. (2014). Willingness to
pay for sensory attributes in beer. Agricultural and Resource Economics
Review, 43(1), 125-139.
Giacalone, D., Frøst, M. B., Bredie, W. L. P., Pineau, B., Hunter, D. C.,& Paisley, A. G.,
et al. (2015). Situational appropriateness of beer is influenced by product
familiarity. Food Quality and Preference, 39, 16-27.
Goetsch, D. L., & Davis, S. B. (2014). Quality management for organizational
excellence. Upper Saddle River, NJ: Pearson.
Gómez-Corona, C., Escalona-Buendía, H. B., García, M., Chollet, S., & Valentin, D.
(2016). Craft vs. industrial: Habits, attitudes and motivations towards beer
consumption in Mexico. Appetite, 96, 358-367.
Gómez-Corona, C., Lelievre-Desmas, M., Escalona Buendía, H. B., Chollet, S., &
Valentin, D. (2016). Craft beer representation amongst men in two different
cultures. Food Quality and Preference, 53, 19-28.
Guinard, J.-X., Souchard, A., Picot, M., Rogeaux, M., & Sieffermann, J.-M. (1998).
Determinants of the thirst-quenching character of beer. Appetite, 31(1), 101-115.

125
Gutjar, S., Dalenberg, J. R., de Graaf, C., de Wijk, R. A., Palascha, A., & Renken, R. J.,
et al. (2015). What reported food-evoked emotions may add: A model to predict
consumer food choice. Food Quality and Preference, 45, 140-148.
Heineken international swot analysis, usp & competitors. (2011 - 2017). Retrieved
from http://www.mbaskool.com/brandguide/food-and-beverages/4985-
heineken-international.html.
History of beer in Thailand. (2017). Retrieved from https://sites.google.com/a/email.
kmutnb.ac.th/beer-nayata/prawati-khxng-beiyr-ni-prathesthiy.
Hjelmar, U. (2011). Consumers’ purchase of organic food products. A matter of
convenience and reflexive practices. Appetite, 56(2), 336-344.
Import duty & taxes for lager beer. (2017). Retrieved from
https://www.dutycalculator.com/.
Jarurungsipong, R., & Rakthum, N. (2013, September 19). Tax hike and weaker
economy reduce consumption of alcoholic beverages. TRIS Rating.
Johansson, J. K., Douglas, S. P., & Nonaka, I. (1985). Assessing the impact of
country of origin on product evaluations: A new methodological perspective.
Journal of Marketing Research, 388-396.
Kladou, S., Kavaratzis, M., Rigopoulou, I., & Salonika, E. (2016). The role of brand
elements in destination branding. Journal of Destination Marketing &
Management.
Kline, P. (2014). An easy guide to factor analysis. New York: Routledge.
Lee, L., Frederick, S., & Ariely, D. (2006). Try it, you'll like it the influence of
expectation, consumption, and revelation on preferences for beer.
Psychological Science, 17(12), 1054-1058.

126
Lee, M., & Lou, Y. C. (1995). Consumer reliance on intrinsic and extrinsic cues in
product evaluations: A conjoint approach. Journal of Applied Business
Research, 12(1), 21.
Mainstream beer news. (2016). Retrieved from http://positioningmag.com/1091301.
Manrai, L. A., Lascu, D.-N., & Manrai, A. K. (1998). Interactive effects of country of
origin and product category on product evaluations. International Business
Review, 7(6), 591-615.
Mcbroom, R. (2013). Beer in thailand. Retrieved from http://blog.wishbeer.com/beer/
beer-in-thailand/.
Miles, J., & Shevlin, M. (2001). Applying regression and correlation: A guide for
students and researchers. London: Sage.
Mudambi, S. M., Doyle, P., & Wong, V. (1997). An exploration of branding in
industrial markets. Industrial Marketing Management, 26(5), 433-446.
Nicholls, J. (2012). Everyday, everywhere: Alcohol marketing and social media—
current trends. Alcohol and Alcoholism, 47(4), 486-493.
Notar, C., & Kanthawongs, P. (2016). Factors positively influence purchase intention
of high quality food products brand A of consumers in Bangkok. In Paper
presented at the The 54th Kasetsart University Annual Conference. Bangkok,
Thailand: Kasetsart University.
Osman, I., Osman, S., Mokhtar, I., Setapa, F., Shukor, S. A. M., & Temyati, Z.
(2014). Family food consumption: desire towards convenient food products.
Procedia - Social and Behavioral Sciences, 121, 223-231.

127
Pandey, S., & Elliott, W. (2010). Suppressor variables in social work research: Ways
to identify in multiple regression models. Journal of the Society for Social
Work and Research, 1(1), 28-40.
Powers, T., Advincula, D., Austin, M. S., Graiko, S., & Snyder, J. (2012). Digital and
social media in the purchase decision process. Journal of advertising research,
52(4), 479-489.
Prentice, C., & Handsjuk, N. (2016). Insights into vodka consumer attitude and
purchasing behaviors. Journal of Retailing and Consumer Services, 32, 7-14.
Priolo, D. (2013). 5 strategies for changing customer buying behavior. Retrieved from
http://blogs.richardson.com/2013/01/07/strategies-for-changing-customer-
behaviors/.
Rinwong, S. (2016). The battle in thailand beer market. Retrieved from
http://www.bangkokbiznews.com/news/detail/714740.
Roth, M. S., & Romeo, J. B. (1992). Matching product catgeory and country image
perceptions: A framework for managing country-of-origin effects. Journal of
international business studies, 23(3), 477-497.
Sankrusme, S. (2016). Strategy to be market leader of chang beer. In Paper presented
at the 2016 CIK AUC Conference Proceedings Entrepreneurship, Responsible
Management, and Economic Development. Retrieved from http://www.cyrusik.
org/wp-content/uploads/2016/11/Strategy-to-Be-Market-Leader-of-Chang-
Beer.pdf.
Saunders, M., Lewis, P., & Thornhill, A. (2006). Research methods for business
students (3rd ed.). London: Prentice Hall.
128
Schiffman, L. G., & Kanuk, L. L. (1994). Consumer behavior (5th ed.). NY: McGraw-
Hill.
Sester, C., Dacremont, C., Deroy, O., & Valentin, D. (2013). Investigating consumers’
representations of beers through a free association task: A comparison between
packaging and blind conditions. Food Quality and Preference, 28(2), 475-483.
Siegel, M., DeJong, W., Naimi, T. S., Fortunato, E. K., Albers, A. B., & Heeren, T.,
et al. (2013). Brand‐specific consumption of alcohol among underage youth in
the United States. Alcoholism: Clinical and Experimental Research, 37(7),
1195-1203.
Signha beer: Boon rawd brewery, Thai beer industry with five forces and swot
analysis, tows matrix, perceptual map, positioning. (2009-2016). Retrieved
from https://brightkite.com/essay-on/signha-beer-boon-rawd-brewery-thai-
beer-business-with-five-forces-and-swot-analysis-tows-matrix-perceptual-
map-positioning.
Silva, A. P., Jager, G., Van Bommel, R., Van Zyl, H., Voss, H. P., & Hogg, T., et al.
(2016). Functional or emotional? How dutch and portuguese conceptualise beer,
wine and non-alcoholic beer consumption. Food Quality and Preference, 49,
54-65.
Simmonds, G., & Spence, C. (n.d.). Thinking inside the box: How seeing products on,
or through, the packaging influences consumer perceptions and purchase
behaviour. Food Quality and Preference.
Sonne, F. G. H. (2016). Carlsberg sees huge potential in Thai beer market. Retrieved
from http://scandasia.com/?s=Carlsberg+sees+huge+potential+in+Thai+beer+
market.

129
Spáčil, V., & Teichmannová, A. (2016). Intergenerational analysis of consumer
behaviour on the beer market. Procedia - Social and Behavioral Sciences, 220,
487-495.
Swartz, K. (2016). 7 trends shaping the alcohol industry in 2016-17. Retrieved from
http://beveragedynamics.com/2016/08/29/7-trends-shaping-the-alcohol-
industry-in-2016-17/.
Swoboda, B., & Morschett, D. (2001). Convenience-oriented shopping: A model from
the perspective of consumer research. In L. J. Frewer, E. Risvik & H.
Schifferstein (Eds.), Food, people and society: A european perspective of
consumers’ food choices (pp. 177-196). Berlin, Heidelberg: Springer Berlin
Heidelberg.
Swot analysis of thaibev thai beverages. (2013). Retrieved from
http://www.managementparadise.com/sayed123/documents/15961/swot-analysis-
of-thaibev-thai-beverages/.
Thai asia pacific brewery background. (2015). Retrieved from http://www.tapb.co.th
/en/about#/background.
Thai beer part I: The famous brands taste of thailand. (2017). Retrieved from
http://www.tasteofthailandfoodtours.org/thaibeerpartithefamousbrands/.
Thai beverage pcl corporate profile. (2015). Retrieved from http://www.thaibev.com
/th08/aboutus.aspx?sublv1gID=132.
Thailand’s economic conditions in 2014. (2014). Retrieved from https://www.bot.or.th/
English/.../EconomicConditions/.../Annual_eng_2014.pdf.

130
Thanaratakkharathawi, T., & Kanthawongs, P. (2016). Factors positively influencing
purchase intention of clothing consumers on instagram. In Paper presented at
the The 54th Kasetsart University Annual Conferencec. Bangkok, Thailand:
Kasetsart University.
The office of industrial economics. (2017). Industrial statistic. Retrieved from
http://www.oie.go.th/academic/statistics.
Theng So, J., Grant Parsons, A., & Yap, S. F. (2013). Corporate branding, emotional
attachment and brand loyalty: The case of luxury fashion branding. Journal of
Fashion Marketing and Management: An International Journal, 17(4), 403-423.
Thomson, D. (2010). Going beyond liking: Measuring emotional and conceptual
profiles to make better new products. Consumer-driven Innovation in Food
and Personal Care Products, 219-274.
Trochim, W. (2006). Non-probability sampling: Purposive sampling. Ithaca, NY: n.p.
Van Ittersum, K., Candel, M. J. J. M., & Meulenberg, M. T. G. (2003). The influence
of the image of a product's region of origin on product evaluation. Journal of
Business Research, 56(3), 215-226.
Van Trijp, H. C. (1994). Product-related determinants of variety-seeking behavior for
foods. Appetite, 22(1), 1-10.
Vanichbuncha, K. (2008). Multivariate analysis. Thailand: Thammasarn.
Vanichbuncha, K. (2009). Statistic for research. Bangkok: Thammasan.
Wang, H., Wei, Y., & Yu, C. (2008). Global brand equity model: Combining
customer‐based with product‐market outcome approaches. Journal of Product
& Brand Management, 17(5), 305-316.

131
Wiratchai, N. (2012). Interested sample size and statistical analyzes determination.
Bangkok: National Research Council of Thailand.

132
APPENDIX A
Survey Questions (English)

133
NO..........
Questionnaire
on
Factors Positively Affecting Purchase Intention of Beer Brand A’s
Customers in Bangkok
Instruction: Objective of this survey is to collected data for use in master of business
administration research, Bangkok University. The result of this research will be
benefit to beer industry. In this regard, cooperation from the respondents are needed.
I, Sunkamol Khongsawatvorakul, master's degree of business administration student
from Bangkok University thankfully for your cooperation
Instruction: Please answer the following question and put in that matches you most.
1. Gender
1) Male 2) Female
2. Age
1) From 18 to 23 years 2) 24–29 years old
3) 30-39 years old 4) 40-49 years old
5) Over 50 years old

134
3. Status
1) Single 2) Married 3) Divorced/ Widowed/ Separated
4. Level of education
1) Under Bachelor Degree 2) Bachelor Degree
3) Master Degree 4) Doctorate Degree
5) Others, Please Specify ……………………………………….
5. Monthly income
1) Less than and equal to 15,000 baht 2) 15,001–30,000 baht
3) 30,001–50,000 baht 4) 50,001-100,000 baht
5) 100,001–150,000 baht 6) 150,001– 200,000 baht
7) 200,001–500,000 baht 8) More than 500,000 baht
6. Professional Status
1) State enterprise employee 2) Private employee
3) Self-Employed 4) Searching for job
5) Housewives 6) Retired
7) Students
8) Others, Please Specify ……………………………………
7. Your type(s) of alcoholic beverage frequent consumed. (Can select more than
one choice)
1) Beer 2) Wine 3) Whisky
4) Vodka 5) Others, Please Specify ………………………………

135
8. Your favorable brand(s) of beer. (Can select more than one choice)
1) Heineken 2) Singha
3) Leo 4) Chang
5) Carlsberg 6) San Miguel
7) Hitachino Nest 8) Estrella Damm
9) Hoegaarden 10) Guinness
11) Leffe 12) Stella Artois
13) Tiger 14) A.K. Damm
15) Others, Please Specify ……………………………………
9. Your frequency of beer consumption.
1) Daily 2) Once a week
3) Several times per week 4) Once a month
5) Several times per month 6) Once a year
7) Several times per year 8) Only on special occasions
9) Others, Please Specify ……………………………………
10. Day(s) of the week you consume most. (Can select more than one choice)
1) Monday 2) Tuesday
3) Wednesday 4) Thursday
5) Friday 6) Saturday
7) Sunday
136
11. How much you spend on beer per week. (Can select more than one choice)
1) Less than and equal to 50 baht 2) 51 – 200 baht
3) 201 – 500 baht 4) 501 – 1,000 baht
5) 1,001 – 1,500 baht 6) 1,501 – 2,000 baht
7) 2,001 – 3,000 baht 8) More than 3,000
12. Who has most influence on your beer purchase intention. (Can select more
than one choice)
1) Yourself 2) Families
3) Beer experts review 4) Friends
5) Others, Please Specify ……………………………………

137
Please mark every question with only one in the box that most corresponds to your
comments.
Agreeable Level
Highest
(5)
High
(4)
Moderate
(3)
Low
(2)
Lowest
(1)
Beer Characteristic
1 I buy beer because of its aroma.
2 I like beer which is not too bitter.
3 I buy beer because of its alcoholic
percentage.
4 I buy beer because of product quality.
Branding
1 I choose beer brand A based on the
brand's trustworthiness.
2 I choose beer brand A based on the
brand's reputation.
3 I am very familiar with beer brand A.
4 I have a clear image of the type of
people who drink beer brand A.
Beer types
1 I prefer Types wheat beer.
2 I prefer malted beer.
3 I prefer fruit beer.

138
Agreeable Level
Highest
(5)
High
(4)
Moderate
(3)
Low
(2)
Lowest
(1)
4 I prefer craft beer.
Situation appropriateness statements
1 I drink beer when I am at a casual
dining restaurant.
2 I drink beer when I need to relax
alone at home.
3 I drink beer when I am at parties.
4 I drink beer when I want to impress
someone.
5 I drink beer for a special occasion.
Packaging
1 Buying beer with extravagant
packaging makes me feel good about
myself.
2 I associate qualities in packaging
of beer with qualities I see in
myself.
3 When I see beer packaging that is
really well designed I have a strong
urge to buy it.

139
Agreeable Level
Highest
(5)
High
(4)
Moderate
(3)
Low
(2)
Lowest
(1)
4 Beer's packaging design can be a
source of satisfaction for me.
Social media
1 I use social media to enhance my
relationship with beer brand A.
2 I use social media to enhance my
understanding of beer brand A.
3 I use social media to follow up
activities related to beer brand A’s
products.
4 I use social media to keep up to date
with beer brand A’s product releases.
Country of origin
1 Beer from Holland is the best quality.
2 Beer from Spain is the best quality.
3 Beer from Germany is the best
quality.
4 Beer from Thailand is the best quality.
Convenient and practical functions
1 I like beer because it is easy to drink.

140
Agreeable Level
Highest
(5)
High
(4)
Moderate
(3)
Low
(2)
Lowest
(1)
2 I prefer to order beer because it is
available to order in most places.
3 I drink beer because it is inexpensive
drink.
4 I drink beer because it is expensive
drink.
5 I drink beer because it is easy to
transport.
Brand preference
1 I would buy a beer brand A rather
than any other brands available.
2 I am willing to recommend others to
buy beer brand A.
3 I definitively purchase beer brand A
in the future.
4 I am likely to purchase beer brand A
in the future.

141
Please recommend for other factors that might positively affect the purchase
intention towards beer brand A.
_____________________________________________________________________
_____________________________________________________________________
_____________________________________________________________________
_____________________________________________________________________
_____________________________________________________________________
_____________________________________________________________________
Thank you for your cooperation
Miss Sunkamol Khongsawatvorakul
E–Mail: [email protected]

142
APPENDIX B
Survey Questions (Thai)
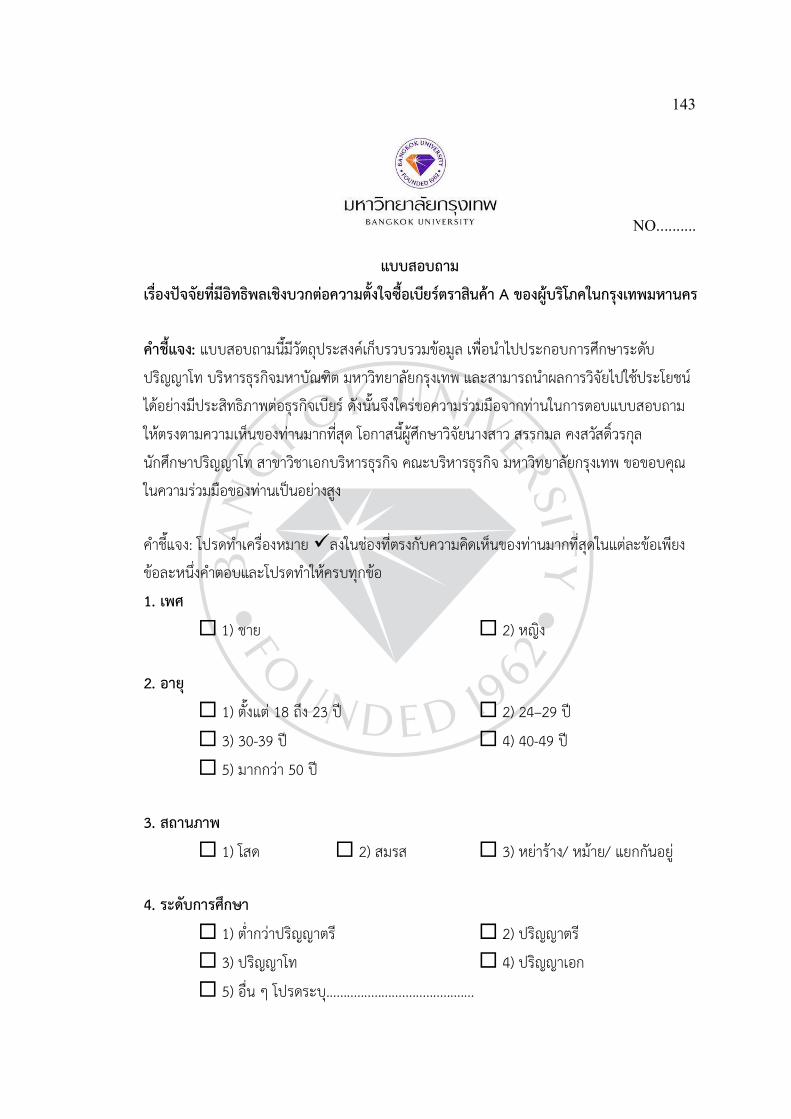
143
NO..........
แบบสอบถาม เรองปจจยทมอทธพลเชงบวกตอความตงใจซอเบยรตราสนคา A ของผบรโภคในกรงเทพมหานคร
คาชแจง: แบบสอบถามนมวตถประสงคเกบรวบรวมขอมล เพอนาไปประกอบการศกษาระดบ
ปรญญาโท บรหารธรกจมหาบณฑต มหาวทยาลยกรงเทพ และสามารถนาผลการวจยไปใชประโยชน
ไดอยางมประสทธภาพตอธรกจเบยร ดงนนจงใครขอความรวมมอจากทานในการตอบแบบสอบถาม
ใหตรงตามความเหนของทานมากทสด โอกาสนผศกษาวจยนางสาว สรรกมล คงสวสดวรกล
นกศกษาปรญญาโท สาขาวชาเอกบรหารธรกจ คณะบรหารธรกจ มหาวทยาลยกรงเทพ ขอขอบคณ
ในความรวมมอของทานเปนอยางสง
คาชแจง: โปรดทาเครองหมาย ลงในชองทตรงกบความคดเหนของทานมากทสดในแตละขอเพยง
ขอละหนงคาตอบและโปรดทาใหครบทกขอ
1. เพศ
1) ชาย 2) หญง
2. อาย
1) ตงแต 18 ถง 23 ป 2) 24–29 ป
3) 30-39 ป 4) 40-49 ป
5) มากกวา 50 ป
3. สถานภาพ
1) โสด 2) สมรส 3) หยาราง/ หมาย/ แยกกนอย
4. ระดบการศกษา
1) ตากวาปรญญาตร 2) ปรญญาตร
3) ปรญญาโท 4) ปรญญาเอก
5) อน ๆ โปรดระบ...........................................

144
5. รายไดตอเดอน
1) ตากวาหรอเทากบ 15,000 บาท 2) 15,001–30,000 บาท
3) 30,001–50,000 บาท 4) 50,000-100,000 บาท
5) 100,001–150,000 บาท 6) 150,001– 200,000 บาท
7) 200,001–500,000 บาท 8) มากกวา 500,000 บาท
6. อาชพ
1) พนกงานรฐวสาหกจ/ รบราชการ 2) พนกงานบรษทเอกชน/ รบจาง
3) ธรกจสวนตว/ คาขาย 4) อยในชวงหางาน
5) ไมประกอบอาชพ 6) เกษยณ
7) นกเรยน/ นกศกษา
8) อน ๆ โปรดระบ....................................................................................
7. ทานดมเครองดมแอลกอฮอลประเภทไหนบอย (สามารถเลอกไดมากกวา 1 ขอ)
1) เบยร 2) ไวน
3) วสก 4) วอดกา
5) อน ๆ โปรดระบ....................................................................................
8. ตราสนคาของเบยรททานนยมชนชอบ (สามารถเลอกไดมากกวา 1 ขอ)
1) ไฮเนเกน (Heineken) 2) สงห (Singha)
3) ลโอ (Leo) 4) ชาง (Chang)
5) คารลสเบรก (Carlsberg) 6) ซาน มเกล (San Miguel)
7) ฮตาชโน เนส (Hitachino Nest) 8) เอสเทรลลา แดม (Estrella Damm)
9) ฮการเดน (Hoegaarden) 10) กนเนส (Guinness)
11) เลฟ (Leffe) 12) สเทลลาอาทวา (Stella Artois)
13) ไทเกอร (Tiger) 14) เอ.เค. แดมม (A.K. Damm)
15) อน ๆ โปรดระบ....................................................................................

145
9. ความบอยในการดมเบยรของทาน
1) ทกวน 2) 1 ครงตอสปดาห
3) มากกวา 1 ครงตอสปดาห 4) 1 ครงตอเดอน
5) มากกวา 1 ครงตอเดอน 6) 1 ครงตอป
7) มากกวา 1 ครงตอป 8) ดมในโอกาสพเศษเทานน
9) อนๆ โปรดระบ....... .............................................................................
10. วนใดในสปดาหททานดมเบยรเปนประจา (สามารถเลอกไดมากกวา 1 ขอ)
1) วนจนทร 2) วนองคาร
3) วนพธ 4) วนพฤหส
5) วนศกร 6) วนเสาร
7) วนอาทตย
11. ทานใชจายในการดมเบยรเปนจานวนเทาไรตอหนงสปดาห (สามารถเลอกไดมากกวา 1 ขอ)
1) นอยกวาหรอเทากบ 50 บาท 2) 51 – 200 บาท
3) 201 – 500 บาท 4) 501 – 1,000 บาท
5) 1,001 – 1,500 บาท 6) 1,501 – 2,000 บาท
7) 2,001 – 3,000 บาท
8) อน ๆ โปรดระบ....................................................................................
12. บคคลใดมอทธพลตอความตงใจในการเลอกซอเบยรสาหรบทาน (สามารถเลอกไดมากกวา 1 ขอ)
1) ตวทานเอง 2) ครอบครว
3) บทวจารณจากนกชมเบยร 4) เพอน
5) อน ๆ โปรดระบ....................................................................................

146
โปรดทาเครองหมาย ลงในชองทตรงกบความคดเหนของทานมากทสดในแตละขอเพยงขอละหนง
คาตอบและโปรดทาใหครบทกขอ
ระดบความเหนดวย
มาก
ทสด
(5)
มาก
(4)
ปาน
กลาง
(3)
นอย
(2)
นอย
ทสด
(1)
คณลกษณะของเบยร (Beer Characteristic)
1 ทานเลอกดมเบยรทกลนของเบยร
2 ทานเลอกดมเบยรทมรสชาตไมขมจนเกนไป
3 ทานเลอกดมเบยรจากปรมาณของแอลกอฮอลใน
เบยร
4 ทานเลอกซอเบยรทคณภาพของเบยร
ตราสนคา (Branding)
1 ทานเลอกดมเบยรเบยรตราสนคาAจากความ
เชอมนในตราสนคา
2 ทานเลอกซอเบยรตราสนคาAจากชอเสยงของตรา
สนคา
3 ทานเลอกซอเบยรตราสนคาAจากประสบการณท
เคยดม
4 ทานมภาพลกษณทชดเจนของกลมคนทดมเบยร
ตราสนคาA
คณลกษณะประเภทของเบยร
(Beer types)
1 ทานนยมดมเบยรททามาจากขาวสาล
2 ทานนยมดมเบยรททามาจากขาวมอลต
3 ทานนยมดมเบยรทมสวนผสมของผลไม
4 ทานนยมดมคราฟทเบยร
สถานการณทเหมาะสมในการดมเบยร (Situation appropriateness statements)
1 ทานดมเบยรในมออาหารเยน
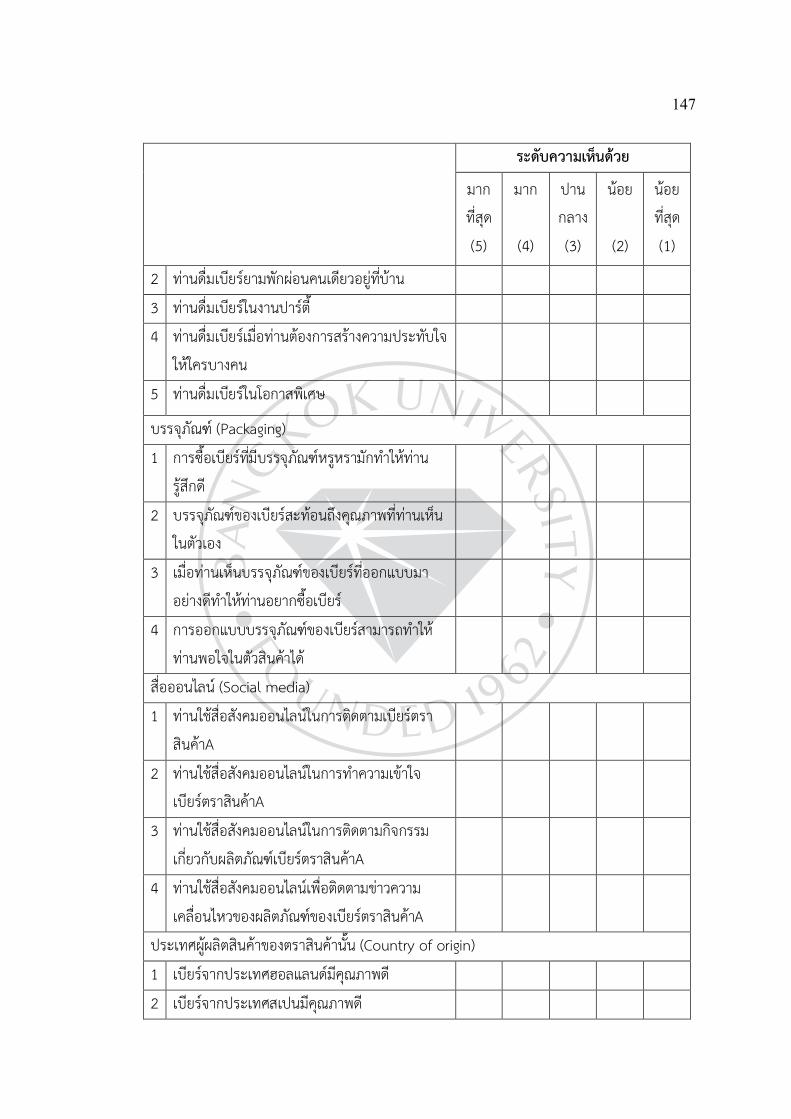
147
ระดบความเหนดวย
มาก
ทสด
(5)
มาก
(4)
ปาน
กลาง
(3)
นอย
(2)
นอย
ทสด
(1)
2 ทานดมเบยรยามพกผอนคนเดยวอยทบาน
3 ทานดมเบยรในงานปารต
4 ทานดมเบยรเมอทานตองการสรางความประทบใจ
ใหใครบางคน
5 ทานดมเบยรในโอกาสพเศษ
บรรจภณฑ (Packaging)
1 การซอเบยรทมบรรจภณฑหรหรามกทาใหทาน
รสกด
2 บรรจภณฑของเบยรสะทอนถงคณภาพททานเหน
ในตวเอง
3 เมอทานเหนบรรจภณฑของเบยรทออกแบบมา
อยางดทาใหทานอยากซอเบยร
4 การออกแบบบรรจภณฑของเบยรสามารถทาให
ทานพอใจในตวสนคาได
สอออนไลน (Social media)
1 ทานใชสอสงคมออนไลนในการตดตามเบยรตรา
สนคาA
2 ทานใชสอสงคมออนไลนในการทาความเขาใจ
เบยรตราสนคาA
3 ทานใชสอสงคมออนไลนในการตดตามกจกรรม
เกยวกบผลตภณฑเบยรตราสนคาA
4 ทานใชสอสงคมออนไลนเพอตดตามขาวความ
เคลอนไหวของผลตภณฑของเบยรตราสนคาA
ประเทศผผลตสนคาของตราสนคานน (Country of origin)
1 เบยรจากประเทศฮอลแลนดมคณภาพด
2 เบยรจากประเทศสเปนมคณภาพด

148
ระดบความเหนดวย
มาก
ทสด
(5)
มาก
(4)
ปาน
กลาง
(3)
นอย
(2)
นอย
ทสด
(1)
3 เบยรจากประเทศเยอรมนมคณภาพด
4 เบยรจากประเทศไทยมคณภาพด
ความสะดวกและความเปนจรง (Convenient and practical functions)
1 ทานชอบดมเบยรเนองจากดมงาย
2 ทานเลอกสงเบยรเพราะเบยรมจาหนายเกอบทก
ราน
3 ทานเลอกดมเบยรเนองจากราคาทไมแพง
4 ทานเลอกดมเบยรเนองจากราคาทแพง
5 ทานเลอกดมเบยรเนองจากความสะดวกในการ
ขนยาย
ความพงพอในในตราสนคา (Brand preference)
1 ทานเลอกทจะซอเบยรตราสนคา A มากกวาเบยร
ตราสนคาอน ๆ
2 ทานยนดทจะแนะนาใหเพอนๆของทานซอเบยร
ตราสนคา A
3 ทานเลอกทจะซอเบยรตราสนคา A ในอนาคต
อยางแนนอน
4 ทานมแนวโนมทจะเลอกซอเบยรตราสนคา A ใน
อนาคต

149
ขอใหทานแนะนาเพมเตมสาหรบปจจยเชงบวกอน ๆ ทมผลตอความตงใจซอเบยรตราสนคา A
_________________________________________________________________________
_________________________________________________________________________
_________________________________________________________________________
_________________________________________________________________________
_________________________________________________________________________
_________________________________________________________________________
โอกาสนผศกษาวจยขอขอบคณในความรวมมอของทานเปนอยางสง
นางสาว สรรกมล คงสวสดวรกล
E–Mail: [email protected]

150
APPENDIX C
Form to Expert Letter

151

152
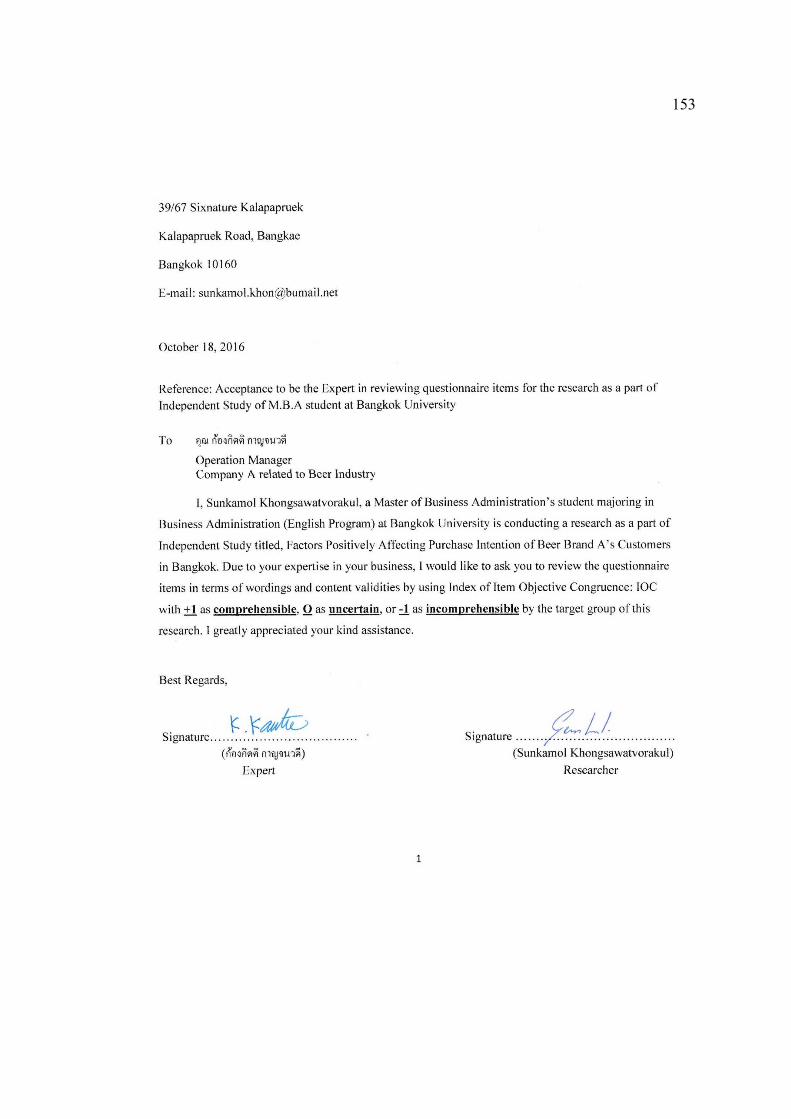
153

154
Factors Original
Eng. v.
Adjusting
Eng. v.
Adjusted
Thai v.
IOC Comments
from the
expert
Total
points
Beer
Characteristic (BC)
(Aquilani, Laureti,
Poponi, & Secondi,
2015)
BC1 : Aroma BC1: I buy
beer
because of
its aroma.
BC1: ทาน
เลอกดมเบยร
ทกลนของ
เบยร
(Gómez-Corona,
Escalona-Buendía,
García, Chollet, &
Valentin, 2016)
BC2: Bitter BC2: I like
beer which is
not too bitter.
BC2: ทานเลอก
ดมเบยรทม
รสชาตไมขม
จนเกนไป
BC3:
Alcoholic
percentage
BC3: I buy
beer because
of its alcoholic
percentage.
BC3: ทานเลอก
ดมเบยรจาก
ปรมาณของ
แอลกอฮอลใน
เบยร
BC4: Quality
(Perceived)
BC4: I buy
beer because
of product
quality.
BC4: ทานเลอก
ซอเบยรท
คณภาพ
ของเบยร
Branding
(BD)
(Prentice &
Handsjuk, 2016)
(Porral & Levy-
Mangin, 2015)
BD1: I chose
vodka based
on the
brand's
trustworthines
s.
BD1: I choose
beer brand A
based on the
brand's
trustworthines
s.
BD1:ทานเลอก
ดมเบยรตรา
สนคาเอจาก
ความเชอมนใน
ตราสนคา
BD2: I chose
vodka based
on the
brand's
reputation.
BD2: I choose
beer brand A
based on the
brand's
reputation.
BD2: ทาน
เลอกซอเบยร
ตราสนคาเอ
จากชอเสยง
ของตราสนคา
BD3: I am
very familiar
with brand
BD3: I am
very familiar
with beer
BD3: ทาน
เลอกซอเบยร
ตราสนคาเอ

155
Factors Original
Eng. v.
Adjusting
Eng. v.
Adjusted
Thai v.
IOC Comments
from the
expert
Total
points
X. brand A. จาก
ประสบการณ
ทเคยดม
BD4: I have a
clear image
of the type
of people
who use the
brand X.
BD4: I have a
clear image
of the type of
people who
drink beer
brand A.
BD4: ทานม
ภาพลกษณท
ชดเจนของ
กลมคนทดม
เบยรตรา
สนคาเอ
Beer Types (BM)
(Gómez-Corona et
al., 2016)
BM1: Which
type of beer
do you like
most?
BM1: I prefer
wheat beer.
BM1: ทาน
นยมดมเบยร
ททามาจาก
ขาวสาล
BM2: Which
type of beer
do you like
most?
BM2:
I prefer
malted beer.
BM2: ทานนยม
ดมเบยรททามา
จากขาวมอลต
BM3: Which
type of beer
do you like
most?
BM3: I prefer
fruit beer.
BM3: ทาน
นยมดมเบยร
ทมสวนผสม
ของผลไม
BM4: Which
type of beer
do you like
most?
BM4: I prefer
craft beer.
BM4: ทาน
นยมดม
คราฟทเบยร
Situation
appropriateness
statements. (SA)
(Cardello et al.,
2016)
SA1: At a
casual dining
restaurant.
SA1: I drink
beer when I
am at a
casual dining
restaurant.
SA1: ทานดม
เบยรในมอ
อาหารเยน
SA2: To drink
alone. At
SA2: I drink
beer when I
SA2: ทานดม
เบยรยาม

156
Factors Original
Eng. v.
Adjusting
Eng. v.
Adjusted
Thai v.
IOC Comments
from the
expert
Total
points
home. When
I want to
relax.
need to
relax alone
at home.
พกผอนคน
เดยวอยทบาน
SA3: At a
party.
SA3: I drink
beer when I
am at parties.
SA3: ทาน
มกจะดมเบยร
ในงานปารต
SA4: To
impress
someone.
SA4: I drink
beer when I
want to
impress
someone.
SA4: ทานดม
เบยรเมอทาน
ตองการสราง
ความ
ประทบใจให
ใครบางคน
SA5: For a
special
occasion.
SA5: I drink
beer for a
special
occasion.
SA5: ทาน
มกจะดมเบยร
ในโอกาส
พเศษ
Packaging.
(PK)
(Prentice &
Handsjuk, 2016)
PK1: Buying
vodka with
extravagant
packaging
makes me
feel good
about
myself.
PK1: Buying
beer with
extravagant
packaging
makes me
feel good
about
myself.
PK1: การซอ
เบยรทมบรรจ
ภณฑหรหรา
มกทาใหทาน
รสกด
PK2: I
associate
qualities in
packaging
with qualities
I see in
myself.
PK2: I
associate
qualities in
packaging of
beer with
qualities I
see in
myself.
PK2: บรรจ
ภณฑของ
เบยรสะทอน
ถงคณภาพท
ทานเหนใน
ตวเอง

157
Factors Original
Eng. v.
Adjusting
Eng. v.
Adjusted
Thai v.
IOC Comments
from the
expert
Total
points
PK3: When I
see vodka
packaging
that is really
well
designed I
have a
strong urge
to buy it.
PK3: When I
see beer
packaging
that is really
well
designed I
have a
strong urge
to buy it.
PK3: เมอทาน
เหนบรรจ
ภณฑของ
เบยรท
ออกแบบมา
อยางดทาให
ทานอยากซอ
เบยร
PK4: A
vodka's
packaging
design can
be a source
of
satisfaction
for me.
PK4: Beer's
packaging
design can
be a source
of
satisfaction
for me.
PK4: การ
ออกแบบ
บรรจภณฑ
ของเบยร
สามารถทาให
ทานพอใจใน
ตวสนคาได
Social media.
(SM)
(Prentice &
Handsjuk, 2016)
SM1: I use
social media
to enhance
my
relationship
with particular
brands of
vodka.
SM1: I use
social media
to enhance
my
relationship
with beer
brand A.
SM1: ทานใช
สอสงคม
ออนไลนในการ
ตดตามเบยร
ตราสนคาเอ
SM2: I use
social media
to enhance
my
understanding
of particular
brands of
SM2: I use
social media
to enhance
my
understanding
of beer brand
A.
SM2: ทานใช
สอสงคม
ออนไลนในการ
ทาความเขาใจ
เบยรตราสนคา
เอ

158
Factors Original
Eng. v.
Adjusting
Eng. v.
Adjusted
Thai v.
IOC Comments
from the
expert
Total
points
vodka.
SM3: I use
social media
to follow
vodka sales
promotions.
SM3: I use
social media
to follow up
activities
related to
beer brand
A’s products.
SM3: ทานใช
สอสงคม
ออนไลนใน
การตดตาม
กจกรรม
เกยวกบ
ผลตภณฑของ
เบยรตรา
สนคาเอ
SM4: I use
social media
to keep up
to date with
current
vodka
product
releases.
SM4: I use
social media
to keep up
to date with
product
releases of
beer brand
A.
SM4: ทานใช
สอสงคม
ออนไลนเพอ
ตดตามขาว
ความเคลอน
ไหวของ
ผลตภณฑเบยร
ตราสนคาเอ
Country of origin.
(CO)
(Prentice &
Handsjuk, 2016)
CO1: Some
countries
produce
better quality
vodka than
others.
CO1: Beer
from Holland
is the best
quality.
CO1: เบยรจาก
ประเทศ
ฮอลแลนดม
คณภาพด
CO2: Some
countries
produce
better quality
vodka than
others.
CO2: Beer
from Spain is
the best
quality.
CO2: เบยรจาก
ประเทศสเปนม
คณภาพด
CO3: Some
countries
CO3: Beer
from Germany
CO3: เบยรจาก
ประเทศ

159
Factors Original
Eng. v.
Adjusting
Eng. v.
Adjusted
Thai v.
IOC Comments
from the
expert
Total
points
produce
better quality
vodka than
others.
is the best
quality.
เยอรมนม
คณภาพด
CO4: Some
countries
produce
better quality
vodka than
others.
CO4: Beer
from Thailand
is the best
quality.
CO4: เบยรจาก
ประเทศไทยม
คณภาพด
Convenient and
Practical
Functions
(CP)
(Silva et al., 2016)
CP1: Easy to
drink.
CP1: I like
beer because
it is easy to
drink.
CP1: ทานชอบ
ดมเบยร
เนองจากดม
งาย
CP2: Practical
to order.
CP2: I prefer
to order beer
because it is
available to
order in most
places.
CP2: ทานเลอก
สงเบยรเพราะ
เบยรมจาหนาย
เกอบทกราน
CP3:
Inexpensive
drink.
CP3: I drink
beer because
it is
inexpensive
drink.
CP3: ทานเลอก
ดมเบยร
เนองจากราคา
ทไมแพง
CP4:
Expensive
drink.
CP4: I drink
beer because
it is expensive
drink.
CP4: ทานเลอก
ดมเบยร
เนองจากราคา
ทแพง

160
Factors Original
Eng. v.
Adjusting
Eng. v.
Adjusted
Thai v.
IOC Comments
from the
expert
Total
points
CP5: Easy to
transport.
CP5: I drink
beer
because it is
easy to
transport.
CP5: ทาน
เลอกดมเบยร
เนองจาก
ความสะดวก
ในการขนยาย
Brand preference
(BF)
(Prentice &
Handsjuk, 2016)
(Porral & Levy-
Mangin, 2015)
BF1: I would
buy this
product/bran
d rather than
any other
brands
available.
BF1: I would
buy beer
brand A
rather than
any other
brands
available.
BF1: ทาน
เลอกทจะซอ
เบยรตรา
สนคาเอ
มากกวาเบยร
ตราสนคา
อนๆ
BF2: I am
willing to
recommend
others to
buy this
product
/brand.
BF2: I am
willing to
recommend
others to
buy beer
brand A.
BF2: ทาน
ยนดทจะ
แนะนาให
เพอน ๆ ของ
ทานซอเบยร
ตราสนคาเอ
BF3:
Definitively, I
would
consider
buying Brand
X beer.
BF3: I
definitively
purchase
beer brand A
in the future.
BF3: ทาน
เลอกทจะซอ
เบยรตรา
สนคาเอใน
อนาคตอยาง
แนนอน
BF4: I am
likely to buy
Brand X
beer.
BF4: I am
likely to
purchase
beer brand A
in the future.
BF4: ทานม
แนวโนมทจะ
เลอกซอเบยร
ตราสนคาเอ
ในอนาคต
161
Reference:
Aquilani, B., Laureti, T., Poponi, S., & Secondi, L. (2015). Beer choice and
consumption determinants when craft beers are tasted: An exploratory study of
consumer preferences. Food Quality and Preference, 41, 214-224. doi:
http://dx.doi.org/10.1016/j.foodqual.2014.12.005
Calvo Porral, C., & Levy-Mangin, J.-P. (2015). Global brands or local heroes?:
evidence from the Spanish beer market. British Food Journal, 117(2), 565-587.
Cardello, A. V., Pineau, B., Paisley, A. G., Roigard, C. M., Chheang, S. L., Guo, L.
F., . . . Jaeger, S. R. (2016). Cognitive and emotional differentiators for beer:
An exploratory study focusing on “uniqueness”. Food Quality and Preference,
54, 23-38. doi: http://dx.doi.org/10.1016/j.foodqual.2016.07.001
Gómez-Corona, C., Escalona-Buendía, H. B., García, M., Chollet, S., & Valentin, D.
(2016). Craft vs. industrial: Habits, attitudes and motivations towards beer
consumption in Mexico. Appetite, 96, 358-367. doi:
http://dx.doi.org/10.1016/j.appet.2015.10.002
Gómez-Corona, C., Lelievre-Desmas, M., Escalona Buendía, H. B., Chollet, S., &
Valentin, D. (2016). Craft beer representation amongst men in two different
cultures. Food Quality and Preference, 53, 19-28. doi:
http://dx.doi.org/10.1016/j.foodqual.2016.05.010
Prentice, C., & Handsjuk, N. (2016). Insights into vodka consumer attitude and
purchasing behaviors. Journal of Retailing and Consumer Services, 32, 7-14.
doi: http://dx.doi.org/10.1016/j.jretconser.2016.05.009

162
Silva, A. P., Jager, G., van Bommel, R., van Zyl, H., Voss, H.-P., Hogg, T., . . . de
Graaf, C. (2016). Functional or emotional? How Dutch and Portuguese
conceptualise beer, wine and non-alcoholic beer consumption. Food Quality
and Preference, 49, 54-65. doi:
http://dx.doi.org/10.1016/j.foodqual.2015.11.007

163
BIODATA
Name-Surname: Sunkamol Khongsawatvorakul
E-mail [email protected]
Education Background:
1998-2002: Bachelor degree of Engineering, Civil Engineering
Kasetsart University, Bangkok

Bangkok University
License Agreemeut of Dissertation/rhesis/ Report of senior proJect
Mr.l ,-^tt r"oL\ 'riviub at 3q I 67
Soi
}c,'.^l^g -nK^lo poflr,"o.k
Sub-district-po*-s'1a1.2 District Pas%,\aLOe!,rrovince Ba"g kok, pastatcode-*. :l,Q:!-2fu? .*-ueingaBangkok
University sfirdent, shrdent m aSgOZqaA L .
Degreelevel ElBachelor /fuf*r,
g
- .,r \dAr. year Ao1?Day Z5 Month - .
E Doctorate
r*s--* Blr:i..u, AA4h iffi3&$ff/_ School Gradu?te School
hereafter refered to as "the licensor"
Bangkok University 1 19 Rarna 4 Road, Klong-Toey, Bangkok iOl t 0 hereaffer referred
to as "tle lioensee"
Both parties have agreed on t}e fotlowing terms and conditions:
1. The licensor certifies that he/she is fhe author and possesses the exclusive rights ofdissertatiorlthesi#report of senior project entitled
?'
FACTpR,g pOqItIVE Ly AFF EcTr 016 BEER .A's BRA^lDPff.F F EREflgF qF c_uqTn crlEg.s rN B &crcKoK
submitted in partial fulfillment ofthe requirement for. 0a ,? Busr nwof Bangkok Uuiversify (hereafrer referred to as "dissertation/ttres:is/ report of senior Ar\nni h istr-ti,project").
2. The lisensor Brants to the iicensee an indefinite and royalty free license of his/herdissertatiorlthesis/report of senior projeot to reproduce, adap.t, disffibute, rent out theoriginal or copy of the rnanuscnpt
3. In sase of any dispute in the oopyright ofthe dissertation/thasis/report of seniorproject between the licensor and others, or between the licensee and others, or anyother inconveniences in regard to tho copyright that prevent the licensee &omreproducing, adapting or distuibuting the manuscript, tho licensor agrees to indemniffthe iicensee against any damage incurred.

This agreement is prepared in duplicate identical wording for two copies. Both parties,-'
have read and fuliy understand its coutents and agree to comply with the above teffns
and conditions. Each party shall retain one signed copy of the agreement.
s.firt, ' Licensee
@irector, Librmy and Learning Center)
N; t hla,r*@"an, Graduate School)
,A-/dfr(Prograur Direclor)
Witaess -
Witness
.. 4
g,-''La,,,{l