Civil Society Lessons on Influencing National Adaptation policies in Nepal

Factors Influencing the Adaptation and Acceptance of Japanese Management Practices
in Thailand
Tanachart Raoprasert
Bachelor of Business Administration
Master of Business Administration
A thesis submitted in partial fulfillment
of the requirements for the degree of
Doctor of Business Administration
Victoria Graduate School of Business
Faculty of Business and Law
Victoria University
Melbourne, Australia
2008

Statement of Declaration
I, Tanachart Raoprasert, declare that the DBA thesis entitled 'Factors Influencing the
Adaptation and Acceptance of Japanese Management Practices in Thailand' is no
more than 65,000 words in length including quotes and exclusive of tables, figures,
appendices, bibliography, references and foot notes. This thesis contains no material
that has been submitted previously, in whole or in part, for the award of any other
academic degree or diploma. Except where otherwise indicated, this thesis is my own
work.
Signature ..................................................................... Date \ 7 110 12008

Acknowledgements
With the completion of this dissertation, there are several people to whom I owe a
great deal of thanks.
Firstly, I wish to acknowledge and thank my principal supervisor, Professor Sardar
Islam for his encouragement and support throughout much of my candidacy. His
guidance, assistance, patience and support over the long years of research work have
been very beneficial, especially during the frustrating times.
Sincere thanks go to my co-supervisor, Dr Rodney Leonard Turner for his time in
helping me pass through difficulties with specific statistics. His extensive assistance
with the AMOS program, and support and encouragement in my DBA program have
been very valuable.
Appreciation is due to both Professor Stephen Martin, and Dr Jane Menzies, my
former co-supervisors, for their assistance in the early stages of my DBA program.
I would like to thank Dr Yuka Fujimoto, Human Resources Management lecturer, Dr
Abdullahi Ahmed Research Econometrician, and Dr Shahril Baharim, Management
lecturer, for their insightful comments and suggestions on my thesis. I would also like
to express my gratitude to Dr Petre Santry, who assisted in proofreading the final draft
of my thesis.
Last but not least, I must sincerely thank to my sponsor, Mahasarakham University
for supporting me with the funds necessary to finish my study.
11

ABSTRACT
Cross-cultural aspects of management, especially international business management,
have been a topic of intense investigation in the contemporary management literature.
Consequently, given the higher presence of Japanese businesses in Thailand, a fertile
field in international management literature is the adaptation of Japanese management
practices in Thailand.
Prior empirical studies of Japanese management practices in Thailand have mainly
focused on Thai employees' perceptions of these practices and on how well they are
implemented, with very little research examining factors that influence the adaptation
and acceptance of Japanese management practices in Thailand. To fill this gap, this
study develops models that are helpful in examining factors that can be introduced by
Japanese organizations in Thailand to enable Thai subordinates to accept, and
Japanese managers to adapt, Japanese management practices to Thai culture.
It is contended that not adapting management practices decreases the motivation and
performance of Thai subordinates. It is therefore proposed that vision, leadership,
structure, resources support, rewards, and relationship factors , drawing upon
Weisbord' s Six-Box diagnostic model, are effective factors that influence Thai
subordinates to implement Japanese management practices, and Japanese managers to
adapt these practices.
Structural equation modelling technique is used as the main research method for the
study. Based on the sample survey of Japanese managers and Thai subordinates, two
structural equation models were developed to find the relationships between
motivational factors and adaptation and acceptance of Japanese management
practices.
The study found that vision and relationship were the significant motivational factors
that influenced Japanese managers to adapt their management practices, as well as
reward and relationship were the significant motivational factors that influenced Thai
subordinates to accept and implement Japanese management practices. The findings
imply that for developing an efficient and effective Japanese management practices
lll

and systems in Thailand, Japanese managers will need a v1s10n and a good
relationship with local staffs, and some rewards and good relationships will motivate
Thai subordinates to accept and implement Japanese management practices. Good
relationships among Japanese managers and Thai subordinates appear to be very
important factor influencing the success of Japanese management practices in
Thailand.
IV

PUBLICATIONS ASSOCIATED WITH THIS
THESIS
Raoprasert, T & Islam,S. M. N. (Forthcoming) 'Structural Equation Modelling in Business Management', in L Moutinho & G Hutcheson (eds), Dictionary on quantitative methods in management, Sage Publications, United Kingdom.
Raoprasert, T & Turner, R 2008, 'Japanese Management practices in Thailand: Models of Management Adaptation and Acceptance', paper presented to PanPacific Conference, 6/4/2008, San Jose, Costa Rica.
Raoprasert, T & Zeidan, S 2007, 'Japanese Management Practices: The Need for Adaptive Management', paper presented to Australia and New Zealand Academy of Management, 7/12/2007, Sydney.
v

Table of Contents
Chapter I Introduction ...................... ............. ............ ... ........ .. ..... ..... ............ ... ............. I I. I Background of the study: Cross-cultural international business management ... 1 I .2 Contribution to knowledge ................................................................................... 3 1.3 Statement of significance ...... ....................................................................... ........ 4 I .4 Scope of the study ................................................................................................ 4 1.5 Aim of the study ................................................................................................... 5
1.5.1 Specific aims ................................................................................................. 5 1.6 Research questions and hypotheses .............................................. ....................... 5 1. 7 Methodology ........................................................................................................ 7 1.8 Structure of the thesis ........................................................................................... 8 1.9 Summary ............................................................................................................ 10
Chapter 2 Literature review ........................................................................................ 11 2.1 Introduction ........................................................................................................ 11 PARTl ......................... ... ............................................................. 12 2.2 Efficient management ........................................................................................ 12 2.3 Efficient cross-cultural business management practices: need and principles ... 13 2.4 Japanese management practices ......................................................................... 14 2.5 Thai management style ................... ................................................................... 22 2.6 Possibility of applying Japanese management practices in Thailand ............. ... 24 2.7 Japanese management practices in other countries ............................................ 28 2.8 Normative management practices of Japanese in Thailand ............................... 29 2.9 Possibility of Thai subordinates' performance after modifying Japanese
management practice .......................... ........................................................ .... .. 30 2. I 0 Reasons for adaptation ........ .. .......... ............................................................. .... 3 I PART2 ............................. . ........ .. ....................................... . ......... 34 2.11 Change management ............ .... ........................................................................ 34
2.11.1 Resistance to change ...... ............... .. .... ... ... .. ............ .. ............................ .... 35 2.12 Why people work or do not work in organizations .......................................... 36
2.12.1 Economic models of organizational behaviour ......................................... 36 2.12.2 Social models of behaviour ..... ... .............................. ..................... ............ 37 2.12.3 The theory of reasoned action ................................................................... 37
2.13 The role of work motivation in organizations .................................................. 39 2.14 Conceptualization of the need to change ................. ....................................... .44 2. I 5 The factors for changes ................................................................................... .46 2.16 Limitations ofWeisbord' s six-box model.. ...................................... ................ 61 2.17 Limitations of the literature .............................................................................. 62 2.18 Summary .......................................................................................................... 62
Chapter 3 Theoretical framework ............... ..... ....................... .............................. .. .... 63 3.1 Introduction ........................................................................................................ 63 3.2 Theoretical background: An efficient management system ................. ....... .. ..... 64 3.3 Theoretical framework .......................................... .. .. ..... ... .... ... ...... ....... ... .......... 65 3.4 Hypotheses development ......... .. ....... ..... ..... .... ...................... ......... .. .......... .... .... 68
3.4.1 Vision ................ .............. ........... .......................... .... .... ... ..... .. .... .... ....... .... .. 68 3.4.2 Leadership ................................................................................................... 69 3.4.3 Structure ................................................... ...... .......................................... ... 71
VI

3.4.4 Reward .. ........ ...... .. ....... ...... ...... ..... .......... ............ ...... ...... ..... .......... ............. 72 3.4.5 Relationship .. ........ .......................... ... ..... .... ...... .. ..... ... .. ........ ..... ... ...... .. .... .. . 73 3.4.6 Resources support .... ................... .. ..... ...... ............. .... .. .. .. ... ... ......... .. .... ....... 74 3.4.7 Acceptance and adaptation ........ ....... .. ...... ............ ... ............ .... ..... .. ........ ..... 75
3.5 Summary ............ .... .... ........ .. ......... .......................... ....... .. ......... ... ...... .. ........ .... .. 76
Chapter 4 Methodology, research process, and computer programs .... ....... .. ....... ... .. 78 4.1 Introduction ...... .... .......... ... .... .... ........ .. ......... .... ....... ... ....... ... .... ..... ... .... ... ......... .. 78 4.2 Research process-design and methodology ............. .......... .... .. ...... .... ..... ... .. ...... 79 4.3 Literature search .. .. ......... .. ........ .......... ............ ........... .............. .. ... ...... .. ....... ....... 80 4.4 Research design ...... ...... ... ........ ... ......... ........................... ............. ... ....... ......... ... . 80
4.4.1 Quantitative research ............ .......... .................... ..... ... ... .......... ..... ....... .. ...... 80 4.4.2 Survey methodology .. ......... .... ....... .. ..... ...... ..... ........ ... .. ...... .......... ... .. ... .. .... 82 4.4.3 Cross-sectional survey research ............ .............................................. ........ 83 4.4.4 Mailing questionnaire survey ..... ... ...................... .. ............. .................... ..... 83 4.4.5 Unit of analysis ......................... ........ .... .......... .... ................... ........... .. ........ 85
4.5 Questionnaire development ........ ..... ................... .. ...................................... ... .... . 85 4.5.1 Scaling decision ....... ........ ........ ................ .......................................... ......... 86 4.5.2 Item adoption .............................................. ......... ................... ...... .......... .... 88 4.5.3 Pre-test. ..... ... ......... ... .. ........ .... .... ......................... .. ........ ... ........ ... ... ... ...... ..... 93 4.5.4 Reliability ............ ............... ..................... .. ...... .... .................... ....... ............ . 95 4.5.5 Validity .. ........ ......... ... ....................... ....................................... .................... 96
4.6 Population, sampling size, and procedures .... ....... .... ................ ... ........ .......... . .! 01 4.6.1 Population ..................... ... ... ... .......... ................................ .. ........... ... ...... ... 102 4.6.2 Sampling design .. .. ............. ........................ .................................. ......... .. .. 102 4.6.3 Data collection procedures ..... .. ....... ..... ....... .. ...... .................. .. ...... ... ....... .. 103 4.6.4 Data preparation prior to analysis ... ......... ........... .. ................. ....... .. ....... .. .! 04 4.6.5 Test of normality ... .............. ... .............. .......... ...... .... ............ ... ......... ...... .. . 104
4. 7 Data analysis ............... ... ................................... ........ ...... ............... ....... .... ...... . 105 4.7.1 Descriptive analysis ................. ........... ......... .... ....... ... ....... ....... .. ...... .. ...... . 106 4.7.2 Introduction to structural equation modelling: Methods, computerized
methods, and computer program ....... ........ ................... ... ....... ................ .. 106 4.8 Ethical considerations ...... ... ...... ....... ............ ...................... ............. .. .... .......... . 114 4.9 Summary .................................... ................. ......... .. ....... .... ..... ......... ........ ......... 115
Chapter S Preliminary data analysis and results: Descriptive statistics and reliability tests .......... ................ .................................. .......... ...... ......... .............. .... .... 117
5.1 Introduction ............................................... ..... ..... ........ .... .............................. ... 117 5.2 Descriptive statistics .................... ........... .... ....... .......... .............. ...... ........ ... ...... 117
5.2.1 Response rate ......... ..... .... ..... ... .......... ............ ............. ............ ....... ..... .. ..... 118 5.2.2 Demographic characteristics ........... ... .. ....... .... ....... .............. ..... .. ... ....... ... . 119
5.3 Reliability and validity .. .. ... .. ... .... .. ... ... .......... .. .... ........ .. ......... .... ..... ..... ...... .. .... 129 5.4 Normality ......... .... .. ................................................. ............................... ........ .. 133 5.5 Summary .. ..... .... ....... .. ... .. ... .. .. ................. ............. .. .. ....... ....... .............. ........ .... 136
Chapter 6 Structural equation modelling: Results and analysis ....... .... ............ ........ 13 7 6.1 Introduction ..... .. ...... ................. .................. .. .............. .. .... .... .... .... ..... ..... .... .. .... 13 7 6.2 Assessing goodness offit ............... .... ............... ..... .... .... ........ ... ... .. ... ....... .... ... . 139 6.3 Confirmation ofhypothesized latent constructs ....... .... .... ..... ... .. .... .... .. .... .. ...... 143
6.3 .1 Confirmation of the vision-Thai construct ....... .. ...... .... .................. ........... 144
Vll

6.3.2 Confirmation of the vision-Japanese construct ......................................... 145 6.3.3 Confirmation of the leadership-Thai construct ........................................ .146 6.3.4 Confirmation of the leadership-Japanese construct .. .... .................. ......... . 148 6.3.5 Confirmation of the resources support-Thai construct ........... ...... ......... .. .. 149 6.3.6 Confirmation of the resources support-Japanese construct ....................... 151 6.3. 7 Confirmation of the structure-Thai construct.. ... .... ...................... .. ........... 152 6.3 .8 Confirmation of the structure-Japanese construct.. ...... ...... .......... ..... ........ 154 6.3 .9 Confirmation of the reward-Thai construct.. ............................................. 155 6.3. I 0 Confirmation of the reward-Japanese construct.. ............. ... .. .. .. .............. 156 6.3 .11 Confirmation of the relationship-Thai construct.. .................................. .158 6.3 .12 Confirmation of the relationship-Japanese construct .......................... .... 159 6.3.13 Confirmation of the acceptance construct.. ............. ........ ........... ..... ........ 161 6.3 .14 Confirmation of the adaptation construct.. ............................. .. ............... 162
6.4 Structural models: Development empirical analysis of the model of Japanese management acceptance and adaptation ........................................................ 163
6.5 Composite factor model ................................................................................... 166 6.6 Development of the Japanese management acceptance model.. ...................... 168 6.7 Development of the Japanese management adaptation model.. ....................... 174 6.8 Summary .......................................................................................................... 180
Chapter 7 Discussion and implications .................................................................... 181 7 .1 Introduction ...................................................................................................... 181 7.2 Descriptive statistic results ............................................................................... 182 7 .3 Hypotheses testing ......... .... ................... .. ..... .................. .. ................................ 183
7.3.1 Hypothesis HlA-H7A ............................................................................... 183 7.3.2 Hypothesis H1B-H7B ............................................................................... 185
7.4 Implications for theory and practice .................................................... .... ... ..... 190 7.5 Towards an efficient cross-cultural and international business management
practices .......... ... ............................................................................... ... .... ....... 194 7.6 Findings and supports from pervious studies ...... .. ........................................... 195 7.7 Summary .............. ... ............................................ .. ..... .... ................... .. ............. 196
Chapter 8 Summary, findings, and conclusion .................... : ...................... .............. 198 8.1 Introduction ............................................ .. ........................................................ 198 8.2 Research design ..................................................................................... ........... 198 8.3 Results and implications .................................................................................. 200 8.4 Potential uses for the models ............................... .. ........................................... 200 8.5 Limitations of the research ............................................................................... 201 8.6 Recommendations for further research ............................................................ 202 8. 7 Concluding remarks ......................................................................................... 202
References ............... ....................................................................... 204 Appendix 1 Descriptive statistic results of Japanese expatriates ........................ 233 Appendix 2 Descriptive statistic results of Thai employees ...................... .. ... .. 263 Appendix 3 Questionnaires for Japanese managers and Thai subordinates .. ...... .... 293 Appendix 4 Information for participants in the adaptation of Japanese management practices survey ................................................................................ 299
Vlll

List of Figures
Figure 1.1: Structure of the thesis .................................................................................. 8 Figure 2.1: Model of the theory of reasoned action ..................................................... 38 Figure 3.1: Japanese management practices in Thailand: Development of good management practices .................................................................................................. 66 Figure 3.2: Model of motivational factors influencing Japanese managers ................. 67 Figure 3 .3: Model of motivational factors influencing Thai subordinates ................... 67 Figure 4.2: Representing casual relationship through path diagrams ........................ 109 Figure 4.3: Translation of path diagrams into structural equation ............................. 109 Figure 6.1: Congeneric model of vision-Thai .................................................. ........ .. 144 Figure 6.2: Congeneric model of vision-Japanese ..................................................... 145 Figure 6.3: Congeneric model ofleadership-Thai ..................................................... 147 Figure 6.4: Congeneric model of leadership-Japanese ...................... ..................... .. . 148 Figure 6.5: Congeneric model of resources support-Thai .......................................... 150 Figure 6.6: Congeneric model of resources support-Japanese ................................... 151 Figure 6.7: Congeneric model of structure-Thai ........................................................ 153 Figure 6. 8: Congeneric model of structure-Japanese ................................................. 154 Figure 6.9: Congeneric model of reward-Thai ........................................................... 155 Figure 6.10: Congeneric model ofreward-Japanese .................................................. 157 Figure 6.11: Congeneric model of relationship-Thai ................................................. 158 Figure 6.12: Congeneric model of relationship-Japanese .......................................... 160 Figure 6.13: Congeneric model of acceptance ........................................................... 161 Figure 6.14: Congeneric model of adaptation ............................................................ 162 Figure 6.15: Proposed model of Japanese management acceptance .......................... 165 Figure 6.16: Proposed model of Japanese management adaptation ........................... 166 Figure 6.17: Composite model of Japanese management acceptance ....................... 168 Figure 6.18: Model of Japanese management acceptance ......................................... 168 Figure 6.19: Re-specified model of Japanese management acceptance ..................... 169 Figure 6.20: Final model of Japanese management acceptance ................................ 170 Figure 6.21: Translation of model of Japanese management acceptance into structural equation ...................................................................................................................... 1 73 Figure 6.22: Composite model of Japanese management adaptation ........................ 174 Figure 6.23: Model of Japanese management adaptation .......................................... 174 Figure 6.24: Re-specified model of Japanese management adaptation ..................... 175 Figure 6.25: Final model of Japanese management adaptation ................................. 176 Figure 6.26: Translation of model of Japanese management adaptation into structural equation ...................................................................................................................... 1 79
IX

List of Tables Table 2.1: Differences between Japanese and Thai managements ........ .. ............ .. ... ... 26 Table 2.2: Differences between Japanese and Thai working values ............................ 26 Table 2.3: Japanese management practices in other countries .... .. ............ ... ................ 28 Table 4.1: Summary of Cronbach's alpha, and item-to-total-correlations values in pilot study of Thai employees ...................................................................................... 99 Table 4.2: Summary of Cronbach's alpha, and item-to-total-correlations values in pilot study of Japanese managers ............................................................................... 101 Table 4.3: Sample size .............. ... ................................................................... .. .. .. ..... 103 Table 4.4: Goodness of fit measures ............................ ..... .............. .... .. .. ... ................ 110 Table 4.5: Sample size for structural equation modelling .. ............................... ...... ... 111 Table 4.6: Paradigm of different approaches of computing composite factors ......... 113 Table 5.1: Response rate ............................................................................................ 118 Table 5.2: Age grouping of Thai subordinates ........................... .... ...... ... ... .. .............. 119 Table 5.3: Age grouping of Japanese managers ........................................................ .119 Table 5.4: Gender breakdown of Thai subordinates .................................................. 120 Table 5.5: Gender breakdown of Japanese managers ................................................ 120 Table 5.6: Position ofThai subordinates ........................................................... .. ....... 120 Table 5.7: Position of Japanese managers .................................................................. 121 Table 5.8: Duration of Thai subordinates ................................... .. ............................. 121 Table 5.9: Duration of Japanese managers ....................................... .... ..................... 121 Table 5.10: Organizational age reported by Thai subordinates ................................. 122 Table 5.11: Organizational age reported by Japanese managers ............................... 122 Table 5.12: Type of organization reported by Thai subordinates .............................. 123 Table 5.13: Type of organization reported by Japanese managers ......... ...... .. ... ..... ... 123 Table 5 .14: Lifetime employment reported by Thai subordinates .................... ..... .... 123 Table 5.15: Lifetime employment reported by Japanese managers ..................... .. .... 124 Table 5 .16: Consensus decision-making reported by Thai subordinates ................. .. 124 Table 5 .17: Consensus decision-making reported by Japanese managers ............... .. 125 Table 5.18: Seniority system reported by Thai subordinates ..................................... 125 Table 5.19: Seniority system reported by Japanese managers ···············:············· ... ... 126 Table 5.20: House union reported by Thai subordinates .. ......................................... 126 Table 5.21: House union reported by Japanese managers ......................................... 127 Table 5.22: Job rotation reported by Thai subordinates ............................................. 127 Table 5.23: Job rotation reported by Japanese managers .................................... ....... 128 Table 5.24: Quality control circles reported by Thai subordinates ............................ 128 Table 5.25: Quality control circles reported by Japanese managers .......................... 129 Table 5.26: Summary of Cronbach's alpha, and item-to-total-correlations values in main survey of Thai employees .............................................. ......................... .. ........ 131 Table 5.27: Summary of Cronbach's alpha, and item-to-total-correlations values in main survey of Japanese managers ............................................................................ 132 Table 5.28: Normality distribution in main survey of Thai subordinates .............. .... 134 Table 5.29: Normality distribution in main survey of Japanese managers ........ ........ 135 Table 6.1: Regression weights of vision-Thai construct.. .. ............ ...... ...... ...... .......... 144 Table 6.2: Variances of vision-Thai construct ...... .. .. ................................................. 145 Table 6.3: Regression weights of vision-Japanese construct .. ................................... 146 Table 6.4: Variances of vision-Japanese construct ...... ... .......... ............ .. ........... .. ...... 146 Table 6.5: Regression weights ofleadership-Thai construct .. .... .. ......... ... ............... .. 14 7 Table 6.6: Variances of leadership-Thai construct. .................................. .................. 147
x

Table 6. 7: Regression weights ofleadership-Japanese construct .... .......... ....... ... ... .. .148 Table 6.8: Variances ofleadership-Japanese construct .............................................. 149 Table 6.9: Regression weights of resources support-Thai construct.. ................ .... .... 150 Table 6.10: Variances of resources support-Thai construct.. .. ..... .............. ...... ... ....... 150 Table 6.11: Covariances of resources support-Thai construct ......... ...... ............. ... .... 150 Table 6.12: Regression weights of resources support-Japanese construct.. ............... 151 Table 6.13: Variances of resources support-Japanese construct.. .............................. 152 Table 6.14: Covariances of resources support-Japanese construct ............................ 152 Table 6.15: Regression weights of structure-Thai construct.. ................................... .153 Table 6.16: Variances of structure-Thai construct ..................................................... 153 Table 6.17: Covariances of structure-Thai construct ................ ................................. 153 Table 6.18: Regression weights of structure-Japanese construct.. ............................. 154 Table 6.19: Variances of structure-Japanese construct .............................................. 155 Table 6.20: Regression weights of reward-Thai construct ......................................... 156 Table 6.21: Variances of reward-Thai construct.. .......................... .. .......................... 156 Table 6.22: Covariances reward-Thai construct ........................................................ 156 Table 6.23: Regression weights of reward-Japanese construct.. ............................... .157 Table 6.24: Variances of reward-Japanese construct.. ............................................... 157 Table 6.25: Regression weights of relationship-Thai construct.. ............................... 158 Table 6.26: Variances of relationship-Thai construct ........ ........ ................................ 159 Table 6.27: Covariances of relationship-Thai construct ............................................ 159 Table 6.28: Regression weights of relationship-Japanese construct .......................... 160 Table 6.29: Variances of relationship-Japanese construct ......................................... 160 Table 6.30: Regression weights of acceptance construct.. ......................................... 161 Table 6.31: Variances of acceptance construct .......................................................... 162 Table 6.32: Regression weights of adaptation construct.. .......................................... 163 Table 6.33: Variances of adaptation construct .......... ............. .. ..... ....... ...................... 163 Table 6.34: Covariances of adaptation construct ....................................................... 163 Table 6.37: Regression weights of the model of Japanese management acceptance.171 Table 6.38: Covariances of the model of Japanese management acceptance ............ 172 Table 6.39: Variances of the model of Japanese management acceptance ................ 172 Table 6.40: Assessment of normality of the model of Japanese management acceptance ............................... : ............................................... ~ .................................. 173 Table 6.41: Regression weights of the model of Japanese management adaptation .177 Table 6.42: Covariances of the model of Japanese management adaptation ............ .178 Table 6.43: Variances of the model of Japanese management adaptation ................. 178 Table 6.44: Assessment of normality of the model of Japanese management adaptation ................................................................................................................... 179 Table 7.1: Hypotheses testing for HlA-H7 A .............................................. 188 Table 7.2: Hypotheses testing for HlB-H7B ............................................. 189 Table 7 .3: Supports from the pervious studies .... ................. ..... ..................... .. ......... .195
XI

List of Abbreviations AIC Akaike Information Criterion
AMOS Analysis of Moment Structures
CFI Comparative Fit Index
CFA Confirmatory Factor Analysis
CMIN/DF Normed Chi-square
C.R. Critical Ration
JIT Just in Time
QC Cs Quality Control Circles
MLE Maximum Likelihood Estimation
RMS EA Root Means Square Error of Approximation
RNI Relative Non-centrality Index
S.E. Standard error of the regression Estimate
SEM Structural Equation Modelling
SPSS Statistical Package for Social Science
SRMR Standardized Root Mean Square Residual
Xll

Chapter 1 Introduction
I .I Background of the study: Cross-cultural international business
management
International Business refers to all commercial transactions between two or more
nations. Because it comprises a large and growing portion of current world business
practise, international business has received considerable attention in academic
research (Daniels & Radebaugh 1998). International business differs in important
ways from business conducted within national borders, and poses additional
challenges to managers and investors in foreign countries (Mahoney et al. 1998). In
this context, Black . et al. (1999) state that effective management is increasingly
recognized as a key determinant of success or failure, arguing that the success of
international business in multinational companies depends most significantly on the
quality of management systems (Stroh & Caligiuri 1998).
As international business involves people from different cultures, every business
function including managing a workforce, marketing output, and dealing with
regulators, has the potential to involve cross-cultural problems (Zineldin 2007).
Cultural differences lead to differences in operating processes and management
practices, because different cultural environments require different managerial actions
(Mead 2005).
Daniels and Radebaugh (1998) state that adaptiveness and local acceptance need to be
concerned if a company wants to transfer its management systems from one country
to one country. Mead (2005) points out that effective management of disparate
cultures when managing abroad will assist companies in gaining a competitive
advantage. Therefore, in agreement with Dienhart (2004), in context of this thesis,
knowledge about how to increase the adaptability of Japanese management practices
is significant, as effective management practices in Japan may be a disaster in another
setting.
1

Japanese management practices are deeply rooted in Japanese culture (Hayashi &
Baldwin 1988). A popular Japanese slogan Hakko-Ichiu, meaning "all the world
under one roof', explains both the rationale for Japanese expansion and their
ethnocentrism (Edwards 2003). Nationalistic pride and a preference for Japanese
culture are strongly implanted in Japanese society (Starrs 2004). Hodgetts, Luthans
and Doh (2006) state that this nationalism results in displays of high levels of
ethnocentrism when dealing with overseas affiliates. This is consistent with recent
empirical research by William and Onishi (2003) who found that Japanese managers
try to transplant their management practices to overseas affiliates because of their
familiarity and proven success.
As differences in national cultures indicate differences in management practices
(Newman & Nollen 1996), conflicts emerge when Japanese managers apply their
management practices in Thailand without adjustment to the local culture. Therefore,
this thesis contends that when Japanese managers do not adapt their management
practices, the motivation and performance of Thai subordinates decreases. Therefore,
in order to increase the effectiveness of Japanese affiliates in Thailand, Japanese
management practices need to be adapted (William & Onishi 2003 ; McCampbell et
al. 1999; Adams & Vernon 1998; Sedgwick 1995).
Japanese models for affiliates . overseas appear to follow .a 'headquarters-outpost'
approach, where practices originating from home office directives are expected of the
foreign-based Japanese managers who must act as they would in Japan (William &
Onishi 2003). Thus, as many Japanese managers resist change and believe that
practices that have worked well domestically can be superimposed into other cultural
settings, there is an argument that Japanese management practices cannot be adapted
to the local Thai culture. Similarly, another argument is that Japanese management
practices cannot be adapted to Thai culture 'because such practices may be
inappropriate in Thailand (William & Onishi 2003; McCampbell et al. 1999; Adams
& Vernon 1998; Sedgwick 1995).
Given that Japanese managers usually transplant their management practices to
Thailand without adapting them, and that such management practices may be
2
inappropriate for local Thai conditions, it is clear that unless certain steps m
implementation are taken, such organizations may not be successful. A workforce in
one culture may respond differently to a workforce in another, and the national culture
of a workforce should influence how expatriates respond to the structures and systems
planned and implemented by management practices (Hofstede and Hofstede 2005).
Different cultural and industrial contexts emphasise different management practices
(Mead 2005), but Japanese managers may refuse change because they believe it is not
worth their time, effort or concentration (Wood, Wallace & Zeffane 2001 ).
Recognising that the Japanese national culture deeply influences how management
practices are consistently applied within affiliate organizations (Edwards 2003), this
research proposes two steps to improve Japanese management practices within the
cultural context of Thailand. One is to investigate motivational factors that may be
introduced within expatriate organizations that enable Thai subordinates to accept
Japanese management practices; and the second is to motivate Japanese managers to
adapt these practices into their dealings with Thai subordinates. Huczynski (2004)
explains that once such employees are motivated, they will support the organization's
directions and policies because they will begin to see themselves as an integral part of
the organization. When this occurs, the personal and organizational goals get closely
intertwined and mutual benefits accrue. Thus, the purpose of the present paper is to
develop a framework for the adaptation and acceptance of Japanese management
practices within a Thai cultural and workplace setting. This framework utilises
Weisbord's Six-Box model to underpin change management strategies for motivating
Thai subordinates and Japanese managers to accept and adapt Japanese management
approaches.
1.2 Contribution to knowledge
A review of relevant literature identified a range of empirical studies of Japanese
management practices in Thailand. These studies mainly focused on Thai employees'
perceptions of Japanese management practices and how well Japanese management
practices in Thailand have been implemented (William & Onishi 2003; McCampbell
et al. 1999; Adams & Vernon 1998; Sedgwick 1995). Surprisingly, little research has
3

examined factors that influence the adaptation and acceptance of Japanese
management practice in Thailand. Therefore, it has been considered important to
develop a framework that examines the relationship between factors that may
influence adaptation and acceptance of Japanese management practices in Thailand,
and acceptance of adaptation to Thai culture in Japanese management practice. The
research for the present study is original in that it investigates factors the underlying
need for such adaptation and acceptance. Moreover, this study is significant in that it
adds to the understandings of cultural diversity in international business management
literature. An intended outcome of this study is to provide insight into improving
business performance and reducing conflict between Japanese manufacturers and their
Thai employees, and to formulate efficient international and cross-cultural business
management systems and practices in this context.
1.3 Statement of significance
Understanding the relationship between motivational factors and adaptation and
acceptance of Japanese management practices in Thailand is significant due to the
impact this could make on improving their management practices and overall
business efficiency. This research will provide Japanese organizations with practical
guidance on how to successfully adapt and implement Japanese management
practices in Thailand. Moreover, this research is expected to enable Japanese
managers to become aware of (1) the factors that instigate the successful adaptation
and acceptance of Japanese management practice in Thailand, (2) how Japanese
management practices can be successfully implemented, and (3) the reasons for
adaptation.
1.4 Scope of the study
The research for this study was conducted in joint venture Japanese manufacturing
organizations in Thailand. Thailand is a preferred location for the establishment of
external Japanese manufacturing (Asano 1996), and Japanese manufacturers are the
largest foreign investors in Thailand. The Thai Board of Investment (2005) reveals
that the 2004-2005 foreign direct investment rate (FDI) of Japanese investment
4

represented almost 65% of total foreign investment in Thailand. Expansion of
Japanese manufacturing to overseas locations resulted in their management practices
becoming well-known and regarded (Rodgers & Wong 1996), and although it may be
true that some Japanese management practices have been adapted or accepted in
Thailand, this study emphasizes the need for Japanese management practices to be
more widely adapted and accepted in the future.
1.5 Aim of the study
The aim of this study is to investigate the factors that can be introduced to
manufacturing organizations that enable Thai subordinates to accept, and Japanese
managers to adapt, Japanese management practice to Thai culture.
1.5.1 Specific aims
To support the general aim of this study, the specific objectives of the research are:
1. To identify which factors influence Japanese managers to adapt their management
practices to operate successfully with Thai subordinates;
2. To identify which factors influence Thai subordinates to accept Japanese
management practices.
1.6 Research questions and hypotheses
The research sought answers to the following questions;
1. What are the motivational factors that can influence Japanese managers to
adapt their Japanese management practices to be apposite to Thai culture? (see
specific aim I)
2. What are the motivational factors that can influence Thai subordinates to
accept Japanese management practice? (see specific aim 2)
5

Based on the research questions fourteen hypotheses have been developed as follows;
• H 1 A: vision is a positive influential factor for Japanese managers to adapt
Japanese management practices.
• HlB: vision is a positive influential factor for Thai subordinates to implement
Japanese management practices.
• H2A: leadership is a positive influential factor for Japanese managers to adapt
Japanese management practices.
• H2B: leadership is a positive influential factor for Thai subordinates to
implement Japanese management practices.
• H3A: structure is a positive influential factor for Japanese managers to adapt
Japanese management practices.
• H3B: structure is a positive influential factor for Thai subordinates to
implement Japanese management practices.
• H4A: reward is a positive influential factor for Japanese managers to adapt
Japanese management practices.
• H4B: reward is a positive influential factor for Thai subordinates to implement
Japanese management practices.
• H5A: relationship is a positive influential factor for Japanese managers to
adapt Japanese management practices.
• H5B: relationship is a positive influential factor for Thai subordinates to
implement Japanese management practices.
• H6A: resources support is a positive influential factor for Japanese managers
to adapt Japanese management practices.
• H6B: resources support is a positive influential factor for Thai subordinates to
implement Japanese management practices.
• H7 A: at least one of six factors is an effective factor that positively influences
Japanese managers to adapt Japanese management practices.
6

• H7B: at least one of six factors is an effective factor that positively influences
Thai subordinates to implement Japanese management practices.
1. 7 Methodology
In order to investigate the links between motivational factors and adaptation and
acceptance of Japanese management practices, a quantitative approach has been
utilized. This approach addresses the research objectives through creation of concrete
numerical descriptions of employee perceptions on a number of constructs allowing
the relationships between these constructs to be examined (Neuman 2006). The
organizations used for data collection were joint-venture Japanese manufacturing
organizations in Thailand.
Data collection was conducted through questionnaire-surveys. The survey method
was selected because there was little control over behavioural events, and the focus
was to identify and develop a contemporary phenomenon within a real life context.
Quantitative data collected from the distributed questionnaires were analysed utilizing
the Statistical Package for Social Science (SPSS) computer program and the Analysis
of Moment Structures (AMOS) software program. Cronbach's alpha test was
conducted to assess reliability of the scale items. Descriptive statistics described and
summarised profiles of the entire sample. Confirmatory factor analysis was conducted
in the first stage of structural equation modelling (SEM). Composite factor model was
also applied to reduce the complexity of the model and reduce the number of returns
required for a reliable model. SEM was utilized to present statistical models of
relationships among the latent variables and manifest variables. For this thesis, the
AMOS software program was utilized to perform confirmatory factor analysis, and to
test the model by investigating the relationships in which path coefficients were tested
for significance and goodness-of-fit.
7

1.8 Structure of the thesis
In accordance with Figure 1.1 below, this thesis is presented in seven chapters.
Factors influencing adaptation and acceptance of Japanese management practices
Chapter 1
i I
Literature Review Chapter 2
i Conceptual Framework and Hypotheses
Chapter 3
~ Methodology and research design
Chapter 4
~ Primarily data analysis -Chapter 5
~ Confirmatory factor analysis and Structural equation
modelling ~
"' Chapter 6
~ Discussion and Implications
~ Chapter 7 ~
~
l Conclusion Chapter 8
Figure 1.1: Structure of the thesis
8

Chapter 1 provides an introduction to the issues this research is designed to address.
Chapter 2 examines and reviews all relevant literature on the issues of cross-cultural
management, change management, and motivational theory. It also explores six
motivational factors for influencing adaptation and acceptance of Japanese
management practices including vision, leadership, reward, structure, resources
support and relationship.
Chapter 3 provides the research framework and relevant theory. This chapter further
refines and synthesises knowledge obtained in the literature to provide a foundation
for this research. This chapter also presents the hypothesis development for the study.
Chapter 4 details the research methodology including sections relating to
operationalisations of the dependent, independent, mediating and moderating
variables, and describes the scales utilized to measure each variable and the research
procedures of data collection.
Chapter 5 presents results of the quantitative data analysis including descriptive
statistics, reliability and normality test.
Chapter 6 reports the results of confirmatory factor analysis and structural equation
modelling.
Chapter 7 discusses the issues and findings emanating from the questionnaire results.
Practical implications of the findings are also provided.
Chapter 8 presents an overview of the thesis. It also discusses the limitations of the
thesis and recommendations for future research.
9

1.9 Summary
This chapter has provided an introduction to the issues that the present research has
been designed to address. Japanese management approaches that work effectively in
Japan may not be appropriate in Thailand. This is because of the cultural differences
and differing work values in the two countries (Hofstede & Hofstede 2005; Miroshnik
2002). Two possible ways to succeed in changing current practices are to motivate
Thai subordinates to accept Japanese management practices, and/or alternatively, to
motivate Japanese managers to adapt their Japanese management practices. The aim
of this study is to investigate the factors that can be introduced to manufacturing
organizations that enable Thai subordinates to accept, and Japanese managers to
adapt, Japanese management practice to Thai culture.
The subsequent development of the main research questions and hypotheses are based
on the research aim. This chapter has also presented the contribution to knowledge
and significance of the study, its scope, an overview of its methodology, and finally,
the overall structure of the thesis (Figure 1.1 ). The next chapter will present a review
of literature on issues related to Japanese management practices.
10
2.1 Introduction
Chapter 2 Literature review
This chapter reviews literature related to adaptation and acceptance of Japanese
management. As mentioned in Chapter I, Japanese managers transplant their
management practices to Thailand. However, conflicts in Japanese manufacturing
organizations occur when the Japanese management practices which work well in
Japan, are not appropriate to the Thai culture. Implicit in this assumption is the notion
that failing to adapt Japanese management practices in Thailand decreases the
motivation and performance of Thai subordinates, and hence decreases business
efficiency. This is followed by a discussion on how these concepts and gaps within
the management hterature have been used to formulate the proposed research
questions for the present thesis.
The review discusses how these concepts and gaps within the management literature
have been used to formulate the research questions proposed in this thesis. This
chapter is divided by two parts. Part 1, consisting of sections 2.2 - 2.10, discusses the
differences in management practices across cultures and the needs for adaptation and
acceptance. Part 2, consisting of sections 2.11 - 2.14, discusses the influential factors
in adaptation and acceptance of management practices.
Section 2.1 introduces the objectives of the chapter, and outlines what will be covered
in the following subsections. Section 2.2 discusses the general concept of efficient
management and relationship between management and business efficiency. Section
2.3 discusses the nature of efficient cross-cultural international business management.
Section 2.4 broadly reviews Japanese management practices and identifies the
concepts underlying Japanese management practices in Thailand. Section 2.5 reviews
the literature on Thai management style based on pervious researches in the
management field. Section 2.6 discusses the possibility of applying Japanese
management practices in Thailand, comparing the differences between Thai and
Japanese management practices. Section 2.7 provides a brief overview of Japanese
11

management practices in other countries to see how Japanese management practices
have been implemented outside Japan. In section 2.8 the normative management
practices of Japanese in Thailand are reviewed to suggest what and how Japanese
management practices should be implemented in Thailand. Section 2.9 indicates the
possibility of Thai subordinates' performances after the modification of Japanese
management practice. Section 2.10 provides the reasons for adaptation, discussing the
reasons Japanese management practices should be adapted in order to deal with
cultural diversity and business globalization. Section 2.11 reviews change
management to extend the understanding of why Japanese management practices
should be adapted, and briefly how to achieve the change. Section 2.12 explains the
reasons why people work or do not work in organizations. The theory of reasoned
action, economic models of organizational behaviour, and social models of behaviour
are discussed to provide the reasons for employees' behaviours. Section 2.13
discusses the role of work motivation in organizations. It also discusses how the
adaptation and acceptance of Japanese management practices may be achieved by
providing motivational factors to influence the Japanese managers to adapt or change
their practices, and how to inspire Thai subordinates to adapt or change their attitudes
to accept Japanese management practices. Section 2.14 reviews the conceptualization
of the need to change. This section also provides an overview of how to achieve the
change. Section 2.15 describes the six-box model used in this study, and discusses
each factor of the model. This section also ,explains how each factor can influence the
. adaptation and acceptance of Japanese management practices. Section 2.16 provides
the limitations of the six-box model and the reasons why it has been appropriate for
this study. In section 2.1 7, the limitations of the literature are provided to indicate the
research gap. A summary of the chapter is presented in the last section 2.18.
PART 1: The differences in management practices across cultures and
the needs for adaptation and acceptance
2.2 Efficient management
Management is a process of working with people and resources to complete
organizational goals (Bateman & Snell 2002). Management can be viewed as a
12

function, or as a set of functions that must be carried out if an organization is to
operate and survive (Buchanan & Buczynski 1985). The management function is a set
of indispensable activities.
Bateman and Snell (2002) assert that organizational goals can be achieved
successfully when management is done effectively and efficiently. To be effective is
to attain organizational goals and to be efficient is to achieve organizational goals
with minimum waste of resources to generate the best possible use of money, time,
material and people. The best managers must maintain a clear focus on both
effectiveness and efficiency.
Put in plain words, efficient management provides the way to produce a perfect use of
resources, so that works are done efficiently and objectives are met within the time
scale laid down (Muir 1995). For example, efficient management can inspire
employees to provide their best performance to reach organizational objectives. This
implies that efficient management provides an approach to reduce the cost of
organizations caused by ineffective performance. In other words, efficient
management policies can provide a direct and economically significant contribution to
firm performance (Paauwe 2004) and help create a source of sustained competitive
advantage (Clinton & Sonny 2002). Pfeffer (1997) sees sustainable competitive
advantage as something that distinguishes an organization from its competitors,
provides positive economic benefits, and is not readily duplicated.
2.3 Efficient cross-cultural business management practices: need and
principles
Cross-cultural international business management is a comprehensive and ongoing
management planning process aimed at formulating and implementing strategies that
enable an organization to compete effectively internationally (Mahoney et al. 1998).
To successfully implement efficient cross-cultural international business management,
Causon (2007) provides six steps including how to lead people, how to manage
change, how to manage information and knowledge, how to meet customer
requirements, how to manage activities, and how to manage oneself. Firstly, a strong
leader is about values, communication and interpersonal relationships (Landrum,
13

Howell & Paris 2000; Homer 1997). A person with triumphant leadership skills will
have a clear vision and provide direction to their team (Marzec 2007; McGreevy
2003; Armenakis & Harris 2002; Harper 1998; Kotter 1996). Secondly, since the pace
of change has intensified, leaders need the ability to manage their team and resources
through turbulent times (Mahoney et al. 1998). Thirdly, leaders need to manage
information and knowledge. Here, Causon (2007) points out that these managers need
skills to manage and exploit the knowledge economy. Fourthly, effective managers
need to develop a customer-facing approach to team management for long-term
business survival (Causon 2007). Fifthly, leaders need to make sure their teams are
efficient and motivated (Tucker & Russell 2004). Moreover, Causon points out that
time spent on managing individuals and time spent optimizing financial and material
resources need to be balanced. Finally, leaders need to demonstrate resilience in
achieving personal goals, using appropriate levels of influence and persuasion
(Causon 2007).
Daniels and Radebaugh ·· (1998) maintain that implementation of efficient cross
cultural management can be generated when managers are aware of the need for
adaptativeness of their practices and acceptance of the practices by the users. They
state that efficient management practices should be flexible or adaptable, as well as
accepted by the people who use them.
2.4 Japanese management practices
The investigation of Japanese management practices has received considerable
attention because of Japan's high economic achievement. In the mid to late 1980s,
Japan, the world largest economy, was seen as an economic spectre (Farrell 1999). It
was seen as a mercantile animal that was buying anything and everything it could.
The Nikkei stock index was at all-time highs. Japan is particularly strong in its
technologies for mass production (Herbig & Palumbo 1994) and in 1990, its economy
represented two-thirds of the Asian economy (Chen 1995). As a result, during the past
twenty years there has been a veritable overflow of publications dealing with bits and
pieces of Japanese management practices.
14

Japanese management practices became well known during the 70' s and 80' s because
the Japanese economy survived two oil crises and sustained to show rapid growth.
Japanese management practices were formed after the Second World War as a
modem adaptation of American ideals, rather than having developed directly from
archaic Japanese values and traditions (Sugiman 1998; Tsutsui 1998). However,
although Japan took the strengths of Western culture and combined them into their
own culture for suitable intentions, available confirmation indicates that Japanese
management practices remain an invention of their culture (Alarid & Wang 1997).
According to Sugiman (1998), Japanese management practices have continued to
attract worldwide attention because of their success, efficiency, and humanistic
qualities. In terms of hard practice these management practices refer to production
systems and techniques, and soft practice refers to industrial relations and humanistic
management (Gill & Wong 1998). However, both practices are related, and hard
practices cannot be applied successfully without soft practices (Oliver & Wilkinson
1988). Here, Japan's post-war competitive success has been based on the cooperative,
group-oriented model of human relations (Alston 1986) which articulates with the
Japanese soft management practices applied worldwide, emphasizing team approach,
lifetime employment, consensus decision-making, bottom-up communication, job
rotation, and quality control circles (Arthur 2005).
Japanese management practice is of interest because of the belief, widely held by
academics and managers (e.g. Hazama 1997; Kilduff, Funk & Mehra 1997; Rhody &
Tang 1995; Abo 1994; Keys, Denton & Miller 1994; Lundberg & Peterson 1994;
McNamara & Hayashi 1994; Cohen 1993; Graham 1993; Fruin 1992; Gerlach 1992a,
l 992b; Gerlach & Lincoln 1992; Lucier, Cangemi & Kowalski 1992; Marsh 1992;
Turnbull, Oliver & Wilkinson 1992; Young 1992; Lincoln & Kalleberg 1990) that
Japanese management practices are a superior way of management and work
organization (Campbell & Burton 1994). Several years ago, Japanese management
practices were all the rage in many business schools. Along with varying degrees of
success, many U.S. companies studied and adopted Continuous Improvement
(Kaizen), Just-In-Time inventory system, Lean production, and other related practices
(Farrell 1999). The widely held view of Japan's superior management style is due to
15

the success that Japan has had both as a country and with its manufacturing
organizations.
The literature delineating Japanese management practices adopts a variety of
approaches. For example, Odaka (1986) describes Japanese management practices by
listing their aspects and characteristics. He mentions that Japanese management
practices include lifetime employment, seniority-based pay and promotion,
employment of the total person, standardized training for all employees, respect for
interpersonal harmony, the ringi system, omikoshi management, collective
responsibility, and participative management. Studies about Japanese management
practices in Thailand have shown that six of these human resource Japanese
management practices have been implemented. These include seniority-based pay and
promotion, quality control circles, job rotation, lifetime employment, consensual
decision-making, and bottom-up communication (Onishi 2006; William & Onishi
2003; Chaisiri 1998; Goh & Pinaikul 1998; Sedgwick 1995; Kumbanaruk 1987;
Kosiyanon & Yoshihara 1985).
Quality control circles
Quality control circles (QCCs) are an approach that uses the employees' abilities,
skills, knowledge, and potential problem-solving capabilities (Canel & Kadipasaoglu
2002). Quality control circles are defined generally as small group activities in which
line staffs voluntarily meet regularly to share ideas about how to solve minor
problems in their productive lines (Canel & Kadipasaoglu 2002; Shimada, Jenkins &
Goslin 1983). These groups have been called by many names including employee
involvement teams, problem-solving groups, and process-improvement teams
(Olberding 1998). In general, problem-solving ideas are proved by collecting data
from the line that can be analysed by using simple statistical techniques (Cole 1984).
Quality control circles are based on the instinctive logic that a worker who is thinking
could make useful suggestions regarding how to work more productively. In the
process of participating in quality control circles, workers are supposed to become
more interested in their jobs and more committed to their firm (Sedgwick 1995).
However, in order to be successful in implementing quality control circles, the quality
control circles approach must be congruous with management's philosophy about
how to relate to employees (Tang, Tollison & Whitside 1989). Effective quality
16

control circle groups also require supportive and involved management (French
1998).
Like most administrative tools, there are both advantages and disadvantages of quality
control circles. The advantages include increases in productivity as employees feel
empowered and respected for their thoughts (Piczak 1988). Quality control circles
allow employees to show their concerns about working conditions, which instils a
spirit of democracy. Employees' opinions are shared with management, meaning that
they can state their ideas and feelings about their situation (Barra 1983). Other
advantages of quality control circles are the possibility of advancement in the
organization, increased morale, and job satisfaction (Millson & Kirk-Smith 1996). On
the other hand, some disadvantages include an increase in time commitment, initial
start-up costs, and resistance to change. Here the initial investment in quality control
circles program requires substantial capital, including expenses for training, supplies
and printing (Canel & Kadipasaoglu 2002). Furthermore, time constraints present
hindrances to implementation, and some employees may feel that their authority is
threatened. Managers may not accept an unfamiliar suggestion and may attempt to
frustrate it.
Job rotation
Job rotation is a well-known administrative tool (Donald & Phyllis 2000) involving
moving employees from one workstation to another at specific intervals
(Tharmmaphornphilas & Norman 2004; Wexley & Latham 1991). Different from
cross-training strategies where employees learn their co-workers' jobs to provide
increased employee capacity (Burke & Moore 2000), the objective of job rotation is to
enhance employees' work experience (Morrison & Hock 1986). Noe and Ford (1992)
state that job rotation is viewed as providing opportunities to obtain an overall
appreciation of organizational goals, to enlarge knowledge and working experience
based on different functional areas, and to develop a network of organizational
contracts. Campion et al. (1994) also found that Job rotation is particularly useful for
enhancing employees' working skills. Job rotation not only enables employees to
learn a different task, but also provides them with an overview of the production
process (Allwood & Lee 2004). Hence, a manager who is likely to work in a firm for
17

long term will change tasks and learn new skills so that he will gain experience in a
range of line or task areas (Sedgwick 1995) and become a more competent manager.
Job rotation is also used to enhance employees' skills and decrease boredom in the
workplace (Ortega 2001 ); rotating workers between different types of mechanical
loads or alternate between high and low energy loads to avoid exhaustion (Kuijer,
Visser & Kemper 1999). Furthermore, quality problems can be spotted with greater
effectiveness (Ebeling & Lee 1994), since more employees have skills and knowledge
of a larger number of production processes. Several studies (e.g. MacLeod &
Kennedy 1993; Hazzard, Mautz & Wrightsman 1992; Henderson 1992; Jonsson
1988) have investigated the perceived benefits of job rotation as follows:
• cross-trained work forces,
• reduced boredom and monotony,
• reduced work stress,
• increased innovation/motivation,
• increased production,
• reduced absenteeism, and
• lower turnover rates .
Some of the above mentioned studies (e.g. Hazzard, Mautz & Wrightsman 1992;
Henderson 1992) also discussed problems that can be encountered in job rotation.
Here, the primary difficulties relate to work structure, organizational culture, and
employee behaviour. Specific problems included:
• experienced employees do not want to learn new work,
• machine users do not want to share machines with others,
• practical difficulties of physically moving from one job to another,
• unsuitable wage structures,
• difficulties identifying appropriate jobs,
• inappropriate use of job rotation by management.
As a result, although job rotation is a useful administrative tool to manage daily
exposure, due to physical stress, a poorly designed job rotation plan can lead to
increases in employees' stress (Tharmmaphornphilas & Norman 2004). Anil and
Brian (2004) also found that job rotation was an inappropriate administration tool, as
some employees found it difficult to work on tasks for which they had no experience.
18

Seniority systems
Seniority systems (nenko joretsu) are based on the concept that a person or group is in
charge or in command of another person or group in an organization (Hara 1997).
Although such control is usually granted to senior persons based on experience or
length of service in the organization, it is not uncommon for them to have less
experience or length of service than their subordinates. These systems provide
employees with a similar inducement to honour commitments to their organization.
Seniority systems also enable employees to establish mutually beneficial long-term
relationships (Michael 1990) and encourage them to stay with the organization
through regular pay increases and promotions (Hasegawa 1986). However, by
promoting an employee based on seniority rather than merit, the organization may
risk the inefficiencies that result from promotion of less able workers, and lose the
ability to maintain a promotion system based on reward for superior performance
(McCampbell et al. 1999). Chen (1995) states that the seniority system is undergoing
adaptations in Japan, where job-hopping is increasingly acceptable and the younger
generation is increasingly impatient with trade-offs of opportunity for security.
Nevertheless, seniority systems are still culturally entrenched, and probably reflect the
discovery that Japanese culture is characterized by a strong need for uncertainty
avoidance (Hofstede & Hofstede 2005).
Lifetime employment
The concept of family life or 'wa' (harmony) is the most frequently emphasized
element in Japanese organizational philosophy (Tang, Tollison & Whitside 1989).
Commitment of the family to the employee is contained in many company policies,
providing them with a wide range of benefits and avoiding layoffs. The objectives are
lifetime employment through encouraging stability and a sense of belonging and
commitment to the organization (Hasegawa 1986). Lifetime employment
(shushinkoyo) means staying on the payroll but not necessarily in a particular job or
even in a particular place for the whole of an employee's working life. Lifetime
employment can be described as the practice of organizations to employ their core
employees primarily from among newly graduates and other young persons, to plan
their continual training and development, to stay their employment within the
organizational group over a long period of time, and not to fire or layoff such
19

employees except in very unusual circumstances (Gill & Wong 1998). However,
Hampden-Turner and Trompenaars ( 1993) take a pessimistic view, pointing out that
lifetime employment is an act of generosity and indulgence for which the receiver is
obliged, and which he/she should work as hard as possible to repay back to the
organization. However, it allows the long-term development of employees, and the
creation of a succession plan which is probably 'beneficial to both the company and
the employees (Holden 1994). Alternatively, it may support employee dependency
and suppress individual creativity (Odaka 1986).
Consensual decision-making
Consensus (ringi) is defined as general agreement among all or most participants
(Priem, Harrison & Muir 1995). Consensual decision-making is also defined as an
attitudinal or behaviour convergence of group members on a common issue (Vanlear
& Mabry 1999) to bring about a desired outcome of the group decision processes.
Therefore, aggregating individual ideas to form an opinion with group consensus is a
key concept in consensual decision-making (Wang & Liu 2006). In short, the process
consists of discussion by a group and subsequent decision-making by each individual
(Sugiman 1998).
In a business context, the consensual decision-making technique is generally used to
indicate verbal generation of ideas by a group, with the manager not making any
decision until others who are involved have had sufficient time to suggest their view,
feel they have been appropriately heard, and are willing to support the decision even
though they may not think that it is the best decision (Satow & Wang 1994).
Moreover, consensual decision-making is a process that not only looks for the
agreement of most participants, but also to mitigate obstructions of the minority to
obtain the most agreeable decision. For example, in his study on how to implement
consensual decision-making, Winch (1995) suggested that participants in the process
should listen to one another (every idea is given a hearing), be comfortable with
disagreement, show no signs of conflict, and reach decisions a consensus in which
they all agree and express a willingness to go forward.
One major advantage of consensual decision-making is that it provides an enormous
number of ideas to assist in generating the best possible decision (Brahm & Kleiner
20

1996). However, although an open and free sess10n allows every participant to
involve in the creation of ideas, a possible disadvantage is that too many low quality
ideas may be presented (VanGundy 1988), and as the final decision is made in
agreement with all participants, a lot of time may be lost in the process.
Bottom-up communication
Bottom-up communication begins with employees at the bottom end of an
organization sending messages to those at the top of the hierarchy (Janet 1980), and
consists of two elements, feed forward and feedback (Waal 2004). Feed-forward
refers to employees at the bottom providing top management with planning
information, allowing management to set up its strategy on a strong foundation. In
addition, incorporating this lower level information increases the staff support base
for the strategy. Feed-back refers to employees at the bottom of an organizational
hierarchy providing top management with information on the results achieved by
them, thus allowing a clear understanding of the organization' s status to emerge.
A review of literature in a study by Tourish and Robson (2006) reveals that bottom-up
communication from subordinates to managers occurs in four primary forms ,
information about the subordinate himself/herself, information about peers and their
problems, information about organizational practices and strategies, and information
about what needs to be done and how it can be done.
As Japanese employees want to feel involved in their companies and are willing to
know if their input is appreciated, managers persuade to speak up when they agree or
disagree with a decision. They also inform employees about what is going on in other
parts of the organization (Alarid & Wang 1997). Managers persuade their
subordinates to provide feedback, and even though the received feedback is more
often negative then positive, they still see such feedback as useful (Barton 1996). This
approach can significantly lead to increased satisfaction in communication (Karen &
Menno 2007).
Although bottom-up communication can provide important information feedback to
management, it is also time consuming and slow (Karen & Menno 2007). Due to
communication taking place across too many organizational levels, top management
21

can take a long time to react to information given from employees at the bottom of the
organizational hierarchy. Moreover, managers may overlook their subordinates' ideas
or suggestions in the mistaken belief that they must appear omniscient at all times
(McMaster 1979). In both cases organization may lose quality ideas or suggestions
before they can reach the top management.
2.5 Thai management style
Managers and employees are a part of their national society, and understanding their
society can assist in explaining the nature of their behavior (Hofstede & Hofstede
2005). This understanding is central to the context of the present study, as although
Thai and Japanese cultures have many similarities leading to similar laws and
regulations, there are some Japanese differences in management practices that may be
unacceptable in the Thai cultural context.
In the Thai management style, Niratpattanasai (2.000) states that the culture demands
people to be humble and polite. Generally, they do not like confrontation, and if they
disagree with what others say, they just keep quiet. They do not make a quick
decision, and prefer to talk with co-workers outside the meeting room after
discussion, resulting in a low degree of commitment. Many expatriates find that Thais
frequently seem to agree during meeting room, but there is no movement. When
expatriates are communicating with them, Thais nod their head, but this does. mean
they are listening to you. It does not mean they agree or understand, but it is because
they are polite and just want to accommodate the other's feelings. This is the case
when Thais seem to agree, but actually do not agree. Their hidden feelings of
disagreement can become an undercurrent. These characteristics are defined as
benevolent paternalism (Chainuvati & Granrose 2001 ), collectivism, intra-group
harmony, deference to authority, humility, self-restraint, and consideration for others
(Dubey-Villinger 2001).
Relationship-oriented
Personal relationships and strong connections between semor and junior family
members are of extreme importance in Thai society (Komin 1990), with trust being of
22

core concern (Lawler & Atmiyanandana 2003). Therefore, personal and family
relations play an integral part in business activities, and relationship-oriented
behaviour takes place more frequently than work-oriented behaviour in Thai
organizations (Sorod 1991 ). Thai management style in companies place significantly
heavier reliance on personal connections in hiring, and they are not likely to
determine promotion, wages, salary and bonus increases primarily on formal
performance criteria (Lawler & Atmiyanandana 2003).
Hierarchy
In Thailand, centralized control based on seniority and family relationship is
commonly implemented, meaning that Thais have strong hierarchies in business and
family matters (Hendon 2001 ). Therefore, as the Thai culture is characterized by a
tight hierarchical social system, acceptance of existential inequality is very common
among Thai employees (Komin 1990).
Decision-making
Thai employees are familiar with their traditional top-down approach in which they
receive orders rather than think for themselves and express their own ideas
(Kumbanaruk 1987). For them, decision-making revolves around a hierarchical,
centralized authority with dependence of the subordinate upon the leader. The Thai
decision-making process does not generally use a team approach. For example, a
recent survey in Thailand found that subordinates in Thai companies a_ccept that their
leaders make decision in an authoritarian way (Holmes & Tangtongtavy 1995).
However, while this management style permits managers in Thai firms to make
decisions for what he or she believes is proper, the authoritarian management style
used is not overbearing. As it is the leader's job to guide subordinates, the decision
making in Thailand is commonly restricted to high-level management. In other words,
normal decision-making in Thai management is top-down, with the cultural norms
strongly discouraging subordinates to dare, to make mistakes, or to demonstrate
inventiveness.
Leadership
Although typical Thai leaders are authoritarian (Holmes & Tangtongtavy 1995;
Kumbanaruk 1987) they are normally non-assertive and close supervision is favoured
23

rather than general supervision (Deyo 1978). Thai subordinates accept a hierarchical
order and value a strong leadership (Vance et al. , 1992) in which leaders and
subordinates consider one another as existentially unequal. In agreement, Redding and
Casey (1975) state that the preferred Thai leadership style is essentially autocratic,
with subordinates being expected to be told what to do.
Harmony
Thais emphasize their relationships as being based on trust and emotion (Komin
1990). Thais prefer to have unwavering social relationships and maintain surface
harmony (Rohitratana 1998), avoiding conflict between individuals if possible. Here,
surface harmony means that people prefer to always be smooth, kind, pleasant,
conflict-free, non-assertive, polite and humble. They typically believe that being nice
helps people to be happy, and also helps build their long-term commitment (Cooper
1991).
2.6 Possibility of applying Japanese management practices in Thailand
Newman and Nollen (1996) point out that cultural norms approved by social cultures
strongly influence management practices, and Japanese and Thai management
practises are demonstrably different. Therefore, as different cultural environments
demand different managerial actions (Mead 2005), considerations of cultural diversity
should be taken into account when considering applying Japanese management
practices in Thailand. The different characteristics of Japanese and Thai management
practices discussed in Sections 2.2 and 2.3 are summarised below in Table 2.1.
Japanese management Thai management Wages and -Based on seniority -Based on performance
salary In general, a worker' s wages are Employees believe that the seniority system
increased and he is promoted in discourages employees, particularly the
accordance with the length of his 1 younger generation, from working hard
service in one company (Hasegawa since their promotion is based on years of
1986). work instead of abilities and performance
(William & Onishi 2003 ; Mccampbell et al.
1999).
24

Japanese management Thai management Decision- -Consensus -Authoritarian making
Traditional tendency has been to make Decision-making revolves around a
corporate decisions form bottom up hierarchical centralized nature of authority
rather than top down (Hasegawa 1986). in which there is dependence of the
In the consensual decision-making subordinate upon the leader. A recent
process (ringi system) the manager will survey in Thailand shows that subordinates
not make any decision until others who in Thai companies accept that their leaders
are involved have had sufficient time to make decision in an authoritarian way
suggest their views, feel they have been (Holmes & Tangtongtavy 1995). This
appropriately heard, and are willing to management style permits managers to
support the decision although they may make decisions that he or she believes is
not think that it is the best decision appropriate.
(Satow & Wang 1994).
Quality -Private life and work life are -Private life and work life are control circles combined separated
Quality control circles (QCCs) are small When Thai business people talk about
group activities in which line staffs !
QCCs in Thailand, they may say that QCCs
normally share ideas about how to solve were born in America, then widely and
minor problems in their productive lines successfully developed in Japan, but came
(Chen 1995). Ideas are proved by to a dead end in Thailand (Simachokdee
collecting data from the line employees 1998). Sedgwick (1995) explains the
that can be analysed by using simple practice of quality control circles in
statistical techniques. Circles are based Thailand as: when a problem arises relating
on the instinctive logic that a worker to customers satisfaction in a company
who is thinking could make useful product, the Japanese take it personally, but
suggestions regarding how to work Thai employees do not. They differ in that
more productively. In the process of they think it does not impact on them
participating in circles, workers are personally, so they are not interested in
supposed to become more interested in solving it. If the problem has to be solved
their jobs and more committed to their right away, the Japanese try to solve it even
firm. though it is outside working hours, but
Thais are not interested in solving it
immediately unless they are paid overtime.
25

Japanese management Thai management Hierarchy -Equality -Centralized control and strong
hierarchy
Management emphasizes equality as the Centralized control based on seniority and
basis for competition and co-operation family relationship is commonly
(Thurly & Wirdenius 1989), basing implemented, with a strong hierarchy in
practice on collective responsibility in business and family matters (Hendon 2001).
which all members feel responsible for
the organization.
Job Rotation -People are seen as competent to -People are seen as incompetent in work on several tasks their present jobs
One popular Japanese management Introducing job rotation into Thailand is
practice is job-rotation, with staff being extremely problematic as workers would be
able to work in several departments extremely unwilling to change tasks, not
within the organization (Farrell 1999). only seeing this as an indication that they
Employees change tasks and learn new have been judged incompetent in their
skills so that they will eventually have present jobs, but they would not be willing
worked on a number of lines or task to split themselves from the social
areas. After working in several task relationships established with their co-
areas he will eventually be a competent workers (Sedgwick 1995).
manager.
Table 2.1: Differences between Japanese and Thai managements
Hofstede and Hofstede (2005) demonstrate that there are national and regional
cultural groupings that affect the behavior of societies and organizations, and that are
very persistent across time. In the case of Japanese and Thai working values, these
include power distance, uncertainty avoidance, individualism, masculinity and long
term orientation (see Table 2.2).
Countries Power Uncertainty Individualism Masculinity Long-term distances avoidance orientation
Japanese 54 92 46 95 80
Thai 64 64 20 34 56
Source: Geert Hofstede and Gert Jan Hofstede (2005)
Table 2.2: Differences between Japanese and Thai working values
26

The five dimensions of Japanese and Thai national work-related values in the study of
Hofstede and Hofstede (2005) are as follows:
Power distance is the extent to which less powerful workers in organizations expect
and accept that power is dispersed unequally (Hofstede & Hofstede 2005). Power
distance also portrays the extent to which employees admit that the higher positioned
persons have more power than they have. In countries with high power distance,
employees are not willing to reveal their disagreements to their autocratic supervisors
(Cho & Padmanabhan 2005).
Individualism is contrasted with collectivism and refers to the extent to which people
are supposed to stand up for themselves and be on their own or choose ways to do
things independently. Daphna et aL (2002) state that individualism refers to persons
being independent of each other, whereas Hofstede and Hofstede (2005) describe
individualism as a focus on rights above responsibilities, a concern for oneself, and an
emphasis on personal sovereignty or self-fulfilment.
Masculinity refers to the value placed on traditionally male or female values. Here,
masculine cultures value competitiveness, assertiveness, ambition, and the
accumulation of wealth and material possessions, whereas feminine cultures place
prefer to place value on relationships and quality of life (Smith & Kimmel 2005).
Uncertainty avoidance refers to the extent to which members of a society attempt to
cope with worriment by minimizing uncertainty. Those scoring high in uncertainty
avoidance prefer rules and structured circumstances, and these employees likely to
remain longer with their present employer (Wennekers et al. 2007).
Long term orientation is described as a time horizon, or importance attached to the
future versus the past and present. In long-term oriented countries, pragmatism,
prudence and diligence are valued more, whereas in short-term oriented countries,
normative statements, respect for tradition, and reciprocation of gifts and favors are
most valued (Hofstede & Hofstede 2005).
27

2.7 Japanese management practices in other countries
To contextualize this study of Japanese management practices in Thailand, it is
necessary to briefly overview Japanese management practices in other countries (See
Table 2.3).
Hong Kong Lack of adaptation in Japanese management practises has lead to many
problems including high labour turnover, friction, poor communication, and
complaints about glass-ceiling influence (Wong et al. 1997).
Singapore Management practices have been adapted to take account of cultural
differences (Cunningham, Debrah & Petzall 1996; Putti & Chong 1986).
Sweden Japanese firms have embraced some changes in home management practices
to adapt their concepts of equality to Swedish concepts of individualism
(Styhre 2002).
United Some basic features of Japanese management practices have been adapted to
Kingdom the local conditions, using the more flexible just-in-time system which can
adapt to changes in demand (Basu & Miroshnik 1999).
Spain No adaptation has lead to unsuccessful implementation of Japanese
management practices because Spanish employees are self-focused and
Japanese are group-oriented (Adenso-Diaz, Kawamura & Gonzalez-Torre
1999).
United States Conflicts have occurred when Japanese transplanted their seniority-based
pay system to replace the American performance-based pay (Johnson 1988).
Table 2.3: Japanese management practices in other countries
As can be seen in Table 2.3 above, Japanese expatriates in Hong Kong are less willing
to adapt their management practices, because they fear that making a mistake will
harm their careers. As a result they face many management problems, such as high
labour turnover, friction, poor communication, and complaints about a glass-ceiling
influence (Wong et al. 1997). In Singapore, Cunningham et al. (1996) found that most
Japanese firms express the view that Singaporeans are not team-oriented. Here,
Singapore employees are accustomed to sticking to their job description, whereas
Japanese managers encourage multi-skilling. Consequently, when in Singapore
Japanese firms maintain broad job descriptions emphasizing formal qualifications and
experience rather than perceived character and personality, and try to introduce multi-
28

skilling among their workers (Putti & Chong 1986). When Japanese organizations are
in Sweden, they make changes to their management practices because most Swedish
workers refuse to implement Japanese management practices. Contrasting with the
collective concept that Japanese management practices are based on, they never
accept being pushed around. As Swedes have been trained to think for themselves and
make their own decisions, the Japanese concept of equality is adapted to embrace a
concept of individualism to fit Swedish conditions (Styhre 2002). In the United
Kingdom, Japanese firms have tried to implement their original practices in spite of
cultural differences, namely the just-in-time approach which is more flexible in
adapting to changes in demand. However, in the case of production management
practices they are not completely successful because of the British cultural differences
(Basu & Miroshnik 1999). In Spain, cultural differences also formed obstacles to the
introduction of Japanese management practices in subsidiaries. Spanish employees are
self-focused, looking to themselves to judge their actions and personal goals, while
Japanese are group-oriented (Adenso-Diaz, Kawamura & Gonzalez-Torre 1999). In
the United States of America there are increasing indications that Japanese
management practices cannot be readily transplanted without adaptation (Ichniowski
& Shaw 1999). For example, in California major Japanese companies have faced a
range of anti-discrimination law suits including sexual discrimination, racial
discrimination, and attempts to force U.S. managers into violating U.S. labour laws
(Richards 1987). A common conflict between Japanese and American has involved
the issue of equality. Japanese employees set living wages graduated by age, whereas
the American labour ideology emphasizes on equal pay for equal work (Johnson
1988).
2.8 Normative management practices of Japanese in Thailand
The cross-cultural international management policies that result in high levels of
commitment, competence, cost effectiveness and congruence, are those that have been
designed and administered through a process of mutual influence between
management and employees (Herbig & Genestre 1997). This implies that when
Japanese managers are in Thailand, they need to adapt their practices to suit Thai
styles of working conditions. As shown previously in Table 2.1 , normal Japanese
management practices (including seniority-based pay and promotion, quality control
29

circles, job rotation, lifetime employment, consensual decision-making, bottom-up
communication) need to be adapted in managing their joint-venture companies in
Thailand.
Thai subordinates expect performance-based pay and promotion rather than seniority
based pay and promotion (Mccampbell et al. 1999). Furthermore, decision-making by
Thai managers is authoritarian and Thai employees accept their leaders to make the
decisions (Holmes & Tangtongtavy 1995). They prefer quick decisions and
immediate results, which is not characteristic of Japanese decision-making processes.
Thai subordinates expect more opportunities and direction from Japanese managers
(Holmes & Tangtongtavy 1995). Moreover, they prefer recognition from their
superiors, and expect Japanese managers to be humorous (William & Onishi 2003).
Thai subordinates prefer their work and private time to be clearly delineated, which
contradicts the concept underlying quality control circles. Therefore, Thais are not
interested in quality control circles without overtime payment (Sedgwick 1995). A
strong hierarchy is essential in Thai organizational culture (Hendon 2001), which is
opposite to the Japanese concept of equality. Thai workers believe that a company
should have a dear hierarchy, and management should keep a certain distance from
employees. In regards to job rotation in Thailand, Thai workers are extremely
unwilling to change tasks because they take it as an indication that they are judged
incompetent in their present jobs, and are not willing to split themselves from social
relationships established with their co-workers (Sedgwick 1995). According to
William and Onishi (2003), Thai subordinates give importance to punctuality,
hierarchy, freedom to adopt their own approach, clear boss and subordinate
relationships and obedience, whereas Japanese managers emphasize a preference for
equality, being innovative and the use of quality circles (Hasegawa 1986).
2.9 Possibility of Thai subordinates' performance after modifying
Japanese management practice
Beyond the general principles of good management, managers can better manage their
subordinates if they understand what their subordinates need (Bateman & Snell 2002).
Once they are aware of each individual's profile, managers can easily motivate and
30

manage their people through initiating productive dialogue about what they need in
order to perform at their peak (Hiam 2003). This creation of a good match between
subordinates' work motives and their work is not only an important step in
maximizing individual performance, and it can also do a great deal to minimize
problems in the workplace (Hiam 2003). Johns and Saks (2005) found that work
satisfaction is strongly associated with enhanced performance. For example, research
of Patterson and West (1998) presented a significant relationship between work
satisfaction and performance. They visited 110 manufacturing sites with an average of
230 staff and found that increased workforce satisfaction leads to higher productivity
and then to greater profitability. Clearly, studies such as these confirm that if Japanese
managers take time to understand the work practices of Thai subordinates and adapt
their management practises to fit, they will effectively motivate the Thai to work at
their best production levels.
2.10 Reasons for adaptation
Globalization of the business environment has been forced by technological and
economic factors which cause an increasing number of cross-cultural interactions in
organizations, firms and industries within and between countries, and consequently,
within the workplace (Thomas 2001). Therefore, in order to cope with the uncertainty
of constant change, companies must frequently make adjustments to their structures
and work processes (Calantone & Zhao 2000). As a result, when Japanese companies
expand their manufacturing to overseas, they need to respond to new environments so
that their practices can be effective (Elger & Smith 1994).
Frustration, doubt and dissatisfaction resulting from poor cross-cultural adaptation are
among the reasons why many expatriates return to their home countries before the
official end of their foreign assignments (Jassawalla, Truglia & Garvey 2004). Most
important is the inability of expatriate managers to deal with cross-cultural adaptation
in regard to differences in cultures and languages, living conditions and
understandings of working harmoniously with co-workers (Yavas & Bodur 1999).
Caligiuri (2000) states that expatriates must access a cognitive and emotional comfort
level with the attitudes, values and behavioural practices considered to be the norm in
the host culture. Expatriates must respect cultural assumptions of the host country,
31

and adapt to differences that exist m physical, psychological and communication
circumstances (Wright, Geroy & Baker 1996). One of the most common factors
contributing to failure in global business assignments is the invalid assumption that if
the application of a management practice is successful in one country it will also be
successful in a different cultural context.
Recognising that culture has a strong influence on cross-cultural management
practices (Mahoney et al. 1998), it is important to define the exact meaning of culture
to better understand how it influences such practices. In this thesis, culture is viewed
as shared and commonly held beliefs, values and ways of thinking that tie a group of
people together as an identifiable community (Donald & Muhammad 1997). Culture
affects the way that people either consciously or subconsciously think, feel and act
(Eamonn & Glenn 1994).
Cultural differences significantly impact on the way business practices can be
managed, affecting all levels of business activities including manufacturing,
marketing, promoting, financing and producing. The characteristics that particularly
affect international organizations are language, education, social organization, attitude
and religion. In the early 1980s, managers were becoming aware of the socio-cultural
dynamics which develop within organizations, resulting in conceptualizations of
organizational culture in terms of the relationship between organizational culture and
national culture (Thomas 2001). Principally,_ organizational culture is the character of
the organization, involving the ways people place their personal and professional
objectives, achieve tasks, and manage resources to achieve them. Thus, culture
includes the statements, values, norms and tangible symbols of organizational
members and their managers (Schein 2004), implying that organizational culture is
the culture of its members, adopted through socialization.
Most large businesses have a diversity of cultures due to the wide range of people
working in the company (Nadeem, Ahmad & Kim 2002). Different cultural
environments demand different managerial actions, leading to differences in
objectives, strategy implementation, operating processes, and management practices
(Mead 2005). Therefore, managing between different cultures is a matter of accurate
perception and appropriate adaptation. However, cultural norms often influence
32

managers to understand people only as a group, and judge them according to the
stereotype they hold. These managers blind themselves to gender, race and ethnicity,
preventing them from consciously recognising that people from different cultural
groups act differently - and that these differences influence their leadership styles
within the organization. People from one culture are not just better or worse than
people from another, they are basically different, and to ignore these differences is not
productive as such inattention can result in costly mistakes in management practice.
Generally, the benefits associated with international businesses are counterbalanced
by a wide range of problems (Makino & Beamish 1998) which are heightened when
the partners are of different nationalities and cultures. Calantone and Zhao (2000)
assert that major differences with respect to management processes, management
practices, and corporate culture between the foreign firm and local partner can cause
serious conflict which contributes to the failure of businesses. For example, a foreign
firm may request that its process of strategies and operational planning, information
and control system, budgeting and accounting be used by the affiliate. However, if the
local partner does not have any experience with these processes, they may consider
them inappropriate. Further, a foreign firm may put emphasis on a more participatory
management practice, delegation of responsibility to subordinates, profit centres and
periodic evaluations of performance, but these practices may be inappropriate if the
local partner is a family-owned business (common in developing countries) which has
an authoritarian management strategy with no delegation . of responsibility to
subordinates and very little formal planning and control.
Problems in cultural diversity not only exist m convergent processes when the
organization needs employees to think or act in the same way, but in
misunderstandings between team members before they have had a chance to build any
relationship between each other (Asherman, Bing & Laroche 2000). However,
cultural diversity can be an advantage when the organization wants to develop new
ideas and strategies, being the starting point of a new marketing plan or new
operation.
33

PART 2: Factors influencing adaptation and acceptance of
management practices
2.11 Change management
Change is inborn in contemporary organizations and its management is not only
significant to organizational success and survival but it is also a critical issue in the
field of organization development (Mukherji & Mukherji 1998). Johnson-Cramer et
al. (2003) suggest that adaptations and changes can lead to improved organizational
performance and enhance the chances of organizational survival. Pettigrew and
Massini (2003) believe that an organization's survival depends on it changing its
boundaries in response to the external surroundings in which it operates.
Change may develop the present form of an organization or create a new form, both
of which are permanent and pervasive (Roach & Bednar 1997). In this study, change
management is defined as the process an organization applies to design, implement,
and evaluate appropriate initiative to deal with demands placed on them by the
interior or exterior environment (Recardo 1995), referring to any change where there
is impact on organizations due to organizational adjustments. Tushman and Anderson
(1997) assert that managing change involves moving an organization from its present
position to its desired position through a transition period. For management
adaptation, this may mean adapting from present inappropriate management practices
to management practices that suitable to the users in organizations. However, in
managing the change efforts there needs to be sufficient dissatisfaction with the
present position (Dervitsiotis 1998; Kotter 1996), a desire to move to the future
position, and the request of a well thought-out strategy for realizing the vision
(Dervitsiotis 1998; Kotter 1997, 1996). Similarly, Pal via and Chervany (1995) see
change as a disruption of the present work patterns with an interest in replacing
undesired activities. Ackerma~ (1986) classifies organizational change into three
kinds, developmental, transitional, and transformational. Developmental change
improves what is already occurring through the improvement of skills, technical
processes, and machines capability. Transitional change refers to replacing the present
ways of doing things by generating new approaches over a controlled period of time.
34

Transformational change is the adaptation of new approaches, unknown until it takes
shape. All such change generally affects the majority of employees in organizations,
and must be referred as strategic in nature (Chrusciel & Field 2006).
Chapman (2002) points out that change processes are designed to increase business
efficiencies and provide a better adjustment to the internal or external environment.
Juechter et al. (1998) suggest that several conditions need to be present when
implementing major change in an organization, including a clear focus driven from
top, leaders committed to systemic change, employee involvement, and external
coaches or change agents to facilitate the change process. Convrsely, change cannot
be successfully implemented if members in the organization do not accept the change
and do not change themselves (Alas 2007). Change may be resisted even though it is
necessary (Goodstein & Burke 1991), and cannot occur unless employees are
motivated and ready for it (Schein 1986).
2.11.1 Resistance to change
Resistance to change, defined as employee behaviour aspiring to challenge, interrupt;
or upturn prevailing assumptions, discussions and power relations (Collinson 1994),
has been of concern to organizational psychologists (e.g. Plant 1987; Lewin 1951 ).
Jermier et al. (1994) found that such resistance can be a response to employee
dissatisfaction with a change program. However, although Frances (1995) sees
resistance as a generalized unwillingness to change, Senge (1997) argues that
employees do not actually resist change, but resist being changed. Employees
normally resist social change more than technical change, and the change programs
which pay no attention to the aspect of psychological resistance to change are likely to
fail (Schein 1986).
Organizational change may create scepticism and resistance in employees, leading to
a difficulty in implementing organizational development (Folger & Skarlicki 1999).
Therefore, as employee resistance can be a significant obstruction to the success of
organizational change (Cummings & Worley 1997), success relies on the willingness
of employees to accept it with eagerness and implement it with attention (Dayr &
Leticia 2001). The difficult and frequently ignored part of a change process is leading
35

and managing behavioural change with those persons involved in the change process.
Employees may have their own opinions about what should change and how change
should be, but management frequently neglects the issue of addressing human
resistance to the plan implementation (Zoller & Fairhurst 2007). Thus, employees
who are targets of the change normally end up spending their time and energy
attempting to stop the change - or modify it until they feel satisfied (Dayr & Leticia
2001).
2.12 Why people work or do not work in organizations
Japanese managers may refuse a change because they believe it is not worth their
time, attempt and concentration (Wood, Wallace & Zeffane 2001) as their national
culture influences how they consistently apply their management practices to affiliates
(Edwards 2003 ). Since most Japanese managers have to go back to their previous
positions in Japan after their assignments are finished in three years, they are not
willing to put any effort into adaptations, and typically repeat their conventional
management practices which emphasize implementation of the Japanese
headquarters' management policies among Thai affiliates.
2.12.1 Economic models of organizational behaviour
In economic models of organizational behaviour, an assumption of one's behaviour is
that individuals pursue their self-interest (Pfeffer 1997). People are presumed to act in
a self-interested fashion to maximize their utilities (Taylor 1947), and because have a
disutility for expending effort, economic models invariably view employees as effort
averse and unlikely to perform what the organization wants or needs without some
form of incentive, sanction, or combination of both (Baron 1988). Therefore, giving
or withholding financial rewards can control people's motivation. Basically, this
model assumes that people are quiescent, likely to assert less rather than more
endeavour, reluctant to take responsibility, and are only concerned with work for what
they can obtain financially (Rowley 1996).
36

2.12.2 Social models of behaviour
Social models of behaviour assume that self-interest is not the only contributor to an
individual's action, but because humans are socially oriented, their group also affects
their actions (Mayo 1949). For example, a satisfying sense of being part of something
big and important plays a significant role in Japanese behaviour. People at work are
motivated by the social needs of friendship and acceptance from others. Moreover,
people are more likely to respond to the pressures of their social groups at work than
to incentive rewards and management controls (Rowley 1996). The key concept of the
social model is the sense of belonging within groups. Fulfilment for a Japanese person
does not come from individual activity or self-actualization, but from participation in,
and acceptance by, the group (Farrell 1999).
2.12.3 The theory of reasoned action
Drawing on work from social psychology, many studies have attempted to predict
behaviour by understanding the attitudes that underlie that behaviour (e.g. Triandis
1985; Ajzen & Fishbein 1980; Beach, Campbell & Townes 1979; Fishbein & Ajzen
1975; Rosenberg 1956). The theory of reasoned action by Ajzen and Fishbein (1980;
1975), is the most widely applied in social psychology (Lin 2007; Trafimow & Finlay
2001) to predict and explain a wide range of behaviours in terms of a limited set of
constructs, including attitudes towards behaviour, and the subjective norm (Sutton et
al. 2003).
The theory of reasoned action premises that beliefs of a person influence the attitude
and subject norm that reflect on behavioural intention and the person's behaviour
(Randall & Gibson 1991; Harrison, Thompson & Rodgers 1985; Ajzen & Fishbein
1980). Chang (1998) states that the theory of reasoned action is based on the
assumption that a person' s behaviour is determined by their behavioural intention to
perform that behaviour, which in tum offers the most accurate prediction of
behaviour. Basically, the theory is based on a person' s intention to engage m
behaviour; the higher the intention, the greater chance of engaging in the behaviour.
The intention to engage in a specific behaviour is based on attitudes toward the
behaviour in relation to subjective norms (Buchan 2005). For example, if a person
surmises a positive outcome (attitude toward the behaviour), and feels encouraged by
37

important people to perform (subjective norm), this results in a higher intention and
he/she is more likely to perform. Therefore, an action or behavioural intention to
perform is influenced by a person's attitude, according to their subjective norms of
future outcomes.
Ajzen and Fishbein (1980) assume that intentions capture the motivational factors that
influence a behaviour; they are indications of how hard people are willing to try and
how much effort they are willing to exert in order to perform the behaviour. In other
words, behavioural intentions are regarded as a summary of the motivation required to
perform a specific behaviour, reflecting a person's decision to pursue a course of
action - as well as an indication of the extent to which people are willing to perform
the behaviour (Figure 2.1 ).
Evaluation of Attitude toward behavioural r----. behaviour
'\ beliefs
r----. Intention Behaviour
I Normative ~
Subjective ~ norms beliefs
Adopted from Ajzen and Fishbein (1980)
Figure 2.1: Model of the theory of reasoned action
Fishbein (1967a; 1967b) proposes a model of attitudes that underpins the theory of
reasoned action. This model holds that beliefs about a specific behaviour generate the
development of an overall attitude towards the performance of a specific act. Sutton et
al. (2003) assert that salient beliefs play an important role in the theory of reasoned
action. Salient behavioural beliefs are held to decide attitude toward the behaviour,
and salient normative beliefs are held to decide subjective norms (Fishbein 1967a).
Therefore, both attitudes and subjective norms are influenced by salient underlying
beliefs. Conversely, salient behavioural beliefs are held to influence attitudes
(Armitage & Christian 2003). Here, multiple beliefs may be relevant, and each is
related to an expected outcome from engaging in performance of the behaviour
(Bright et al. 1993; Fishbein & Ajzen 1975). Buchan (2005) views that the intention
of a person to perform a given behaviour or not is the immediate determinant of
38

action, and attitude is determined by the person' beliefs and evaluation of the
expected outcome. For example, if a person believes that positive outcome will result
from performing a specific behaviour, he/she will have a positive attitude towards that
behaviour.
2.13 The role of work motivation in organizations
Due to the need for increased productivity to be globally competitive, motivation has
become central to success in contemporary organizations. Much of this is has resulted
from the rapid changes that contemporary organizations are being forced to undergo
(Johns & Saks 2005). Here, the need for motivation was inferred by results of
systematic analyses of how personal, task and environmental characteristics influence
behaviour and job performance (Wiley 1997), showing that motivated employees help
organizations survive because they are more productive (Lindner 1998). Therefore, to
be effective, managers need to understand what motivates their employees within the
context of the roles they perform. They need to understand the psychological
processes that cause the arousal, direction and persistence of behaviours that result in
performance (Mitchell 1988). For example, Robbins (1998) describes motivation as
the willingness to exert high levels of effort towards organizational goals in order to
satisfy some individual need. Hence, motives or motivations influence how people act
(Buchanan & Buczynski 1985). They have different needs energizing and motivating
them towards different goals, and the extent and ways in which a person's needs are
met or not at work, affects their behaviour on the job (Bateman & Snell 2002).
Cultural diversity demands different roles in motivation (Hofstede & Hofstede 2005).
For example, an Indonesian may explain putting in extra effort for their job by the
money received, rationalising "French honour and Koranic mutual obligation".
According to Locke & Latham (2004), the maximization of individual motivation to
accomplish organizational goals can be acquired by an exhaustive understanding of
motivational theories including: Law of Effect; Maslow's Hierarchy of Needs, ERG;
Herzberg's Two-Factor; McClelland's; Goal Setting; Expectancy; Equity; Theory X
and Y by Douglas McGregor; and finally Theory Z by William Ouchi. Those theories
are divided by the following three categories.
39

Firstly, the fundamental motivational theory is of law of effect - behaviour. In 1911,
psychologist Edward Thorndike developed the theory of the law of effect, which
hypothesises that a behaviour that is followed by a positive consequence will probably
be repeated. This law has laid the foundation for countless investigations into the
effects of positive consequences or 'rein forcers' that motivate behaviour. Four key
consequences of behaviour that either encourage or discourage people's behaviour are
positive reinforcement, negative reinforcement, punishment, and extinction
(Thorndike 1999). Positive reinforcement refers to applying a consequence that
increases the likelihood that the person will repeat the behaviour that led to it. Positive
rein forcers include compliments, favourable performance evaluations, and pay raises.
Negative reinforcement is the removal of an undesirable consequence. An example of
this is when a manager takes an employee off probation. Punishment refers to the
administration of an adverse consequence. Examples include criticizing or shouting at
an employee, cutting off a bonus or decreasing a salary. Extinction is the withdrawal
of, or failure to provide, a reinforcing consequence. When this occurs, motivation is
reduced and the behaviour is extinguished (Thorndike 1999). Here examples include
setting impossible performance goals, or not giving a compliment for a good job. The
first two consequences, positive and negative reinforcement, are generally positive for
the employees who obtain them. The last two consequences punishment and
extinction, are normally negative for the employees who receive them, and reduce
possibility of the repetition of an undesirable behaviour.
The second category of maJor concepts m work motivation assumes that all
individuals process the same set of needs. These content theories include Maslow's
Need theory; ERG theory, Two-factor theory, and McClelland's theory as follows:
Maslow's Need theory (1954) is characterized by a pyramid of five layers of needs in
order of hierarchy. In order of importance these are physiological, security, esteem by
others, self-esteem, and self-actualization. Physiological needs are the lowest level
and self-actualization is the highest level, with all needs being satisfied in order.
ERG theory consists of three basic human needs. Similar to Maslow's lowest levels of
physiological and safety needs, E stands for existence. The letter R stands for
40

relatedness, which is parallel to Maslow's social needs, and G stands for growth,
which is similar to Maslow' s highest level of needs (Robbins et al. 2003)
Herzberg's motivation theory has been considered as the most influential motivation
theory of the modem post-war era (Ruthankoon & Ogunlana 2003). Frederick
Herzberg's two-factor theory distinguishes between two broad categories of factors
that affect people working on their jobs. The first factor is hygiene, which can include
characteristics of the workplace including company policies, working conditions, pay,
and supervision (Beard well & Holden 2001 ). These factors can make employees
dissatisfied if they are poorly managed. The second category is motivators, which can
include the nature of the work itself, the actual job responsibilities, opportunities for
personal growth and recognition, sense of personal achievement, sense of group
achievement, and the feelings of achievement the job provides (Fincham & Rhodes
2005). When these factors are present, jobs are presumed to be both satisfying and
motivating for most people.
David McClelland ( 1985) identified a number of basic needs that guide people. The
most important needs for mariagers are the needs for achievement, affiliation, and
power. A need for achievement is characterized by a strong orientation toward
accomplishment and an obsession with success and goal attainment. The need for
affiliation reflects a strong desire to be liked by other people, and the need for power
is a desire to influence or control people.
Lastly, the third category is the process theories of motivation including Goal Setting
theory, Expectancy theory, Equity theory, theory X and Y and theory Z, stress the
differences in people's needs, focusing on the cognitive processes creating these
differences (Robbins et al. 2003). One important theory of motivation relevant to the
present study is goal setting - based on the idea that clear goals are themselves
motivating to employees. In other words, achieving goals is a motivator, occurring
when the goals are developed in a collective and participative way (Hackett &
Spurgeon 1996).
Expectancy theory is based on the importance of reward forming linkages between
effort and performance, good performance and reward. The main concept of
41

Expectancy theory is that people's performance will be based on both the perceived
likelihood that their efforts will lead to a certain outcome and on how highly they
value that outcome (Green 1992). According to expectancy theory, the reason why
people like to take actions and co-operate to attain the goals of an organization
depends on the following three items: 1) the value of behaviour itself; 2) the
probability of success and value placed in such success; and 3) the probability of
obtaining rewards and the value of the rewards (Robbins et al. 2003).
Equity theory is simply based on the concept of equality - as the name suggests. The
concept of the Equity theory is that people put efforts into their work that are equal to
the value of their rewards (Robbins et al. 2003). If rewards are fair, people will be
motivated, and unfair reward systems will result in lowered motivation.
Douglas McGregor's ( 1967) theory X and theory Y summarise two possible views of
management in work motivation. Theory X provides a view of direction and control,
theorising that employees dislike work and try to avoid it. Therefore, the function of
management is to force the employees to work through coercion and threats of
punishment. Theory Y is a humanistic approach to motivation, hypothesising that
employees are naturally motivated when they are satisfied, and that when they are
satisfied they can be well committed and motivated. Theory Y applies when
management exploits employee participation in organizational decisions.
William Ouchi's (1981) theory Z describes the characteristics of Japanese companies
as producing high employee commitment, motivation, and productivity. Most
Japanese employees are guaranteed lifetime employment to increase their loyalty to
the company. Here, the responsibility for success or failure is shared among
employees and management. Generally, employees do not specialize in one skill area
- being required to learn more about the company by developing several different
working tasks. Many of these characteristics are similar to theory Y.
Yamaguchi (2001) asserts that motivation in Japanese employees derives from the
opportunities afforded them by management to contribute to making things better, and
from their perception that their job is a career providing increasingly worthy work.
This motivation is said to come from new training, new jobs, rewards, and from the
42

active participation in the process of organizing the work. A recent research by Kubo
and Saka (2002) shows that there are three major motivational factors that have an
impact on Japanese employees. These are monetary incentives, human resource
development or personal growth, and job autonomy or task achievement. However, it
has been found that Japanese are very responsive to non-monetary rewards, which
often helps consolidate and promote their position within the group (Cesare & Golnaz
2003).
Japanese management provides both extrinsic and intrinsic motivations (Fukuda
1993). To enhance extrinsic motivation, Japanese management offers both job and
income securities to employees through the lifetime employment system and seniority
based pay and promotion system, along with comprehensive welfare system. To
increase intrinsic motivation, Japanese management offers continuous on the job
rotation. Chen (1995) points out that Japanese management puts more emphasis on
extrinsic motivational factors, such as job security, work condition and wages, than on
intrinsic motivational factors of creativity and achievement. However, creativity and
achievement are normally accomplished in the form of group efforts that are
accredited to the group.
Yong (2004) points out that the task of management is to adapt motivational strategies
to organizational conditions so that disincentives to performing well are overcome.
Many ideas have been proposed to help managers motivate people to work, and good
work performance is often generated from good behaviour (Mitchell 1988).
Therefore, to understand how behaviour of people can be motivated, motivation
theories need to be taken into account, and behaviour modification techniques need to
be developed to enhance work performance.
In this thesis, the above review of strategies suited to motivating employees is used to
serve as the basis for understanding the interrelationships of different variables and
how they may respond to adaptation. This suits the perspective of this study, which
emphasizes on the area of organizational behaviour which involves needs for change.
Here a change model can be used as a motivational model to assist in the successful
adaptation and acceptance of Japanese management practices in Thailand. However,
43

in order to provide a basis for implementation of this model, a conceptualization of
the need to change must be taken into account.
2.14 Conceptualization of the need to change
Adaptation is a narrow concept of change specifically used within evolutionary
change models, referring to variations and modifications in organizations or their
elements in order to alter changes in the external environment (Cameron 1991).
Adaptation is an event that results in a change in supposition about individuals and
organizations, and requires a corresponding change in one' s expectations, behaviours,
and relationships (Marks 2003; Schlossberg 1981). For the perspective of this study, it
is hypothesised that adaptation and acceptance of Japanese management practices can
be successfully achieved by motivating Japanese managers to adapt or change their
Japanese management practices, and motivate Thai subordinates to adapt or change
their attitudes to accept such practices.
There are many factors that can drive change. For example, Price and Chahal (2006)
highlight several factors which are critical to successful change management
including leadership and shared vision, strategic management, responsibility, vision,
teamwork and collaboration, open communication, respect, support and developing
others, effective problem solving, participation, and information flow. Adrianna
(2001) suggests that change models need to be described in detail in order to reveal
why change occurs (driving forces of change); how change will occur (stages, scale,
timing and process), and what will occur (content of change, outcome and why to
measure it). In order to conceptualise the need for change, ten change models are
reviewed in order of historical development, the earliest of which was a fundamental
model of change presented by Lawin (1952) who proposed change procedures as
unfreezing, moving, and refreezing.
Of particular interest to this thesis, Weisbord (1978) developed a diagnostic apparatus
for identifying six key factors where an organization has to perform well in order to
succeed in organizational change. Weisbord's Six-Box model, still widely used in the
development of management models, provided a diagnostic tool which identifies six
areas to examine when organizational change is required (Valeie & Kim 2000).
44

In another view, Tichy (1983) delineated organizational change as the introduction of
new patterns of performance, belief and attitudes among employees in organizations.
In this model organizational change can also be the main ·causes of problems or
opportunities that result from differences in the environment, diversification, know
how and people. Following this, Lundberg's (1985) organizational learning-cycle
model of organizational change emphasized external environmental factors and
internal factors in organizations. The internal factors are generally adequate resources,
system readiness, apparatus for corresponding communications and control, and
leadership.
Dyer's (1985) cycles of cultural evolution model advised that if there is perceived
crisis followed by a collapse of pattern-maintenance symbols, a change in leadership
with new values is needed for a culture change to transpire, even though there may be
a conflict before the new values are admitted. Following the development of this
model, Schein's (1985) life model further develops Lundberg's work and puts
different stages in an organization's development against the function of culture and
diverse culture change methods. However, using a different approach, Gagliardi
(1986) chose to perceive the essence of culture as subconscious suppositions
expressed in conscious beliefs and values. His model involved four key development
stages. Firstly, leadership delineates objectives and tasks according to a particular
belief and values. Second, the belief is assured by experience, and subordinates start
to share the belief and values. Thirdly, subordinates agree that the belief and values
are the cause of the desired results, and finally, the belief and values are shared
unquestioningly by all concerned. He asserted that culture change can be
revolutionary when the old culture fades or vanishes, and is transformational when the
exiting new culture merges values.
Leavitt and Bahrami (1988) developed a Diamond model that emphasized the
relationships between: people issues, motivation, skill and rewards; business structure,
processes, organization and job definition; control processes, performance indicators
and management information; and technology, operational systems, and information
delivery. Next, basing their approach on the models developed by Lewin (1952),
Beyer and Trice ( 1988), and Isabella ( 1990), Roberts and Brown ( 1992) divided
45

change into three steps of processing including, unfreezing processes,
experimentation, and refreezing. Lastly, the most recent model reviewed in this study
is McKinley's Seven Ss, which presents an inclusive set of factors that have been
developed to assess organizations' readiness for change (Peter & Watermann 2004),
In this model seven factors including structure, strategy, systems, shared values,
skills, style and staff are all of concern prior to implementing change. However, this
model takes little account of external factors (Price & Chana} 2006) .
As mentioned above, Weisbord's (l 978) Six-Box (diagnostic) model including vision,
leadership, rewards, resources support, structure, and relationship is of particular
interest in this thesis as it has several highly applicable characteristics. Vakola and
Nikolaou (2005) confirm that good work relationship, clear vision, leadership,
allocation of resources, rewards, and training are crucial in order to increase the level
of change readiness. Weisbord's model is output-focused and based on an open
system view of organizations, and is one of the most unsophisticated and
straightforward systematic models available - with considerable intuitive appeal
(Harrison & Shirom 1999). In addition, several studies have successfully adopted
Weisbord ' s Six-Box model as motivational factors to inspire employees to change
(e.g. Lin, 2007; Lok & Crawford 2000; Abraham, Crawford & Fisher 1999; Abraham,
Griffin & Crawford 1999; Chui, Sharpe & McCormick 1996; Birnbaum 1984;
Preziosi 1980). Therefore, this model has been adopted for use in this thesis to specify
the factors that influence adaptation and acceptance of Japanese management
practices in a cross-cultural context, and discussed in detail in the following section.
2.15 The factors for changes
The factors needed for changes in the model of this study have been identified on the
basis of Weisbord's Six-Box model. The Six-Box model is intended to assist
individuals in understanding the ways in which organizations can perform more
effectively, and by specifying problem areas, make suggestions and initiate
procedures for reparations. This model also provides a good guideline for determining
what factors need to be acquired by individuals or organizations in order to meet
operational goals (Beatrice 1990), which is particularly important in facilitating the
adaptation and acceptance of Japanese management practices. Therefore, for the
46

purpose of conceptualizing need for changes in this study, Weisbord's Six-Box model
is utilized to determine motivational factors that influence the adaptation and
acceptance of Japanese management practices.
Weisbord's Six-Box diagnosis model, by definition, provides a way of looking over
an organization to determine any problems and decide solutions for them (Dulcelina
1997). Weisbord, a change management specialist, has been associated with improved
techniques including 'Future Search' which have been applied to recent change
management initiatives in the U.K.; for example, the King's Fund's Urban Health
Partnership Project (Plamping, Gordon & Pratt 1998).
The boxes in Weisbord's Six-Box model (1978) include 'vision' (extent to which
leaders are committed to share organizational goals); 'structure' (degree to which
employees in the organization are involved in governance); 'reward' (level of morale
and satisfaction); 'resource supports' (availability of processes or tools to facilitate the
adaptation); 'relationship' (interactions between stakeholders); and 'leadership'
(effectiveness of the leaders in directing activities and providing resources). The Six
Box model is shown in Figure 2.2 below.
Relationship Is there any
conflict between staffs?
Resource supports
Are there adequate co-coordinating technologies?
Source: Weisbord (1976) Figure 2.2: Six-Box model
Vision What business are
we in?
Leadership Does someone
keep the boxes in balance; adapt to
the context?
47
Structure How is work
divided?
Rewards Are there
incentives for doing key
functions?

Elements of the above model displayed in Figure 2.2 (vision, structure, rewards,
resource supports, relationship, and leadership) are discussed following.
Vision
The vision box concerns clear mission and what is expected to be achieved in the
establishment. In this, research indicates that the implementation of change requires
leaders to provide the need for change and convince other members in the
organization that change is necessary (Laurent 2003; Burke 2002; Armenakis, Harris
& Feild l 999b; Kotter 1995). The process of convincing members in the organization
of the need for change often starts with crafting a compelling vision (F emandez &
Rainey 2006). Kets de Vries and Balazs (1999) suggest that leaders can easily
convince members in the organization to implement a change by creating vision.
Vision is a unique feature that distinguishes the business from the employees
(Beatrice 1990). Here, direction needs to be provided to the business to accomplish its
goals, and employees need to know what the change is all about and their role in
participating such change.
Vision is defined as an idealized object that the leader wants the organization to
achieve in the future (Hackett & Spurgeon 1996; Conger & Kanungo 1987). Vision
also captures the worth of work, allowing employees to identify their contributions
toward achieving the ideal (Tvorik & McGivem 1997), conceptualized as a tool
proffering direction to facilitate organizational success (Foster & Akdere 2007).
Vision is normally perceived by some members in the organization to be the future
direction that all members agree to pursue (Hwang, Khatri & Srinivas 2005).
Goodstein, Nolan and Pfeiffer (1993) advocate that vision provides the organization
with a clear sense of direction and provides a powerful mobilization of vigour - also
providing employees with sense of being engaged in something significant. Marzec
(2007) points out that vision gives a compass to the organization to create a clear path
for employees to follow and identify organizational goals.
Vision provides all members in an organization with a sense of purpose and picture of
the future (Hoe 2007; Morden 1997). Similarly, many researchers (e.g. Testa 1999;
Eccles 1994; Nanus 1992; Kouzes & Posner 1987) see vision as a unique, ideal image
of the future. They say that without a future picture, employees cannot be drawn from
48
where they currently are to move toward the future state (Senge 1997). Kilpatrick and
Silverman (2005) assert that employees are efficient if the organization has a clear
vision, and McGivem and Tvorik ( 1998) suggest that the key to achieving a higher
degree of long-term organizational success can be ascribed to the use of a clear and
effective vision. Therefore it is the leaders' responsibility to create a vision and
present steps of that vision clearly so subordinates can see exactly how to achieve it
(Alley 1999). However, as Kotter (1995) explains, the content of vision must be
sensible and plainly understood by all members in the organization as content without
elucidation is ineffectual.
Leaders can motivate their subordinates by sharing their vision for the organization to
facilitate subordinates to recognize the directions needed to achieve organizational
goal (Hackett & Spurgeon 1996). Awamleh and Gardiner ( 1999) state that motivation
can arise when leaders inspire their subordinates by providing meaning and challenge
to their work; for instance, giving encouragement, communicating. vision, and acting
in ways that inspire enthusiasm. Many studies have shown that vision is a tool that
leaders use to inspire subordinates to higher levels of commitment and performance
(Dvir, Kass & Shamir 2004; Proctor & Doukakis 2003; Bryman 1992). Thus, vision
provides an interpretive framework of shared meaning for organizational members
(Holladay & Coombs 1994 ).
Bas.ically, the creation of vision is often seen as the starting point for strategic future
development (Awamleh & Gardiner 1999), but only if it is understood and meets the
challenge of the future as perceived through the eyes of all members in the
organization (Hackett & Spurgeon 1996). Therefore, a shared vision is an essential
component of an organizational vision (Youngdahl, Waldman & Andres 1998; House
1995), creating a clear organizational purpose and supporting the changes necessary
for reaching desired future outcomes (Hoe 2007). Larwood et al. (1995) mention that
leaders are required to clearly state their vision for their organization in order for it to
be claimed or owned by all members and become part of a new social architecture
within the organization (Dvir, Kass & Shamir 2004; Proctor & Doukakis 2003 ).
However, employees are more likely to support a vision of the organization when it is
the result of an authentic exchange of views among everyone in the organization
(Licata & Harper 2001; Blase & Blase 1997). For example, a study by Barnett and
49

McCormick (2003) suggests that leaders should recognize the need to involve those
who implement and live with the result of a vision, by collaborating and providing
opportunities for participation in developing the vision to give a sense of ownership.
Without this shared sense of creation and shared responsibility, success is improbable
(Tichy & Sherman 1994).
Employee perception of vision is essential because it is the employees who actually
put the vision into action. Oswald et al. (1994), stress that vision must be salient to all
members in the organization, with members sensing that a clear vision has been
articulated, that the leadership of the organization shares the vision, and that the
vision is appropriate. Holpp and Kelly ( 1988) give an instance that if employees are
not absolutely sure about the vision, they will have to presume the meaning and what
actions they need to take. It is leaders' responsibility to make sure that their
subordinates fully understand the vision, clarify what it means in regard to each
employee position, and ensure that the resources to execute the vision are in place
(Foster & Akdere 2007). Furthermore, Collins and Porras (1996) note that vision must
be translated from words to pictures with a description of what it will be like to
accomplish the desired organizational goal.
Vision is a stimulus for change (Barnett & McCormick 2003; Smith 1996a, 1996b;
Snyder & Graves 1994), and Jones and Kahaner (1995) assert that it is the most
powerful technique that an organization can utilize to implement change. Successful
visionary leaders communicate their ideas to facilitate changes and widen support for
their vision (Bennis & Nanus 1997; Cowley & Domb 1997; Conger & Kanungo 1988;
Conger & Kanungo 1987; Bass 1985) and organizations need to share their visions to
enable proactive direction and sustain the adaptation process to create the future
(McGivem & Tvorik 1998; Kotter 1996, 1995; Garfield 1992; Naisbitt & Aburdene
1985; Miles & Snow 1978). Many researchers (e.g. Holt et al. 2006; Armenakis &
Bedeian 1999; Armenakis, Harris & Mossholder 1993) have asserted that the primary
method for creating employee change readiness, acceptance, and adaptation is a
change message perceived from direct communication, and symbolic evidence as the
change unfolds. Armenakis et al. (l 999a) state that the message perceived from
shared vision creates core sentiments in employees that they use to guide decisions
about their level of support for such initiative.
50

As shown above, one of the most steady features across diverse change is the
attributed important of vision and effectiveness in its communication (McAdam 2003 ;
Kotter 1995). One of the key sentiments to providing change readiness and supporting
change is the sense that change is needed (Armenakis, Harris & Feild l 999a;
Armenakis, Harris & Mossholder 1993), and vision generates much of the
justification for such a sentiment. Correspondingly, Nutt and Backoff ( 1997) view
vision as the trigger for radical transformational change. In particular, vision is a core
motivational tool for organizations to use in inspiring their employees to implement a
desired change (Kantabutra & Avery 2007; Cole, Harris & Bernerth 2006; Landua,
Drori & Porras 2006; Hwang, Khatri & Srinivas 2005; Dvir, Kass & Shamir 2004;
Barnett & McCormick 2003 ; Abraham, Crawford & Fisher 1999; Awamleh &
Gardiner 1999; Testa 1999; Hackett & Spurgeon 1996; Bryrnan 1992).
Structure
Structure refers to the degree of authority in an organization and how the work is
apportioned (Beatrice 1990), identifying who is formally responsible to respond to the
adaptation. Structure is defined as series of steps in change activity (Richardson
2007), and the basic underlying theory is simple. Structure is the process of change
implementation, and viewed as sets of responsibilities and patterns of interactions
(Hemes 2000). Structure first allocates tasks (what and how to implement the change)
and then proffers coordination (how to make the whole thing work) (Waterman,
Peters & Phillips 1980). Structure provides participants in a change process with
enough interpretative plans or references to communicate the reality of their actions in
the change process (Akgun, Byrne & Keskin 2007) and indicate how the change can
be best accomplished (Staber & Sydow 2002).
Graetz and Smith (2005) view structure as a process of how to change, involving
investment information technology, horizontal and vertical communications, and new
human resource practices. Moreover, Garg and Singh (2006) state that structure is
associated with an organizational support system that assists change process, in which
the support system includes span of control , manpower utilization, administration,
communication, integration and coordination. Feldman and Pentland (2003) propose
that this process can be characterized as abstract patterns that participants utilize to
51

guide, account for and refer to specific performances of change process. The abstract
patterns refer to the understanding of how process is achieved and who does what in
particular situations in combination with formal and informal rules, shared
understandings, and agreements of change process (Vilkas 2006). Structure begins
with defining the process of change and addresses the key questions: How can change
be done? How does information flow? What are the process and lateral capabilities?
Who will drive the change process? (Williams & Rains 2007). Similarly, Jessop
(2000) interprets structure as giving rise to questions of what and how to implement
the change, and who is driving the change process.
Although vision offers only broad outline of an organization's direction (Hoe 2007;
Morden 1997), structure provides the narrow ways of implementation of change
process in particular situations, by specific people, and in specific time (Vilkas 2006).
As structure provides a roadmap that outlines a change process, it is possible that
structure can be seen as a plan for change. In this, planning identifies activities in the
change process (Nutt 1993 ). Lippert and Davis (2006) assert that planning is the
collaborative creation of design specifications for change directed to specify what is
needed, where and when the actions will happen, who is in charge, and how the action
will start and end.
Morris and Raben (1995) suggest the needs for leaders who drive change programs as
including pilot projects, experimental units, technology supports, and special task
forces. In order to be successful in a change process, participants need to know what
to do, how to improve upon what they do, and how to implement it effectively
(Rosenberg 2003). Porras and Robertson state that a change process should be guided
by information about:
• The organizational features that can be changed;
• The proposed outcomes of those changes;
• The causal mechanisms by which those changes can be accomplished; and
• The factors that successful change depends on.
O'Conner and Fiol (2006) assert that successful implementation of change can be
facilitated by effective structure supports. Structure refers to the direction of how to
52
implement the change through providing a series of steps for change activity, and
identifying who is responsible for the change process (Richardson 2007; Williams &
Rains 2007). When a clear direction of how to implement the change is recognized,
participants will be motivated to implement such change (Hackett & Spurgeon 1996).
Rewards
Rewards are the technique whereby the needs of the organization or individuals are
fulfilled (Todd, Billy & James 1988). According to Herzberg (1987), work rewards
are the intrinsic and extrinsic benefits that employees receive from their jobs that
influence their efforts to perform well (Kocabiyikoglu & Popescu 2007). This is in
agreement with Locke and Latham (2004) who assert that motivation occurs not only
as a result of external factors, but also as a result of "internal factors that impel action
and external factors that can act as inducements to action".
Frederick Herzberg's two-factor theory distinguishes between two broad categories of
rewards that affect people working on their jobs. The first category, extrinsic rewards
(hygiene), includes the characteristics of the workplace including company policies,
working condition, pay and supervision (Beardwell & Holden 2001). These rewards
can make employees dissatisfied if they are poorly managed. The second category is
intrinsic rewards (motivators) which include the nature of the work itself, the actual
job responsibilities, opportunity of personal growth and recognition, sense of personal
achievement, sense of group achievement, and the feelings of achievement the job
provides (Fincham & Rhodes 2005). When these factors are present, jobs are
presumed to be both satisfying and motivating for most people. In other words,
rewards that come from others are considered extrinsic, and rewards that are
personally experienced are intrinsic.
Judson ( 1991) asserts that one common tactic that managers can employ to minimize
resistance to change is rewards. Both extrinsic and intrinsic rewards are most
frequently considered when change is being implemented (Buch & Tolentino 2006),
however, from the perspective of human behaviour research, extrinsic rewards most
significantly affect employee participation (Fenwick & Olson 1986). Therefore,
certain forms of extrinsic motivations, for instance monetary rewards, praise and
recognition rewards, may best inspire employees to participate in the desired change.
53

Numerous studies have shown that rewards are regularly used to motivate employee
behaviour to achieve positive organizational outcome (Ford & Greer 2005; Kerr &
Slocum 1987; Cummings & Schwab 1973), and most managers believe that using the
right motivational tools inspires employees into doing more of what management
wants (Strickler 2006). Rewards can also act as a reinforcement to motivate to the
performance of desired behaviours in an ongoing way (Lin 2007; Chrusciel & Field
2006; Govindarajulu & Daily 2004). In addition, Gupta and Govindarajan (2000)
showed that rewards are important in assisting organizations in successful knowledge
sharing implementation, and effectively influencing employees to achieve their
personal goals (Creech 1995). For example, a study by Lin et al. (2005) found that
rewards affiliated the implementation of the Chronic Care Model adopted in health
care organizations.
As mentioned above, rewards can be implemented in many forms, including both
financial and recognition (Govindarajulu & Daily 2004). Recognition, promotion,
increase in pay, benefits and incentives, are some of the systems that can be utilized to
· reward employees for participating in a change process (Marks 2001; Patton & Daley
1998; Leitch et al. 1995; Atwater & Bass 1994). However, monetary rewards, one of
the most favourable motivators for encouraging employees to participate in change,
are often utilized as a means to motivate employees to reach organizational goals
(Groves et al. 1994). Stajkovic and Luthans's (2003) meta-analysis of 72 studies
indicates that an organizational behaviour modification intervention using monetary
rewards improved task performance by 23 percent, whereas an intervention with
social recognition did only 17 percent. Nevertheless, although direct monetary
rewards are undoubtedly the most successful motivators, Goodpastor and Montoya
(1996) suggest that in business, recognition, working conditions, the work itself, job
responsibilities, opportunities for personal growth, and sense of personal achievement
can also be effective. In the last instance however, Arocena and Villanueva (2003)
point out that all these can ultimately be expressed in terms of money, and monetary
roots are found in every case.
Monetary pay is of significant concern since this is perceived to be a manifestation of
an individual's value to the organization (Appelbaum & Mackenzie 1996). The use of
54

monetary or other financial rewards is based on the reinforcement theory (Perry,
Mesch & Paarlberg 2006) which emphasizes relationships between target behaviours
(e.g. performance outcome) and motivational tools such as pay increases (Skinner
1969). This theory is premised on the principles and techniques of organizational
behaviour modification (Stajkovic & Luthans 1997; Luthans 1973).
Pearce (2007) points out that although monetary rewards motivate employees, they
are not likely to be motivated by money all the time, and different employees
appreciate different kinds of rewards. Innovative rewards such as paid vacations, time
off from work, opportunity of personal growth and feelings of achievement the job
provides can be effective in motivating employees (Fincham & Rhodes 2005; Bragg
2000). Jeffries (1997) found that there are some employees who are more motivated
by recognition than anything else, and do their best when their input is recognized.
Indeed, most employees expect appreciation from supervisors and peers (Miller
1991 ), and praise is often more appreciated than monetary rewards (Kohn 1993 ).
Lincoln & Kalleberg 1990) showed that promotion opportunities influence employees'
behaviours of motivation and organizational commitment, particularly when their
employment is stable. Similarly, in a study of Japanese workers, Takahashi (2006)
found that motivation can be achieved by receiving rewards of rapid achievement in
gaining higher position, high levels of compensation, and engagement in interesting
and challenging work.
Resource supports
Oakland and Tanner's (2007) study shows that resources support such as training and
skill development are critical to successfully managing change within both public and
private sector organizations. Here, successful change requires adequate resources to
support the process (Fernandez & Rainey 2006) such as support policies for
procedures and machinery that assist workers, and systems of tracking work and
identifying problem areas (Beatrice 1990). Thus, Eisenberger et al. ( 1990) suggest
that when employees perceive resources support, an atmosphere of trust in the
organization's willingness to fulfil its obligations towards employees is created.
However, policy implementation scholars have long recognized the need for sufficient
resources to implement policy change (Matland 1995; Goggin et al. 1990; Mazmanian
& Sabatier 1989). Readily available finance, communication technologies, flexible
55

systems and responsive training and education all contribute to a supportive
foundation that facilitates change process (Kerber & Buono 2005). In support of this,
Boyne's (2003) study shows that resources support is one of the most significant
factors for implementation of change, and substantial financial support is a major
resource factor benefiting such change (Larson & Barnes 2001). Conversely, failure
to provide sufficient resources in support of change leads to feeble implementation
efforts, higher levels of interpersonal stress, and unsuccessful change implementation
(Fernandez & Rainey 2006; Brescia 2004). Students of recent administrative reforms
have also observed that scanty resources can hamper organizational change
(Chackerian & Mavima 2000; Berry, Chackerian & Wechsler 1999; Bringham &
Wise 1996).
According to Jones, Jimmieson & Griffiths (2005), the advantages of improving all
resources and systems are in the increased achievement of organizational goals
through development of employee capabilities. This was also observed by Miller and
Chen (1994) and Turner and Crawford (1998), who reported that successful change
implementation was demonstrably seen as being the result of increased development
of skills and capabilities among employees. However, not only is sufficient funding
necessary to provide implementing agencies with the administrative and technical
capacity needed to ensure the achievement of objectives (Fernandez & Rainey 2006),
but time is also a necessary resource in change (Brescia 2004). Time allows
employees to participate in the change process and successfully bring their skills to
the process. Therefore, to be successful in change implementation, a key task for
leaders is not only to allow sufficient time for the implementation, but to find a
balance between the resources deployed in change process (Meyer & Stensaker 2006).
They also need to overcome resistance to change by bolstering the confidence of
organizational members by ensuring that their organization has adequate resource
supports to ensure successful implementation of the change (Self 2007).
Fernandez and Rainey (2006) state that resources support can lead to synergies
increasing the likelihood that all changes will be implemented successfully. O'Connor
and Fiol (2006) suggest that when employees feel that they have resources support for
change, it improves the likelihood of change implementation success. Employees'
perceptions of the extent to which their organization has the sufficient resources
56

support to achieve change (e.g. the prov1s10n of timely information, funds, and
training), and the degree to which they can actively and genuinely participate in the
process, are significant factors in accomplishing successful change (Jones, Jimmieson
& Griffiths 2005; Smith 2005).
Relationships
The importance of good company relationships both between employees in the
organization and the outside environment was emphasized in a study by Todd, Billy
and James (1988). As a result, attention needs to be paid to address any matter that
may cause conflict between stakeholders, calculating the interdependent effects of
negative and/or positive outcomes to ensure a successful change process (Beatrice
1990). In this way, relationships are primarily concerned with maintaining warm,
friendly interactions with others (Lee 1997). Thus, in today's business environment,
social relations are often seen as a useful way to reach organizational goals (Neergard,
Sahaw & Carter 2005). For example, a study by Lam (1997) indicated that good
relationships are a significant factor in increasing job satisfaction among quality
managers. Furthermore, if employees have positive attitudes towards each other, the
favourable attitudes will positively influence their behavioural intentions to act
according to group decisions (Taormina & Lao 2007).
Motivation researchers have long been intrigued by the internal factors of
interpersonal relationships that effectively motivate people (Steers, Porter & Bigley
1996). The internal motivational factor of affiliation (Choi 2006) plays an important
role in organizational behaviour. According to McClelland's (1985) theory of needs,
employees with a high need for affiliation tend to emphasize harmonious relationships
with others, and need to feel accepted by them; they tend to conform to the norms of
their work group (Veroff & Veroff 1980). Employees who have high needs for
affiliation tend to gravitate to work environments where the primary focus is on
developing and maintaining ~arm relationships with other employees (Street &
Bishop 1991 ). These employees are highly concerned about opportunities to combine
socially (Baron & Donn 2003; Stinson & Johnson 1977), tending towards enjoying
company, making friends, and maintaining personal relationships (Steers 1987).
57

Cultural values are an important aspect that strongly influences work attitudes and
behaviours (Kirkman, Jones & Shapiro 2000). As pointed out in Hofstede's (2005)
study, both Thailand and Japan are collectivist oriented, tending to define themselves
as members of larger social groups which emphasize the attainment of group goals
and cooperation. As collectivists have a strong need for affiliation (Hui & Villareal
1989), they will happily subjugate their needs to the needs of the group as a whole
(Murphy et al. 2006). Yao and Wang (2006) point out that such collectivism focuses
on the in-group as the ultimate purpose, with the interests of the group more being
important than individual advancement, and obligations overriding personal pleasure.
Paul et al. (2004) state that collectivists emphasize the importance of group demands
and interests over individual need and high collectivism contributes to high
cooperation within group work (Wager 1995). Therefore, in a business environment
in-group relationships are more important than individual achievement (Costigan et
al. 2005), with employees being satisfied that their work provides them with the
opportunity to involve with others (Hui & Yee 1994). As a result, collectivists are
more likely to resolve conflicts by integrating and compromising (Hui & Yee 1999).
Leadership
Leaders are people who are able to keep all factors in balance in order to sustain the
steadiness needed for their organization to meet its goals. This factor is particularly
important because responsibility for the success of their organizations lies directly
with them (Beatrice 1990). Therefore, strong leadership is important when a major
change or development occurs in the organization (Mackay & Horton 2002; Jones,
Blunt & Sharma 1996), and the characteristics of good leaders and their relationships
with fellow employees need to be fully understood. The assumption is that leaders
exercise their power to positively influence organizational capacity and effectiveness.
As shown earlier in Figure 2.2, good leadership is central to linking the five boxes of
vision, structure, rewards, resource supports, and relationship. It is the task of leaders
to deal with factors that influence the organization's effectiveness, and adjust
relationships between the other boxes (Beatrice 1990), and if they do not clearly
describe the mission or vision of their organization, employees will lose sight of their
goals (Dulcelina 1997).
58

Organizational success or failure depends on the ability of its leaders (Zoller &
Fairhurst 2007; Meindl, Ehrlich & Dukerich 1985). Many studies have shown that
strong leadership is the most important factor for successful change (Landrum,
Howell & Paris 2000; Hoffman 1989; Bibeault 1982). Given the challenges of
managing resistance to change, the task of top executives during the implementation
of change can be extremely difficult. Therefore, where important change is involved,
effective leaders who are competent to embrace and facilitate change are required
(Manz, Bastien & Hostager 1991) to influence their subordinates' attitudes (Almeida
Costa & Amaro de Matos 2002; Homer 1997) and movements towards goal
achievement (Robbins 2001). In agreement, Tucker & Russell (2004) point out that
effective leaders influence the way their subordinates think, and introduce new
processes into the organization by emphasizing perceptions of reality, influencing
psychological understanding of current structures, and shaping values to facilitate
comprehension of the need for growth (Brown 1994 ).
As recent research confirms, attitudes are significant determinants of behaviour, and
changing employees' behaviour necessitates changing attitudes (Almeida Costa,
Amaro de Matos & Pina e Cunha 2003; Chapman 2002) by clearly presenting a vision
for organizational change (Bennis & N anus 1997). Therefore, leaders are expected to
have the ability to articulate their vision to rally subordinates' support for the need of
such change (Bass 2002; Conger 1998; Sashkin 1988). Further, Caldwell (2003)
. believes that change needs to be planned in a rational, linear manner, and the leader's
ability to articulate a viable vision is critical to enhancing subordinates' openness
toward the change implementation (Groves 2006). In other words, successful change
occurs when leaders identify viable new pathways for organizations to follow, and
build the impetus for change even when the desired future state of the organization is
still undefined (Chapman 2002). Furthermore, Eisenbach et al. (1999) assert that at
precarious stages in the implementation of a change process, leaders can effectively
change the status quo by presenting appropriate behaviours.
McGreevy (2003) asserts that in changing attitudes in order to motivate subordinates
to participate in change in a positive, proactive way, leaders play a critical key role.
He maintains that in this capacity, good leaders need to be:
• Open, honest and positive in their communication style;
59

• Accessible and visible;
• Able to lead and motivate;
• Willing to provide support and advice; and
• Able to demonstrate an understanding and recognition of effects of the change.
As discussed, support and commitment to change from a leader is a highly influential
factor in facilitating the change adaptation process (Canning & Hanmer-Lloyd 2002),
and plays a crucial role in the successful motivation of employees (Burke 2002; Yukl
2002; Johnson & Leavitt 2001; Carnall 1995; Reyneirse 1994). However, Caldwell
(2003) argues that although leadership is essential to generating and supporting
change, without the ability to create and sustain a motivating vision, change will
simply fail to eventuate. Furthermore, in order to inspire subordinates to actively
participate in change procedures, leaders need to create an attractive vision that
clearly considers the underlying needs and values of the subordinates (Ford & Ford
1994). To achieve this, necessitates creative leaders who can engage their employees
to higher ideals and moral values through defining and articulating a clear vision of
the future (Tucker & Russell 2004 ), and generate a compelling vision to create
quantum advances by building new realities (Harper 1998). In other words, leadership
delineates what the organization's future should look like, aligns subordinates with
that vision, and inspires them to believe that they will also benefit from the proposed
change (Moran & Brightman 2001; Kotter 1996). Furthermore, throughout the
process of change leaders are required to pass on what they know and make sure that
all subordinates get the same message as they are the natural channels of information
who must remain visible and accessible at all times (McGreevy 2003). Leaders have
ability to influence subordinates' readiness for adapting change. Readiness refers to
the term of organizational members' beliefs, attitudes, and intention (Garg & Singh
2006; Kavanagh 1999). Armenakis et al. (1993) and Beer and Walt on (1987) explored
the influence of leadership on organizational members for change. They find that the
primary concern for generating readiness in an organization is the message, which
includes organizational needs and it ability to change. Besides, Britt and Thomas
(2007) a clear and consistent message from leaders is important for effective change.
60

2.16 Limitations of Weisbord's six-box model
The Six-Box model assists analysts to address different groups of frequently
occurring organizational problems. However, like all other models, it has limitations.
For example, the model does not deal adequately with power issues. Furthermore,
although leadership is truly considered as a key concern, understanding the leadership
requirements of an organization depends on the specific context, the strategic
challenge facing it, and the kind and size of organization. Therefore, the innate appeal
of the model, with six boxes emphasizing characteristic organizational problem areas,
must be balanced with the weaknesses occurring from lack of linkages between the
boxes. What exactly does it mean by keeping the boxes in balance? When does its fit
between formal and informal systems constitute a significant capacity potential, and
when is it a constraint? The Six-Box model does not seem to respond to these
questions, however, this model may assist analysts to put into perspective whatever
theories they already know. Therefore, for the purpose of this thesis on
conceptualizing the need for change, Weisbord's Six-Box model offers utilization to
determine what motivational factors influence the adaptation and acceptance of
Japanese management practices in Thailand.
Weisbord's Six-Box organizational model, a behaviourally oriented conceptual
scheme, fits the study because it is output-focused and based on an open-system view
of organizations. Additionally, it is one of the most uncomplicated and
straightforward systematic models available with considerable intuitive appeal
(Harrison & Shirom 1999). Weisbord's Six-Box organizational model serves as a
basis for understanding the inter-relationships of different factors and which may
respond to adaptation (Dana 2004), acting as a guide to determine what changes need
to be made in either individual or organizational behaviour in order to reach
organizational goals (Beatrice 1990). Furthermore, this model has been successfully
applied in many studies focussing on change management (e.g. Lok & Crawford
2000; Abraham, Crawford & Fisher 1999; Abraham, Griffin & Crawford 1999; Chui,
Sharpe & McCormick 1996; Burke & Litwin 1992; Birnbaum 1984; Robert 1984;
Tichy 1983; Preziosi 1980; Nadler & Tushman 1977). Therefore, Weisbord's Six-Box
model has been selected as the most suitable way to guide the researcher in
61

determining the motivational factors that influence the adaptation and acceptance of
Japanese management practices in the context of Thailand.
2.17 Limitations of the literature
An extensive review of related literature has identified pnor empirical studies of
Japanese management practices in Thailand. These studies have focused on Thai
employee's perceptions of Japanese management practices and on how well Japanese
management practices have been implemented in Thailand (William & Onishi 2003;
Mccampbell et al. 1999; Adams & Vernon 1998; Sedgwick 1995). Surprisingly, no
research has been found that examined factors that influence the adaptation and
acceptance of Japanese management practice in Thailand. Moreover, although
Weisbord's Six-Box model has been applied in many change management studies
(e.g. Lok & Crawford 2000; Abraham, Crawford & Fisher 1999; Abraham, Griffin &
Crawford 1999; Chui, Sharpe & McCormick 1996; Birnbaum 1984; Preziosi 1980), it
has never been applied within the context of manufacturing in Thailand.
2.18 Summary
This chapter has reviewed relevant literature related to adaptation and acceptance of
Japanese management. Although Japanese management practises may work
effectively in Japan, their transplantation into the context of Thailand without
adaptation may be inappropriate. Japanese management practices may not be
appropriate because differences in work values exist between the two countries
(Hofstede & Hofstede 2005; Miroshnik 2002). However, to successfully adapt current
practices there are two possibilities: to motivate Thai subordinates to accept Japanese
management practices; and/or to motivate Japanese managers to adapt their Japanese
management practices. Therefore, in order to investigate these possibilities,
Weisbord's Six-Box model including vision, leadership, structure, rewards, resources
support, and relationship is utilized to identify motivational factors that influence
Japanese managers to adapt or change their Japanese management practices, and
inspire Thai subordinates to adapt or change their attitudes to accept such practices.
The following chapter presents the theoretical model and hypotheses for this study.
62

3.1 Introduction
Chapter 3 Theoretical framework
The literature review in the previous chapter discussed many well-known theories and
models which are useful for formulation of the theoretical background of this
research. The literature specific to Weisbord ' s six-box model (e.g. vision, leadership,
rewards, resources support, structure, and relationship) stresses it as an important tool
in determining change (Lok & Crawford 2000; Abraham, Crawford & Fisher 1999;
Abraham, Griffin & Crawford · 1999; Chui, Sharpe & McCormick 1996; Birnbaum
1984; Preziosi 1980). However, as there is no empirical research specifically
addressing the relationship between the six-box model (adopted as motivational
factors) and the adaptation and acceptance of Japanese management practices in
Thailand, it is important to explore this relationship - assuming that the model ' s
components can influence the adaptation and acceptance of Japanese management
practices in Thailand. The study focus is to investigate factors that can be introduced
to manufacturing organizations that enable Thai subordinates to accept, and Japanese
managers to adapt, Japanese management practice in Thai culture.
This chapter has five sections beginning with SeCtion 3.1 which summanses the
objectives of the chapter and outlines what will be covered in the subsections. Section
3.2 discusses the theoretical background of the study and provides brief information
on how the two research aims of the study (as outlined in Chapter 1) are to be
achieved. In Section 3.3 , the conceptual framework developed in this chapter is
presented, illustrating the main conceptual framework (Figure 3 .1) and two sub
conceptual frameworks to support the main one (Figures 3.2 & 3.3). In Section 3.4,
the causal relationships proposed from the framework are discussed, and hypotheses
are developed. Section 3.5 presents a chapter summary.
63

3.2 Theoretical background: An efficient management system ·
Recent research in this area by William and Onishi (2003) confirms that Japanese
managers generally attempt to transplant their management practices to their overseas
affiliates because of their familiarity and proven success. Additionally, Hodgetts,
Luthans and Doh (2006) state that Japanese are very nationalistic and display a high
degree of ethnocentrism in overseas affiliates. As differences in national cultures
demand differences in management practices (Newman & Nollen 1996), conflicts
transpire when the Japanese managers apply their management practices in foreign
countries without adjustment to the local culture. It is a contention of this study that
not adapting management practices decreases the motivation and performance of Thai
subordinates. It is also contended that Japanese management practices should be
adapted in order to increase effectiveness of Japanese affiliates in Thailand (William
& Onishi 2003; Mccampbell et al. 1999; Adams & Vernon 1998; Sedgwick 1995).
Adaptation is a contracted concept of change, specifically within evolutionary change
models (Cameron 1991). Garg and Singh (2006) found two perspectives of change
that have generally been studied: organizational change and individual change. They
maintain that organizational change refers to the visible changes in the organization
where efforts have been made in different areas including structure, systems,
managerial strategies, culture and technology. Conversely, individual change refers to
the changes in attitude, vision and target of individuals within the organization. In this
study, change is defined as a change in Japanese managers ' attitudes toward
adaptation of Japanese management practices, and a change in subordinates' attitudes
toward acceptance of Japanese management practices.
Coenell (1996) states that change can be achieved if employees are motivated to
accept it. Thus, if the motivational factors are understood, change can be successfully
accomplished. Buchan (2005) views the intention of a person as either to perform a
given behaviour or not (the immediate determinant of action), and views attitude as
determined by the person' beliefs and evaluation of the expected outcome. In this
context, Buchanan and Huczynski (1985) point out that motivations influence how
people act. According to Robbins (1998), motivated people are willing to exert high
64

levels of effort towards organizational goals in order to satisfy their individual needs.
Therefore, for the purposes of this study, it is presupposed that adaptation and
acceptance of Japanese management practices can be achieved by providing
motivational factors to influence Japanese managers to adapt or change their usual
management practices, and to inspire Thai subordinates to adapt or change their
attitudes to accept Japanese management practices.
For the purposes of this study, a conceptualization of need to change, such as that
proposed in Weisbord' s six-box model, is utilized to determine what motivational
factors influence the adaptation and acceptance of Japanese management practices.
Many studies have investigated how to achieve change, several of which have
adopted Weisbord' s six-box model (diagnostic model) as motivational factors to
inspire employees to change (e.g. Lin 2007; Lok & Crawford 2000; Abraham,
Crawford & Fisher 1999; Abraham, Griffin & Crawford 1999; Chui, Sharpe &
McCormick 1996; Birnbaum 1984; Preziosi 1980). Weisbord' s six-box
organizational model, a behaviourally oriented conceptual scheme, fits the study
because it is output-focused and based on an open-system view of organizations.
Additionally, it is one of the most unsophisticated and straightforward systematic
models available and has considerable intuitive appeal (Harrison & Shirom 1999). As
mentioned previously, these six boxes include vision, leadership, rewards, resources
support, structure, and relationship (Weisbord 1978). In support of this model, Vakola
and Nikolaou' s (2005) study confirms that factors such as good work relationship,
clear vision, leadership, allocation of resources, rewards, and training are crucial in
order to increase the level of change readiness. Here, change readiness refers to the
extent to which employees hold positive views about the need for organizational
change (Armenakis & Harris 2002).
3.3 Theoretical framework
The term theoretical framework refers to a collection of theories and models from the
literature which underpin a positivistic research study (Hussey & Hussey 1997). In
other words, it is a conceptual model of how the researcher theorises or makes logical
sense of the relationships among the variables that have been identified as important
65

to their problem. However, it is essential to understand what and how those variables
can affect the research problem (Kripanont 2007). After the theoretical framework
has been formulated, then testable hypotheses can be developed to examine whether
the theory formulated is valid or not (Sekaran 2003).
In this study, the theoretical framework has been formulated according to the research
objectives in Chapter 1, and based on some aspects of the theories and models of
change reviewed in Chapter 2. Having set the context and explored motivational
theory and change management theory, a conceptual framework has been developed
by adopting Wiesbord's six-box model as the motivational factors influencing
Japanese managers to adapt, and Thai subordinates to accept, Japanese management
practices (Figure 3 .1).
Six-Box model: vision, leadership, resources support, structure, reward,
relationship
Adaptation
,-----------------------, : Accommodation , : "Good management practices" -:
Six-Box model: vision, leadership, resources support, structure; reward,
relationship
Acceptance
Figure 3.1: Japanese management practices in Thailand: Development of good
management practices
66

To fill the gap in the literature review and fulfil the aims of this study, two more
detailed sub-conceptual motivational models have been designed to suit both
Japanese managers (see Figure 3.2) and their Thai subordinates (see Figure 3.3).
Vision Leadership Rewards
HI A H2A H4A
•Ir · Ir .1rl --- -- ---------- -- --I I . .-- ----- ---- ------
I Japanese managers .. - - - ... Adaptatiol - - - .... : Accommodation I I I I H7A I ··Good management or I I I --- - --------- - ----- ----------- -------
. • • I
act1ces ' --- - -- · •l •l '
H3A H6A
I HSA
l Str ucture Relationsh ip Resources
support
Proposed research model 1
Figure 3.2 : Model of motivational factors influencing J apanese managers
Vision
HIB
--------- --- -------I I I Thai subordinates .. - - - ... I I I I I I ------- -- ----------
H3B
I Str ucture
L eadership
H2B
•Ir •Ir •Ir
Acceptance"71
' ' '
HSB
Relationship
Rewards
H4B
.-------- ---------- - - .... :
I I
Accommodatio I
n I
"Good management or actices·· : ---------- ----- --- ______ ,
H6B
l Resources
support
Proposed research model 2
Figure 3.3: Model of motivational factors influencing Thai subordinates
Although these two proposed research models look similar, they will yield different
results (adaptation and acceptance of Japanese management practices) which were
suitably applied into one main theoretical framework for the study (Figure 3.1 ).
67

3.4 Hypotheses development
Based on the two research questions formulated in Chapter 1 and the review of
literature on change management and motivational theory in Chapter 2, hypotheses
for the present research have been developed as follows.
3.4.1 Vision
One of the important motivators to provide change readiness and support change is
the sense that change is needed (Armenakis, Harris & Feild l 999a; Armenakis, Harris
& Mossholder 1993). Therefore, implementation of change requires leaders to
convince other members in the organization that change is necessary by
demonstrating the need for change (Laurent 2003; Burke 2002; Armenakis, Harris &
Feild l 999b; Kotter 1995). The process of convincing members of an organization of
this need normally starts with crafting a compelling vision (Fernandez & Rainey
2006) to enable a conceptualization of direction to facilitate organizational success
(Foster & Akdere 2007). In agreement, Nutt and Backoff (1997) assert that vision is
the trigger for radical transformational change.
Awamleh and Gardiner (1999) point out that motivation arrives when leaders inspire
their subordinates by providing meaning and challenge to their work; for instance,
giving encouragement, communicating vision, and acting in ways that inspire
enthusiasm. Hackett and Spurgeon (1996) further point out that leaders who motivate
their subordinates by sharing their vision of the organization, facilitate the
subordinates to recognize ways to achieve the organizational goal. This is a tool that
leaders can apply to inspire their subordinates to increase levels of motivation,
commitment and performance (Dvir, Kass & Shamir 2004; Proctor & Doukakis 2003;
Bryman 1992).
Vision is seen to be the catalyst for incentive for change (Barnett & McCormick
2003; Smith 1996a, 1996b; Snyder & Graves 1994). The most powerful technique
that an organization can utilize to achieve change is for leaders to communicate their
vision to widen support for their plans (Bennis & Nanus 1997; Cowley & Domb
1997; Jones & Kahaner 1995; Conger & Kanungo 1988; Conger & Kanungo 1987;
68

Bass 1985). Therefore, one of the steadiest features in successful diverse change is
the attribution of importance to vision and effective communication (McAdam 2003;
Kotter 1995).
The pnmary technique for creating employee change readiness, acceptance and
adaptation to a vision, is that the change message as perceived from direct
communication, and supported by symbolic evidence as the change unfolds (Holt et
al. 2006; Armenakis & Bedeian 1999; Armenakis, Harris & Mossholder 1993). Tichy
and Sherman (1994) state that organizations should describe their vision and
proposed destination so that all members in the organizations can share in the process.
In this way the shared vision generates positive measures of organizational
effectiveness through increased adaptability and flexibility (Bennis & Nanus 1997).
Moreover, several studies adopting this concept have demonstrated that vision is
highly influential in causing change (e.g. Lok & Crawford 2000; Abraham, Crawford
& Fisher 1999; Abraham, Griffin & Crawford 1999; Preziosi 1980). In this study,
therefore, it is assumed that vision may be a primary motivational factor for both the
adaptation and acceptance of Japanese management practices in Thailand.
Based on the preceding discussion of how v1s10n may influence change and in
fulfilment of the research aims in Chapter 2, the following hypotheses are presented:
HIA: vision is a positive influential factor for Japanese managers to adapt Japanese
management practices.
HJB: vision is a positive factor for Thai subordinates to implement Japanese
management practices.
3.4.2 Leadership
Although researchers have shown that v1s10n 1s a pnmary factor in facilitating
change, several researchers have shown that without strong leadership, such change
may fail. Therefore, strong leadership is the most important factor in the
implementation of successful change (e.g. Landrum, Howell & Paris 2000; Hoffman
1989; Bibeault 1982). Leadership refers to the ability to motivate, stimulate and
inspire subordinates to put extra effort into achieving organizational goals (Robbins
69
2001; Landrum, Howell & Paris 2000; Homer 1997). Leaders can influence the way
subordinates think and introduce new processes to the organization (Tucker & Russell
2004). Furthermore, as attitudes are important determinants of behaviour (Almeida
Costa, Amaro de Matos & Pina e Cunha 2003; Chapman 2002), successful leaders
have the ability to change their subordinates' attitudes to work more gainfully for the
organization (Almeida Costa & Amaro de Matos 2002; Homer 1997). Eisenbach et
al. (1999) assert that these leaders can effectively change the status quo by presenting
appropriate behaviours at the appropriate stages in change process. Thus, the leader's
support and commitment to change play a crucial role in success (Burke 2002; Yukl
2002; Johnson & Leavitt 2001; Camall 1995).
Caldwell (2003) points out that strong leaders can facilitate the process of change by
specifying new pathways for organizations to follow and building stimulus for
change, even when the desired future state of the organization is not defined
(Chapman 2002). Therefore, leaders in organizations need to stimulate subordinates
to align their purposes, identities, and understandings of the importance of change
(Moran & Brightman 2001). In agreement, Cannaing and Hanmer-Lloyd (2002)
believe that support from a leader is one of the factors that facilitate the adaptation
process. In this, leaders provide explanations of their vision and desired direction to
assist subordinates in understanding and following (Marzec 2007; McGreevy 2003;
Armenakis & Harris 2002; Harper 1998; Kotter 1996). This demonstrates that the
leaders are committed to investing the time, _energy, and resources necessary to make
the change (Eisenbach, Watson & Pillai 1999), and the subordinates may feel that
their participation in the change process is secured (Cowley 2007). In this sense,
leadership is a mutually reinforcing component of the change. Several studies have
confirmed these principles through utilizing leadership as an influential factor that
causes change (e.g. Lok & Crawford 2000; Abraham, Griffin & Crawford 1999;
Preziosi 1980).
Based on the above discussion of how leadership may influence change, and in
fulfilment of the research aims in Chapter 2, the following hypotheses are presented:
H2A: leadership is a positive influential factor for Japanese managers to adapt
Japanese management practices.
70

H2B: leadership is a positive influential factor for Thai subordinates to implement
Japanese management practices.
3.4.3 Structure
Only convmcmg the members of an organization for the need for change by
providing vision is not adequate to bring about the change (Fernandez & Rainey
2006). Vision must be transformed into a course of action or plan for accomplishing
the change (Abramson & Lawrence 2001; Lambright 2001; Young 2001; Kotter
1995). Planning is the collaborative creation of design specifications for change
directed to identify where and when the actions will happen, who is in charge, what is
needed, and how the action will start and end (Lippert & Davis 2006). Nutt (1993)
defines planning as identifying the specific activities needed in the change process.
However, in order to be successful in a change process, employees who participate in
such change need to know what to do, how to improve upon what they do, and how to
achieve it effectively (Rosenberg 2003).
Structure identifies the narrow ways of how to implement plans for change in
particular situations by specific people and in specific time (Vilkas 2006). It provides
direction for how to implement change by providing a series of steps for change
activities, and identifying who is responsible for the change process (Richardson
2007; Williams & Rains 2007). This should provide change participants with
sufficient interpretative schemes or references to communicate the reality of their
roles in the change process (Akgun, Byrne & Keskin 2007) to indicate how the
change can be achieved (Staber & Sydow 2002).
O'Conner and Fiol (2006) assert that successful implementation of change needs to
be facilitated by effective structure supports, and when a clear direction of how to
implement the change is recognized, participants will be motivated to implement the
. change (Hackett & Spurgeon 1996). Furthermore, several researches have confirmed
that structure is an influential factor that causes change (e.g. Lok & Crawford 2000;
Abraham, Griffin & Crawford 1999; Preziosi 1980). In this study, therefore, it is
assumed that structure may be a positive factor to assists in the adaptation and
acceptance of Japanese management practices.
71

Based on the preceding discussion of how structure may influence change, and in
fulfilment of the research aims in Chapter 2, the following hypotheses are presented:
H3A: structure is a positive influential factor for Japanese managers to adapt
Japanese management practices.
H3B: structure is a positive influential factor for Thai subordinates to implement
Japanese management practices.
3.4.4 Reward
Takahashi (2006) states that high level of rewards generates the enhancement of
workers' motivation. Thus, rewards are a significant technique in motivating
employees in an organization to implement change (Buch & Tolentino 2006). They
are frequently utilized to motivate employee behaviour to attain positive
organizational outcomes (Ford & Greer 2005; Kerr & Slocum 1987; Cummings &
Schwab 1973 ). In other words, the common purpose of rewards is to attract, retain
and motivate employees to increase their effort and output towards the success of
organizational goals (Bergmann & Scarpello 2001 ).
As motivation influences the intensity, duration and direction of an action (Jindal
Snape & Snape 2006), it is considered as a key determinant of successful change
(Josep & Caroline 2007). Therefore most managers accept that using the right
motivational techniques can inspire their employees into doing more of what they
want (Strickler 2006), acting as a reinforcement to ensure desired behaviours (Lin
2007; Govindarajulu & Daily 2004). Recognition, promotion, increased pay, benefits
and incentives are some of the techniques that can be utilized to reward employees for
participating in change process (Marks 2001; Patton & Daley 1998; Leitch et al.
1995; Atwater & Bass 1994). Thus, as such rewards are seen to significantly affect
employee participation (Fenwick & Olson 1986), certain forms of extrinsic
motivation including monetary rewards, praise and recognition can be used to
motivate them to participate in change. In agreement, several studies have adopted
rewards as an influential factor that causes change (e.g. Lin 2007; Lok & Crawford
2000; Abraham, Griffin & Crawford 1999; Preziosi 1980). Therefore, for the
72

perspective of the present study, it is assumed that if employees believe they can
receive rewards, they are likely to develop more positive attitudes toward adaptation
and acceptance of Japanese management practices.
Based on the preceding discussion of how rewards may influence change, and in
fulfilment of the research aims in Chapter 2, the following hypotheses are presented:
H4A: reward is a positive influential factor for Japanese managers to adapt Japanese
management practices.
H4B: reward is a positive influential factor for Thai subordinates to implement
Japanese management practices.
3.4.5 Relationship
Interpersonal relationships are a helpful method to reach organizational goals
(Neergard, Sahaw & Carter 2005). This is because employees with high needs for
affiliation are likely to be attracted by work environments where the primary focus is
on developing and maintaining warm relationships with other employees (Street &
Bishop 1991 ). It is assumed that if an employee has a positive attitude towards their
relationship with other employees in the organization, this will positively influence
their behavioural intentions to act according to the group' s decision (Taormina & Lao
2007). Thus, the employee's behaviour is more likely to be in accordance with the
decision of the group they employee belong to. This will be even more so in the case
of this study, as both Thai and Japanese cultures are collective (Hofstede & Hofstede
2005), emphasizing on the demands and interests of the group rather than on the
individual interests (Paul et al. 2004). Collectivists have strong needs for affiliation
(Hui & Villareal 1989), and are more likely to solve conflicts by integrating and
compromising (Hui & Yee 1999). Therefore, both Thai and Japanese employees will
be concerned about their relationships with others in the organization (Hofstede &
Hofstede 2005), and may strongly refuse a change that presents conflict with other
employees in the organization. Therefore, for the purposes of this study, it is proposed
that interpersonal relationship or affiliation of employees may be a key factor in
influencing the adaptation and acceptance of Japanese management practices.
73

Based on the preceding discussion of how relationships may influence change in
organizations and the research aims outlined in Chapter 2, the following hypotheses
are presented:
H5A: relationship is a positive influential factor for Japanese managers to adapt
Japanese management practices.
H5B: relationship is a positive influential factor for Thai subordinates to impleme~t
Japanese management practices.
3.4.6 Resources support
Several studies have adopted resources support and found it to be influential in
affecting organizational change (e.g. Lok & Crawford 2000; Abraham, Crawford &
Fisher 1999; Abraham, Griffin & Crawford 1999; Preziosi 1980). Support of
available finance, communication technologies, flexible systems and responsive
training and education all contribute to a supportive foundation in facilitating change
(Kerber & Buono 2005), making resources support one of the most significant factors
in effective change implementation (Boyne 2003). Therefore, to overcome resistance
to change, leaders need to boost the confidence of employees by ensuring that the
organization has ample resource support to implement such change (Self 2007).
Fernandez and Raine (2006) found that this kind of support can lead to synergies that
increase the possibility of all changes being implemented successfully. Indeed,
employees' perceptions of the extent to which their organization has sufficient
resources support to achieve the desired change, and the degree to which they can
actively and genuinely participate in the process, are significant factors in
accomplishing successful change (Jones, Jimmieson & Griffiths 2005; Smith 2005).
Conversely, failure to provide enough resources to support change can lead to feeble
implementation efforts, higher levels of interpersonal frustration, and unsuccessful
change implementation (Fernandez & Rainey 2006; Brescia 2004). Therefore, it is
assumed that resources support may be a motivational factor that assists adaptation
and acceptance of Japanese management practices.
74

Based on the preceding discussion of how resources support may influence change
above and in fulfilment of the research aims in Chapter 2, the following hypotheses
are presented:
H6A: resources support is a positive influential factor for Japanese managers to
adapt Japanese management practices.
H6B: resources support is a positive influential factor for Thai subordinates to
implement Japanese management practices.
3.4. 7 Acceptance and adaptation
As discussed in Chapter 2, motivation arises when a need is aroused and the person
wants to satisfy it (Solomon 1994). Motivation is determined by goal directedness,
free will or human volition, and perceived needs and desires (Locke 1997). Locke and
Latham (2004) assert that the concept of motivation refers to internal factors that
impel action and to external factors that induce action.
Motivation has an effect on individual behavioural action (Moody & Pesut 2006).
Perry et al. (2006) state that motivational factors can lead to specific behavioural
outcomes including adaptation and acceptance of change. Therefore, motivation
strategies are important for facilitating any organizational change management
(Locke & Latham 2004) that may confront the phenomenon of resistance to change
(Beer 2000). Coenell suggests ( 1996) that that effective adaptation and acceptance of
change can occur when employees are motivated to accept such change. Thus, if the
motivational factors are recognized, adaptation and acceptance of change will be
successful implemented.
For the purposes of this study, it is proposed that adaptation and acceptance of
Japanese management practices may be successfully achieved by motivating Japanese
managers to adapt or change their Japanese management practices, and by motivating
Thai subordinates to adapt or change their attitudes to accept Japanese management
practices.
75

Based on the preceding discussion of how motivation factors of vision, leadership,
structure, resources support, and rewards may influence change, and the research
aims outlined in Chapter 2, the following hypotheses are presented:
H7A: at least one of six factors is an effective factor that positively influences
Japanese managers to adapt Japanese management practices.
H7B: at least one of six factors is an effective factor that positively influences Thai
subordinates to implement Japanese management practices.
3.5 Summary
As discussed earlier, within the change management literature much research has
investigated influential factors that can facilitate adaptation and acceptance of change,
using Weisbord's six-box model including vision, leadership, structure, rewards,
relationship and resources support (e.g. Lin 2007; Lok & Crawford 2000; Abraham,
Crawford & Fisher 1999; Abraham, Griffin & Crawford 1999; Chui, Sharpe &
McCormick 1996; Birnbaum 1984; Preziosi 1980). These factors have been utilized
to cause change in several different contexts; however, there is no empirical research
specifically addressing the relationship between these factors and adaptation and
acceptance of Japanese management practices in Thailand. Thus it is important to
explore the relationship between the six-box model and the proposed adaptation and
acceptance, under the assumption that this model can positively influence such
adaptation and acceptance. Therefore, the focus of this study is to investigate the
factors that can be introduced to manufacturing organizations that enable Thai
subordinates to accept, and Japanese managers to adapt, Japanese management
practice to Thai culture.
Based on the theoretical framework, the hypotheses developed from the framework
intend to establish the influential factors in facilitating change in Japanese managers '
attitudes toward adaptation of Japanese management practices, and change in
subordinates' attitudes toward acceptance of such practices. The proposed models
76

may assist Japanese manufacturing companies m Thailand to improve their
management practices, and as a result, their overall business efficiency. The
methodology adopted in order to test the fourteen hypotheses is discussed in the next
chapter.
77

Chapter 4 Methodology, research process,
and computer programs
4.1 Introduction
This chapter discusses the methodology used to examine the theoretical framework
developed in section 3 .1 and to address the research questions discussed in Chapter 1.
Nine subsections include: Section 4.1 introducing the chapter objectives and Section
4.2 which outlines the research process. Section 4.3 discusses literature on the
motivational factors adopted in Chapter 2. Section 4.4 overviews the quantitative
approach of questionnaires used in the collection of data. Section 4.5 discusses the
scale development process, and development of the constructs. Section 4.5 also
discusses translation and back-translation of the survey in English Thai and Japanese.
Pre-testing of the questionnaires which was checked by management academics and
professionals are also discussed in this section, as well as reliability testing. Section
4.6 discusses the population, sampling method, and procedures used in the thesis. It
overviews the screening and cleaning of data, and includes checking for completeness
of responses, and frequencies of items. Section 4. 7 deals with the statistical
techniques used to examine the research questions, using structural equation
modelling and descriptive statistics to explore the eight hypotheses. Section 4.8
discusses the ethical issues in this research, and Section 4.9 summarises the chapter.
78

4.2 Research process-design and methodology
The procedure of research adopted in this study consists of the eight steps illustrated
in Figure 4. 1 below. These include: the research objectives, research questions the
literature search; research design; questionnaire development; research setting,
sampling size an_d procedures; and quantitative data analysis and interpretation of
results.
Research Objectives +---• The aims of the research • Research gaps • Contribut ion to the knowledge
,.
Research questions +---
• Research questions • Hypothesis setting
•r
Literature search • Printed and electronic sources, academic journals, books, on-l ine data bases, academic
theses and conference proceedings - for identifying the domain of constructs and sample nool
Research design • Deciding on research questions and generation of hypotheses
• Deciding on appropriate research design (quantitative)
Questionnaire development • Questionnaire design • Scaling decision
• Per-test-reliability, validity, language back translation
, .. Research setting, sampling size and procedures
• Population • Sample size • Data collection procedure • Screening data
,, Methodology: Quantitative data analysis and interpretation of results
• Goodness of data • Descriptive statistic • Frequencies (SPSS) • Reliabilities (SPSS)
• Structural equation modelling (AMOS) • Interpretation and reporting of results
,, Results and findings
Interpretation and reporting of results -•
Figure 4.1: The research process 79

4.3 Literature search
In formulating the research process for this thesis, a review of literature on
motivational factors was undertaken (Chapter 2). The search involved secondary
analysis of available information including academic journals, books, on-line data
bases, postgraduate theses, and conference proceedings. Data bases for accessing the
academic journal articles included: EBSCOhost for academic Search Elite, Business
Source Complete, Emerald Full Text, PsycArticles, Australian Digital Theses,
Expanded Academic Index, Wiley InterScience, and Blackwell Synergy.
4.4 Research design
The research design and overview of the methodological approach taken m the
present study are discussed below.
4.4.1 Quantitative research
Research methods are generally categorized into two types, quantitative and
qualitative methods (Cherry 2000). Both methods provide various approaches of
gathering and interpreting information, and their relative merits have been debated in
the literature (Veal 2006). For example, Nunnally and Bernstenin (1994) argued that
research without application of quantitative approaches cannot be considered as
scientific, whereas Denzin and Lincoln (2005) argue that qualitative approaches are
displacing 'outdated' quantitative approaches. However, each approach is appropriate
or inappropriate, depending on the research being undertaken - which is most suited to
the subject under investigation and provides the information best suited to the
purposes of the research (Collis & Hussey 2003).
Qualitative approaches involve the collection of non-numerical data that includes
large amounts of relatively rich information about relatively few subjects. This can be
conducted through in-depth interviews, focus groups, participant observations and
case studies (Veal 2006; Cavana, Delahaye & Sekaran 2001). Moreover, qualitative
approaches involve inductive hypothesis-generating research (as opposed to
80

hypotheses testing), and tend to emphasize data that supports the researcher' s
argument - which is limited to indications of contrary evidence being sought.
Consequently, results can vary from research to research, becoming problematic when
researchers become fixated on exploratory research and do not progress beyond this to
the hypotheses testing stage (Silverman 2006; Cherry 2000). Although the
quantitative approach has been criticized for its inability to produce theory or generate
in-depth explanations of qualitative enquiry, it can verify hypotheses and generate
strong reliability and validity (Amaratunga et al. 2002; Cavana, Delahaye & Sekaran
2001).
Quantitative approach provides the fundamental connection between empirical
observation, and the mathematical expression of quantitative relationships (Neuman
2006). Therefore, quantitative research utilized m this study involves the
measurement and testing of hypotheses based on an empirical examination of
dependent and independent variables employing statistical techniques (Neuman 2006;
Zikmund 2003).
Quantitative approach is considered appropriate when studying relationships between
several variables (Neuman 2006; Cavana, Delahaye & Sekaran 2001; Larsson 1993).
As discussed in Chapter 2, needs for change literature indicates there are relationships
between motivational factors such as vision, leadership, structure, rewards,
relationship, resources support, and change. The thesis attempts to investigate these
relationships in Thai culture context by testing the proposed hypotheses based on
existing theory. This method is consistent with a number or quantitative researchers
which have found that those motivational factors can influence change in
organizations or individual attitudes (e.g. Lin 2007; Lok & Crawford 2000; Abraham,
Crawford & Fisher 1999; Abraham, Griffin & Crawford 1999; Chui, Sharpe &
McCormick 1996; Birnbaum 1984; Preziosi 1980).
Many of the scales utilized within the above studies have been tested for validity and
reliability, hence claiming further scientific credibility. Besides, the scales utilized in
the study were adopted from previous literature, and in order to test the hypotheses of
the thesis, qualitative data was required. On the above justification, the researcher
decided to choose a quantitative rather than qualitative approach for this thesis.
81

Statistical data analysis will also allow the thesis to identify information such as
which motivational factors influence Japanese managers to adapt and influence Thai
subordinates to accept Japanese management practices in Thailand.
According to Canava et al. (2001 ), 'measurement of the variables in the theoretical
framework is an essential part of research and an significant aspect of quantitative
research design'. In this study, a quantitative technique utilizing mailing questionnaire
survey method was applied to measure and collect data. This method permitted the
formation of concrete numerical descriptions of respondents' perceptions on a number
of constructs, and allowed the relationships between constructs to be examined
utilizing several statistical techniques as discussed in the following sections.
4.4.2 Survey methodology
The current study is primarily a deductive and positivist approach for testing the
conceptual models. The survey method was selected as the most appropriate research
technique to fulfil the objectives of this study due to:
1) Type of overall research question. This is the first state for differentiating among
manifold research strategies. The question type with 'how' and 'why' are
appropriate to the case study method while the questions with "who', 'what', 'how
much', and 'to what extent' are appropriate for surveys (Yin 1994). The nature of
the research questions being investigated in this study, for instance 'what are the
motivational factors that influence Japanese managers to adapt their management
practices?' is appropriate for the use of survey-based research approach.
2) The degree of focus upon contemporary as opposed to historical events.
The survey approach is selected in examining contemporary events as opposed to
historical events (Yin 1994). This thesis emphasises on the ongoing contemporary
issue of cross cultural management practices, and employee attitudes.
82

As noted in the Chapter 3, the objectives of the study are the motivational factors that
influence Japanese managers to adapt or change their management practices, and that
inspire Thai subordinates to adapt or change their attitudes to accept Japanese
management practices. The survey method allows information on beliefs, attitudes
and motives to be collected (Bums 2000). Furthermore, survey method is intended to
deal with the nature of people's beliefs, opinions and feehngs (Shaughnessy &
Zechmeister 1997), making it appropriate for collecting the type of data required to
test the theoretical model put forth in the current research. A survey method utilizing
questionnaires for data collection generates a quantitative description of a fraction of a
population and allows the researcher to draw conclusions about generalizing the
results from a sample of responses to a population (Creawell 1994). Survey is also
low-cost, fast, efficient and accurate means of assessing information about a
population and can be administered to a large sample (Sekaran 2003; Churchill 1995;
McClelland 1994).
4.4.3 Cross-sectional survey research
The most popular form of survey is a cross-sectional survey (Zikmund 2003). Cross
sectional surveys involve the data collection from a sample drawn from a
particularized population at a particular point in the time (Babbie 2000). These
surveys are often utilized (Visser, Krosnick & Lavrakas 2000), and in practice most
surveys fall into this category (Zikmund 2003). Cross-sectional surveys offer the
opportunity to assess relations between variables (Reis & Judd 2000); therefore, this
survey approach will be utilized in this thesis.
4.4.4 Mailing questionnaire survey
Data collection can be performed using various methods: questionnaires (including
personally administered questionnaires, mail questionnaires and electronic
questionnaires); personal interview; or telephone interview. Although personal
interviews or telephone interviews have many unique advantages, such as opportunity
for feedback and probing of complex answers, they have time and cost limitations
(Zikmund 2003; Cavana, Delahaye & Sekaran 2001). Moreover, respondents are not
anonymous and may be reluctant to provide sensitive information to researchers.
83

Conversely, questionnaires method have some advantages including reaching large
numbers of people with a minimum of cost and minimal staff involvement (Sekaran
2003), as well as can be able to be administered electronically, if desired (Cavana,
Delahaye & Sekaran 200 l ). Questionnaire method is an efficient data collection
mechanism when the researcher knows exactly what is required and how to measure
the variables of interest (Sekaran 2003).
Questionnaires can be self-administered or by mail. Mailing questionnaire was mainly
utilized to collect primary data for this thesis, because 1) this technique can cover a
large geographical area. Since there are many Japanese manufacturing companies in
Thailand, it was impossible to use self-administered questionnaires due to the high
expense and time consumed, 2) mail survey questionnaire can be filled out whenever
the respondent has time. Thus, there is a better chance that respondents will take the
time to think about their replies (Zikmund 2003). Normally the response rates of mail
questionnaires start relatively high for the first two weeks, then gradually taper off
(Zikmund 2003 ). To deal with the issue of low response rates, the researcher utilized
much effort in order to improve the response rates.
By using the mailing questionnaire survey, respondents will be able to respondent
freely to questions with the assurance that their identities remain anonymous.
Allowing respondents to be anonymous is a critical factor in obtaining more valid
answers, especially, compared to personal or telephone interviews (Cavana, Delahaye
& Sekaran 2001 ). It can be noted that survey methodology has been used in much
previous research, and most of them used questionnaires survey (Lin 2007; Lok et al.
2005; Abraham, Sullivan & Griffin 2002; Lok & Crawford 2000; Zineldin & Jonsson
2000; Abolghasemi, McCormick & Conners 1999; Abraham, Crawford & Fisher
1999; Abraham, Griffin & Crawford 1999; Abraham, Fisher & Crawford 1997; Chui,
Sharpe & McCormick 1996). The development of questionnaire survey for the thesis
will be discussed in Section 4.4.
84

4.4.5 Unit of analysis
The unit analysis is defined as the level of aggregation of the data collected during the
subsequent data analysis stage (Sekaran 2003). For this study, the unit of analysis is
an individual employee within Japanese manufacturing companies in Thailand. The
researcher treated each response as an individual data source.
4.5 Questionnaire development
According to Sekaran (2003), a questionnaire is a pre-formulated written set of
questions to which respondents record their answers, usually within rather closely
defined alternatives. It is a significant instrument in a survey when the researcher
knows exactly what is required to measure the variables (Bailey 1994), and is
appropriate for obtaining sensitive information such as that relating to the personal
attitudes, perceptions and background of respondents. This kind of instrument is one
of the most frequently utiliz.ed for data collection (Saunders, Lewis & Thornhill 2003;
Clarke 1999) due to its effectiveness in collecting empirical data from large sample
(McClelland 1994).
In designing a questionnaire, the sequencing of questions can affect the nature of
respondents' answers and cause some errors in analysis (Kinnear & Taylor 1996).
Furthermore, Tull and Hawkins (1990) suggest that the overall questionnaire should
reflect the objectives of the research and move from one topic to another in a logical
manner (all questions focusing on one topic completed prior to moving on to the next
topic). Zikmund (2003) recommends that in order to reduce low response rates, a
mailed out questionnaire should not exceed six pages.
As discussed in Chapter 3, the questionnaires for Japanese managers and Thai
subordinates were developed separately (copies available in Appendix 3). Each
survey instrument for this study was limited to three pages and questions classified
under the same topic were grouped together in order to aid dynamics and flow.
Contents of this instrument included: the purpose of the study; the importance of the
study; assurance of complete confidentiality; directions on responding to each
question; appreciation for the subject' s participation; and the questions. Both Thai and
Japanese questionnaires started with a cover letter introducing the research
85

background and aims, disclosing the identity of the researcher and prom1smg
confidentiality and anonymity for respondents. Considerable attention was given to
developing clear, unequivocal and useful questions before distributing the
questionnaires to gather primary data. This was significant because designing
questions that respondents can accurately answer will decrease non-response and
measurement errors (De Vaus 2002). Questionnaires for both Thai and Japanese were
developed similarly and presented in four sections as follows.
Section 1 Demographic ieformation
This section included seven questions about employees' age, gender, position, tenure,
and background information of their organizations.
Section 2 Implementation of Japanese management practices
This section required the respondents to indicate whether Japanese management
practices had been implemented in their organizations, and the extent to which they
were being implemented.
Section 3 Motivation · to the adaptation/acceptance of Japanese management
practices
This section contained six questions about motivational factors that could influence
their adaptation and acceptance of Japanese management practices ..
Section 4 Adaptation/acceptance of Japanese management practices
This section concerned the extent to which respondents thought they would agree to
adapt/accept Japanese management practices to local conditions if they were provided
those motivational factors outlined in the Section 3.
4.5.1 Scaling decision
De Vaus (2002) states that the best way of raising reliability is to use multiple-item
indicators and other methods involving question wording, interviewer training and
suitable methods of coding. However, although single item scales are uncomplicated,
Danaher and Haddrell (1996) claim that there are at least two disadvantages. Firstly,
the single-item scale has considerable random measurement error (Blalock 1979) and
86

cannot provide information on components or assess various dimensions separately.
Secondly, it is difficult to assess reliability with a single-item measure, requiring test
retest formats for estimates. In contrast, multiple-item scales tend to be more
representative, stable, and more likely to relate to a construct (Neuman 2006;
Nunnally & Bernstein 1994; Sopector 1992).
As the use of multiple indicators in the survey instrument can maximize validity and
reliability, the design of the questionnaire in this study was based on adapting existing
multiple-item scales which had been validated and found reliable in previous studies.
For example, Lok and Craford (2000) used six factors that can influence
organizational effectiveness. These included five-item measures of each of the
following items: leadership; measure of vision; reward; structure; relationship; and
helpful mechanisms. Furthermore, Abraham et al. ( 1999) utilized a four-item measure
of resource support and a five-item measure of vision to predict the effectiveness of
cultural change in improving productivity following the introduction of total quality
management. These scales have been adapted for inclusion in the survey
questionnaire of this thesis (see Section 4.5.2).
In order to maximise the effectiveness of the survey instrument, a decision was made
on the most appropriate way to obtain credible responses from subjects in relation to
objects, so that meaningful inferences could be made (Cavana, Delahaye & Sekaran
2001; Devlin, Dong & Brown 1993; Anderson, Basilevsky & Hum 1983). As Likert
scales are designed to allow respondents to indicate . degree of agreement or
disagreement of perceived object with a statement on a seven-point scale (Cavana,
Delahaye & Sekaran 2001; Anderson, Basilevsky & Hum 1983) they are the easiest to
construct and administer, and the simplest for respondents to use (Zikmund 2003;
Anderson, Basilevsky & Hum 1983). As a result, Likert scales are the most
commonly used instruments for measuring opinions, beliefs and attitudes (Neuman
2006; DeVellis 2003; Anderson, Basilevsky & Hum 1983). Therefore, in order to find
the perceptions of motivational factors that can influence adaptation and acceptance
of Japanese management practises based on existing experiences, respondents were
asked to respond to a seven-point Likert scale ranging from 1 = Not at all important,
to 7 =Extremely important.
87

4.5.2 Item adoption
This section explains the process of adopting items for each of the constructs
developed in the thesis. The methodology literature highlighted some issues needing
consideration during this process. One of the important issues in designing a
questionnaire is that questions should only be included if they are related to the
research questions (Veal 2006). Veal also suggests that the wording of questions
should avoid jargon, ambiguity and leading questions, and should ask only one
question at a time. This is intended to decrease both item non-response and response
errors (Veal 2006). Therefore it was important to phrase questions in a way that
respondents could dearly and easily understand (Malhotra 2003). According to the
above considerations, the scales were adopted with some changes to fit the context of
the study.
Vision
The idea that vision could used as a factor in successful change was initially measured
using Abraham, Crawford and Fisher' s (1999) five-item scale, with each item scored
using a seven-point Likert-type response format targeting respondents from a sample
of 350 employees in 14 companies in Australia. Abraham, Crawford and Fisher
reported an alpha coefficient of 0.79. In agreement with their study, the adaptations
for scale items designed to elicit responses from Japanese managers in the present
study were: "Provision of explanation of the advantage of the adaptation to key
internal and external groups (employees, management, unions, customers, clients,
etc.)"; "A clear rationale for the adaptation and beliefs needed to make the adaptation
successful"; "A clear timetable devised for the various phases of the adaptation";
"Provision of a plan detailing the various steps of the adaptation"; and "A discussion
of specific new ways in which structure, systems and people practices would adapt".
Similar~y, the items for scales used for administration to Thai subordinates in the
present study were adapted as: "Providing explanation of the advantage of the
Japanese management practices to key internal and external groups (employees,
management, unions, customers, clients, etc.)"; "A clear rationale for the use of
Japanese management practices and beliefs needed to make successful
implementation"; "A clear timetable devised for the various phases of the use of
Japanese management practices"; "Provision of a plan detailing the various steps of
88

use of Japanese management practices"; and "A discussion of specific new ways in
which structure, systems and people practices could implement the Japanese
management practices ' .
Leadership
Leadership in the model of the present study was measured using Lok and Crawford ' s
(2000) five-item scale, which was initially adopted from the scale developed by
Preziosi (1980). Lok and Crawford scored each item using a seven-point Likert-type
response format in a sample of I 002 employees in 2 companies in Australia. These
items, used to assess the extent to which organizational effectiveness existed within
two companies, reported an alpha coefficient of 0.81. In agreement, Lok and
Crawford's scale was used with some changes to fit the context of this study. Thus,
the items for the questionnaire of Japanese managers were: "Managers set an example
by modelling appropriate behaviours"; "From the beginning there is a powerful
guiding executive coalition clearly in support of the adaptation"; "Once the adaptation
program commences, there is clear evidence of the CEO and the senior management
team attempting and championing the adaptation"; "The CEO and senior management
ensure the support of key power groups for the adaptation"; and "The CEO and senior
management create and communicate a sense of urgent need for adaptation
throughout the organization". In a similar way, the items used in the questionnaire of
Thai subordinates were adapted as: "Managers set an example by modelling
appropriate behaviours;" "From the beginning there is a powerful guiding executive
coalition clearly in support of the use of Japanese management practices"; "Once the
use of Japanese management practices commences, there is clear evidence of the CEO
and the senior management team attempting and championing the use of Japanese
management practices"; "The CEO and senior management ensure the support of key
power groups for the use of Japanese management practices"; and "The CEO and
senior management create and communicate a sense of urgent need for implementing
Japanese management practices throughout the organization".
Resource support
In the present study, resource support was measured using Abraham, Crawford and
Fisher's (1999) four-item scale, with each item being scored using a seven-point
Likert-type response format. As Abraham, Crawford and Fisher (1999) reported an
89

alpha coefficient of 0. 71 in their study, their scale was adapted to fit with the context
of the present study, using only minor changes. Thus items for the scales used in this
study of Japanese managers were: "Adequate financial resources are allocated in
support of the adaptation"; "Adequate human resources are allocated in support of the
adaptation"; "You will receive adequate and appropriate training to enable you to
work in new ways"; and "Senior management are prepared to devote their time to the
meetings, presentations, communication, education and training needed to support the
adaptation". Likewise, the items for scales used in this study for Thai subordinates
were: "Adequate financial resources are allocated in support of the use of Japanese
management practices"; "Adequate human resources are allocated in support of the
use of Japanese management practices"; "You will receive adequate and appropriate
training to enable you to work in new ways"; and "Senior management are prepared
to devote their time to meetings, presentations, communication, education and
training needed to support the use of Japanese management practices".
Reward
In the present study reward was measured usmg the five-item scale of Lok and
Crawford (2000), and each item was scored using a seven-point Likert-type response
format resulting in an alpha coefficient of 0.73. Therefore, their scale was adopted for
use with some changes to fit the context of this study. Thus, the items used in the
questionnaire of Japanese managers were: "Providing the opportunity for new and
exciting challenges, enabling you to develop skills and capabilities"; "Getting you
more pay as a result of the adaptation"; "There is little chance of advancement in the
organization unless you embrace the adaptation"; "Successful adaptation provides
satisfaction for a job well done"; and "A pay system and benefits from your firm that
treat each employee equally". Similarly, the items used in the questionnaire of Thai
subordinates were: "Providing the opportunity for new and exciting challenges,
enabling you to develop skills and capabilities"; "Getting you more pay as a result of
the use of Japanese management practices"; "There is little chance of advancement in
the organization unless you embraced the use of Japanese management practices";
"Successful implementation of Japanese management practices provides satisfaction
for a job well done"; and "Having pay systems and benefits from your finn that treat
each employee equally".
90

Structuring for change
Structure in this thesis was measured using the five-item scale of Lok and Crawford
(2000) who reported an alpha coefficient of 0.74. Their scale was utilized with some
changes to fit the context of this study, and each item was scored using a seven-point
Likert-type response format. Thus, the items used in the questionnaire of Japanese
managers were: "The structure of adaptation process is flexible"; "The structure of
adaptation is clear and helpful"; ' 'The structural arrangement provides new insights
for adaptation"; "The structural arrangement devise for managing adaptation is
appropriate"; and "The structure of adaptation process is well designed". Similarly,
the items used in the questionnaire for Thai subordinates were: "The structures of
Japanese management practices are flexible"; "The structure of the use of Japanese
management practices is clear and helpful"; "The structural arrangement provides
new insights into the use of Japanese management practices"; "The structural
arrangement devise for managing the use of Japanese management practices is
appropriate"; and 'The structure of Japanese management practices are well
designed".
Relationship
In the model of this thesis, relationship was also measured using the five-item scale of
Lok and Crawford (2000) who reported an alpha coefficient of 0.73. Each item was
scored using a seven-point Likert-type response format, and their scale was adapted to
fit the context of this study. Here, the items for Japanese managers and Thai.
subordinates were: "Your relationship with your supervisor will be a harmonious one
after adapting Japanese management practices"; "You can feely talk with someone at
work if you have a work-related problem"; "There is no evidence of unresolved
conflict in the organization"; "Your relationships with peers in your work groups are
friendly"; and "You have established relationships with everyone in your organization
that you need to adapt to".
91

Adaptation
In the case of adaptation, this item was measured using Zineldin and Jonsson's (2000)
four-item scale, with each item being scored using a seven-point Likert-type response
format. Zineldin and Jonsson initially utilized this scale on a sample of 114
purchasing managers at Swedish lumber dealers, and reported an alpha coefficient of
0.90. In their study, adaptation was examined as a factor that affects trust and
commitment in supplier-dealer relationships. Their scale was adapted with only minor
changes to fit the context of the present study measuring the adaptation of
management practices by Japanese managers. Thus, the items were: "I am willing to
customize the management practices"; "I am willing to adjust the process of
management practices"; "I am willing to change the management procedures"; and "I
am willing to invest in tool/equipment to better adjust management practices to local
conditions".
Acceptance
Acceptance was measured by Lin's (2007) four-item scale, and each item was scored
using a seven-point Likert-type response format. This scale was initially used on a
sample of 500 employees in 50 organizations in Taiwan. In this study, acceptance was
seen as an intention to accept knowledge sharing in organizations, reporting an alpha
coefficient of 0.85. Lin's scale was adopted with some changes to fit the context of
the present study, but was only used in the questionnaire of Thai subordinates in the
measurement of their acceptance of Japanese management practices. Thus _the items
were: "I intend to accept the Japanese management practice.sin future"; "I will always
make an effort to accept the Japanese management practices"; "I will try to accept the
Japanese management procedures"; and "I intend to accept the Japanese management
practices".
Japanese Management Practices
The Japanese management practices in this study were measured by Gill and Wong's
(1998) six-item scale, with each item being scored using a seven-point Likert-type
response format. This scale, initially used on a sample of 1,700 employees in the
public and private sectors in Singapore, was adopted with minor changes for use in
the questionnaires of both Thai subordinates and Japanese managers to investigate the
extent to which Japanese management practices had been implemented in Thailand.
92

The items were: "Lifetime employment"; "Consensus decision-making"; "Seniority
system"; "House union"; "Job rotation"; and "Quality control circles'.
Demographic Questions
In order to collect the personal data of respondents, demographic questions were
included in the questionnaire. These included employees' age, gender, position and
tenure, as well as the organizations' background information. These questions were
presented in a fixed-response multiple-choice format. The demographic information
collected in the questionnaires was used to understand the characteristics of the
sample. This section included 8 questions allowing description of the sample prior to
undertaking more complex statistical evaluation (Polonsky & Waller 2005) in order to
determine whether this sample represented the whole population (see Section 5.1 ).
Percentage analysis was then performed to describe the statistical aspects of
demographic data in order to describe the sample (Chapter 5).
4.5.3 Pre-test
To evaluate the survey, a pre-test was conducted to identify if there were any
problems in the questionnaire's design or instructions (Zikmund 2003). The pre-tests
were conducted in the three stages.
In stage one of the pre-test, content validity was used to evaluate the study. This refers
to subjective agreement among professionals that a scale logically appears to reflect
accurately what it purports to measure (Zikmund 2003; Cavana, Delahaye & Sekaran
2001 ). Nunnally and Bemstenin (1994) state that content validity is established before
generating the full survey administration. Here, testing of item fit is conducted in the
pre-test stage to guarantee that the items actually represent the specified definitions of
constructs. Thus, the initial questionnaires were assessed by management academics
and professionals who have experience with Japanese management practices. This
was to identify any ambiguities, problems or weaknesses requiring further refinement
of the instrument to increase content validity, and to ensure that the final
questionnaire was well presented. Overall, there was no major criticism of the
questionnaires. All assessors agreed that the six motivational factors could influence
93

the adaptation and acceptance of Japanese management practices. However, although
most agreed that the questionnaires were clear and understandable, one management
academic suggested that question six in part three on the Japanese questionnaire was
unclear. Hence, the researcher modified "Managers set an example by modelling the
appropriate behaviours", to "CEOs and senior management set examples by
modelling the appropriate behaviours to adapt". Also a concern was raised about the
Japanese management questions in part two. One professional recognized that all six
Japanese management practices questions in part two might not be applicable in some
companies - some may have only four or five of them. The respondents may be
unfamiliar with certain Japanese management practices, which may confuse them in
answering. Therefore, the researcher modified the scale from 1 =very small extent, and
7=extreme extent, to be 1 =not at all, and 7= extreme extent.
Stage two of the pre-test dealt with language translation and back-translation. Here,
questionnaire items were first prepared in English and then translated into Thai or
Japanese, depending on the targeted population. This approach is best-known
approach for questionnaire translations (Brislin 1986) and was important in
minimising inaccuracies that could result in measurement errors and affect conceptual
and instrument equivalence (Cavana, Delahaye & Sekaran 2001; Brislin 1986).
As recommended by Brislin (1986), to confirm that item equivalency had been
. achieved, both questionnaires were first developed in English then translated into: 1) .
Thai by a Thai-English bilingual then back-translated by another Thai; and 2)
Japanese by a Japanese-English bilingual then back-translated by another Japanese.
Neither of the bi-lingual translators was involved in the research. Lastly, the original
English questionnaires were compared with the back-translated questionnaires by the
two above bilinguals, to minimize language nuances and suggest modifications. As a
result, some idiomatic, colloquial English words and phrases that had been adopted
into questions from previous established studies were reworded, ensuring both clarity
for respondents and translation equivalence (Mullen 1995; Hambleton 1993).
Following the above two stages, the third and final stage of the pre-test implemented
the distribution of the revised instrument in order to pilot the survey. The purpose of
this was not only to test the question wording, but the sequencing, questionnaire
94

layout, field work arrangements, training and test fieldworks, estimates of response
rates, and the analysis of procedures (Veal 2006). Here, the pilot test for the thesis
was conducted using a sample of 50 Japanese manufacturing companies in Thailand.
In accordance with Reynolds, Diamantopoulos and Schlegelmilch (1993) who suggest
that a pre-test sample size should range from 5-10, to 50-100, this survey was
distributed to 50 Japanese managers and 50 Thai employees from the Japanese
manufacturing companies in Thailand (see Table 4.1 ). There were no incentives for
participation in this study, and respondents were all volunteers.
In distributing the pilot questionnaires to the selected companies, packages of the
questionnaires included a brief letter to the human resource manager explaining the
purpose of the study, copies of the three-page questionnaire, and freepost envelopes.
These were mailed to each company, then distributed to Japanese managers and Thai
subordinates by the human resource (HR) managers. Packages were distributed
between September and November, 2006. The response rate was 70% for Japanese
managers (e.g. 35 usable surveys were collected from the 50 questionnaires
distributed), and 82% for Thai employees (e.g. 41 usable surveys were collected from
the 50 questionnaires distributed).
4.5.4 Reliability
The reliability analysis and validity for each of the constructs of the questionnaires of
this thesis were examined to test data quality. Reliability of the scale examines its
internal consistency by calculating Cronbach's alpha. This method has been used in
this study to indicate the extent to which items within scales were correlated (Sekaran
2003). It was also used to reflect the consistency between different items in the scales,
measuring equal attributes. Further, validity is the ability of a scale or measuring
instrument to measure what is intended to be measured (Veal 2006; Zikmund 2003).
Here, a measure was considered valid when the differences in observed scores
reflected true differences in the characteristics being measured and on nothing else
(Churchill 1979). However, although a valid measure implies good reliability, a
reliable measure may or may not be valid (Malhotra 2003). Therefore, to explore the
reliability of the constructs in order to design good scales for measurement, data was
analysed using SPSS computer program.
95

According to Veal (2006), reliability is the extent to which research findings would be
the same if the research was to be repeated at a later date or with a different sample of
subjects. Here, the examination of reliability can indicate how reliable a score on the
test will be and describe the domain of each construct. Therefore, to estimate the
reliability of the items for each construct, internal consistency methods include the
value of item-to-total correlation and Cronbach's alpha value. Gliem and Gliem
(2003) suggest that a minimum value of item-to-total correlation values should be
greater than 0.40, and item-to-total-correlation values in each construct at the 0.05
level are of reliable significance. However, as Hair et al. Point out, within the wider
literature a minimum alpha of 0.60 is suggested as appropriate - therefore this
measure has been utilized as the minimum required reliability level within the present
thesis. Hence, as unreliability in these items would mean that they could not be used
in any future examinations, the item-to-total-correlations and Cronbach's alpha values
for items within the eight components have been analysed (see Tables 4.1 and 4.2).
4.5.5 Validity
According to Malhotra (2003), the validity of a scale is defined as the extent to which
differences in observed scale scores reflect true differences among objects on the
characteristics being measured, rather than on systematic or random errors.
Measurement validity is the extent to which an instrument measures what it is
required to measure, whereas an indicator is valid to the extent that it signifies the
theoretical concept it is supposed to measure (Shammout 2008; Zeidan 2006), and the
better the fit between the conceptual and operational definitions, the greater the
measurement validity (Neuman 2006). In this thesis, all of the scales had been used
within previous studies (e.g. Lin 2007; Lok & Crawford 2000; Zineldin & Jonsson
2000; Abraham, Crawford & Fisher 1999; Preziosi 1980), and all have been tested for
both content and construct validity and reliability.
Content validity is defined as the degree to which measures adequately represent a
specified domain (Nunnally & Bernstein 1994). It is a subjective but systematic
assessment of the content where a scale measures a construct (Malhotra 2003). An
instrument has content validity if it has measurement items that adequately cover the
content domains or aspects of the concept being measured (Ahire, Golhar & Waller
96

1996); however, it is not assessed statistically because it hinges on the process utilized
to construct measures. Therefore, in accordance with Cooper and Schindler ( 1998),
the present program of study uses the following procedures in ensuring content
validity: the identification of relevant existing scales within the literature; and
consultation with a group of experts to independently assess and test items (refer to
pre-test stage one).
Construct validity refers to establishing correct and adequate operational measures for
the concepts being tested (Malhotra 2003; Yin 1994), and addresses directly the
question of what the instrument is truly measuring (Churchill 1995). This type of
validity lies at the very heart of construct development and involves consideration of
theoretical questions about why the scale works and what deductions can be made on
the basis of theory (Malhotra 2003 ). Construct validity can be established through
correlation analysis (convergent and discriminate validity), factor analysis, and the
multi-trait, multi-method matrix of correlations (Kripanont 2007). Others suggest that
the three most widely accepted forms of validity are convergent, discriminate, and
monological (Peter 1981; Campbell & Fiske 1959).
Convergent validity is synonymous with criterion validity (Zikmund 2003) and
correlation analysis, and is one way of creating construct validity for this research. It
implies that items that are indicators of a specific construct should converge or share a
.high proportion of variance in common (Hair et al. 2003). In other words, it assesses
the degree to which measures of the same concept are correlated, with high
correlation indicating that the scale is measuring its intended concept. Hence,
reliability is also an indicator of convergent validity (Hair et al. 2003). As was
discussed earlier, item-to-total correlation was conducted in the stage of reliability to
indicate the correlations between items under the same concept (see the stage of
reliability). Results of the item-to-total-correlation analysis for items within the eight
components are reported in Tables 4.1 and 4.2.
97

Items Reliability Item-to- Cronbach 's results total- Alpha if
correlations item deleted Vision Cronbach' s Alpha = 0.83 Providing explanation of the advantage of the Japanese 0.67 0.79 management practices to key internal and external groups (employees, management, unions, customers, clients, etc.). A clear timetable is devised for the various phases of the use of 0.55 0.82 Japanese management practices. A clear rationale for the use of Japanese management practices 0.57 0.82 and beliefs needed to make successful implementation. Provision of a plan detai ling the various steps of the use of 0.67 0.79 Japanese management practices. A discussion of specific new ways in which structure, systems 0.71 0.78 and people practices would implement the Japanese management practices.
Leadership Cronbach' s Alpha= 0.78
Managers set an example by modell ing appropriate behaviours 0.61 0.73 to implement Japanese management practices. From the beginning there is a powerful guiding executive 0.71 0.69 coalition clearly in support of the use of Japanese management practices. Once the use of Japanese management practices commences, 0.45 0.78 there is clear evidence of the CEO and the senior management team attempting and championing the use of Japanese management practices. The CEO and senior management ensure the support of key 0.46 0.78 power groups for the use of Japanese management practices . . The CEO and senior management create and communicate a 0.59 0.73 sense of urgent need for implementing Japanese management practices throughout the organization.
Structuring Cronbach' s Alpha= 0.77 The structural arrangement provides new insights into the use of 0.53 0.73 Japanese management practices. The structure of the use of Japanese management practices is 0.50 0.74 clear and helpful. The structures of Japanese management practices are flexible. 0.52 0.74 The structural arrangement devise for managing the use of 0.62 0.70 Japanese management practices is appropriate. Structures of Japanese management practices are well designed. 0.56 0.72 Items Reliability Item-to- Cronbach's
results total- Alpha if correlations item deleted
Reward Cronbach' s Alpha = 0.77 Providing the opportunity for new and exciting challenges, 0.58 0.71 enabling you to develop skills and capabilities. Getting you more pay as a result of the use ofJapanese 0.46 0.75 management practices. There is little chance of advancement in the organization unless 0.44 0.76 you embrace the use of Japanese management practices. Successful implementation of Japanese management practices 0.65 0.69 provides satisfaction for a job well done.
Having pay system and benefits of your firm treat each 0.58 0.71 employee equally.
Relationship Cronbach' s Alpha= 0.76 Your relationship with your supervisor will be a harmonious one 0.55 0.70 after implementing Japanese management practices.
98

You can feely talk with someone at work if you have a workrelated problem. There is no evidence of unresolved conflict in the organization.
Your relationships with peers in your work groups are friendly.
You have established the relationships that you need to do your job properly.
Resources support Cronbach' s Alpha= Adequate financial resources are allocated in support of the use of Japanese management practices. Adequate human resources are allocated in support of the use of Japanese management practices. You will receive adequate and appropriate training to enable you to work in new ways. Senior management are prepared to devote their time to meetings, presentations, communication, education and training needed to support the use of Japanese management practices.
Acceptance Cronbach' s Alpha = I intend to accept the Japanese management practices in the future . I will always make an effort to accept the Japanese management practices. I will try to accept the Japanese management procedures.
I intend to accept the Japanese management practices.
0.55
0.56 0.46 0.60
0.81 0.67
0.67
0.72
0.47
0.82 0.58
0.60
0.72 0.67
0.70
0.70 0.77 0.69
0.74
0.74
0.72
0.841
0.80
0.79
0.73 0.76
Table 4.1: Summary of Cronbach's alpha, and item-to-total-correlations values
in pilot study of Thai employees
99

Items Reliability Item-to- Cronbach 's results total- Alpha if
correlations item deleted
Vision Cronbach' s Alpha= 0.73 Provision of explanation of the advantage of adaptation to key 0.44 0.70 internal and external groups (employees, management, unions, customers, clients, etc.). A clear timetable devised for the various phases of the 0.41 0.71 adaptation. A clear rationale for the adaptation and beliefs needed to make 0.41 0.71 the adaptation successful. Provision of a plan detailing the various steps of the adaptation. 0.59 0.65
A discussion of specific new ways in which structure, systems 0.62 0.63 and people practices would adapt.
Leadership Cronbach' s Alpha= 0.74 CEO and the senior management set an example by modelling 0.45 0.71 appropriate behaviours to adapt. From the beginning there is a powerful guiding executive 0.56 0.67 coalition clearly in support of the adaptation. Once the adaptation program commences, there is clear 0.57 0.66 evidence of the CEO and the senior management team attempting and championing the adaptation. The CEO and senior management ensure the support of key 0.61 0.64 power groups for the adaptation. The CEO and senior management create and communicate a 0.42 0.76 sense of urgent need for adaptation throughout the organization.
Structuring Cronbach' s Alpha = 0.71
The structure of adaptation process is flexib le. 0.40 0.70
The structure of adaptation is clear and helpful. 0.41 0.68 The structural arrangement provides new insights for adaptation. 0.48 0.65
The structural arrangement devise for managing adaptation is 0.52 0.64 . appropriate. The structure of adaptation process is well designed. 0.54 0.63
Reward Cronbach' s Alpha= 0.74
Providing the opportunity for new and exciting challenges, 0.52 0.69 enabling you to develop my skills and capabilities. Getting you more pay as a result of the adaptation. 0.41 0.74
There is little chance of advancement in the organization unless 0.40 0.74 you embrace the adaptation. Successful adaptation provides satisfaction for a job well done. 0.66 0.64
Having pay system and benefits of your firm treat each 0.63 0.65 employee equally.
Relationship Cronbach' s Alpha = 0.75 Your relationship with your supervisor wi11 be a harmonious one 0.65 0.66 after adapting Japanese management practices. You can feely talk with someone at work if you have a work- 0.61 0.67 related problem.
There is no evidence of unresolved conflict in the organization. 0.54 0.70
100

Items Reliability Item-to- Cronbach's results total- Alpha if
correlations Item Deleted
Your relationships with peers of your work groups are friendly.
0.40 0.80 You have established relationships with everyone in your 0.72 0.64 organization that you need to adapt to do your job properly.
Resources support Cronbach ' s Alpha = 0.74 Adequate financial resources are allocated in support of the 0.55 0.67 adaptation. Adequate human resources are allocated in support of the 0.59 0.64 adaptation. You will receive adequate and appropriate training to enable 0.69 0.58 you to work in new ways. Senior management are prepared to devote their time to 0.42 0.76 meetings, presentations, communication, education and training needed to support the adaptation.
Adaptation Cronbach ' s Alpha= 0.77 I am willing to customize the management practices. 0.40 0.79 I am willing to adjust the process of management practices. 0.63 0.67 I am willing to change the management procedures. 0.71 0.63
I am willing to invest in tools/equipment to better adjust 0.54 0.73 management practices to local conditions.
T able 4.2: Summary of Cronbach's alpha, and item-to-total-correlations values
in pilot study of Japanese managers
All internal consistency reliability based on Cronbach's alpha for measurement items
were found to be greater than 0.7 and considered to be good and acceptable,
indicating a high degree of internal consistency. The researcher expected that the
reliability would increase with the final sample size, as Pallant (2005) states that a
larger sample size can increase the reliability. In Tables 4.1 and 4.2 it can be seen that
most of the item-total-correlations fall within the acceptable range, consistent with the
suggestion that a minimum value of item-to-total correlation should be greater than
0.4 (Gliem & Gliem 2003). These results identify that all the constructs are therefore
valid and reliable.
4.6 Population, sampling size, and procedures
The population, sampling size and procedures used in the collection of data for this
study are discussed below.
101

4.6.1 Population
In quantitative research, population refers to the entire group of people, events, or
things that the researcher desires to investigate (Sekaran 2003; Cavana, Delahaye &
Sekaran 2001 ). As noted in Chapter I, this research focuses on the joint venture
Japanese manufacturing organizations in Thailand, thus the population in this research
includes Japanese managers and Thai subordinates who have worked in the Japanese
manufacturing organizations in Thailand. According to the Japanese Chamber of
Commerce Bangkok (2006), the total number of Japanese manufacturing companies
in Thailand is 617 (N=6 l 7), including metal 11.6%, machinery 11 %, garment and
textile 6.9%, agricultural and marine 8.1 %, electric and electronic 21.8%, automobile
27.1 %, and chemicals 13.5%. The sample in this research is expected assist in
representing this large population.
4.6.2 Sampling design
A sample is a subset of a population, containing some members selected from that
population. In data collection, a selected sample from a population can be used as a
tool to infer something about that population (Mason, Lind & Marchal 1999). Roscoe
(1975) suggests that sample sizes larger than 30 and smaller than 500 are appropriate
for most research and multivariates, and the sample size should be several times as
large as the number of variables in the study. In this study, the sample size has been
calculated using Yamane's formula (1973) which is n= N/l+N (e) 2, where n is the
sample size; N is the target population; and e is the percentage of error. In the present
study, population refers to the Japanese manufacturing companies in Thailand.
According to the list of Japanese manufacturing multinational companies in Thailand
provided by the Japanese Chamber of Commerce Bangkok (2006), the total of
Japanese manufacturing companies in Thailand is 617 with an 'e' of 5%, thus the
calculation of sample size is n = 617/ 1+617 (0.05)2 = 242.
The result of the preceding calculation indicates that the sample size has to be at least
242 Japanese manufacturing companies. Thus, at least 242 Japanese managers, and at
least 242 Thai subordinates are required for participation, with one Japanese manager
and one Thai subordinate representing one organization (See table 4.3). For the
purpose of the present study, Japanese managers in this research were the managers
102

who had the responsibilities of administering the Japanese management practices in
their organizations, and Thai subordinates were the Thai employees who had
experienced using these Japanese management practices. A random sampling process
was applied in order to draw a probability sample. A random sampling process allows
each unit of the population to have an equal chance of being selected in the sample
(Collis & Hussey 2003). The random sampling has the advantage of having the least
bias and offering high generalizability of findings (Sekaran 2003).
Population Sample Size
Japanese managers 242
Thai subordinates 242
Table 4.3: Sample size
4.6.3 Data collection procedures
This section discusses the data collection procedures used for the survey which was
conducted in five regions of Thailand: Central, Northern, Eastern, North Eastern, and
Southern, within a period of six months from April to September 2007. The
researcher was seriously concerned about the response rate for this survey, since the
response rate associated with mailing questionnaires in Thailand is usually very low.
To deal with the low response rate, therefore, the researcher decided to distribute
questionnaires to all 61 7 Japanese manufacturing firms - for both Japanese managers
and Thai subordinates. A package of the questionnaire, including a brief letter to
human resource managers explaining the purpose of the study, questionnaire, and
freepost envelope, was sent to HR managers for participation. A survey package was
mailed to each company, then distributed to Japanese managers and Thai subordinates
by HR managers.
As response rates start relatively high in the first two weeks before gradually tapering
off (Zikmund 2003 ), to address low response rates follow-up of a duplicate
questionnaire and reminder to return the original questionnaires was sent to HR
managers three weeks later. E-mail follow-ups were also sent, and phone calls were
103

made to HR managers two weeks after. Even so, the response rate remained low.
Therefore, the researcher decided to make personal visits to some of the Japanese
manufacturing companies, asking the HR managers to help. This meant that a lot of
time and effort needed to be taken to obtain the minimum usable data required to run
the structural equation modelling (SEM) which will be discussed in Section 4.6.1.
4.6.4 Data preparation prior to analysis
All the returned questionnaires were firstly manually checked for completeness of
responses (Kumer 2005). As missing data normally occurs when a respondent has
failed to complete all items in a questionnaire (Hair et al. 2003; Cavana, Delahaye &
Sekaran 2001 ), incomplete questionnaires containing one or more missing items were
excluded from the dataset. Following this, the retained questionnaires were checked
again manually prior to computer entry to identify missing items. Once the data entry
was complete, the data files were carefully screened in order to minimize data entry
errors. To do this, the examination of frequencies for each item was checked in order
to detect out-of-range values and values greater than 7.
Descriptive analyses was undertaken to determining the validity of underlying
assumptions about the data required for further multivariate analysis (e.g. structural
equation modelling). Examination of the data for normality of items using the
Statistical Package for Social Science (SPSS) statistical software is discussed in the
next section.
4.6.5 Test of normality
In this study the assumption of normality will be verified by examining both the
histogram shape of the data distribution and skewness and kurtosis of each item.
When inspection of the histogram shape of each item appears as a reasonable shape in
a normal curve, this indicates a normal distribution (Pattant 2005). In this study,
examination of descriptive analyses determined normality of the items, and checked
the average of responses and spread of the data (Cavana, Delahaye & Sekaran 2001 ;
Coakes & Steed 1997). Here, distribution is considered within a normal range when
104

indicators of the skewness and the kurtosis values less than 2 and 3 respectively
(Azzalini 2005; Hair et al. 2003).
In addition to checking univariate normality (skewness and kurtosis), it was also
essential to check multivariate normality as it is an important assumption underlying
multivariate analyses and structural equation modelling techniques (Shammout 2008;
Zeidan 2006). Multivariate normality refers to '(l) all the univariate distributions are
normal; (2) the joint distribution of any pair of the variables is bivariate normal; and
(3) all bivariate scatter plots are linear and homoscedastic ' (Kline 2005, pp. 48-9). In
other words, the joint distributions of any combination of variables should be normal
(Tanachnick & Fidell 2007). It is important to note that, although it is a prerequisite in
the analysis of covariance and mean structures that data have a multivariate normal
distribution, several studies of robustness of the multivariate normality assumption
(e.g. Amemiya & Anderson 1990) found that the parameter estimates remain valid
even when the data are not normally distributed. The results in relation to assessments
and examination of normality are discussed in Chapter 5.
Multivariate normality' was inspected in AMOS through inspection of the multivariate
value represented by Mardia's coefficient of multivariate kurtosis. A mardia's
coefficient greater than 8 is an indication of infringement of the assumption of
multivariate normality (Shammout 2008; Zeidan 2006). In such cases of multivariate
non-normahty in this thesis, Bollen-stine's bootstrap was invoked (Kline 2005). This
is discussed in following section.
4. 7 Data analysis
According to Coorley (1978) and Maruyama (1998), the purpose of statistical
procedures is to support in establishing plausibility of the theoretical model and to
assess the degree to which independent variables seem to influence the dependent
variables. Data analysis in this thesis has been divided into two stages. The first stage
involved testing the reliability and validity of the measurement (e.g. descriptive static
of percent, skewness, and kurtosis) using SPSS computer program. The second stage
involved testing validity of the measurement of the models by testing discriminate
105

validity, analysing data by structural equation modelling (SEM) usmg AMOS
computer program.
The widely accepted program for data analysis, SPSS (Tanachnick & Fidell 2007;
Malhotra 2003; Zikmund 2003) has been used to report the descriptive analysis and
reliability tests of this thesis. Furthermore, AMOS, one of the main software programs
utilized to assess structural models, was utilized to examine the constructs and overall
structural model (Byrne 2001; Ullman 2001). AMOS 7.0 provided the researcher with
powerful and easy-to-use structural equation modelling software, which helped to
create a more realistic model than would have been possible through using standard
multivariate statistics or multiple regression models. Moreover, utilizing AMOS 7.0,
the researcher was able to estimate, specify, assess and present the model m an
intuitive path diagram to show the hypothesized relationships among variables.
4. 7 .1 Descriptive analysis
Descriptive statistics have been utilized to describe the basic features of the data in
this study. They provided simple summaries of the sample, and together with simple
graphics analysis they formed the basis of virtually every quantitative analysis of data
(Trochim 2006). As descriptive statistics are used to present quantitative descriptions
in a manageable form, descriptive statistics have been conducted for primary data
analysis. As mentioned in Section 4.5, the demographics included 8 questions
incorporating employee and organizational backgrounds. These questions allowed
samples to be described prior to undertaking more complex statistical evaluations
(Polonsky & Waller 2005) for determining whether the sample represented the whole
population. Percentage analysis was performed to describe the statistical aspects of
demographic data in order to describe the sample. The results of these are outlined in
Chapter 5.
4.7.2 Introduction to structural equation modelling: Methods, computerized
methods, and computer program
Structural equation modelling (SEM) is utilized to examine complex models in which
one or more independent variables can relate to one or more dependent variables
106

(Tanachnick & Fidell 2007). In simple terms, SEM is a multivariate technique
coalescing aspects of multiple regression and factor analysis to estimate a series of
interrelated dependence relationships simultaneously (Hair et al. 2003; Schumaker &
Lomax 1996) and depict the structural relationships among constructs (Sharma 1996).
SEM is also recognized as path analysis with latent variables, regularly utilized for
representing dependency relations in multivariate data in the behavioural and social
sciences (McDonald & Ringo 2002). In other words, SEM is a model of relationships
among variables (Hayduk 1987), using a statistical technique that takes a
confirmatory (e.g. hypothesis-testing) approach to the analysis of a structural theory
(Byrne 2001) relating to some phenomenon with two significant aspects: (1) causal
processes under study are represented by a series of structural equations; and (2)
structural relations are modelled pictorially to enable a clearer conceptualization of
theory (Byrne 2001).
SEM is based on the assumption of causal relationships where a change in a variable
(x 1) is expected to result in a change in another variable (y1) (Shammout 2008).
Moreover, SEM must be sustained by the theory in order to develop or modify the
proposed management model (Zeidan 2006). SEM is a popular method of analysis
(Byrne 2001) that allows for examining various models which could explain the data
structures (Joreskog & Wold 1982) and relationship in management and
organizational behaviour. It is an analytical method that improves upon, and
supersedes, other methods such as multiple and multivariate regression, or recursive
path analysis (Holmes-Smith 2000) in management research. SEM can make a
distinction between latent and observed variables, can estimate the nature of
measurement error associated with the observed variables, and permits unequal
weightings for the multiple indicators of a latent construct (Holmes-Smith 2000) in a
management model. Moreover, SEM can examine more than one relationship within
the model at a time (Hair et al. 2003). That is the causal procedures under study are
represented by a series of structural equations which designate the strength of the
relationships between constructs. SEM also allows an assessment of whether or not a
model developed from the literature is a good fit to the observed data (Hair et al.
2003) in a management study. As the primary purpose of SEM is to describe the
pattern of a series of interrelated dependence relationships simultaneously in a set of
latent or unobserved constructs, each measured by one or more observed variables
107

(Hair et al. 2003), it 1s highly suited for use m the present study of business
management practises.
For the purpose of this study, the structural model and measurement model will be
analysed separately. Separate examination of structural and measurement components
of the model allows for the assessment of measurement problems independent from
the inspection of structural problems (Bagozzi 1983). This allows a comprehensive
assessment of construct validity and reliability (Hair et al. 2003; Anderson & Gerbing
1988). Thus, one factor congeneric models and confirmatory factor analyses utilizing
AMOS 7 are used to explore the statistical relationships among the items of each
factor and between factors.
As confirmatory factor analysis has been considered a useful approach to assessing
scale properties (Ullman 2001) it was employed prior to testing the proposed
structural relationship to assess soundness of the measurement properties of the
conceptual model, and utilizing fit statistics computed from comparing factor
structure with sample data. Thus, to ensure sufficiency of the measurement models of
individual constructs, indicators have been checked to ensure they had substantial
loadings on the factors to which they belonged. Moreover, all the loading figures
shown in each construct have been used to calculate the composite factor models
discussed below.
108

Mathematical representation of structural equation modelling
Structural equation models can be well explained in mathematical form. Hair et al.
(2003) suggest that translating a path diagram into a series of structural equations is
an uncomplicated procedure. This is shown in the proposed model below.
Ml M2 M3 M4 M5 M6
Al
Figure 4.2: Representing casual relationship through path diagrams
Endogenous Variable
GI
G2
Al
= Exogenous Variables Ml M2 M3 M4 MS M6
=b 1M1 +b2M2+b3M3+b4M4
=b5M5+b6M6
=b7M2+b8M5
+ Endogenous Variables Gl G2 Al
+b9G 1+b1002
Figure 4.3: Translation of path diagrams into structural equation
+Error
+el
+e2
+e3
Figure 4.3 shows the translation process for each of the path diagrams in Figure 4.2.
Each endogenous variable (Al) can be predicted either by exogenous variable(s) (M)
or by other endogenous variable(s). For each hypothesized effect, a structural
coefficient (b) is estimated because the prediction errors will appear just as in multiple
regressions. The error term ( e) is included for each equation which represents the sum
of the effects due to specification error and random measurement error (Hair et al.
2003). The models of Japanese management adaptation and acceptance will not only
be illustrated in path diagrams, but will be also shown in a mathematical form in
Chapter 6.
Model-data fit examination
Testing with SEM provides allows evaluation of how well the model is supported by
the sample data. The primary task in this model testing method is to detennine the
109

goodness of fit between the proposed model and the sample data. According to Hair et
al. (2003 ), goodness of fit is defined as a measure of the correspondence of the actual
input covariance matrix with that expected from the proposed model. That is to
expose if the parameter evaulate in the model are consistent with theory-based
expectations, and if the evaulates statistically infer goodness of fit. Here there are
three kinds of goodness of fit including:
1. Absolute fit measures to estimate the overall model fit with no adjustment for
over-fitting by determining whether the residual variance is appreciable
(Maruyama 1998).
2. Incremental fit measures evaluate the incremental fit of a model compared to a
null model.
3. Parsimonious fit measures adjust the measures of fit to evaluate models with
different numbers of coefficients and determine the fit accomplished by each
coefficient (Reisinger & Turner 2000).
Hair et al. (2003) state that measures from each type are supposed to be reported to
provide the best overall picture of model fit. To measure the goodness of fit in this
research, three measures and guidelines adopted from both Hair et al (2003) and Kline
(2005) are presented in Table 4.4. Selection and assessment of goodness-of-fit will be
discussed in more detail in Chapter 6.
Measures Level of Acceptable Fit Absolute fit measures Likelihood ratio Chi-square (X2
) statistics (p) Root Statistical test of significance (at least p>0.05).
Means Square Error of Approximation (RMSEA). Under 0.08, preferably under 0.05.
Standardized Root Mean Square Residual (SRMR) The smaller the better-close to zero. Values less than 0.10 indicate good model fit.
Incremental or comparative fit measures Tucker-Lewis Index (TLI) The closer to 1.0, the better. Recommended
higher than 0.90.
Comparative Fit Index (CFI) The closer to 1.0, the better. Recommended higher than 0.90.
Parsimonious fit measures (model (Values close to 1.0 indicate perfect fit) parsimony) Normed Chi-square (CMIN/DF) (also considered as Recommended level: lower limit 1.0, upper limit an absolute fit measure) 3.0 or as high as 5 (I.Os tldf s 5.0).
Akaike Information Criterion (AIC) The model that fits with the smallest values of AIC is the most parsimoniously fitting model.
Table 4.4: Goodness of fit measures
110

Model modification
By using AMOS to implement SEM analysis, the list of significant and non
significant parameters can be easily examined, so a determination can be made as to
whether any of the non-significant parameters can be eradicated from the model
without substantial loss of fit (Arbuckle & Wothke 1999). Subsequently, the initial
model is tested and modified utilizing the same data and using modification indices
until a theoretically parsimonious model is accomplished. Since each path in the
model represents a hypothesized relationship, hypothesis testing is accomplished by
assessment of the significant parameter estimates. Modification may be either theory
or data driven, and the ultimate intention is to find a model that is both substantively
meaningful and statistically well fitting (Joreskog 1993). Therefore, it is significant
that any modification is theoretically justifiable (Kline 2005; Schumaker & Lomax
1996).
Sample size for structural equation modelling
Structural equation modelling is based on covariance, and covariance and correlations
are unstable when evaluated from small sample size (Tanachnick & Fidell 2007).
There are no clear-cut rules or definitive recommendations when it comes to the
required sample size to obtain reliable solutions and parameter estimates in structural
equation modelling (Shammout 2008; Zeidan 2006). However, while utilizing large
sample sizes to estimates in structural equation models with latent variables will lead
to a degree of confidence about such statistics, the asymptotic statistical theory
underlying parameter estimations privides clues as to how large the sample size
should be (Holmes-Smith 2000). The minimum requirements for structural equation
modelling are presented in table 4.5.
Statistical Analysis Minimum Sample Size
Structural equation modelling • Sample size as small as 50 found to provide valid results
(SEM) (Hair et al. 2003).
• Recommended minimum sample sizes of l 00-150 to ensure the stable Maximum Likelihood Estimation (MLE) solution (Hair et al. 2003).
• Suggested sample sizes in a range of 150-400 (Hair et al. 2003).
Table 4.5: Sample size for structural equation modelling
I I 1

Composite factor model
A composite factor measurement model can reduce complexity and decrease the
number of returns required for a reliable model (Hair et al. 2003; Holmes-Smith &
Rowe 1994). Composite variables are determined by computations integrating
measured values from the constituent variables and replacing the latent construct with
the composite variable (Turner 2007). Once the latent variables in the model are
replaced by a computed composite variable, it is then regarded as a distinct manifest
or measurement variable (Hair et al. 2003).
There are several approaches to compute a composite variable. A sum of the manifest
variable being utilized is the simplest, but this may generate some problems if the
composite variables have different numbers making them up (Turner 2007). One
approach to compute a composite variable suggested by Hair et al. (2003) is to use a
simple average to calculate values, however this approach does not consider the
different factor loadings that each variable brings (Holmes-Smith & Rowe 1994).
Here, strong loading factors are biased against whilst weaker loading factors have a
positive bias. To overcome this, Holmes-Smith and Rowe (1994) suggest that a
weighted calculation be adopted based on factor loadings. However, this approach is
still influenced by different numbers in the various composite factors. Therefore,
Holmes-Smith and Rowe (1994) put forward a better approach in which a weighted
average calculation was taken into account for the factor loadings of each constituent.
Therefore, as this approach is not influenced by the different numbers of variables in
each composite, the method utilized in this thesis is based on the following formula
adopted from Turner (2007):
Composite = L fl xi where xi is the item score and fl is the factor loading .
.L fl The different approaches to computing composite variables adopted from Turner
(2007) are presented in Table 4.6. These utilize a hypothetical set of data and two
factors with different numbers of variables. Here, factor one contains five variables
and factor two contains three variables, with each variable being measured on a scale
of 1-5. For each of these two factors, factor loadings, scores and weighted scores are
112

in columns 1-3. Computations for the composite variables (var l and var 2) are also
given. The first two computations (average and sum) do not take into account the
loading of the factors, whereas the weighted mean and weighted sum do (Turner
2007). This paradigm illustrates the problem by simply summing up the scores. In this
paradigm the outcome is the same for different numbers of variables. Similarly, the
weighted sum has a similar shortcoming so researcher may be lured into supposing
that the contributions are similar (Turner 2007).
Factor 1
Factor 2
Composite
Loading I
0.4 0.5 0.5 0 .7 0 .5
Loading I 0.5 0.6 0.7 0.6
Sum Average Weighted sum Fully weighted mean
Adopted from Turner (2007)
Weighted
0.4 2 1 2.8 1.5
E'
Table 4.6: Paradigm of different approaches of computing composite factors.
In this thesis, the latent constructs will be replaced by composite variables which are
determined by computations integrating measured values from the constituent
variables. A composite factor model has been preferred as appropriate to the analysis
in this study for three reasons: I) reduction of the complexity of the model; 2)
decrease in the number of returns required for reliability (Hair et al. 2003; Holmes
Smith & Rowe 1994); and 3) it is widely accepted and used in many Management
researches (e.g. Luthans et al. 2007; Turner 2007; Houghton et al. 2004; Hair et al.
2003; Holmes-Smith & Rowe 1994).
113
I p. t..1)

Boollen-stine's bootstrap
Bootstrapping is a statistical re-sampling method (Diaconis & Efron 1983) in which
the computer draws random samples from a probability density function with
parameters specified by the researcher. The Bollen-stine option signifies a modified
bootstrap method for the chi-square goodness-of-fit statistic, and provides a means of
testing the null hypothesis that the specified model is correct (Bollen & Stine 1993).
For a good-fitting model, Bollen-stine p should be greater than 0.001. For the present
program of research in which issues with multivariate non-normality are evident, the
researcher requested AMOS to perform a bootstrap on 140 samples (Japanese
managers) and 204 samples (Thai subordinates), both within the range suggested by
Hair et al. (2003) as sufficient.
4.8 Ethical considerations
The issue of ethics is an important concern in any social science research (Bodgan &
Biklen 1998). In a business research such as the present one, ethics is defined as a
code of conduct or expected societal norm of behaviour while conducting research
(Sekaran 2003). Here, the main aim is to protect all parties involved in the research
from impair or adverse consequences resulting from their involvement in the research
(Cooper & Emory 1995).
This research was conducted considering ethical responsibility in accordance with the
general principles of research ethics outlined by Ticehurst and Veal (2000) that: (1)
no harm should occur to the research subjects; (2) subjects should take part feely; and
(3) participation is based on informed consent. As the researcher must understand the
basics of ethical research and how this may affect the research project (Polonsky &
Waller 2005), proposal for approval for the present research was submitted to the
Faculty of Business and Law Human Research Ethics Committee at Victoria
University. The application addressed issues of potential risks associated with the
research project, participant privacy and confidentiality, and assurance that
information is provided to potential participants as part of the informed consent
process.
114

Zikmund (2003) suggests that participants should be informed of their right to be left
alone or to break off their participation at any given time. Accordingly, subjects were
informed of all aspects of the research project, particularly that their participation was
entirely voluntary and that they could withdraw their consent to take part in the
research project at any time. Moreover, participants who needed more information
about the research project before taking part in it were free to contact a Victoria
University representative to confirm that information.
Although the questionnaires in this research contain some demographic questions, the
process of de-identification utilized in the research meant that no identifiers such as
names or codes were utilized in the data. Thus, there was no way of recognizing
which organizations or individual employees had completed the questionnaires.
Besides, the collected data was retained in a safe place so as to limit: its access to
unauthorized persons, and the researcher ensured that that data was only used for the
purpose of academic research. As a result of the above considerations, the Ethics
Committee at Victoria University granted its approval for this research to be
conducted.
4.9 Summary
This chapter has presented the methodologies used in this research, including
preliminary information gathering, development of the model, pre-tests, pilot study,
reliability and validity of the instrument, data collection and data analysis procedures.
The research instrument was developed in Australia and the pilot study was conducted
in Thailand. The instrument was shown to be reliable and valid after conducting the
pilot study.
Data collection methodology included a discussion of the survey procedure,
population, sample size, and problems encountered in collecting data. To fulfil the
purpose of the study, structural equation modelling is applied as the main statistical
technique used in analysis. The minimum sample size requirement and how to
organize and clean data is also investigated. Finally, the issues of generalizability and
ethics considerations are taken into account. Descriptive statistic analysis using SPSS
115

will be discussed in Chapter 5, and the results of data analysis using AMOS for the
structural equation modelling used in this thesis will be discussed in Chapter 6.
116

Chapter 5
Preliminary data analysis and results:
Descriptive statistics and reliability tests
5.1 Introduction
The research methodology adopted to collect and analyse data for this research was
described, justified and discussed in Chapter 4. Therefore, the purpose of the present
chapter is to summarise and present results of the descriptive statistics used to
describe the samples. This chapter outlines the use of a computer package for
analysing data from questionnaire surveys, and presents the findings of the data
analysis. The analysis of questionnaire data is described in five subsections: Section
5.1 summarises the chapter objectives and outlines what will be covered in the
subsections; Section 5.2 discusses the response rate and describes sample
characteristics; Section 5.3 examines the psychometric properties of the measures
utilized in terms of reliability analyses and construct validity for each construct of
interest; Section 5.4 describes the normality check of the items; and Section 5.5
summarises the chapter.
5.2 Descriptive statistics
In accordance with the discussion of descriptive statistics outlined in Chapter 4, this
section provides details of responses contributed in the survey, as well as the sample
characteristics. The total number of questionnaires collected was 210 from Thai
subordinates and 143 from Japanese managers. However, six were excluded because
a large part of them (motivation to adapt and accept) was not filled in, with three
showing high levels of i:ion-completion. Therefore the usable questionnaires from
Thai subordinates were 204, and from Japanese managers were 140. Prior to computer
entry the retained questionnaires were manually checked once more to identify if
there were any missing items.
117

5.2.1 Response rate
The questionnaire surveys were distributed to all 617 Japanese manufacturing firms
for both Japanese managers and Thai subordinates during the time period from April
to September 2007. Questionnaires were distributed to seven types of Japanese
manufacturing companies according the Japanese Chamber of Commerce, Bangkok
(2006), including 71 metal companies, 70 machinery companies, 42 garment and
textile companies, 50 agricultural and marine companies, 134 electric and electronic
companies, 167 automobile companies, and 83 chemical companies. Summary
profiles of respondent companies are presented in Table 5.1 below.
I
Types of Japanese Thai organizations Completed Number Response Completed Number Response
Sent rate Sent rate Metal 30 71 4.86% 37 71 6%
Machinery 9 70 1.46% 17 70 2.8%
Garment and 8 42 1.3% 13 42 2.1% textile
Agricultural 8 50 1.3% 14 50 2.2% and marine Electric and 35 134 5.67% 48 134 7.8% electronic
Automobile 32 167 5.19% 50 167 8.1%
Chemicals 18 83 2.91% 25 83 4% Total 140 617 22.69°/o 204 617 33.0°/o
Table 5.1: Response rate
The response rates for Thai subordinates and Japanese managers were 33 percent and
22.69 percent, respectively. As a 30 percent response rate is considered acceptable
(Sekaran 2003), the response rate of 33 percent for Thai subordinates was deemed to
be acceptable. The response rate of 22.69 percent for Japanese managers was low
despite conducting a serious follow-up process. However, as 100-150 (16.5%-24.5%)
is the recommended minimum sample size, at 140 (22.69%) and 204 (33%) the
sample sizes for this study were still sufficient to perform SEM and provide a stable
Maximum Likelihood Estimation (MLE) solution (Hair et al. 2003 ).
118

5.2.2 Demographic characteristics
Demographic data was collected in order to develop a profile of respondents who took
part in the main survey. Demographics of Japanese managers and Thai subordinates
included age, gender, position, tenure, and organizations' background information.
Age grouping
Age Number percent
20-25 23 11.3% I
26-30 81 39.7% 31-35 43 21.1 % 36-40 32 15.7% 41-45 18 8.8% 46-50 7 3.4%
Total 204 100%
Table 5.2: Age grouping of Thai subordinates
Table 5.2 shows the age distribution of Thai subordinates. The majority of
respondents between 26 and 30 years included 39.7 percent. Nearly 72 percent of
Thai subordinates were under the age 35 and over 87 percent were below the age of
41.
Age Number percent
36-40 38 27.1%
41-45 66 47.1% 46-50 27 19.3% 51-55 7 5% 56-50 2 1.4% Total 140 100%
Table 5.3: Age grouping of Japanese managers
Table 5.3 shows the age distribution of Japanese managers. The majority of these
respondents were aged between 41 and 45 at 4 7 .1 percent. Over 93 percent of
Japanese managers were below 51 .
119

Gender breakdown of Thai subordinates and Japanese managers
Gender Number percent
Male 141 69.1%
Female 63 30.9% Total 204 100%
Table 5.4: Gender breakdown of Thai subordinates
Table 5.4 indicates that of the 204 Thai subordinates there were more males than
females with over 69 percent male and fewer than 31 percent female.
Gender Number percent
Male 138 98 .6%
Female 2 1.4% i Total 140 100%
Table 5.5: Gender breakdown of Japanese managers
Table 5.5 shows that of the 140 Japanese managers there were disproportionately
more males than females, with over 98 percent male and under 2 percent female.
Positions
Position Number percent
Non-supervisor/non-manager (not a 23 11.3% supervisor or manager) First Line supervisor 81 39.7% Lower level/Junior Manager 43 21.1% Middle Manager 32 15.7% Senior Manager 21 10.3% Executive 4 2%
Total 204 100%
Table 5.6: Position of Thai subordinates
As shown in Table 5.6, the majority of Thai subordinates surveyed were either first
line managers (39.7 %) or lower level/junior managers (21.1 %), with a small number
of executives (2 %).
120

Position Number percent
Senior Manager 101 72.1%
Executive 34 24.3% Divisional Head/General Manager 5 3.6% (not CEO) Total 140 100%
Table 5.7: Position of Japanese managers
Table 5.7 shows that the majority of Japanese managers were senior managers (72.1
%). Over 27 percent were executives and divisional heads or general managers.
Duration
Duration Number percent
2 up to 5 years 25 12.3%
5 up to 10 years 123 60.3% 1 0 up to 15 years 49 24% 15 up to 20 years 7 3.4% Total 204 100%
Table 5.8: Duration of Thai subordinates
Table 5.8 shows that nearly 27 percent of Thai subordinates had over 10 years
working experience, whereas nearly 73 percent had less than 10 years work
expenence.
Duration Number percent
1 0 up to 15 years 38 27.1%
15 up to 20 years 66 47.1% 20 up to 25 years 27 19.3% 25 up to 30 years 7 5% 30 up to 35 years 2 1.4% Total 140 100%
Table 5.9: Duration of Japanese managers
Table 5.9 shows that more than 93 percent of Japanese managers had working
experience of between 10 to 25 years, whereas nearly 7 percent had working
experience of more than 25 years.
121

Organizational age
Organizational Age Number percent
1 to 2 years 7 3.4%
3 to 5 years 29 14.2% 6 to 10 years 68 33.3% 11 to 20 years 66 32.4% 21 to 30 years 29 14.2% 31 to 40 years 5 2.5%
Total 204 100%
Table 5.10: Organizational age reported by Thai subordinates
Table 5.10 shows that the organizational age distribution is approximately the same
for 6 to 10 years and 11 to 20 years, with relatively small groups of organizations
aged between 31 to 40 years and 1 to 2 years.
Organizational Age Number percent
, 1 to 2 years 2 1.4%
3 to 5 years 15 10.7% 6 to 10 years 45 32.1% 11 to 20 years 45 32.1% 21 to 30 years 18 12.9% 31 to 40 years 15 10.7%
Total 140 100%
Table 5.11: Organizational age reported by Japanese managers
Table 5.11 shows organizational age reported by the Japanese managers. This
indicates that the organizational age distribution is the same for 6 to 10 years and 11
to 20 years, with a relatively small group of 1 to 2 years. This result is similar to the
results presented in Tab le 5 .10.
122

Types of organization
Types of Organization Number percent Joint venture 150 73 .5%
Wholly owned Japanese subsidiary 54 26.5% Total 204 100%
Table 5.12: Type of organization reported by Thai subordinates
Table 5.12 indicates that of the 204 organizations, significantly more were joint
venture than wholly-owned Japanese subsidiary, with over 73 percent joint venture
and fewer than 27 percent wholly-owned Japanese subsidiary.
Types of Organization Number percent Joint venture 104 74.3%
Wholly owned Japanese subsidiary 36 25.7% Total 140 100%
Table 5.13: Type of organization reported by Japanese managers
Table 5.13 shows that of the 140 organizations, there were notably more joint venture
organizations than wholly-owned Japanese subsidiary with over 74 percent joint
venture and under 26 percent wholly-owned Japanese subsidiary.
Lifetime employment
Lifetime employment Numbe.r percent Almost never 13 6.4%
Seldom 19 9.3% Sometimes 54 26.5% Frequently 47 23% Almost always 45 22.1% Always 26 12.7%
Total 204 100%
Table 5.14: Lifetime employment reported by Thai subordinates
Table 5.14 shows the extent to which lifetime employment had been implemented in
Thailand, reported by Thai subordinates. The majority of Thai subordinates indicated
that lifetime employment had been implemented in their organizations sometimes to
almost always (71 .6 %).
123

Lifetime employment Number percent
Almost never 8 5.7%
Seldom 13 9.3% Sometimes 38 27.1% Frequently 33 23.6% Almost always 30 21.4% Always 18 12 .9%
Total 140 100%
Table 5.15: Lifetime employment reported by Japanese managers
Table 5.15 shows the extent to which lifetime employment had been implemented in
Thailand reported by Japanese managers. Similar to the results in Table 5.14, the
majority of Japanese managers indicated that lifetime employment had been
implemented in their organizations sometimes to almost always (72.1 %).
Consensus decision-making
Consensus Decision-Making Number percent
Almost never 6 2.9%
Seldom 3 1.5% Sometimes 59 28.9% Frequently 54 26 .5% Almost always 52 25.5% Always 30 14.7%
Total 240 100%
Table 5.16: Consensus decision-making reported by Thai subordinates
Table 5.16 shows the extent to which consensus decision-making had been
implemented in Thailand, reported by Thai subordinates. Over 80 percent of Thai
subordinates reported that consensus decision-making had been implemented in their
organizations sometime to almost always. However, 4.4 percent reported that
consensus decision-making had either almost never or seldom been implemented in
their organizations.
124

Consensus Decision-Making Number percent
Almost never 4 2.9%
Seldom 2 1.4% Sometimes 43 30.7% Frequently 37 26.4% Almost always 34 24.3% Always 20 14.3%
Total 140 100%
Table 5.17: Consensus decision-making reported by Japanese managers
Table 5.17 shows the extent to which consensus decision-making had been
implemented in Thailand, reported by Japanese managers. Over 95 percent of
Japanese managers reported that consensus decision-making had been implemented in
their organizations sometime to always.
Seniority system
Seniority System Number percent
Almost never 7 3.4%
Seldom 17 8.3% Sometimes 65 31 .9% Frequently 45 22.1% Almost always 50 24.5% Always 20 9.8%
Total 240 100%
Table 5.18: Seniority system reported by Thai subordinates
The majority of Thai subordinates indicated that seniority systems had been used in
their organizations sometimes to almost always (78.5 %), while over 11 percent of
them reported that seniority systems had almost ever or seldom been used.
125

Seniority System Number percent
Almost never 5 3.6%
Seldom 12 8.6% Sometimes 44 31.4% Frequently 33 23.6% Almost always 33 23 .6% Always 13 9.3%
Total 140 100%
Table 5.19: Seniority system reported by Japanese managers
The majority of Japanese managers indicated that seniority systems had been used in
their organizations sometimes to almost always (78.6 %), while over 12 percent of
them reported that seniority systems had seldom or almost never been used.
House union
House Union Number percent
Almost never 3 1.5%
Seldom 24 11.8% Sometimes 58 28.4% Frequently 62 30.4% Almost always 39 19.1% Always 18 8.8%
Total 204 100%
Table 5.20: House union reported by Thai subordinates
Over 58 percent of Thai subordinate reported that house union practices had been
implemented in their organizations sometimes or frequently, while 13.3 percent of
them reported seldom or almost never.
126

House Union Number percent
Almost never 2 1.4%
Seldom 17 12. 1% Sometimes 38 27.1% Frequently 45 32.1% Almost always 27 19.3% Always 11 7.9%
Total 140 100%
Table 5.21: House union reported by Japanese managers
Over 59 percent of Japanese managers reported that house union practices had been
implemented in their organizations sometimes or frequently, while 13.5 percent of
them reported seldom or almost never.
Job rotation
Job Rotation Number percent
Almost never 3 1.5%
Seldom 22 10.8% Sometimes 43 21.1% Frequently 62 30.4% Almost always 49 24% Always 25 12.3%
Total 204 100%
Table 5.22: Job rotation reported by Thai subordinates
The majority of Thai subordinates agreed that rob rotation had been implemented in
their organizations (51.5 %), while 12.8 percent reported almost never or seldom use
of job rotation.
127

Job Rotation , Number percent
Almost never 2 1.4%
Seldom 14 10% Sometimes 30 21.4% Frequently 46 32.9% Almost always 32 22.9% Always 16 11.4%
Total 140 100%
Table 5.23: Job rotation reported by Japanese managers
The majority of Japanese managers indicated that job rotation had been used in their
organizations sometimes to almost always (77.2 %), while over 11.4 percent reported
that job rotation had seldom or almost never been used.
Quality control circles
I Quality Control Circles Number percent
Almost never 3 1.5%
Seldom 22 10.8% Sometimes 43 21.1% Frequently 62 30.4% Almost always 49 24% Always 25 12.3%
Total 204 100%
Table 5.24: Quality control circles reported by Thai subordinates
Over 30 percent of Thai subordinates indicated that quality control circles had been
frequently implemented in their organizations, while 12.3 percent reported almost
never or seldom.
128

Quality Control Circles Number percent
Almost never 1 0.7%
Seldom 6 4.3% Sometimes 42 30% Frequently 39 27.9% Almost always 39 27.9% Always 13 9.3%
Total 140 100%
Table 5.25: Quality control circles reported by Japanese managers
Table 5.25 shows that over 85 percent of Japanese managers agreed that quality
control circles had been implemented in their organizations; however, 5 percent of
them reported seldom or almost never use of quality control circles.
5.3 Reliability and validity
All internal consistency reliabilities based on Cronbach's Alphas for measurement
items were better in the questionnaire survey results than they were in the pilot
survey. All of them were found to be greater than 0.8, which is considered as good
(see Tables 5.26 & 5.27). All reliability tests were quite high (greater than 0.8), which
indicates that the items in each factor positively correlated to one another (Sekaran
2003). In other words, items in each factor were independent measures of the same
concept, and therefore indicate accuracy in measurement in the main survey.
Another internal consistency measure for the survey was the item-total-correlation
values, and consistent with Robinson, Shaver and Wrightsman (1991 ), all exceeded
0.5 (see Tables 5.26 and 5.27). Cohen (1988) suggests that correlation (r) = 0.1 to
0.29 (small correlation in both positive and negative), r = 0.3 to 0.49 (medium
correlation), and r = 0.5 to 1.0 (large correlation). These results supported those of
Cronbach' s Alpha coefficient, showing that the questionnaires in the main survey
were a reliable measurement tool.
Convergent validity {correlation analysis) assessing the degree to which two measures
of the same concept are correlated has also been used as a way to establish construct
129

validity for this research. Hair et al. (2003) point out that high correlations indicate
that the scale is measuring its intended concept. Therefore, as item-total correlations
were found to be quite high (greater than 0.5 -see Table 5.26 and 5.27) with most of
the item-total correlations for the survey being better than those in the pilot survey
(see Chapter 4), these results indicate convergent validity of the instrument.
Convergent validity is also accomplished when the factor loading is significantly
different from zero (Shammout 2008 ;_ Zeidan 2006). When the critical ratio of the
parameter estimates is utilized to evaluate its statistical significance, the main
criterion is that the estimated parameter be significantly different from zero. As all
indicators specified to measure common underlying factors in this study had relatively
high standardized loadings on their factors (Kline 2005), goodness of fit measures for
the one-factor congeneric measurement models reported in Chapter 6 can also be
viewed as confirming the convergent validity of the constructs of this research.
130

Items Reliability Item-to- Cronbach' Results : total- s Alpha if
Cronbach' s correlations Item Alpha Deleted
Vision 0.874 Vision! 0.573 0.877 Vision2 0.746 0.838 Vision3 0.709 0.847 Vision4 0.725 0.844 Vision5 0.775 0.830
Leadership 0.885 Leadership 1 0.562 0.893 Leadership2 0.749 0.854 Leadership3 0.704 0.864 Leadership4 0.776 0.847 Leadership5 0.825 0.835
Structure 0.852 Structure! 0.630 0.832
Structure2 0.682 0.818 Structure3 0.712 0.810 Structure4 0.682 0.817 Structure5 0.622 0.833 Reward 0.856 Reward! 0.615 0.841 Reward2 0.646 0.833 Reward3 0.702 0.819 Reward4 0.659 0.830 Reward5 0.735 0.809 Relationship 0.802 Relationship 1 0.604 0.759 Relationship2 0.553 0.775 Relationship3 0.616 0.755 Relationship4 0.501 0.789 Relationship5 0.663 0.743
Resources support 0.885 Resources support 1 0.729 0.859 Resources support2 0.701 0.870 Resources support3 0.774 0.842
Resources support4 0.793 0.834
Acceptance 0.819 Acceptance 1 0.552 0.814 Acceptance2 0.713 0.737 Acceptance3 0.724 0.736 Acceptance4 0.587 0.796
Table 5.26: Summary of Cronbach's alpha, and item-to-total-correlations values
in main survey of Thai employees
131

Items Reliability Item-to- Cronbach' Results: total- s Alpha if
Cronbach ' s correlations Item Alpha Deleted
Vision 0.885 Visionl . 0.603 0.886 Vision2 0.712 0.864 Vision3 0.723 0.860 Vision4 0.768 0.849 Visions 0.813 0.838
Leadership 0.849 Leadership 1 0.578 0.838 Leadership2 0.618 0.829 Leadership3 0.697 0.808 Leadership4 0.689 0.810 LeadershipS 0.717 0.802
Structure 0.873 Structure! 0.583 0.873
Structure2 0.761 0.832
Structure3 0.695 0.847
Structure4 0.698 0.849 Structures 0.778 0.827
Reward 0.832 Rewardl 0.686 0.782 Reward2 0.512 0.830
Reward3 0.691 0.781 Reward4 0.557 0.818 Rewards 0.719 0.774
Relationship 0.821 Relationship I 0.590 0.793 Relationship2 0.589 0.793 Relationship3 0.566 . 0.799 Relationship4 0.697 0.759 Relationships 0.628 0.781
Resources support 0.873 Resources support I 0.751 0.829 Resources support2 0.734 0.835 Resources support3 0.679 0.862
Resources support4 0.762 0.824
Adaptation 0.892 Adaptation 1 0.762 0.862 Adaptation2 0.753 0.866 Adaptation3 0.763 0.862 Adaptation4 0.778 0.856
Table 5.27: Summary of Cronbach's alpha, and item-to-total-correlations values
in main survey of Japanese managers.
132

5.4 Normality
As structural equation modelling requires variables to be normality distributed, it was
necessary to check the distribution of variables to be utilized in the analysis. In order
to check the actual deviation from normality for this thesis, three methods including
univariate skewness, univariate kurtosis, and multivariate kurtosis were used. The
univariate skewness and univariate kurtosis were conducted using an SPSS program,
and the multivariate kurtosis was preformed using an AMOS program. Distribution is
considered within a normal range when indicators of the univariate skewness and
univariate kurtosis values are less than 2 and 3, respectively (Azzalini 2005; Hair et
al. 2003). As the univariate skewness and univariate kurtosis values of the
questionnaires were all less than 2 (see Table 5.28 and 5.29), this indicates that the
univariate skewness and univariate kurtosis values were very small for each item.
Therefore, these items of the main survey were considered to be normally distributed
(e.g. Halstead, Hartman & Schmidt 1994).
Items Univariate Univariate Multivariate Skewness Kurtosis Kurtosis
Vision 13.242 Vision} 0.006 -0.118 Vision2 0.181 -0.894 Vision3 0.046 -0.671 Vision4 -0.039 -0.790
Visions 0.091 -0.654
Leadership 13.632
Leadership I -0.219 0.180 Leadership2 -0.957 0.807 Leadership3 -0.475 -0.184 Leadership4 -0.433 -0.343 Leaderships -0.382 -0.382 Structure 12.399 Structure I -0.227 -0.451
Structure2 -0.055 -0.521
Structure3 0.019 -0.318 Structure4 -0.159 -0.541 Structures -0.094 -0.907
Reward 23.411 Reward I -0.376 -0.086 Reward2 -0.265 -0.150 Reward3 -0.856 0.999 Reward4 -0.37 1 -0.179 Rewards -0.431 -0.318
133

Items Univariate Univariate Skewness Kurtosis
Relationship Relationship I -0.589 -0.090 Relationship2 -0.431 -0.700 Relationship3 -0.446 -0.445 Relationship4 -0.464 -0.243 Relationships -0.546 -0.399
Resources support Resources support I -0.856 0.999 Resources support2 -0.371 -0.179 Resources support3 -0.431 -0.318
' Resources support4 -0.433 -0.186 Acceptance Acceptance I -0.029 -0.589 Acceptance2 -0.227 -0.451 Acceptance3 -0.055 -0.521 Acceptance4 0.019 -0.318
Table 5.28: Normality distribution in main survey of Thai subordinates.
(See Appendix 2 for shape of distribution)
Items Univariate Univariate Skewness Kurtosis
Vision Visionl -0.342 0.595 Vision2 -0.828 0.954 Vision3 -0.328 -0.100 Vision4 -0.267 -0.351 Visions -0.241 -0 .556 Leadership Leadership l -0.274 -0.035 Leadership2 -0.342 0.595 Leadership3 -0.828 0.954 Leadership4 -0.328 -0.100 LeadershipS -0.267 -0.351 Structure Structure I 0.096 -0. l 01 Structure2 0.317 -0.846 Structure3 0.027 -0.485 Structure4 -0.017 -0.739 Structures 0.215 -0.493 Reward Reward I -0.612 0.580 Reward2 -0.308 -0.304 Reward3 -0.597 0.663 Reward4 -0.303 0.280 Rewards -0.275 0.074
134
Multivariate Kurtosis
8.956
9.823
2.851
Multivariate Kurtosis 13.111
11.869
9.798
13.450

Items Univariate Univariate Skewness Kurtosis
Relationship Relationship I -0.303 0.280 Relationship2 -0.275 0.074 Relationship3 -0.131 -0.064 Relationship4 -0.791 0.963 Relationships -0.304 -0.647
Resources support Resources support l 0.317 -0.846 Resources support2 0.027 -0.485 Resources support3 -0 .017 -0.739 Resources support4 0.215 -0.493 Adaptation Adaptation I -0.791 0.963 Adaptation2 -0.304 -0.647 Adaptation3 -0.336 -0.615 Adaptation4 -0.356 -0.602
Table 5.29: Normality distribution in main survey of Japanese managers.
(See Appendix 1 for the shape of the distribution)
Multivariate Kurtosis
4.842
11.763
15.482
Most of the multivariate kurtosis values in tables 5.28 and 5.29 were greater than 8,
which may present a problem with implementation of structural equation modelling
(Shammout 2008; Zeidan 2006). Kline states that ' absolute values of the kurtosis
index greater than 10 may suggest a problem, and values greater than 20 may indicate
a more serious one' (2005, p.50). However, the AMOS program provides a way to
solve this problem (refer to Section 4.7.2).
Departure from normality
The maximum likelihood for estimate SEM parameters requires data to be of a
multivariate distribution, which may become violated in small samples (Turner 2007).
For data that lacks multivariate distribution, bootstrapping may solve these problems
and gives a less biased estimate. When normality assumptions are violated, Bollen
Stine chi-square correction generates a correct value (Byrne 2001 ). For the present
study where issues with multivariate non-normality were evident, the researcher
requested AMOS to perform a bootstrap on 140 and 204 samples. The results of these
bootstrap tests are presented in the next chapter.
135

5.5 Summary
This chapter has presented and described the demographic characteristics of the
research sample, as well as information concerned with the respondents' profiles. The
response rates were sufficient to perform SEM, as a recommended minimum sample
size of 100-150 is considered as stable for maximum likelihood estimation. The
demographic data of Japanese managers and Thai subordinates included age, gender,
position, tenure, and organizations' background information. Tables 5.14 to 5.25 have
illustrated that Japanese management practices are utilized in both Japanese joint
venture organizations and wholly-owned Japanese subsidiaries in Thailand.
Reliability and validity of the measures of motivational factors for adaptation and
acceptance (vision, leadership, resources support, reward, structure, and relationship),
the measure of adaptation, and the measure of acceptance have been described.
Additionally, examination of the data for normality prior to analysis, and the
normality of items of vision, leadership, resources support, structure, relationship,
reward, adaptation, and acceptance, was revealed. All of these items showed normal
distribution when univariate · skewness and univariate kurtosis were performed;
however, multivariate kurtosis did not show normal distribution. The use of
bootstrapping to solve the problem of multivariate non-normality when performing
structural equation modelling will be presented in the following Chapter 6. Further
analysis using SEM with AMOS will also be presented in relation to assessing the
relationship between motivational factors and adaptation and acceptance, the main
purpose of this research.
136

Chapter 6 Structural equation modelling: Results and
analysis
6.1 Introduction
The purpose of this chapter is to empirically examine and test the hypotheses of
relationships between the motivational factors for adaptation and acceptance (vision,
leadership, resources support, reward, structure, and relationship), and adaptation and
acceptance as described in Chapter 3, using structural equation modelling (SEM).
SEM provides the ability to measure causal relationships between unobserved (latent)
variables while determining the amount of un-explained variance. SEM also has the
ability to evaluate how well a proposed conceptual model containing observed
indicators and hypothetical constructs explains or fits the collected data (Bollen
1989).
As stated in Chapter 4, structural equation modelling measurement and theory testing
techniques are more useful than traditional statistical techniques (e.g. liner regression,
multiple regressions), because they allow competing theoretical models to be
examined. SEM is also preferred because it is more flexible than regression analysis.
For instance, multiple predictor variables, multiple mediators and multiple outcome
variables can be included in the model , as well as other potential causes of the
mediator and outcome, including longitudinal data (MacKinnon 2000; Quintana &
Maxwell 1999). Furthermore, SEM is considered to be the method of analysis for this
thesis because of the information it offers on degree of fit for the entire model after
controlling for measurement error (Peyrot 1996). Here, control for measurement error
is important because measurement problems stay one of the serious obstacles
impeding social science research (Blalock 1979). Moreover, SEM can be utilized to
examine scale validation, and probably modifies scales for better psychometric
properties as well as re-specifies the hypothesized model for better model fit (Chau
1997).
137

Structural equation modelling measurement can be conducted in either one or two
stage approaches (Hair et al. 2003). The one stage approach processes the analysis
with simultaneous estimations of both structural and measurement models, and the
two-stage approach processes the measurement model first, then modifies it in the
second stage when the structural model is estimated. In this research, the two-stage
approach has been selected for the analysis for three reasons. Firstly, it is widely
accepted and utilized in management research (e.g. Brown et al. 2007; Kacmar et al.
2006; Rhoades, Eisenberger & Armdi 2001 ). Secondly, the accurate representation of
reliability of the indicators of each construct is best accomplished in two stages to
avoid any interaction between the measurement and structural models (Hair et al.
2003). Finally, analyzing the causal relationships in the structural model initially
needs performance of the measurement model due to the latter representing a
condition that must be satisfied as a matter of logical necessity (Anderson & Gerbing
1988). Therefore, in this research the first stage of analysis was carried out by
specifying causal relationships between the observed variables (indicators) and the
underlying theoretical constructs (latent variables). The purpose of this step was to
verify the unidimensionality of the latent variables and demonstrate their validity. In
order to determine the underlying measurement model for this stage, confirmatory
factor analysis (CFA) has been used. --------As discussed in Chapter 4, the measurement model of this research was tested
utilizing confirmatory factor analysis prior to testing the structural model to ensure
stability of the set of scales and to improve the fit. A critical step of structural
equation modelling is the assessment of the hypothesized measurement model, thus,
prior to analysis of the structural equation model, all its variables were examined for
relevance. This was performed by producing one-factor congeneric models for all
latent constructs.
In this thesis the measurement model identifies and tests the relationships between
observed measures and their underlying constructs (the first stage) and provides a
confirmatory assessment of construct validity (Bentler 1978), whereas the structural
model (the second stage) tests the causal relationships among the latent constructs, as
posited by the theory (Anderson & Gerbing 1988). As already mentioned, achieving
138

the model-building task through using a two-stage approach has been selected as
superior to using a one stage approach (Anderson & Gerbing 1988).
This chapter has eight subsections. Section 6.1 summanses the objectives of the
chapter and outlines what will be covered in the subsections. Section 6.2 describes the
assessment of goodness-of-fit for the models. Section 6.3 presents the confirmation of
hypothesized latent constructs and discusses how each was tested before developing
the structural models. Section 6.4 illustrates how the structural models were tested and
developed. Section 6.5 discusses the use of composite factor approach in this
research. Section 6.6 presents the Japanese management acceptance model used in
this thesis - examined and developed from the proposed model in Chapter 3. Section
6. 7 elucidates and tests the proposed Japanese management adaptation model. Finally,
Section 6.8 summarises the chapter.
6.2 Assessing goodness of fit
There is substantial literature on the assessment of goodness of fit of structural
equation models, giving a wide array of fit indices along with information about their
behavior (e.g. Browne & Cudeck 1993; Mulaik et al. 1989; Marsh, Balla &
McDonald 1988). However, Hair et al. (2003 p.489) asserts that "Structural equation
modelling has no single statistical test that best describes the strength of the model's
predictions". While there are various indices provided by SEM, there is no
concurrence among scholars as to which fit indices should be reported. For instance,
Kline (2005) recommended at least four fit tests, while Jacard and Wan (1996)
suggested the use of at least three. Anderson and Gerbring (1988) advised that
researchers could assess how well the specified model accounts for data with one or
more overall goodness-of-fit indices. Therefore, in order to provide the best overall
picture of model fit, in agreement with Hair et al. (2003), this research reports
measures which reflect the three categories of fit indices: absolute; incremental; and
parsimonious (see Table 4.5, Chapter 4).
As recommended by a number of researchers, multiple criteria for goodness-of-fit
were utilized in this research to evaluate the goodness of fit for models tested in
confirmatory factor analysis and structural equation modelling (Kline 2005; Byrne
139

2001; Bollen 1989). These criteria consist of the following measures of model fit: chi
square (X2); normed chi-square (the ratio of the x2 to its degrees of freedom [ df]);
standardized root mean-square residual (SRMR); Tucker-Lewis Index (TLI);
comparative fit index (CFI); and Root-Mean-Square Error of Approximation
(RMSEA). These indices were selected because they reflect the three categories of fit
indices mentioned above.
The first index considered was the chi-square ('X,2) test of model fit. Chi-square (x2)
provides an absolute fit index, and considered by Joreskog (1969) as the fundamental
measure of overall fit only obtainable in SEM (Bollen 1989). The chi-square value
stands for the discrepancy between the unrestricted sample covariance matrix and the
restricted covariance matrix (Joreskog & Sorbom 1993). Ideally, a statistically non
significant chi-square (at least p>0.05) value should be observed to indicate good fit.
As noted in many studies, inferring from only the chi-square test is not recommended
because a statistical chi-square value can be achieved even when all other indices
indicate that the specified model provides a good fit to the data. This derives from the
fact that the chi-square test in very susceptible to even small deviations between the
observed and reproduced data matrices, and is vulnerable to sample sizes (Marsh,
Balla & McDonald 1988) both large and small (Hair et al. 2003). Moreover, as
mentioned in Section 5.4 of Chapter 5, when the data violates assumptions of
multivariate normality, the Bollen-Stine bootstrap p is reported. As stated above, the
maximum likelihood x2 statistic is susceptible to sample size; as N increases so too
does x2' and the bigger the X2 the more possible it is that the specified model will be
rejected. Presented as an equation it can be said that:
(N-l)*Fo is distributed as an x2 distribution with df = Yz[(p+q)(p+q+ l)]-t
where: N is sample size;
Fo is the minimum value of discrepancy function;
p is the number of endogenous indicators;
q is the number of exogenous indicators; and
tis the number of estimated coefficients in the proposed model.
140

The second fit index selected for use in this study was the normed chi-square test of
model fit (NC ration= x2/degree of freedom) (Wheaton et al. 1977). This index falls
within the parsimonious fit indices category which examines the parsimony of the
hypothesised model by evaluating the fit of the model to the number of estimated
coefficients or degrees of freedom required to attain the level of fit (Hair et al. 2003).
However, although models with a value close to one are accepted, it is not clear how
far from one that a ratio can get before concluding that a model is unacceptable.
The third fit index utilized in this research, standardized root mean-square residual
(SRMR), is an absolute fit measure which is 'based on transforming both the sample
covariance matrix and the expected covariance matrix into correlation matrices. The
SRMR is thus a measure of the mean absolute correlation residual, which is the
overall difference between the observed and expected correlations (Kline 2005, p.
141 ). Thus, the SRMR value represents the average discrepancy between the observed
sample and the hypothesized correlation matrices. This value should be from 0-1 with
values less than 0.10, indicating a well-fitting model (Kline 2005). This value can also
be interpreted as meaning that the model elucidates the correlations to within an
average error of that value (Hu & Bentler 1995).
The fourth and fifth fit indices were the Tucker-Lewis Index (TLI) (Tucker & Lewis
1973), and the Comparative Fit Index (CFI) (Bentler 1990), which are defined as
incremental or comparative fit indices (Zeidan 2006). The CFI is synonymous to the
relative non-centrality index (RNI), except that the CFI is truncated to fall in a range
from 0-1. The TLI and CFI are not systematically influenced by sample size, and both
reflect systematic variation in model misspecifications. The difference between them
is that the TLI suitably penalizes model complexity, and appropriately rewards model
parsimony (Shammout 2008; Zeidan 2006). Although the value of TLI may oscillate
outside of the range between 0-1 under some situations, values above 0.90 are
normally indicative of well-fitting models. CFI values greater than 0.90 indicate a
good fit (Bentler 1992), and values close to 0.95 indicate great fit (Hu & Bentler
1929). Bollen (1989, p. 275) states that "selecting a rigid cut-off for the incremental
fit indices is like selecting a minimum R2 for a regression equation. Any value will be
controversial. Awareness of the factors affecting the values and good judgment is the
best guide to evaluating their size".
141

The TLI measure coalesce a measure of parsimony into a comparative index between
the proposed and null models, and is expressed as:
TLI= [ ( X2nulll dfnutt)-( X2 proposed I df proposed)] /( X2nutt I dfnuu)-1
where: X2nul I is the chi-square measure of the null model ;
dfnull is the degree of freedom of the null model;
X2 proposed is the chi-square measure of the proposed model being tested; and
df proposed is the degree of freedom of the proposed model being tested.
The CFI measure is calculated as:
CFI=[1-max(chisq-df,O)] I [max(chisq-df), (chisqn-dfn), O)]
where: chisq and chisqn are model chi-square for the given and null models,
and df and dfn are the corresponding degree of freedom.
The sixth fit index used in this thesis was the Root Mean Square Error of
Approximation (RMSEA) (Steiger 1989). The RMSEA is a measure of absolute fit
index which refers "how well would the model , with unknown, but optimally chosen
parameter values fit the population covariance matrix if it were available?" (Browne
& Cudeck 1993, pp:137-8). This index includes parsimony as a criterion in the
assessment of fit. Browne and Cudeck (1993) provided guidelines for the
interpretation of the value of RMSEA. By analyzing many sets of empirical data and
assessing the behavior of RMS EA in relation to previous conclusions about model fit ,
Browne and Mels (1990) suggested that values of RMSEA less than 0.05 are
considered as indicative of good fit. Browne and Cudeck (1993) recommended that
values in the range of 0.05-0.08 indicate moderate fit as "value up to 0.08 represent
reasonable errors of approximation in the population" (Joreskog & Sorbom 1996,
p.124). RMSEA attempts to correct the tendency of the x2 statistic to deny any
specified model. It takes into account the error of approximation in the population and
lightens up the stringent requirement on x2 that the model holds accurately in the
population.
142

Browne and Cudeck (1993) have defined the RMSEA as:
RMSEA= ~Max{[F-(df ln),0]}14[
where: Max is the maximum value of either of the two expressions in the parentheses;
/\
F is the minimum value of fit function;
n =N-l (where N is the sample size); and
dfis degree of freedom.
As above, RMSEA is a measure of the discrepancy per degree of freedom; therefore
the smaller it is the better. It is one of the fit indexed that is less influenced by sample
size, although for very small sample sizes it overestimates goodness of fit.
As mentioned earlier in this section, all the above criteria were used in this research to
evaluate fit of the models. These ranges of values of acceptable fit measures are
consistent with the guidelines recommended by many researchers as presented in
Table 4.5, Chapter 4.
6.3 Confirmation of hypothesized latent constructs
Based on the responses received from Thai subordinates and Japanese managers in
manufacturing organizations (N 1 =204, N2= 140) one-factor congeneric models
utilizing maximum likelihood CF As were evaluated for the hypothesized latent
constructs of vision, leadership, resources support, structure, reward and relationship.
In this research, confirmatory factor analysis was conducted using an AMOS 7
computer program. Analysis of congeneric models utilizing AMOS 7 allows for
complex modelling whereby error associated with the measurement of indicator
variables towards the measurement of latent variables can be explicated, and the fit of
these indicators as measures of the latent variables can be tested. In these models, the
variances oflatent variables were set to unity in order to specify the models.
143

6.3.1 Confirmation of the vision-Thai construct
An inspection of the modification indexes of one-factor model for the construct of
vision-Thai revealed high covariances between the first, second and third
measurement errors. According to Byrne (2001), these measurement error covariances
signify systematic rather than random measurement error in item responses, and can
be triggered due to a high degree of overlapping in item content. Therefore the second
question related to the first and third measurement error was deleted, as it was found
to be highly correlated and redundant with the item associated with the first and third
measurement errors. A new model was then submitted and found to have a good data
fit to the model in statistics as follows: p=0.088; Bollen-Stine bootstrap, p= 0.254;
CMIN/df=2.433; RMR=0.035; TLI=0.975; CFI=0.922; and RMSEA=0.084. All
remaining items loaded highly on this factor as the factor loading range was from a
low of0.62 to a high of0.87 (see Figure 6.1) .
. 38
Vision1
.62 .49
Vision3
Vision
Vision4
.75
Visions
Figure 6.1: Con generic model of vision-Thai
This congeneric model can be explained by the following mathematical formula:
Vision= vision] *0.62+ vision 2*0. 70+ vision 3*0.83+ vision 4*0.87
Estimate S.E. C.R. p Label Vision5 <---Vision 1.000 Vision4 <---Vision 1.046 .086 12.182 *** Vision3 <---Vision .748 .071 10.602 *** Vision 1 <---Vision .669 .073 9.131 ***
Table 6.1: Regression weights of vision-Thai construct
144

Estimate S.E. C.R. p Label Vision II 1.202 .167 7.183 *** eV5 .397 .077 5.157 *** 'eV4 .586 .094 6.253 *** eV3 .691 .081 8.568 *** eVl .874 .096 9.141 ***
Table 6.2: Variances of vision-Thai construct
Table 6.1 shows that all the regression weights were significant at a 0.001 level. As
shown in Table 6.2, all variances of Vision-Thai construct were also significant at a
0.001 level.
6.3.2 Confirmation of the vision-Japanese construct
For the construct of vision-Japanese, the modification indices showed high covariance
between the second and third measurement errors. The second question associated
with the third measurement error was deleted as it was redundant with the third item.
Hence, a new model was developed showing an excellent data fit to the model in
statistics as follows: p=0.837, Bollen-Stine bootstrap p= 0.846, CMIN/df=0.178,
RMR=0.010, TLI=l.017, CFI=l.000, and RMSEA=0.000. All remaining items
loaded highly on this factor, as the factor loading range ranged from a low of 0.63 to a
high of 0.95 (see Figure 6.2). .40
. Vision1
Vision3
Vision
Vision4 .95
.90
V isions
Figure 6.2: Congeneric model of vision-Japanese
The above congeneric model of vision-Japanese can he explained by mathematic
formula as:
Vision= visionl*0.63+ vision3*.0.67+ vision4*0.88+ vision5*0.95
145

Estimate S.E. C.R. p Label Visions <--- Vision 1.000
'
Vision4 <--- Visioni .898 .063 14.222 *** Vision3 <---Vision' .665 .071 9.412 *** I I IVisionl <---Vision! .592 .069 8.563 ***
Table 6.3: Regression weights of vision-Japanese construct
Estimate S.E. C.R. p Label Vision 1.268 .178 7.110 *** ,ev5 .143 .061 2.324 .015 ' ' ev4 .311 .061 5.106 *** '
ev3 .672 .087 7.756 *** evl .671 .085 7.886 ***
Table 6.4: Variances of vision-Japanese construct
The p values of all the regression weights in Table 6.3 and variances in Table 6.4
were significant at 0.001. It can be noted that although the p value of ev5 in Table 6.4
was a little high, it was acceptable at a significant level of 0.05. The item of vision 5
could not be deleted as this would have affected the p value for the model.
6.3.3 Confirmation of the leadership-Thai construct
One-factor model for the construct of leadership-Thai revealed that the third item was
responsible for the model misspecification. This item appeared to be highly correlated
and redundant with the second item, and was thus deleted. The removal of this item
resulted in a good fit of the data to the model where: p=0.251, Bollen-Stine bootstrap
p= 0.199, CMIN/df=l.382, RMR=0.025, TLI=0.995, CFI=0.998 and RMSEA=0.043 .
All remaining items loaded highly on this factor, with the factor loading ranging from
a low of 0.60 to a high of 0.95 (see Figure 6.3).
146

.36
Leadership1
.60 .47
Leadership2
Leadership
Leadership4
.90
Leadership5
Figure 6.3: Con generic model of leadership-Thai
The above congeneric model can be explained by mathematic formula as:
Leadership= leaderl*0.60+ leader2*0.69+ leader4*0.89+ leader5*0.95
Estimate S.E. C.R. p Label Leads <--- Leadership 1.000
Lead4 <--- Leadership .936 .051 18.209 *** Lead2 <--- Leadership . 749 .063 . 11.831 *** Lead 1 <--- Leadership .544 .056 9.788 ***
Table 6.5: Regression weights of leadership-Thai construct
Estimate . S.E. C.R . p Label Leadership 1.374 .158 8.676 *** '
'
eLS .147 .052 2.807 .004 eL4 .313 .054 5.779 *** eL2 .863 .092 9.382 *** eLl .712 .074 9.650 ***
Table 6.6: Variances of leadership-Thai construct
Table 6.5 shows the unstandardized estimate of the congeneric model of leadership
Thai, indicating that the p values were significant at a 0.001 level. Although the p
value of eLS in Table 6.6 was a little high, it was acceptable at a significant level of
0.05. The rest of the p values were significant at a level of 0.001. The item of
147

Leadership 5 could not be deleted as it had a very strong factor loading that would
affect the fit of the model.
6.3.4 Confirmation of the leadership-Japanese construct
The measurement model of the construct of leadership-Japanese is also presented in
the form of a one-factor congeneric model where the fourth item was deleted as it was
found to be highly correlated and redundant with the third item. The new model
showed a good data fit to the model in statistics: p=0.179, Bollen-Stine bootstrap p=
0.264, CMIN/df=l.721, RMR=0.031, TLI=0.976, CFI=0.992, and RMSEA=0.072.
All remaining items loaded highly on this factor, as factor loading ranged from a low
of0.68 to a high of0.81 (see Figure 6.4) .
~ I eL2 ~
Leadership1
Leadership2
Leadership3
Leaderships
.48
.50 .69
.7
Leadership
.65
Figure 6.4: Congeneric model of leadership-Japanese
The above congeneric model can be explained by the following mathematical
formula: Leadership= leader 1*O.69+ leader 2 *O. 71 + leader 3 *O. 68+ leader 5 *O. 81
Estimate S.E. C.R. p Label Lead5 <---Leadership 1.000 Lead3 <---Leadership .920 .124 7.434 *** Lead2 <---Leadership .800 .104 7.670 *** Lead 1 <---Leadership .785 .104 7.510 ***
Table 6. 7: Regression weights of leadership-Japanese construct
148

Estimate S.E. C.R. p Label Leadership .872 .170 5.138 *** eL5 .461 .097 4.767 *** eL3 .847 .127 6.692 *** eL2 .558 .087 6.432 *** eLl .591 .089 6.615 ***
Table 6.8: Variances ofleadership-Japanese construct
Table 6.7 shows the unstandardized estimate of the congeneric model of leadership
Japanese, representing that the p values were significant at a 0.001 level. Following
this, Table 6.8 shows the variances of the leadership-Japanese construct in which all p
values were significant at a level of 0.001.
6.3.5 Confirmation of the resources support-Thai construct
The congeneric model of the resources support-Thai construct was tested. Initially,
this model was a very poor fit, but after re-specifying the model by correlating two
error covariances, the model had an excellent fit to the data in statistics where:
p=0.891, Bollen-Stine bootstrap p= 0.886, CMIN/df=0.09, RMR=0.001, TLI=l .011,
CFI=l .000, and RMSEA=0.000. All remaining items loaded highly on this factor, as
factor loading ranged from a low of 0.62 to a high of 0.94 (see Figure 6.5).
Correlating the error covariance approach has been suggested and used in several
studies (e.g. Baharim 2007, pp. 104-15; Schumacker & Lomax 2004, pp. 189, 225;
Nguyen 2003, pp. 266-80; Byrne 2001, p. 185; Arbuckle & Wothe 1999; Joreskog &
Sorbom 1993 ). Moreover, Byrne (2001) states that correlating the error covariance
approach is well justified both statistically and substantively. Therefore, eRsl was
correlated to eRs2 to improve the fit for the model.
149

.43
ResourceSupport 1
.55 .38
ResourceSupport2
ResourceSupport3
.89
ResourceSupport4
.65
Resource support
Figure 6.5: Congeneric model of resources support-Thai
The above congeneric model can be explained by the following mathematic formula:
Resource support= ReSSJ *O. 65 + ReSS2 *O. 62+ ReSS3 *O. 91 + ReSS4 *O. 94
Estimate S.E. C.R. p Label ReSS2 <---Resource support 1.000 ReSS 1 <---Resource support 1.164 .098 11.894 *** ReSS3 <---Resource support 1.611 .162 9.975 *** ReSS4 <---Resource support 1.742 .175 9.947 *** .
Table 6.9: Regression weights of resources support-Thai construct
Estimate S.E. C.R. p Label Resources support .461 .097 4.740 *** eRs4 .177 .065 2.704 .005 eRs2 .745 .078 9.569 *** eRsl .832 .088 9.460 *** eRs3 .256 .060 4.307 ***
Table 6.10: Variances of resources support-Thai construct
Estimate S.E. C.R. p Label eRs2 <--> eRs 1 .435 .068 6.426 ***
Table 6.11: Covariances of resources support-Thai construct
The regression weights shown in Table 6.9 were significant at a level of 0.001. As
seen in Table 6.9, the p value of eRs4 was a little high. However it was still tolerable
at the significant level of 0.05. The covariance between eRs2 and eRsl as shown in
150

Table 6.11 was also significant at a 0.001 level. The item of resources support 4 could
not be deleted as it had a very strong factor loading which would affect the fit of the
model.
6.3.6 Confirmation of the resources support-Japanese construct
One-factor congeneric model of resources support-Japanese construct produced a
good fit of the data to the model after correlating two error covariances: p=0.272,
Bollen-Stine bootstrap p= 0.383 , CMIN/df= l.207, RMR=0.013 , TLI=0.996,
CFI=0.999 and RMSEA=0.039. All remaining items loaded highly on this factor, as
factor loading ranged from a low of 0.63 to a high of 0.89 (see Figure 6.6) .
. 80
ResourceSupport1
.73
ResourceSupport2
ResourceSupport3
.45 .53
ResourceSupport4
.89
Resource support
Figure 6.6: Congeneric model of resources support-Japanese
The above congeneric model can be explained by mathematical formula as:
Resource support= ReSSJ *0.89+ReSS2*0.85+ReSS3*0.63+ReSS4*0. 73
Estimate S.E. C.R. p Label ReSS4 <---Resources support .846 .089 9.489 *** ReSS3 <---Resources support .832 .106 7.809 *** ReSS2 <---Resources support .949 .085 11.163 *** ReSS 1 <---Resources support 1.000
Table 6.12: Regression weights of resources support-Japanese construct
151

Estimate S.E. C.R. p Label Resources support 1.079 .173 6.229 *** eRs4 .688 .098 7.031 *** eRs3 1.142 .151 7.550 *** eRs2 .363 .077 4.733 *** eRsl .269 .077 3.483 ***
Table 6.13: Variances of resources support-Japanese construct
Estimate S.E. C.R. p Label eRs4 <--> eRs3 .397 .097 4.090 ***
Table 6.14: Covariances of resources support-Japanese construct
Table 6.12 shows that the regression weights were significant at a level of 0.001.
Moreover, all the p values of the variances in Table 6.13 were significant at level
0.001. The p value of covariance between eRs4 and eRs3 in Table 6. I 4 was also
significant at level 0.001.
6.3. 7 Confirmation of the structure-Thai construct
The initial one-factor congeneric model of structure-Thai indicated a poor fit of the
data to the model. After re-specifying the model by deleting the first item and
correlating two error covariances, the result indicated that the data fitted the model
very well: p=0.632, Bollen-Stine bootstrap p= 0.564, CMIN/df=0.333 , RMR=0.007,
TLI=l.013 , CFI=l.000 and RMSEA=0.000. All remaining items loaded highly on this
factor, as factor loading ranged from a low of0.55 to a high of 0.87 (see Figure 6.7).
152

Figure 6. 7: Con generic model of structure-Thai
The above congeneric model can be explained by mathematic formula as:
Structure= structure2*0.55+ structure3*0. 76+ structure4*0.87 structure5*0. 73
Estimate S.E. C.R. p Label Struct5 <---Structure 1.000 Struct4 <---Structure 1.166 .116 10.057 *** Struct3 <---Structure .985 .101 9.756 *** Struct2 <---Structure .701 .098 7.117 ***
Table 6.15: Regression weights of structure-Thai construct
Estimate S.E. C.R. p Label Structure for change .727 .131 5.569 *** eSt5 .626 .082 7.633 *** eSt4 .324 .080 4.070 *** eSt3 .529 .075 7.070 *** eSt2 .808 .090 9.000 ***
Table 6.16: Variances of structure-Thai construct
Estimate S.E. C.R . p Label
eSt3 <--> eSt2 . 190 .063 3.017 .003
Table 6.17: Covariances of structure-Thai construct
All the p values of regression weights and variances shown in Table 6.15 and 6.16
were significant at level 0.001, while the p value of the covariance in Table 6.17 was
153

a little high, but still acceptable. The covariance between eSt3 and eSt2 could not be
deleted as it would affect the fit of the model.
6.3.8 Confirmation of the structure-Japanese construct
A one-factor congeneric model of the structure-Japanese variable was tested. Initially
the model had a poor fit, but the good fit of the data to the model was improved after
deleting the third item. This resulted in a good fit of the data to the model: p=0.268,
Bollen-Stine bootstrap p= 0.403, CMIN/df=l .318, RMR=0.027, TLI=0.992,
CFI=0.997 and RMSEA=0.048. All remaining items loaded highly on this factor, as
factor loadings range from a low of 0.65 to a high of 0.88 (see Figure 6.8) .
.43
Structure1
.65 .55
Structure2
Structure for change
Structure4
.78
Structure5
Figure 6.8: Congeneric model of structure-Japanese
This congeneric model can be explained by mathematic formula as:
Structure= structure] *0.65+ structure2*0. 74+ structure4*0. 78 structure5 *0.88
Estimate S.E. C.R. p Label Struct5 <---Structure for change 1.000 Struct4 <---Structure for change 1.003 .101 9.959 *** 1Struct2 <---Structure for change .811 .086 9.485 *** Structl <---Structure for change .718 .089 8.113 ***
Table 6.18: Regression weights of structure-Japanese construct
154

Estimate S.E. C.R. p Label Structure for change 1.133 .186 6.098 *** eS5 .327 .083 3.922 *** eS4 .749 .120 6.269 *** eS2 .602 .090 6.698 *** eSl .779 .105 7.387 ***
Table 6.19: Variances of structure-Japanese construct
Tables 6.18 and 6.19 illustrate the p values of regression weights and variances of
structure-Japanese construct as all significant at level 0.001.
6.3.9 Confirmation of the reward-Thai construct
A one-factor congeneric model of reward was found to provide a modest fit of the
data to the model, with correlating error covariances: p=0.045, Bollen-Stine bootstrap
p= 0.154, CMIN/df=2.439, RMR=0.038, TLI=0.969, CFI=0.988 and RMSEA=0.084.
All remaining items loaded highly on this factor, as factor loading ranged from a low
of 0.62 to a high of 0.84 (see Figure 6.9) .
. 53
Rewards1
.53 .73
Rewards2
Rewards3 Rewards
.54 .38
Rewards4
.70
Rewards5
Figure 6.9: Congeneric model of reward-Thai
This congeneric model can be explained by mathematic formula as:
Rewards= rewards] *O. 73+ rewards2*0. 73+ rewards3*0.67+ rewards4*0.62+
rewards 5 *O. 84
155

Estimate S.E. C.R. p Label Reward5 <---Rewards 1.000 Reward4 <---Rewards .674 .078 8.587 *** Reward3 <---Rewards .806 .085 9.474 *** Reward2 <---Rewards .777 .075 10.359 *** Reward 1 <---Rewards .805 .078 10.331 ***
Table 6.20: Regression weights of reward-Thai construct
Estimate S.E. C.R. p Label Rewards 1.020 .152 6.709 *** eRw5 .433 .077 5.586 *** eRw4 .743 .084 8.829 *** eRw2 .536 .068 7.858 *** eRwl .582 .074 7.886 *** eRw3 .794 .094 8.459 ***
Table 6.21: Variances of reward-Thai construct
Estimate S.E. C.R. p Label eR w4 <--> eR w3 .417 .074 5.665 ***
Table 6.22: Covariances reward-Thai construct
The p values represented in Tables 6.20, 6.21 and 6.22 were all signifi cant at level
0.001.
6.3.10 Confirmation of the reward-Japanese construct The one-factor congeneric model for reward-Japanese showed that the data fit the
model well: p=0.049, Bollen-Stine bootstrap p= 0.383 , CMIN/df=2.226, RMR=0.44
TLI=0.951, CFl=0.975 and RMSEA=0.094. All remaining items loaded highly on this
factor, as factor loading ranged from a low of 0.62 to a high of 0. 79 (see Figure 6.10).
156

.63
Rewards1
·., '· .79
8-- Rewards2 ~-EH Rewards3 Revvards I
/
----------------Rewards4
.63
8- Rewards5
Figure 6.10: Congeneric model of reward-Japanese
This congeneric model can be explained by mathematic formula as:
Rewards= rewards] *O. 79+ rewards2*0.57+ rewards3*0. 76+ rewards4*0.62+
rewards5*0. 79
Estimate S.E. C.R. p Label Reward5 <--- Rewards 1.000 Rewaid4 <--- Rewards .698 .098 7.091 *** Reward3 <--- Rewards 1.027 . I I 7 8.793 *** Reward2 <--- Rewards .700 . I09 6.449 *** Reward l <--- Rewards l. I I 8 .122 9.153 ***
Table 6.23: Regression weights of reward-Japanese construct
Estimate S.E. C.R. p Label
Rewards .825 .158 5.233 *** eRe5 .482 .083 5.771 *** eRe4 .645 .087 7.429 *** eRe3 .644 .102 6.323 *** eRe2 .851 .111 7.648 *** eRel .613 .105 5.816 ***
Table 6.24: Variances of reward-Japanese construct
Tables 6.23 and 6.24 show the unstandardized estimate of regression weights and
variances in the congeneric model of leadership-Japanese as representing all p values
at a significant level of 0.001.
157

6.3.11 Confirmation of the relationship-Thai construct
The initial model for the one-factor congeneric model of relationship-Thai was found
to show a very poor fit of the data to the model: p=0.000, Bollen-Stine bootstrap p=
0.005, CMIN/df=5. 785, RMR=0.116 TLI=0.845, CFI=0.923 and RMSEA=0.154.
Deleting the fourth item and correlating two error covariances, as suggested by the
modification indices and re-specifying the model, led to an excellent model fit:
p=0.494, Bollen-Stine bootstrap p= 0.418, CMIN/df=0.467, RMR=0.015 TLI=l.013,
CFI=l .000 and RMSEA=0.000. All remaining items loaded highly on this factor, as
factor loading ranged from a low of 0.52 to a high of 0.88 (see Figure 6.11 ) .
. 53
Relationship1
.27 .73
Relationship2
.36 Relationship
Relationship3
.78
Relationship5
Figure 6.11: Congeneric model of relationship-Thai
This congeneric model can be explained by mathematic formula as:
Relationship= relation] *O. 73+ relation2*0.52+ relation3*0.56+ relation5*0.88
Estimate S.E. C.R. p Label Relations<--- Relationship 1.000 Relation3 <---Relationship .697 .102 6.853 *** Relation2 <---Relationship .677 .105 6.454 *** Relation I <--- Relationship .942 .116 8.112 ***
Table 6.25: Regression weights of relationship-Thai construct
158

Estimate S.E. C.R. p Label Relationship 1.363 .220 6.187 *** eR5 .387 .146 2.647 .004 eR3 1.469 .164 8.936 *** eR2 1.667 .182 9.143 *** eRl 1.069 .164 6.517 ***
Table 6.26: Variances of relationship-Thai construct
Estimate S.E. C.R. p Label eR3<-->eR2 .566 .135 4.210 ***
Table 6.27: Covariances of relationship-Thai construct
The p values illustrated in Table 6.25 were significant at level 0.001, while the p value
of eR5 in Table 6.26 was a little high, but still acceptable at a significant level of 0.05.
The p value of covariance between eR3 and eR2 was also significant at level 0.001.
The item of relationship 5 could not be deleted as it had a very strong factor loading
which would affect the fit of the model.
6.3.12 Confirmation of the relationship-Japanese construct The one-factor congeneric model of the relationship-Japanese variable was tested.
Although the model initially had a poor fit, after deleting the fourth item as suggested
by the modification indices, the model was re-specified and an excellent fit of data to
the model was obtained: p=0.196, Bollen-Stine bootstrap p= 0.343, CMIN/df=l.631,
RMR=0.036 TLI=0.972, CFI=0.991 and RMSEA=0.067. All remaining items were
loaded on this factor, as the factor loading ranged from a low of 0.52 to a high of 0.79
(see Figure 6.12).
159

.44
Relationship 1
.62 .67
Relationship2
Relationship
Relationship3
.27
Relationship5
Figure 6.12: Congeneric model of relationship-Japanese
This congeneric model can be explained by mathematic formula as:
Relationship= relation] *0.67+ relation2*0. 79+relation3*0. 70+ relation5*0.52
Estimate S.E. C.R. p Label Relations<--- Relationship 1.000 Relation} <---Relationship 1.313 .255 5.144 *** Relation2 <---Relationship 1.483 .281 5.278 *** Relation 1 <---Relationship 1.125 .224 5.024 ***
Table 6.28: Regression weights of relationship-Japanese construct
Estimate S.E. C.R. p Label Relationship .327 .083 3.922 *** eRe5 1.010 .135 7.502 *** eRe3 .645 .109 5.928 *** eRe2 .502 .112 4.498 *** eRel .583 .091 6.422 ***
Table 6.29: Variances of relationship-Japanese construct
Table 6.28 represents the regression weights of relationship-Japanese constructs, with
significance of the p values at level 0.001. Table 6.29 also shows that variance of
relationship-Japanese construct had significance of the p values at 0.001.
160

6.3.13 Confirmation of the acceptance construct
An initial run for the one-factor congeneric model of acceptance revealed that the
model had been a bad fit. However, the model was a good fit to the data after
conducting the Bollen-Stine bootstrap where: p=0.021 , Bollen-Stine bootstrap
p =0.080, CMIN/df=3.854, RMR=0.035 TLI=0.943 , CFI=0.981 and RMSEA=0.119.
All remaining items loaded highly on this factor, as factor loading ranged from a low
of0.59 to a high of0.85 (see Figure 6.13) .
.42
Acceptance4
.73 .65
Acceptance3
.69 Acceptance
Acceptance2
.35
e- Acceptance1
Figure 6.13 : Congeneric model of acceptance
This congeneric model can be explained by mathematic formula as:
Acceptance= acceptance 1*O.5 9+ acceptance2 *O. 83 + acceptance] *O. 85 +
acceptance4 *O. 65
Estimate S.E. C.R. p Label Accept 1 <---Acceptance 1.000 Accept2 <---Acceptance 1.464 .175 8.368 *** Accept3 <---Acceptance 1.330 .158 8.415 *** Accept4 <--- Acceptance 1.037 .144 7.209 ***
Table 6.30: Regression weights of acceptance construct
161

Estimate S.E. C.R. p Label Acceptance .480 .111 4.325 *** eAl .891 .097 9.171 *** eA2 .456 .079 5.758 *** eA3 .316 .062 5.114 *** eA4 .719 .081 8.857 ***
Table 6.31: Variances of acceptance construct
All p values of regression weights and variances of the acceptance construct shown in
Tables 6.30 and 6.31 were significant at level 0.001.
6.3.14 Confirmation of the adaptation construct
While the initial model for the latent variable of adaptation resulted in a poor fit of the
model to the data, as a consequence of correlating two error covariances, the re
specified model indicated that the data was a good fit to the model: p=0.186, Bollen
Stine bootstrap p= 0.259, CMIN/df=l .746, RMR=0.011 TLI=0.988, CFI=0.998 and
RMSEA=0.073. All remaining items loaded highly on this factor, as factor loading
ranged from a low of0.68 to a high of0.91 (see Figure 6.14) .
.49
Adaptation1
.61 .46 .70
Adaptation2 .6
Adaptation
Adaptation3
.82
Adaptation4
Figure 6.14: Congeneric model of adaptation
This congeneric model can be explained in mathematic formula as:
Adaptation= adaptation] *O. 70+ adaptation2 *O. 68+ adaptation] *O. 88+
adaptation4*0.91
162

Estimate S.E. C.R. p Label Adapt4 <---Adaptation 1.496 .167 8.985 *** Adapt3 <---Adaptation 1.475 .165 8.965 *** Adapt2 <---Adaptation 1.000 Adapt I <---Adaptation 1.063 .088 12.0 I 0 ***
Table 6.32: Regression weights of adaptation construct
Estimate S.E. C.R. p Label Adaptation .639 .146 4.378 *** eAd4 .314 .095 3.313 *** eAd3 .399 .097 4.114 *** eAd2 .737 .099 7.479 *** eAdl .763 .103 7.406 ***
Table 6.33: Variances of adaptation construct
Estimate S.E. C.R. p Label eAd2 <--> eAd 1 .459 .085 5.387 ***
Table 6.34: Covariances of adaptation construct
Regression weights of the adaptation construct represented in Table 6.32 were all
significant at 0.001, as were the variances and covariance of the adaptation construct.
6.4 Structural models: Development empirical analysis of the model
of Japanese management acceptance and adaptation
Structural model is defined as "the portion of the model that specifies how the latent
variables are related to each other" (Arbuckle 2005 p.90). Similarly, Byrne (1989)
states that a structural model aims to specify which latent variables directly or
indirectly influence the values of other latent variables in a model. In this research,
once all latent variables in the measurement model were validated and a satisfactory
fit accomplished, the structural models were tested and presented as a second stage.
The SEM technique is especially useful when one has multiple indicators for the
latent variables under investigation, as has been the case in this research. The purpose
163

of this stage was to examine relationships through determining the significant paths
between the latent variables.
In a path diagram, manifest variables are presented in a rectangular shape. In this
research, these variables are presented as scale items. The variables for errors are
enclosed in circles to signify that they are unmeasured variables. The single-headed
arrows in the diagram stand for causal paths. For example, the arrow leading from
vision to adaptation in Figure 6.15 implies that the adaptation depends on vision. The
double-headed .arrows illustrate correlations or covariances. An important requirement
in linear regression is that error variables are assumed to be not correlated with any
other predictor variable. Predictor variables such as vision, leader, structure, resources
support, reward, and relationship, are referred to as exogenous, while criterion
variables (e.g. adaptation and acceptance) are referred to as endogenous. All
endogenous variables have at least one single-headed path going into them whereas
exogenous variables have only single-headed path going out from them. The error
terms represent random fluctuations that have occurred due to measurement error in
the variables they are attached to. The measurement errors can sometimes be
correlated to each other by the double-headed arrow (Byrne 2001 , p. 186).
In the output presented (Tables 6.37 & 6.41 in Section 6.6), non-standardized
regression weights are displayed under the heading of Maximum Likelihood Estimate.
In Table 6.37, the S.E. column is an estimate of standard error of the regression, and
the C.R. column is the critical ratio (an observation of a random variable that has
approximate standard distribution). Utilizing a significance level of 0.05, any critical
ratio that exceeds 1.96 in magnitude is significant (Byrne 2001). In this study, critical
ratios associated with the latent mean estimates were reported, following Kaplan ' s
(2000) and Kline's (2005) recommendation that once the research model fits to the
data, it is important to interpret parameter estimates and critical ratios for specific
effects.
After all the congenenc one-factor models had been tested, the initial proposed
models of Japanese management acceptance and adaptation (see Figures 6.15 and
6.16) were tested in AMOS 7. However, these two models were not able to be tested
as the AMOS program indicated that the sample moment matrix was not positively
164

definite. Another possibility for this is related to the multivariate non-normality issue.
As discussed in Chapters 4 and 5, structural equation modelling requires variables to
be normality distributed, but the results of multivariate normality showed that most of
the variables were multivariate non-normality. This could increase some problems
when performing the full model in structural equation modelling using AMOS.
1 ~----~
1
Vision1
Vision3
Vision4
Visions
Leadership4
Leaderships
ResourceSupport1
ResourceSupport2
ResourceSupport3
ResourceSupport4
Rewards1
Rewards2 Rewards3
Rewards4
RewardsS
Structure2
Structure3
Structure4
Structures
Relationship1
Relationship2
Relationship3
Relations hipS
Vision
Resource support
Rewards
1 Acceptance1
1 Acceptance2
1 Acceptance3 3
~
Figure 6.15: Proposed model of Japanese management acceptance
The reconfigured model of Japanese management acceptance was tested usmg
AMOS. However, this program indicated that the sample moment matrix was not
positive definite. Therefore, a composite factor model technique was requested to
develop the model.
165

1
1
Vision
otivation Rewards
1
Figure 6.16: Proposed model of Japanese management adaptation
1
The model of Japanese management adaptation was also tested usmg AMOS.
However, as before, the program · indicated that the sample moment matrix was not
positive definite. Hence, a composite factor model technique was requested to
develop the model. This model is discussed in the following section.
6.5 Composite factor model
Given that the model of Japanese management acceptance and adaptation could not be
tested, the researcher decided to use a composite factor approach to deal with this
problem using following reasons: firstly it is widely accepted and used in many
management researches (e.g. Luthans et al. 2007; Turner 2007; Houghton et al. 2004;
Hair et al. 2003; Holmes-Smith & Rowe 1994); and secondly, it has been suggested
by Holmes-Smith and Rowe (1994), Hair et al. (2003), and Hughes, Price, and Marrs
166

(1986) that composite factor measurement models can reduce the complexity of the
model and reduce the number of returns required for a reliable model.
Composite variables which are referred to as item parceling, have a number of
advantages over the use of individual scale items as indicators of latent variables
(Turner 2007). A composite factor approach can improve reliability over individual
items leading to: less biased estimates of parameters and better model fit; reduced
effects of non-normality (Holt 2004; Bandalos 2002; Bandalos & Finney 2001),
parsimony (Bandalos & Finney 2001 ); and the ability to use smaller samples (Taylor,
Celuch & Goodwin 2004). On the other hand, the penalty for this approach is the loss
of detail on individual constructs which the composite variable reasonably depends
upon (Taylor, Celuch & Goodwin 2004).
The creation of composite variables is achieved by combining scores of two or more
items on a unidimensional scale. The factors of vision, leadership, resources support,
reward, structure and relationship were used to calculate composite variables for use
in developing and testing the structural model. In structural modelling, factor scores
are defined as latent variables. The method for calculating latent variables has been
outlined in Chapter 4.
The composite variables were also determined using the method outlined in Chapter
4, and the component questions utilized for these computings are listed in Table 6.3S
and 6.36.
Factor Components name VisionX Vl, V3, V4, VS
LeaderX I Ll, L2, L3, LS
ReSSX ) Rel, Re2, Re3, Re4
StructureX I S2, S3, S4, S5
RewardX I RI' R2, R3, R4, RS
RelationX I RI I, R12, RI3, RIS
Table 6.36: Structure of composite variables (Thai)
167
Factor Components name VisionY Vl,V2, V3, V4, VS
LeaderY I LI, L2, L3, LS
ReSSY ) Rel, Re2, Re3, Re4
StructureY I SI, S2, S4, SS
RewardY I RI, R2, R3, R4, RS
RelationY I RI!, Rl3, Rl4, RIS
Table 6.35: Structure of composite variables (Japanese)

6.6 Development of the Japanese management acceptance model
Once composite variables were achieved, a new model of Japanese management
acceptance was achieved. This is presented in the following Figure 6.17.
VisionX l ~-[\
\ \
~-L_e_a_d_e_rx _ _ l ' ReSSX 1 ~.
Acceptance1 z
'·--- -1 ___ 1 __ _____ Acceptance
Acceptance2
StructureX
Acceptance3
RewardsX \
~ RelationX
Figure 6.17: Composite model of Japanese management acceptance
This model of Japanese Management Acceptance was tested. However, the result still
showed that the data did not fit the model: p=0.000, Bollen-Stine bootstrap p= 0.005 ,
CMIN/df=32.502, RMR=0.304, TLI=0.147, CFI=0.318 and RMSEA=0.476 (see
Figure 6.18 below). Modifications were required for the model to improve the fit.
VisionX ~\ \
\ -.07 .78
~4 LeaderX Acceptance1
~\ .88
ReSSX _67
Acceptance2
\ .78 .60 StructureX \
~3', \ Acceptance3 I ·~/
\ I .66 RewardsX I _94 .81
Geptance4 I / ~·~ e4 I
L RelationX rl
Figure 6.18: Model of Japanese management acceptance
168

The modification indices indicated that the latent variables of VisionX, LeaderX,
ReSSX, StructureX, RewardsX, and RelationX needed to be related. Two error
covariances also needed to be correlated to improve fit of the model to the data. Thus,
covariances between these latent variables were drawn (Figure 6.19).
VisionX
-.04
.79
-· Acceptance1 ,~)
LeaderX
ReSSX .62
Acceptance2
StructureX .50
Acceptance3
.57 "1 .56 / RewardsX
.84 1.05 Acceptance4 :~
RelationX
Figure 6.19: Re-specified model of Japanese management acceptance
The model of Japanese management acceptance was tested again after six covariances
were drawn but the model still had a poor fit: p=0.000, Bollen-Stine bootstrap p=_
0.005, CMIN/df=2.590, RMR=0.102, TLI=0.957, CFI=0.971 and RMSEA=0.107.
The modification indices indicated that some exogenous variables had directly
influenced the endogenous variables. The modification suggested that VisionX and
LeaderX needed to be crrelated. ReSSX and StructureX had a relationship. RewardsX
and RelationX needed to be related. VisionX had a direct influence to Acceptance 4.
RewardsX and RelationX also had directive influences to Acceptance I and 2. Lastly
e3 and e4 also needed to be corrected. Therefore, the model was developed again with
directive influences from exogenous variables to endogenous variables as presented in
Figure 6.20 below.
169

VisionX
.97 -.10 .81
LeaderX Acceptance1
ReSSX .75
.98
StructureX
RevvardsX .62 .51
.84 Acceptance4
RelationX
Figure 6.20: Final model of Japanese management acceptance
Finally, the model of Japanese management acceptance produced a good fit of the
data to the model after six directive paths and four covariances were drawn: p=0.216,
Bollen-Stine bootstrap p= 0.299, CMIN/df=l .202, RMR=0.073, TLI=0.995,
CFI=0.997, and RMSEA=0.038.
Notes for Model:
Computation of degrees of freedom
Result
Number of distinct sample moments: 55
Number of distinct parameters to be estimated: 28
Degrees of freedom (55 - 28): 27
Minimum was achieved
Chi-square= 32.451
Degrees of freedom= 27
Probability level =0.216
170
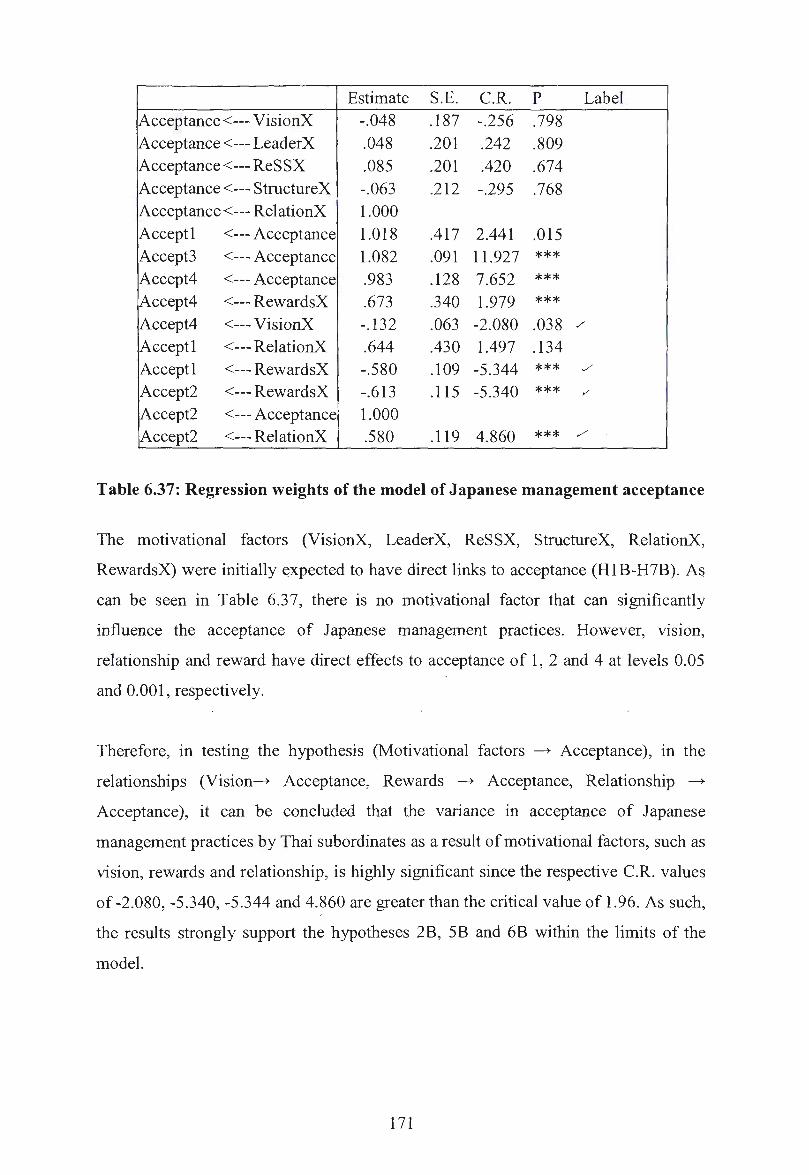
Estimate S.E. C.R. p Label Acceptance <--- VisionX -.048 .187 -.256 .798 Acceptance <--- Leader X .048 .201 .242 .809 Acceptance <--- ReSSX
' .085 .201 .420 .674
Acceptance <--- StructureX -.063 .212 -.295 .768 Acceptance <--- RelationX 1.000 Acceptl <--- Acceptance 1.018 .417 2.441 .015 Accept3 <---Acceptance 1.082 .091 11.927 *** Accept4 <---Acceptance .983 .128 7.652 *** Accept4 <--- RewardsX .673 .340 1.979 *** Accept4 <--- VisionX -.132 .063 -2.080 .038 ./
Acceptl <--- RelationX .644 .430 1.497 .134 Acceptl <--- RewardsX -.580 .109 -5.344 *** /
Accept2 <--- RewardsX -.613 .115 -5.340 *** ,/
Accept2 <---Acceptance 1.000 Accept2 <--- RelationX .580 .119 4.860 *** ./
Table 6.37: Regression weights of the model of Japanese management acceptance
The motivational factors (VisionX, LeaderX, ReSSX, StructureX, RelationX,
RewardsX) were initially expected to have direct links to acceptance (HlB-H7B). As
can be seen in Table 6.37, there is no motivational factor that can significantly
influence the acceptance of Japanese management practices. However, vision,
relationship and reward have direct effects to acceptance of 1, 2 and 4 at levels 0.05
and 0.001, respectively.
Therefore, in testing the hypothesis (Motivational factors - Acceptance), in the
relationships (Vision- Acceptance, Rewards - Acceptance, Relationship -
Acceptance), it can be concluded that the variance in acceptance of Japanese
management practices by Thai subordinates as a result of motivational factors, such as
vision, rewards and relationship, is highly significant since the respective C.R. values
of -2.080, -5.340, -5.344 and 4.860 are greater than the critical value of 1.96. As such,
the results strongly support the hypotheses 2B, SB and 6B within the limits of the
model.
171

Estimate S.E. C.R. p Label RelationX <--> RewardsX .660 .087 7.598 *** ReSSX <--> S tructureX 1.015 .123 8.258 *** VisionX <--> LeaderX .832 .101 8.228 ***
,1e3 <--> e4 .360 .081 4.475 ***
Table 6.38: Covariances of the model of Japanese management acceptance
All the covariances of the model of Japanese Management Acceptance in Table 6.38
were significant at level 0.001. This indicates that the constructs and error
measurements mentioned in Table 6.38 need to be correlated.
Estimate S.E. C.R. p Label VisionX .914 .110 8.337 *** LeaderX .797 .096 8.337 *** ReSSX 1.091 .131 8.337 *** StructureX .980 .118 8.337 *** RelationX .757 .091 8.337 *** RewardsX .810 .097 8.337 *** z .108 .045 2.374 .018 el .289 .064 4.476 *** e2 .338 .058 5.847 *** !
e3 .771 .106 7.251 *** e4 .651 .090 7.239 ***
Table 6.39: Variances of the model of Japanese management acceptance
Most of variances in Table 6.39 were significant at level 0.001, except the variance of
Z which was significant at level 0.05.
172

Variable mm max skew c.r. kurtosi s c.r. RewardsX 2.600 6.800 -.215 -1.038 -.376 -.909 RelationX 2.600 7.000 -.176 -.850 -.156 -.376 StructureX 3.000 7.000 .450 2.176 -.713 -1.722 ReSSX 3.000 7.000 .459 2.219 -.768 -1.854 LeaderX 2.600 7.000 -.423 -2.042 -.041 -.100 VisionX 2.400 7.000 -.370 -1.789 -.232 -.561 Accept4 2.000 7.000 -.352 -1.702 -.623 -1.505 Accept3 2.000 7.000 -.333 -1 .607 -.636 -1.53 7 Accept2 2.000 7.000 -.300 -1.451 -.667 -1.61 1 Accept I 1.000 7.000 -.783 -3.781 .983 2.374 Multivariate 18.046 6.891
Table 6.40: Assessment of normality of the model of Japanese management acceptance
Table 6.40 shows that the multivariate kurtosis normality of the model of Japanese
management acceptance was greater than 8, which indicated multivariate non
normality. The multivariate non-normality problem was resolved using the Bollen
Stine' s bootstrap to increase the p value.
The model of Japanese management acceptance can be formally illustrated m a
mathematical form as shown in Figure 6.21 below.
Endogenous = Exogenous Variables + Endogenous Variables +Error · Variable VisionX LeaderX ReSSX StructureX Acceptance Acceptance I
RewardX RelationX Acceptance2 Acceptance3 Acceptance4
Acceptance = (-0.05*VisionX) + (0.05* LeaderX) + +Z (0.1 O*ReSSX) + (-0.07*StructureX) + (0.94* RelationX)
Acceptance I = (-0.43 *RewardY) + (0. 11 *Relation Y) + (0.78* Acceptance) +e l
Acceptance2 = (-0.47* RewardY) + (0.46*RelationY) + (0.80* Adaptation) +e2
Acceptance3 + (0.75* Adaptati on) +e3
Acceptance4 = (-0.1 O*VisionX) + (0.43* Reward ) + (0.69* Adaptation) +e4
Figure 6.21: Translation of model of Japanese management acceptance into structural equation
173
e

6.7 Development of the Japanese management adaptation model
As discussed in Section 6.3 , composite variables for the model of Japanese
management adaptation were achieved (see in Figure 6.22).
VisionY
LeaderY Adaptation1
1
ReSSY ~---~ 1 ~ -, Adaptation2 __, e2)
StructureY
RewardsY 1 Adaptation4
RelationY
Figure 6.22: Composite model of Japanese management adaptation
From the above model 6.22, a new model of Japanese management acceptance was
tested as presented in the following Figure 6.23 :
VisionY
.79 LeaderY
Adaptation1 .89
.75 ReSSY
Adaptation2
StructureY .68 .46
-~ .51
RewardsY Adaptation4
RelationY
Figure 6.23: Model of Japanese management adaptation
174

However, when this model of Japanese management adaptation was tested, results
indicated that the data did not fit the model: p=0.000, Bollen-Stine bootstrap p=0.005 ,
CMIN/df=33 .508, RMR=0.298, TLI=0.193 , CFI=0.355 and RMSEA=0.484. (see to
Figure 6.23). Therefore, the model required some modifications to improve the fit to
the data.
The modification indices indicated that latent variables ofVisionY, LeaderY, ReSSY,
StructureY, RewardsY, and RelationY needed to be correlated. Two error covariances
also needed to be linked to improve the fit of the model to the data. Adaptation 2 was
required to be deleted. Thus, covariances between these latent variables were drawn,
and one measurement item was deleted as shown in Figure 6.24 following .
. 51
RewardsY Adaptation4 ~~~/,A ~----1
RelationY
Figure 6.24: Re-specified model of Japanese management adaptation
The model of Japanese management adaptation was tested again after eight
covariances were drawn and one measurement item was deleted; however, the model
still had a poor fit: p=0.000, Bollen-Stine bootstrap p=0.005, CMIN/df=3.712,
RMR=0.099, TLI=0.938, CFI=0.961 and RMSEA=0.140. The modification indices
indicated that some exogenous variables had direct paths to endogenous variables.
The modification suggested that Vision Y had directive influences to Adaptation 1, 3,
175

and 4. RewardsY had had a directive influence to Adaptation 4 as well as RelationY
had a directive influence to Adaptation 1.
Therefore, the model was again modified by drawing the directive influences from
exogenous variables to endogenous variables as presented in Figure 6.25.
VisionY
RelationY
Figure 6.25: Final model of Japanese management adaptation
Finally, the model of Japanese management adaptation had a good fit of the data to
the model after five directive paths and eight covariances were drawn: p=0.557,
Bollen-Stine bootstrap p=0.602, CMIN/df=0.971, RMR=0.058, TLI=l.001 ,
CFI=l.000 and RMSEA=0.000.
Notes for Model
Computation of degrees of freedom
Result
Number of distinct sample moments: 45
Number of distinct parameters to be estimated: 28
Degrees of freedom (45 - 28): 17
Minimum was achieved
Chi-square = 16.499
Degrees of freedom = 1 7
Probability level = 0.489
176

Estimate S.E. C.R. p Label Adaptation <--- Relation Y 1.000 Adaptation <--- RewardsY .088 .157 .559 .576 Adaptation <--- StructureY .112 .218 .511 .609 Adaptation <--- ReSSY -.097 .208 -.465 .642 Adaptation <---LeaderY -.098 .168 -.585 .559 !Adaptation <--- Vision Y .010 Adaptl <---Adaptation 1.000 Adapt3 <---Adaptation .600 .115 5.204 *** Adapt4 <---Adaptation .604 .107 5.645 *** ,Adapt3 <---Vision Y .538 .120 4.503 *** Adaptl <---Relation Y . .347 .054 6.473 *** Adapt I <---Vision Y -.048 .187 -.256 .798 Adapt4 <---Rewards Y -.135 .063 -2.147 .032 Adapt4 <---Vision Y .566 .111 5.099 ***
Table 6.41: Regression weights of the model of Japanese management adaptation
The motivational factors (VisionY, LeaderY, ReSSY, StructureY, RelationY,
RewardsY) were initially predicted to have direct influence on acceptance (HlA-
. H7 A). As shown in Table 6.41, although there is no motivational factor that can
significantly influence adaptation, vision, relationship and reward, they have direct
effects on adaptation 1, 3 and 4 at 0.001 and 0.05 level, respectively. Hence, in testing
the hypothesis (Motivational factors ----+ Adaptation), in the relationships (Vision---+
Adaptation, Rewards----+ Adaptation, Relationship----+ Adaptation), it can be concluded
that the variance in adaptation of Japanese management practices by Japanese
managers as a result of motivational factors such as vision, rewards and relationship,
is highly significant since the respective C.R. values of 4.503, 6.473, -3.994, 5.099
and -2.14 7 are greater than the critical value of 1.96. As such, the results strongly
support that hypotheses 2A, SA and 6A are within the limits of the model.
177

Estimate S.E. C.R. p Label VisionY <--> Relation Y .612 .090 6.803 *** LeaderY <--> StructureY .151 .071 2.135 .033 LeaderY <--> ReSSY .144 .074 1.956 .050 StructureY <--> ReSSY .832 .101 8.228 *** LeaderY <--> Rewards Y .849 .103 8.23 I *** ReSSY <-->Rewards Y ' .155 .079 1.967 .049 StructureY <--> RewardsY .162 .076 2. 147 .032 e3 <--> e4 .421 .076 5.545 ***
Table 6.42: Covariances of the model of Japanese management adaptation
The covariances of the model of Japanese management adaptation in Table 6.42 were
all significant at levels of 0.001 and 0.05. This implies that all the constructs and error
measurements in Table 6.42 need to be linked to improve the model fit to the data.
Estimate S.E. C.R. p Label VisionY .841 .101 8.337 *** RelationY .892 .107 8.337 *** LeaderY .816 .098 8.340 *** StructureY .874 .013 69.4 I 3 *** ReSSY .954 .014 69.413 *** RewardsY .932 .112 8.340 *** z .289 .064 4.476 *** el .172 .050 3.421 *** e3 .823 .100 8.216 *** e4 .711 .087 8.176 ***
Table 6.43: Variances of the model of Japanese management adaptation
All variances of the model of Japanese management adaptation were significant at
level 0.001.
178

Variable mm max skew c.r. kurtosis c.r.
RewardsY 2.316 7.000 -.340 -1.644 -.303 -.731 ReSSY 3.000 7.000 .463 2.238 -.754 -1.821 StructureY 3.000 7.000 .463 2.235 -.724 -1.749 LeaderY 2.479 7.000 -.455 -2.196 .025 .062 RelationY 2.152 7.000 -.423 -2.043 .143 .345 VisionY 2.547 6.785 -.261 -1.261 -.287 -.692 Adapt4 2.000 7.000 -.352 -1.702 -.623 -1.505
, Adapt3 2.000 7.000 -.333 -1.607 -.636 -1.537 Adaptl 1.000 7.000 -.783 -3.781 .983 2.374 Multivariate 11.144 4.686
Table 6.44: Assessment of normality of the model of Japanese management
adaptation
The multivariate kurtosis normality of the model of Japanese management acceptance
shown in Table 6.44 was greater than 8, which indicated multivariate non-normality.
Therefore, Bollen-Stine's bootstrap was conducted to deal with the multivariate non
normality problem of the model. The resulting model of Japanese management
adaptation can be formally illustrated in mathematical form as shown in Figure 6.26.
Endogenous = Exogenous Variables +Endogenous Variables +Error Variable VisionY LeaderY ReSSY StructureY Adaptation Adaptation 1
RewardY Relation Y Adaptation3 Adaptation4
Adaptation = (0.01 *VisionY) + (-0.09* LeaderY) + +Z (-0.1 O*ReSSY) + (0.11 *StructureY) + (0.09* RewardY) + (0.99* Relation Y)
Adaptation 1 = (-0.17*RewardY) + (0.27*Relation Y) + (0.78* Adaptation) +el
Adaptation3 = (0.37*VisionY) + (0.43* Adaptation) +e3
Adaptation4 = (0.39*Vision Y) + (-0. IO*RewardY) + (0.44* Adaptation) +e4
Figure 6.26: Translation of model of Japanese management adaptation into
structural equation.
179
e

6.8 Summary
The overall objective of this chapter has been to determine support for the
hypothesized models by statistically testing them. The choice of SEM as the main
technique used to test the hypothesized models has also been discussed. Hence, SEM
was implemented in two stages including measurement models and structural models,
and motivational factors were found to have some relationship with the adaptation and
acceptance of Japanese management practices. These findings suggest that vision,
rewards and relationship have significant effects on the adaptation and acceptance of
Japanese management practices. Significance of the theoretical and practical
implications of these findings is discussed in the following Chapter 7.
180

Chapter 7 Discussion and implications
7.1 Introduction
The objective of this chapter is to show the results of hypotheses testing and discuss
significant theoretical and practical implications of the findings. In Chapter 6, two
models, one of Japanese management acceptance and one of Japanese management
adaptation suited to influencing Thai subordinates to accept such management
practices, were developed. These models illustrate the motivational factors that
influenced both Thai subordinates and Japanese managers to accept and adapt
practices suited to their new cross-cultural work environment in Thailand. In this
chapter, the relationship between Japanese management acceptance and adaptation
and motivational factors, including vision, rewards, relationship, structure, leadership
and resources support are discussed. The significant theoretical and practical
implications of the findings are also provided.
This chapter has seven subsections. Section 7 .1 summanses the objectives of the
chapter and outlines what will be covered in the subsections. Section 7 .2 discusses the
results of descriptive statistics in Chapter 5. Section 7 .3 provides the results of
hypotheses testing; the results of all fourteen hypotheses are also discussed and
summarized. Section 7.4 provides the significant theoretical and practical implications
of the findings. The relationship between Japanese management adaptation and
acceptance and each motivational factor are also discussed, along with the theoretical
support from Chapters 2 and 3. Section 7.5 discusses ways to achieve efficient cross
cultural business management in Thailand. Section 7 .6 shows the results of the study,
comparing them with pervious studies in the field. Finally, section 7.7 summaries the
materials discussed in the previous sections.
181

7 .2 Descriptive statistic results
In Chapter 5, descriptive statistics were conducted to describe basic features of the
data used in this study. Based on six demographic questions and six questions of
Japanese management practices, results of findings from the survey questionnaire are
discussed below.
Firstly, demographic responses to questions asked respondents about their employee
background, and results of the findings indicate that Japanese expatriates were aged
between 41 and 45. Surprisingly, the numbers of male Japanese expatriates were a
much higher than the female Japanese expatriates (98.6% male-1.4% female). Their
positions mostly included senior manager or executive (96.4%), and their working
experience was in a range of 10 to 25 years (93%). According to descriptive statistics
results, it can be concluded that the sample group of Japanese expatriates in this study
represent the whole population.
Thai employees were also asked to provide their background information. Their
results showed that over 60 percent of Thai employees were aged between 26 and 35,
and that there were more males than females (69.1 % male & 30.9% female). Their
positions were mainly first line supervisor and junior manager (over 60%), and their
working experience was in a range of 2 to 10 years (72.6% ). These results indicated
that the sample group of Thai employees in this study represents the whole
population.
Thai employees and Japanese expatriates were also asked the extent to which
Japanese management practices had been implemented in Thailand. The results of
these findings showed that lifetime employment, consensus decision-making,
seniority system, house union, job rotation and quality control circles had been
existent and frequently implemented in Thailand. These results pointed to supporting
the main research purpose, that the adaptation and acceptance of Japanese
management practices are significantly required due to the fact that the current
Japanese management practices are inappropriate to Thai culture (William & Onishi
2003; McCampbell et al. 1999; Adams & Vernon 1998; Sedgwick 1995) (refer to
Chapterl and 2).
182

7 .3 Hypotheses testing
Based on the research questions 1 and 2 (see Chapter 1), the fourteen Hypotheses
developed in Chapter 3 are tested in this section. To test these hypotheses, structural
equation modelling (SEM) was used to examine the relationships between
motivational factors and the adaptation of Japanese management practices for the
selected group of Japanese managers in Thailand, and the relationships between
motivational factors and acceptance of Japanese management practices for the
selected group of Thai subordinates.
7.3.1 Hypothesis H1A-H7A
Research question one asked:
• What are the motivational factors that can influence Japanese managers to
adapttheir Japanese management practices to be apposite to Thai culture?
The results of hypotheses testing are presented as follows:
Hypothesis HJA: vision is a positive influential factor for Japanese managers to adapt
Japanese management practices. (VisionY--+Adaptation)
According to Table 6.41 in Chapter 6, vision had a direct positive relation with
adaptation 3 and 4 at 0.001 significant level. This result indeed supports hypothesis
HlA, which means that vision is a motivational factor that positively influences
Japanese managers to adapt their management practices. Thus hypothesis H 1 A has
been accepted.
Hypothesis H2A: leadership is a positive influential factor for Japanese managers to
adapt Japanese management practices. (Leadership--+ Adaptation)
This result indicated that leadership had a relationship with the adaptation of Japanese
management practices; however, it was only a slight relationship and was therefore
deemed as not significant. It could be said that leadership was a factor that influenced
183

the adaptation of Japanese management practices, but it was not a positive and
significant influential factor. Therefore, hypothesis H2A was rejected.
Hypothesis H3A: structure is a positive influential factor for Japanese managers to
adapt Japanese management practices. (Structure~ Adaptation)
Based on the result shown in Table 6.41 in Chapter 6, the structure of adaptation
process was not a significant factor that influenced the adaptation of Japanese
management practices, although it has a positive link to the adaptation. Hence,
hypothesis H3A was rejected.
Hypothesis H4A: reward is a positive influential factor for Japanese managers to adapt
Japanese management practices. (Reward~Adaptation)
Reward was a significant factor that influenced the adaptation of Japanese
management practices at 0.05 significant level; however, it was a negative influential
factor. Thus, hypothesis H4A was rejected.
Hypothesis H5A: relationship is a positive influential factor for Japanese managers to
adapt Japanese management practices. (Relationship~Adaptation)
The results presented in Table 6.41 in Chapter 6 indicate that relation_ship had a direct
positive to adaptation 1 at 0.001 significant level. This means that relationship was a
positive influential factor for Japanese managers to adapt their management practices.
Therefore, the hypothesis HSA was accepted.
Hypothesis H6A: resources support is a positive influential factor for Japanese
managers to adapt Japanese management practices. (Resources support~ Adaptation)
Although the Figure 6.25 in Chapter 6 shows that Resources support had a link to
adaptation, it was a negative influential factor and not deemed as a significant factor
at 0.001 and 0.05 levels. Thus hypothesis H6A was rejected.
184

Hypothesis H7A: at least one of six factors is an effective factor that positively
influences Japanese managers to adapt Japanese management practices. (Motivational
factors---+ Adaptation)
From the hypothesis HIA to H6A, vision and relationship were found to be positive
influential factors at the significant level of 0.001, thus suitable for Japanese managers
to adapt into their Japanese management practices. Therefore, hypothesis H7 A was
accepted.
7.3.2 Hypothesis H1B-H7B
Research question two asked:
• What are the motivational factors that can influence Thai subordinates to
accept Japanese management practice?
The results of hypotheses testing are presented as follows:
Hypothesis . HJB: v1s10n 1s a positive influential factor for Thai subordinates to
implement Japanese management practices.
Based on the results shown in Table 6.3 7 in Chapter 6, v1s10n was a negative
influential factor for Thai subordinates to accept Japanese management practices at
0.05 significant level. Hence, hypothesis HI B was rejected. ·
Hypothesis H2B: leadership is a positive influential factor for Thai subordinates to
implement Japanese management practices.
Leadership was a positive influential factor for Thai subordinates to implement
Japanese management practices; however it was not a significant factor at levels
0.001 and 0.05. Thus, hypothesis H2B was rejected.
Hypothesis H3B: structure is a positive influential factor for Thai subordinates to
implement Japanese management practices.
185

Results showed that structure was not a positive influential factor for Thai
subordinates to implement Japanese management practices, and it was also not
significant at levels 0.001 and 0.05. Therefore hypothesis H3B was rejected.
Hypothesis H4B: reward is a positive influential factor for Thai subordinates to
implement Japanese management practices.
As shown in Table 6.37 in Chapter 6, reward had direct positive relationships with
acceptances 3 and 4. This result indicated that the reward factor was a positive
influential factor for Thai subordinates to implement Japanese management practices
at a significant level of 0.001. Hence, hypothesis H4B was accepted.
Hypothesis HSB: relationship is a positive influential factor for Thai subordinates to
implement Japanese management practices.
Figure 6.20 in Chapter 6 showed that the relationship factor had a direct positive link
to acceptance 2, and as shown in Table 6.37, the relationship factor was significant at
level 0.001. Therefore, hypothesis H5B was accepted.
Hypothesis H6B: resources support is a positive influential factor for Thai
subordinates to implement Japanese management practices.
Although the resources support factor had a positive link to acceptance of Japanese
management practices, it was not significant at levels 0.001 and 0.05 as shown in
Table 6.37 in Chapter 6. Thus, hypothesis H6B was rejected.
Hypothesis H7B: at least one of six factors is an effective factor that positively
influences Thai subordinates to implement Japanese management practices.
Based on the results presented in Table 6.37 in Chapter 6, reward and relationship
factors were positive influential factors for Thai subordinates to implement Japanese
management practices at a significant level of 0.001 of. Therefore, the hypothesis
H7B was accepted.
186

The results of research in this thesis suggest that adaptation and acceptance of
Japanese management practices are genuinely related to motivational factors
(particularly vision, rewards, and relationship). Based on the theory of reasoned action
by Ajzen and Fishbein (1980), beliefs of a person can influence attitude and subject
norms and reflect on behavioural intention, and therefore the person' s behaviour. In
other words, an action or behaviour of a person depends on the intention which comes
from the attitude of that person towards a future outcome. Results of the present
research suggest that adaptation and acceptance of Japanese management practices
can be created via the use of motivational factors. In agreement with Ajzen and
Fishbein (1980), intentions are assumed to capture the motivational factors that
influence a behaviour; they are indications of how hard people are willing to try and
of how much effort they are willing to exert in order to perform the behaviour.
Consistent with this statement, results of the present research confirm links between
the six motivational factors and adaptation of Japanese management practices in one
model, and the same factors with acceptance of such practises in another model.
These results are also in agreement with the few studies that relied on the theory of
reasoned action for developing hypotheses about relationships among the
motivational factors of vision, leadership, rewards, resources support, structure and
relationship (e.g. Lin 2007; Lok & Crawford 2000; Abraham, Crawford & Fisher
1999) and the adaptation and acceptance of Japanese management practices .
In this study, Figures 6.20 and 6.25 in Chapter 6 show that certain motivational
factors have played a determining role in the acceptance and adaptation of Japanese
management practices. Specifically, organizations that provide a clear vision of
adaptation and acceptance, rewards for adaptation and acceptance, and good
relationships among employees, have greater likelihoods of developing higher levels
of adaptation and acceptance of Japanese management practices.
As shown in Figure 6.25 in Chapter 6, all the motivational factors had some relations
to the adaptation of Japanese management practices; however, only vision and good
relationship were significant at level 0.001 (see Table 7.1). Therefore, it can be stated
that clear vision and good relationships were very important in influencing Japanese
managers to adapt their management practices.
187

Hypotheses Effect Hypothesis accepted
Model of Japanese Management Adaptation
Vision Y-Adaptation Direct effect H 1 A: vision is a positive influential factor for Japanese managers to adapt Japanese management 1) 0.538*** '1 practices. Vision Y -Adaptation3)
12) 0.566*** , Vision Y __,. Adaptation4)
LeaderY -->Adaptation H2A: leadership is a positive influential factor for
Not sig. x Japanese managers to adapt Japanese management practices. Structure Y-Adaptation H3A: structure is a positive influential factor for
Not sig. x Japanese managers to adapt Japanese management practices. RewardsY-Adaptation Direct effect H4A: reward is a positive influential factor for x Japanese managers to adapt Japanese management 1) -0.135** [negative effect] practices. Rewards Y-Adaptation4)
Relation Y-Adaptation Direct effect H5A: relationship is a positive influential factor for '1 Japanese managers to adapt Japanese management 1) 0.347*** practices. (Relation Y--> Adaptation I) ReSSY-Adaptation H6A: resources support is a positive influential
Not sig. x factor for Japanese managers to adapt Japanese management practices. Motivational· factors-Adaptation Direct effect
' H7 A: at least one of six factors is an effective factor that positively influences Japanese managers to adapt 1) 0.538*** Japanese management practices. (Vision Y __,. Adaptation3)
'1 12) 0.566*** (VisionY -->Adaptation4)
~) 0.347*** (Relation Y __,.Adaptation 1)
Notes: ***significant at the 0.001 level (one-tailed) ** significant at the 0.05 level (one-tailed) '1 Hypothesis accepted x Hypothesis rejected
Table 7.1 : Hypotheses testing for Hl A-H7 A
Although vision, leadership, structure, and resources support had some slight links to
the acceptance of Japanese management practices (see Figure 6.20), they were not
significant factors in the context of Japanese manufacturing organizations in Thailand.
On the other hand, good relationships and rewards for the acceptance of Japanese
management practices were significant at level 0.001, as shown in Table 7 .2.
Therefore it can be concluded that good relationships and rewards are motivational
188

factors that could influence Thai subordinates to accept and implement Japanese
management practices. Therefore, hypotheses H4B, HSB and H7B were accepted.
Hypotheses Effect Hypothesis accepted
Model of Japanese Management Acceptance
VisionX-+ Acceptance Direct effect H 1 B: vision is a positive influential factor for Thai x subordinates to implement Japanese management 1) - 0.132**[negative effect] practices. (VisionX-+ Acceptance4) Leader X-+ Acceptance H2B: leadership is a positive influential factor for
Not sig. x Thai subordinates to implement Japanese management practices. StructureX-+ Acceptance H3B: structure is a positive influential factor for
Not sig. x Thai subordinates to implement Japanese management practices. RewardsX-+ Acceptance Direct effect H4B: reward is a positive influential factor for '1 Thai subordinates to implement Japanese 1) 0.673 ***[positive effect] management practices. (RewarsX-+ Acceptance4) RelationX-+ Acceptance Direct effect HSB: relationship is a positive influential factor '1 for Thai subordinates to implement Japanese 1) 0.580***[positive effect] management practices. (RelationX-+ Acceptance2) ReSSX-+ Acceptance H6B: resources support is a positive influential
Not sig. x factor for Thai subordinates to implement Japanese management practices . Motivational factors-+ Acceptance Direct effect H7B: at least one of six factors is an effective factor that positively influences Thai subordinates 1) 0.673***
'1 to implement Japanese management practices. (RewarsX ~ Acceptance4) 2) 0.580***
(RelationX-+ Acceptance2)
Notes: ***significant at the 0.001 level (one-tailed) ** significant at the 0.05 level (one-tailed)
I~ Hypothesis accepted Hypothesis rejected
Table 7.2: Hypotheses testing for H1B-H7B
189

7.4 Implications for theory and practice
The set of above implications is relevant to benefiting Japanese manufacturing
organizations in Thailand. This research has focused on the six motivational factors
including vision, reward, good relationship, leadership, structure and resources
support, discussed earlier in Chapters 2 and 3. However, the results indicated that only
vision, reward, and good relationship were significant motivational factors in the
context of Thailand. The significant theoretical and practical implications of the
findings are discussed following.
Vision as a motivational factor
When there is a need for adaptation, vision can be a tool that inspires employees to
higher levels of commitment and performance (Dvir, Kass & Shamir 2004; Proctor &
Doukakis 2003; Bryman 1992). Therefore, organizations need to communicate this
need through a vision that convinces members that acceptance of such adaptation is
necessary and good (Fernandez & Rainey 2006; Laurent 2003; Burke 2002;
Armenakis, Harris & Feild 1999b; Kotter 1995). In this way, organizations can
motivate their subordinates by sharing the organizational vision to facilitate
subordinates to recognize suitable ways of achieving the specified goal (Hackett &
Spurgeon 1996). Thus, a shared vision creates a clear organizational purpose and
supports the necessary changes to reach desired future outcomes (Hoe 2007).
Results of this study have confirmed the hypothesis that adaptation of Japanese
management practices can be achieved by providing vision to Japanese managers.
These results showed that the Japanese managers intended to adapt their management
practices to be appropriate to Thai local culture, possibly because they had become
informed of the reasons for adaptation, and the direction of how adaptation could be
achieved. In other words, in agreement with Forster and Akdere (2007) who stated
that vision is conceptualized as a technique which provides a direction to facilitate
organizational success, they had developed a vision. If adaptation of Japanese
management practices was to be a goal of their organization, Japanese managers
could be motivated by gaining a clear vision of their organization and recognizing the
way to achieve its goals.
190

Role of reward for acceptance of Japanese management practices
Reward is a primarily technique used in organizations to attain positive organizational
outcomes (Ford & Greer 2005; Kerr & Slocum 1987; Cummings & Schwab 1973).
Rewards are a reinforcement to strongly motivate subordinates to perform desired
behaviours (Lin 2007; Buch & Tolentino 2006; Govindarajulu & Daily 2004), often
utilized to motivate employees to attain positive organizational outcomes (Ford &
Greer 2005; Kerr & Slocum 1987; Cummings & Schwab 1973). Rewards attract,
retain and motivate employees to increase their effort and output towards the success
of organizational goals (Bergmann & Scarpello 200 I), and high level rewards provide
even stronger enhancement of motivation (Takahashi 2006), significantly affecting
employee participation (Fenwick & Olson 1986). Therefore, certain forms of extrinsic
motivation, for instance monetary rewards, praise and recognition may motivate
employees to participate in the implementation of Japanese management practices.
Results of this study have confirmed the hypothesis that the acceptance of Japanese
management practices can be achieved if Thai subordinates are provided some
rewards. Rewards were seen as an influential factor for Thai subordinates to accept
Japanese management practices, possibly because most Thai subordinates were young
adults (20-30 years old - refer to Table 5.2 in Chapter 5) looking for opportunities to
improve their opportunities for a better future. Therefore Thai subordinates could be
motivated to accept and implement Japanese management practices by giving them a
sense of achievement through providing them with opportunities of new and exciting
challenges, development of new skills and capabilities, or providing them with money
incentives.
Good relationship as a motivational factor
Interpersonal relationship is an important motivational factor in reaching
organizational goals (Neergard, Sahaw & Carter 2005). Employees with high needs
for affiliation may be attracted by work environments in which there is a primary
focus on developing and maintaining warm relationships between employees (Street
& Bishop 1991 ). It is presumed that if an employee has a positive attitude toward their
relationship with others in the organization, this should positively influence their
behavioural intentions to act according to the group' s decision {Taormina & Lao
191

2007). Thus, employees' behaviours may vary according to the decision of the group
that they belong to.
In context of the present study, both Thai and Japanese are collectivist, emphasizing
on the demands and interests of the group rather than on individual interests (Hofstede
& Hofstede 2005; Paul et al. 2004). As a result they have strong needs for affiliation
(Hui & Villareal 1989) and are more likely to solve conflicts by integrating and
compromising (Hui & Yee 1999). These employees are very concerned with their
relationships with others in their organization (Hofstede & Hofstede 2005), and may
strongly refuse to change if that change could result in conflict with their workmates.
In other words, not only can a Thai employee fail to accept and implement Japanese
management practices they feel that a conflict may eventuate, but a Japanese manager
may not adapt his management practices if there is a poor relationship between
himself and his employees. Therefore, in agreement with the hypotheses of this study,
questionnaire results have strongly confirmed that the acceptance and adaptation of
Japanese management practices can be achieved if Thai subordinates and Japanese
managers can maintain good relationships with each other.
Leadership as a motivational factor
Leaders' support and commitment to change can play an important role in
organizational change (Burke 2002; Yuki 2002; Johnson & Leavitt 2001; Carnall
1995). Cannaing and Hanmer-Lloyd (2002) believe that support from a leader is a
factor in facilitating an adaptation process. Leaders have the ability to influence
followers' movements (Robbins 2001) by providing messages to help them
understand the vision and direction to follow (Marzec 2007; McGreevy 2003;
Armenakis & Harris 2002; Harper 1998; Kotter 1996) and motivate the way they
think in order to introduce new processes into their organization (Tucker & Russell
2004). In this way, subordinates may be assured that their leaders are committed to
investing the time, energy and resources necessary to implement the change
(Eisenbach, Watson & Pillai 1999).
However, although several researchers believe that strong leadership is the most
important factor for successful change in organizations (e.g. Landrum, Howell &
Paris 2000; Hoffman 1989; Bibeault 1982), results of the present research indicate
192

that leadership had only a little relationship with the change of Japanese management
practices in Japanese manufacturing organizations in Thailand (see Figures 6.20 &
6.25). This implies that Thai subordinates and Japanese managers did not seriously
take leadership as an important factor that could influence them to accept and adapt
Japanese management practices. This may be due to leadership not playing an
important role in the context of manufacturing organizations in Thailand, as influence
from leaders may always exist and be very commonplace for employees in their
manufacturing organizations.
Structure for adaptation and acceptance of Japanese management practices
Fernandez and Rainey (2006) believe that only providing vision is insufficient to
bring about change. Vision must be altered into a course of action or plan for
achieving the change (Abramson & Lawrence 2001; Lambright 2001; Young 2001;
Kotter 1995). In order to be successful in change, employees who participate in a
change process need to know what to do, how to improve upon what they do, and how
to achieve it effectively (Rosenberg 2003). Here, structure provides a direction of how
to perform the change through a series of steps in change activities, and identifying
who is in charge of the change process (Richardson 2007; Williams & Rains 2007):
However, structure for adaptation and acceptance of Japanese management practices
was not a significant factor in motivating Thai subordinates and Japanese managers; it
only had a small effect on the acceptance and adaptation of Japanese management
practices (see Figures 6.20 & 6.25). It is possible that Thai subordinates and Japanese
managers did not believe that structure was as important as vision, rewards and good
relationship, in their acceptance and adaptation of Japanese management practices.
Moreover, they were probably already endeavouring to perform the acceptance and
adaptation of Japanese management practices. Thus, the structure factor was not an
important factor that influenced Thai subordinates and Japanese managers to accept
and adapt their management practices.
Role of resources support to motivate employees
To overcome resistance to change, leaders need to improve their employees'
confidence by ensuring that the organization has sufficient resources to support the
change program (Self 2007). Resources support can lead to synergies increasing the
193

possibility that all changes will be successfully implemented (Fernandez & Rainey
2006). Employees' perceptions of the extent to which their organization has sufficient
resources to support change, and the degree to which they can actively and genuinely
participate in the process, are significant factors in accomplishing successful change
(Jones, Jimmieson & Griffiths 2005; Smith 2005). However, results of the present
research indicated that resources support was not a significant factor to motivate
Japanese managers to change and Thai subordinates to change their ' attitudes to accept
Japanese management practices (see Table 6.37 and 6.41). Resources support for the
adaptation and acceptance of Japanese management practices was seen as an
insignificant factor because it was ordinarily provided in Japanese manufacturing
organizations in Thailand. Therefore, although resources support has been seen by
some as important to the change process (Fernandez & Rainey 2006; Jones,
Jimmieson & Griffiths 2005; Smith 2005), in this study it was not an important factor
in influencing Thai subordinates and Japanese managers to accept and adapt their
management practices.
7 .5 Towards an efficient cross-cultural and international business
management practices
Daniels and Radebaugh ( 1998) state that efficient management practices should be
flexible, and adaptable and acceptable to those who use them. This study has
confirmed that by providing vision, reward and good relationship, Japanese managers
and Thai subordinates can be motivated to adapt and accept the Japanese management
practices. When there is a clear vision and good relationship among employees,
Japanese managers will adapt their management practices. Furthermore, Thai
subordinates will accept and implement Japanese management practices in Thailand if
reward and good relationships occur. Therefore, efficient Japanese management
practices can be engendered if Thai subordinates and Japanese managers are provided
with a clear vision and reward, and there are good relationships among them.
This research is groundbreaking in that it examines the factors that cause adaptation
and acceptance of Japanese management practices in Thailand. Moreover, it has
significance in adding to the cross-cultural and international business management
literature in which vision, reward and good interpersonal relationships need to be
194

taken into account when transplanting management practices from one country to
another. The outcome of the present study could lead to improved business
performance and reduction in conflict between Japanese manufacturers and their Thai
employees, and assist in formulating efficient international and cross-cultural business
management systems and practices.
7 .6 Findings and supports from pervious studies
The findings of this study indicate that clear vision, rewards and good relationship
could significantly influence the adaptation and acceptance of Japanese management
practices in Thailand. This strongly supports the results of several researches in
change management studies where vision, reward, and relationship have been
significantly influential factors for change in organizations (e.g. Lin 2007; Lok et al.
2005; Abraham, Sullivan & Griffin 2002; Abraham, Crawford & Fisher 1999;
Abraham, Fisher & Crawford 1997). Table 7.3 shows the similar finsdings provided
from previous studies which have been conducted in different contexts to results of
the present study.
Author(s) Vision Reward Relationship
Lin (2007) '1 '1
Lok et al. (2005) '1
Abraham, Sullivan & Griffin (2002) '1 '1
Abraham, Crawford &.Fisher (1999) '1 I
Abraham, Fisher & Crawford (1997) '1 '1
Table 7.1: Supports from the pervious studies
In Lin's (2007) study, structural equation modelling was developed to examine the
relationships between motivational factors (reward and interpersonal relationship) and
employee knowledge-sharing intentions. The findings in her study indicate that
interpersonal relationship and rewards are associated with employee knowledge
sharing intentions.
Lok et al. (2005) developed an integrative framework for measuring the extent to
which organizational variables influence the success of process improvement
195

programs. Their results indicate that v1s10n and leadership are necessary for the
success of process-improvement programs
Abraham, Sullivan and Griffin (2002) found that vision, resources support, leadership
and reward are critical factors in implementing the effective management of legislated
change in museums.
The study of Abraham, Crawford and Fisher (1999) indicated that vision, resources
and management supports are the important factors in managing organizational
change. Abraham, Crawford and Fisher (1997) also found that vision, leadership,
structure and reward are the key factors predicting effectiveness of cultural change
and improved productivity in the implementation of total quality management.
7.7 Summary
This chapter has discussed the results of the research findings by utilizing the
descriptive statistics and structural equation modeling techniques outlined in Chapters
5 and 6. The significant theoretical and practical implications of the research findings
are also discussed in this chapter.
Regarding the results of descriptive statistics, it can be concluded that the sample
group of Thai employees and Japanese expatriates represents the whole population of
Thai subordinates and Japanese managers who work in joint-venture Japanese
manufacturing organizations in Thailand. Furthermore, these results show that
Japanese management practices have frequently been implemented in Thailand, and
that in order to generate good management practices that are able to more fully reflect
the efficiency and capability of these organizations, adaptation and acceptance of
Japanese management practices is required.
This chapter has summarised and discussed the results of findings and implications
for cross-cultural management practices. It has also outlined the results of hypotheses
testing for the thesis, along with implications for theory and practice. Vision, reward
and good relationship were found to be positive significant motivational factors that
196

influence Thai subordinates to accept, and Japanese managers to adapt, Japanese
management practices. The next chapter presents the conclusion of the thesis.
197

Chapter 8 Summary, findings, and conclusion
8.1 Introduction
In summarising the present thesis, this chapter presents the following eight sections.
Section 8.2 discusses the purpose of the study and research questions, and overviews
the research. Section 8.3 summarises the results of the study. Section 8.4 describes
potential uses for the models of Japanese management adaptation and acceptance.
Section 8.5 discusses the limitations of the research. Section 8.6 suggests
recommendations for further research. Finally, Section 8. 7 summarises the present
research program.
8.2 Research design
This research was designed to assess the relationship between motivational factors,
adaptation and acceptance of Japanese management practices. The aim of the research
was to investigate the motivational factors that can influence Japanese managers to
adapt, and Thai subordinates to accept, Japanese management practices in Thailand.
While prior empirical studies of Japanese management practices in Thailand have
mainly focused on Thai employees' perceptions of these practices and on how well
they are implemented, there has not yet been any research undertaken to examine
factors that influence the adaptation and acceptance of Japanese management
practices in Thailand. In essence, it was assumed that motivational factors, such as
vision, leadership, structure, rewards, resources support, and relationship are the
positive influential factors in Thai subordinates accepting, and Japanese managers
adapting, Japanese management practices.
Research questions
In order to develop efficient cross-cultural management practices, this research sought
answers to the following questions:
198

• What are the motivational factors that can influence Japanese managers to
adapt their Japanese management practices to be apposite to Thai culture?
• What are the motivational factors that can influence Thai subordinates to
accept Japanese management practice?
Overview of the research
To address the research questions and establish a framework and development of
models, a comprehensive literature review of change management in organizations
was undertaken in Chapter 2. Given that many Japanese management practices have
not been successfully implemented in Thailand, this chapter established the
foundation of the present research by emphasizing how to create good management
practices that can satisfy all members of organizations. However, in reviewing the
literature it became apparent that motivational factors of vision, leadership, resources
support, structure, reward and relationship could be important in implementing
changes of current Japanese management practices - but what appeared to be lacking
was a detailed use of motivational factors that can be used to influence Japanese
managers to adapt, and Thai ·subordinates to accept, Japanese management practices.
Although many studies have reported that motivational factors can influence
employees in organizations, there has not yet been any research undertaken to
investigate which of these factors can influence the adaptation and acceptance of
Japanese management practices in Thailand. Therefore, to enable Japanese
organizations in Thailand to understand how to create good management practices,
the research framework adopted six motivational factors to develop and test in
structural equation models, using composite variables that allowed the relative
importance of attributes to be identified.
For the purpose of the present research, two sets of questionnaires were developed,
pilot-tested and revised before being distributed to Japanese managers and Thai
subordinates. Chapter 4 discussed justification of the research design, the
questionnaire development, the sample surveyed, and the method of data collection.
Statistical analysis supported the results of other studies reported in the literature, and
199

two new models including one of motivational factors that influence acceptance of
Japanese management practices and the other of motivational factors that influence
adaptation of Japanese management practices, were presented. Hypotheses testing and
results of the findings using the structural equation modelling technique were
described in Chapter 6.
8.3 Results and implications
As discussed in Chapter 7, vision and good relationship were seen as positive
motivational factors that influence Japanese managers to adapt their management
practices to be appropriate to Thai culture, whereas Thai subordinates considered
reward and good relationship as positive motivational factors that influence them to
accept and implement Japanese management practices. The structural equation
models of Japanese management adaptation and acceptance were developed and
tested in Chapter 6. These models demonstrate the relationship between motivational
factors and adaptation and acceptance in path diagrams (see Chapter 6, Figures 6.20
& 6.25). These two models were also formally illustrated in mathematical forms (see
Chapter 6, Figures 6.21 & 6.26). These results imply that in order to develop efficient
cross-cultural management practices, good relationships along with rewards and
vision play an important role.
8.4 Potential uses for the models
The two models of motivational factors for adaptation and acceptance of Japanese
management practices presented in Chapter 6, Figures 6.20 and 6.25, may not only be
used in the context of manufacturing organization, but also for other types of
organization to motivate their employees to achieve organizational goals and efficient
international cross-cultural management practices. Moreover, these two models may
be used to compare the differences between motivational factors of managers and
their subordinates
200

8.5 Limitations of the research
In identifying the motivational factors that affect organizational change and are
relevant for Japanese managers to adapt and Thai subordinates to accept Japanese
management practices, the motivational factors and Six-Box model of Weisbord
(1978), were adopted. However, in the present thesis, Weisbord's model which
initially studied relationships between six factors that affect organizational change,
was adapted to identify the particular motivational factors that affect the adaptation
and acceptance of Japanese management practices; it did not follow investigation of
the relationships among six factors as did W eisbord.
As discussed in Chapter 1, the aim of the study was to examine motivational factors
that can influence Japanese managers to adapt, and Thai subordinates to accept,
Japanese management practices in Thailand. Therefore, comparisons of the two
models presented in Chapter 6 were found to be irrelevant to this study.
Although the results of findings indicated that vision, rewards and good relationship
were significant in motivating Japanese managers to adapt and Thai subordinates to
accept Japanese management practices in Thailand, other motivational factors such as
resources support, and structure and leadership were only slightly relative to the
adaptation and acceptance of Japanese management practices in Thailand. However,
these results may prove to be different when applying the models in other contexts.
The selection of Japanese manufacturing organizations for the present study was
based on a freely available list through the Japanese Chamber of Commerce, Bangkok
(2006). As this list was dated 2006, the sample size based on this list may be out of
date; however, it was still used in this study since it was the only reliable information
available during the period of undertaking this research.
As discussed in Chapter 5, although the response rates in this thesis were sufficient to
perform structural equation modelling, at 204 (Thai subordinates) and 140 (Japanese
managers) they were not high. According to the calculations in Chapter 4 Section
4.6.2, ideally they should have been at least 242 each. However, the results of the
study were satisfactory in terms of the standard statistical tests of structural equation
201

modelling and information requirements for analysing the research questions of the
thesis (refer to Section 5.2.1 in Chapter 5).
8.6 Recommendations for further research
The models of adaptation and acceptance of Japanese management were developed
based on small sample groups of Japanese managers and Thai subordinates in
manufacturing organizations in Thailand. These two models have that identified
vision, rewards and good relationships can motivate Japanese managers and Thai
subordinates in manufacturing organizations to adapt and accept Japanese
management practices. However, much published research has stated that not only
vision, reward, and good relationship can motivate employees in organizations, but
also resources support, structure, and leadership. It is therefore possible that resources
support, structure, and leadership could be significant motivational factors when
applying the models in a different sample. Therefore, the proposed model of
motivational factors for adaptation and acceptance of Japanese management practices
needs to be tested in different types of organizations or different groups of
respondents to confirm the results of this research.
8. 7 Contributions and Concluding remarks
Differences in national cultures suggest the need for differences in management
practices (Newman & Nollen 1996). Several researches have indicated that Japanese
management practices are inappropriate in the Thai local culture (e.g. William &
Onishi 2003; Tannock, Krasachol & Sruangpermpool 2001; Mccampbell et al. 1999;
Goh & Pinaikul 1998; Holmes & Tangtongtavy 1995; Sedgwick 1995).
Consequently, when Japanese managers apply their management practices in
Thailand without adjustment to the local culture, conflicts emerge. Therefore, it has
been a contention of this thesis that failure to adapt management practices in Thailand
decreases the motivation and performance of Thai subordinates. It has also contended
that Japanese management practices should be adapted in order to increase the
effectiveness of Japanese affiliates in Thailand (William & Onishi 2003; Mccampbell
et al. 1999; Adams & Vernon 1998; Sedgwick 1995).
202

At present, literature on cross-cultural management provides insufficient
understandings on how to motivate Thai employees to accept and implement
transplanted Japanese management practices, and how Japanese managers need to
adapt their management practices to be appropriate in Thai culture. However, several
researches identifying factors that can influence employees to implement change in
organizations may be applicable (e.g. Lin 2007; Lok et al. 2005; Abraham, Sullivan &
Griffin 2002; Lok & Crawford 2000; Abraham, Crawford & Fisher 1999; Abraham,
Griffin & Crawford 1999; Abraham, Fisher & Crawford 1997). Therefore, as previous
studies have shown how to motivate employees to perform the change in
organizations, it was considered necessary in this study to identify how to motivate
Thai employees to accept, and Japanese managers to adapt, Japanese management
practices in Thailand.
The present research began with the goal of investigating motivational factors that can
influence employees in organizations. By using structural equation modelling to
specify the relationships between motivational factors and adaptation and acceptance
of Japanese management practices, the findings indicate that clearer vision and an
emphasis on rewards and good relationships can create an increased perception of
Japanese management adaptation and acceptance. This study has added to the body of
knowledge in the cross-cultural management literature by suggesting vision, rewards,
and good relationship are significant motivational factors that can influence
employees in Japanese manufacturing organizations in Thailand.
Most importantly, the central claim of this thesis is that Japanese management
practices in Thailand can be successfully implemented when vision, reward and good
relationship are a central focus. This emphasis will assist Japanese businesses in
Thailand to develop efficient international management practices in which Thai
subordinates accept, and Japanese managers adapt Japanese management practices.
203

References
Abo, T 1994, Hybridfactory, Oxford University Press, New York. Abolghasemi, M, McCormick, J & Conners, R 1999, 'The importance of department
heads in the development of teacher support for school vision', The International Journal of Educational Management, vol. 13, no. 2, pp. 80-6.
Abraham, M, Crawford, J & Fisher, T 1999, 'Key factors predicting effectiveness of cultural change and improved productivity in implementing total quality management', International Journal of Quality & Reliability Management, vol. 16, no. 2, pp. 112-32.
Abraham, M, Fisher, T & Crawford, J 1997, 'Quality culture and the management of organization change', International Journal of Quality & Reliability Management, vol. 14, no. 6, pp. 616-36.
Abraham, M, Griffin, D & Crawford, J 1999, 'Organization change and management decision in museums', Management Decision, vol. 37, no. 10, pp. 736-51.
Abraham, M, Sullivan, T & Griffin, D 2002, 'Implementing NAGPRA: the effective management oflegislated change in museums', Management Decision, vol. 40, no. 1, pp. 35-49.
Abramson, MA & Lawrence, PR 2001, 'The Challenge of Transforming Organizations: Lessons Learned about Revitalizing Organizations', in MA Abramson & PR Lawrence (eds), Transforming Organizations, Rawman & Littlefield, Lanham, MD.
Ackerman, LS 1986, 'Development, Transition or Transformation: The Question of Change in Organizations', Organizational Development Practitioner, vol. December, pp. 1-8.
Adams, GF & Vernon, H 1998, 'How do firms adjust to economic crisis? The case of Thailand'; Sas in Journal of Management, vol. 4, pp. 1-5.
Adenso-Diaz, B, Kawamura, Y & Gonzalez-Torre, P 1999, 'Cultural practices in the Spanish subsidiaries of Japanese companies', Industrial Management & Data System, vol. 99, no. 3, pp. 115-20.
Adler, NJ 1991, International Dimensions of Organizational Behavior, Wadsworth Publishing, Belmont, CA.
Ahire, S, Golhar, D & Waller, M 1996, 'Development and validation ofTQM implementation constructs', Decision Sciences, vol. 27, no. 1, pp. 23-56.
Ajzen, I & Fishbein, M 1980, Understanding attitudes and predicting social behavior, Prentice-Hall, Englewood Cliffs, NJ.
Akgun, AE, Byrne, J & Keskin, H 2007, 'Organizational intelligence: a structuration view', Journal of Organizational Change, vol. 20, no. 3, pp. 207-89.
Alarid, LF & Wang, H-M 1997, 'Japanese management and policing in the context of Japanese culture', Policing: An International Journal of Police Strategies & Management, vol. 20, no. 4, pp. 600-8
Alas, R 2007, 'Reactions to organizational change from the institutional perspective: the case of Estonia', Problems and Perspectives in Management, vol. 5, no. 3, pp. 19-30.
Alley, S 1999, Importance of leadership and morale in a work in today's business environment, ESU On-line Management Journal, 12/10/2007.
Allwood, JM & Lee, WL 2004, 'The impact of job rotation on problem solving skills', International Journal of Production Research, vol. 42, no. 5, pp. 865-81.
204

Almeida Costa, L & Amaro de Matos, L 2002, 'Towards an Organizational Model of Attitude Change', Computational and Mathematical Organization Theory, vol. 8, no. 4, pp. 315-35.
Almeida Costa, L, Amaro de Matos, L & Pina e Cunha, M 2003, 'The Manager as Change Agent', Int. Studies of Mgt. & Org., vol. 33, no. 4, pp. 65-93.
Alston, JP 1986, The American samurai: blending American and Japanese managerial practices, De Gruyter studies in organization; 6, W. de Gruyter, Berlin; New York.
Amaratunga, D, Baldry, D, Sashar, M & Newton, R 2002, 'Quantitative and qualitative research in the built environment: Application of 'mixed' research approach', Work Study, vol. 51, no. 1, pp. 17-3 l.
Amemiya, Y & Anderson, TW 1990, 'Asymptotic chi-square test for a large class of factor analysis models', The Annals o.f Statistics, vol. 18, no. 3, pp. 1453-63.
Anderson, AB, Basilevsky, A & Hum, DPJ 1983, 'Measurement: Theory and Techniques', in PH Rossi, JD Wright & AB Anderson (eds), Handbook of Survey Research, Academic Press, New York.
Anderson, JG & Gerbing, DW 1988, 'Structural equation modelling in practice: A review and recommended two-step approach', Psychological Bulletin, vol. 107, no. 1, pp. 238-46.
Anil, A & Brian, M 2004, 'Using Job Rotation to Extract Employee Information', The Journal of Law, Economic, & Organization, vol. 20, no. 2, pp. 400-14.
Appelbaum, SH & Mackenzie, L 1996, 'Compensation in the year 2000: pay for performance?' Health Manpower Management, vol. 22, no. 3, pp. 31-9.
Arbuckle, JL & Wothe, W 1999, AMOS 4.0 User's Guide, Small Waters Corporation, Chicago.
Arbuckle, JL & Wothke, W 1999, AMOS 4.0 User's Guide, Small Waters Corp. , Chicago, IL.
Armenakis, AA & Bedeian, AG 1999, 'Organizational change: a review of theory and research in the 1990s', Journal of Management, vol. 25, no. 3, pp. 293-315.
Armenakis, AA & Harris, SG 2002, 'Craf6ng a change message to create transformational readiness', Journal of Organizational Change, vol. 15, no. 2, pp. 169-83.
Armenakis, AA, Harris, SG & Feild, HS l 999a, 'Making change permanent: a model for institutionalizing change', Research in Organizational Change and Development, vol. 12, no. 1, pp. 97-128.
---- 1999b, 'Paradigms in Organizational Change: Change Agent and Change Target Perspectives', in RT Golembiewski (ed.), Handbook of Organizational Behaviour, Marcel Dekker, New York.
Armenakis, AA, Harris, SG & Mossholder, KW 1993, 'Creating readiness for large scale change', Human Relations, vol. 46, no. 1, pp. 681-703.
Armitage, C & Christian, J 2003, 'From Attitudes to behavior: Basic and Applied Research on the Theory of Planned Behaviour', Current Psychology: Development, Learning, Personality, Social, vol. 22, no. 3, pp. 187-95.
Arocena, P & Villanueva, M 2003, 'Access as a Motivational Device: Implications for Human Resource Management', KYKLOS, vol. 56, no. 2, pp. 199-221.
Arthur, M 2005, Japanese management: Tradition and Transition, Whitehill , Honolulu, Hawaii, USA.
Asano, J 1996, Databank Series 96: Japanese Overseas Companies, Toyo Keizai Inc., Tokyo.
205

Asherman, I, Bing, JW & Laroche, L 2000, Building Trust Across Cultural Boundaries, IT AP International Inc, 22/3/2007.
Ashkanasy, NM & Tse, B 2000, 'Transformational leadership as management of emotion: a conceptual review', in NM Ashkanasy & CE Hartel (eds), Emotions in the Workplace: Research, Theory, and Practice, Greenwood Publishing Group, Westport, CT.
Atwater, DC & Bass, BM 1994, 'Transformational leadership in teams', in BM Bass & BJ Avolio (eds), Improving Organizational Effectiveness through Transformational Leadership, Sage Publication, London.
Awamleh, R & Gardiner, W 1999, 'Perceptions ofleader charisma and effectiveness: the effects of content, delivery, and organizational performance', Leadership Quarterly, vol. 10, no. I, pp. 345-73.
Azzalini, A 2005, 'The skew-normal distribution and related multivariate families', Board of the Foundation of the Scandinavian Journal of Statistics, vol. 32, no. 2, pp. 159-88.
Babbie, ER 2000, The Practices of Social Research, Wadsworth Thomson Leaming, Belmont, CA.
Bagozzi, R 1983, 'Issues in the application of covariance structure analysis: A further comment', Journal of Consumer Research, vol. 9, no. 1, pp. 449-50.
Baharim, SB 2007, 'The influence of knowledge sharing on motivation to transfer training: a Malaysian public sector context', PhD thesis, Victoria University.
Bailey, KD 1994, Methods of Social Research, The Free Press, New York. Bandalos, D 2002, 'The Effects of Item Parceling on Goodness-of-Fit and Parameter
Estimate Bias in Structural Equation Modelling', Structural Equation Modelling, vol. 9, no. 1, pp. 78-102.
Bandalos, D & Finney, S 2001, 'Item Parceling Issues in Structural Equation Modelling', in GAMRE Schumacker (ed.), New Developments and Techniques in Structural Equation Modelling, Lawrence Erlbaum Associates, Mahawah, NJ.
Barnett, K & McCormick, J 2003, 'Vision, relationships, and teacher motivation: a case study', Journal of Educational Administration, vol. 41, no. 1, pp. 55-73.
Baron, JN 1988, 'The employment relation as a social relation', in J Pfeffer (ed.), New Direction for Organization Theory:· Problem and Prospects, Oxford University Press, USA.
Baron, RA & Donn, B 2003, Social Psychology, 10 edn, Allyn and Bacon, Boston, MA.
Barra, R 1983, Putting Quality Circles to Work, McGraw-Hill, New York, NY. Bartlett, CA & Ghoshal, S 1989, Managing across borders: The transnational
solution, Harvard Business School Press, Boston, MA. Barton, RA 1996, 'La vie en rose' revisited: Contrasting perceptions of informal
upward feedback among managers and subordinates', Management Communication Quarterly, vol. 9, no. 3, p. 338.
Bass, BM 1985, Leadership and Performance Beyond Expectations, Free Press, New York, NY.
---- 2002, 'Cognitive, social, and emotional intelligence of transformational leaders', in RE Riggio, SE Murphy & FJ Pirozzolo (eds), Multiple Intelligences and Leadership, Lawrence Erlbaum Associates, Mahwah, NJ.
Basu, D & Miroshnik, V 1999, 'Strategic human resources management of Japanese multinationals-A case study of Japanese multinational companies in the UK', Journal of Management Development, vol. 18, no. 9, pp. 714-32.
206

Bateman, TS & Snell, S 2002, Management: Competing in the New Era, 5th edn, McGraw-Hill, USA.
Beach, LR, Campbell, FL & Townes, BD 1979, 'Subjective expected utility and the prediction of birth planning decision', Organizational Behavior and Human Performance, vol. 24, no. 1, pp. 18-28.
Beardwell, I & Holden, L 2001, Human Resource Management: A contemporary approach, 3 rd edn, Financial Times Prentice Hall , UK.
Beatrice, G-D 1990, 'An Educational Occupational Issues Group for the Chronic Psychiatric Patient', Journal of community and clinical practice, vol. 13, no. 1, pp. 113 - 27
Beer, M 2000, 'Lead organizational change by creating dissatisfaction and realigning the organization with new competitive realities', in EA Locke (ed.), Handbook ofprinciples of organizational behavior, Blackwell, Malden, MA.
Beer, M & Walton, A 1987, 'Organizational change and development', Annual Review of Psychology, vol. 38, no. 1, pp. 339-67.
Bennis, W & Nanus, B 1997, Leader: Strategies for taking change, Harper Collins, New York.
Bentler, PM 1978, 'The interdependence of theory, methodology, and empirical data: Causal modelling as an approach to construct validation', in DB Kandel (ed.), Longitudinal Drug Research, Wiley, New York.
---- 1990, 'Comparative fit indexes in structural models', Psychological Bulletin, vol. 107, no. 1, pp. 238-46.
---- 1992, 'On the fit of models to covariance and methodology to the Bulletin', Psychological Bulletin.
Bergmann, TJ & Scarpello, VG 2001 , Compensation Decision Making Harcourt, Fort Worth, TX.
Berry, FS, Chackerian, R & Wechsler, B 1999, 'Reinventing Government: Lessons from a State Capital', in HG Frederickson & JM Johnston (eds), Public Management Reform and Innovation: Research, Theory, and Application, University of Albama Press, Tuscaloosa.
Beyer, JM & Trice, HM 1988, 'The communication of power relations in organizations through cultural rites', in MD Jones & RC Sayder (eds), Inside Organizations: Understanding the Human Dimensions~ Sage California.
Bibeault, DB 1982, Corporate Turnaround: How managers Turn Losers Into Winners , McGraw-Hill, New York.
Birnbaum, R 1984, 'The effects of a Neutral Third Party on Academic Bargaining Relationships and Campus Climate', The Journal of Higher Education, vol. 55, no. 6, pp. 719-34.
Black, JS, Gregerson, HB, Mendenhall , ME & Stroh, LK 1999, Globalizing people through international assignments, Addision-W esley, Reading, MA.
Blalock, HM 1979, 'The presidential address: Measurement and conceptualization problems: the major obstacle to integrating theory and research ' , American Sociological Review, vol. 44, no. 6, pp. 881-94.
Blase, J & Blase, J 1997, The Fire is back: Teachers Sharing School Governance, Corwin Press, Thousand Oaks, CA.
Bodgan, RC & Biklen, SK 1998, Qualitative Research in Education, 3 edn, Allyn&Bacon, Boston.
BOI 2005, Thailand Investment Review, Board of Investment Thailand, Bangkok. Bollen, KA 1989, Structural Equations with Latent Variables, John Wiley and Sons,
New York.
207

Bollen, KA & Stine, RA 1993, 'Bootstrapping goodness-of-fit measures in structural equation modelling', in KA Bollen & JS Long (eds), Testing Structural Equation Models, Sage, Newbury Park, CA.
Boyne, GA 2003, 'Sources of Public Service Improvement: A Critical Review and Research Agenda', Journal of Public Administration Research and Theory, vol. 13, no. 3, pp. 367-94.
Bragg, T 2000, 'How to effectively reward and inspire your team', Occupational Hazards, vol. October, pp. 131-4.
Brahm, C & Kleiner, BH 1996, 'Advantages and disadvantages of group decisionmaking approaches', Team Performance Management: An International Journal, vol. 2, no. 1, pp. 30-5.
Brescia, W 2004, 'Planned Change at the Center on Philanthropy: The CLEAR Model', Nonprofit Management & Leadership, vol. 14, no. 3, pp. 343-57.
Bright, AD, Fishbein, M, Manfredo, MJ & Bath, A 1993, 'Applied of theory of Reasoned Action to the National Park Service's Controlled Bum Policy', Journal of Leisure Research, vol. 25, no. 3, pp. 263-80.
Bringham, LB & Wise, CR 1996, 'The Administrative Dispute Resolution Act of 1990: How Do We Evaluate Its Success? 'Journal of Public Administration Research and Theory, vol. 6, no. 3, pp. 383-411.
Brislin, RW 1986, 'The wording and translation of research instruments', in WJ Lonner & JW Berry (eds), Field Methods in Cross-Cultural Research, Sage, Beverly Hills, CA.
Britt, J & Thomas, B 2007, 'A heart for change', Healthcare financial management, vol. January, pp. 66-70.
Brown, A 1994, 'Transformational leadership in tackling change', Journal of General Management, vol. 19, no. l, pp. 1-12.
Brown, D, Ferris, DL, Heller, D & Keeping, L 2007, 'Antecedents and consequences of the frequency of upward and downward social comparisons at work', Organizational Behavior and Human Decision Processes , vol. 101, no. 1, pp. 59-75.
Browne, MW & Cudeck, R 1993, 'Alternative ways of assessing model fit', in A Bollen & JS Long (eds), Testing Structural Equation Models, Sage, Newbury Park, CA.
Browne, MW & Meis, G 1990, RAMONA User's Guide, Department of Psychology, Ohio State University, Ohio.
Bryman, A 1992, Charisma and Leadership in Organizations, Sage Publications, Newbury Park, CA.
Buch, K & Tolentino, A 2006, 'Employee perception of rewards associated with six sigma', Journal of Organizational Change, vol. 19, no. 3, pp. 356-64.
Buchan, HF 2005, 'Ethical Decision Making in the Public Accounting Profession: An Extension of Ajzen's Theory of Planned Behavior', Journal of Business Ethics, vol. 61, no. 1, pp. 165-81.
Buchanan, DA & Buczynski, A 1985, Organizational behaviour: an introductory text, Prentice-Hall International, Englewood Cliffs; London.
Burke, W & Litwin, G 1992, 'A causal model of organizational performance and change', Journal of Management, vol. 18, pp. 523-45.
Burke, LA & Moore, JE 2000, 'The Reverberating Effects of Job Rotation: A Theoretical Exploration ofNonrotaters' Fairness Perceptions', Human Resource Management Review, vol. 10, no. 2, pp. 127-52.
208

Burke, WW 2002, Organization Change: Theory and Practices, Sage Publication, Thousand Oaks, CA.
Bums, J 1978, Leadership, Harper Collins, New York. Bums, RB 2000, Introduction to Research Methods, 4 edn, Pearson Education,
Frenchs Forest Byrne, BM 2001, Structural Equation Modelling with AMOS: Basic Concepts,
Applications, and Programming, Lawrence Erlbaum Associates, Mahwah, NJ. Calantone, RJ & Zhao, YS 2000, 'Joint Ventures in China: A Comparative Study of
Japanese, Korean, and US Partners', Journal of International Marketing, vol. 9,no.1,pp.1-23.
Caldwell, R 2003, 'Models of Change Agency: a Fourfold Classification', British Journal of Management, vol. 14, no. 1, pp. 131-42.
Caligiuri, PM 2000, 'Selecting expatriates for personality characteristics: a moderating effect of personality on the relationship between host national contact and cross-cultural adjustment', Management International Review, vol. 40, no. 7, pp. 61-80.
Cameron, K 1991, 'Organizational adaptation and higher education', in MW Pererson, EE Chaffee & TH White (eds), ASHE Reader on Organization and Governance in Higher Education, Ginn Press, Needham Heights, MA.
Campbell, D & Fiske, D 1959, 'Convergent and discriminant validity by the multitrait-multimethod matrix', Psychological Bulletin, vol. 56, no. March, pp. 81-105.
Campbell, N & Burton, F (eds) 1994, Japanese multinationals, Routledge, London. Campion, MA, Cheraskin, L & Stevens, MJ 1994, 'Career-related antecedents and
outcomes of job rotation', Academy of Management Journal, vol. 37, no. 1, pp. 1518-67.
Canel, C & Kadipasaoglu, S 2002, 'Quality control circles in the Veterans Administration hospital ',International Journal of Health Care Quality Assurance, vol. 15,no. 6,pp.238-48.
Canning, L & Hanmer-Lloyd, S 2002, 'Modelling the adaptation process in interactive business relationships', Journal of Business & Industrial Marketing, vol. 17, no. 7, pp. 615-36.
Carnall, C 1995, Managing Change in Organizations, Prentice Hall, New York. Causon, J 2007, 'Six steps to efficient management', Management Performance, vol.
20, no. 1, pp. 20-1. Cavana, R, Delahaye, 8 & Sekaran, U 2001, Applied Business Research: Qualitative
and Quantitative Methods, John Wiley & Sons Australia, Queensland. Cesare, JD & Golnaz, S 2003, 'Do All Carrots Look The Same? Examining the
Impact of Culture on Employee Motivation', Management Research News, vol. 26, no. 1, pp. 29-40.
Chackerian, R & Mavima, P 2000, 'Comprehensive Administrative Reform Implementation: Moving Beyond Single Issue Implementation Research', Journal of Public Administration Research and Theory, vol. 11, no. 3, pp. 353-77.
Chainuvati, V & Granrose, CS 2001, 'Career Planning and Development of Managers in Thailand', in JB Kidd, X Li & F J Richter (eds), Advances in Human Resource Management in Asia, Palgrave, London.
Chaisiri, K 1998, 'Human Resource Development Through Continuous Improvement: a Case Study ofYasothom Hospital, Thailand', Human Resources Development Journal, vol. 2, no. 2, p. 13.
209

Chang, MK 1998, 'Predicting Unethical Behavior: A Comparison of the Theory of Reasoned Action and the Theory of Planned Behavior', Journal of Business Ethics, vol. 17, no. 1, pp. 1825-34.
Chapman, JA 2002, 'A framework for transformational change in organizations', Leadership & Organization Development Journal, vol. 23, no. 1, pp. 16-25.
Chau, PYK 1997, 'Reexamining a model for evaluating information center success using a structural equation modelling approach', Decision Sciences, vol. 28, no. 2, pp. 309-34.
Chen, M 1995, Asian management systems, Routledge, London. Cherry, JAL 2000, A Research Primer for the Helping Professions: Methods,
Statistics, and Writing,, Wadsworth, Brooks/Cole, CT. Cho, K & Padmanabhan, P 2005, 'Revisiting the role of cultural distance in MN C's
foreign ownership mode choice: the moderating effect of experience attributes', International Business Review, vol. 14, no. 3, pp. 307-24.
Choi, J 2006, 'A Motivational Theory of Charismatic Leadership: envisioning, Empathy, and Empowerment', Journal of Leadership and Organizational Studies, vol. 13, no. 1, pp. 24-43.
Chrusciel, D & Field, DW 2006, 'Success factors in dealing with significant change in an organization', Business Process Management Journal, vol. 12, no. 4, pp. 503-16.
Chui, HS, Sharpe, FG & McCormick, J 1996, 'Vision and leadership of principals in Hong Kong', Journal of Educational Administration, vol. 34, no. 3, pp. 30-48.
Churchill, G 1979, 'A paradigm for developing between measures of marketing constructs', Journal of Marketing Research, vol. 16, no. 2, pp. 64-73.
Churchill, GA 1995, Marketing Research Methodological Foundation, 6 edn, The Dryden Press, Orlando, FL.
Clarke, A 1999, Evaluation Research: An Introduction to Principles, Methods and Practice, Sage Publication, Thousand Oaks, CA.
Clinton, OL & Sonny, SA 2002, 'Creating competitive advantage through effective management education ',Journal of Management Development, vol. 21, no. 9, pp. 640-54.
Coakes, SJ & Steed, LG 1997, SPSS Analysis Without Anguish, John Wiley & Sons, Brisbane.
Cohen, AM 1993, 'Japanese in transit: Remodelling the Japanese corporation', Management Japan, vol. 26, no. 2, pp. 1-13.
Cohen, J 1988, Statistical power analysis for the behavioural sciences, 2 edn, Lawrence Erlbaum Associates, Hillsdale, NJ.
Cole, MS, Harris, SG & Bernerth, JB 2006, 'Exploring the implications of vision, appropriateness, and execution of organizational change', Leadership & Organization Development Journal, vol. 27, no. 5, pp. 352-67.
Cole, R 1984, 'Some Principles Concerning Union Involvement in Quality Circles and Other Employee Involvement Program', Labor Studies Journal, vol. 8, no. 4, pp. 221-8.
Collins, JC & Porras, JI 1996, 'Building your company vision', Harvard Business Review, vol. 74, no. 5, pp. 65-77.
Collinson, D 1994, 'Strategies of resistance: power, knowledge and subjectivity in the workplace', in JM Jermier, D Knights & WR Nord (eds), Resistance and Power in Organizations, Routledge, New York, NY.
Collis, J & Hussey, R 2003, Business research: a practical guide for undergraduate and postgraduate students, 2 edn, Palgrave Macmillan, New York.
210

Conger, J & Kanungo, R 1987, 'Towards a theory of charismatic leadership in organizational setting', Academy of Management Review, vol. 12, no. 1, pp. 637-47.
Conger, JA 1998, 'The necessary art of persuasion', Harvard Business Review, vol. May-June, pp. 84-95.
Conger, JA & Kanungo, RN 1988, Charismatic Leadership: The Elusive Factor in Organizational Effectiveness, Jossey-Bass, San Francisco, CA.
Cooper, DR & Emory, CW 1995, Business Research Methods, Erwin, USA. Cooper, DR & Schindler, PS 1998, Business Research Method, McGraw Hill,
Singapore. Cooper, R 1991, Thais Mean Business, l edn, Time Books International, Singapore. Coorley, WW 1978, 'Explanatory observation studies', Educational Researcher, vol.
October, pp. 9-15. Cornell, J 1996, 'Aspects of the management of change', Journal of Management in
Medicine, vol. 10, no. 2, pp. 23-30. Costigan, RD, Insinga, RC, Berman, JJ, Ilter, SS, Kranas, G & Kureshov, VA 2005,
'An Examination of the Relationship of a Western Performance-Management Process to Key Workplace Behaviours in Transition Economies', Canadian Journal of Administrative Sciences, vol. 22, no. 3, pp. 255-67.
Cowley, B 2007, 'Why Change Succeeds: An Organizational Self-Assessment', Organization Development Journal, vol. 25, no. 1, pp. 25-30.
Cowley, M & Domb, E 1997, Beyond Strategic Vision, Bosston, MA., ButterworthHeinemann.
Creawell, JW 1994, Research Design; Qualitative and Quantitative Approaches, Sage Publications, Thousands Oaks.
Creech, R 1995, 'Employee motivation', Management Quarterly, vol. 6, no. 2, pp. 33-40.
Cummings, LL & Schwab, DP 1973, Performance in Organizations: Determinants and Appraisal, Foresman, Glenview, IL.
Cummings, TG & Worley, CG 1997, Organization Development and Change, 6 edn, South-Western College, Cincinnati, OH.
Cunningham, JB, Debrah, YA & Petzall, S 1996, 'Manufacturing management practices of Japanese subsidiaries in Singapore', Industrial Management & Data Systems, vol. 96, no. 7, pp. 3-16.
Dana, MJ 2004, 'Adaptation of organizational change models to the implementation of quality standard requirements', International Journal of Quality & Reliability Management, vol. 21, no. 2, pp. 154-74.
Danaher, P J & Haddrell, V 1996, 'A comparison of question scales used for measuring customer satisfaction', International Journal of Service Industry Management, vol. 7, no. 2, pp. 235-60.
Daniels, JD & Radebaugh, LH 1998, International Business: Environments and Operations, 9 edn, Upper Saddle River, New Jersey.
Daphna, 0, Heather, MC & Kemmelmeier, M 2002, 'Rethinking Individualism and Collectivism: Evaluation of Theoretical Assumptions and Meta-Analyses', Psychological Bulletin, vol. 128, no. 1, pp. 3-72.
Dayr, R & Leticia, P 2001, 'Reengineering the motivation to work', Management Decision, vol. 39, no. 8, pp. 666-75.
De Vaus, DA 2002, Surveys in Social Research, Allen & Unwin, St. Leonard, N.S.W. Denzin, NK & Lincoln, YS 2005, The SAGE handbook of qualitative research 3edn,
Sage Publications, Thousand Oaks
211

Dervitsiotis, KN 1998, 'The Challenge of managing organizational change: exploring the relationship of re-engineering and developing a learning organization', Total Quality Management, vol. 9, no. 1, pp. 109-22.
DeVellis, RF 2003, Scale Development: Theory and Applications, 2 edn, Sage Publications, Inc, Thousand Oaks, CA.
Devlin, SJ, Dong, H, K & Brown, M 1993, 'Selecting a scale for measuring quality', Marketing Research, vol. 5, no. 3, pp. 12-7.
Deyo, FC 1978, 'The cultural patterning of organizational development: A comparative case study of Thailand and Chinese industrial enterprises', Human Organization, vol. 37, no. 1, pp. 68-72.
Diaconis, P & Efron, B 1983, 'Computer-intensive methods in statistics', Scientific American, vol. 248, no. 5, pp. 116-30.
Dienhart, J 2004, In global arena, execs need cross-culture skills, Business Journal, viewed 21 March 2005, <http://www.bizjournals.com/seattle/stories/2004/l l/29/editiorial3.html>.
Donald, DT & Phyllis, MK 2000, 'Job Rotation', Professional Safety, vol. I, no. 1, pp. 32-4.
Donald, F & Muhammad, M 1997, International Business and Australia, Marrickville, NSW.
Dubey-Villinger, N 2001, 'Thai Business Culture: Hierarchy and Group, Initiative and Motivation', in JB Kidd, X Li & FJ Richter (eds), Advances in Human Resource Management in Asia, Palgrave, London.
Dulcelina, AS 1997, 'Organizational Diagnosis: A Six-Box Model', Nursing Management, vol. 28, no. 4, pp. 18-20.
Dumdum, UR, Lowe, KB & Avolio, BJ 2002, 'A meta-analysis of transformational and transactional leadership correlates of effectiveness and satisfaction: an update and extension', Transformational and Charismatic Leadership, vol. 2, no. 1, pp. 35-66.
Dvir, T, Kass, N & Shamir, B 2004, 'The emotional bond: vision and organizational commitment among high-tech employees', Journal of Organizational Change, vol. 17,no. 2,pp. 126-43.
Dyer, W 1985, 'The cycle of cultural evolution in organizations', in R Kilmann, M Saxton & R Serpa (eds), Gaining Control of the Corporate Culture, J ossey Bass, San Francisco, CA, pp. 200-29.
Eamonn, PS & Glenn, H 1994, 'The Important of Organizational and National Culture', Journal of European Business, vol. 94, p. 5.
Ebeling, AC & Lee, CY 1994, 'Cross-training effectiveness and profitability', International Journal of Production Research, vol. 32, no. 12, pp. 2843-59.
Eccles, T 1994, Succeeding with Change: Implementing Action-Driven Strategies, McGraw Hill, London.
Edwards, W 2003, 'Forging Tradition for a Holy War: The Hakko Ichiu Tower in Miyazaki and Japanese Wartime Ideology', Society for Japanese Studies, vol. 29, no. 2.
Eisenbach, R, Watson, K & Pillai, R 1999, 'Transformational leadership in the context of organizational change', Journal of Organizational Change Management, vol. 12, no. 2, pp. 80-8 .
Eisenberger, R, Fasolo, P & Davis-LaMastro, V 1990, 'Perceived organizational support and employee diligence, commitment and innovation', Journal of Applied Psychology, vol. 75, no. 1, pp. 51-9.
212

Elger, T & Smith, C 1994, Global Japanization ? The Transnational Transformation of Labor Process, Routledge Press, London.
Farrell, WR 1999, Crisis and opportunity in a changing Japan , Quorum, Westport, Conn.
Feldman, M & Pentland, BT 2003, 'Re conceptualizing Organizational Routines as a Source of Flexibility and Change', Administration in Science Quarterly, vol. 48 , no. 1, pp. 94-118.
Fenwick, R & Olson, J 1986, 'Support for worker participation: attitudes among union and non-union workers', American Sociological Review, vol. 51 , no. 4, pp. 505-22.
Fernandez, S & Rainey, HG 2006, 'Managing Successful Organizational Change in the Public Sector', Public Administration Review, vol. March-April, pp. 168-76.
Ferraro, GP 2002, The cultural dimension of international business , 4th ed. edn, Prentice Hall, Upper Saddle River, NJ.
Fincham, R & Rhodes, PS 2005, Principles of organizational behaviour, 4th ed. edn, Oxford University Press, Oxford.
Fishbein, M l 967a, 'Attitude and the prediction of behavior', in M Fishbein (ed.), Readings in attitude theory and measurement, Wiley, New York, NY.
---- l 967b, 'A behavior theory approach to the relations between beliefs about an object and the attitude toward the object', in M Fishbein (ed.), Readings in attitude theory and measurement, Wiley, New York, NY.
Fishbein, M & Ajzen, I 1975, Belief, attitude, intention, and behavior: AN introduction to theory and research, Addison-Wesley, Reading, MA.
Folger, R & Skarlicki, DP 1999, 'Unfairness and resistance to change: hardship as mistreatment' , Journal of Organizational Change, vol. 12, no. 1, pp. 35-50.
Ford, JD & Ford, LW 1994, 'Logics of identity, contradiction, and attraction in change', Academy of Management Review, vol. 19, no. 4, pp. 756-85.
Ford, MW & Greer, BM 2005, 'The Relationship between Management Control System Usage and Planned Change achievement: An Exploratory Study', Journal of Change Management, vol. 5, no. 1, pp. 29-46.
Foster, RD & Akdere, M 2007, 'Effective organizational vision: implications for human resource development', Journal of European Industrial Training, vol. 31, no. 2, pp. 100-11.
Frances, M 1995, 'Organizational change and personal mythology', Personal Review, vol. 24, no. 4, pp. 58-68.
French, WL 1998, Human Resource Management, Houghton Mifflin Company, Boston, MA.
Fruin, M 1992, The Japanese enterprise system: Competitive strategies and cooperative structures, Oxford University Press, New York, NY.
Fukuda, KJ 1993, Japanese management in East Asia and beyond, Hong Kong, The Chinese University Press Shatin.
Gagliardi, P 1986, 'The creation and change of organizational cultures: a conceptual framework', Organization Studies , vol. 7, no. 2, pp. 117-34.
Garfield, C 1992, Second to None, One Irwin, Homewood, IL. Garg, RK & Singh, TP 2006, 'Management of Change-A Comprehensive Review' ,
Global Journal of Flexible Systems Management, vol. 7, no. 1. Gerlach, ML 1992a, Alliance capitalism: The social organization of Japanese
business, University of California Press, Berkeley.
213

---- l 992b, 'The Japanese corporate network: A block model analysis', Administration in Science Quarterly, vol. 37, no. 1, pp. 105-39.
Gerlach, ML & Lincoln, JR 1992, 'The organization of business networks in the United States and Japan', in N Nohria & RG Eccles (eds), Networks and organizations: Structure, form, and action, Harvard University Press, Boston, pp. 491-520.
Gill, R & Wong, A 1998, 'The cross-cultural transfer of management practices: the case of Japanese human resource management practice in Singapore', The International Journal of Human Resource Management, vol. 9, no. 1, pp. 116-35.
Gliem, JA & Gliem, PR 2003, 'Calculating interpreting, and reporting cronbach's alpha reliability coefficient for Likert-type scales', paper presented to Midwest Research to Practice Conference in Adult, Continuing & Community Education.
Goggin, ML, Bowman, AOM, Lester, JP & O'Tools, LJ 1990, Implementation Theory and Practice: Toward a Third Generation, Scott Foresman/Little, Brown, Glenview, IL.
Goh, M & Pinaikul, P 1998, 'Logistics management practices and development in Thailand', Logistics Information Management, vol. 11, no. 6, pp. 359-69.
Goodpastor, WA & Montoya, ID 1996, 'Motivating physician behaviour change: Social influence versus financial contingencies', International Journal of Health Care Quality Assurance, vol. 9, no. 6, pp. 4-9.
Goodstein, L, Nolan, T & Pfeiffer, JW 1993, Applied Strategic Planning: How to Develop a Plan That Really Works, McGraw-Hill, New York, NY.
Goodstein, LD & Burke, WW 1991, 'Creating Successful Organizational Change', Organizational Dynamics, vol. 19, no. 4, pp. 5-1 7.
Govindarajulu, N & Daily, BF 2004, 'Motivating employees for environmental improvement', Industrial Management & Data Systems, vol. 104, no. 4, pp. 364-72.
Graetz, F & Smith, A 2005, 'Organizing Forms in Change Management: The Role of Structures, Processes and Boundaries in a Longitudinal Case Analysis', Journal of Change Management, vol. 5, no. 3, pp. 311-28.
Graham, L 1993, 'Inside a Japanese transplant: A critical perspective', Work and Occupations, vol. 20, no. 1, pp. 147-73.
Green, TB 1992, Performance and motivation strategies for today's woriforce : a guide to expectancy theory applications Westport, Conn., Australia.
Groves, SK 2006, 'Leader emotional expressivity, visionary leadership, and organizational change', Leadership & Organization Development Journal, vol. 27,no. 7,pp.566-83.
Groves, T, Hong, Y, Mcmillan, J & Naughton, B 1994, 'Autonomy and incentives in Chinese state enterprises', Quarterly Journal of Economics, vol. 109, no. 1, pp. 183-209.
Gupta, AK & Govindarajan, V 2000, 'Knowledge flows within multinational corporations', Strategic Management Journal, vol. 21, no. 1, p. 473.
Hackett, M & Spurgeon, P 1996, 'Leadership and vision in the NHS: how do we create the "vision thing"?' Health Manpower Management, vol. 22, no. 1, pp. 5-9.
Hair, JE, Black, WC, Babin, BJ, Anderson, RE & Tatham, RL 2003, Multivariate Data Analysis, 6 edn, Pearson Prentice Hall, Upper Saddle River, NJ.
214

Hambleton, R 1993, 'Translating achievement tests for use in cross-national studies', European Journal of Psychological Assessment, vol. 19, no. 1, pp. 57-68.
Hampden-Turner, C & Trompenaars, F 1993, The Seven Cultures of Capitalism, Doubleday, New York, NY.
Hara, Y 1997, 'Japanese employers revamp seniority system', Electronic Engineering Times, vol. 1, no. 969, pp. 154-7.
Harper, SC 1998, 'Leading organizational change in the 21st century', Industrial Management, vol. 40, no. 3, pp. 25-30.
Harrison, IM & Shirom, A 1999, Organizational diagnosis and assessment, Thousand Oaks, Sage.
Harrison, W, Thompson, VD & Rodgers, JL 1985, 'Robustness and Sufficiency of the Theory of Reasoned Action in Longitudinal Prediction', Basic and Applied Social Psychology, vol. 6, no. 1, pp. 25-40.
Hasegawa, K 1986, Japanese-style Management, Kodansha International, Tokyo. Hayashi, S & Baldwin, F 1988, Culture and management in Japan, University of
Tokyo Press, Tokyo. Hayduk, L 1987, Structural equation modelling with LISREL: Essentials and
advances, The Johns Hopkins University Press, Baltimore, Maryland. Hazama, H 1997, The History of labor management in Japan, Macmillan, London. Hazzard, L, Mautz, J & Wrightsman, D 1992, 'Job rotation cuts cumulative Trauma
case', Personal Journal, vol. 71, no. 1, pp. 29-32. Henderson, C 1992, 'Ergonomic Job Rotation in Poultry Processing', Advances in
Industrial Ergonomics and Safety, vol. 4, no. 1, pp. 443-50. Hendon, DW 2001, 'How to Negotiate with Thai Executives', Asia Pacific Journal of
Marketing and Logistics, vol. 13, no. 3. Herbig, P & A, G 1997, 'International motivational differences", Management
Decision, vol. 35, no. 7, pp. 562-7. Herbig, PA & Palumbo, F 1994, 'A brief examination of the Japanese innovation
process: part 2', Marketing Intelligence & Planning, vol. 12, no. 2, pp. 38-42. Hemes, T 2000, 'Effects of media of communication and collaboration in structural
change: insights from a computer-mediated research group', Human Resource Development International, vol. 13, no. 1, pp. 69-87.
Herzberg, F 1987, 'One more time: how do you motivate employees?' Harvard Business Review, vol. 65, no. 5, pp. 109-20.
Hiam, A 2003, Motivational management: inspiring your people for maximum performance, AMA COM American Management Association, New York.
Hodgetts, RM, Luthans, F & Doh, JP 2006, International management: culture, strategy, and behavior, 6th ed. edn, McGraw-Hill, Boston.
Hoe, SL 2007, 'Shared vision: a development tool for organizational learning', Development and learning in organizations, vol. 21, no. 4, pp. 12-3.
Hoffman, RC 1989, 'Strategies for corporate turnarounds: what do we know about them?' Journal of General Management, vol. 14, no. 3, pp. 46-4.
Hofstede, G 1991, Cultures and Organizations: Software of the Mind, McGraw-Hill, New York.
Hofstede, GH & Hofstede, GJ 2005, Cultures and organizations software of the mind, Rev. and expanded 2nd ed. edn, McGraw-Hill, New York.
Holden, L 1994, 'Training', in I Beardwell & L Holder (eds), Human Resource Management: A Contemporary Perspective, Pitman, London.
Holladay, SJ & Coombs, WT 1994, 'Speaking of visions and vision being spoken', Management Communication Quarterly, vol. 8, no. 1, pp. 165-89.
215

Holmes-Smith, P 2000, 'Introduction to Structural Equation Modelling using AMOS 4.0: course notes', in SREAMS, Melbourne.
Holmes-Smith, P & Rowe, KJ 1994, 'The Development and Use of Congeneric Measurement Models in School Effectiveness Research: Improving Reliability and Validity of Composite and Latent Variables for Fitting Multilevel and Structural Equation Models', paper presented to International Conference for School Effectiveness and Improvement, Melbourne, Australia.
Holmes, H & Tangtongtavy, S 1995, Working in Thais, White Lotus, Bangkok. Holpp, L & Kelly, M 1988, 'Realizing the possibilities', Training & Development, vol.
42, no. 9, pp. 48-55. Holt, DT, Armenakis, AA, Harris, SG & Feild, HS 2006, 'Toward a comprehensive
definition of readiness for change: a review of research and instrumentation', in RW Woodman & WA Passmore (eds), Research in Organizational Change and Development, JAI Press, Greenwich, CT, vol. 16.
Holt, JK 2004, 'Item Parceling in Structural Equation Models for Optimum Solutions', paper presented to the Annual Meeting of the Mid-Western Educational Research Association Columbus, OH, October 13-16.
Homer, M 1997, 'Leadership theory: past, present and future', Team Performance Management, vol. 3, no. 4, pp. 270-87.
Houghton, JD, Bonham, TW, Neck, CP & Singh, K 2004, 'The relationship between self-leadership and personality: A comparison of hierarchical factor structures ',Journal of Managerial Psychology, vol. 19, no. 4, pp. 427-41.
House, RJ 1995, 'Leadership in the twenty-first century', in A Howard (ed.), The Changing Nature of Work, Jossey-Bass, San Francisco, CA.
Hu, L & Bentler, PM 1995, 'Evaluating model fit', in RH Hoyle (ed.), Structural Equation Modelling: Concepts, Issues, and Applications, Sage, Thousand Oaks, CA.
---- 1999, 'Cutoff criteria for fir indexes in covariance structure analysis: Conventional versus new alternatives', Structural Equation Modelling, vol. 6, no. 1, pp. 1-55.
Hughes, MA, Price, RL & Marrs, DW 1986, 'Linking Theory Construction and Theory Testing: Models with Multiple Indicators of Latent Variables',
· Academy of Management Review, vol. 11, no. 1, pp. 128-44. Hui, CH & Villareal, MJ 1989, 'Individualism-Collectivism and psychological needs:
Their relationships in two cultures', Journal of Cross Cultural Psychology, vol. 20, no. 1, pp. 310-23.
Hui, CH & Yee, C 1994, 'The shortened Individualism-Collectivism Scale: Its relationship to demographic and work-related variables', Journal of Research in Personality, vol. 28, no. 1, pp. 409-24.
---- 1999, 'The Impact of Psychological Collectivism and Workgroup Atmosphere on Chinese Employees' Job Satisfaction', Applied Psychology: An International Review, vol. 48, no. 2, pp. 175-85.
Hussey, J & Hussey, R 1997, Business research: a practical guide for undergraduate and postgraduate students, Macmillan Press LTD, Basingstoke, Hampshire.
Hwang, A, Khatri, N & Srinivas, ES 2005, 'Organizational charisma and vision accross three countries', Management Decision, vol. 43, no. 7, pp. 960-74.
Ichniowski, C & Shaw, K 1999, 'The Effects of Human Resource Management Systems on Economic Performance: An International Comparison of U.S. and Japanese Plants', Management Science , vol. 45, no. 5, pp. 704-21.
216

Isabella, L 1990, 'Evolving interpretations as a change unfolds: how managers construe key organizational events', Academy of Management Journal, vol. 33, no. 1, pp. 7-41.
J accard, J & Wan, CK 1996, LISREL Approaches to Interaction Effects in Multiple Regression, Sage, Thousand Oaks, CA.
Janet, HG 1980, 'Upward Communication in Industry: An Experiment ', Human Relations, vol. 33, no. 12, pp. 929-42.
Japanese Chamber of Commerce, B 2006, List of Members, L.K.D.Co.,Ltd., Bangkok. Jassawalla, A, Truglia, C & Garvey, J 2004, 'Cross-cultural conflict and expatriate
manager adjustment: An exploratory study ', Management Decision, vol. 42, no. 7, pp. 837-49.
Jeffries, R 1997, 'Reaping the rewards of recognition', HR Focus, vol. January, pp. 1-9.
Jermier, JM, Knights, D & Nord, WR 1994, Resistance and Power in Organizations, Routledge, London.
Jessop, D 2000, 'What is a structure?' Structural Survey, vol. 18, no. 5, pp. 205-7. Jindal-Snape, D & Snape, JB 2006, 'Motivation of scientists in a government research
institute: Scientists' perceptions and the role of management', Management Decision, vol. 44, no. 10, pp. 1325-43.
JMO Labor 1995, The Present Situation and Future Prospects of the Japanese Style Employment System (Nihon teki toyo seido no genjo to tenbo), JMOL.
John, RS & Michael, HB 1997, 'Cross-cultural leadership dynamics in collectivism and high power distance settings', Leadership & Organization Development Journal, vol. 18, no. 4, pp. 187-93
Johns, G & Saks, AM 2005, Organizational Behavior: Understanding and Managing Life at Work, 6 edn, Pearson, US.
Johnson-Cramer, ME, Cross, RL & Yan, A 2003, 'Sources of Fidelity in Purposive Organizational Change: Lessons from a Re-engineering Case', Journal of Management Studies, vol. 40, no. 7, pp. 1837-70.
Johnson, C 1988, 'Japanese-Style Management in America', Cahfornia Management Review, vol. 30, no. 4, pp. 34-45.
Johnson, G & Leavitt, W 2001, 'Building on Success: Transforming Organizations through an Appreciative Inquiry', Public Personal Management, vol. 30, no. 1, pp. 129-36.
Jones, ML, Blunt, P & Sharma, KC 1996, 'Managerial perceptions ofleadership and management in an African public service organization', Public administration and development, vol. 16, pp. 455-67.
Jones, P & Kahaner, L 1995, Say It and Live It: The 50 Corporate Mission Statements That Hit the Mark, Doubleday, New York, NY.
Jones, RA, Jimmieson, NL & Griffiths, A 2005, 'The Impact of Organizational Culture and Reshaping Capabilities on Change Implementation Success: The Mediating Role of Readiness for Change', Journal of Management Studies, vol. 42, no. 2, pp. 361-86.
Jonsson, B 1988, 'Electromyography Studies of Job Rotation', Scandinavian Journal of Work Environment Health, vol. 1, no. 14, pp. 108-9.
Joreskog, K 1993, 'Testing structural equation models', in KA Bollen & JS Long (eds), Testing Structural Equation Models, Sage, Beverly Hills, CA.
Joreskog, KG 1969, 'A general approach to confirmatory maximum likelihood factor analysis', Psychometric, vol. 34, no. 1, pp. 183-202.
217

Joreskog, KG & Sorbom, D 1993, LISREL 8: Structural Equation Modelling with the SJMPLJS Command Language, Lawrence Erlbaum Associates, Hillsdale, NJ.
---- 1996, PRELIS 2 User's Reference Guide, Scientific Solfware International, Chicago.
Joreskog, KG & Wold, H 1982, Systems Under Indirect Observation, Amsterdam, North-Holland.
Josep, I & Caroline, P 2007, 'Harnessing energy to drive organizational change', McKinsey Quarterly, vol. 1, no. 1, pp. 16-9.
Judson, AS 1991, Changing Behaviour in Organizations: Minimizing Resistance to Change, Blackwell, Cambridge, MA.
Juechter, WM, Fisher, C & Alford, RJ 1998, 'Five conditions for high-performance cultures', Training & Development, vol. 52, no. 5, pp. 63-7.
Kacmar, M, Anderews, M, Van Rooy, D, Steiberg, C & Cerrone, S 2006, 'Sure everyone can be replaced ... but at what cost? Turnover as a predictor of unitlevel performance', Academy of Management, vol. 49, no. 1, pp. 133-44.
Kantabutra, S & Avery, GC 2007, 'Vision effects in customer and staff satisfaction: an empirical investigation', Leadership & Organization Development Journal, vol. 28, no. 3, pp. 209-29.
Kanungo, RN 1987, 'An Alternative to the Intrinsic-Extrinsic Dichotomy of Work Rewards', Journal of Management, vol. 13, no. 4, pp. 751-66.
Kaplan, D 2000, Structural Equation Modelling, Sage, Thousand Oaks, CA. Karen, Z-K & Menno, DJ 2007, 'Evaluating the Communication Satisfaction
Questionnaire as Communication Audit Tool', Management Communication Quarterly, vol. 20, no. 3, pp. 261-82.
Kavanagh, A 1999, Change management journey, 17 /10/2006, <http://www.kpmg.org>.
Kerber, K & Buono, AF 2005, 'Rethinking organizational change: Reframing the challenge of change management', Organization Development Journal, vol. 23, no. 3, pp. 23-38.
Kerr, JL & Slocum, JW 1987, 'Managing corporate culture through reward systems', Academy of Management Executive, vol. 1, no. 2, pp. 99-107.
Kets de Vries, MFR & Balazs, K 1999, 'Transforming the Mind-Set of the Organization', Administration & Society, vol. 30, no. 6, pp. 640-75.
Keys, JB, Denton, LT & Miller, TR 1994, 'The Japanese management theory junglerevisited', Journal of Management, vol. 20, no. 1, pp. 373-402.
Kilduff, M, Funk, JL & Mehra, A 1997, 'Engineering identity in a Japanese factory', Organizational Science, vol. 8, no. 1, pp. 579-92.
Kilpatrick, A & Silverman, L 2005, 'The power of vision', Strategy & Leadership, vol. 33, no. 2, pp. 24-6.
Kinnear, TC & Taylor, JR 1996, Marketing Research: An Applied Approach, 5 edn, McGraw-Hill, Inc, New York.
Kirkman, BL, Jones, RG & Shapiro, DL 2000, 'Why do employees resist teams? Examining the "resistance barrier" to work team effectiveness', The International Journal of Conflict Management, vol. 11, no. 1, pp. 74-92.
Kirkpatrick, SA & Locke, EA 1996, 'Direct and indirect effects on three core charismatic leadership components on performance and attitudes', Journal of
\ Applied Psychology, vol. 81, no. 1, pp. 36-51. ..,
Kline, RB 2005, Principles and Practice of Structural Equation Modelling, The Guilford Press, New York.
218

Kocabiyikoglu, A & Popescu, I 2007, 'Managerial Motivation Dynamics and Incentives', Management Science, vol. 53, no. 5, pp. 834-48.
Kohn, A 1993, 'Why incentive plans cannot work', Harvard Business Review, vol. October, pp. 77-8.
Komin, S 1990, 'Culture and work-related values in Thai organizations', International Journal of Psychology, vol. 25, no. 5, pp. 681-704.
Kosiyanon, L & Yoshihara, K 1985, 'Japanese management in Thailand', Southeast Asian Studies, vol. 22, no. 4.
Kostova, T 1999, 'Transnational transfer of strategic organizational practices: a contextual perspective', Academy of Management Review, vol. 24, no. 1, pp. 308-24.
Kostova, T & Zaheer, S 1999, 'Organizational legitimacy under conditions of complexity: the case of the multinational enterprise', Academy of Management Review, vol. 24, no. 1, pp. 64-81.
Kotter, JP 1995, 'Leading change: why transformation efforts fail', Harvard Business Review, vol. 73, no. 2, pp. 59-67.
---- 1996, Leading change, Harvard Business School Press, Boston, MA. ---- 1997, 'Leading by vision and strategy', Executive Excellence, vol. 14, no. 10, pp.
15-7. Kouzes, JM & Posner, BZ 1987, The Leadership Challenge: How to get
Extraordinary Things Done in Organizations, Jossey-Bass, San Francisco, CA.
Kripanont, N 2007, 'Examining a Technology Acceptance Model of Internet Usage by Academics within Thai Business Schools', PhD thesis, Victoria University.
Kubo, I & Saka, A 2002, 'An inquiry into the motivation of knowledge workers in the Japanese financial industry', Journal of Knowledge Management, vol. 6, no. 3, pp. 262-72.
Kuijer, PPFM, Visser, B & Kemper, HCG 1999, 'Job rotation as a factor in reducing physical workload at a refuse collecting department', Ergonomics, vol. 42, no. 9, pp. 1167-78.
Kumbanaruk, T 1987, 'Japanese QCC in Thailand', paper presented to The Joint Symposium on Thai-Japanese Relations: Development & Future Prospect, Bangkok, Thailand.
Kumer, R 2005, Research Methodology: A step by step.for beginners, 2 edn, Pearson Education Australia, NSW.
Lam, SSK 1997, 'Job satisfaction among quality managers in Hong Kong: a survey', International Journal of Management, vol. 14, no. 1, pp. 103-6.
Lambright, WH 2001, 'Transforming the National Aeronautics and space Administration: Dan Goldin and the Remaking of NASA', in MA Abramson & PR Lawrence (eds), Trans.forming Organizations, Rowman & Littlefield, Lanham, MD.
Landrum, NE, Howell, JP & Paris, L 2000, 'Leadership for strategic change', Leadership & Organization Development Journal, vol. 21, no. 3, pp. 150-6.
Landua, D, Drori, I & Porras, J 2006, 'Vision change in a government R&D organization', The Journal of Applied Behavioural Science, vol. 42, no. 2, pp. 145-71.
Larson, RS & Barnes, S 2001, Building Philanthropy and Nonprofit Academic Centers: A Vievi'from Ten Builders, Kellogg Foundation, New Lenox, IL.
Larsson, R 1993, 'Case study methodology: Quantitative analysis of patterns across case studies', Academy of Management Journal, vol. 36, no. 6, pp. 1515-64.
219

Larwood, L, Falbe, CM, Kriger, MP & Miesing, P 1995, 'Structure and meaning of organizational vision', Academy of Management Journal, vol. 38, no. 1, pp. 740-69.
Laurent, A 2003, 'Entrepreneurial Government: Bureaucrats as Business People', in MA Abramson & AM Kieffaber (eds), New Way o.f Doing Business, Rowman & Littlefield, Lanham, MD.
Lawler, 11 & Atmiyanandana, V 2003, 'HRM in Thailand: A Post-1997 Update', Asia Pacific Business Review, vol. 9, no. 4, pp. 165-85.
Leavitt, H & Bahrami, H 1988, Managerial Psychology, University of Chicago Press, Chicago, IL
Lee, J 1997, 'The motivation of women entrepreneurs in Singapore', International Journal of Entrepreneurial Behaviour & Research, vol. 3, no. 2, pp. 93-110.
Leitch, J, Nieves, D, Burke, G, Little, M & Borin, M 1995, 'Strategies for involving employees', The Journal for Quality and Participation, vol. September, pp. 68-74.
Lewin, K 1951, Field Theory in Social Science, Harper & Row, New York, NY. ---- 1952, Field Theory in Social Science, Tavistock, London. Licata, J & Harper, G 2001, 'Organizational health and robust school vision',
Education Administration Quarterly, vol. 3 7, no. 1, pp. 5-26. Lin, H-F 2007, 'Effects of extrinsic and intrinsic motivation on employee knowledge
sharing intentions', Journal of Information Science, vol. 33, no. 2, pp. 135-49. Lin, MK, Marsteller, JA, Shortell, SM, Mendel, P, Pearson, M, Rosen, M & Wu, S-Y
2005, 'Motivation to Change Chronic Illness Care: Results from a National Evaluation of Quality Improvement Collaborative', Health Care Management Review, vol. 30, no. 2, pp. 139-56.
Lincoln, JR & Kalleberg, AL 1990, Culture, control, and commitment: A study o.f work organization and work attitudes in the United States and Japan, Cambridge University Press, New York, NY.
Lindner, JR 1998, 'Understanding Employee Motivation', Journal of Extension, vol. 36, no. 3.
Lippert, SK & Davis, M 2006, 'A conceptual model integrating trust into planned change activities to enhance technology adoption behavior', Journal of Information Science, vol. 32, no. 5, pp. 434-48.
Locke, EA 1997, 'The motivation to work: what we know', in ML Maehr & PR Pintrich (eds), Advances in Motivation and Achievement, JAi Press Inc, Greenwich, CT.
Locke, EA & Latham, GP 2004, 'What should we do about motivation theory? Six recommendations for the twenty-first century', Academy of Management Review, vol. 29, no. 3, pp. 388-403.
Lok, P & Crawford, J 2000, 'The application of a diagnostic model and surveys in organizational development', Journal of Managerial Psychology, vol. 15, no. 2, pp. 108-25.
---- 2004, 'The effect of organizational culture and leadership style on job satisfaction and organizational commitment: A cross-national comparison', Journal of Management Development, vol. 23 , no. 4, pp. 321-38
Lok, P, Hung, RY, Walsh, P, Wang, P & Crawford, J 2005, 'An Integrative Framework for Measuring the Extent to which Organizational Variables Influence the Success of Process Improvement Programs', Journal of Management Studies, vol. 42, no. 7, pp. 0022-2380.
220

Lucier, C, Cangemi, J & Kowalski , C 1992, 'Developing organizational trust Japanese style: Reconciling Japanese and American management practices', Organizational Development Journal, vol. I 0, no. 2, pp. 49-56.
Lundberg, CD & Peterson, MF 1994, 'The meaning of working in U.S. and Japanese local governments at three hierarchical levels', Human Relations, vol. 47, no. 1, pp. 1459-87.
Luthans, F 1973, Organizational behavior, McGraw-Hill, New York. Luthans, F, Avolio, BJ, Avey, JB & Norman, SM 2007, 'Positive Psychological
Capital: Measurement and Relationship with Performance and Satisfaction', Personal Psychology, vol. 60, no. 3, pp. 541-72.
Mackay, R & Horton, D 2002, Capacity development in planning monitoring and evaluation: results of an evaluation, The Hague, ISNAR.
MacKinnon 2000, 'Contrasts in multiple mediator models', in JS Rose, L Chassin, CC Presson & S Sherman (eds), Multivariate Applications in Substance Use Research: New Methods for New Questions, Erlbaum, Mahwah, NJ.
MacLeod, D & Kennedy, E 1993, Job Rotation System, XYZ Co. Mahoney, D, Trigg, M, Griffin, R & Pustay, M 1998, International Business: a
managerial perspective, Longman, South Melbourne, Australia. Makino, S & Beamish, PW 1998, 'Performance and survival of joint ventures with
non-conventional ownership structures', Journal of International Business Studies, vol. 29, no. 4, pp. 797-818.
Malhotra, NK 2003, Marketing Research: An Applied Orientation, Prentice Hall, Upper Saddle River, NJ.
Manz, C, Bastien, D & Hostager, T 1991, 'Executive Leadership During Organizational Change: A Bi-Cycle Model', Human Resource Planning, vol. 14,no.4,pp.275-87.
Marks, ML 2003, Charging Back Up the Hill: Workplace Recovery after Mergers, Acquisitions, and Downsizings, Jossey-Bass, San Francisco, CA.
Marks, SJ 2001, 'Incentives That Really Reward and Motivate', Woriforce, vol. June, pp. 108-14.
Marsh, HW, Balla, JR & McDonald, RP 1988, 'Goodness of fit in confirmatory factor analysis', Psychological Bulletin, vol. 103, no. 1, pp. 391-410.
Marsh, RM 1992, 'A research note: Centralization of decision-making in Japanese factories', Organization Studies, vol. 13, no. 1, pp. 261-74.
Maruyama, GM 1998, Basics of Structural Equation Modelling, Sage, Thousand Oaks, CA.
Marzec, M 2007, 'Telling the corporate story: vision into action', Journal of Business Strategy, vol. 28, no. 1, pp. 29-36.
Maslow, AH 1954, Motivation and personality, Harper, New York. Mason, RD, Lind, DA & Marchal, WG 1999, Statistical Techniques in Business and
Economics, 10 edn, McGraw-Hill, New York. Matland, RE 1995, 'Synthesizing the Implementation Literature: The Ambiguity
Conflict Model of Policy Implementation', Journal of Public Administration Research and Theory, vol. 5, no. 2, pp. 145-74.
Mayo, E 1949, The Social Problems of an Industrial Civilization , vol. London, Routledge and Kegan Paul.
Mazmanian, DA & Sabatier, PA 1989, Implementation and Public Policy: With a New Postscript, University Press of America, Lanham, MD.
McAdam, R 2003, 'Radical change: a conceptual model for research agenda', Leadership & Organization Development Journal, vol. 24, no. 4, pp. 226-35.
221

Mccampbell, AS, Jongpipitpom, C, Umar, I & Ungaree, S 1999, 'Seniority-based promotion in Thailand: it's time to change', Career Development International, vol. 4, no. 6, pp. 318-20.
McClelland, D 1985, Human Motivation, Scott Foresman, Glenview, IL. McClelland, S 1994, 'Training needs assessment data-gathering methods: Part one,
survey questionnaire', Journal of European Industrial Training, vol. 18, no. 1, pp. 22-6.
McDonald, RP & Ringo, H 2002, 'Principles and practice in reporting structural equation analyses', Psychological Methods, vol. 7, no. 1, pp. 64-82.
McGivem, MH & Tvorik, SJ 1998, 'Vision driven organizations: measurement techniques for group classification', Management Decision, vol. 36, no. 4, pp. 241-64.
McGreevy, M 2003, 'Managing the transition', Industrial and Commercial Training, vol. 35, no. 6, pp. 241-6.
McGregor, D 1967, The professional manager, McGraw-Hill, New York. McMaster, JB 1979, 'Getting the word to the top', Management Review, vol. 68, no. 2,
pp. 62-5. McNamara, TE & Hayashi, K 1994, 'Culture and management: Japan and the West
towards a transnational corporate culture', Management Japan, vol. 27, no. 2, pp. 1-13.
Mead, R 2005, International management: cross-cultural dimensions, 3rd ed. edn, Blackwell, Oxford, UK ; Malden, MA.
Meindl, JR, Ehrlich, SB & Dukerich, JM 1985, 'The romance ofleadership', Administration in Science Quarterly, vol. 30, no. 1, pp. 78-102.
Meyer, CB & Stensaker, IG 2006, 'Developing Capacity for Change', Journal of Change Management, vol. 6, no. 2, pp. 217-31.
Michael, LD 1990, 'Why is there a seniority system? To solve an agency problem', Public Choice, vol. 66, no. 1, pp. 37-50.
Miles, RE & Snow, CC 1978, Organizational Strategy, Structure, and Process, McGraw-Hill, New York, NY.
Miller, C 1991, 'How to construct programs for teams', Training & Development, vol. August, pp. 4-7.
Miller, D & Chen, M 1994, 'Sources and consequences of competitive inertia', Administration in Science Quarterly, vol. 39, no. 1, pp. 1-15.
Millson, F & Kirk-Smith, M 1996, 'The effect of quality circles on perceived service quality in financial service', Journal of Marketing Practice, vol. 2, no. 4, pp. 75-88.
Miroshnik, V 2002, 'Culture and international management: a review', Journal of Management Development, vol. 21, no. 7, pp. 521-44.
Mitchell, TR 1988, People in organizations: an introduction to organizational behaviour in Australia, McGraw-Hill, Sydney.
Moody, RC & Pesut, DJ 2006, 'The Motivation to care', Journal of Health Organization and Management, vol. 20, no. 1, pp. 15-48.
Moran, JW & Brightman, B.K 2001, 'Leading organizational change', Career Development International, vol. 6, no. 2, pp. 111-8.
Morden, T 1997, 'Leadership as vision', Management Decision, vol. 35, no. 9, pp. 668-76.
Morris, KF & Raben, CS 1995, 'The fundamentals of change management', in DA Nadler, RB Shaw & AE Walton (eds), Discontinuous Change: Leading Organizational Transformation, Jossey Bass, San Franciso, CA.
222

Morrison, RF & Hock, RR 1986, 'Career building: Leaming from cumulative work experience', in DT Hall & Associates (eds), Career development in organizations, Jossey-Bass, San Francisco.
Mugyabuso, JFL & Doris, SM 2000, 'Effective library management: issues for managers and subordinates', New Library World, vol. 101, no. 6, pp. 263-9.
Muir, J 1995, 'Effective management through delegation', Work Study, vol. 44, no. 7, pp. 6-7
Mukherji, A & Mukherji, J 1998, 'Structuring organizations for the future: analyzing and managing change', Management Decision, vol. 36, no. 4, pp. 265-73.
Mulaik, SA, James, LR, Van-Alstine, J, Bennett, N, Lind, S & Stilwell, CD 1989, 'Evaluation of goodness of fit indices for structural equation models', Psychological Bulletin, vol. 105, no. 1, pp. 430-45.
Mullen, M 1995, 'Diagnosing measurement equivalence in cross-national research', Journal of International Business Studies, vol. 26, no. 3, pp. 573-96.
Murphy, C, Ramamoorthy, N, Flood, PC & MacCurtain, S 2006, 'Organizational Justice Perceptions and Employee Attitudes among Irish Blue Collar Employees: An Empirical Test of the Main and Moderating Roles of Individualism/Collectivism', Management revue, vol. 17, no. 3, pp. 328-43.
Nadeem, MF, Ahmad, SM & Kim, HK 2002, 'Think globally manage locally', International Journal of Commerce and Management, vol. 12, no. 13, pp. 19-32.
Nadler, D & Tushman, M 1977, 'A diagnostic model for organization behaviour', in JR Hackman, E Lawler & L Porter (eds), Perspectives on Behaviour in Organizations, McGraw-Hill, New York, NY.
N aisbitt, J & Aburdene, P 1985, Reinventing the Corporatation, W am er Books, New York, NY.
Nanus, B 1992, Visionary Leadership, Jossey-Bass, San Francisco, CA. Neergard, H, Sahaw, E & Carter, S 2005, 'The impact of gender, social capital, and
networks on business ownership: a research agenda', International Journal of Entrepreneurial Behaviour & Research, vol. 11, no. 5, pp. 338-57.
Neuman, WL 2006, Social Research Methods: Qualitative and Quantitative Approaches, 6 edn, Pearson/ Allyn&Bacon, Boston.
Newman, KL & Nollen, SD 1996, 'Culture and congruence: the fit between management practices and national culture', Journal of International Business Studies, vol. 22, pp. 753-79.
Nguyen, T-H 2003, 'Travel Behavior and Its Cultural Context: An Empirical Study of Vietnamese Community in Australia', PhD thesis, Victoria University.
Niratpattanasai, K 2000, The New Kid in Town, Asia Pacific Management Forum, Bangkok, <http://www.apmforum.com/ column/thai3 5 .htm>.
Noe, RA & Ford, JK 1992, 'Emerging issues and new directions for training research', Research in Personal and Human Resources Management, vol. 10, no. 1, pp. 345-94.
Nunnally, JC & Bernstein, IH 1994, Psychometric Theory, McGraw-Hill Inc., New York.
Nutt, PC 1993, 'Planned change and organizational success', Journal of Strategic Change, vol. 2, no. 1, pp. 247-60.
Nutt, PC & Backoff, RW 1997, 'Facilitating transformational change', Journal of Applied Behavioral Science, vol. 33, no. 1, pp. 490-508.
O'Connor, EJ & Fiol, CM 2006, 'Creating Organizational Support for Change', The Physician Executive, vol. May-June, pp. 76-8.
223

Oakland, JS & Tanner, SJ 2007, 'A new framework for managing change', The TQM Magazine, vol. 19, no. 6, pp. 572-89.
Odaka, K 1986, Japanese Management: A Forward Looking Analysis, Asian Productivity Organization, Tokyo.
Olberding, S 1998, 'Toyota on competition and quality circles', The Journal for Quality and Participation, pp. 52-4.
Oliver, N & Wilkinson, B 1988, 'British companies fail to understand the key to Japanese success', Employment Bulletin and Industrial Relations Digest, vol. 4, no. 6.
Onishi, J 2006, 'The transferability of Japanese HRM practices to Thailand', Asia Pacific Journal of Human Resources, vol. 44, no. 3, p. 260.
Ortega, J 2001, 'Job Rotation as a Learning Mechanism', Management Science, vol. 47,no. 10, pp. 1361-70.
Oswald, SL, Mossholder, KW & Harris, SG 1994, 'Vision salience and strategic involvement: implications for psychological attachment to organization and job', Strategic Management Journal, vol. 15, no. I, pp. 477-89.
Ouchi, W 1981, 'Theory Z: How American business can meet the Japanese challenge', Business Horizons, vol. 6, no. 24, pp. 82-3.
Paauwe, J 2004, HRM and performance: achieving long-term viability, Oxford University Press, Oxford.
Palvia, S & Chervany, N 1995, 'An experimental investigation of factors influencing predicted success in DSS implementation', Information & Management, vol. 29, no. 1, pp. 43-53.
Pattant, J 2005, SPSS Survival Manual: A step by step Guide to Data Analysis Using SPSS, 2 edn, Allen&Unwin, Crows Nest, Australia.
Patterson, M & West, M 1998, 'People power: the link between job satisfaction and productivity', in R Fincham & P Rhodes (eds), Principles of Organizational Behavior, Ashford Color Press Ltd, U.K.
Patton, KR & Daley, DM 1998, 'Gainsharing in Zebulon: what do workers want?' Public Personal Management, vol. Spring, pp. 117-31.
Paul, S, Samarah, IM, Seetharaman, P & Mykytyn, P 2004, 'An Empirical Investigation of Collaborative Conflict Management Style in Group Support System-Based Global Virtual Teams', Journal of Management Information System, vol. 21, no. 3, pp. 185-222.
Pearce, C 2007, 'Ten steps to staff motivation', Nursing Management, vol. 13, no. 9, p. 21.
Perry, JL, Mesch, D & Paarlberg, L 2006, 'Motivating Employees in a New Governance Ear: The Performance Paradigm Revisited', Public Administration Review, vol. July-August, pp. 505-14.
Peter, J 1981, 'Construct validity: a review of basic issues and marketing practices', Journal of Marketing Research, vol. 18, no. May, pp. 133-45.
Peter, TJ & Watermann, RH 2004, In Search of Excellence, Profile Books, London. Pettigrew, AM & Massini, S 2003, 'Innovative Forms of Organizing: Trends in
Europe, Japan and the USA in the 1990s', in AM Pettigrew, W Ruigrok & T Numagami (eds), Innovative Forms of Organizing, Sage, London.
Peyrot, M 1996, 'Causal analysis: Theory and application', Journal of Pediatric Psychology, vol. 21 , no. 1, pp. 3-24.
Pfeffer, J 1997, New directions for organization theory: problems and prospects, Oxford University Press, New York.
Piczak, MW 1988, 'Quality circles come home', Quality Progress, pp. 3-30.
224

Plamping, D, Gordon, P & Pratt, J 1998, Action Zones and Large Numbers, King's Fund, London.
Plant, R 1987, Managing Change and Making It Stick, Fontana, London. Polonsky, MI & Waller, DS 2005, Designing and Managing A research Project: A
Business Student's Guide, Sage Publication, Inc., Thousand Oaks, CA. Prahalad, CK & Lieberthal, K 1998, 'The end of corporate imperialism', Harvard
Business Review, vol. 76, no . 4, pp. 69-79. Preziosi, R 1980, Organizational Diagnosis Questionnaire, The 1980 Annual
Handbook for Group Facilitators, University Associates, New Jersey. Price, A & Chanal, K 2006, 'Astrategic framework for change management',
Construction Management and Economics, vol. 24, no. 1, pp. 237-51. Priem, RL, Harrison, DA & Muir, NK l 995, 'Structured Conflict and Consensus
Outcomes in Group Decision Making', Journal of Management, vol. 21, no. 4, pp. 691-710.
Proctor, T & Doukakis, I 2003, 'Change management: the role of internal communication and employee development', Corporate Communications: An International Journal, vol. 8, no. 4, pp. 268-77.
Putti, J & Chong, T 1986, 'Human resources management practices of Japanese organizations', Singapore Management Review, vol. 8, no. 2, pp. 11-9.
Quintana, SM & Maxwell, SE 1999, 'Implications of recent developments in structural equation modelling for counseling psychology', The Counseling Psychologist, vol. 27, no. 1, pp. 485-527.
Randall, DM & Gibson, AM 1991, 'Ethical Decision Making in the Medical Profession: An Application of the Theory of Planned Behavior', Journal of Business Ethics, vol. 10, no. 1, pp. 111-22.
Recardo, RF 1995, 'Overcoming resistance to change', National Productivity Review, vol. 14, no. 2, pp. 5-12.
Redding, SG & Casey, TW 1975, 'Managerial beliefs among Asian managers', paper presented to Academy of Management, New Orleans.
Reis, HT & Judd, CM 2000, Handbook of Research Methods in Social and Personality Psychology, Cambridge University Press, New York.
Reisinger, Y & Turner, L 2000, 'Structural equation modelling with Lisrel: Application in tourism', Monash University.
Reyneirse, JH 1994, 'Ten commandments for CEOs seeking organizational change', Business Horizons, vol. 37, no. 1, pp. 40--5.
Reynolds, N, Diamantopoulos, A & Schelglmilch, B 1993, 'Pre-testing in questionnaire design: A review of the literature and suggestions for further research', Journal of Market Research Society, vol. 35, no. 2, pp. 171-82.
Rhoades, L, Eisenberger, R & Armeli, S 2001, 'Affective commitment to the organization: The contribution of perceived organizational support', Journal of Applied Psychology, vol. 86, no. 5, pp. 825-36.
Rhody, JD & Tang, TL 1995, 'Learning from Japanese transplants and American corporations', Public Personal Management, vol. 24, no. 1, pp. 19-32.
Richards, E 1987, 'Clashing Cultures in Corporations', San Jose Mercury News, November 10.
Richardson, T 2007, 'Why focusing on processes business management', Management Service, vol. Autumn, pp. 34-7.
Roach, D & Bednar, D 1997, 'The theory of logical types: a tool for understanding levels and types of change in organizations', Human Relations, vol. 50, no. 6, pp. 671-99.
225

Robbins, SP 1998, Organizational Behaviour: Concepts, Controversies, Applications, Prentice-Hall, NJ.
---- 2001, Organizational Behavior, Prentice Hall , Upper Saddle River, NJ. ---- 2001, Organizational behavior: leading and managing in Australia and New
Zealand, 3rd ed. edn, Pearson Education Australia, Frenchs Forest, N.S.W. Robbins, SP, Bergman, R, Stagg, L & Coulter, M 2003, Management, 3 edn, Prentice
Hall, Australia. Robert, B 1984, 'The Effects of a Neutral Third Party on Academic Bargaining
Relationships and Campus Climate', The Journal of Higher Education, vol. 55, no. 6, pp. 719-34.
Roberts, H & Brown, A 1992, 'Cognitive and social dimensions ·of IT implementation', paper presented to British Academy of Management 6th Annual Conference, Bradford, 14-16 September.
Robinson, J, Shaver, P & Wrightsman, L 1991, 'Criteria for scale selection and evaluation', in J Robinson, P Shanver & L Wrightsman (eds), Measures of personality and social psychological attitudes, Academic Press, San Diego, CA
Rodgers, R & Wong, J 1996, 'Human factors in the transfer of the Japanese best practice: manufacturing system to Singapore", International Journal of Human Resource Management, vol. 7, no. 2, pp. 455-88.
Rohitratana, K 1998, 'The role of Thai values in managing information systems; a case study implementing as MRP systems', paper presented to Proceedings of the Fifth International Working Conference of IFIP WG 9.4-Implementation and Evaluation of Information System in Developing Countries, February 18-20, London School of Economics and Political Science and Asian Institute of Technology Bangkok.
Roscoe, JT 1975, Fundamental research statistics for the behavioural sciences, 2 edn, Holt, Rinehart and Winston, New York.
Rosenberg, MJ 1956, 'Cognitive structure and attitudinal affect', Journal of Abnormal and Social Psychology, vol. 53, no. I, pp. 367-72.
Rosenberg, R 2003 , 'The Eight Rings of Organizational Influence: How to Structure Your Organization for Successful Change', Association for Quality & Participation, vol. Summer, pp. 30-4.
Rowley, J 1996, 'Motivation of staff in libraries', Library Management, vol. 17, no. 5, pp. 31-5.
Ruthankoon, R & Ogunlana, SO 2003, 'Testing Herzberg's two-factor theory in the Thai construction industry', Engineering Construction and Architectural Management, vol. 10, no. 5, pp. 333-41.
Sashkin, M 1985, 'Creating a corporate excellence culture: identifying levers and how to use them', Expender, vol. 21, no. 145, pp. 36-9.
---- 1988, 'The visionary leader', in J Conger & B Kanungo (eds), Charismatic Leadership: The elusive Factor in Organizational Effectiveness, Jossey-Bass, San Francisco, CA
Satow, T & Wang, ZM 1994, 'Cultural and organizational factors in human resource management in China and Japan', Journal of Managerial Psychology, vol. 9, no. 4, pp. 3-11.
Saunders, ML, Lewis, P & Thornhill , A 2003, Research Methods for Business Students , 3 edn, Prentice Hall, Upper Saddle River, NJ .
226

Schein, E 1985, 'How culture forms, develops and changes', in R Kilmann, M Saxton & R Serpa (eds), Gaining Control of the Corporate Culture, Jossey Bass, San Francisco, CA, pp. 17-43.
---- 1986, 'Management Development as a Process of Influence', in MD Richards & N W.A. (eds), Readings in Management, South-Western Publishing Co, U.S.
Schein, EH 2004, Organizational Culture and Leadership 3edn, Jossey-Bass, San Francisco.
Schlossberg, NK 1981, 'A model for analyzing human adaptation to transition', The Counseling Psychologist, vol. 9, no. 2, pp. 2-18.
Schumacker, RE & Lomax, RG 2004, A Beginner's Guide to Structural Equation Modelling, 2 edn, Lawrence Erlbaum Associates, Inc., London.
Schumaker, RE & Lomax, RG 1996, A Beginner's Guide to Structural Equation Modelling, Elbraum Associates, Mahwah, NJ.
Scott, WR 2001, Institutions and Organizations, Sage, Thousand Oaks, CA. Sedgwick, MW 1995, 'Does Japanese management travel in Asia?' Conference
Volume. Sekaran, U 2003, Research Methods for Business: A Skill Building Approach, John
Wiley and Sons, New York. Self, DR 2007, 'Organizational change-overcoming resistance by creating readiness',
Development and learning in organizations, vol. 21, no. 5, pp. 11-3. Senge, PM 1997, The Fifth Discipline: The Art & Practice of The Learning
Organization Currency Doubleday, New York, NY. Shammout, A 2008, 'Evaluating an extended relationship marketing model for Arab
guests of five-star hotels', PhD thesis, Victoria University. Sharma, S 1996, Applied Multivariate Techniques, John Wiley & Sons, Inc., NJ. Shaughnessy; J & Zechmeister, EB 1997, Research Methods in Psychology, 4 edn,
McGraw-Hill, New York. Shimada, JY, Jenkins, KM & Goslin, LN 1983, 'Quality Circles Can Meet the
Challenge', Business Forum, vol. 3, no. 1, pp. 18-21. Silverman, D 2006, Interpreting Qualitative Data: Methods for Analyzing Talk, Text
and Interaction, 3 edn, SAGE, London. Simachokdee, V 1998, 'TQM ... How not to fail', Rangsit Business Review, vol. 1, no.
1, pp. 80-4. Skinner, BF 1969, Contingencies of Reinforcement, Appleton-Century-Crofts, New
York. Smith, DK l 996a, 'Driving change at Bell Atlantic', Planning Review, vol. 22, no. 5,
pp. 25-7. ---- 1996b, Taking Change of Change: 10 Principles for Managing People and
Performance, Addison-Wesley, Reading, MA. Smith, I 2005, 'Achieving readiness for organizational change', Library Management,
vol. 26, no. 7, pp. 408-12. Smith, T & Kimmel, M 2005, 'The Hidden Discourse of Masculinity in Gender
Discrimination Law', Journal of Women in Culture and Society, vol. 30, no. 1, pp. 1827-49.
Snyder, NH & Graves, M 1994, 'Leadership and vision', Business Horizons, vol. 37, no. 1, pp. 25-42.
Solomon, M 1994, Consumer Behaviour, Allyn & Bacon, Boston, MA. Sopector, PE 1992, Summated Rating Scale Construction: An Introduction, Sage
Publications, Inc, Newbury Park, CA.
227

Sorod, B 1991, 'The Influence of National and Organizational Cultures on Managerial Values, Attitudes, and Performance', The University of Utah.
Staber, U & Sydow, J 2002, 'Organizational adaptive capacity: a structuration perspective', Journal of Management Inquiry, vol. 11, no. 4, pp. 408-24.
Stajkovic, AD & Luthans, F 1997, 'A Meta-Analysis of the Effects of Organizational Behavior Modification on Task Performance', Academy of Management Journal, vol. 40, no. 1, pp. 1122-49.
---- 2003, 'Behavioral Management and Task Performance in Organizations: Conceptual Background, Meta-Analysis, and Test of Alternative Models', Personal Psychology, vol. 56, no. 1, pp. 155-94.
Starrs, R 2004, Japanese cultural nationalism, Global oriental, UK, UK. Steers, RM 1987, 'Murray's manifest needs theory', in RM Steers & L Porter (eds),
Motivation and work behavior, McGraw-Hill, New York. Steers, RM, Porter, LW & Bigley, GA 1996, Motivation and leadership at work,
McGraw-Hill, New York. Steiger, JH 1989, Causal Modelling: A Supplementary Module for SYSTAT and
SYGRAPH, SYSTAT, Evanston, IL. Stinson, JE & Johnson, TW 1977, 'Tasks, Individual Differences, and Job
Satisfaction', Industrial Relation, vol. 16, no. 3, pp. 315-22. Strange, JM & Mumford, MD 2002, 'The origins of vision: charismatic versus
ideological leadership', Leadership Quarterly, vol. 13, no. 343-77. Street, DL & Bishop, AC 1991, 'An Empirical Examination of the Need Profiles of
Professional Accountants', Behavioral Research in Accounting, vol. 3, no. 1, pp. 97-116.
Strickler, J 2006, 'What Really Motivates People?' The Journal for Quality and Participation, vol. Spring, pp. 26-8.
Stroh, L & Caligiuri, PM 1998, 'Increasing global competitiveness through effective people management', Journal of World Business, vol. 33, no. 1, pp. 1-16.
Styhre, A 2002, 'Constructing the other: a post-colonial critique of the adaptation of Japanese human resource management practices', Management Decision, vol. 40, no. 3, pp. 257-65.
Sugiman, T 1998, 'Group Dynamics in Japan', Asian Journal of Social Psychology, vol. 1, no. 1, pp. 51-74.
Sutton, S, French, DP, Hennings, S, Mitchell, J, Wareham, NJ, Griffin, S, Hardeman, W & Kinmonth, L 2003, 'Eliciting Salient Beliefts in Research on the Theory of Planned Behavior: The Effect of Question Wording', Current Psychology: Development, Learning, Personality, Social, vol. 22, no. 3, pp. 234-51.
Szulanski, G & Jensen, RJ 2006, 'Presumptive Adaptation and The Effectiveness of Knowledge Transfer', Strategic Management Journal, vol. 27, no. 1, pp. 937-57.
Takahashi, K 2006, 'Effects of wage and promotion incentives on the motivation levels of Japanese employees', Career Development International, vol. 11, no. 3, pp. 193-203.
Tanachnick, BG & Fidell, LS 2007, Using Multivariate Statustics, 5 edn, Pearson/ Allyn&Bacon, Boston.
Tang, TL-P, Tollison, PS & Whitside, HD 1989, 'Quality Circle Productivity as Related to Upper-Management Attendance, Circle Initiation, and Collar Color', Journal of Management, vol. 15, no. 1, pp. 101-13.
Tannock, J, Krasachol, L & Sruangpermpool, S 2001, 'The development of total quality management in Thailand manufacturing SMEs: A case study
228

approach', International Journal of Quality & Reliability Management, vol. 19,no.4,pp.380-95.
Taormina, RJ & Lao, SK 2007, 'Measuring Chinese entrepreneurial motivation', International Journal of Entrepreneurial Behaviour & Research, vol. 13, no. 4, pp. 200-21.
Taylor, FW 1947, Scientific Management, Harper&Row, London. Taylor, SA, Celuch, K & Goodwin, S 2004, 'The Importance of Brand Equity to
Customer Loyalty', Journal of Product & Brand Management, vol. 13, no. 4, pp. 217-27.
Testa, MR 1999, 'Satisfaction with organizational vision, job satisfaction and service efforts: an empirical investigation', Leadership & Organization Development Journal, vol. 20, no. 3, pp. 154-61.
Tharmmaphornphilas, W & Norman, BA 2004, 'A Quantitative Method for Determining Proper Job Rotation Intervals', Annals of Operations Research, vol. 128, no. 1, pp. 251-66.
Thomas, DC 2001, Essentials of International Management, 1 edn, Sage Publications, Inc, California.
Thorndike, EL 1999, Education psychology: briefer course Routledge, London. Thurly, K & Wirdenius, H 1989, Towards European Management, Pitman, London. Ticehurst, G & Veal, A 2000, Business research methods: a managerial approach,
Pearson Education Australia, NWS. Tichy, N 1983, Managing Strategic Change: Technical, Political and Cultural
Dynamics, Wiley & Sons, New York, NY. Tichy, NM & Sherman, S 1994, Control Your Own Destiny or Someone Else Will,
Harper Business, New York, NY. Todd, C, Billy, FW & James, R 1988, Research in Corrections, 1, The National
Institute of Corrections. Tourish, D & Robson, P 2006, 'Sense making and the Distortion of Critical Upward
Communication in Organizations', Journal of Management Studies, vol. 43, no. 3, pp. 711-30.
Trafimow, D & Finlay, KA 2001, 'Evidence for improved sensitivity of withinparticipants analyses in tests of the theory of reasoned action', The Social Science Journal, vol. 38, no. 1, pp. 629-35.
Triandis, H 1985, 'Values, attitudes and interpersonal behavior', in D Levine (ed.), Nebraska Symposium on Motivation, University of Nebraska Press, Lincoln, NE.
Trochim, WMK 2006, Descriptive Statistics, The Research Methods Knowledge Base, 11/3/2008.
Tsutsui, WM 1998, Manufacturing Ideology: Scientific Management in TwentiethCentury Japan, Princeton University Press, Princeton, NJ.
Tucker, BA & Russell, RF 2004, 'The Influence of the Transformational Leader', Journal of Leadership and Organizational Studies, vol. 10, no. 4, pp. 103-11.
Tucker, L & Lewis, C 1973, 'A reliability coefficient for maximum likelihood factor analysis', Psychometric, vol. 38, no. 1, pp. 1-10.
Tull, DS & Hawkins, DI 1990, Marketing Research: Measurement and Method: A Text with Case, 5 edn, Macmillan, New York.
Turnbull, P, Oliver, N & Wilkinson, B 1992, 'Buyer-supplier relations in the U.K Automotive industry: Strategic implications of the Japanese manufacturing model', Strategic Management Journal, vol. 13, no. 1, pp. 159-68.
229

Turner, D & Crawford, M 1998, Change Power: Capabilities that Drive Corporate Renewal, Business and Professional Publishing, Warriewood, NSW.
Turner, RL 2007, 'The Development of a Two-Stage Regression Model Describing the IS Graduate', PhD thesis, Monash University.
Tushman, ML & Anderson, P 1997, Managing Strategic Innovation and Change, Oxford University Press, New York, NY.
Tvorik, SJ & McGivern, MH 1997, 'Determinants of organizational performance', Management Decision, vol. 35, no. 6, pp. 417-35.
Ullman, JB 2001, 'Structural Equation Modelling', in BG Tabachnick & LS Fidell (eds), Using Multivariate Statistics, 4 edn, Allyn and Bacon, Boston.
Vakola, M & Nikolaou, I 2005, 'Attitudes towards organizational change: what is the role of employees' stress and commitment?' Employee relations, vol. 27, no. 2, pp. 160-74.
Valeie, I & Kim, S 2000, Managing Change in the NHS: Organizational Change, National Coordinating Center for NHS Service Delivery and Organization R&D, London.
VanGundy, A 1988, Techniques of Structured Problem Solving, Van Nostrand, New York, NY.
Vanlear, CA & Mabry, EA 1999, 'Testing Contrasting Interaction Models for Discriminating between Consensual and Dissentient Decision-Making Groups', Small Group Research, vol. 30, no. 1, pp. 29-58.
Veal, AJ 2006, Research Methods for Leisure and Tourism, 3 edn, Financial Times Prentice Hall, New York.
Veroff, J & Veroff, JB 1980, Social incentives: A life span development approach, Academic Press, New York.
Vignali, C 1997, 'Motivation factors that force a sales training program and the experience within the brewing industry', Industrial and Commercial Training, vol. 29, no. 1, pp. 10-5.
Vilkas, M 2006, 'Modelling of Planned Change of Organizational Work Processes in Terms of Process' Internal Structure', Engineering Economics, vol. 4, no. 9, pp. 76-86.
Visser, PS, Krosnick, JA & Lavrakas, PJ 2000, 'Survey research', in HT Reis & CM Judd (eds), Handbook of Research Methods in Social and Personality Psychology, Cambridge University Press, New York.
Waal, AAd 2004, 'Stimulating performance-driven behaviour to obtain better results', International Journal of Productivity and Performance Management, vol. 53, no. 4, pp. 301-16.
Wagner, JAi 1995, 'Studies of individualism-collectivism: Effects on cooperation in groups', Academy of Management Journal, vol. 38, no. 1, pp. 152-72.
Waldman, DA, Ramirez, GG, House, RJ & Puranam, P 2001, 'Does leadership matter? CEO leadership attributes and profitability under conditions of perceived environmental uncertainty', Academy of Management Journal, vol. 44,no. l,pp. 134-43.
Wang, K & Liu, HM 2006, 'A fuzzy aggregation approach to group decision-making based on centroid measurement', Expert System, vol. 23, no. 5, pp. 313-22.
Waterman, RH, Peters, TJ & Phillips, JR 1980, 'Structure is not organization', The McKinsey Quarterly, vol. Summer, pp. 2-20.
Weisbord, MR 1978, Organizational Diagnosis: A Workbook o.f Theory and Practice, Addison-Wesley, Reading, MA.
230

Wennekers, S, Thurik, R, Stel, A & Noorderhaven, N 2007, 'Uncertainty avoidance and the rate of business ownership across 21 OECD countries1976-2004', Journal of Evolutionary Economics, vol. 17, no. 2, pp. 133-60.
Wexley, KN & Latham, GP 1991, Development and training human resources in organizations, Harper Collins, New York,, NY.
Wheaton, B, Muthen, B, Alwin, DF & Summers, GF 1977, 'Assessing reliability and stability in panel models', in DR Heise (ed.), Sociological Methodology, Jossey-Bass, San Francisco.
Wiley, C 1997, 'What motivates employees according to over 40 years of motivation surveys', International Journal of Manpower, vol. 18, no. 3, pp. 263-80.
William, FS & Onishi, J 2003, 'Culture and conflict: Japanese managers and Thai subordinates', Personal Review, vol. 32, no. 2, pp. 187-210.
Williams, TC & Rains, J 2007, 'Linking Strategy to Structure: The Power of Systematic Organization Design', Organization Development Journal, vol. 25, no. 2, pp. 163-70.
Winch, GW 1995, 'Developing consensus: reflections on a model-supported decision process', Management Decision, vol. 33, no. 6, pp. 22-31.
Wong, MML, College, L, Tei, F & Mun, T 1997, 'Human resource policies in two Japanese retail stores in Hong Kong', International Journal of Manpower, vol. 18, no. 3, pp. 281-95 .
Wood, J, Wallace, J & Zeffane, RM 2001, Organizational Behaviour: A global perspective, 2 edn, Wiley & Sons Inc, Australia.
Wright, PC, Geroy, GD & Baker, N 1996, 'Managing expatriates: a systems approach', Management Decision, vol. 34, no. 10, pp. 32-42.
Yamaguchi, I 2001, 'Perceived organizational support for satisfying autonomy needs of Japanese white-coHar workers: A comparison between Japanese and US- . affiliated companies ', Journal of Managerial Psychology, vol. 16, no. 6, pp. 434-48.
Yamane, T 1973, Statistics: an introductory analysis, 3 edn, Harper & Row, New York.
Yao, X & Wang, L 2006, 'The predictability of normative organizational commitment for turnover in Chinese companies: a cultural perspective', International Journal of Human Resource Management, vol. 17, no. 6, pp. 1058-75.
Yavas, U & Bodur, M 1999, 'Satisfaction among expatriate managers: correlates and consequences', Career Development International, vol. 4, no. 5, pp. 261-9
Yin, RK 1994, Case Study Research: Design and Methods, Sage Publications, Beverly Hills, CA.
Young, DR 2004, The music of management: applying organization theory, Ashgate, Burlington, VT.
Young, GJ 2001, 'Transforming the Veterans Health Administration: The Revitalization ofVHA', in MA Abramson & PR Lawrence (eds), Transforming Organizations, Rowman & Littlefiled, Lanham, MD.
Young, SM 1992, 'A framework for successful adaptation and performance of Japanese manufacturing practices in the United States', Academy of Management Review, vol. 17, no. 1, pp. 677-700.
Youngdahl, WE, Waldman, DA & Andres, GC 1998, 'Leading to total quality transformation at Goodyear-Oxo, Mexico' , Journal of Management Inquiry, vol. 7, no. 1, pp. 59-66.
Yukl, GA 2002, Leadership in Organizations, Prentice Hall , Upper Saddle River, NJ.
231

Zeidan, S 2006, 'The relationship between high commitment management and employee attitudes and behaviours: the role of psychological contract fulfilment and justice', PhD thesis, Victoria University.
Zikmund, WG 2003, Business Research Methods, 7 edn, Thomson, Cincinnati, OH. Zineldin, M 2007, 'International business relationship and entry modes: A case of
Swedish automotive industry Scania and Volvo in Mexico', Cross Cultural Management: An International Journal, vol. 14, no. 4, pp. 365-86.
Zineldin, M & Jonsson, P 2000, 'An examination of the main factors affecting trust/commitment in supplier-dealer relationships: an empirical study of the Swedish wood industry', The TQM Magazine, vol. 12, no. 4, pp. 245-65.
Zoller, MH & Fairhurst, GT 2007, 'Resistance leadership: The overlooked potential in critical organization and leadership studies', Human Relations, vol. 60, no. 9, pp. 1331-60.
232
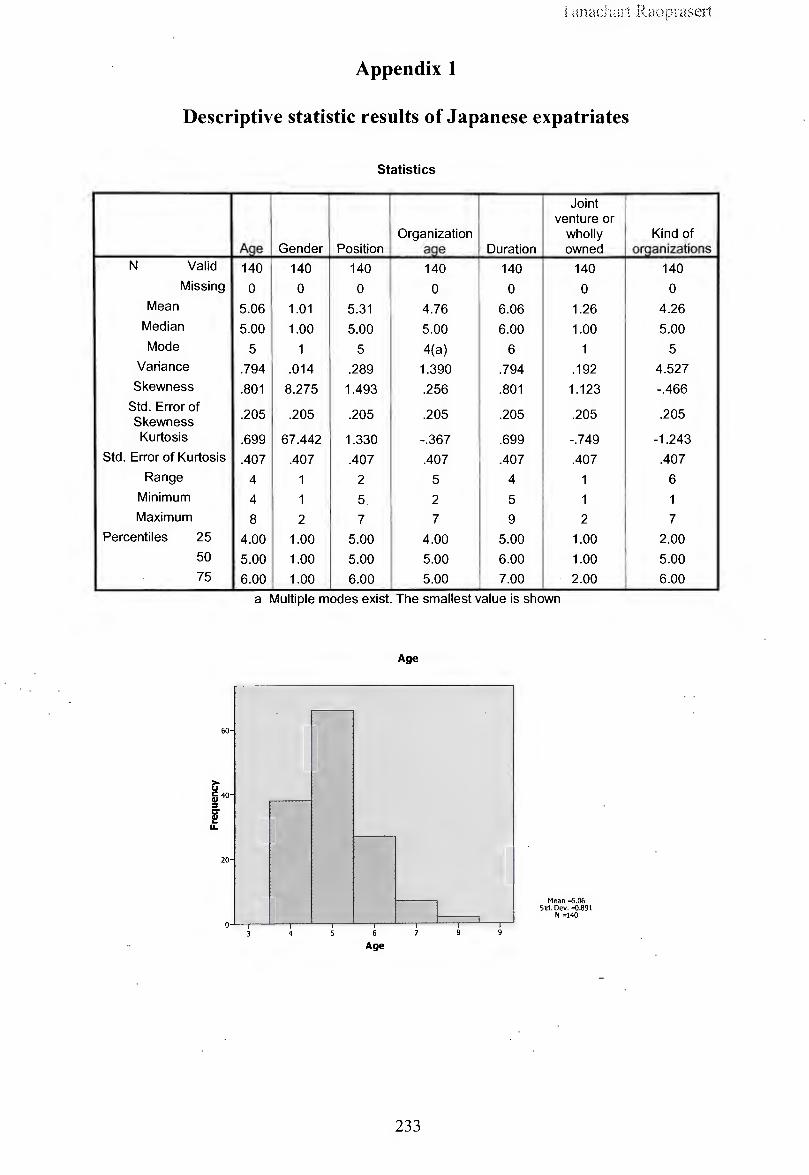
' l q i anac;wrt xu.ioprasert
Appendix 1
Descriptive statistic results of Japanese expatriates
N Valid
Missing
Mean
Median
Mode
Variance
Skewness
Std. Error of Skewness Kurtosis
Std. Error of Kurtosis
Range
Minimum
Maximum
Percentiles 25
50
75
60
20
Statistics
Joint venture or
Organization wholly Age Gender Position aqe Duration owned
140 140 140 140 140 140
0 0 0 0 0 0
5.06 1.01 5.31 4.76 6.06 1.26
5.00 1.00 5.00 5.00 6.00 1.00
5 1 5 4(a) 6 1
.794 .014 .289 1.390 .794 .192
.801 8.275 1.493 .256 .801 1.123
.205 .205 .205 .205 .205 .205
.699 67.442 1.330 -.367 .699 -.749
.407 .407 .407 .407 .407 .407
4 1 2 5 4 1
4 1 5 2 5 1
8 2 7 7 9 2
4.00 1.00 5.00 4.00 5.00 1.00
5.00 1.00 5.00 5.00 6.00 1.00
6.00 1.00 6.00 5.00 7.00 2.00
a Multiple modes exist. The smallest value is shown
I
4 6
Age
Age
I
233
I I I
Mean =5.06 Std. Dev. ~.891
N =140
Kind of orqanizations
140
0
4.26
5.00
5
4.527
-.466
.205
-1.243
.407
6
1
7
2.00
5.00
6.00

(j' c QI :I
--- . -
,_ 125
> I.I c
100
8 75
~ ... 0
5-
0
120-
100-
80
0.5
w 60
u.
40
20-
--
Gender
1.5
Gendel"
Position
-2.5
I
II
l,_tndchart Raupn.tsert
Mean =1.01 Std. Dev. =0.119
N =140
Mean =5.31 Std. Dev. =0.538
i-'--+----,~---+---~---1----~-----1'- N =HO
50
40
> u 30 c ~ w u.
20
10
4.5 5 5.5 6 6.5 7.5
Position
Organization age
Organization age
234
Mean "4.76 SoJ. Dev. =1.J 79
N =140

60 -
,_ 20
'\
I 0 4
120
100-
BO-
> g !! w 60-
... 40
20
~ c GI
40
30
&20 !! u.
10
0.5
Duration
I 7
Duration
T
I I
9
Joint venture or v.tiolly owned
1 LS 2
Joint venture or wholly owned
Kind of organizations
--
-
'----
f----
I I 2 4
Kind of organizations
235
I 10
2.5
11
1:
Mean =6.06 Std. Dev. =0.891
N =140
Mean =1.26 Std. Dev. =0.439
N =140
Mean =4.26 Std. Dev. =2.128
N =140

Japanese management practices in Thailand- Answered by Japanese expatriates
I
N Valid
Missing
Mean
Median
Mode
Variance
Skewness
Std. Error of Skewness Kurtosis
Std. Error of Kurtosis
Range
Minimum
Maximum
Percentiles 25
50
75 II
Lifetime employment
> u ~ :I
30
~ 20 IL
10
140
0
4.84
5.00
4
1.874
-.172
.205
-.639
.407
5
2
7
4.00
5.00
6.00
Statistics
Consensus decision-makin~
140
0
5.11
5.00
4
1.434
-.158
.205
-.309
.407
5
2
7
4.00
5.00
6.00
Lifetime employment
6
Lifetime employment
236
Seniority system
140
0
4.83
5.00
4
1.568
-.094
.205
-.540
.407
5
2
7
4.00
5.00
6.00
House union
140
0
4.79
5.00
5
1.360
.026
.205
-.503
.407
5
2
7
4.00
5.00
6.00
Mean "'4.84 Std. Dev. =l.369
N =140
Quality Job control
rotation circles
140 140
0 0
5.00 5.06
5.00 5.00
5 4
1.439 1.1 91
-.152 -.014
.205 .205
-.512 -.612
.407 .407
5 5
2 2
7 7
4.00 4.00
5.00 5.00
6.00 6 .00
I

SQ
40
> !::! 30 cu :I
~ ... 20
10
I
so
40
10
Consensus decision-making
6
Consensus decision-making
Seniority system
-
~ -
4
Seniority system
House union
4
House union
237
Mean =5.11 Sia. Dev. =l.198
N =140
Mean ~.83 Sid_ Dev. =l-252
N =140
Mean =4.79 Sid. Dev. =l.1 66
N =140

so
qo
> U JO
~ ~ ...
20
so
•o
10
-
-
-
Job rotation
Job rotation
Quality control circles
-
-
_J 6
Quality control circles
238
~
Mean =5 Std . Dev. =1.2
N =140
Mean =5.06 Std. 'Dev. =I.09 1
N =140

Motivational Factors for Adaptation of Japanese management practices
VISION Statistics
Vision1 Vision2 Vision3 Vision4 Visions N Valid 140 140 140 140 140
Missing 0 0 0 0 0 Mean 5.11 5.17 5.18 5.05 5.06
Median 5.00 5.00 5.00 5.00 5.00 Mode 5 5 5 5 6
Variance 1.124 1.596 1.241 1.343 1.421 Skewness -.342 -.828 -.328 -.267 -.241
Std. Error of Skewness .205 .205 .205 .205 .205 Kurtosis .595 .954 -.100 -.351 -.556
Std. Error of Kurtosis .407 .407 .407 .407 .407 Range 6 6 5 5 5
Minimum 1 1 2 2 2 Maximum 7 7 7 7 7
Percentiles 25 4.00 5.00 4.00 4.00 4.00 50 5.00 5.00 5.00 5.00 5.00 75 6.00 6.00 6.00 6.00 6.00
Vision1
Cumulative Frequency Percent Valid Percent Percent
Valid Not at all 1 .7 .7 .7 Seldom 5 3.6 3.6 4.3
Sometimes 34 24.3 24.3 28 .6 Frequently 48 34.3 34.3 62.9
Almost always 40 28.6 28.6 91.4 Always 12 8.6 8.6 100.0 Total 140 100.0 100.0
Vision2
Cumulative Frequency Percent Valid Percent Percent
Valid Strongly disagree 2 1.4 1.4 1.4
Moderately disagree 3 2.1 2.1 3.6
Slightly disagree 9 6.4 6.4 10.0
Neither agree nor 18 12.9 12.9 22 .9 disagree
Slightly agree 49 35.0 35.0 57.9
Moderately agree 41 29.3 29.3 87.1
Strongly agree 18 12.9 12.9 100.0 Total 140 100.0 100.0
239
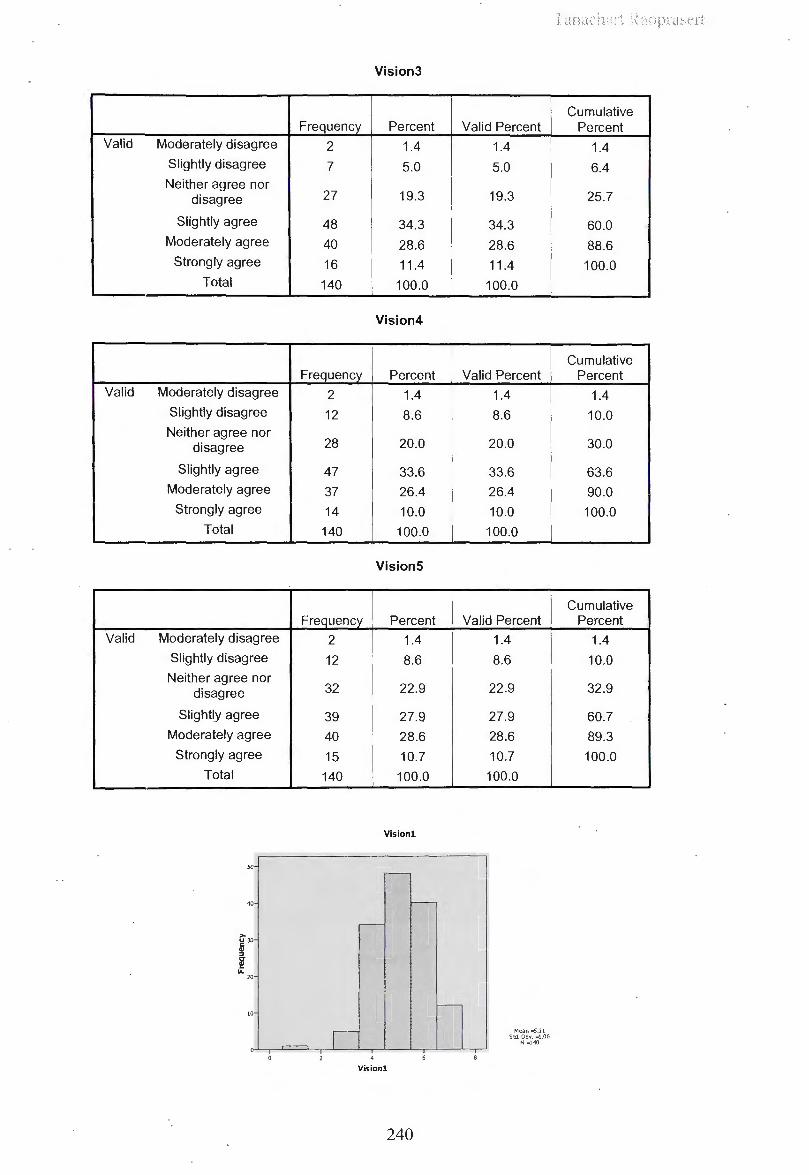
I Valid
Valid
I
I
Valid
Moderately disagree
Slightly disagree
Neither agree nor disagree
Slightly agree
Moderately agree
Strongly agree
Total
Moderately disagree
Slightly disagree
Neither agree nor disagree
Slightly agree
Moderately agree
Strongly agree
Total
Moderately disagree
Slightly disagree
Neither agree nor disagree
Slightly agree
Moderately agree
Strongly agree
Total
50
40
... u 30
~ ~ u.
20
10
I
I
I
Vision3
Frequency Percent
2 1.4
7 5.0
27 19.3
48 34.3
40 28.6
16 11.4
140 100.0
Vision4
Freauencv Percent
2 1.4
12 8.6
28 20.0
47 33.6
37 26.4
14 10.0
140 100.0
Visions
Freauencv Percent
2 1.4
12 8.6
32 22 .9
39 27.9
40 28.6
15 10.7
140 100.0
Visionl
Vis ion!
240
Valid Percent
1.4
5.0
19.3
34.3
28.6
11.4
100.0
Valid Percent
1.4
8.6
20.0
33.6
26.4
10.0
100.0
Valid Percent
1.4
8.6
22.9
27.9
28.6
10.7
100.0
Mean =5.11 Std. Dev. =l.06
N =140
Cumulative Percent
1.4
6.4
25.7
60.0
88.6
100.0
Cumulative Percent
1.4
10.0
30.0
63.6
90.0
100.0
Cumulative Percent
'
1.4
10.0
32.9
60.7
89.3
100.0

50
40
> ~ 30 GI ::I
¥ II.
20
10
0 0
40
()'30
! !
20
10
50
> 40 u ~ 30 ::l
~ 20 u..
10
0 2
Vision2
4
Vision2
Vision3
4
Vision3
Vision4
4 6
Vision4
241
8
·ranach <ni
Mean =S.17 Std. Dev. =1.263
N =140
Mean =5.18 Std. Oev. =1.114
N =140
Mean =5.05 Std. Dev. =1.
159 N =140

N Valid I Missing
Mean
Median
Mode
Variance
Skewness
Std. Error of Skewness
Kurtosis I
Std. Error of Kurtosis
Range
Minimum
Maximum
Percentiles 25
50
75
Visions
4
Visions
Leadership
Statistics
Leadership1 Leadership2
140 140
0 0
4.85 5.11
5.00 5.00
5 5
1.136 1.124
-.274 -.342
.205 .205
-.035 .595
.407 .407
5 6
2 1
7 7
4.00 4.00
5.00 5.00
5.75 6.00
242
Lmachm1
Mean =5.06 Std. Dev. =l.192
N =140
Leadership3 Leadership4
140 140
0 0
5.17 5.18
5.00 5.00
5 5
1.596 1.241
-.828 -.328
.205 .205
.954 -.100
.407 .407
6 5
1 2
7 7
5.00 4.00
5.00 5.00
6.00 6.00
Leadership5
140
0
5.05
5.00
5
1.343
-.267
.205 I
-.351
.407
5
2
7
4.00
5.00
6.00

Leadership1
' Cumulative
I Frequency Percent Valid Percent Percent Valid Moderately disagree 2 1.4 1.4 1.4
Slightly disagree 15 10.7 10.7 12.1 Neither agree nor
27 disagree 19.3 19.3 31.4
Slightly agree 61 43.6 43.6 75.0 Moderately agree 28 20.0 20.0 95.0
Strongly agree 7 5.0 5.0 100.0 I
Total 140 100.0 100.0
Leadership2
Cumulative Frequency Percent Valid Percent Percent
Valid Strongly disagree 1 .7 .7 .7 Slightly disagree 5 3.6 3.6 4.3 Neither agree nor
34 24.3 24.3 28.6 disagree
Slightly agree 48 34.3 34.3 62.9 Moderately agree 40 28.6 28.6 91.4
Strongly agree 12 8.6 8.6 100.0 Total 140 100.0 100.0
I
Leadership3
Cumulative Frequency Percent Valid Percent Percent
Valid Strongly disagree 2 1.4 1.4 1.4
Moderately disagree 3 2.1 2.1 3.6 Slightly disagree 9 6.4 6.4 10.0
Neither agree nor 18 12.9 12.9 22.9 disagree
Slightly agree 49 35.0 35.0 57.9
Moderately agree 41 29.3 29.3 87.1
Strongly agree 18 12.9 12:9 100.0
Total 140 100.0 100.0
Leadership4
Cumulative Frequency Percent Valid Percent Percent
-
Valid Moderately disagree 2 1.4 1.4 1.4
Slightly disagree 7 5.0 5.0 6.4
Neither agree nor 27 19.3 19.3 25.7 disagree
Slightly agree 48 34.3 34.3 60.0 I
Moderately agree 40 28.6 28.6 88.6
Strongly agree 16 11.4 11.4 100.0
Total 140 100.0 100.0
243

I
Valid Moderately disagree
Slightly disagree
Neither agree nor disagree
Slightly agree
Moderately agree
Strongly agree
Total
60
> u c 40
~ w ...
50
40
> u 30 c GI ::J
w ... 20
lO
20
Leaderships
Frequency Percent
2 1.4
12 8.6
28 20.0
47 33.6
37 26.4
14 10.0
140 100.0
Leadershipl
Leadershipl
Leadership2
Leadership2
244
Cumulative Valid Percent Percent
1.4
8.6
20.0
33.6
26.4
10.0
100.0
Mean =4.85 5 Id. Dev. =1.066
N =140
Mean =S.11 Std . Dev. =1.06
N =140
1.4
10.0
30.0
63.6
90.0
100.0

so
40
> ~ 30
!! w u.
>
20
10
so
40
ro w u.
20
10
i :I
~ u..
so
20
10
Leadership3
Leadership3
Leadership4
4
Leadership4
Leaderships
4
Leaderships
245
··~1·,,·1r1~idi;.1r1 P · r),_.,,, .. , .,_, ,., .. ~ ~-. . • ,,\..<! <., t -' i {!::-,._,_, \
Mean sS.17 Std. Dev. =1.263
N =140
Mean =5.18 Std. Dev. =l.114
N =140
Mean =5.0S Std. Dev. =l.1S9
N =140

Resources Support
Statistics
ResourceSupport1 ResourceSupport2 ResourceSupport3 ResourceSuooort4 N Valid 140 140 140 140
Missing 0 0 0 0 Mean 5.05 5.09 4.94 4.86
Median 5.00 5.00 5.00 5.00 Mode 4(a) 5 4 5
Variance 1.357 1.345 1.902 1.471 Skewness .317 .027 -.017 .215
Std. Error of .205 .205 .205 .205
Skewness Kurtosis -.846 -.485 -.739 -.493
Std. Error of Kurtosis .407 .407 .407 .407 Range 4 5 5 5
Minimum 3 2 2 2 Maximum 7 7 7 7
Percentiles 25 4.00 4.00 4.00 4.00 50 5.00 5.00 5.00 5.00 75 6.00 6.00 6.00 6.00
a Multiple modes exist. The smallest value is shown
Resou rceSupport1
Cumulative Frequency Percent Valid Percent Percent
Valid Slightly disagree 8 5.7 5.7 5.7 Neither agree nor
44 31.4 31.4 37.1 disagree
Slightly agree 44 31.4 31.4 68.6 Moderately agree 21 15.0 15.0 83.6
Strongly agree 23 16.4 16.4 100.0
Total 140 100.0 100.0
Re sou rceSu pport2
1' Cumulative Frequency Percent Valid Percent Percent
Valid Moderately disagree 2 1.4 1.4 1.4
Slightly disagree 5 3.6 3.6 5.0
Neither agree nor 41 29.3 29.3 34.3 disagree
I Slightly agree 43 30.7 30.7 65.0
Moderately agree 29 20.7 20.7 85.7
Strongly agree 20 14.3 14.3 100.0
Total 140 100.0 100.0
246

Valid Moderately disagree
Slightly disagree
Neither agree nor disagree
Slightly agree
Moderately agree
Strongly agree
Total
Valid Moderately disagree
Slightly disagree
Neither agree nor disagree
Slightly agree
Moderately agree
Strongly agree
Total
,_ so
l-40
> l -ro
~ IL
l-20
l -10
I 0
r Raop1,ase1i
ResourceSupport3
Cumulative Frequency Percent Valid Percent Percent
6 4.3 4.3 4.3
10 7.1 7.1 11.4
45 32.1 32.1 43.6
31 22.1 22.1 65.7
22 15.7 15.7 81.4
26 18.6 18.6 100.0
140 100.0 100.0
ResourceSupport4
Cumulative Frequency Percent Valid Percent Percent
2 1.4 1.4 1.4
13 9.3 9.3 10.7
43 30.7 30.7 41.4 I
45 32.1 32.1 73.6
18 12.9 12.9 86.4
19 13.6 13.6 100.0
140 100.0 100.0
ResourceSupp0rt1
-
I 4 6
ResourceSupport1
247
. Mean =5.05
Std. Dev. =1.165 N =140

ResourceSupport2
50
40
> ::! 30 Cll :I
w II.
20
10
Mean =5 .09 Std. Dev. =1.16
N =140
ResourceSupport2
ResourceSupport3
50
40
~ 30 c Cll :I
w II.
20
10
Mean =4.94 Std . Dev. =1.379
N =140
ResourceSupport3
ResourceSupport4
so
40
g 3o Cll :I
w II.
20
10
Mean =4.86 Std . Dev. =l.213
N =140
ResourceSupport4
248

Rewards
Statistics
Rewards1 Rewards2 Rewards3 Rewards4 Rewards5 N Valid 140 140 140 140 140
Missing 0 0 0 0 0 Mean 4.92 5.24 4.97 4.95 5.01
Median 5.00 5.00 5.00 5.00 5.00 Mode 4(a) 5 5 5 5
Variance 1.656 1.264 1.524 1.055 1.316 Skewness -.612 -.308 -.597 -.303 -.275
Std. Error of Skewness .205 .205 .205 .205 .205 Kurtosis .580 -.304 .663 .280 .074
Std. Error of Kurtosis .407 .407 .407 .407 .407 Range 6 5 6 5 5
Minimum 1 2 1 2 2 Maximum 7 7 7 7 7
Percentiles 25 4.00 5.00 4.00 4.00 4.00 50 5.00 5.00 5.00 5.00 5.00 75 6.00 6.00 6.00 6.00 6.00
a Multiple modes exist. The smallest value is shown
Rewards1
Cumulative Frequencv Percent Valid Percent Percent
Valid Strongly disagree 2 1.4 1.4 1.4 Moderately disagree 7 5.0 5.0 6.4
Slightly disagree 2 1.4 1.4 7.9 Neither agree nor
40 28.6 28.6 36.4 disagree
Slightly agree 40 28.6 28.6 65.0 Moderately agree 36 25.7 25.7 90.7
Strongly agree 13 9.3 9.3 100.0 Total 140 100.0 100.0
Rewards2
Cumulative Freauencv Percent Valid Percent Percent
Valid Moderately disagree 1 .7 .7 .7 Slightly disagree 9 6.4 6.4 7.1 Neither agree nor
23 16.4 16.4 23.6 disagree
Slightly agree 48 34.3 34.3 57.9 Moderately agree 40 28.6 28.6 86.4
Strongly agree 19 13.6 13.6 100.0 Total 140 100.0 100.0
249

Rewards3
Cumulative Frequency Percent Valid Percent Percent
Valid Strongly disagree 1 .7 .7 .7 Moderately disagree
I
7 5.0 5.0 5.7 i
Slightly disagree 4 2.9 2.9 8.6 Neither agree nor
30 disagree 21.4 21.4 30 .0
Slightly agree 53 37.9 37.9 67.9 Moderately agree 31 22.1 22.1 90.0
Strongly agree 14 10.0 10.0 100.0 Total 140 100.0 100.0
Rewards4
Cumulative Frequency Percent Valid Percent Percent
Valid Moderately disagree 3 2.1 2.1 2.1 Slightly disagree 5 3.6 3.6 5.7 Neither agree nor
37 26.4 26.4 32.1 disagree
Slightly agree 53 37.9 37.9 70.0 Moderately agree 35 25.0 25.0 95.0
Strongly agree 7 5.0 5.0 100.0 Total 140 100.0 100.0
Rewards5 ·
Cumu1lative I
Frequency Percent Valid Percent Percent
Valid Moderately disagree 4 2.9 2.9 2.9
Slightly disagree 7 5.0 5.0 7.9
Neither agree nor 32 22 .9 22.9 30.7 disagree
Slightly agree 52 37.1 37.1 67.9
Moderately agree 31 22.1 22.1 90.0
Strongly agree 14 10.0 10.0 100.0
Total 140 100.0 100.0
250

40
30
10
50
40
i30 ~ ....
20
10
60
50
40
i :I ~30 ....
20
10
Rewards1
Rewards!
Rewards2
Rewards2
Rel.Wrds3
0
Rewards3
251
Mean =4.92 Std. Dev. =l.287
N =140
Mean =5.24 Std. Dev. =l. 124
N =140
Mean ='l.97 Std. Dev. =!.235
N =140

Reverds4
60
so
40
> u c QI :I w3o IL
20
10
Mean =4.95 Std. Dev. =1.027
N =140
4
Rev.erds4
ReverdsS
60
so
40 > u ij :::i w 30
IL
20
10
Mean =5.01 Std. Dev. =1.147
N =140
4
Rev.erdsS
252

Structure
Statistics
I Structure1 Structure2 Structure3 Structure4 Structures N Valid 140 140 140 140 140
Missing 0 0 0 0 0 Mean 4.67 5.05 5.09 4.94 4.86
Median I
5.00 5.00 5.00 5.00 5.00 Mode 4 4(a) 5 4 5
Variance 1.373 1.357 1.345 1.902 1.471 Skewness .096 .317 .027 -.017 .215
Std. Error of Skewness .205 .205 .205 .205 .205 Kurtosis -.101 -.846 -.485 -.739 -.493
Std. Error of Kurtosis .407 .407 .407 .407 .407 Range 5 4 5 5 5
Minimum 2 3 2 2 2 Maximum 7 7 7 7 7
Percentiles 25 4.00 4.00 4.00 4.00 4.00 50 5.00 5.00 5.00 5.00 5.00 75 5.00 6.00 6.00 6.00 6.00
a Mulltiple modes exist. The smallest value is shown
Structure1
Cumulative Frequency Percent Valid Percent Percent
Valid Moderately disagree 5 3.6 3.6 3.6 Slightly disagree 12 8.6 8.6 12.1 Neither agree nor
49 35.0 35.0 47.1 disagree
Slightly agree 43 30.7 30.7 77.9 Moderately agree 20 14.3 14.3 92.1
Strongly agree 11 7.9 7.9 100.0
Total 140 100.0 100.0
Structure2
Cumulative Frequency Percent Valid Percent Percent
Valid Slightly disagree 8 5.7 5.7 5.7
Neither agree nor 44 31.4 31.4 37.1 disagree
Slightly agree 44 31.4 31.4 68.6
Moderately agree 21 15.0 15.0 83.6
Strongly agree 23 16.4 16.4 100.0
Total 140 100.0 100.0
253

Valid
Valid
Valid
Moderately disagree
Slightly disagree
Ne1ither agree nor disagree
Slightly agree
Moderately agree
Strongly agree
Total
Moderately disagree
Slightly disagree
Neither agree nor disagree
Slightly agree
Moderately agree
Strongly agree
Total
Moderately disagree
Slightly disagree
Neither agree nor disagree
Slightly agree
Moderately agree
Strongly agree
Total
so
> u 30
iii :I
w IL
20
10
Structure3
Frequency Percent
2 1.4
5 3.6
41 29.3
43 30.7
29 20.7
20 14.3
140 100.0
Structure4
Frequency Percent
6 4.3
10 7.1
45 32.1
31 22.1
22 15.7
26 18.6
140 100.0
Structures
Frequency Percent
2 1.4
13 9.3
43 30.7
45 32.1
18 12.9
19 13.6
140 100.0
Sbucturel
Sbucturel
254
Valid Percent
1.4
3.6
29.3
30.7
20.7
14.3
100.0
Valid Percent
4.3
7.1
32 .1
22.1
15.7
18.6
100.0
Valid Percent
1.4
9.3
30.7
32 .. 1
12.9
13.6
100.0
Mean~.67 Std . Dev. =l .172
N =140
Cumulative Percent
1.4
5.0
34.3
65.0
85.7
100.0
Cumulative Percent
4.3
11.4
43.6
65.7
81 .4
100.0
Cumulative Percent
1.4
10.7
41.4
73.6
86.4
100.0

>
so
40
,.. v 30 c Iii = w ...
20
10
50
40
v 30
ii = w LI.
20
10
I
Structure2
-~
I
Sbvcture2
Structure3
Strocture3
Strucb.Jre4
Structure4
255
I
I
I
I
I
r
Mean =5.05 Std. Dev. =1.165
N =140
Mean =5.09 Std . Dev. =1.16
N =140
Mean =4.94 Std. Dev. =l.379
N =140
Raopn1scr1

I
50
40
> g 30 Cll :I
w u..
20
10
Structures
Stnlcture5
Relationship
Statistics
r
Mean =4.86 Sttl. Dev. =1.213
N =140
Relationsh,ip 1 Relationship2 Relatiionship3 Relationship4 Relationship5 N Valid 140 140 140 140 140
Missing 0 0 0 0 0 Mean 4.95 5.01 5.04 5.41 5.37
Median 5.00 5.00 5.00 6.00 5.00
Mode 5 5 5 6 6 Variance 1.055 1.316 1.286 1.496 1.386
Skewness -.303 -.275 -.131 -.791 -.304
Std. Error of Skewness .205 .205 .205 .205 .205
Kurtosis .280 .074 -.064 1.063 -.647
Std. Error of Kurtosis .407 .407 .407 .407 .407
Range 5 5 5 6 5
Minimum 2 2 2 1 2
Maximum 7 7 7 7 7
Percentiles 25 4.00 4.00 4.00 5.00 4.00
50 5.00 5.00 5.00 6.00 5.00
75 6.00 6.00 6.00 6.00 6.00
Relationship1
Cumulative Frequency Percent Valid Percent Percent
Valid Moderately disagree 3 2.1 2.1 2.1
Slightly disagree 5 3.6 3.6 5.7
Neither agree nor 37 26.4 26.4 32.1 disagree
Slightly agree 53 37.9 37.9 70.0
Moderately agree 35 25.0 25.0 95.0
Strongly agree 7 5.0
I 5.0 100.0
Total 140 100.0 100.0
256

Relationship2
Cumulative Frequency Percent Valid Percent Percent
Valid Moderately disagree 4 2.9 2.9 2.9 Slightly disagree 7 5.0 5.0 7.9 Neither agree nor
32 disagree 22.9 22.9 30.7
Slightly agree 52 37.1 37.1 67.9 Moderately agree 31 22.1 22.1 90.0
Strongly agree 14 10.0 10.0 100.0 Total 140 100.0 100.0
Relationship3
Cumulative Frequency Percent Valid Percent Percent
Valid Moderately disagree 3 2.1 2.1 2.1 Slightly disagree 6 4.3 4.3 6.4 Neither agree nor
35 25.0 25.0 31.4 disagree
Slightly agree 51 36.4 36.4 67.9 Moderately agree 29 20.7 20.7 88.6
Strongly agree 16 11.4 11.4 100.0 Total 140 100.0 100.0
Relationship4
Cumulative Frequency Percent Valid Percent Percent
Valid Strongly disagree 2 1.4 1.4 1.4
Slightly disagree 6 4.3 4.3 5.7 Neither agree nor
21 15.0 15.0 20.7 disagree
Slightly agree 40 28.6 28.6 49.3
Moderately agree 43 30.7 30.7 I 80.0 I
Strongly agree 28 20.0 20.0 100.0
Total 140 100.0 100.0
Relationship5
Cumulative Frequency Percent Valid Percent Percent
Valid Moderately disagree 1 .7 .7 .7
Slightly disagree 6 4.3 4.3 5.0
Neither agree nor 29 20.7 20.7 25.7 disagree
Slightly agree 35 25.0 25.0 50.7
Moderately agree 42 30.0 30.0 80.7
Strongly agree 27 19.3 19.3 100.0
Total 140 100.0 100.0
257

60
50
40 :..
~ :I ~ 30 IL
20
10
60
so
> 40 u ~ 6- 30 f u.
20
10
60
so
20
10
Relations hi pl
Relationship1
Relationship2
4
Relationship2
Relationship3
6
Relations hip3
258
Mean "'4.95 Sa::J . Dev. =l.027
N ::140
Mean =5.01 Std. Dev. =1.147
N =140
Mean =5.04 Std. Dev. =l.134
N =140

50
40
10
50
40
~30 ~ ¥
LL. 20
10
Relationship4
4
Relationship4
Relationships
Relationships
259
Mean =5.41 Std. Dev. =1.223
N =140
Mean =5.37 Std. Dev. =1.177
N =140

Adaptation
Statistics
I Adaptation 1 Adaptation2 Adaptation3 Adaptation4
N Valid 140 140 140 140 Missing 0 0 0 0
Mean I
5.41 5.37 5.23 5.20 Median 6.00 5.00 5.00 5.00 Mode 6 6 5 6
Variance 1.496 1.386 1.803 1.758 Skewness -.791 -.304 -.336 -.356
Std. Error of Skewness .205 .205 .205 .205 Kurtosis 1.063 -.647 -.615 -.602
Std. Error of Kurtosis .407 .407 .407 .407 Range 6 5 5 5
Minimum 1 2 2 2 Maximum 7 7 7 7
Percentiles 25 5.00 4.00 4.00 4.00 50 6.00 5.00 5.00 5.00 75 6.00 6.00 6.00 6.00
Adaptation1
Cumulative Frequency Percent Valid Percent Percent
Valid Strongly disagree 2 1.4 1.4 1.4 Slightly disagree 6 4.3 4.3 5.7 Neither agree nor
21 15.0 15.0 20.7 disagree
Slightly agree 40 28.6 28.6 49.3 I
Moderately agree 43 30.7 30.7 80.0
Strongly agree 28 20.0 20.0 100.0
Total 140 100.0 100.0
Adaptation2
Cumulative Frequency Percent Valid Percent Percent
Valid Moderately disagree 1 .7 .7 .7
I Slightly disagree 6 4.3 4.3 5.0
Neither agree nor 29 20.7 20.7 25.7 disagree
Slightly agree 35 25.0 25.0 50.7
Moderately agree 42 30.0 30.0 80.7
Strong1ly agree 27 19.3 19.3 100.0
Total 140 100.0 100.0
260

Valid Moderately disagree
Slightly disagree
Neither agree nor disagree
Slightly agree
Moderately agree
Strongly agree
Total
I I
Valid Moderately disagree
Slightly disagree
Neither agree nor disagree
Slightly agree
Moderately agree
Strongly agree
Total
50
40
> ~ 30
:I
~ IL
20
10
Adaptation3
Frequency Percent
4 2.9
10 7.1
28 20.0
37 26.4
30 21.4
31 22.1
140 100.0
Adaptation4
Frequency Percent
4 2.9
10 7.1
30 21.4
33 23.6
36 25.7
27 19.3
140 100.0
Adaptation!
Adaptationt
261
Cumulative Valid Percent Percent
2.9 2.9
7.1 10.0
20.0 30.0
26.4 56.4
21.4 77.9
22.1 100.0
100.0
Cumulative Valid Percent Percent
2.9
7.1
21.4
23.6
25.7
19.3
100.0
Mean =5Al Std. Dev. =1223
N =140
2.9
10.0
31.4
55.0
80.7
100.0

50
40
> u 30
!ii :l
~ "" 20
10
40
30
ID
Adaptation2
Adaptation2
Adaptation3
Adaptation)
Adaptation4
Adaptation4
262
Mean =5.37 Std. Dev. =1.177
N ;J40
Mean =5.23 Std. Dev. =l.343
N =140
Mean =5.2 Std . Dev. =l.326
N =140

I
T
Appendix 2
Descriptive statistic results of Thai employees
Age Gender N Valid 204 204
Missing 0 0 Mean 2.81 1.31
Median 2.00 1.00 Mode 2 1
Std. Deviation 1.281 .463 Variance 1.640 .215
Skewness .681 .834 Std. Error of Skewness .170 .170
Kurtosis -.252 -1.318 Std. Error of Kurtosis .339 .339
Range 5 1 Minimum 1 1 Maximum 6 2
Percentiles 25 2.00 1.00 50 2.00 1.00 75 4.00 2.00
100
80
40
20
Statistics
Organization Position age
204 204
0 0
2.80 4.47
2.00 4.00
2 4
1.249 1.085
1.560 1.176
.601 -.041
.170 .170
-.433 -.228
.339 .339
5 5
1 2
6 7
2.00 4.00
2.00 4.00
4.00 5.00
Age
Age
263
Joint venture
Duration
204
0
4.19
4.00
4
.684
.468
.399
.170
.364
.339
3
3
6
4.00
4.00
5.00
Mean =2.81 Std. Dev. =1.281
N =204
or wholly owned
204
0
1.26
1.00
1
.442
.196
1.075
.170
-.854
.339
1
1
2
1.00
1.00
2.00
Kind of organizations
204
0
4.32
5.00
6
2.066
4.267
-.485
.170
-1.172
.339
6
1
7
2.00
5.00
6.00

150
I 100
50
I
100
> u c Cl> :I
w u.
> u
60
~ 40 :I
w u.
20
80
60
40
20
0.5
-
Gender
-- - -
1.5
Gender
Position
Position
I
Organization age
Organization age
264
·--
2.5
Mean =1.31 SttJ. Dev. =0.463
N =20'!
Mean =2.8 Stt:I. Oe\I . =l .249
N =204
Mean :::4.47 Str:I . Dev. =1.085
N =2()4

120
100
,_ > 80 u 5i :I
~ 60 ,_
IL.
,_ 40
,_ 20
0
ISO
100
~ c ~ w
IL.
so
50
40-
> u 30-
~ w ...
20
10
-
o.s
Duration
I ' 4 s Duration
Joint venb.lre or wholly owned
I LS 2
Joint venbJre or wholly owned
Kind of organizations
-
I 4
Kind of organizations
265
25
Tanachart Raop1·ase1·1
Mean =4.19 Slrl. Dev . .0.684
N =204
Mean ~1.26 Slrl. Dev • .0.442
N =204
Mean =".32 Slrl. Dev. ~.066
N "204

Japanese management practices in Thailand- Answered by Thai subordinates
Statistics
Consensus Lifetime decision- Seniority House Job
employment makinq system union rotation N Valid 204 204 204 204 204
Missing 0 0 0 0 0 Mean 4.83 5.14 4.85 4.80 5.01
I
Median 5.00 5.00 5.00 5.00 5.00 Mode 4 4 4 5 5
Std. Deviation 1.387 1.201 1.259 1.183 1.230 Variance 1.923 1.443 1.584 1.400 1.512
Skewness -.201 -.225 -.093 .062 -.173 Std. Error of Skewness .170 .170 .170 .170 .170
Kurtosis -.664 -.281 -.598 -.553 -.625 Std. Error of Kurtosis .339 .339 .339 .339 .339
Range 5 5 5 5 5 Minimum 2 2 2 2 2
Maximum 7 7 7 7 7
Percentiles 25 4.00 4.00 4.00 4.00 4.00
50 5.00 5.00 5.00 5.00 5.00
75 6.00 6.00 6.00 6.00 6.00
a Multiple modes exist. The smallest value 1s shown
60
so
40 > v c QI :::J w3o-u..
20-
10-
Lifetime employment
4
Lifetime employment
266
I 6 8
Mean =4.83 Std. Dev. =l.387
N =204
Quality control circles
204
0
5.07
5.00
4(a)
1.103
1.217
-.092
.170
-.551
.339
5
2
7
4.00
5.00
6.00

60
50
40
g ~ ¥30 II.
20
10
Consensus decision-making
4 6
Consensus decision-making
Seniority system
4
Seniority system
House union
4
House union
267
·a
i'1·. r.'. ;._·.,,. (.~.-1. ·1 <·.·1 r.1.· Lt · >: ) ' '' · 'l (,J"t " h ~ .L .- i-.. ((< . ..1i··'J.C~.1,,.,,._(
Mean =S.14 Std. Dev. =1.201
N =204
Mean =4.85 Std. Dev. =1.259
N =204
Mean ::4.8 SID. Dev. =l.183
N =;204

> v c G> ::I
> v
60
~ 40 :I
~ II.
20
60
so
40
~ 30 II.
20
Job rotation
Job rotation
Quality control circles
4 6
Quality control circles
268
Mean =5 .01 Std. Dev. =l.23
N =204
Mean =S.07 Std. Dev. =l.103
N =204

Motivational Factor for Acceptance of Japanese Management Practices
VISION
Statistics
Vision1 Vision2 Vision3 Vision4 Visions N Valid 204 204 204 204 204
Missing 0 0 0 0 0 Mean 4.73 5.13 5.14 4.99 4.94
Median 5.00 5.00 5.00 5.00 5.00 Mode 5 5 5 4 4
Std. Deviation 1.191 1.167 1.171 1.382 1.268 Variance 1.420 1.363 1.370 1.911 1.607
Skewness .006 .181 .046 -.039 .091 Std. Error of Skewness .170 .170 .170 .170 .170
Kurtosis -.118 -.894 -.671 -.790 -.654 Std. Error of Kurtosis .339 .339 .339 .339 .339
Range 5 4 5 5 5 Minimum · 2 3 2 2 2 Maximum 7 7 7 7 7
Percentiles 25 4.00 4.00 4.00 4.00 4.00 50 5.00 5.00 5.00 5.00 5.00 75 5.00 6.00 6.00 6.00 6.00
Vision1
Cumulative Frequency Percent Valid Percent Percent
Valid 2 8 3.9 3.9 3.9
3 16 7.8 7.8 11 .8 4 65 31.9 31 .9 43.6
5 67 32.8 32.8 76.5
6 30 14.7 14.7 91 .2
7 18 8.8 8.8 100.0 Total 204 100.0 100.0
Vision2
Cumulative Frequency Percent Valid Percent Percent
Valid 3 12 5.9 5.9 5.9
4 56 27.5 27.5 33.3
5 65 31 .9 31 .9 65.2
6 36 17.6 17.6 82.8
7 35 17.2 17.2 100.0
Total 204 100.0 100.0
269

Frequency Valid 2 2
3 8 4 58 5 61 6 42 7 33
Total 204
Frequency Valid 2 8
3 14 4 64 5 45 6 32 7 41
Total 204
Frequency Valid 2 4
3 18 4 60
I 5 59 6 31 7
I
32 Total 204
60
e-c 40
~ ~ ...
20
Percent
1.0
3.9
28.4
29.9
20.6
16.2
100.0
Percent
3.9
6.9
31.4
22.1
15.7
20.1
100.0
Percent
2.0
8.8
29.4
28.9
15.2
15.7
100.0
Vision3
Valid Percent
1.0
3.9
28.4
29.9
20.6
16.2
100.0
Vision4
Valid Percent
3.9
6.9
31.4
22.1
15.7
20.1
100.0
Visions
Valid Percent
2.0
8.8
29.4
28.9
15.2
15.7
100.0
Vision!
4
Vision!
270
Cumulative Percent
1.0
4.9
33.3
63.2
83.8
100.0
Cumulative Percent
3.9
10.8
42.2
64.2
79.9
100.0
Cumulative Percent
2.0
10.8
40.2
69.1
84.3
100.0
Mean =4.73 Std. Dev. =1.191
N =204
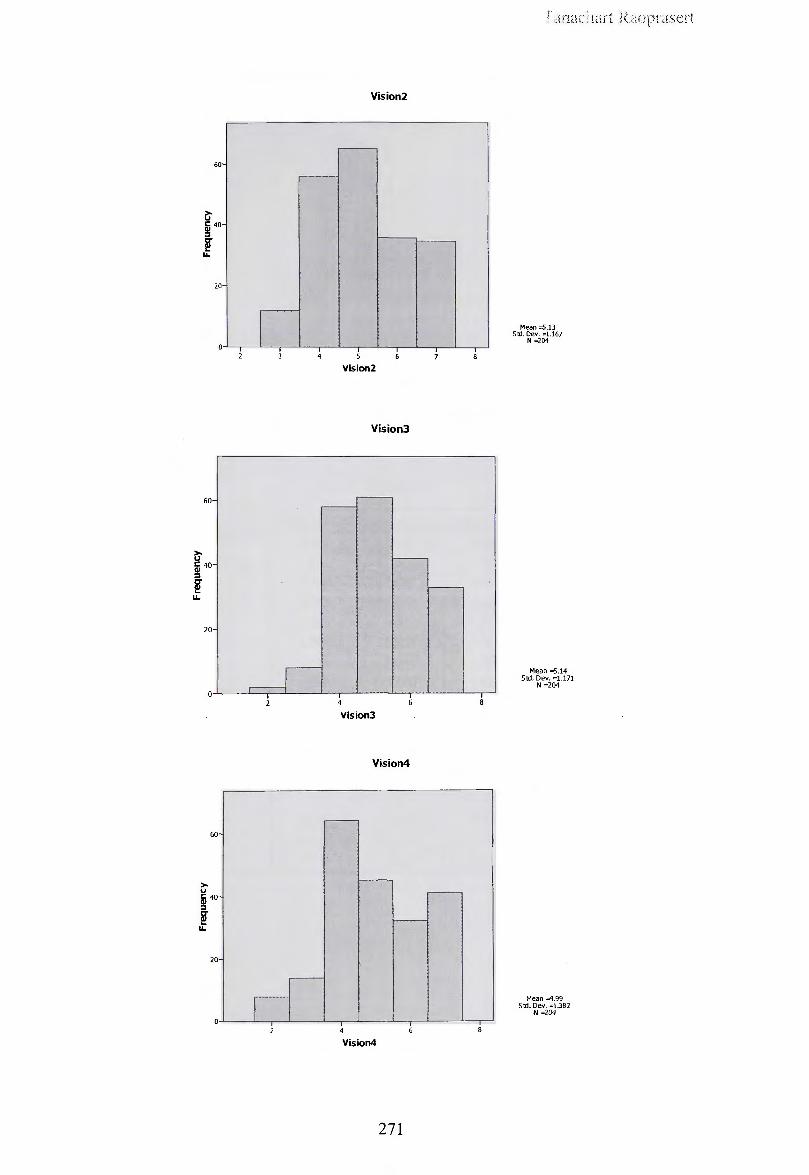
60
20
0 I
60
20
60
20
-
I
Vision2
5
Vision2
Vision3
4
Vision3
Vision4
-
-
4
Vision4
-
271
" 11
II
11
I I
-
I
II
Mean =5.13 Std. Dev. =l.167
N =204
Mean =6.14 Std. Dev. =J.1 71
N =204
Mean ~.99 Std. Dev. =1.382
N =20<!

I
I
N
Mean
Median
Mode
~ 5 :l
60
50
40
~ 30 IL
20
10
Valid
Missing
Std. Deviation
Variance
Skewness
Std. Error of Skewness
Kurtosis
Std . Error of Kurtosis
!Range
Minimum
Maximum
Percentiles 25
50
75
Visions
Visions
Leadership
Statistics
Leadership1 Leadershio2
204 204
0 0
5.18 5.33
5.00 6.00
5 6
1.060 1.281
1.125 1.642
-.219 -1.057
.170 .170
.180 1.507
.339 .339
6 6
1 1
7 7
4.00 5.00
5.00 6.00
6.00 6.00
272
Mean =4 .9'1 Std. Dev. =l.268
N =204
Leadership3 Leadership4
204 204
0 0
5.33 5.19
5.00 5.00
6 5
1.155 1.235
1.335 1.525
-.475 -.433
.170 .170
-.184 -.343
.339 .339
5 5
2 2
7 7
5.00 4.00
5.00 5.00
6.00 6.00
Leadership5
204
0
5.18
5.00
6
1.236
1.529
-.382
.170 I
-.489
.339
5
2
7
4.00
5.00
6.00

Leadership1
Cumulative Frequency Percent Valid Percent Percent
Valid 1 1 .5 .5 .5 3 6 2.9 2.9 3.4 4 49 24.0 24.0 27.5 5 68 33.3 33.3 60.8 6 58 28.4 28.4 89.2 7 22 10.8 10.8 100.0
Total 204 100.0 100.0
Leadership2
Cumulative Frequency Percent Valid Percent Percent
Valid 1 4 2.0 2.0 2.0 2 3 1.5 1.5 3.4 3 10 4.9 4.9 8.3 4 23 11 .3 11 .3 19.6 5 61 29.9 29.9 49.5 6 70 34.3 34.3 83.8 7 33 16.2 16.2 100.0
Total 204 100.0 100.0
Leadership3
Cumulative Frequency Percent Valid Percent Percent
Valid 2 3 1.5 1.5 1.5 3 9 4.4 4.4 5.9 4 37 18.1 18.1 24.0 5 55 27.0 27.0 51.0 6 69 33.8 33.8 84.8 7 31 15.2 15.2 100.0
Total 204 100.0 100.0
Leadership4
Cumulative Frequency Percent Valid Percent Percent
Valid 2 4 2.0 2.0 2.0
3 18 8.8 8.8 10.8
4 31 15.2 15.2 26.0
5 63 30.9 30.9 56.9
6 58 28.4 28.4 85.3
7 30 14.7 14.7 I 100.0 I
Total 204 100.0 100.0
273

I Valid 2
3
4
5
6
7
Total
Frequency
4
15
42
51
63
29
204
> u
60
20
60
&i 40 ,. l ...
20
I
Leaderships
Percent Valid Percent
2.0 2.0
7.4 7.4
20.6 20.6
25.0 25.0
30.9 30.9
14.2 14.2
100.0 100.0
Leadershipl
~
....._
~
-
I Leadershipl
Leadership2
Leadership2
274
Cumulative Percent
2.0
9.3
29.9
54.9
85.8
100.0
Mean =5.18 Std. Dev. =l.06
N =:204
Mean =5.33 Std. Dev. =1.281
N =204

> v
,_ 60
I
,_ ~ 40 ::I
w LL.
,_ 20
60
20
60
20
I '
Leadership3
Leadership3
Leadership4
Leadership4
Leaderships
~
-
I 4
Leaderships
~
I 6
275
,,
>----
8
Mean =5.33 Sta. Dev. =1.1 55
N =204
Mean =5.19 Std. Dev. =1.235
N =204
Mean =S.18 Std . Dev. =l.236
N =204

Resources Support
Statistics
ResourceSunnort1 ResourceSupport2 ResourceSupport3 ResourceSupport4 N Valid 204 204 204 204
Missing 0 0 0 0 Mean 5.30 5.29 5.15 5.17
Median 5.00 5.00 5.00 5.00 Mode 6 5(a) 6 5(a)
Std . Deviation 1.210 1.101 1.208 1.257 Variance 1.464 1.212 1.460 1.581
Skewness -.856 -.371 -.431 -.433 Std. Error of
.170 .170 .170 .170 Skewness Kurtosis .999 -.179 -.318 -.186
Std. Error of Kurtosis .339 .339 .339 .339 Range 6 5 5 6
Minimum 1 2 2 1 Maximum 7 7 7 7
Percentiles 25 5.00 5.00 4.00 4.00 50 5.00 5.00 5.00 5.00 75 6.00 6.00 6.00 6.00
a Multiple modes exist. The smallest value is shown
ResourceSupport1
Cumulative Frequency Percent Valid Percent Percent
Valid 1 2 1.0 1.0 1.0 2 3 1.5 1.5 2.5 3 12 5.9 5.9 8.3 4 24 11 .8 11.8 20.1 5 65 31 .9 31 .9 52 .0
6 69 33.8 33.8 85.8
7 29 14.2 14.2 100.0
Total 204 100.0 100.0
ResourceSupport2
Cumulative Frequency Percent Valid Percent Percent
Valid 2 2 1.0 1.0 1.0
3 9 4.4 4.4 5.4
4 36 17.6 17.6 23.0
5 65 31 .9 31 .9 54.9
6 65 31.9 31 .9 86.8
7 27 13.2 13.2 100.0 Total 204 100.0 100.0
276

ResourceSupport3
Frequency Percent Valid Percent Valid 2 4 2.0 2.0
3 17 8.3 8.3 4 35 17.2 17.2 5 61 29.9 29.9 6 62 30.4 30.4 7 25 12.3 12.3
Total 204 100.0 100.0
Resou rceSu pport4
Frequency Percent Valid Percent Valid 1 1 .5 .5
2 3 1.5 1.5 3 16 7.8 7.8 4 39 19.1 19.1 5 57 27.9 27.9 6 57 27.9 27.9 7 31 15.2 15.2
Total 204 ' 100.0 100.0
ResourceSupportl
0 2 4
ResourceSupportl
277
Cumulative Percent
2.0
10.3
27.5
57.4
87.7
100.0
Cumulative Percent
.5
2.0
9.8
28.9
56.9
84.8
100.0
Mean =5.3 Std. Dev. =l.21
N =204

> v
60
5i 40 :J
w LL
20
60
,_
,_ 20
> v c: QI :J
60
so
40
~ 30 LL
20
10
r-I
ResourceSupport2
ResourceSupport2
ResourceSupport3
-
~
-
I 4
ResourceSupport3
-
ResourceSupport4
-
ResourceSupport4
278
Mean =5.29 Std. Dev. = l.101
N =204
Mean =5.15 Std. Dev. =1.208
N =204
Mean =5 .17 Std . Dev. =1.257
N =.204

Rewards
Statistics
Rewards1 Rewards2 Rewards3 Rewards4 Rewards5 N Valid 204 204 204 204 204
Missing 0 0 0 0 0 Mean 4.94 5.24 5.30 5.29 5.15
Median 5.00 5.00 5.00 5.00 5.00 Mode 5 5 6 5(a) 6
Std. Deviation 1.117 1.075 1.210 1.101 1.208 Variance 1.248 1.156 1.464 1.212 1.460
Skewness -.376 -.265 -.856 -.371 -.431 Std. Error of Skewness .170 .170 .170 .170 .170
Kurtosis -.086 .150 .999 -.179 -.318 Std. Error of Kurtosis .339 .339 .339 .339 .339
Range 5 6 6 5 5 Minimum 2 1 1 2 2 Maximum 7 7 7 7 7
Percentiles 25 4.00 4.00 5.00 5.00 4.00 50 5.00 5.00 5.00 5.00 5.00 75 6.00 6.00 6.00 6.00 6.00
a Multiple modes exist. The smallest value is shown
Rewards1
Cumulative Frequency Percent Valid Percent Percent
Valid 2 4 2.0 2.0 2.0 3 20 9.8 9.8 11 .8 4 36 17.6 17.6 29.4 5 81 39.7 39.7 69.1
6 50 24.5 24.5 93.6
7 13 6.4 6.4 100.0
Total 204 100.0 100.0
Rewards2
Cumulative Frequency Percent Valid Percent Percent
Valid 1 1 .5 .5 .5
3 6 2.9 2.9 3.4
4 46 22.5 22.5 26.0
5 66 32.4 32.4 58.3
6 60 29.4 29.4 87.7
7 25 12.3 12.3 100.0 Total 204 100.0 100.0
279

Frequency Valid 1 2
2 3 3 12 4 24 5 65 6 69 7 29
Total I 204
Frequency Valid 2 2
3 9 4 36 5 65 6 65 7 27
Total 204
Frequency Valid 2 4
3 17 4 35 5 61 6 62 7 25
Total 204
100
80
> ~ 60
" ~ ...
Percent
1.0
1.5
5.9
11 .8
31.9
33.8
14.2
100.0
Percent
1.0
4.4
17.6
31 .9
31.9
13.2
100.0
Percent
2.0
8.3
17.2
29.9
30.4
12.3
100.0
Rewards3
Valid Percent
1.0
1.5
5.9
11 .8
31 .9
33.8
14.2
100.0
Rewards4
Valid Percent
1.0
4.4
17.6
31 .9
31.9
13.2
100.0
Rewards5
Valid Percent
2.0
8.3
17.2
29.9
30.4
12.3
100.0
Re111erdsl
Rewanlsl
280
Cumulative Percent
1.0
2.5
8.3
20.1
52.0
85.8
100.0
Cumulative Percent
1.0 I
5.4
23.0
54.9
86.8
100.0
Cumulative Percent
2.0
10.3
27.5
57.4
87.7
100.0
Mean ::4 .94 Std. Dev. =1.11 7
N ='204

Rewuds2
-60 r---
~
~
20
I I I I
Rewards2
Rewards3
60-
20-
o~--,--, -~'~~1~,,~-"-~~~-,.--~~~~-.-~~~~~-.-~
> u
60
·-Iii 40 :I
w u.
,_ 20
0 2 4
~ I
Rev.erds3.
Rev.erds4
~
4
Rewards4
281
6 8
-
Mean =5.24 5 td. Dev. =1.075
N =204
Mean =5.3 Std. Dev. =l.21
N =204
Mean =5.29 Std. Dev. =1.101
N =204

N
> u
60
5i 40 ::i
w u..
20
Mean
Median
Mode
Std. Deviation
Variance
Skewness
Valid
Missing
Std. Error of Skewness
Kurtosis
Std. Error of Kurtosis
Range
Minimum
Maximum
Percentiles 25
50
75
RewardsS
Rewards5
Structure
Statistics
Structure1 Structure2
204 204
0 0
5.02 5.04
5.00 5.00
5 4
1.221 1.082
1.492 1.171
-.227 -.055
.170 .170
-.451 -.521
.339 .339
5 5
2 2
7 7
4.00 4.00
5.00 5.00
6.00 6.00
282
Mean =5.15 Std. Dev. =1.208
N =204
Structure3 Structure4
204 204
0 0
4.99 4.96
5.00 5.06
5 5
1.114 1.148
1.241 1.319
.019 -.159
.170 .170
-.318 -.541
.339 .339
5 5
2 2
7 7
4.00 4.00
5.00 5.00
6.00 6.00
Structure5
204
0
4.99
5.00
6
1.166
1.360
-.094
.170
-.907
.339
4
3
7
4.00
5.00
6.00

Structure1
Cumulative I Frequency Percent Valid Percent Percent
Valid 2 4 2.0 2.0 2.0 3 20 9.8 9.8 11 .8 4 40 19.6 19.6 31.4 5 68 33.3 33.3 64.7 6 47 23.0 23.0 87.7 7 25 12.3 12.3 100.0
Total 204 100.0 100.0
Structure2
Cumulative Frequency Percent Valid Percent Percent
Valid 2 2 1.0 1.0 1.0 3 8 3.9 3.9 4.9 4 62 30.4 30.4 35.3 5 57 27.9 27.9 63.2 6 58 28.4 28.4 91 .7 7 17 8.3 8.3 100.0
Total 204 100.0 100.0
Structure3
Cumulative Frequency Percent Valid Percent Percent
Valid 2 2 1.0 1.0 1.0
3 14 6.9 6.9 7.8
4 51 25.0 25.0 32.8
5 76 37.3 37.3 70.1
6 39 19.1 19.1 89.2
7 22 10.8 10.8 100.0
Total 204 100 .0 100.0
Structure4
Cumulative Frequency Percent Valid Percent Percent
Valid 2 2 1.0 1.0 1.0
3 21 10.3 10.3 11 .3
4 46 22.5 22.5 33.8
5 66 32.4 32.4 66.2
6 52 25.5 25.5 91.7
7 17 8.3 8.3 100.0
Total 204 100.0 100.0
283

Sbuctl.lre1
60
20
Structurel
Sbucture2
I I
-60
~
20
~ Structure2
Structure3
80
60
20
4
Sbuctl.lre3
284
-
r t d
Mean =5 .02 Std. Dev. =l.221
N =2 04
Mean :5.04 Std . Dev. =l.082
N =204
Mean =4.99 Std . Dev. =l.114
N =204

60
20
60
50
40
~
~ ~30 u..
20
l-10
Structure4
4
Structure4
Structures
StructureS
285
I
I
Mean =4.96 Std. Dev. =l.148
N =204
Mean ::::i4.99 Std. Dev. =l.166
N =204

Relationship
Statistics
Relationshio1 Relationshio2 Relationshio3 Relationshio4 Helationshio5 1 N Valid 204 204 204 204 204
Missing 0 0 0 0 0 Mean 5.12 5.19 5.16 5.02 5.50
Median 5.00 5.00 5.00 5.00 6.00 Mode 5 7 7 6 7
Std. Deviation 1.514 1.518 1.464 1.381 1.326 Variance 2.292 2.303 2.143 1.906 1.759
Skewness -.589 -.431 -.446 -.464 -.546 Std. Error of Skewness .170 .170 .170 .170 .170
Kurtosis -.090 -.700 -.445 -.243 -.399 Std. Error of Kurtosis .339 .339 .339 .339 .339
Range 6 6 6 6 5 Minimum
I 1 1 1 1 2
Maximum 7 7 7 7 7 Percentiles 25 4.00 4.00 4.00 4.00 4.25
50 5.00 5.00 5.00 5.00 6.00 75 6.00 7.00 6.00 6.00 7.00
Relationship1
Cumulative Frequencv Percent Valid Percent Percent
Valid 1 5 2.5 2.5 2.5 2 7 3.4 3.4 5.9
3 14 6.9 6.9 12.7
4 41 20.1 20.1 32.8
!
5 50 24.5 24.5 57.4
6 40 19.6 19.6 77.0
7 47 23.0 23.0 100.0
Total 204 100.0 100.0 '
Relationship2
Cumulative Freauencv Percent Valid Percent Percent
Valid 1 1 .5 .5 .5
2 11 5.4 5.4 5.9
3 13 6.4 6.4 12.3
4 48 23.5 23.5 35.8
5 36 17.6 17.6 53.4
6 40 19.6 19.6 73.0
7 55 27.0 27.0 100.0
Total 204 100.0 100.0
286

Relationship3
Cumulative Frequency Percent Valid Percent Percent
Valid 1 3 1.5 1.5 1.5 2 4 2.0 2.0 3.4 3 19 9.3 9.3 12.7 4 46 22.5 22.5 35.3 5 39 19.1 19.1 54.4 6 46 22.5 22.5 77.0 7 47 23.0 23.0 100.0
Total 204 100.0 100.0
Relationship4
Cumulative Frequency Percent Valid Percent Percent
Valid 1 2 1.0 1.0 1.0 2 8 3.9 3.9 4.9 3 15 7.4 7.4 12.3 4 48 23.5 23.5 35.8
5 46 22.5 22 .5 58.3
6 55 27.0 27.0 85.3 7 30 14.7 14.7 100.0
Total 204 100.0 100.0
Relationships
Cumulative Frequency Percent Valid Percent Percent
Valid 2 6 2.9 2.9 2.9
3 5 2.5 2.5 5.4
4 40 19.6 19.6 25.0
5 46 22.5 22.5 47.5
6 45 22.1 22.1 69.6
7 62 30.4 30.4 100.0
Total 204 100.0 100.0
287

Relationship1
50
40
> ~ 30
:::I
w ... 20
10
Mean =5.12 Std. Dev. =1.514
N ;204
4
Relationshipl
Relationship2
60
so
40 > u ii :::I w 30 ...
20
10
Mean =5.19 Std. Dev. =l.518
N "204
4
Relationship2
Relationship3
50
40
> u 30 c: QI ::J
w ... 20
10
Mean =5. 16 Std. Dev. ; 1.4&4
N "204
Relationship3
288

60
50
40
~ c: !!l w30 ...
10
Relationship4
Relationship4
Relationships
4
Relationships
289
Tnnach<t it
Mean =5.02 Std. Dev. =l.381
N "204
Mean =5.5 Std. Dev. =1.326
N =204
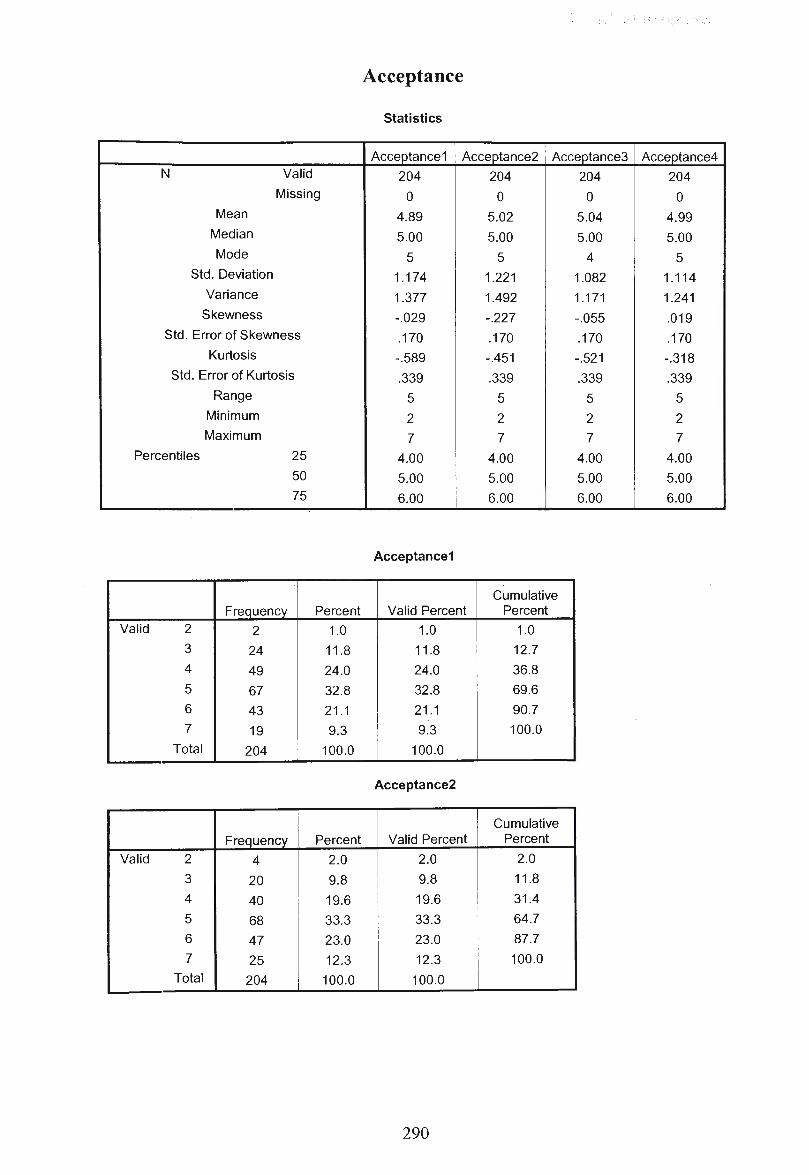
Acceptance
Statistics
Acceptance1 Acceptance2 Acceptance3 Acceptance4 N Valid 204 204 204 204
Missing 0 0 0 0 Mean 4.89 5.02 5.04 4.99
Median 5.00 5.00 5.00 5.00 Mode 5 5 4 5
Std. Deviation 1.174 1.221 1.082 1.114 Variance 1.377 1.492 1.171 1.241
Skewness -.029 -.227 -.055 .019 Std. Error of Skewness .170 .170 .170 .170
Kurtosis -.589 -.451 -.521 -.318 Std. Error of Kurtosis .339 .339 .339 .339
Range 5 5 5 5 Minimum 2 2 2 2 Maximum 7 7 7 7
Percentiles 25 4.00 4.00 4.00 4.00 50 5.00 5.00 5.00 5.00 75 6.00 6.00 6.00 6.00
Acceptance1
Cumulative Frequency Percent Valid Percent Percent
Valid 2 2 1.0 1.0 1.0
3 24 11.8 11.8 12.7
4 49 24.0 24.0 36.8
5 67 32.8 32.8 69.6
6 43 21 .1 21 .1 90.7
7 19 9.3 9.3 100.0
Total 204 100.0 100.0
Acceptance2
Cumulative Frequency Percent Valid Percent Percent
Valid 2 4 2.0 2.0 2.0
3 20 9.8 9.8 11.8
4 40 19.6 19.6 31.4
5 68 33.3 33.3 64.7
6 47 23.0 23.0 87.7
7 25 12.3 12.3 100.0
Total 204 100.0 100.0
290

Valid 2
3
4
5
6
7
Total
Valid 2
3
4 i
5
6
7
Total
Frequencv
2
8
62
57
58
17
204
Frequency
> u
60
ii 40 :I
~ ...
20
2
14
51
76
39
22
204
Acceptance3
Percent Valid Percent
1.0 1.0
3.9 3.9
30.4 30.4
27.9 27.9
28.4 28.4
8.3 8.3
100.0 100.0
Acceptance4
Percent Valid Percent
1.0 1.0
6.9 6.9
25.0 25.0
37.3 37.3
19.1 19.1
10.8 10.8
100.0 100.0
Acceptancel
4
Acceptancel
291
T
Cumulative Percent
1.0
4.9
35.3
63.2
91.7
100.0
Cumulative Percent
1.0
7.8
32.8
70.1
89.2
100.0
Mean =4.89 Std. Dev. =1.174
N =204

> u
60
llj 40 ::J
~ LL
20
~
Acceptance2
4
Acceptance2
Acceptance3
~
-
Acceptance3
Acceptance4
Acceptance4
292
1,
I---
Mean =5 .02 Std . Dev. =1.22 1
N "204
Mean :::5.04 Stet Dev. =1.082
N =204
Mean =A.99 Std . De v. =l.114
N "204

For Japanese expatriates
Appendix 3 Demographic Information
This information is collected to classify who you are. (For question 1- 7, please circle the appropriate answer)
Ql. What is your age? 20 - 25 26 - 30 31 - 35 36-40 41 -45 46-50 51 - 55 56-60 61 -65 65+
Q2. What is your gender? Male Female
Q3. Which best describes your managerial level? (please circle the response that best describes y~u) Non-supervisor/non-manager (not a supervisor or manager) First Line supervisor Lower level/Junior Manager Middle Manager Senior Manager Executive Divisional Head/General Manager (not CEO) Chief Executive Officer/President
Q4. About how old is your organization? Year Less than 1 year 1 1 to 2 years 2 3 to 5 years 3 6 to 10 years 4 11 to 20 years 5 21 to 30 years 6 31 to 40 years 7 41 to 50 years 8 51 to 60 years 9 61 to 70 years 10 71 to 80 years 11 81 to 90 years 12 91 to 100 years 13 More than 100 years old 14
1 2 3 4 5 6 7 8 9 10
1 2
1 2 3 4 5 6
7 8
293
QS. How many years have you been in full time employment for
Less than one year 1 up to 2 years 2 up to 5 years 5 up to 10 years 10 up to 15 years 15 up to 20 years 20 up to 25 years 25 up to 30 years 30 up to 35 years 35 years or more
Year
1 2 3 4 5 6 7 8 9 10
Q6. Is this subsidiary a joint venture or a wholly owned Japanese subsidiary? Joint venture 1 Wholly owned Japanese subsidiary 2
Q7. What is your present industry? Metal Machinery Garment and textile Agricultural and marine Electric and electronic Automobile Chemicals Other. (Please write in)
1 2
3 4 5 6 7

THE IMPLEMENTATION OF JAPANESE MANAGEMENT PRACTICES The following questions relate to how Japanese management practices have been implemented in your organization, and the attitude of Japanese expatriates towards implementation of Japanese
management practices in Thailand.
Q8. Please indicate whether the following Japanese manageme11t practices have been 1mplelltented at this subsidiary (Yes or No), and if yes, the extent to which they have been implemented. Please circle the appropriate answer Not at To an
all extremely extent extent
1. Lifetime employment 1 2 3 4 5 6 7 2. Consensus decision-making 1 2 3 4 5 6 7 3. Seniority system 1 2 3 4 5 6 7 4. House union 1 2 3 4 5 6 7 5. Job rotation 1 2 3 4 5 6 7 6. Quality control circles 1 2 3 4 5 6 7
MOTIVATION TO THE ADAPTATION OF JAPANESE MANAGEMENT PRACTICES
Q9. If you were required to adapt Japanese management practices, Not at all Extremely
which of the following factors would be important in assisting you to Important~ Important
adapt? (Please circle the appropriate answer )
Vision The introduction of adaptation is accompanied by: 1. Provision of explanation of the advantage of the adaptation to key internal and
1 2 3 4 5 6 7 external groups (employees, management, unions, customers, clients, etc.).
2. A clear rationale for the adaptation and beliefs needed to make the adaptation 1 2 3 4 5 6 7
successful. 3. A clear timetable is devised for the various phases of the adaptation. 1 2 3 4 5 6 7
4. Provision of a plan detailing the various steps of the adaptation. 1 2 3 4 5 6 7
5. A discussion of specific new ways in which structure, systems and people 1 2 3 4 5 6 7
practices would adapt. iA'.' lHJ e f 'i ~Ii f* The adaptation of Japanese management practices can be successfully implemented if: 6. CEO and the senior management set an example by modelling appropriate
behaviours to adapt. 1 2 3 4 5 6 7
7. From the beginning there is a powerful guiding executive coalition clearly in 1 2 support of the adaptation.
3 4 5 6 7
8. -Once the adaptation program commences, there is clear evidence of the CEO 1 2 3 4 5 6 7 and the senior management team attempting and championing the adaptation.
9. The CEO and senior management ensure the support of key power groups for 1 2 3 4 5 6 7 the adaptation.
10. The CEO and senior management create and communicate a sense of urgent 1 2 3 4 5 6 7 need for adaptation throughout the organization.
The adaptation of Japanese management practices can be supported by: 11. Adequate financial resources are allocated in support of the adaptation. 1 2 3 4 5 6 7
12. Adequate human resources are allocated· in support of the adaptation. 1 2 3 4 5 6 7
294

Not at all Extremely Important~ Important
Re~murce su.pp<fft The adaptation of Japanese management practices can be supported by: 13. You will receive adequate and appropriate training to enable you to work in 2 3 4 5 6 7
new ways. 14. Senior management are prepared to devote their time to meetings, 2 3 4 5 6 7
presentations, communication, education and training needed to support the adaptation.
I~c·wanh
The adaptation of Japanese management practices can be facilitated by: 15. Providing the opportunity for new and exciting challenges, enabling you to 2 3 4 5 6 7
develop my skills and capabilities. 16. Getting you more pay as a result of the adaptation. 2 3 4 5 6 7 17. There is little chance of advancement in the organization unless you embrace 2 3 4 5 6 7
the adaptation. 18. Successful adaptation provides satisfaction for a job well done. 1 2 3 4 5 6 7
19. Having pay system and benefits of your firm treat each employee equally. 1 2 3 4 5 6 7
Strm:wring ftir change The adaptation is supported because: 20. The structure of adaptation process is flexible. 1 2 3 4 5 6 7
21. The structure of adaptation is clear and helpful 1 2 3 4 5 6 7
22. The structural arrangement provides new insights for adaptation. 2 3 4 5 6 7
23. The structural arrangement devise for managing adaptation is appropriate. 1 2 3 4 5 6 7 24. The structure of adaptation process is well designed. 1 2 3 4 5 6 7 l~diltfo:nship
Perceived extent to which the following relationship approaches are used to facilitate the adaptation: 25. Your relationship with your supervisor will be a harmonious one after adapting 1 2 3 4 5 6 7
Japanese management practices. 26. You can feely talk with someone at work if you have a work-related problem. 1 2 3 4 5 6 7 . .
27. There is no evidence of unresolved conflict in the organization. 1 2 3 4 5 6 7 28. Your relationships with peers of your work groups are friendly. 1 2 3 4 5 6 7 29. You have estabhshed relationships with everyone in your organization that you 1 2 3 4 5 6 7
need to adapt to do your job properly.
ADAPTATION OF JAPANESE MANAGEMENT PRACRICES
QlO. Please indicate the extent to which you think that you will agree to adapt your management practices to local conditions if you are provided by those motivational factors mentioned above. Please circle the appropriate answer Totally Totally
disagree agree
1. I am willing to customize the management practices. 1 2 3 4 5 6 7 2. I am willing to adjust the process of management practices. 1 . 2 3 4 5 6 7 3. I am willing to change the management procedures. 1 2 3 4 5 6 7 4. I am willing to invest in tool/equipment to better adjust 1 2 3 4 5 6 7
management practices to local condition.
Thank you for your participation
295

For Thai Staffs
Demographic Information
This information is collected to classify who you are. (For question 1- 7, please circle the appropriate answer)
Ql. What is your age? 20 -25 26 -30 31 - 35 36- 40 41-45 46-50 51 -55 56-60 61-65 65+
Q2. What is your gender? Male Female
Q3. Which best describes your managerial level? (please circle the response that best describes you) Non-supervisor/non-manager (not a supervisor or manager) First Line supervisor Lower level/Junior Manager Middle Manager Senior Manager Executive Divisional Head/General Manager (not CEO) Chief Executive Officer/President
Q4. About how old is your organization? Year Less than 1 year 1 1 to 2 years 2 3 to 5 years 3 6 to 10 years 4 11 to 20 years 5 21 to 30 years 6 31 to 40 years 7 41 to 50 years 8 51 to 60 years 9 61 to 70 years 10 71 to 80 years 11 81 to 90 years 12 91 to 100 years 13 More than 100 years old 14
1 2 3 4 5 6 7 8 9 10
1 2
1 2 3 4 5 6
7 8
296
QS. How many years have you been in full time employment for
Less than one year 1 up to 2 years 2 up to 5 years 5 up to 10 years 10 up to 15 years 15 up to 20 years 20 up to 25 years 25 up to 30 years 30 up to 35 years 35 years or more
Year
1 2 3 4 5 6 7 8 9 10
Q6. ls this subsidiary a joint venture or a wholly owned Japanese subsidiary? Joint venture 1 Wholly owned Japanese subsidiary 2
Q7. What is your present industry? Metal 1 Machinery 2 Garment and textile 3 Agricultural and marine 4 Electric and electronic 5 Automobile 6 Chemicals 7 Other. (Please write in)

THE IMPLEMENTATION OF JAPANESE MANAGEMENT PRACTICES The following questions relate to how Japanese management practices have been implemented in your organization, and the attitude of Thai staffs towards implementation of Japanese management practices
in Thailand.
Q8. Please indicate whether the following Japanese management practices have been implemented at this subsidiary (Yes or No), and if yes, the extent to which they have been implemented. Please circle the appropriate answer Not at To an
all extremely extent extent
7. Lifetime employment 2 3 4 5 6 7 8. Consensus decision-making 1 2 3 4 5 6 7
9. Seniority system 1 2 3 4 5 6 7 10. House union 1 2 3 4 5 6 7
11. Job rotation 1 2 3 4 5 6 7
12. Quality control circles 1 2 3 4 5 6 7
MOTIVATION TO THE ACCEPTANCE OF J APANESE MANAGEMENT PRACTICES
Q9. If you were required to accept Japanese management practices, which Not at all ..----.. Extremely
of the following factors would be important in assisting you to accept? Important Important
(Please circle the appropriate answer }
Vision The introduction of the use of Japanese management practices lS
accompanied by: 1. Providing explanation of the advantage of the Japanese management practices to
key internal and external groups (employees, management, unions, customers, 2 3 4 5 6 7
clients, etc.). 2. A clear rationale for the use of Japanese management practices and beliefs needed
2 3 to make successfully implementation.
4 5 6 7
3. A clear timetable is devised for the various phases of the use of Japanese 2 3 4 5 6 7 management practices.
4. Provision of a plan detailing the various steps of the use of Japanese management 2 3 4 5 6 7 practices.
5. A discussion of specific new ways in which structure, systems and people practices 1 2 3 4 5 6 7 would implement the Japanese management practices.
Leadership and management practice The use of Japanese management practices can be success/ ully implemented if: 6. Managers set an example by modelling appropriate behaviours to implement 2 3 4 5 6 7
Japanese management practices. 7. From the beginning there is a powerful guiding executive coalition clearly in
support of the use of Japanese management practices. 1 2 3 4 5 6 7
8. Once the use of Japanese management practices commences, there is clear evidence of the CEO and the senior management team attempting and championing 2 3 4 5 6 7
the use of Japanese management practices. 9. The CEO and senior management ensure the support of key power groups for the 2 3 4 5 6 7
use of Japanese management practices. 10. The CEO and senior management create and communicate a sense of urgent need 2 3 4 5 6 7
for implementing Japanese management practices throughout the organization.
297

Not at all~ Extremely Important Important
RtsU:Jn,~(' support The use of Japanese management practices can be supported by: 11. ·Adequate financial resources are allocated in support of the use of Japanese
management practices.
12. Adequate human resources are allocated in support of the use of Japanese management practices.
13. You will receive adequate and appropriate training to enable you to work in new ways.
14. Senior management are prepared to devote their time to meetings, presentations, communication, education and training needed to support the use of Japanese management practices.
l\·fotivatfrm und n.:1v~irds The use of Japanese management practices can be facilitated by:
1 1
1
15. Providing the opportunity for new and exciting challenges, enabling you to develop 1 my skills and capabilities.
16. Getting you more pay as a result of the use of Japanese management practices. 17. There is little chance of advancement in the organization unless you embrace the
use of Japanese management practices.
1 1
18. Successful implementation of Japanese management practices provides satisfaction 1 for a job well done.
19. Having pay system and benefits of your firm treat each employee equally.
Structuring for d:urngc The use of Japanese management practices is supported because: 120. The structures of Japanese management practices are flexible. 121 . The structure of the use of Japanese management practices is clear and helpful. 122. The structural arrangement provides new insights into the use of Japanese
management practices. 1')3. The structural arrangement devise for managing the use of Japanese management
practices is appropriate. 24. The structures of Japanese management practices are well designed. llclaHo:nsMp Perceived ·extent to which ihe following relationship approaches are used to 1acilitate the use of Japanese management practices: 25. Your relationship with your supervisor will be a harmonious one after
implementing Japanese management practices. 26. You can feely talk with someone at work if you have a work-related problem. 27. There is no evidence of unresolved conflict in the organization.
1
1 1 1
1
1
1
1 1
128. Your relationships with peers in your work groups are friendly. 1 129. You have established the relationships that you need to do your job properly 1
ACCEPTANCE OF JAPANESE MANAGEMENT PRACRICES
2
2 2
2
2
2 2
2
2
2 2 2
2
2
2
2 2 2 2
3
3 3
3
3
3 3
3
3
3 3 3
3
3
3
3 3 3 3
4
4 4
4
4
4 4
4
4
4 4 4
4
4
4
4 4 4 4
5
5 5
5
5
5 5
5
5
5 5 5
5
5
5
5 5 5 5
6
6 6
6
6
6 6
6
6
6 6 6
6
6
6
6 6 6 6
7
7 7
7
7
7 7
7
7
7 7 7
7
7
7
7 7 7 7
QlO. Please indicate the extent to which you think that you will agree to accept the use of Japanese management practices to local conditions if you are provided by those motivational factors mentioned above. Please circle the appropriate answer Totally Totally
disagree agree I . I intend to accept the Japanese management practices in the future. I 2 3 4 5 6 7 2. I will always make aneffort to accept the Japanese management I 2 3 4 5 6 7
practices. 3. I will try to accept the Japanese management procedures. 2 3 4 5 6 7
4. I intend to accept the Japanese management practices. 1 2 3 4 5 6 7
Thank you for ~ur participation

Victoria University PO Box 14428 MELBOURNE VIC 8001 Australia
Telephone: Mr Tanachart Raoprasert (03) 9919 1070 Victoria Graduate School of Facsimile: Business
City Flinders Campus 301 Flinders Lane
(03) 9919 1064 Email:[email protected] VICTORIA
UNIVERSITY Melbourne Appendix 4
Information for Participants in the Adaptation of Japanese Management Practices Survey
Dear Potential Participant,
We would like to invite you to be part of a study into:
Factors Influencing the Adaptation and Acceptance of Japanese Management Practices in Thailand.
This study is part of a Doctor of Business Administration degree. The objectives of this study are to explore the application of Japanese management practices in a Thai cultural context, to examine the extent to which Japanese transplant their management style to Thai culture and to investigate the factors that can be introduced to manufacturing organizations that enable Thai subordinates to accept, and Japanese managers to adapt, Japanese management practice to Thai culture. Your participation is completely voluntary and all information obtained will be completely anonymous and confidential. We will establish only an anonymous data file, so no individual's opinions will be identified. There will be no negative consequences to you not participating, as we will not be ·mentioning any individuals irt the thesis.
With your permission we would like you to answer each question as reliably as you can. There are no rights or wrong answers. This questionnaire is about your perceptions of Japanese management practices to what you feel about the Japanese management practices and how the Japanese management practices can be adapted and accepted to Thai local condition. It should take you around 15 to 20 minutes to complete the entire questionnaire.
Thank you for considering participating in this research. If you have any questions in relation to our study please contact Professor Sardar M. N. Islam (+61-3-9919 1338 or [email protected]) or myself at the contact details above. Should you have any concerns with the operation of survey please contact the secretary of the Victoria University Human Research Ethics Committee ([email protected] or +61-3-9919 4128).
Thank you for your assistance in this research,
Tanachart Raoprasert Doctor of Business Administration Candidate
299