Factors influencing the acceptance of computer assisted ...
92
Rochester Institute of Technology Rochester Institute of Technology RIT Scholar Works RIT Scholar Works Theses 5-1-1981 Factors influencing the acceptance of computer assisted Factors influencing the acceptance of computer assisted estimating estimating Sharon Ryan Follow this and additional works at: https://scholarworks.rit.edu/theses Recommended Citation Recommended Citation Ryan, Sharon, "Factors influencing the acceptance of computer assisted estimating" (1981). Thesis. Rochester Institute of Technology. Accessed from This Thesis is brought to you for free and open access by RIT Scholar Works. It has been accepted for inclusion in Theses by an authorized administrator of RIT Scholar Works. For more information, please contact [email protected].
Transcript of Factors influencing the acceptance of computer assisted ...

Rochester Institute of Technology Rochester Institute of Technology
RIT Scholar Works RIT Scholar Works
Theses
5-1-1981
Factors influencing the acceptance of computer assisted Factors influencing the acceptance of computer assisted
estimating estimating
Sharon Ryan
Follow this and additional works at: https://scholarworks.rit.edu/theses
Recommended Citation Recommended Citation Ryan, Sharon, "Factors influencing the acceptance of computer assisted estimating" (1981). Thesis. Rochester Institute of Technology. Accessed from
This Thesis is brought to you for free and open access by RIT Scholar Works. It has been accepted for inclusion in Theses by an authorized administrator of RIT Scholar Works. For more information, please contact [email protected].

FACTORS INFLUENCING THE ACCEPTANCE OFCOMPUTER ASSISTED ESTIMATING
by
Sharon L. Ryan
A thesis submitted in partial fulfillment of therequirements for the degree of Master of Science in the
School of Printing in the College of Graphic Arts and Photographyof the Rochester Institute of Technology
May, 1981
Thesis Advisor: Mr. William BirkettAssociate Professor of
Printing Management

Certificate of Approval--Master's Thesis
School of PrintingRochester Institute of Technology
Rochester, New York
CERTIFICATE OF APPROVAL
MASTER'S THESIS
This is to certify that the Master's Thesis of
name of student
with a major in--:--:----=-----::::------::----=----:---------
has been approved by the Thesis Committee assatisfactory for the thesis requirement for the Masterof Science degree at the convocation of
date
Thesis Committee; William BirkettTt.?'sis Xdvisor
Joseph L. Noga~uate IAdvisor
Director or Designate
ABSTRACT
In spite of its advantages over manual estimating methods,
computer assisted estimating (CAE) lacks acceptance in the printing
industry today. Possible reasons for non-acceptance are: 1) the cost
of CAE, 2) CAE's lack of versatility, 3) printing manager's lack
of knowledge on the subject of CAE and/or computers in general, and
4) the small size of the majority of the printing companies does
not warrant the use of CAE.
A survey questionnaire was designed for the purpose of finding
out how printing companies feel about CAE, and if the reasons listed
above are, in fact, major influences on their decision not to use
CAE. The responses of the survey were analyzed by use of the Statistical
Package for the Social Sciences (SPSS).
There were 312 survey responses used in data analysis. From
this data, it was concluded that the major reason for CAE rejection
among the responding population is the cost of CAE. The factor of
company size must be considered also when stating this conclusion,
since 55 percent of the printing companies responding employ between
one and twenty-five people. In the overall population, when the number
of employees in printing companies increases, so does CAE usage,
which indicates the size of the company is an important factor towards
CAE acceptance among the respondents to the survey.

The major factor influencing the acceptance of CAE in the
form of a problem with CAE itself (and not the printing company)
is CAE's lack of program versatility. The author feels that this
problem will be overcome in the near future with improved customized
and semi-customized system programming.

TABLE OF CONTENTS
Chapter
I . INTRODUCTION 1
FOOTNOTES FOR CHAPTER I 6
II . PRESENTATION AND ANALYSIS OF DATA 7
Objectives of the Study 7
Hypothesis
Related Research 8
Background Theory, Design Parameters 10
Methodology of the Study 13
Results and Findings 20
FOOTNOTES FOR CHAPTER II 69
III . SUMMARY AND CONCLUSIONS 70
BIBLIOGRAPHY 72
APPENDIX A 73
APPENDIX B 74
APPENDIX C 78
APPENDIX D 79
APPENDIX E 82
APPENDIX F 83
n

LIST OF TABLES
Table Page
1. Geographical Distribution of Responses 21
2. Position of Respondent 22
3. Percentage of Responses from the General
Commercial and Specialized Printing Companies 23
4. Percentage of Small, Medium and Large Sized
Printing Companies Responding 23
5. Percentage of Respondents Using Each
Estimating Method 23
6. Percentage of Respondents According to the
Method Used to Determine Production
Standards 24
7. Percentage of Manual Estimators Having Used
Computers in Production or Management 25
8. Percentages of Companies According to Where
the Company has Heard of CAE 25
9. Percentages of How Seriously Respondents
Have Considered Using CAE 26
10. Percentage of Respondents According to the
Major Influence on Their Decision Not
to Use CAE 27
11. Percentage of Respondents Who Would Consider
Using CAE in a Computer Dedicated to
Estimating Functions, at a Given Price
Range 28
12. Percentage of Respondents Who Would Consider
Using CAE as Part of a Management
Information System, at a Given Price Range 28
13. Percentage of Length of Time CAE users had
Been Us ing CAE 29
iii

Table Page
14. Percentage of Respondents According to What
Data Base They Developed 29
15. Percentage of Respondents According to How
Satisfied They Are With Their System 30
16. List of Percentages According to Disadvantages
Respondents Found in Using CAE 30
17. Detailed Breakdown in Number of Employees
in Responding Companies 31
18. Percentage of CAE Respondents Using Customized
and Packaged Programs 31
19. Percentage of Estimating Methods Used by the
Different Sizes of Companies 32
20. Ratio of CAE Users to Non-Users Accordingto the Size of the Company 32
21. Price at Which Respondents Would Consider UsingCAE on a Computer Dedicated Solely to the
Task, Categorized by the Size of the
Company 34
22. Price at Which Respondents Would Consider UsingCAE as a Part of a Management Information
System, Categorized by the Size of the
Company 35
23. Cross-Tabulation of Company Size by the Major
Influence on Their Decision Not to Use CAE
Percentage of Total Responses to Column 38
24. Cross-Tabulation of the Type of Printing Company
By the Major Influence on Their Decision to
Use CAE 39
25. Cross-Tabulation of CAE Users by the Type
of Printing Company They Work For 40
26. Cross-Tabulation of Where the Company Heard of
CAE by How Seriously They Considered Using It 42
27. Cross-Tabulation of Where the Company Heard
of CAE by the Major Influences on Their
Decision Not to Use It 45
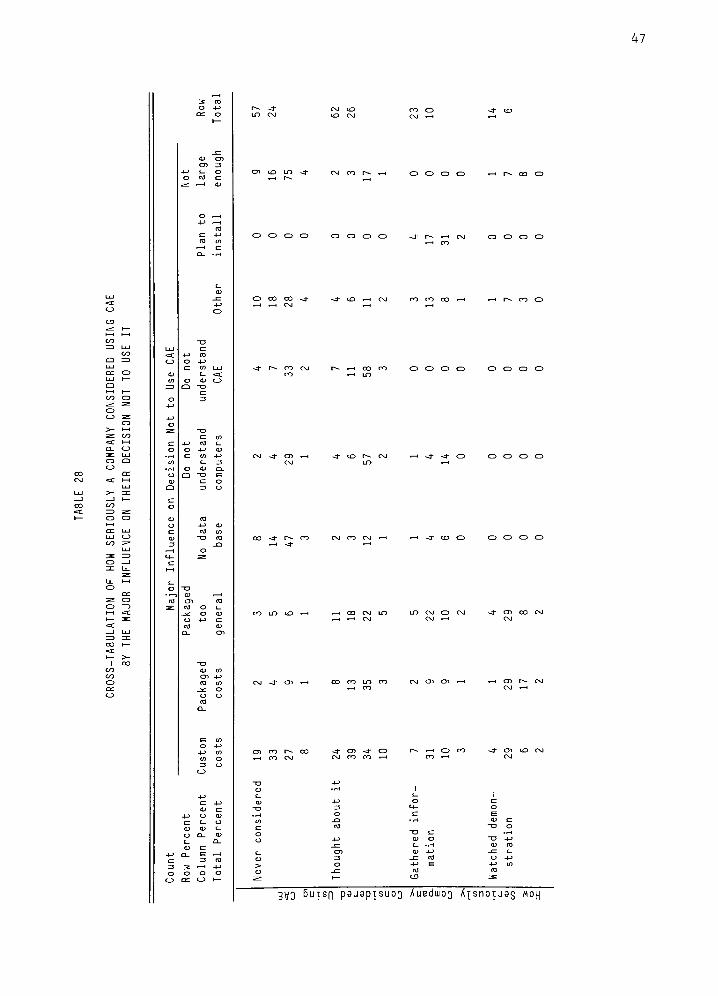
28. Cross-Tabulation of How Seriously a CompanyConsidered Using CAE by the Major Influence
on Their Decision Not to Use It 47
iv

Table Page
29. Breakdown of Companies That Heard of CAE in
Trade Journals and Trade Shows, by How
Seriously They Considered Using CAE, bythe Major Influence on Their Decision Not
to Use It 50
30. Breakdown of Companies That Heard of CAE
Through Salesman and CAE Literature, byHow Seriously They Considered Using It, bythe Major Influence on Their Decision Not
to Use It 51
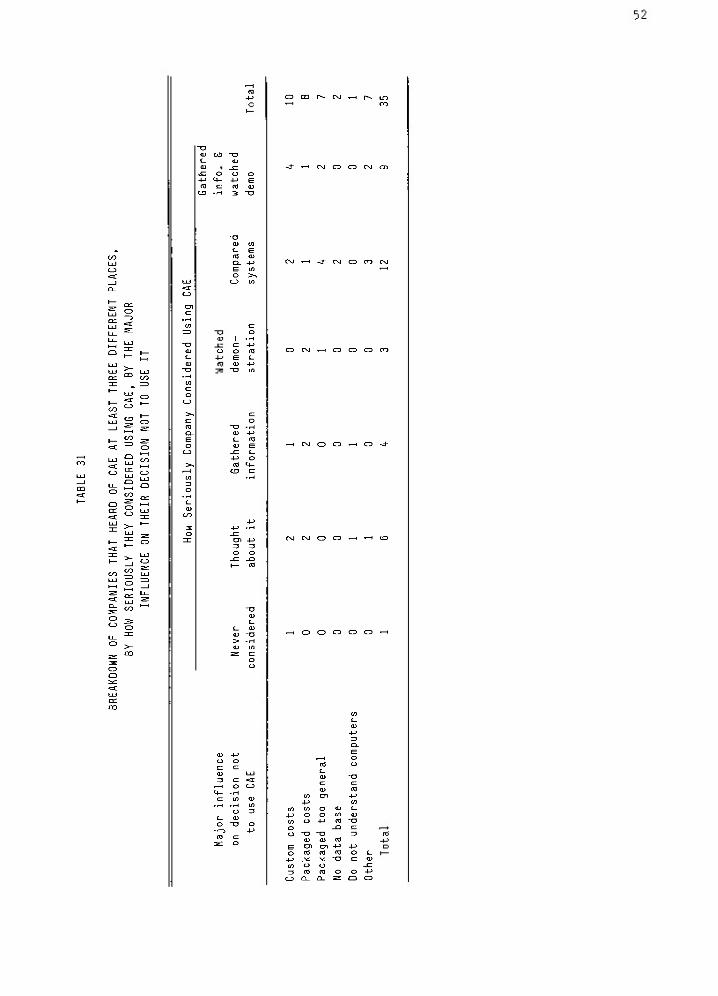
31. Breakdown of Companies That Heard of CAE at
Least Three Different Places, by How
Seriously They Considered Using CAE, bythe Major Influence on Their Decision to Use It 52
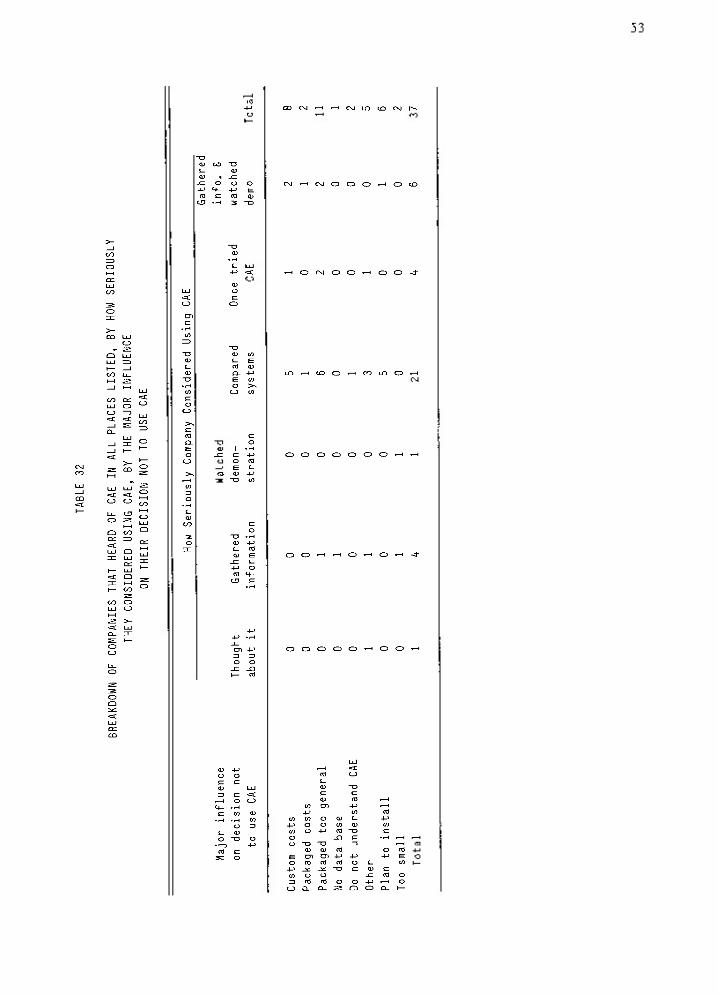
32. Breakdown of Companies That Heard of CAE in
All Places Listed, by How Seriously They
Considered Using CAE, by the Major Influence
on Their Decision Not to Use CAE 53
33. Cross-Tabulation Between the Major Influences
on a Company's Decision Not to Use CAE and
Whether or Not They Used Computers in
Production or Management 55
34. Breakdown of Companies Listing "No DataBase"
As the Major Influence on Their Decision
Not to Use CAE 57
35. Breakdown of Packaged System CAE Users byProduction Standards, by the Data Base
Developed 58
36. Breakdown of Customized CAE System Users
by Production Standards, by the Data Base
Developed 58
37- Breakdown of CAE Users, by Production Standards
Used, by How Satisfied They Are With
Their System 60
38. Breakdown of How Satisfied Companies Are With
CAE, by Data Base Development, by the
Major Disadvantage They Found in Using CAE 61
CHAPTER I
INTRODUCTION
Computer assisted estimating was introduced to the printing
industry in 1971. Unlike the computer in other areas of printing,
computer assisted estimating lacks acceptance among estimators and
management in the majority of printing companies throughout the United
States.
Computer assisted estimating (often abbreviated CAE) is an
estimating method in which a computer assists the estimator in the
estimating function. Ideally, when CAE is used, a job input form is
filled out before sitting down at the computer keyboard. In most cases
the estimator fills out this input form, making decisions such as which
press to use, what imposition is best or possible, how many negatives,
proofs or plates will be required for the job, what finishing operations
are necessary, etc. After the sheet is filled out, the estimator or an
assistant to the estimator, inputs the information into the computer
and commands the computer to calculate the cost of the particular job.
The figures required for calculation (hourly rates, production stan
dards, material costs) are stored in the computer's data base.
There are two basic types of computer assisted estimating
systems available to printing companies today. They are: 1) customized
CAE systems, and 2) turnkey or packaged CAE systems. In a customized
system, the program software is tailored to a particular company's
needs. A turnkey or packaged system follows a format designed by the
CAE vendor, which includes a program of operations which would take
place in an average commercial printing company. There have been at
least fifteen different packaged systems on the market at one time or
another. No two are exactly alike. The CAE concept is basically the
same whether customized or turnkey.
There have been numerous articles published since the invention
of CAE, praising this method of estimating. Advantages such as speed,
accuracy, consistency, and lower costs per estimate, have all been
cited as major benefits of CAE. Articles declaring anything less than
successful use of CAE are rare. Headings of articles such as "Computer-
1ized Estimating Helps Village Press
Grow,"
"Big or Small Computerized
2Estimating is a Must for All,"
"Estimating That Complex Art Made
3Swift and Easy by Mini Computer," "Computer Cuts Time, Labor in
4Estimating,"
and "Computerized Estimating May be a Reality for Small
Printers,"are common examples of the literature appearing over the
past several years in various printing trade magazines.
Computer assisted estimating does possess distinct advantages
over scratch estimating, which is the most popular estimating method
presently used. CAE is faster than scratch estimating. Almost all of
the estimate calculations are performed by the computer. This calcula
tion capability cuts time considerably for the estimator. Three quant
ities (more on some systems) may be calculated in the amount of time
required for one. This savings of time for the estimator has many
benefits, such as allowing more time to set priorities for jobs coming
up for bids. Also, having extra time allows the estimator to be
more creative in planning and analyzing each job.

Another advantage of the computer's calculation capability is
arithmetical accuracy. There are considerably less keys to punch
when inputing a computer assisted estimate as opposed to figuring
an estimate by the manual scratch method, using a calculator or adding
machine. This reduces human error. If the estimator fills in the
input forms accurately and the hardware and software is working properly,
then the only place a mistake could be made is in punching in the
job specifications. Keystrokes are so few there is little chance
of making a mistake.
Consistency is another advantage of using CAE. The input
forms, along with the data base, helps to yield consistent estimates,
regardless of the person doing the estimate.
Lower cost per estimate has been stated as being an advantage
of using CAE. There are many factors involved in figuring the cost
per estimate in a company. One of the major factors the speed
of estimating can reduce the cost of each estimate significantly.
This potential cost reduction through time savings is no real benefit
unless the data base used to calculate the estimates reflects the
company's true cost. As Dr. Robert Hacker of the RIT School of Technology
wrote, "Without standards, CAE will only help the printer go out
of business morequickly."
The data base of production standards, hourly rates and material
costs may be changed as needed by the CAE user in all CAE systems.
Once an accurate data base is built it is easy to compare estimates
to actual costs and modify the base when necessary. Why then, with
all of these potential benefits, does CAE lack acceptance? Success
stories are plentiful, there is a variety of systems from which to
choose, and customized systems are available, so why is the number
of CAE users so small?
The author believes that the original investment for using
CAE is one major reason why companies decide against using this method
of estimating. A sophisticated piece of machinery such as a mini-computer
is very high priced compared to the cost of a calculator or adding
machine normally used in other estimating methods. Perhaps company
owners cannot justify the benefits of CAE when they have been getting
along all right with manual methods for a long time, which are much
less expensive.
Lack of versatility is a major disadvantage of turnkey or
packaged estimating programs. Many companies find that there aren't
enough operations included in a packaged program to fit their needs.
It is possible that these same companies cannot afford to have a
custom program tailored to their needs, so they decide not to use
a CAE system altogether.
Perhaps a lot of companies do not need a computer to assist
in their estimating because of the number of estimates performed
a day. Also, the complexity of each estimate would be an important
consideration in the decision of whether or not to use CAE.
Another possible reason that CAE users seem so few is perhaps
companies are writing their own programs for the computers already
being used in management. Most calculations used in estimating the
cost of a job do not require complex formulas or mathematics. A lot
of the programming of a packaged system would be unnecessary for
a company writing its own program which would simplify programming.
If companies were custom writing their own computer assisted estimating
programs, there would be no record of their system in sales statistics
of CAE systems.
If the management of a printing company does not understand
computers and/or estimating as it relates to computers, then they
are unlikely to invest in a CAE system. It is common in our society
to find people who distrust computers altogether because they don't
understand them.
The data base which a printing company uses to estimate jobs
should be built from reliable information such as time studies,
employees'
time sheets, or other thoughtful data collecting methods.
Some companies feel that until they develop reliable estimating
standards, the purchase or use of CAE is wasteful (garbage in, garbage
out) .
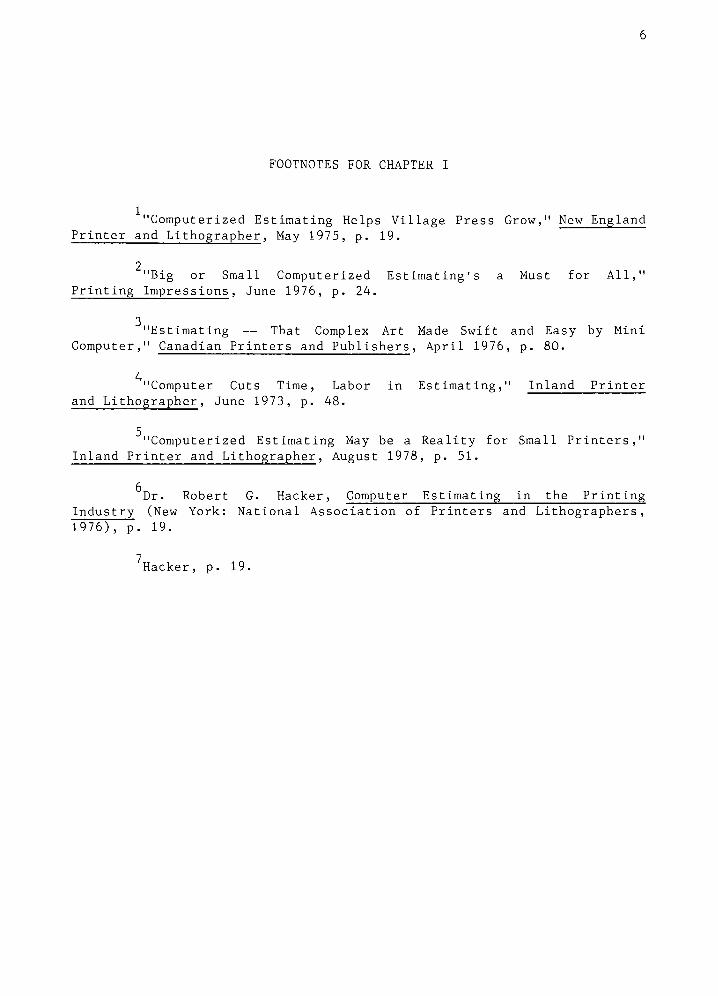
FOOTNOTES FOR CHAPTER I
"Computerized Estimating Helps Village PressGrow," New England
Printer and Lithographer, May 1975, p. 19.
2"Big or Small Computerized Estimating's a Must for
All,"
Printing Impressions, June 1976, p. 24.
3
"Estimating That Complex Art Made Swift and Easy by Mini
Computer,"Canadian Printers and Publishers, April 1976, p. 80.
4"Computer Cuts Time, Labor in
Estimating,"Inland Printer
and Lithographer, June 1973, p. 48.
"Computerized Estimating May be a Reality for SmallPrinters,"
Inland Printer and Lithographer, August 1978, p. 51.
Dr. Robert G. Hacker, Computer Estimating in the Printing
Industry (New York: National Association of Printers and Lithographers,
1976), p. 19.
Hacker, p. 19.

CHAPTER II
PRESENTATION AND ANALYSIS OF DATA
Objectives of the Study
The first objective of my study was to determine the degree
of CAE acceptance within the given population. This number of CAE users
was compared with other CAE survey statistics.
The second objective was to determine the relationship between
the size of a printing company and its decision to use or not to use
CAE.
The third objective of this study was to find the relationship
between the type of printing company (general commercial and specialized)
and its decision to use or not to use CAE.
The fourth objective was to discover the relationship between
the knowledge of a company in the area of a CAE and its decision to
use or not to use CAE.
The fifth objective was to find the relationship between a
company's production standards and its decision to use or not to use
CAE.
Hypothesis
It was hypothesized that when one or more of the following
conditions are met, CAE will become more widely accepted:
1) the original investment for using CAE decreases,
2) packaged systems available are more versatile,
3) management gains an understanding of CAE,
4) management begins to use defined hourly rates.
In order to test these research questions, the following hypothe
ses were formulated:
1) Printing companies decide to use CAE when the original
investment for using CAE decreases.
2) Printing companies requiring a more versatile estimating pro
gram than those presently on the market in packaged systems
form will decide to use CAE when such systems are developed.
3) Management is more favorable towards using CAE when it devel
ops and totally understands its company's production stand
ards and machine hourly rates, as they relate to CAE.
Related Research
To date there have not been any published research results
which answer the question of why computer assisted estimating has not
been accepted in the printing industry. There are opinions of those
knowledgeable on the subject which deserve attention.
Michael Nolan, Director of Computer Systems Studies for the
Graphic Computer Communications Association (GCCA) , a section of Print
ing Industries of America, published an article in September, 1979
Printing Impressions magazine. The article listed several reasons he
believed there is a lack of CAE acceptance. The following list is a
summary of the reasons given by Mr. Nolan:
1) Until recently, the cost of CAE has been too high for
the average printer.
2) Computer software firms are not willing to invest in
the development of CAE because of the diversity of estimating
methods and complexity of the process.
3) Printing companies may not be willing to purchase the
additional hardware required for the estimating program
software .
4) The cost of customizing general design systems requires
more resources than the company has available.
Phillip Kent Ruggles, Associate Professor of Graphic Communica
tions at the California Polytech State University, conducted a six-part
survey titled "Survey on Estimators andEstimating."
Although
Mr.Ruggles'
analysis of the results does not offer a reason for
lack of CAE acceptance, it does shed some light on the subject.
Because of his research in the field of estimating, Mr. Ruggles'
opinion concerning this problem was sought. In summary, the following
are reasons Mr. Ruggles believes CAE has not caught on as anticipated:
1) Systems currently on the market are too inflexible for
medium- and small-sized printers.
2) Estimators who are unfamiliar with computers may be fearful
of the"systems"
approach needed.
3) Companies interested in CAE for speed, delivery and consis
tency do not have defined, complete hour production standards
and/or machine hour rates (BHR's).
4) Smaller printers cannot afford the purchase price of
hardware; in addition, they are fearful of this hardware

10
becoming obsolete within a short time. Tight contractual
obligations in the lease agreement keep some smaller
and medium-sized printers from using CAE.
5) Top management is hesitant to install an estimating system
3which it believes only the estimator will understand.
Background Theory, Design Parameters
The data gathered for this thesis was analyzed using the
Statistical Package for the Social Sciences (SPSS). The three programs
selected for data analysis in this study were: 1) Subprogram Frequencies,
2) Subprogram Crosstabs, and 3) Subprogram Breakdown.
Subprogram Frequencies computes and presents one-way frequencydistribution tables, i.e., marginals, for what are termed discrete
or categorial variables, i.e., variables classified into a limited
number of values or categories. 3
The percentages of all of the answers to each variable were drawn
from these tables.
Subprogram Crosstabs was used to compare two variables. The
statistics applied when analyzing the data fell under two categories:
1) measure of association, and 2) tests of statistical significance.
The specific statistics used depended on the level of measurement
of each variable. In this study, the variables fell under two categories,
labeled nominal and ordinal. A nominal level of measurement makes
no assumption about the values being assigned to the data, whereas
ordinal measurement makes it possible to rank-order all of the categories
according to some criterion.
An example of nominal and ordinal variables is shown on the
following page.
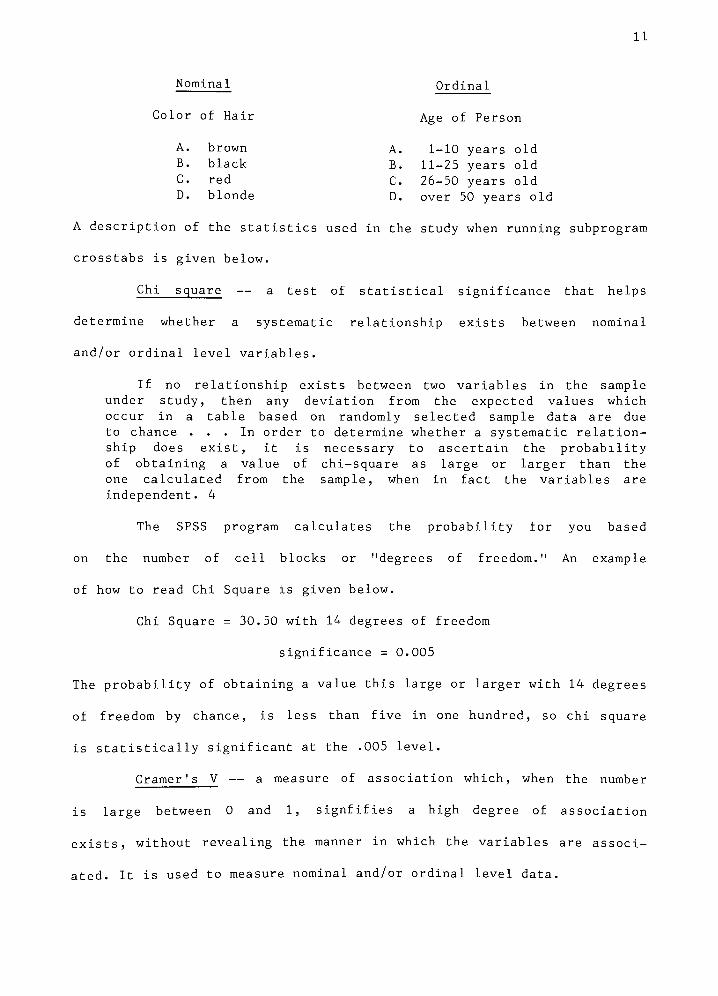
11
Nominal Ordinal
Color of Hair Age of Person
A. brown A. 1-10 years old
B. black B. 11-25 years old
C red C. 26-50 years old
D. blonde D. over 50 years old
A description of the statistics used in the study when running subprogram
crosstabs is given below.
Chi square a test of statistical significance that helps
determine whether a systematic relationship exists between nominal
and/or ordinal level variables.
If no relationship exists between two variables in the sample
under study, then any deviation from the expected values which
occur in a table based on randomly selected sample data are due
to chance ... In order to determine whether a systematic relation
ship does exist, it is necessary to ascertain the probability
of obtaining a value of chi-square as large or larger than the
one calculated from the sample, when in fact the variables are
independent. 4
The SPSS program calculates the probability for you based
on the number of cell blocks or "degrees offreedom."
An example
of how to read Chi Square is given below.
Chi Square = 30.50 with 14 degrees of freedom
significance = 0.005
The probability of obtaining a value this large or larger with 14 degrees
of freedom by chance, is less than five in one hundred, so chi square
is statistically significant at the .005 level.
Cramer's V a measure of association which, when the number
is large between 0 and 1, signfifies a high degree of association
exists, without revealing the manner in which the variables are associ
ated. It is used to measure nominal and/or ordinal level data.
12
Lambda a measure of association. There are two types of
lambda, asymmetric and symmetric. Asymmetric lambda measures the
percentage of improvement in our ability to predict the value of
the dependent variable once we know the value of the independent
variable. This is computed for both variables in a crosstable.
A symmetric lambda is a kind of average of the two asymmetric
values, making no assumption about which variable is dependent.
The maximum value of lambda is 1.0, which indicates a prediction
can be made without error. The value zero means there is no improvement
in prediction. Lambda may be used with both nominal and ordinal data.
Uncertainty coefficient a measure of association of the
dependent and independent variables which calculates the symmetrical
value and asymmetrical value of measurement.
The asymmetrical coefficient is the proportion by which
'uncertainty'in the dependent variable is reduced by knowledge
of the independent variable. The concept of uncertainty comes
from information theory and has to do with the ambiguity of data
distribution. 5
The major difference between this approach and the method of calculating
lambda is that the uncertainty coefficient considers the entire distribu
tion, not just the mode.
Tau C and gamma measures the association between two ordinal
level variables.
Each pair is checked to see if their relative ordering on
the first variable is the same (concordant) as the relative ordering
of categories of variables on the second variable, or if the
ordering is reversed (discordant) ... It takes on the value
of +1 when all cases fall along the major diagonal. Similarly
a -1 is achieved when all cases fall along the minor diagonal.
If any cases fall along the off-diagonal cells, tau C will have
some value between these two extremes. 6
13
The difference between Tau C and the statistical gamma is
the way in which"tied"
cases are counted. A tied case is one in
which two individuals are at the same position on one or both of
the variables. Tau C makes adjustments for these ties, whereas gamma
does not. This causes Tau C to take on a lower value than gamma.
Methodology of the Study
The method used to test the hypothesis was the survey question
naire method. One thousand printing companies were randomly selected
from the March, 1980 Printing Industries of America, Inc. membership
list. Each company selected was mailed a survey questionnaire, along
with a stamped, self-addressed envelope.
A cover letter was printed on the front page of the survey
(see Appendix A). The first paragraph of the cover letter stated
the importance of estimating and acknowledges the fact that estimating
techniques are constantly changing with our technology. The purpose
of the survey was stated in the second paragraph.
The term "computer assistedestimating"
was purposely avoided
so that non-users of a system would not get discouraged before reading
further. In this paragraph, it was requested that a person who is
familiar with the reason(s) his company uses the estimating method
it does, answer the questionnaire. The third paragraph pointed out
the fact that every companys'
answers carry the same weight. The
fourth paragraph offered the survey results as a reward for responding.
Confidentiality was assured in this paragraph. The fifth paragraph
urged the reader to respond.
14
The questionnaire used in the survey for this study followed
the outline prescribed by Mildred Parten, Ph.D., in her book titled
Surveys, Polls, and Samples.
The information included on the schedule (survey) may be
classified under three headings: (1) Identifying information.
This insures that the schedule will not be mislaid, lost or dupli
cated; that the information on it pertains to the particular
sample case; and that the interviewer and informant can be identi
fied. (2) Social background or census-type factual data. This
information about the respondent provides variables by which
the survey data are to be classified and also the basis for evalu
ating the sample. (3) Questions on the subject matter of the
survey. These questions may be directed towards obtaining more
or less objective facts or towards revealing attitude and opinions
on matters of current interest. 7
The identifying items used in my survey were the following:
1) Name of the survey a title was not used on the question
naire. The purpose of the survey implied on the cover
letter, was to learn more about estimating methods in
general. The term "estimatingmethods"
was used because
it is neutral and does not imply that information about
one estimating method is more important than another.
This term eliminated any bias which might have occured
had the words "computer assistedestimating"
or "manual
estimatingmethods'' been used.
2) Name of agency sponsoring the survey. An RIT stamp signifying
the legitimacy of the project appeared on the cover of
each questionnaire (see Appendix A). Educational institutions
rate very high and sponsorship of surveys by them produces
Q
excellent cooperation. The author's title as a graduate
printing technology student appeared under her name.
This also insured neutrality of the survey.
15
3) Position or job description of the person being surveyed.
Someone familiar with the reasons for his company using
the estimating methods it uses was asked to answer the
questionnaire.
The second survey item type, items for census-type factual
data, was essential to the evaluation of the sample and the interpreta
tion of the results. "If this information is compared to the census or
other standard and recent data, the extent to which the sample is
9a cross-section of the total population may be
determined."
The number of returns from companies who use computer assisted
estimating is one kind of census-type factual data identified in
this study. In this study, the number of companies using computer
assisted estimating is compared to present statistics representing
CAE users.
How large the responding companies are in terms of employees
is also census-type factual data. Determining the size of each printing
company responding serves two purposes in this thesis. First of all,
it satisfies Objective 2 of this study, which is to discover the
relationship between the size of a printing company and its decision
concerning the use of CAE as a method of estimating. Secondly, knowing
the size distribution of the printing companies who responded to
the survey gives a basis for comparison to the total population of
commercial printing companies in the industry.
The third type of survey items included in the questionnaire
was questions on the subject matter of the survey. These questions
were developed by the author to meet the objectives listed in the

16
second chapter under "Objectives of theStudy" (see Appendix B for
sample questionnaire).
Question 1 of the survey asked where the company is located.
This question was asked for two reasons: first, to give the respondent
an easy question to make them feel at ease; secondly, so that the
population of respondents could be defined geographically.
Question 2 asked "What is your position in thecompany?"
As
long as the person who answered the survey is in a position to
understand the reasons for his company choosing to use the estimating
method it uses, then that person was considered an acceptable respondent.
Question 3 asked "What is the position of the person you report
to?"This question was asked so that if the respondent's title was not
recognized, then the person he reports to might clarify his position.
The questions following Question 3 on the survey were pertinent
in accomplishing the objectives of the study. Each question answered
was compared to one or more variables which were believed to be related
to one another. The following explanations are given in support of
the remaining questions asked on the subject matter of the survey.
Question 4, "What type of printing does your companydo?"
was asked in support of Objective 3, to discover the relationship
between the type of printing company responding and its decisions
regarding CAE. Since so many companies are beginning to specialize,
and a specialized company may require a customized estimating program,
then it was assumed these companies would be less apt to use packaged
CAE. Also, a company who has a need for a specialized program may
not be able to afford it, so the idea of using CAE is abandoned
altogether.
17
Lack of versatility in packaged CAE programs was expected to be
a major reason why specialized printing companies in particular have
decided not to use packaged CAE programs. A cross-tabulation program
comparing the type of printing company to the major influence on the
company's decision not to use CAE was run to test this assumption.
To further examine the relationship between the type of printing
company and a company's decisions concerning CAE, a breakdown program
was run breaking down the type of printing company, by the estimating
method used, by the disadvantages of CAE. This produced a table of CAE
users only, and was run to find differences in relationships between
packaged and customized systems in specialized and general printing
companies, by what they listed as disadvantages of their system.
Question 5, "Approximately how many employees are there in your
printing company?", was asked to reveal the size of a printing company.
The number of employees working for a company is an acceptable method
used to categorize the companies as small, medium or large. The
objective met with answers to this question is Objective 2 whether or
not size has an effect on a company's decision to use or not to use
CAE. A cross-tabulation program comparing company sizes to the esti
mating method used was run to meet the objective. A factor related to
the size of the printing company is the dollar amount of sales per
year. While an exact correlation may not be present between number of
employees and dollars of sales per year, it is reasonable to assume
that the more employees there are, the more dollars of sales per year
there will be. It is assumed then, that the medium to large printing
companies are more likely to afford CAE than the smaller companies.

A cross-tabulation program was run between the size of the
printing companies and the dollar amount they would pay for: 1) a
micro- or mini-computer dedicated solely to the task of estimating,
and 2) computer assisted estimating as part of a complete management
information system.
Question 6 asked "Which estimating method does your company
use?"
The answers from this question supply data to meet both Objec
tives 1 and 5. First, it yields the percentage of CAE users within
the given population. The choices allow CAE to be broken into two
categories: 1) packaged CAE systems, and 2) customized CAE systems,
or CAE users and non-users.
Objective 5, to find the relationship between the data base
of a company and its decisions concerning CAE, uses Questions 6 and 7
to see if those companies using CAE actually have defined hourly
rates and representative production standards.
Two breakdown programs were used in analysis of Questions 6
and 7. Those companies using CAE were broken down by estimating method
used, by production standards, and by data base development (Questions 6,
7, and 15).
The program run on respondents data who did not use CAE was
a breakdown by the estimating method used, by production standards,
and by the major influence on their decision not to use CAE. This
test was run to reveal the nature of thecompanies'
data base, who
listed "no database"
as the major influence not to use CAE.
Question 8 begins the section of the questionnaire on printing
companies who have made the decision not to use CAE. Question 8 asked
"Has your company ever used computers in production or management?"
19
This was asked to see what effect experience with a computer had
on a company's decision not to use CAE. A cross-tabulation program
comparing computer usage to reasons for not using CAE was run.
Question 9, "Where have you heard of CAE?", and Question 10,
"How seriously have you considered using CAE?", were both asked to
see if a company's knowledge of CAE had an effect on its decision
not to use CAE (Objective 4). The cross-tabulations run for analysis
of these questions were: 1) where the person heard of CAE to how
seriously he considered using it, 2) where the person heard of CAE
to the major influence on his decision not to use it, and 3) how
seriously the company considered using CAE to the influence on its
decision not to use it.
The breakdown program run was where a company had heard of
CAE, by how seriously it considered using CAE, by the major influence
on its decision not to use it.
Question 11, "Rank the following items in the order of their
influence in your decision not to use CAE, using number 1 as the
mostimportant,"
was used in cross-tabulation and breakdown programs
with all questions asked of the non-users.
Questions 12 and 13 were already explained in explanation
of Question 5.
The section of the questionnaire designed for printing companies
who presently use CAE began after Question 13. Question 14 read,
"How long has your company been usingCAE?"
This question was asked
to see if the length of a company's use of CAE has an effect on the
degree to which a company is satisfied. This question was also asked

20
so that future CAE acceptance might be predicted. The lengths of
time were broken into the following categories:
1 year or less
2-3 years
4-8 years
over 8 years
These values were cross-tabulated with the degree to which a company
was satisfied.
Question 15 asked if new standards were developed for the
data base of the CAE system. This question was asked in support of
Objective 5 to find out what effect the use of specifically developed
hourly rates and production standards might have had on the company's
decisions concerning CAE. As mentioned before, this question was
used in a breakdown program with "estimating methodsused"
and "produc
tion standardsdeveloped."
Also, a cross-tabulation program was run
between Questions 15 and 16 on data base development and degree of
satisfaction. Another breakdown program was run between Questions 15,
16 and 17 data base development, by the degree of satisfaction,
by the major disadvantage of CAE.
Results and Findings
The number of survey returns received within two months after
the mailing was 340. Out of those returned, 92 percent of these was
used in data analysis, 5 percent was unable to answer the questionnaire
as they were not printing companies, and 1.5 percent was not deliverable
as addressed. The percentage of those answering each question was
figured using the SPSS Subprogram Frequencies.
21
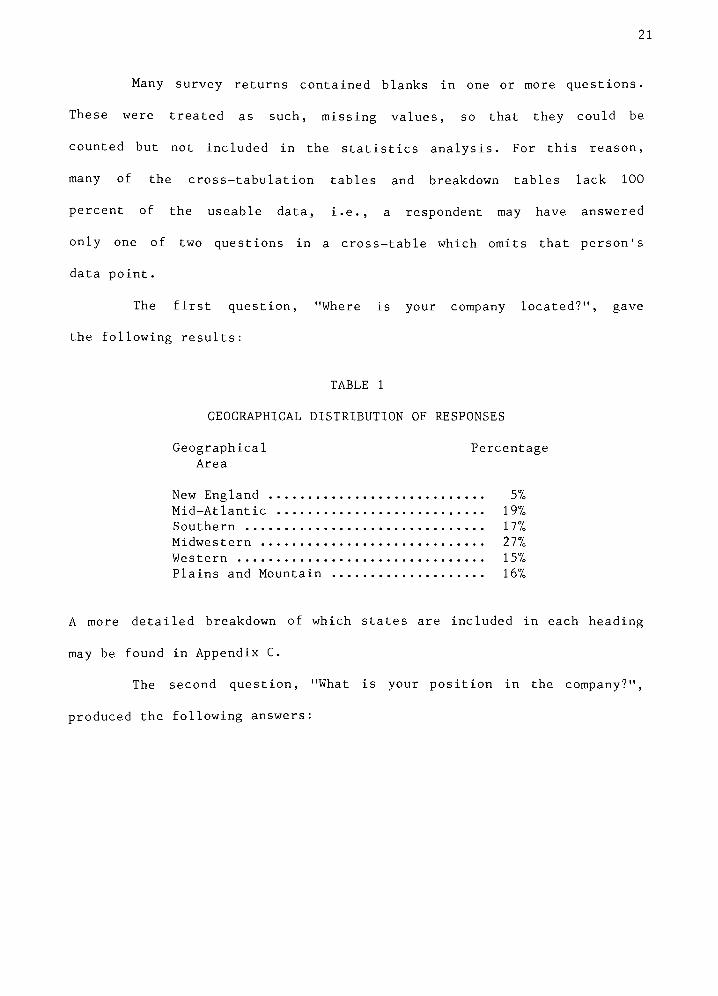
Many survey returns contained blanks in one or more questions.
These were treated as such, missing values, so that they could be
counted but not included in the statistics analysis. For this reason,
many of the cross-tabulation tables and breakdown tables lack 100
percent of the useable data, i.e., a respondent may have answered
only one of two questions in a cross-table which omits that person's
data point.
The first question, "Where is your company located?", gave
the following results:
TABLE 1
GEOGRAPHICAL DISTRIBUTION OF RESPONSES
Geographical Percentage
Area
New England 5%
Mid-Atlantic 19%
Southern 17%
Midwestern 27%
Western 15%
Plains and Mountain 16%
A more detailed breakdown of which states are included in each heading
may be found in Appendix C.
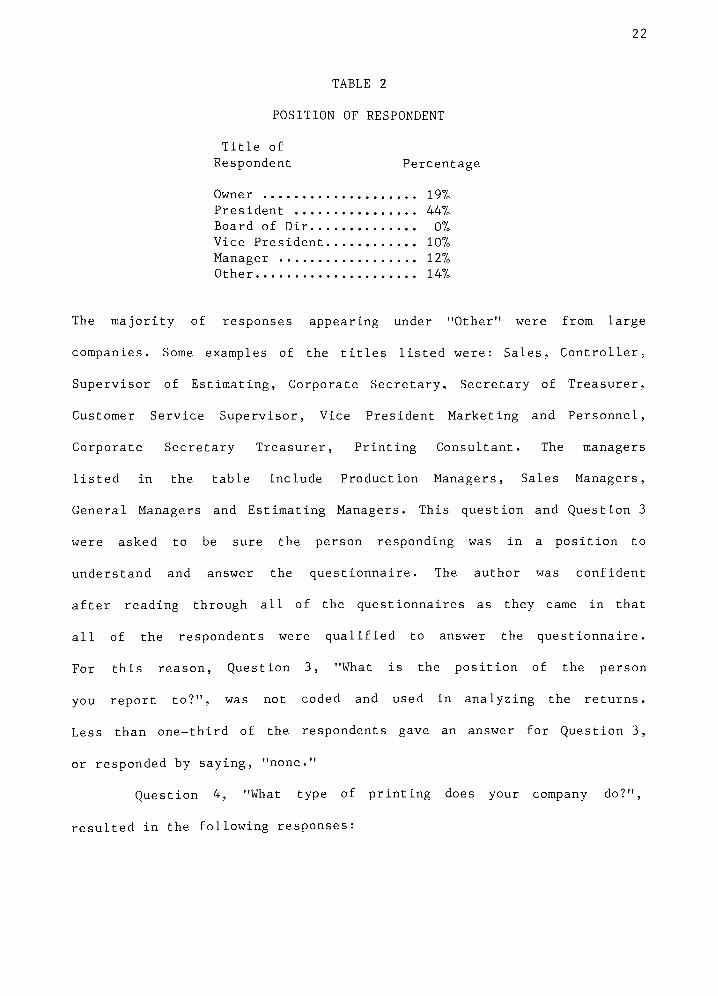
The second question, "What is your position in the company?",
produced the following answers:
22
TABLE 2
POSITION OF RESPONDENT
Title of
Respondent Percentage
Owner 19%
President 44%
Board of Dir 0%
Vice President 10%
Manager 127o
Other 14%
The majority of responses appearing under"Other"
were from large
companies. Some examples of the titles listed were: Sales, Controller;
Supervisor of Estimating, Corporate Secretary, Secretary of Treasurer,
Customer Service Supervisor, Vice President Marketing and Personnel,
Corporate Secretary Treasurer, Printing Consultant. The managers
listed in the table include Production Managers, Sales Managers,
General Managers and Estimating Managers. This question and Question 3
were asked to be sure the person responding was in a position to
understand and answer the questionnaire. The author was confident
after reading through all of the questionnaires as they came in that
all of the respondents were qualified to answer the questionnaire.
For this reason, Question 3, "What is the position of the person
you report to?", was not coded and used in analyzing the returns.
Less than one-third of the respondents gave an answer for Question 3,
or responded by saying,"none."
Question 4, "What type of printing does your company do?",
resulted in the following responses:
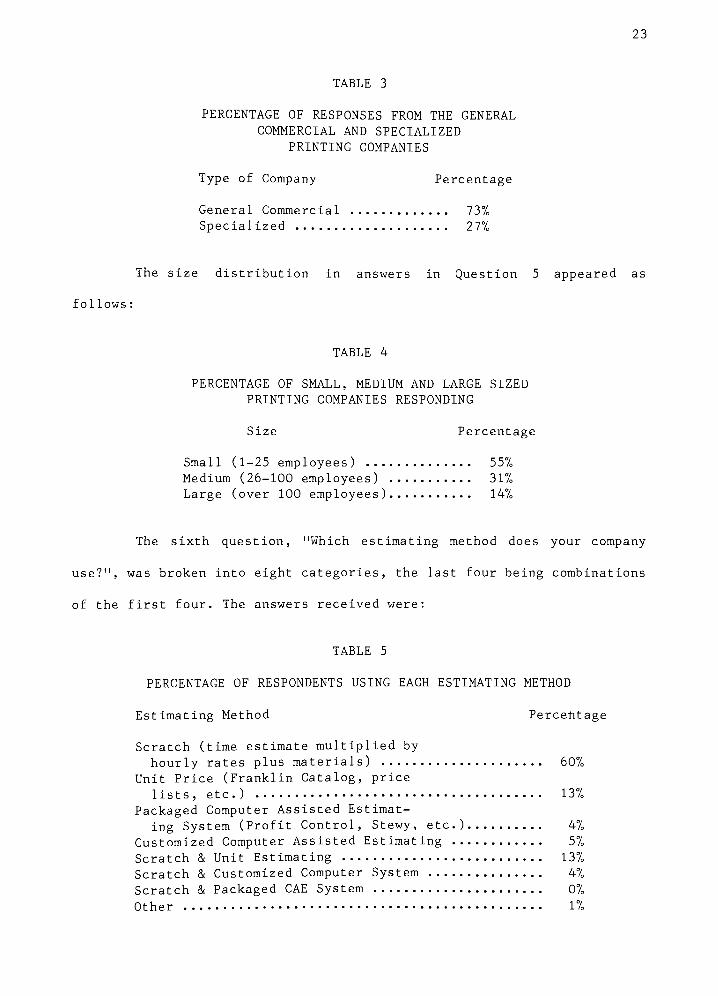
23
TABLE 3
PERCENTAGE OF RESPONSES FROM THE GENERAL
COMMERCIAL AND SPECIALIZED
PRINTING COMPANIES
Type of Company Percentage
General Commercial 737,
Specialized 27%
The size distribution in answers in Question 5 appeared as
follows :
TABLE 4
PERCENTAGE OF SMALL, MEDIUM AND LARGE SIZED
PRINTING COMPANIES RESPONDING
Size Percentage
Small (1-25 employees) 557,
Medium (26-100 employees) 317o
Large (over 100 employees) 147.
The sixth question, "Which estimating method does your company
use?", was broken into eight categories, the last four being combinations
of the first four. The answers received were:
TABLE 5
PERCENTAGE OF RESPONDENTS USING EACH ESTIMATING METHOD
Estimating Method Percentage
Scratch (time estimate multiplied by
hourly rates plus materials) 607.
Unit Price (Franklin Catalog, price
lists, etc.) 137.
Packaged Computer Assisted Estimat
ing System (Profit Control, Stewy, etc.) 47,
Customized Computer Assisted Estimating 57,
Scratch & Unit Estimating 13%
Scratch & Customized Computer System 4%
Scratch & Packaged CAE System 0%
Other 1%
24
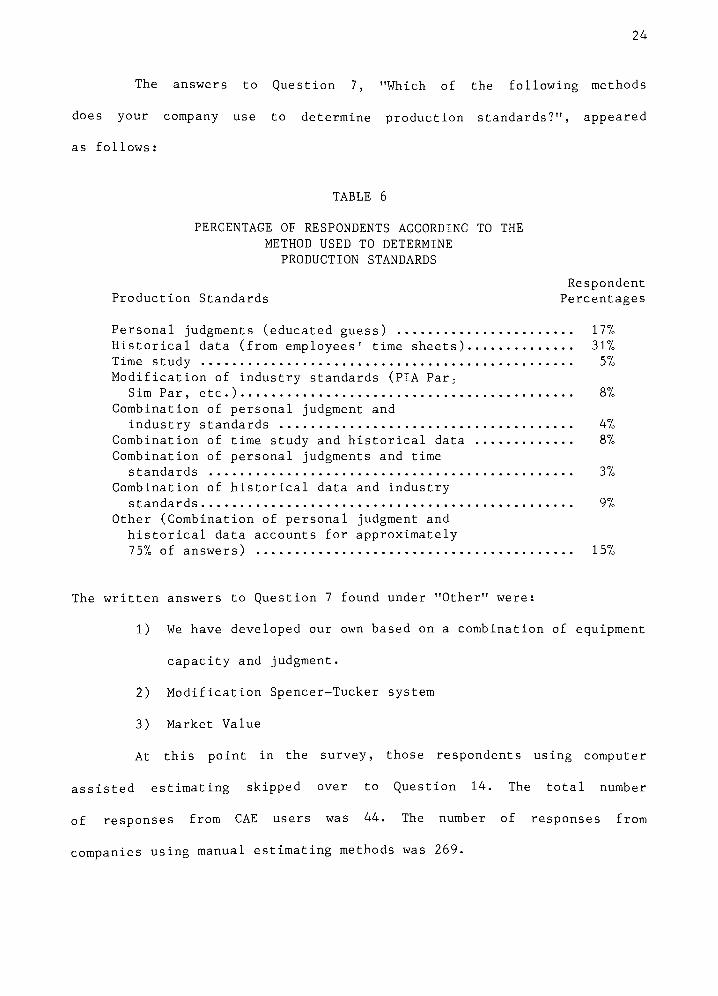
The answers to Question 7, "Which of the following methods
does your company use to determine production standards?", appeared
as follows:
TABLE 6
PERCENTAGE OF RESPONDENTS ACCORDING TO THE
METHOD USED TO DETERMINE
PRODUCTION STANDARDS
Respondent
Production Standards Percentages
Personal judgments (educated guess) 177,
Historical data (from employees'
time sheets) 317,
Time study 57,
Modification of industry standards (PIA Par;
Sim Par, etc.) 8%
Combination of personal judgment and
industry standards 47,
Combination of time study and historical data 87,
Combination of personal judgments and time
standards 3%
Combination of historical data and industry
standards 9%
Other (Combination of personal judgment and
historical data accounts for approximately
757, of answers) 157,
The written answers to Question 7 found under"Other"
were:
1) We have developed our own based on a combination of equipment
capacity and judgment.
2) Modification Spencer-Tucker system
3) Market Value
At this point in the survey, those respondents using computer
assisted estimating skipped over to Question 14. The total number
of responses from CAE users was 44. The number of responses from
companies using manual estimating methods was 269.

25
The answers to Question 8, "Has your company ever used computers
in production or management?", were:
TABLE 7
PERCENTAGE OF MANUAL ESTIMATORS HAVING USED
COMPUTERS IN PRODUCTION OR MANAGEMENT
Computer Usage Percentage
Yes 31%
No 69%
Question 9, "Where have you heard of CAE?", was answered
as follows:
TABLE 8
PERCENTAGES OF COMPANIES ACCORDING TO WHERE
THE COMPANY HAS HEARD OF CAE
Respondents
Where CAE was Heard of Percentages
Trade journals 307,
Trade shows 6%
CAE salesman 5%
CAE literature 8%
Trade shows and journals 207,
CAE salesman and literature 07,
Three of the above answers 157,
Four of the above answers 16%
Question 10, "How seriously have you considered using CAE?",
produced the following results:

26
TABLE 9
PERCENTAGES OF HOW SERIOUSLY RESPONDENTS
HAVE CONSIDERED USING CAE
Respondents
How Seriously Considered Percentages
Have not considered using it at all 247,
Just "thought aboutit"
24%
Gathered information on specific
systems 11%
Watched a demonstration 67,
Compared advantages and disadvantages
against present system of estimating 237,
Once tried CAE then went back to
previously used method 47,
Gathered information and watched
demonstrations 87,
The written comments from Question 10 were:
1) Once used Stewy
2) This company specialized in book manufacturing: very
little estimating.
3) We have tried an in-house system and it does not work
properly: definitely want a CAE system for pricing estimating.
Question 11 on the survey read, "Rank the following items in
the order of their influence on your decision not to use CAE, using
number 1 as the mostimportant."
The results of this item were coded
differently than implied. The author decided, after reviewing all of
the returns, that only one data point should represent the answers
rather than coding for ranked data. The reasons for coding the data
this way are:
1) Very few respondents actually ranked their answers most
respondents checked only one answer.

27
2) The author did not feel answers ranked less than first
were necessary in reaching the objectives stated in the
thesis proposal.
The distribution of answers to this question appeared as
follows :
TABLE 10
PERCENTAGE OF RESPONDENTS ACCORDING TO THE MAJOR
INFLUENCE ON THEIR DECISION NOT TO USE CAE
Respondents
Major Influence on Decision Percentages
Customized system costs too much 297,
Packaged systems cost too much 97,
Packaged systems too general 217,
No data base 7%
Don't understand computers 37,
Don't understand CAE 5%
Plan to install 6%
Too small 5%
Other 15%
The written answers to"Other"
in Question 11 are listed in Appendix D.
Questions 12 and 13 were questions regarding the price at
which a firm might consider using:
1) A micro- or mini-computer dedicated solely to computer
assisted estimating.
2) Computer assisted estimating as part of a management
information system.
The answers to these questions were as follows:
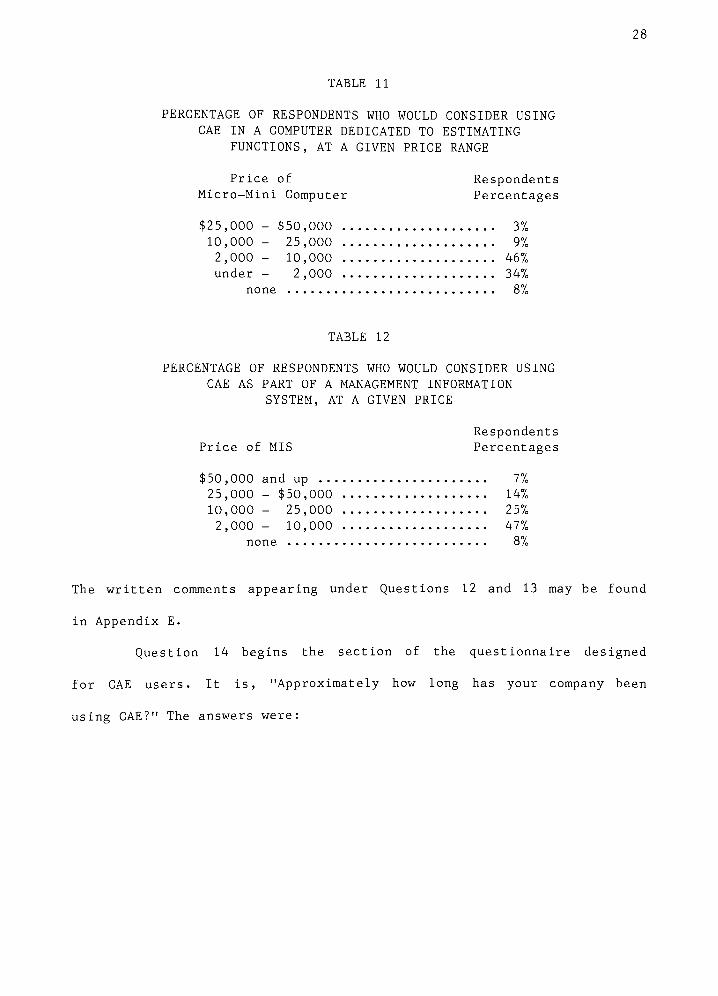
28
TABLE 11
PERCENTAGE OF RESPONDENTS WHO WOULD CONSIDER USING
CAE IN A COMPUTER DEDICATED TO ESTIMATING
FUNCTIONS, AT A GIVEN PRICE RANGE
Price of Respondents
Micro-Mini Computer Percentages
$25,000 - $50,000 3%
10,000- 25,000 9%
2,000 - 10,000 46%
under - 2,000 34%
none 87,
TABLE 12
PERCENTAGE OF RESPONDENTS WHO WOULD CONSIDER USING
CAE AS PART OF A MANAGEMENT INFORMATION
SYSTEM, AT A GIVEN PRICE
Respondents
Price of MIS Percentages
$50,000 and up 7%
25,000 - $50,000 14%
10,000 - 25,000 25%
2,000- 10,000 47%
none 87,
The written comments appearing under Questions 12 and 13 may be found
in Appendix E.
Question 14 begins the section of the questionnaire designed
for CAE users. It is, "Approximately how long has your company been
usingCAE?"
The answers were:
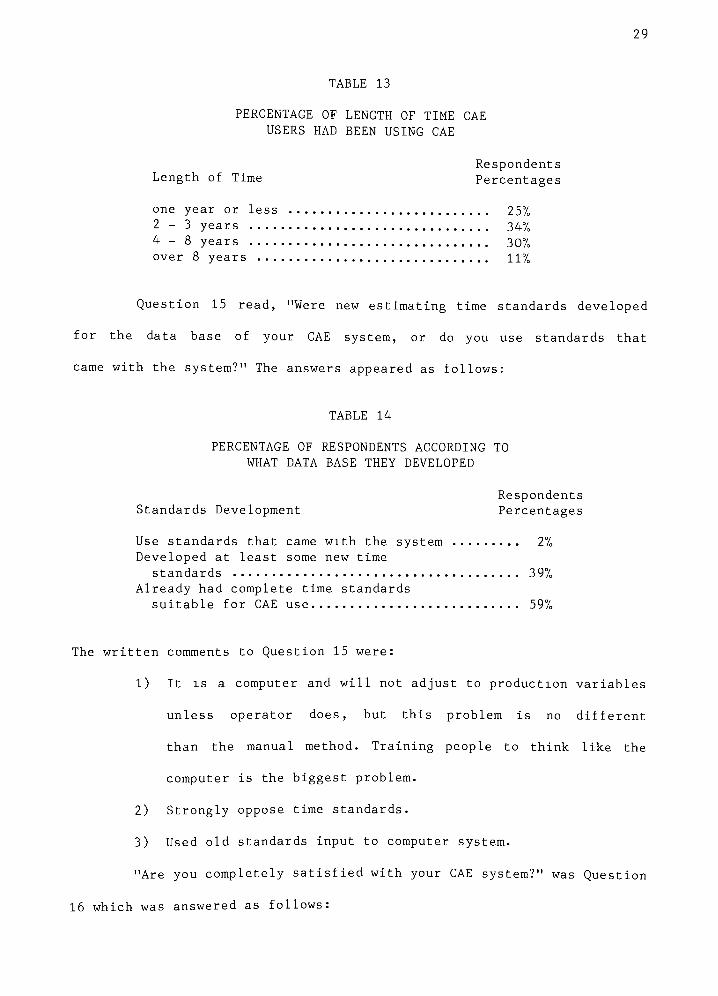
29
TABLE 13
PERCENTAGE OF LENGTH OF TIME CAE
USERS HAD BEEN USING CAE
Respondents
Length of Time Percentages
one year or less 257,
2-3 years 34%
4-8 years 30%
over 8 years 11%
Question 15 read, "Were new estimating time standards developed
for the data base of your CAE system, or do you use standards that
came with thesystem?"
The answers appeared as follows:
TABLE 14
PERCENTAGE OF RESPONDENTS ACCORDING TO
WHAT DATA BASE THEY DEVELOPED
Respondents
Standards Development Percentages
Use standards that came with the system 27,
Developed at least some new time
standards 39%
Already had complete time standards
suitable for CAE use 59%
The written comments to Question 15 were:
1) It is a computer and will not adjust to production variables
unless operator does, but this problem is no different
than the manual method. Training people to think like the
computer is the biggest problem.
2) Strongly oppose time standards.
3) Used old standards input to computer system.
"Are you completely satisfied with your CAE system?"
was Question
16 which was answered as follows:
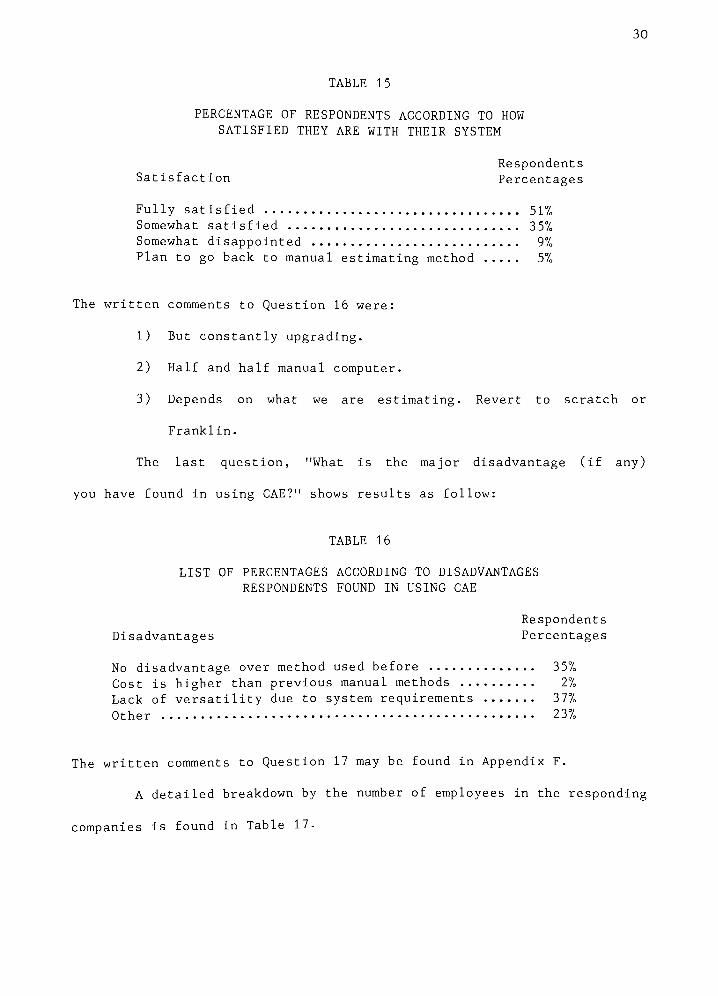
30
TABLE 15
PERCENTAGE OF RESPONDENTS ACCORDING TO HOW
SATISFIED THEY ARE WITH THEIR SYSTEM
Respondents
Satisfaction Percentages
Fully satisfied 51%
Somewhat satisfied 35%
Somewhat disappointed 97,
Plan to go back to manual estimating method 57,
The written comments to Question 16 were:
1) But constantly upgrading.
2) Half and half manual computer.
3) Depends on what we are estimating. Revert to scratch or
Franklin.
The last question, "What is the major disadvantage (if any)
you have found in usingCAE?"
shows results as follow:
TABLE 16
LIST OF PERCENTAGES ACCORDING TO DISADVANTAGES
RESPONDENTS FOUND IN USING CAE
Respondents
Disadvantages Percentages
No disadvantage over method used before 357,
Cost is higher than previous manual methods 27,
Lack of versatility due to system requirements 377,
Other 23%
The written comments to Question 17 may be found in Appendix F.
A detailed breakdown by the number of employees in the responding
companies is found in Table 17-

31
TABLE 17
DETAILED BREAKDOWN IN NUMBER OF EMPLOYEES
IN RESPONDING COMPANIES
Respondents
Number of Employees Percentages
1 - 10 employees 31%
11 - 25 employees 257,
26 - 50 employees 177,
51 - 80 employees 9%
81 - 110 employees 7%
111 - 150 employees 37,
151 - 200 employees 1%
201 - 500 employees 5%
over 500 employees 27,
As mentioned in the methodology, certain statistical tests
of cross-tabulation and variable breakdown were run in order to meet
the objectives of this study. These tests appear in the texts according
to the objectives they represent.
The degree of CAE acceptance
Question 6 of the survey reveals the number of CAE users. Users
were broken into two categories, depending on the types of systems
they used. Those categories and the percentage of respondents in each,
are summarized in Table 18.
TABLE 18
PERCENTAGE OF CAE RESPONDENTS USING
CUSTOMIZED AND PACKAGED PROGRAMS
Customized Number of Total Survey Percentage of
CAE System Responses Responses Total CAE Users
Percentage of
Number of Total Survey
Responses Responses
13 4.2%
27 8.7%
40 12.9%
Packaged CAE system 13 4.2% 32.5%
Customized CAE system 27 8.7% 67.5%
Total 4 12.9% 100.0%
32
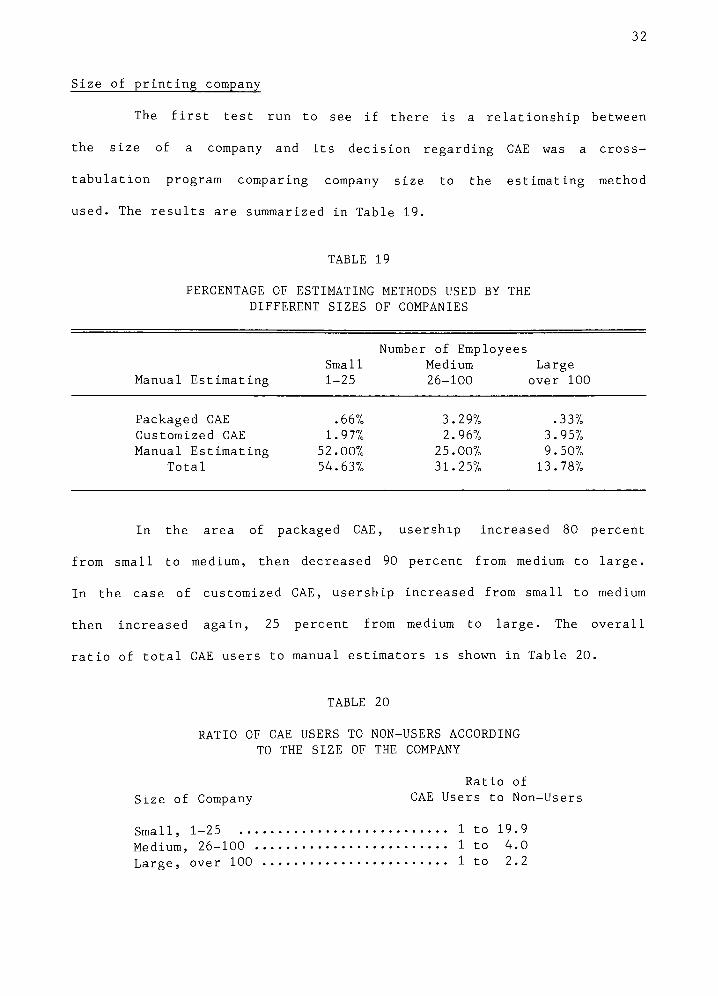
Size of printing company
The first test run to see if there is a relationship between
the size of a company and its decision regarding CAE was across-
tabulation program comparing company size to the estimating method
used. The results are summarized in Table 19.
TABLE 19
PERCENTAGE OF ESTIMATING METHODS USED BY THE
DIFFERENT SIZES OF COMPANIES
Manual Estimating
Number of Employees
Small Medium Large
1-25 26-100 over 100
Packaged CAE .66% 3.29% .33%
Customized CAE 1.97% 2.96% 3.95%
Manual Estimating 52.00% 25.00% 9 . 50%
Total 54.63% 31.25% 13.78%
In the area of packaged CAE, usership increased 80 percent
from small to medium, then decreased 90 percent from medium to large.
In the case of customized CAE, usership increased from small to medium
then increased again, 25 percent from medium to large. The overall
ratio of total CAE users to manual estimators is shown in Table 20.
TABLE 20
RATIO OF CAE USERS TO NON-USERS ACCORDING
TO THE SIZE OF THE COMPANY
Ratio of
Size of Company CAE Users to Non-Users
Small, 1-25 1 to 19.9
Medium, 26-100 1 to 4.0
Large, over 100 1 to 2.2

33
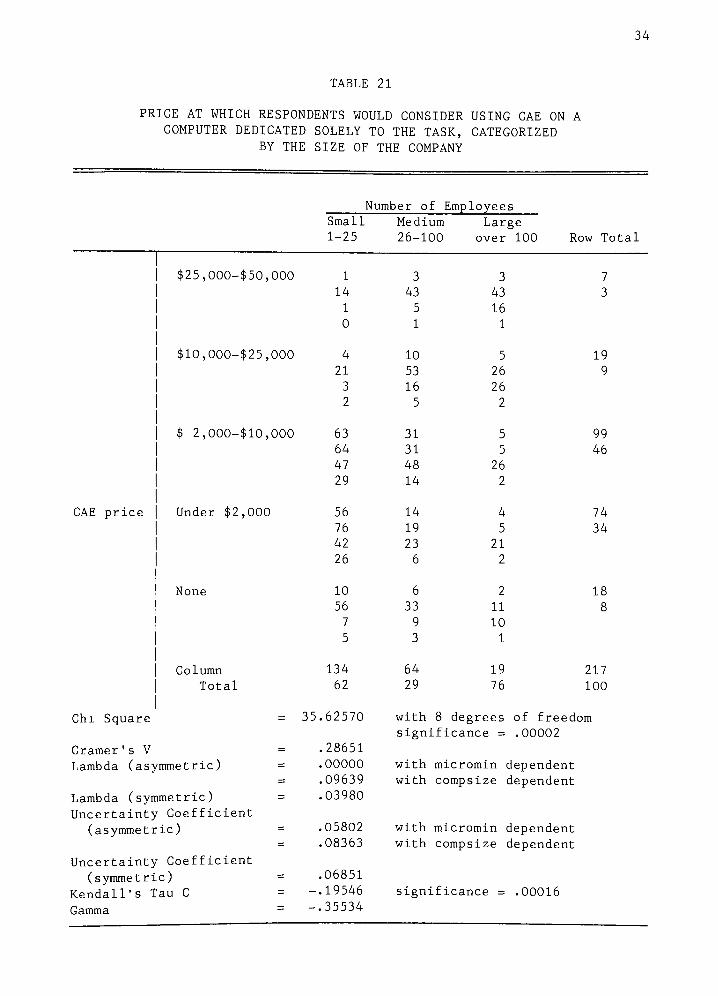
Cross-tabulation tables were also run between size and the
price they would consider using CAE as a computer dedication solely
to the task of estimating, or as part of a total management information
system. The results appear in Tables 21 and 22.
34
TABLE 21
PRICE AT WHICH RESPONDENTS WOULD CONSIDER USING CAE ON A
COMPUTER DEDICATED SOLELY TO THE TASK, CATEGORIZED
BY THE SIZE OF THE COMPANY
Number o f Emp loyees
Small Medium Large
1-25 26-100 over 100 Row Total
j $25,000-$50, 000 1 3 3 7
14 43 43 3
1 5 16
0 1 1
| $10,000-$25, 000 4 10 5 19
21 53 26 9
3 16 26
2 5 2
j $ 2,000-$10, 000 63 31 5 99
64 31 5 46
47 48 26
29 14 2
CAE price | Under $2,OOC 56 14 4 74
76 19 5 34
42 23 21
26 6 2
| None 10 6 2 18
56 33 11 8
7 9 10
5 3 1
| Column 134 64 19 217
j Total 62 29 76 100
Chi Square = 35.62570 with 8 degrees of freedom
significance =.00002
Cramer's V = .28651
Lambda (asymmetric) = .00000 with micromin dependent
= .09639 with compsize dependent
Lambda (symmetric) = .03980
Uncertainty Coefficient
(asymmetric) = .05802 with micromin dependent
= .08363 with comp size dependent
Uncertainty Coefficient
(symmetric) = .06851
Kendall's Tau C = -.19546 significance =.00016
Gamma= -.35534

35
TABLE 22
PRICE AT WHICH RESPONDENTS WOULD CONSIDER USING CAE AS A
PART OF A MANAGEMENT INFORMATION SYSTEM,
CATEGORIZED BY THE SIZE OF THE COMPANY
Count
Row Percent
Column Percent
Total Percent
Number of Employees
Small
1-25
Medium
26-100
Large
over 100 Row Total
$50,000 and up 1 6 4 11
9 55 36 6
1 10 24
1 3 2
$25,000-$50,000 7 17 3 27
26 63 11 14
6 28 18
4 9 2
$10,000-$20,000 29 17 3 49
59 35 6 25
MIS with
CAE price
25
15
28
9
18
2
$ 2,000-$10,000 69 17 6 92
75 18 7 47
59 28 35
35 9 3
None 11 4 1 16
69 25 6 8
9 7 6
6 2 1
Column 117 61 17 195
Total 60 31 9 100
Chi Square = 40 .22746
Cramer's V = .32117
Lambda (asymmetric) = .00000
.19231
Lambda (symmetric) = .08287
Uncertainty Coefficient
(asymmetric)= .07327
.11144
Kendall's Tau C = -
.28047
.48538
with 8 degrees of freedom
significance = .00002
with MIS dependent
with compsize dependent
with MIS dependent
with compsize dependent
significance =.00000

36
Of the respondents presently using CAE, only one person listed
cost as a disadvantage of using CAE. That person represented a small
printing company who used a combination of packaged-customized CAE,
and although the cost was a disadvantage, the person was "somewhat
satisfied"
with the system, which indicates the disadvantage was not
severe .
An interpretation of the statistics found in subprogram cross-
tabs is offered at this point as an example of how the reader may
evaluate the data. This example along with the explanation of the same
statistics in the background theory should clarify the meaning of these
tests for the reader.
Chi square in Tables 21 and 22 show there is a systematic rela
tionship between the variables, i.e., they are not statistically
independent. In the case of Table 21, the chance of being wrong about
thevariables'
systematic relationship is two times out of 10,000.
We conclude then, that Chi square is statistically significant at the
.0002 level. Chi square in Table 22 is even more statistically signifi
cant, at a level of .00001 or less.
Cramer's V in Tables 21 and 22 indicates a degree of association
still exists after adjusting for the degree of freedom in Chi square,
but without revealing the manner in which the variables are associated.
The values .2865 and .32117 indicate an association exists since those
numbers are greater than zero.
Asymmetric Lambda, in Tables 21 and 22, shows that knowing
the price a company would consider using either type of system, does
not increase our ability to predict the size of the companies. However,
with the size of the company being the dependent variable, our chances
37
of predicting the price they would consider a system increases 9.6
percent in Table 21 and 19.2 percent in Table 22.
By knowing the company size in Tables 21 and 22, uncertainty
about the prices companies would consider CAE is reduced 5.8 percent
and 8.8 percent, respectively, as found in the asymmetric uncertainty
coefficient with price dependent. Once the price of consideration is
known, the uncertainty about the size of the company is reduced 8.4
percent in Table 21 and 11 percent in Table 22. The overall reduction
of uncertainty without either variable being dependent (symmetric
uncertainty coefficient) is 6.9 percent in Table 21 and 8.8 percent
in Table 22.
Kendall's Tau C in Table 21 shows that 19.5 percent of the
pairs of answers fall along the major diagonal of ordering. In Table 22,
28.9 percent of the cases fell along the major diagonal. This indicates
the pairs of answers are ordered in the same direction on both variables,
i.e., there is a positive association that percent of the time. (Note
that the ordering of Questions 12 and 13 was from the high price [Num
ber 1 answer] down to the low price. The company sizes, in contrast,
were ordered from small to large in Question 5. This caused the program
to find a negative association which the author reversed, since the
variables were in opposite ordering.)
Gamma, after adjusting for"ties"
in Kendall's Tau C, was 35.5
percent in Table 21 and 48.5 percent in Table 22, which indicates there
is a fairly strong relationship between the variables in both cases.
Finally, the cross-tabulation table, "Company Size by Influence
on Decision Not to UseCAE,"
was run to see the size distribution for
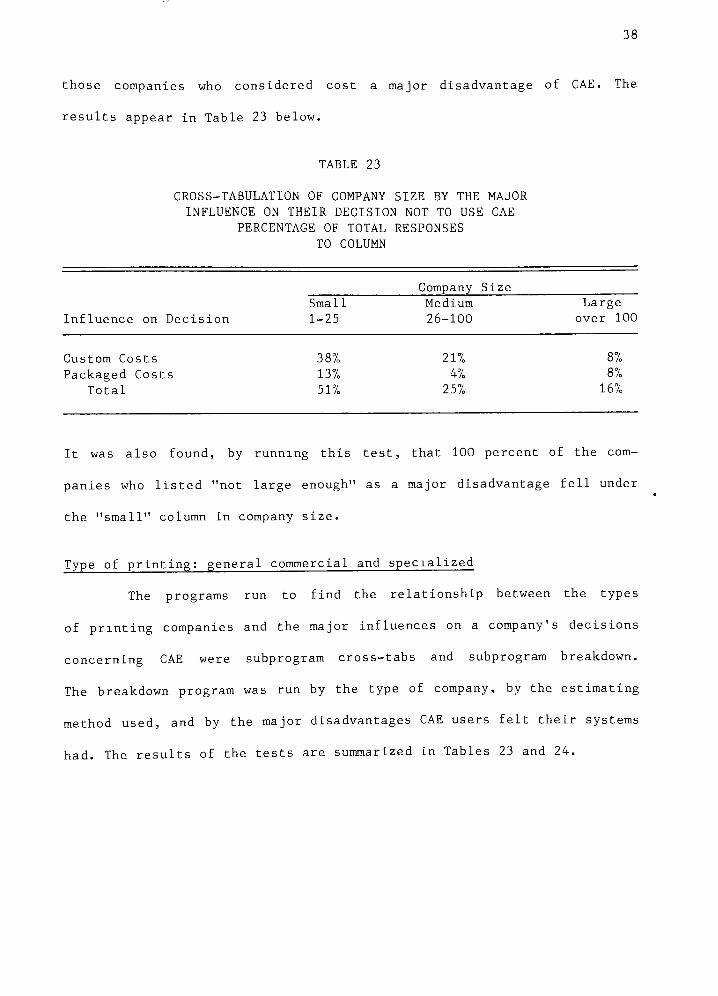
38
those companies who considered cost a major disadvantage of CAE. The
results appear in Table 23 below.
TABLE 23
CROSS-TABULATION OF COMPANY SIZE BY THE MAJOR
INFLUENCE ON THEIR DECISION NOT TO USE CAE
PERCENTAGE OF TOTAL RESPONSES
TO COLUMN
Influence on Decision
Small
1-25
Company Size
Medium
26-100
Large
over 100
Custom Costs
Packaged Costs
Total
38%
13%
51%
21%
4%
25%
8%
8%
16%
It was also found, by running this test, that 100 percent of the com
panies who listed "not largeenough"
as a major disadvantage fell under
the"small"
column in company size.
Type of printing: general commercial and specialized
The programs run to find the relationship between the types
of printing companies and the major influences on a company's decisions
concerning CAE were subprogram cross-tabs and subprogram breakdown.
The breakdown program was run by the type of company, by the estimating
method used, and by the major disadvantages CAE users felt their systems
had. The results of the tests are summarized in Tables 23 and 24.

39
cn lo csi<t-
CNJ CO CO i-i
o , I
1= +->
3 W
it in h ct><j-
m
CU "O <L> "O
* I CO LT) LO cnj co m *
<u "O <v ""o
CD CO tO CNl rH OJ O
li.Q
co r^ o o to * i i
i to o CD o -h cm
lo r^ o o r- or-. to o o cm o *
r* * < o o o cd o
CD CO CD-d-
s
2 II
-j-
to l c\j
o o: ui-
^ueduioj Bui^uiJd jo sdAi

40
As expected, the major influences chosen were "customcosts"
and packaged systems "too general."
Combined, these account for over 50
percent of the answers given as a major influence of the specialized
printing companies.
The breakdown program run on the data from companies who use
CAE and listed "versatility"as a major disadvantage is found below in
Table 25.
TABLE 25
CROSS-TABULATION OF CAE USERS BY THE TYPE OF
PRINTING COMPANY THEY WORK FOR
Major General Commercial Specialized
Disadvantage Packaged CAE Custom CAE Packaged CAE Custom CAE
Versatility 27% 38% 100% 44%
Knowledge of CAE
In order to discover the relationship between knowledge of
CAE and reasons for not using CAE, the following cross-tabulation
programs were run:
1) Where the company heard of CAE, by how seriously it con
sidered using CAE;
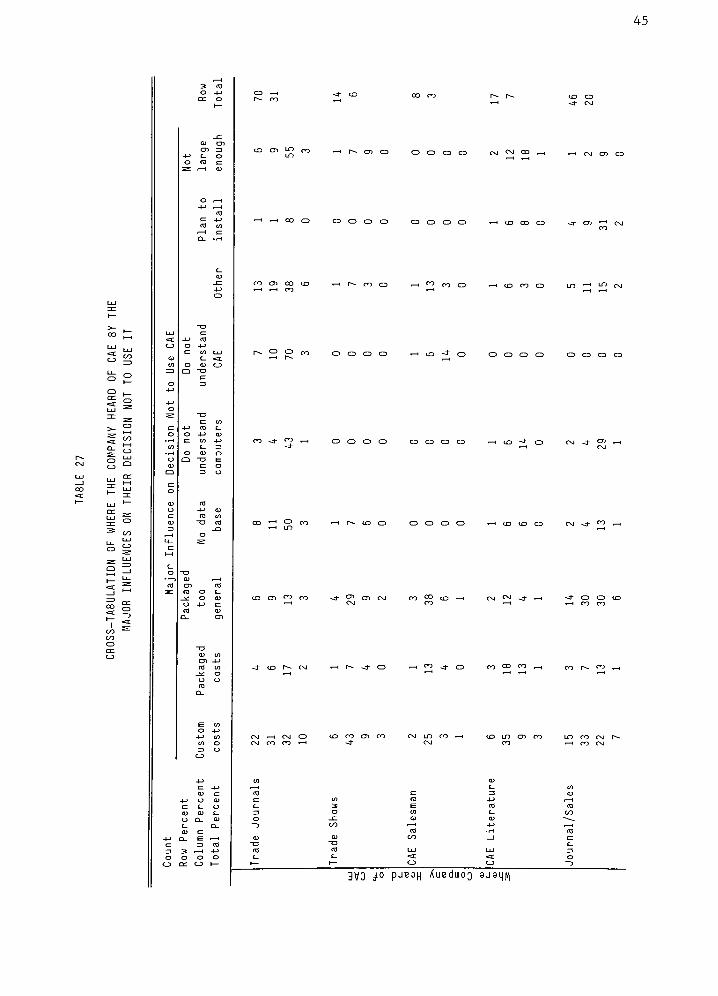
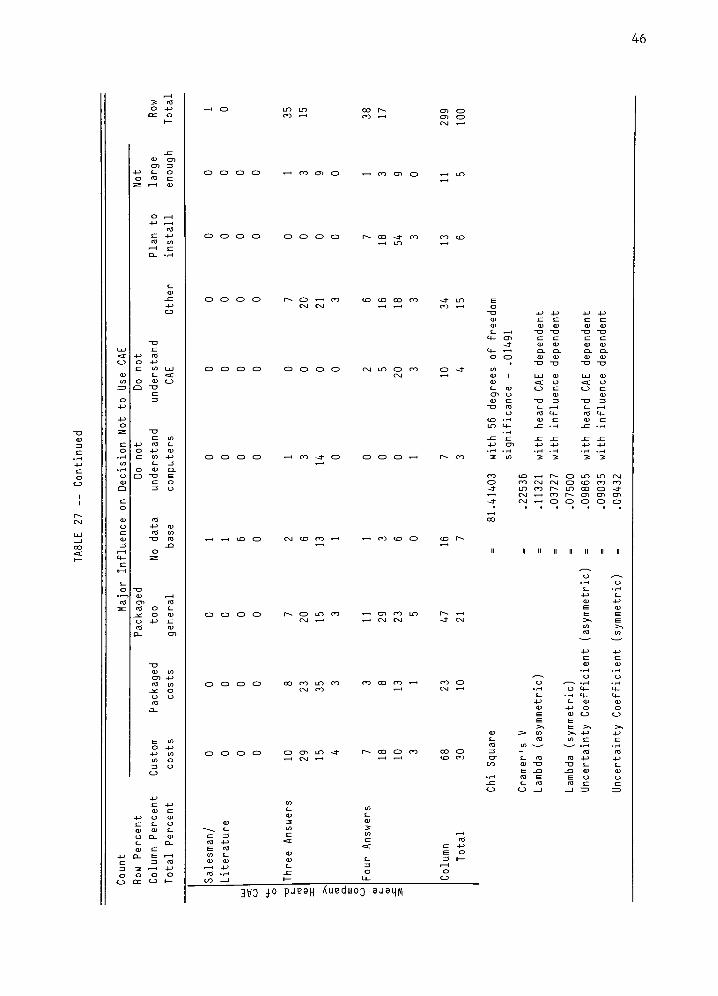
2) Where the company heard of CAE by the major influence on
its decision not to use CAE;
3) How seriously a company considered using CAE by the major
influence on its decision not to use CAE.
One breakdown program was run in support of this objective. It broke
down where a company heard of CAE by how seriously it considered using
CAE, by the major influence on its decision not to use CAE.

41
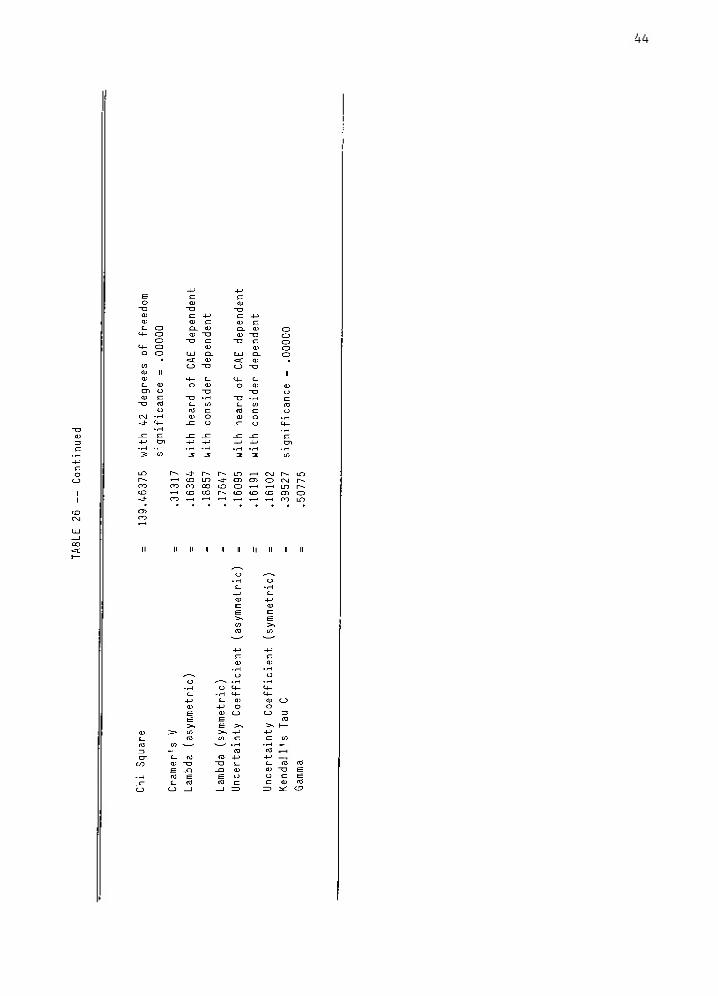
The results of the three cross-tabulations are found in Tables
26, 27 and 28, respectively, and details of the breakdown program appear
in Tables 29, 30, 31 and 32.

42
<U l*i> "O
CNJ CO I -H O O CD CD t-h t-h LO CD O CD CD O t-H CM LO O
* 4 i < I O * I t t i O * i * i t-h CD I to * i O O CD O O
CO CO i CO CD CD O CD t-h CM CD CD Ol to <
CD
CNJ
5: <=>
1 s
7Z CD
CO<j-
< < CO ^-1 t-H ^H* i t i r~*- cd o o o o
co ai
oi ro ro <f* i r*-
-d-
o t-H t-H.J-
CD csj t-h-d-
* i LD t-h CD CM
CD CO CNJ CO CO ID t-h LD CO CO CM
*\ t I CM CD-d-
CM CO CM t-h
CD CC CD

43
CD -,-i 3 "O
CD CC CD
en co co
CD CD CD CD
O CD O CD
O O CD O
O CD CD CD CO CO *-h t-H t-h co co r- cd
CD O O O LD-J-
CD CMJ-
O O ID CM
CD CD O O CD t CO t-h CO CO CM CD
CD CD CD CD t-h CO CM O CD O O O O
44
cm r^- CD
T-H CD LD-J"
CD CD O CM r^.
CO CO CO to CD , 1 t-H l-O r*-
t-H to CO r~~ CO CD CD CD oCO T-H *""' . i ^ T ' ^ CO LO
II II II II II II
45
CO CD LD CO * r*- CD CD o o o o rg (M co ^ t-H CM Ol CD
- < CO CD CD CD O CD CDOCDO i CO CO CD
r^ CO O < cr> CO O .-H CD CO CD lot-h in cm
CD O CD CD CD CD CD O CD CD CD CD
^ =!
co -Jr fy t-h CD CD CD O O CD O O CM-4- C"
t-h
CO*- CD co i OCDCDCD t-hcOCOO CM
-J- C1^t-H
CD
CD
CO Ol CO fr) 4 ^ O) w CO co CO t-H CM <>J~Hr t-h
-J"
CD CD tO
<t co r^ CM * i r^ < o *-h co .j-
0 ro co co ,_,
CD CO CD CO CMLDCOt-h COLDCDCO
CD en CD I
3V0 ^ Pje9H ^ueduiOQ ajaijM
46
OOOCD t I CO CD CD t-h CO CD CD
O r I
-M I
nJ to
O O CD CD O CD O O
O O CD CD CO CD CO CO
t-H ~0 "O
CD O O CD O O CD O CM LD CD CO
O O O O t-h CO-J-
CD O O O rH
t-h t-h CD CD CM CO CO t-h CO tO CD
CM t-h CD CD CD CD CD
II II II II
<D -->
O O CD O
CD CD CD CD CO OO CO t-h CO CD
O CJ-
rH q-
C_ <D
-u> o
<D CD
CD CD O CD r^ co CD co
to
u o: o i-
3\/3 jo pjean AueduiOQ sjaqM
47
CD tO LD < CM CO r^ t-h O CD CD CD t i r- to o
CD CD O CD CD O CD O <t r* t-h cm O O CD O
<* tO t-h CM CO CO CO t-h i r^ co o
-4- r-- co cm O CD O CD O CD CD O
CM - CD t-h <t to r-*. cm t-h-J-
-dr CD CD CD CD CD
CO r*- CO CM CO CM t I *
I-J-CDCD O O CD O
CO LO tO ' > I CO CM LD LO CM CD CMJ-
CD CO CM
CM CD t-h co co in co CM Ol Ol I
r^ t-h cd co CD CD CM
O CC CD I
3\/Q ButSfl p3J8pTSU0Q AuediuoQ A^snoTjag moh

48
O O CD CD O CD O O CD CD CD O
CD O CD CD CM t-H LO t-h
CM CM CO t-H CO CD CO .-H
CO t-H O
CM CO CD CD CD CD CD CD CD CD O
O CD CD O CD O CD O CD CD CD CD
CD to-4"
CM t i CO-4"
LD CD CD CM t-h CD CD CD CD
r- o-4- r^ -4- -d-
co CM CD CM CM CO CDCO CO
-4-
CO LD CM
<
. i
CM t-h i i-4~
t-H
CD CM t-H CD t-h CO CD
CM t-h
CD to CO
-H t-H
to
<t t-H ) T-H
t-H
CD
CD CD
O
c
CM
CO
"O
(D
CD CO
o
rH
-M
re
c
-p
CD CD
r-* cm
"O E r-\ "O o to
<D OJ i- OJ -M c: . 1
C_ 4-J -l-> I_ re o c re
rtl tO CD 3 E -4->
o_ >> <u _C <D 3 O
e to o -M t*5 "O 1 1
o c: re o
CD CD CD CD
3V3 6uts 1 P ajapisuoQ Aue dlUOQ <I SH0TJ8S M0H
<D 4->
49
The breakdown program described appears in Tables 29, 30, 31
and 32 in detail. Because the answers were broken down into such low
values, the author combined the following similar values of where a
company heard of CAE. They are:
1) Trade journals and/or trade shows
2) CAE salesman and/or CAE literature
3) Three of the above
4) All of the above items
The figures appearing in these tables represent the actual number of
responses rather than percentages.

50
co r^ co co co-4-
t-H t-H
co in cd co
co oi -o
CO
OOt-hCDCDCDtIticdco
> ICDOOOCD-iOCDCM
Q
gi
OO=
I-
I I I
=c >_
cc"
CO
ID ^
"So
QC3
?"
-=C"
O
^=)o
1-1Q E
~^ S ~
=> S 2cc
tJm
t iCDLOCOOCDCOt-HCDCM
-d-CMCMOOCDt-HCDOCD
LD CD CD CD CD * ICOCDCO
^ -S3
"o
=>
!!r1
5 <=
COo_
Si
cdcoldcocdldcocdcmcm
COCMOI CMCMCOCD
o
Q
.I o =c
re re .i
re -o -o
re re re
o o o o_

Q> CaS "O
51
CM CO LO t I , i t I CO CM CM IT)
OOt-hOCDOCDCDCDt-h
O CD O CD CD CD iCDCDt-h
CO-d-CMOCDOCMCMCDCO
<=XLI ) t
CD 1
rc S CD
CD i i
^ CO
CD ro ^
OT CD
ZIZ o l (
1 UJ CO
or 1 1
UJ LjJ CD
r o LU
CD 1 1 Q
CO
U_==
or
CD CD i i
CD LU
O :e
OT >- I
re <d -4->
CDCD-hCDCDOOOCDt-h
t i CD CD CD * lOOOCDCM
CO ^
rr> LU
o =d
r-H I
or u-
LU ^
CO t-H
CM CM -H t-h O O CD * i CO
COCMCDCDCDOCDO'-hCD
re re it
m ~a -o
Dl CT) -P -P 4J -M
CDO-Q-^QQCDCL.1
<D C*5 "D
52
re <d -u>
CD CO r- CM t-h
-4"
CM O CD CM CD
CM --4"
CM O CO CM
CD CM t-h CD O O CO
CO
CO
CO
CD
CD
I I
CO
"-1
" S "
Is>-
"=:
COCO
CD
LU
CJI
o
3
t I CM O CD t-h CD-d"
CM CM CD O t-h t-h to
t-h CD O O CD CD
CD
.I O
E Dl G) -P -P
o rt re re o
+j _^c _*: ~o cz
53
CO LU
CD
Q LU
CO ^
<D Ca!> "O
re (D 4J
, I O CD
COCM1iCMLntDCMP^
CM t-h CM CD O CD iCDCD
I CD CM O OlOO-d"
tO CD i CO LD O * *
CDOCDOOCDO*-!'-'
CDO' 0 CD1-4"
0 0 0 0 0*i O O *
re I
O ""O "O ZJ
qj qj re o
E CD CD +->-M
4->
u a. o.
O 4-> .I
Q O Cu
54
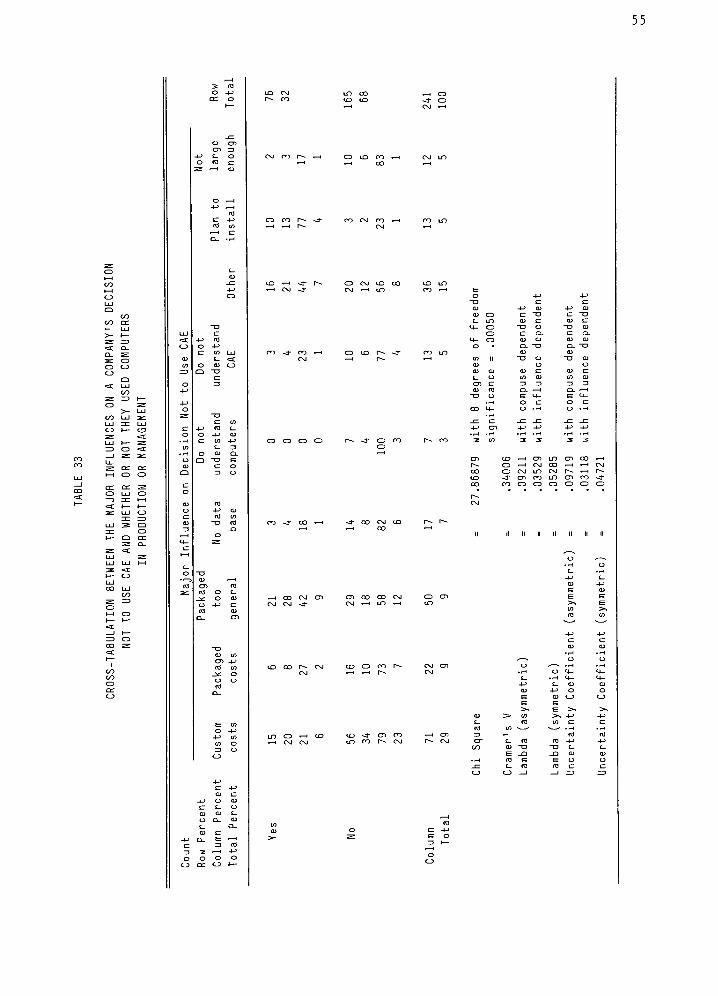
A cross-tabulation program was run between the major influence
on a company not to use CAE and whether or not they ever used computers
in production or management. The results of that comparison are found
in Table 33. This test was run to see if there is a relationship between
a company's experience with computers and what influenced its negative
decision concerning CAE.
55
O O <
o
o
i CD<t-
o
CM t-H
CM CO I t I O tO CO t-h
t-H CO
CO CM CO t-h
CD t-h-4"
t-H CNJ-d"
O O O O r-- -d-
CD co
CD or CDt
CO CM (O
CD t-h CD LD CD CO t-h
CD t-h CM CO t-h t-h CM
CD CM LO CM r^ t i r-
CD CO LD CD CO-d"
CO CD CD CD O O O
II II II II
CD CO r-^ CM to O co r^.
id co r^ CM
56
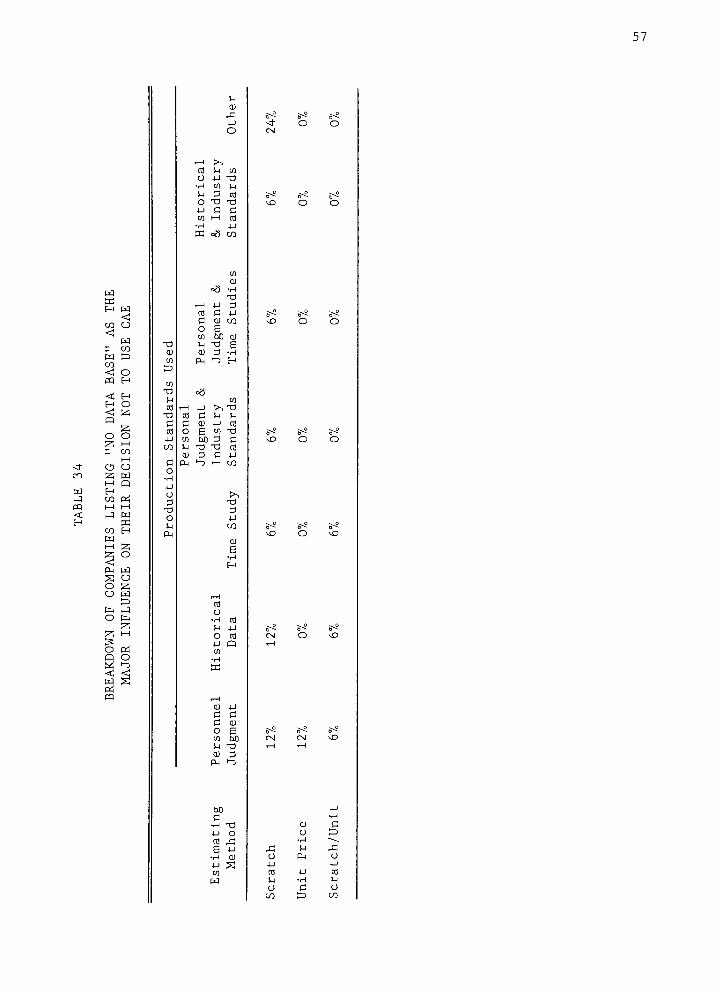
Data base
Objective 5 was to discover what relationship the use of
defined hourly rates and production standards had on a company's
decisions concerning CAE. There were four breakdown programs run. The
first breakdown was for companies who use manual estimating methods. It
broke down their estimating methods by the production standards they
use by data base development as the major influence on their decision
not to use CAE. The results of the breakdown are shown in Table 34.
57
W
PQ
<
<!co u
w
r co
O
H
H
O
z
zo
w
CO
<pq
<!H
<Q
O
zr coi i
o u
z wW Q
Hco rtM M
J W
co H
W
M Z
Z O
<!P-i w
o
o
z
o
Q
<w
Pd
pq
S3
V-4
0)
o
l-i en
-d
u
cd
rH cn
M 3 .
O X) 13
4-> C Ccn
H
ffi o3 co
Cti
cn
a)
=a H
X)
1 1 4J 3cd c 4J
S 0) CO
O 6cn oO 0)
n X) E0) 3 H
P-I >-o H
cS
cnr 1 4J >^x>
IX) c u u
c 01 jj cd
o E cn x)
cn oO 3 CM X) x) cd
01 3 C 4-1
PM |-> I S
CO
o-I cs
M 4-1
o cd
4J Qcn
0) 4J
p cC 0)
o ecn 00
M X)
0) 3P-i >->
oo
H X)
4-1 O
cd xi
e 4-1
H 0)
4J gCD
W
CN|
O
o
Xi
o
4J
cd
S-i
o
co
CD
O
PM
H
Ci=>
^3
O4->
CO
M
CJ
CO
58
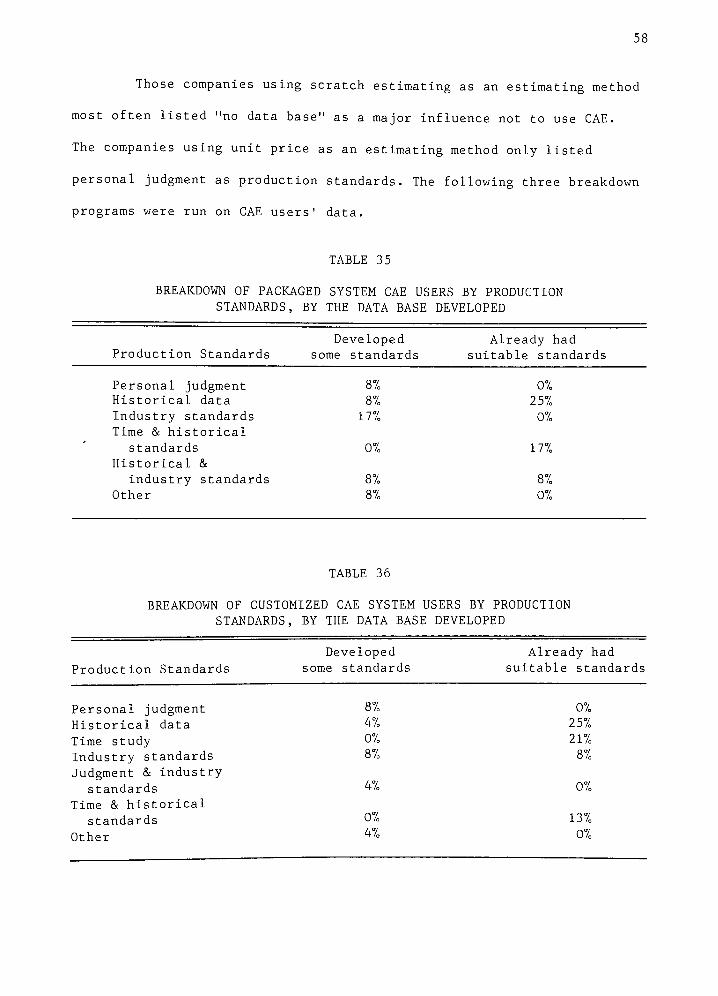
Those companies using scratch estimating as an estimating method
most often listed "no data base"as a major influence not to use CAE.
The companies using unit price as an estimating method only listed
personal judgment as production standards. The following three breakdown
programs were run on CAE users'
data.
TABLE 35
BREAKDOWN OF PACKAGED SYSTEM CAE USERS BY PRODUCTION
STANDARDS, BY THE DATA BASE DEVELOPED
Developed Already had
Production Standards some standards suitable standards
Personal judgment 87, 07,
Historical data 8% 25%
Industry standards 17% 0%
Time & historical
standards 0% 17%
Historical &
industry standards 87, 87,
Other 8% 0%
TABLE 36
BREAKDOWN OF CUSTOMIZED CAE SYSTEM USERS BY PRODUCTION
STANDARDS, BY THE DATA BASE DEVELOPED
Developed Already had
Production Standards some standards suitable standards
Personal judgment 87, 07,
Historical data 47, 257,
Time study0% 21%
Industry standards 87, 87,
Judgment & industry
standards 4% 0%
Time & historical
standards"/ 13%
Other M 0%

59
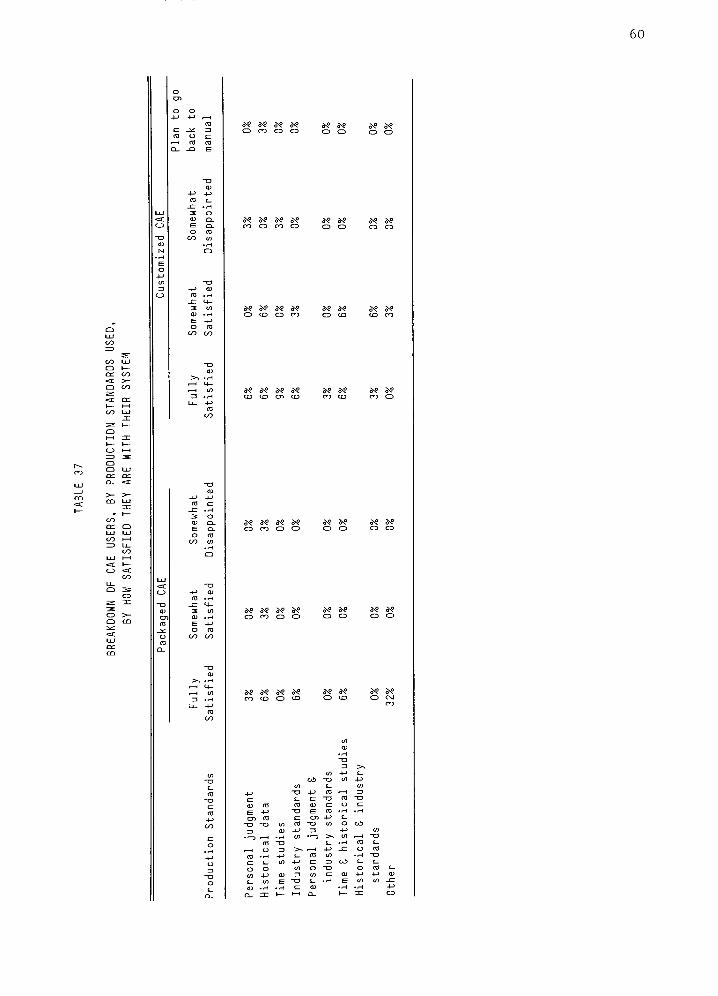
The third breakdown table, Table 37, compares the estimating
method companies used, to the production standards they used, to how
satisfied they were with their system.
60
+J -r-> . I
o\ o\ o\ o\
CD CO CD O CD CD
^ ^ ^ ^? *? 5-SCO CD CO O O CD O O
^? ^ ^? ^eCD to O CO o to
Q
CD LU
or or
CDCOCDCD OO OO
CD CO CD O
3^ ^? *? ^?CO tO CD CD
c ~o re -o
to . I "O
E "O C_ -r-

61
The last breakdown program run was the data base a company
used, by how satisfied the company was with its system, by what the
major disadvantage of the system was. The results of that program are
summarized in Table 38.
TABLE 38
BREAKDOWN OF HOW SATISFIED COMPANIES ARE WITH CAE,BY DATA BASE DEVELOPMENT, BY THE MAJOR
DISADVANTAGE THEY FOUND IN USING CAE
Data Base Development
Degree of
Satisfaction Major Disadvantage
Developed
some new Standards
standards were suitable
9% 16%
5% 12%
2% 7%
2% 7%
2% 0%
9% 7%
0% 7%
2% 2%
0% 5%
Fully satisfied
Somewhat satisfied
Somewhat disappointed
No disadvantage
Lack of versatility
Other
No disadvantage
Cost is higher
Lack of versatility
Other
Lack of versatility
Other
Going back to manual Other 2% 2%
Discussion of results
The percentage of total respondents using customized CAE was
9 percent. Only 4 percent of the total respondents used packaged CAE
systems. In all, 13 percent of the total respondents used CAE. This
figure, when compared to Phillip KentRuggles'
survey conducted in
1980, shows a 4 percent difference in CAE usage.Ruggles'
CAE usage
figure was 17 percent of the total respondents of the survey.
62
Lack of versatility in computers was hypothesized to be one
of the reasons why companies (particularly specialized printing compan
ies) decide not to use CAE. The three programs run on versatility are
discussed below.
1) A cross-tabulation program between the type of printing
company (general commercial or specialized) and the major
influence on the company's decision not to use CAE was
run. The results showed versatility as the second major
reason why both general commercial and specialized printers
do not use CAE. There was a slightly higher percentage
of specialized companies listing versatility than general
commercial companies (2 percent), but because of the Chi
square values and the other statistics, this difference
could have been due to chance.
2) A breakdown program was run which broke down the estimating
method used, by the type of printing company by the major
disadvantage in using CAE. The percentage of the companies
who answered versatility was: a) 100 percent of the special
ized companies using packaged systems; b) 44 percent of
the specialized companies using customized CAE; c) 27 percent
of the general commercial companies using packaged systems;
and, d) 38 percent of the general commercial companies
usingcustomized systems.
3) The third program run was a cross-tabulation table between
the type of printing company and the major disadvantage
of CAE. The data base proved too small to draw any valid
conclusions from the program test results.
63
In the straight percentage of answers found under "Major influ
ence on your decision to useCAE,"
the second highest response was
under "Packaged systems toogeneral" (21 percent). The highest response
was "Customized system costs toomuch" (29 percent). Perhaps the reason
why the cost of a customized system was listed most often is that a
large number of companies would not even consider using packaged CAE
because of its lack of versatility, but those same companies feel custom
systems are out of their price range.
Whether or not a company has developed hourly rates and produc
tion standards (a good estimating data base) was hypothesized to be
a reason for either using or not using CAE, and to either be an advantage
or disadvantage to those using CAE. Four breakdown programs were run
to test this hypothesis. Because of the nature of the breakdowns and
the number of CAE respondents, the answers were scattered among the
selections for answers.
The first breakdown program run was on companies listing "no
database"
as a major influence on their decision not to use CAE, by
the estimating method used, by the production standards used. The only
companies who listed "no database"
were those who used scratch, unit
price and combination scratch/unit price estimating methods. The produc
tion standards for those estimating methods were developed by personal
judgment in 30 percent of the responses. Twenty-five percent of the
responses in scratch estimating listed "other"as the production stan
dards used. The main answer in"other"
was a combination of personal
judgment and historical data. Historical data was the third most answered
production standard used, with 18 percent of the responses. The rest
of the responses were evenly distributed among the remaining production

64
standards. As expected, the majority of non-users really did not have a
developed data base from which to build a CAE system. It was unusual,
however, to find "time study"
and "historical data"answered as often
as they were since both of these methods are generally acceptable in
developing decent production standards.
The next three programs run on production standards development
were on companies presently using CAE. The first program was a breakdown
of CAE system users, by production standards used by the data base
developed.
The companies using packaged CAE responded as already having
suitable standards which were built from historical data. The same
percentage of custom system users responded with the same answers.
Overall, the custom system users claimed they already had suitable
standards more often than the packaged system users. It seemed to make
a difference that companies who used packaged or customized CAE had
at least some standards already developed, since none of the respondents
who used CAE had to totally develop new standards.
The next program run on CAE users was a breakdown of CAE users,
by production standards used, by how satisfied they were with their
system. By far, the majority of packaged CAE users were fully satisfied
with their systems. Of all those fully satisfied, the majority of them
used a combination of personal judgment with historical data to determine
their production standards. The same satisfaction was most commonly
found in customized system users. The majority of custom system users
was fully satisfied, but the major production standards used among
them were "timestudies." The production standards used when those
companies were "somewhatdisappointed"
were historical data. This was

65
probably due to the fact that "historical data"was the main answer
chosen overall as a type of production standard used. Only 3 percent
of the CAE users listed "plan to go back to manualestimating."
Those
3 percent were custom system users.
The last breakdown program run on the data base of a company
was the data developed, by the degree of satisfaction, by the major
disadvantage people found with their system. "Nodisadvantage"
was
answered most often by companies who were "fullysatisfied."
The majority
of the same respondents said they had suitable standards for CAE before
they began using it. The only respondents who said there was no disadvan
tage to using CAE were only "somewhatsatisfied"
with their system.
It appears these companies could not find a disadvantage to the system
but still were not fully satisfied. The majority of those respondents
also had suitable standards for CAE before using it. The major disadvan
tage listed by respondents in all degrees of satisfaction was "lack
ofversatility."
Even some of the companies who were fully satisfied
felt lack of versatility was a disadvantage of their CAE system.
Answers to "Do not understandcomputers"
and "Do not understand
CAE"were low. Only 5 percent of the total respondents listed "Do not
understandCAE"
as a major influence not to use CAE, and only 3 percent
of the responses were "Do not understandcomputers."
The majority of
the respondents had heard of CAE at trade shows. Overall, the respondents
seemed verywell-informed on CAE, with only one person saying the place
he heard of CAE was in the questionnaire itself. Perhaps there were
more companies who were not familiar with CAE or computers, but did
not mail in the questionnaire for that reason.

66
Twenty-five percent of the respondents never considered using
CAE. Fifty-five percent of those same companies said they heard of
CAE through trade journals. Another 22 percent of the same respondents
heard of CAE through a combination of trade journals and trade shows.
It appears the publicity at trade shows and in trade magazines is not
quite good enough to get companies to at least consider CAE.
After reviewing the results of the last four programs run,
it appears that when a company has a data base which it feels is suitable
for CAE, it is more likely to change over to CAE from manual estimating,
then if the company has to develop new standards. Whether or not the
company's production standards are actually suitable is another question
which cannot be answered without knowing more about the company.
At the beginning of this thesis the possibility that the overall
lack of understanding computers and CAE was discussed as possibly a
major reason why CAE is not more widely accepted. As expected, the
more seriously companies considered using CAE, the more familiar those
companies seemed to be with CAE. This is evident in the high value
of Tau C and Gamma which indicates the relative ordering of answers
between the two variables where the respondent "heard ofCAE"
and "how
seriously he considered usingCAE" fell along the major diagonal. The two
variables, "where the company heard ofCAE"
and "the major influence
on their decision not to useCAE," had no significant relationship.
The cross-tabulation program between how seriously a company
considered using CAE by the major influence on its decision not to
use CAE was useful in finding what companies who seriously considered
using CAE thought about it. Thirty percent of the companies who compared
CAE systems to their present system said that custom systems were too
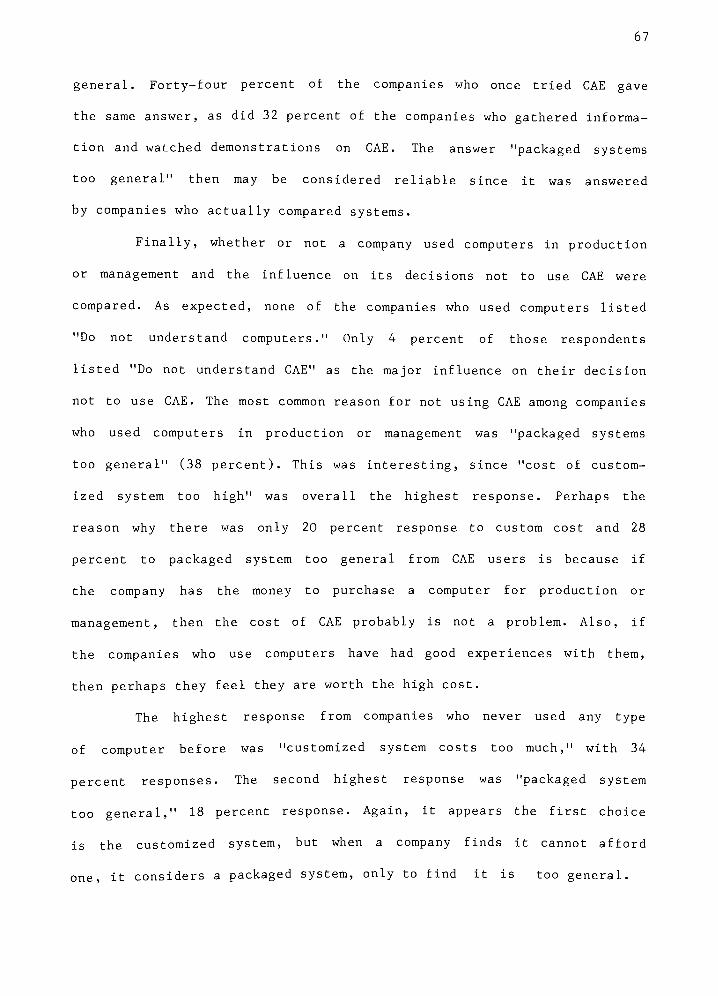
67
general. Forty-four percent of the companies who once tried CAE gave
the same answer, as did 32 percent of the companies who gathered informa
tion and watched demonstrations on CAE. The answer "packaged systems
toogeneral"
then may be considered reliable since it was answered
by companies who actually compared systems.
Finally, whether or not a company used computers in production
or management and the influence on its decisions not to use CAE were
compared. As expected, none of the companies who used computers listed
"Do not understandcomputers."
Only 4 percent of those respondents
listed "Do not understandCAE"
as the major influence on their decision
not to use CAE. The most common reason for not using CAE among companies
who used computers in production or management was "packaged systems
toogeneral" (38 percent). This was interesting, since "cost of custom
ized system toohigh"
was overall the highest response. Perhaps the
reason why there was only 20 percent response to custom cost and 28
percent to packaged system too general from CAE users is because if
the company has the money to purchase a computer for production or
management, then the cost of CAE probably is not a problem. Also, if
the companies who use computers have had good experiences with them,
then perhaps they feel they are worth the high cost.
The highest response from companies who never used any type
of computer before was "customized system costs toomuch,"
with 34
percent responses. The second highest response was "packaged system
toogeneral," 18 percent response. Again, it appears the first choice
is the customized system, but when a company finds it cannot afford
one, it considers a packaged system, only to find it is too general.

68
The size of a printing company was discussed as a possible
reason why CAE is not more widely used. This has to do with the fact
that a small printing company not only cannot afford the cost to CAE,
but also may not have a need for it. Both of these reasons for not
using CAE certainly appear to be the case in the majority of companies
responding to the survey. Fifty-five percent of the companies responding
employed only one to twenty-five employees. It does not seem likely
that a computer assisted estimating system would be necessary in plants
of this size. Less than 3 percent of all respondents in this size bracket
use CAE.
In spite of all the small printing companies responding to
the survey, only 5 percent of them answered "toosmall"
when asked
why they decided not to use CAE. As mentioned before, however, 51 percent
of the small companies listed custom and packaged CAE cost as the reason
they decided not to use CAE. Possibly they cannot afford it because
they are small companies. Strangely enough, the highest response of
small companies as to what price they would consider using CAE on a
computer dedicated solely to the task of estimating was not in the
lowest category (under $2,000), but was in the bracket of $2 ,000-$10,000.
In the case of the price companies would pay for CAE as part of a Manage
ment Information System, 59 percent of the companies did respond in
the lowest price range ($2 ,000-$10,000) . However, 25 percent of the
companies went one bracket higher in the price they would consider
using CAE, at $10 ,000-$20,000.Although the companies are small, it
appears there is still a price at which they would use CAE even if
it is not necessary.

69
FOOTNOTES FOR CHAPTER II
1Michael Nolan, "Computer Assisted Estimating: Not Much New,
But It's Coming,"
Printing Impressions, Sept. 1979, p. 34.
2
Phillip Kent Ruggles (Correspondence with Sharon L. Ryan,March 1, 1980).
3Norman H. Nie, C. Hadlai Hull, Jean G. Jenkins, Karin Stein-
brenner and Dale H. Bent, Statistical Package for the Social Sciences
(New York: McGraw-Hill, Inc., 1970), p. 194.
4Nie, Hull, Jenkins, Steinbrenner and Bent, p. 224.
Nie, Hull, Jenkins, Steinbrenner and Bent, p. 226.
Nie, Hull, Jenkins, Steinbrenner and Bent, p. 228.
Mildren Parten, Surveys, Polls and Samples (New York: Cooper
Square Publishers, Inc., 1966), pp. 162-163.
Q
Parten, p. 164.
q
Parten, p. 169.
70
CHAPTER III
SUMMARY AND CONCLUSIONS
The following conclusions are based on the results of the cross-
tabulations, breakdowns and straight survey results.
The major reason the majority of printing companies in the survey
reject CAE is because of the cost of it. It is not practical for the
majority of printing companies to pay today's price of CAE because ot
their estimating needs. Fifty-five percent of the printing companies
in the survey employ between one and twenty-five people. It is unlikely
that those companies require a full-time estimator. It would be difficult
to justify a CAE system in a company with few estimates.
Related to the above reason size, is another reason CAE is
concluded to be rejected. That drawback is the lack of developed produc
tion standards among the printing companies responding to the survey.
The small companies may feel they have little reason to spend time
developing and upkeeping a data base when there is a limited amount
of data going through it. Most of the smallcompanies'
estimators are
probably the owners and feel they know (and possibly do) what the produc
tion standards are without looking into it in detail. The attitude
of these managers is probably: why should I spend time developing numbers
to put in a computer memory when I already have them in mine? The author
concludes, however, that medium and large sized printing companies
who have developed their own production standards are more likely to
71
convert from manual estimating to computer assisted estimating than
companies who have not developed production standards.
Aside from size and data base having an influence on CAE accep
tance though, is a factor the author concludes to be the major problem
with CAE lack of versatility. Even if the cost of CAE came down to
an affordable price for everyone, and everyone had developed production
standards, CAE would not be acceptable to companies who require versatil
ity in their estimating system. This problem is a result of the software
programs written for computer assisted estimating systems and will
not be overcome until a programmer is able to create a practical system
that operates in the same manner as an estimator's thoughts.
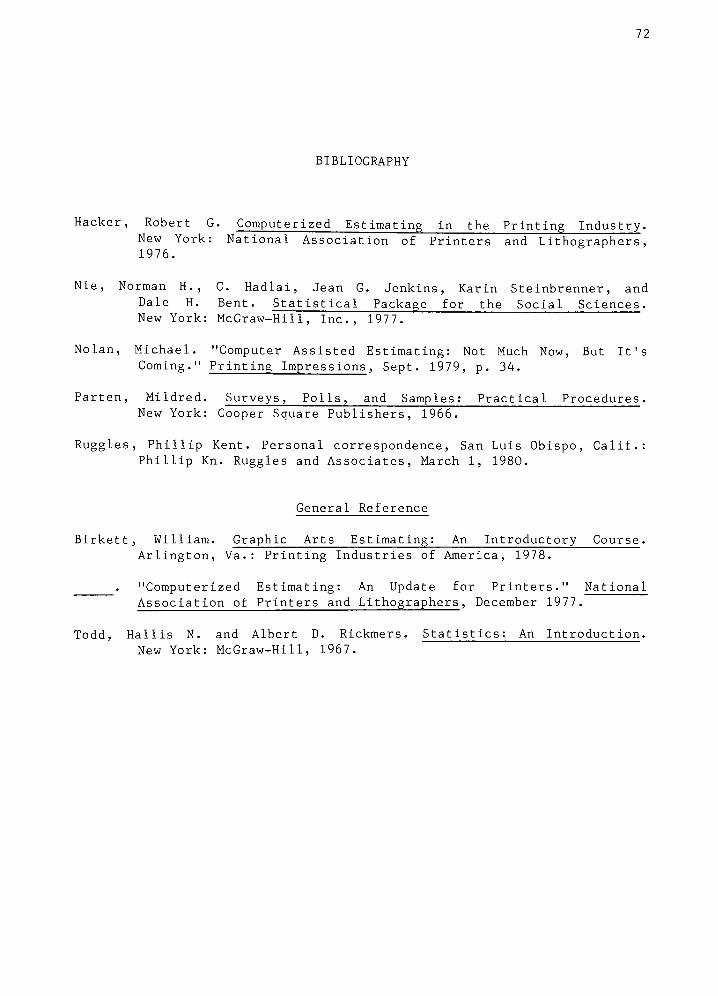
72
BIBLIOGRAPHY
Hacker, Robert G. Computerized Estimating in the Printing Industry.
New York: National Association of Printers and Lithographers,1976.
Nie, Norman H.,
C. Hadlai, Jean G. Jenkins, Karin Steinbrenner, and
Dale H. Bent. Statistical Package for the Social Sciences.
New York: McGraw-Hill, Inc., 1977.
Nolan, Michael. "Computer Assisted Estimating: Not Much Now, But It'sComing."
Printing Impressions, Sept. 1979, p. 34.
Parten, Mildred. Surveys, Polls, and Samples: Practical Procedures.
New York: Cooper Square Publishers, 1966.
Ruggles, Phillip Kent. Personal correspondence, San Luis Obispo, Calif.:
Phillip Kn. Ruggles and Associates, March 1, 1980.
General Reference
Birkett, William. Graphic Arts Estimating: An Introductory Course.
Arlington, Va.: Printing Industries of America, 1978.
"Computerized Estimating: An Update for Printers."National
Association of Printers and Lithographers, December 1977.
Todd, Hallis N. and Albert D. Rickmers. Statistics: An Introduction.
New York: McGraw-Hill, 1967.

73
APPENDIX A
Cover Letter
Dear Printing Manager:
The attitudes of management towards estimating methods is becom
ing increasingly important in the printing industry today. Estimating
techniques, along with printing technology, are constantly changing.
This further complicates the skill required in estimating the cost
of printing.
The purpose of this survey is to discover the reasons why your
company chooses one estimating method over another. If you are unfamiliar
with the reasons why your company chooses the method it does, then
please forward the survey to the appropriate person.
All of the companies chosen for this survey are of equal impor
tance, so please fill out the questionnaire, regardless of the estimating
method your company uses. If you wish to receive a copy of the research
results in return for your help, then include your name and address
at the end of the survey. Your company is assured complete confidenti
ality. The information will be used for my Master's Thesis only.
Please answer as soon as possible. The questionnaire will only
take a few minutes to answer. The pre-stamped return envelope was pre
pared for your convenience. Please use it to help advance our knowledge
of the graphic arts industry.
Sincerely,
Sharon L. Ryan
Graduate Printing Technology Student
This is to certify that the
contents of this letter
involve a bonafide R.I.T.
graduate thesis project.
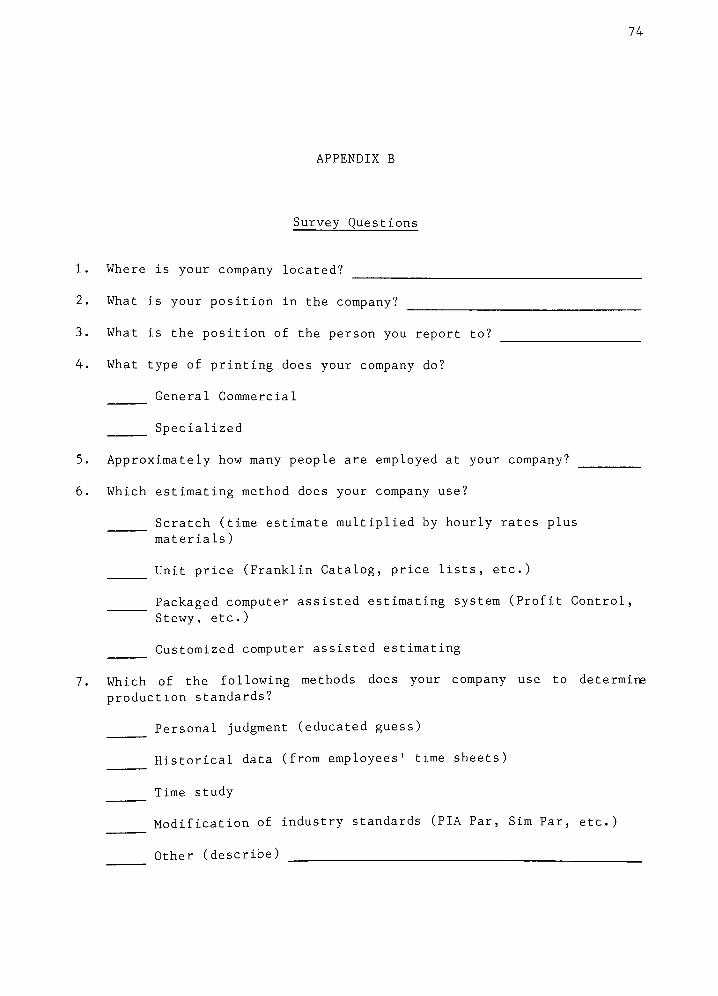
74
APPENDIX B
Survey Questions
1. Where is your company located ?
2. What is your position in the company?
3. What is the position of the person you report to?
4. What type of printing does your company do?
General Commercial
Specialized
5. Approximately how many people are employed at your company?
6. Which estimating method does your company use?
Scratch (time estimate multiplied by hourly rates plus
materials)
Unit price (Franklin Catalog, price lists, etc.)
Packaged computer assisted estimating system (Profit Control.
Stewy , etc. )
Customized computer assisted estimating
7. Which of the following methods does your company use to determine
production standards?
Personal judgment (educated guess)
Historical data (fromemployees'
time sheets)
Time study
Modification of industry standards (PIA Par, Sim Par, etc.)
Other (describe)

75
IF YOUR COMPANY USES COMPUTER ASSISTED ESTIMATING (CAE), PLEASE SKIP
QUESTIONS 8-13 AND GO ON TO QUESTION 14.
8. Has your company ever used computers in production or management?
Yes
No
9. Where have you heard of CAE?
Trade journals
Trade shows
CAE salesman
CAE literature
10. How seriously have you considered using CAE?
Have not considered using it at all
Just "thought aboutit"
Gathered information on specific system(s)
Watched a demonstration
Compared the advantages and disadvantages against your present
system of estimating
Once tried CAE then decided to go back to previously used
method
11. Rank the following items in the order of their influence on your
decision not to use CAE, using number 1 as the most important.
Customized system costs too much
Packaged system costs too much
Packaged systems are too general (not versatile enough)
No data base
Do not understand computers
Do not understand CAE
Other reason (describe)

12. At what price would your firm seriously consider investing in
computer assisted estimating utilizingmicro- or mini-computer
dedicated solely to this task?
$25,000 - $50,000
$10,000 - $25,000
$ 2,000 - $10,000
under $2,000
13. At what price would your firm seriously consider investing in
computer assisted estimating as part of a complete computer manage
ment information system?
$50,000 and up
$25,000 - $50,000
$10,000 - $25,000
$ 2,000 - $10,000
PLEASE ANSWER THE FOLLOWING QUESTIONS IF YOUR COMPANY PRESENTLY USES CAE.
14. Approximately how long has your company been using CAE?
15. Were new estimating time standards developed for the data base
of your CAE system, or do you use the standards that came with
the system?
Use standards that came with the system
Developed at least some new time standards once CAE was
installed
Already had complete time standards suitable for CAE use
16. Are you completely satisfied with your CAE system?
Fully satisfied
Somewhat satisfied
Somewhat disappointed
Plan to go back to manual estimating method
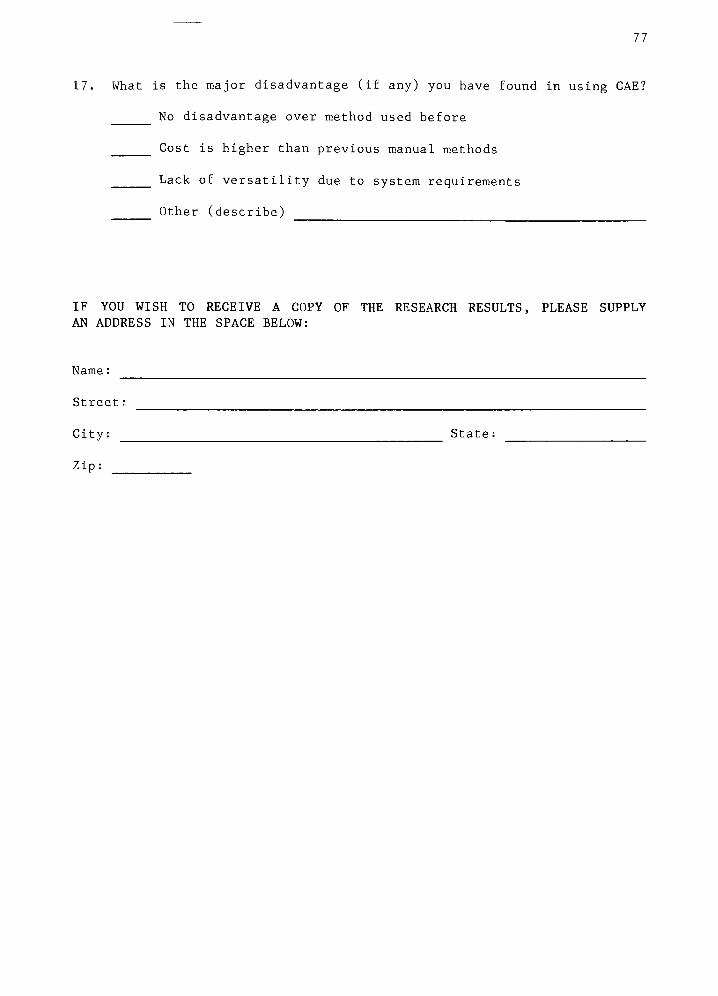
77
17. What is the major disadvantage (if any) you have found in using CAE?
No disadvantage over method used before
Cost is higher than previous manual methods
Lack of versatility due to system requirements
Other (describe)
IF YOU WISH TO RECEIVE A COPY OF THE RESEARCH RESULTS, PLEASE SUPPLY
AN ADDRESS IN THE SPACE BELOW:
Name :^
Street:
City: State:
Zip:
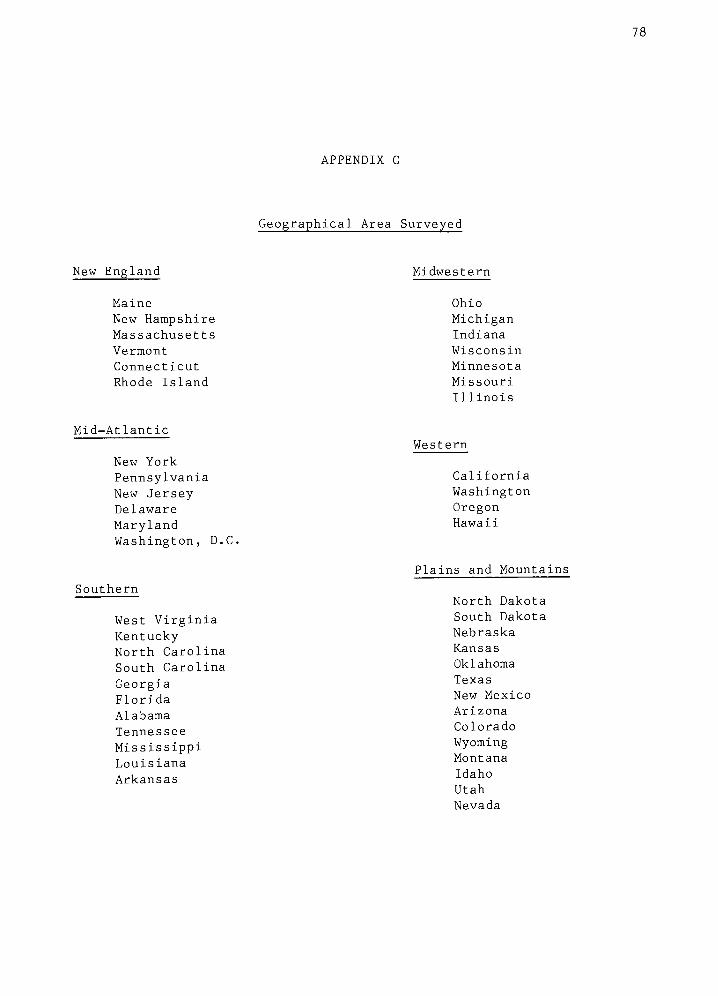
APPENDIX C
Geographical Area Surveyed
New England Midwestern
Maine
New Hampshire
Massachusetts
Vermont
Connecticut
Rhode Island
Ohio
Michigan
Indiana
Wisconsin
Minnesota
Missouri
Illinois
Mid-Atlantic
Western
New York
Pennsylvania
New Jersey
Delaware
Maryland
Washington, D.C.
Southern
West Virginia
Kentucky
North Carolina
South Carolina
Georgia
Florida
Alabama
Tennessee
Mississippi
Louisiana
Arkansas
California
Washington
Oregon
Hawaii
Plains and Mountains
North Dakota
South Dakota
Nebraska
Kansas
Oklahoma
Texas
New Mexico
Arizona
Colorado
WyomingMontana
Idaho
Utah
Nevada
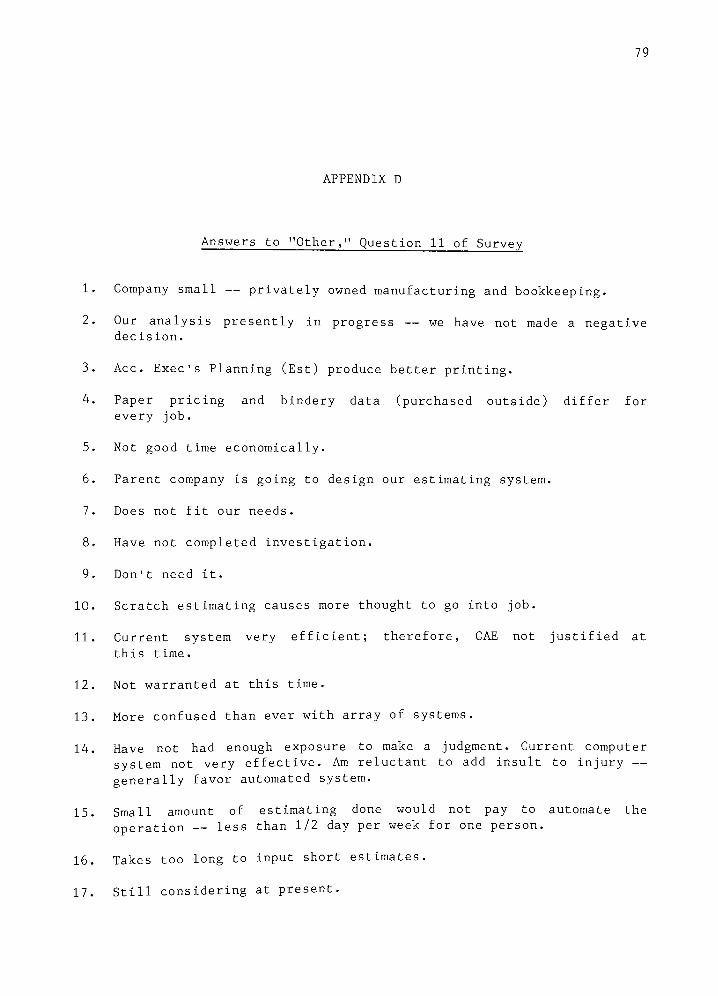
79
APPENDIX D
Answers to "Other,"Question 11 of Survey
1. Company small privately owned manufacturing and bookkeeping.
2. Our analysis presently in progress we have not made a negative
decision.
3. Ace. Exec's Planning (Est) produce better printing.
4. Paper pricing and bindery data (purchased outside) differ for
every job.
5. Not good time economically.
6. Parent company is going to design our estimating system.
7. Does not fit our needs.
8. Have not completed investigation.
9. Don't need it.
10. Scratch estimating causes more thought to go into job.
11. Current system very efficient; therefore, CAE not justified at
this time.
12. Not warranted at this time.
13. More confused than ever with array of systems.
14. Have not had enough exposure to make a judgment. Current computer
system not veryeffective. Am reluctant to add insult to injury
generally favor automated system.
15. Small amount of estimating done would not pay to automate the
operation less than 1/2 day per week for one person.
16. Takes too long to input short estimates.
17. Still considering at present.
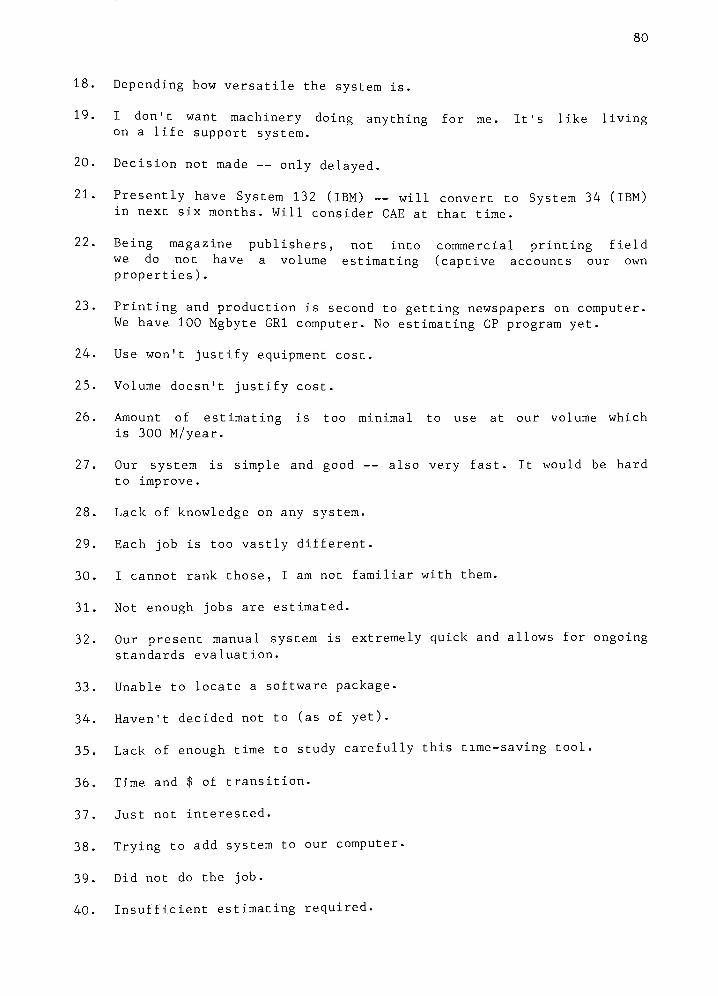
80
18. Depending how versatile the system is.
19. I don't want machinery doing anything for me. It's like livingon a life support system.
20. Decision not made only delayed.
21. Presently have System 132 (IBM) will convert to System 34 (IBM)in next six months. Will consider CAE at that time.
22. Being magazine publishers, not into commercial printing field
we do not have a volume estimating (captive accounts our own
properties) .
23. Printing and production is second to getting newspapers on computer.
We have 100 Mgbyte GR1 computer. No estimating CP program yet.
24. Use won't justify equipment cost.
25. Volume doesn't justify cost.
26. Amount of estimating is too minimal to use at our volume which
is 300 M/year.
27. Our system is simple and good also very fast. It would be hard
to improve.
28. Lack of knowledge on any system.
29. Each job is too vastly different.
30. I cannot rank those, I am not familiar with them.
31. Not enough jobs are estimated.
32. Our present manual system is extremely quick and allows for ongoing
standards evaluation.
33. Unable to locate a software package.
34. Haven't decided not to (as of yet).
35. Lack of enough time to study carefully this time-saving tool.
36. Time and $ of transition.
37. Just not interested.
38. Trying to add system to our computer.
39. Did not do the job.
40. Insufficient estimatingrequired.

41. No funds right now, hope to get into this year or at least by
'81.
42. Too time-consuming.
43. Company too small to make adequate use.
44. Mother company insists on our using their time standards.
45. CAE only speeds calculation. Does not perform any better than
the person handling the input.
46. Have not heard of it.
47. Can't justify cost of a large computer with more and time capabil
ities.
48. We're not ready yet.
49. We don't estimate enough to have a basic price for 957, of our work.
50. Volume of estimates low cost per estimate too high. I'm smarter
than a computer.
51. Insufficient volume of estimates.
52. We would need more time/cost information.
53. Time and effort on CAE exceeds manual systems.
54. We expect to go next year.
55. We will develop our own.
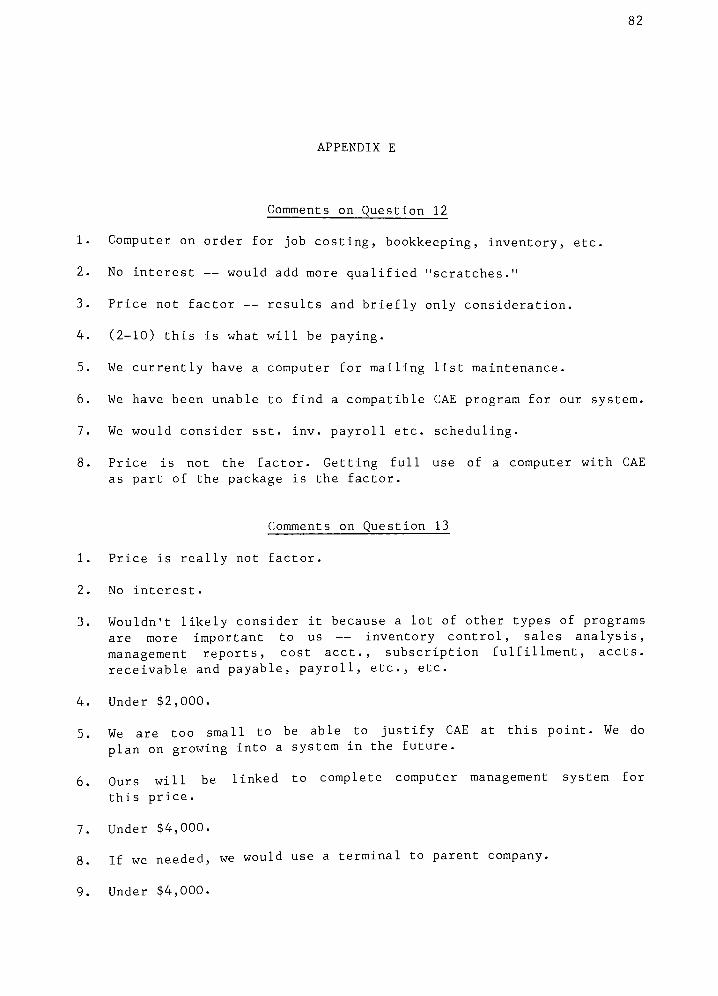
82
APPENDIX E
Comments on Question 12
1. Computer on order for job costing, bookkeeping, inventory, etc.
2. No interest would add more qualified"scratches."
3. Price not factor results and briefly only consideration.
4. (2-10) this is what will be paying.
5. We currently have a computer for mailing list maintenance.
6. We have been unable to find a compatible CAE program for our system.
7. We would consider sst. inv. payroll etc. scheduling.
8. Price is not the factor. Getting full use of a computer with CAE
as part of the package is the factor.
Comments on Question 13
1. Price is really not factor.
2. No interest.
3. Wouldn't likely consider it because a lot of other types of programs
are more important to us inventory control, sales analysis,
management reports, cost acct., subscription fulfillment, accts.
receivable and payable, payroll, etc., etc.
4. Under $2,000.
5. We are too small to be able to justify CAE at this point. We do
plan on growing into a system in the future.
6. Ours will be linked to complete computer management system for
this price.
7. Under $4,000.
8. If we needed, we would use a terminal to parent company.
9. Under $4,000.

83
APPENDIX F
Comments on Question 17
1. Certain limitations as it may relate to complicated multi-form
runs such as label work.
2. We developed our software based on our previous estimating method.
This also allows for a greater versatility.
3. Still working on it. Looks OK.
4. Our own programming.
5. Lower cost 3 hours/day (computer) vs. 14 hours/day manual.
6. CAE is only part of program that is on line now want to use
more programs.
7. System not large enough.
8. Sometimes we can do hand-estimating faster.
9. IBM S100 slows down flow of work when using it only as a source
for completing estimates.
10. It is slower and requires more thought than looking up a price
list in the Franklin Catalog.
11. Estimators never trusted the system gave illogical answers
requiring a manual estimate.
12. We have too many variablesfor software.
13. Some special operations are too expensive to program for limited
users .
14. Too new to tell.