
Factors influencing innovative value creation of milled ...
97
FACTORS INFLUENCING INNOVATIVE VALUE CREATION OF MILLED RICE BY AGRO PROCESSORS WITHIN THE RICE VALUE CHAIN IN MWEA IRRIGATION SCHEME GITHINJI ANTHONY MWANIKI A RESEARCH PROJECT SUBMITTED IN PARTIAL FULFILLMENT OF THE REQUIREMENT FOR THE AWARD OF THE DEGREE OF MASTER OF SCIENCE IN ENTREPRENEURSHIP AND INNOVATION MANAGEMENT, SCHOOL OF BUSINESS, UNIVERSITY OF NAIROBI 2017
Transcript of Factors influencing innovative value creation of milled ...
FACTORS INFLUENCING INNOVATIVE VALUE CREATION OF MILLED
RICE BY AGRO PROCESSORS WITHIN THE RICE VALUE CHAIN IN
MWEA IRRIGATION SCHEME
GITHINJI ANTHONY MWANIKI
A RESEARCH PROJECT SUBMITTED IN PARTIAL FULFILLMENT OF THE
REQUIREMENT FOR THE AWARD OF THE DEGREE OF MASTER OF
SCIENCE IN ENTREPRENEURSHIP AND INNOVATION MANAGEMENT,
SCHOOL OF BUSINESS, UNIVERSITY OF NAIROBI
2017
ii
DECLARATION
I, the undersigned declare that, this research project report is my original work and has
not been submitted to any other college, institution or university.
Signature………………………………………….Date…………………………………..
Githinji Anthony Mwaniki
D66/79472/2015
This research project has been submitted for examination with my approval as
University Supervisor.
Signature…………………………………………Date…………………………………..
Dr. Florence Muindi
Supervisor
Department of Business Administration
University of Nairobi

iii
DEDICATION
I dedicate this research project to my loving and caring family for their unwavering
support and inspiration throughout the entire study period.

iv
ACKNOWLEDGEMENT
I express sincere gratitude to the key respondents, mainly large scale, medium and small
scale rice processors as well as value creation technical experts for their provision of
rich data despite the short notice provided hence making this analysis possible. Special
thanks go to my supervisor, Dr. Florence Muindi, for her constructive and excellent
guidance in shaping the entire research idea. I give thanks to my lecturers who instilled
knowledge and skills in the entire academic period, not forgetting my fellow students for
the great sharing, comradeship and networking.
I also appreciate the Chief Officer MOA Kirinyaga County Mr. Gachingiri and the
Director Mr. B. Muriithi for their great support in allowing me further my education
despite the busy work schedule. To my wife Grace, Mum Jecinta, sister Mercy and
Lucy, I will forever be grateful. Finally, I give thanks to Almighty God for the strength
and wisdom without which, I would not have managed this work.

v
TABLE OF CONTENTS
DECLARATION ............................................................................................................. ii
DEDICATION ................................................................................................................ iii
ACKNOWLEDGEMENT ............................................................................................. iv
LIST OF TABLES ........................................................................................................ viii
LIST OF FIGURES ........................................................................................................ ix
ABBREVIATIONS AND ACRONYMS ........................................................................ x
DEFINITION OF TERMS ............................................................................................ xi
ABSTRACT .................................................................................................................... xii
CHAPTER ONE: INTRODUCTION ........................................................................... 1
1.1 Background of the Study ............................................................................................. 1
1.1.1 Concept of Innovation ........................................................................................ 3
1.1.2 Concept of Value Creation ................................................................................. 4
1.1.3 Concept of Value Chain ...................................................................................... 6
1.1.4 Concept of Agro-Processing ............................................................................... 7
1.1.5 Factors Influencing Innovative Value Creation .................................................. 7
1.1.6 Mwea Irrigation Scheme ..................................................................................... 8
1.2 Research Problem ........................................................................................................ 9
1.3 Research Objective .................................................................................................... 10
1.4 Value of the Study ..................................................................................................... 10
CHAPTER TWO: LITERATURE REVIEW ............................................................. 11
2.1 Introduction ................................................................................................................ 11
2.2 Theoretical Foundation of the Study ......................................................................... 11
2.2.1 Rodgers Diffusion of Innovation Theory ......................................................... 11
2.2.2 Value Chain Theory as Proposed by Porter (1985) .......................................... 12
2.3 Factors Influencing Innovative Value Creation ......................................................... 13
2.3.1 Firm’s Age or Maturity ..................................................................................... 13
2.3.2 Firm’s Size and Stakeholder Attributes ............................................................ 14
2.3.3 Customer Needs and Expectation ..................................................................... 14
2.3.4 Resource Availability ....................................................................................... 15
2.3.5 Product Attractiveness ...................................................................................... 15

vi
2.3.6 Product Demand ............................................................................................... 15
2.3.7 Market of the Value Created Product ............................................................... 16
2.3.8 Technology Availability ................................................................................... 16
2.3.9 Corporate Culture and Environment ................................................................. 17
2.4 Empirical Review of Innovative Value Creation ....................................................... 17
2.5 The Conceptual Framework ...................................................................................... 18
CHAPTER THREE: RESEARCH METHODOLOGY ........................................... 20
3.1 Introduction ................................................................................................................ 20
3.2 Research Design ........................................................................................................ 20
3.3 Target Population ....................................................................................................... 20
3.4 Sampling Design ........................................................................................................ 21
3.5 Data Collection .......................................................................................................... 22
3.6 Data Analysis ............................................................................................................. 22
CHAPTER FOUR: DATA ANALYSIS, RESULTS AND DISCUSSION ............... 23
4.1 Introduction ................................................................................................................ 23
4.2 General Information ................................................................................................... 23
4.2.1 Respondents’ Category of Agro-Processor ...................................................... 23
4.2.2 Age bracket of the Respondents ....................................................................... 24
4.2.3 Respondents’ Gender ........................................................................................ 25
4.2.4 Respondents’ Level of Education ..................................................................... 25
4.2.5 Registration Status of the Business ................................................................... 26
4.2.6 Number of Years Worked in Rice Agro-Processing/Value Creation ............... 27
4.2.7 Continuous Engagement in Value Creation Activities ..................................... 27
4.2.8 Growing Status of the Enterprise ...................................................................... 28
4.3 Innovative Value Creation Activities ........................................................................ 29
4.3.1 Polishing Rice/White Rice Processing ............................................................. 30
4.3.2 Baking ............................................................................................................... 30
4.3.3 Whole Rice Cookies Preparation ...................................................................... 31
4.3.4 Rice Flour Processing ....................................................................................... 31
4.3.5 Rice Blending ................................................................................................... 32
4.3.6 Feeds Formulation ............................................................................................ 32
vii
4.3.7 Rice Husk Briquetting ...................................................................................... 33
4.3.8 Making of Rice Biscuits ................................................................................... 33
4.3.9 Deep Frying of Baked Products ........................................................................ 34
4.4 Factors Influencing Innovative Value Creation of Milled Rice ................................ 35
4.4.1 Firms Age of Maturity ...................................................................................... 35
4.4.2 Firm Size and Stakeholders Attributes ............................................................. 36
4.4.3 Customer Needs and Expectations ................................................................... 37
4.4.4 Customer Needs’ Consideration in the Value Creation Process ...................... 38
4.4.5 Demand of the Value Added Products ............................................................. 40
4.4.6 Product Attractiveness ...................................................................................... 41
4.4.7 Market of the Value Created Products .............................................................. 42
4.4.8 Human Resource Availability ........................................................................... 45
4.4.9 Technology availability .................................................................................... 48
4.4.10 Corporate Culture and Environment ............................................................... 49
4.5 Factor Analysis .......................................................................................................... 50
4.6 Discussion of the Findings ......................................................................................... 54
CHAPTER FIVE: SUMMARY, CONCLUSIONS AND RECOMMENDATIONS58
5.1 Introduction ................................................................................................................ 58
5.2 Summary of the Key Findings ................................................................................... 58
5.3 Theoretical Relationship with the Results of the Study ............................................. 60
5.4 Conclusion ................................................................................................................. 60
5.5 Recommendations ...................................................................................................... 61
5.6 Areas for Further Research ........................................................................................ 62
REFERENCES .............................................................................................................. 63
APPENDICES ................................................................................................................ 66
Appendix I: Questionnaire .............................................................................................. 66
Appendix II: Component Matrix ..................................................................................... 77
Appendix III: Communalities .......................................................................................... 83
viii
LIST OF TABLES
Table 3. 1: Target Sample Size………………………………………………………….21
Table 4.1: Respondents’ Category of agro-processor ..................................................... 23
Table 4.2: Age bracket of the Respondents ..................................................................... 24
Table 4.3: Respondents’ Gender ..................................................................................... 25
Table 4.4: Respondents’ Level of education ................................................................... 25
Table 4.5: Registration status of the business ................................................................. 26
Table 4.6: Number of Years Worked in Rice Agro-Processing/Value Creation ............ 27
Table 4.7: Continuous Engagement in Value Creation Activities .................................. 27
Table 4.8: Growing Status of the Enterprise ................................................................... 28
Table 4.9: Polished/white rice ......................................................................................... 30
Table 4.10: Baked products ............................................................................................. 30
Table 4.11: Whole rice cookies ....................................................................................... 31
Table 4.12: Rice flour ...................................................................................................... 31
Table 4.13: Blended rice.................................................................................................. 32
Table 4.14: Feeds............................................................................................................. 32
Table 4.15: Rice husk briquettes ..................................................................................... 33
Table 4.16: Rice biscuits ................................................................................................. 33
Table 4.17: Deep fried products, Body Powder and Rice Bran Oil ................................ 34
Table 4.18: Firms Age or Maturity.................................................................................. 35
Table 4.19: Firm Size and Stakeholders Attributes ......................................................... 36
Table 4.20: Consideration of Customer Needs and Expectations ................................... 37
Table 4.21: Market of the Value Created Products ......................................................... 42
Table 4.22: Market Promotion for Value Added Products.............................................. 43
Table 4.23: Price of value added products and Target Market ........................................ 44
Table 4.24: Adequacy of Human Resource ..................................................................... 45
Table 4.25: Offering of capacity/Training by value addition experts ............................. 46
Table 4.26: Financial Capability for value Addition Activities ...................................... 47
Table 4.27: Frequency of changing value creation machinery/Equipment ..................... 48
Table 4.28: Rating of the processing facilities/Machineries/equipment ........................ 48
Table 4.29: Corporate Culture and Environment ............................................................ 49
Table 4.30: Total Variance Explained…………………………………………………..50

ix
LIST OF FIGURES
Figure 2.1: Conceptual Framework ................................................................................... 19
Figure 4.1: Scree plot for the Perceived factors Influencing Value Creation ................... 53
x
ABBREVIATIONS AND ACRONYMS
BDS Business Development Services
FAO Food Agricultural Organization
MDGs Millennium Development Goals
MIAD Mwea Irrigation Agriculture Development
MIS Mwea Irrigation Scheme
MOA Ministry of Agriculture
MOALV&F Ministry of Agriculture, Livestock, Veterinary and Fisheries
MOW&I Ministry of Water and Irrigation
MRGM Mwea Rice Growers Multi-purpose
MT Metric Tonnes
NCPB National Cereals and Produce Board
NGOs Non-Governmental Organizations
NIB National Irrigation Board
NRDS National Rice Development Strategy
VCP Value Chain Process

xi
DEFINITION OF TERMS
The following is the meaning of terminologies as used in context of the study.
Agro processing is a transformation process of changing agricultural commodities from
their original natural state to different products with anticipation of improving the value.
Innovation refers to an application of better solutions able to meet expected
requirements in addressing existing market needs and unarticulated needs. It translates
an invention and an idea into a product that creates customer value or for which they are
willing to pay.
Intrinsic value is the inherent worth of a product. It is the underlying perception of the
actual value of the product considering its true value. The market value is not the same
as intrinsic value.
Proximate analysis means, partitioning of compounds in a produce based on its
chemical properties for example; moisture content, ash, crude protein, crude lipids,
crude fibre and free digestible nitrogen extracts.
Value addition is transforming agricultural produce which is raw to a new product
through processing, cooling, extracting, processing, packaging, , drying or any other
procedure that differentiates the product from the original raw commodity.
Value chain is a composition of activities which firms operating in a specific industry
perform in delivery of their products to the market.
Value Creation refers to the increase of the worth of a product in the context of creating
better value for the customer purchasing the product as well as producers who want to
see if their stake appreciates in value
xii
ABSTRACT
Firms must innovate in order to enhance the value of their processes with ultimate aim
of generating affordable competitive products for the market. The challenge of
producing consumer products that are safe from a health viewpoint with fair price
consideration has pressurized firms to comply or be edged out from the market. Despite
the importance of value creation of milled rice and by-products within Mwea Irrigation
scheme, it has remained relatively low and with minimal growth. This therefore
necessitated the evaluation of the influencing factors in order to devise the various value
creation strategies to correct the situation. The researcher took a population of 139 rice
agro-processors with a sample of 72 actors (50%) of the population occasioned due to
oversampling. However, 67 actors (93.05%) of the sample responded. Descriptive cross
sectional survey coupled with stratified random and judgmental sampling was used in
identifying the survey elements. Closed structured questionnaires devised in Likert scale
were administered in data collection. The study concludes that, agro-processing firms in
Mwea irrigation scheme rarely improve the value of milled rice except through polishing
and blending. The researcher further find that, value of blended and polished rice is only
enhanced through, branding, packaging, standardizing, promotion and advertising.
Products such as fortified feeds, whole rice cookies, rice flour, rice husk briquettes, rice
biscuits, and deep fried baked products are rarely done by the agro-processors. Other
conclusion is that, innovative value creation activities such as packaging, branding,
blending, promotion, and advertising as well as standardization marks are
fairly/moderately conducted while barcoding, feed fortification, diamond mark of
quality, milling of rice flour, fortification logos are never practiced. This highlights
major entrepreneurial gaps available worth exploiting. Moreover, firm size and
stakeholders attributes is the most significant factor influencing innovative value
creation of milled rice within Mwea irrigation scheme, followed by product
attractiveness, market of the value added products, resource availability, customers’
needs and expectations, corporate culture and environment, firm’s age and maturity,
product demand and technology availability. The study recommends that, rice
processing firms need to frequently adjust their value created products in consistence
with the customers’ needs and expectations in order to create more entrepreneurial
innovative opportunities. Further, capacity building with the aim of creating value
creation skills, technology adjustment as well as promotion and advertising need to be
emphasized. Moreover, adoption of inventory management systems to enable demand
forecasting must be considered. The frequency with which market surveys are conducted
must be improved so as to identify customers’ needs and expectations and also asses
their product’s demand in the market. Other recommendations are such as, carrying out
high promotions and advertising for the value created products in order to increase sales
volume and hence general growth and improving staff skills through holding refresher
training programmes for different value creation programmes. Moreover, the researcher
advises on seeking alternative finance sources such as loans from banks, venture capital
among others in order to meet firms finance demands and expand their value creation
activities.
1
CHAPTER ONE: INTRODUCTION
1.1 Background of the Study
Innovation is not only a factor of economic efficiency but also a determinant of value
creation in various entrepreneurial ventures and their sustainability (Evelina and
Mykolas, 2013). It is a critical element that determines corporation’s ability to create
value over time (Ruben and Mercedes, 2012). According to Friday (2007), modern
business operates in a world of continuous change where risks, problems and
opportunities will always emanate hence forcing the enterprise to mobilize resources in
order to mitigate the negative effect. No enterprise or entrepreneur however successful
can continuously lead without risks. This influences the firm to innovate characterized
by venture’s innovation development speed based on the duration initiation,
development and new product delivery across the value chain by entrepreneurs (Evelina
and Mykolas, 2013). According to Miller and Friesen (1984) innovation leads to the
development of unique products which is usually inspired by the knowledge intensive
enterprise capability. However, though, the exceptional high value products enable a
firm to create customer loyalty and improving firm’s value due to enhanced competitive
advantage, value creation for agriproducts has remained low coupled with a lot
challenges.
Hansen and Birkinshaw, (2007) argue that, innovation success is seen as a process from
the idea to the outcome and it focuses on the various product value chain stages. Despite
innovating firm generating ideas, selecting the best ideas and developing new products
which it can spread across the organization, local channel and customer groups, the
sustainability of the products along the value chain has not been guaranteed. This
therefore necessitates entrepreneurial venture’s to put extra effort in order to deliver
superior performance for the desired customers through updating their consumer
products to meet the needs of customers more than existing ones with the preferable
attributes (O’Cass and Ngo, 2012; O’Cass and Sok,2013). Moreover, firm’s
innovativeness must be enhanced through proper researched differentiated products that
guarantees increase in the firm’s market size.

2
Despite the many entrepreneurial opportunities underlying the unique value created
products, innovative value creation has remained minimal with the majority of traded
products being raw. Even though Companies can produce much more value added
products for their customers and hence reduce the over-reliance on imported products, it
has not been a priority for major rice milling enterprises. Since the contributing factors
for the low value creation of the milled rice by agro-processors has not really been
evaluated nor analyzed, it therefore necessitated an in depth evaluation with the aim of
finding the solution to the above subject.
This study was based on Rodgers diffusion of innovation theory and Value chain theory
as proposed by Porter (1985). Rodger’s (2003) contends that, individuals will perceive
an innovation as new even though invented a long time ago. He, postulated that,
knowledge on the innovation process, decision and persuasion are related to innovation
(Ismail, 2006). To minimize the uncertainities of innovation adoption, Ismail (2006)
believes that, advantages and disadvantages on the innovation should be informed to the
actors for awareness creation of the consequences. Value chain theory was developed
upon the background that, a firm is more than a random composition of various actors
including machinery, people, money, and equipment (Dagmar, 2001). Development of
products which the customers will readily pay for can only be possible if these things are
arranged into systematic activities to produce business systems. Porter argues that, the
ability to undertake various activities and manage the linkages is the ultimate source of
competitive advantage.
The focus of the study was agro-processing firms dealing with milled rice across the
value chain and value creation experts within Mwea irrigation scheme. Despite the
knowledge that, increased processed food is important for agricultural market
development and can generate great benefits for the economy (Ann, 2014), there has
been consistent perishability, bulkiness, wasted entrepreneurial opportunities beside low
priced raw commodities of raw rice across the value chain within the scheme. This has
led to unrealized incomes and wasted employment opportunities within the area (Cuts,
2014).

3
The eminence of raw materials in the scheme from the milled rice which can be used for
agro-industrial processing can not only satisfy the highly growing urban market with the
growing demand for processed products but will also transform the existing single raw
product into a variety of high value products leading to variety of entrepreneurial
ventures (Ann,2014).
1.1.1 Concept of Innovation
Drucker (1985) and O’Sullivan and Dooley (2009) describe innovation as a conduit of
change. It is the means by which entrepreneurs take advantage of a change process by
converting it to an opportunity of business or service. Aiken and Hage (1986) refers
innovation as a generation, acceptance of new products and services at first instance,
implementation of new processes and ideas within an organisation setting. According to
Rasul (2003), innovation is a process where new products, processes and ideas are
developed, commercialized as well as improved in the market place. Wang and
Kafuoros (2009) recognize innovation as a value driver. However, Schumpeter (1934)
argued that, innovation is the act of applying or adoption of invention. He defined
technical change as an irreversible and historic in creative destruction and production
method of commodities. The changes are related to small (increamental) and have a key
impact on structural changes in respective industry and market segment as well as
radical changes (these are large scale).
Innovation can be an introduction of high quality products to customers, new products,
new methods to specific industry, new competition model that leads to structural
changes in the industry to which its being implemented and new raw material source.
Moreover, Godin (2008) contended innovation as a change in all spheres of life relating
to social, cultural, organizational, political and technological change. This is supported
by Vergragt (1988) and Cleraq (2004) who stipulates that, changes associated with
innovation should be considered in a social context in terms of their users. Therefore
innovation is associated with change that creates a new dimension of performance. It
involves the exploitation of new ideas that bring the creation of new product, process or
business system or management that has a significant impact on firms’ productivity and
growth.

4
Processes such as invention, innovation and diffusion must be managed efficiently if a
firm will optimally realize its potential production value. The interlink with the actors
within the product value chain need to be competitive in order to avoid the probable
threats that may arise during implementation.
1.1.2 Concept of Value Creation
Adding value is a transformation process that results into changing a product to a more
valuable state from its original state (Mike, 2009). Value also refers to, the perception of
what a product is worth versus the possible alternatives (Gautam (2016). The customer
must feel the benefit of the paid sum in acquiring the product. The customer pays not
only the price but also non price terms such as effort, energy, inconvenience and time,
(Gautam, 2016). The value the consumer perceives in the utilization of the product does
influence the evaluation and perception of the decision maker or customer.
According to Adrian (2001), value creation process has key elements such as the value
provided by the firm to its customers, value the firm receives from its clients and the
value exchange. The total package of benefits exploited from added value which
enhances the basic features of the product and the primary product is referred to as the
total value derived by the customer from the supplier organisation. Adrian (2001) also
posits that, competition exists between what companies add to their factory output in
terms of delivery arrangement, financing, advertising services, packaging, warehousing
and other things that people value but not what they produce in their factories.
In order to create superior product and customer value, the firm must evaluate the most
profitable and suitable market segment in order to identify opportunities and
(limitations) in each market segment. Where the offer made is technically identical to
the competitor’s product, differentiation of the total package in terms of market segment,
price benefit opportunities as well as the customer must be evaluated. According to
Mckinsey framework and company (2010), a firm must choose the value, provide and
then communicate the value.

5
The component of choosing the value involves understanding the customer economics,
forces driving the demand, how well the competition serves customer needs particularly
in terms of their product, price charged and the buying prices (Adrian, 2001).
To develop a product that provides clear and superior value, the firm must focus on
manufacturing cost and flexibility, channel structure and performance, product quality
and performance, price structure as well as service cost and responsiveness. In
persuading the customers that the value offered is better than the competitor’s, the firm
must engage in advertising, sales force and sales promotion but provide outstanding
service in a way that is recognised and remembered by the target audience (Mckinsey,
2010).
Many raw commodities have intrinsic value in their original state (Mike, 2009). The
process must be economically viable to produce a product either by changing the
characteristics from one set to another, current place and time preferred by the market
place. Oftenly, it may involve building processing plants in the producers’ geographical
regions to process locally produced agri-products wherever it is most feasible and
profitable, such as closer to where the final products will be marketed. Customer value
will be realized from the relationship between the price customers pay for the product
and the benefits they receive (David and Charles, 2001). The value will be higher if
benefits are more relative to price. This does not necessarily mean that, high value
emanates from a low price. If associated benefits of a product are high in addition to its
price, the customer will still perceive the value of the product. This interaction creates an
opportunity to add value to the product and hence enhancing customer value. To build a
profitable and substantial business, creating customer value is of utmost requirement.
However, it is good to note that, producers will is not very critical compared to the
customers perception of value. This perception of value will mainly emanate from the
customer’s expectation of quality, functionality for the customer’s need, the useful form,
location, ease of possession as well as the right place at the right time (David and
Charles, 2001).

6
1.1.3 Concept of Value Chain
Value chain consists of activities necessary to develop a product from its conception,
intermediate inputs, design, raw material sourcing, marketing and distribution to the
final consumer (Kaplinsky and Morris, 2000). According to Dagmar (2001), value chain
describes value adding activities interconnecting company’s supply side (production
processes, raw materials, and inbound logistics) with its demand side (sales and
marketing, outbound logistics). Porter, (1980) also defined value chain as a
representation of a firm’s value adding activities based on its cost structure and pricing
strategy. He argued that, firms have their own model chains instilled in their own value
network which individually they have different roles within the sector or industry in
which they have an influence or are impacted by other value actors in the network.
Value chain concept therefore, incorporates production, sourcing, distribution, and
beyond recycling or disposal of a given product. Various levels have different actors
who play a number of roles in meeting the consumer demand. These levels can either
have internal or external linkages. The internal linkage incorporates either the intra- unit,
inter-firm or intra-firm relationship while external has mainly inter-firm or network
relationships (Prescott, 2001).The firm’s ability to innovatively integrate the activities in
the value chain greatly determines it’s competitive advantage and hence sustained
shareholders wealth.
In analyzing the value chain, a firm can assess the information on constraints that are
currently present within the chain and the profitability of actors (Karl et al., 2009). This
also helps in identifying arrangement of institutions for targeting in enhancing capacity
distribution of remedy for distortions and increase in value added (Karl et al,. 2009).
Moreover, the analysis also evaluates the points of upgrading and improvements needed
within the chain. This improvement can be in diversification, access to new markets,
quality and product design. Further upgrading also enhances the actors innovation
capacity hence ensuring continuous improvement in product and process.
7
1.1.4 Concept of Agro-Processing
According to FAO (1997), agro processing is a value addition of products as well as
transformation that originates from agriculture, forestry and fisheries industries. It’s an
onsite growing, harvesting, processing and packaging of agricultural products and then
delivering to market as finished value added products.
UNIDO (2008) defines agro-processing as the” processing, preservation and preparation
of agricultural production for intermediate and final consumption. Drawbacks such as
low market concentration in agro-processing units, supply side constraints on (skills,
technology, infrastructure), inadequate market development incentives, restrictive
legislations, raw material supply challenges and proliferation of private standards
(DAFF, 2012) highly affect the success of agro-processing units in an organisation. This
therefore calls for value chain actors at micro and meso levels to improve their
partnership in order to enhance information sharing, promoting good practice, market
access, feedback mechanisms and inclusivity hence promoting innovativeness in product
development (CUTs, 2012).With greater market integration and increase in the size of
the middle class whose demand for processed value added products continue to increase,
a thorough scrutiny of agro-processing is highly needed considering its contribution to
the growth of the actors income, market development, food security and the economy at
large.
1.1.5 Factors Influencing Innovative Value Creation
Process and product innovations are key manifestation of innovativeness by an
organization. Even though process innovations refers to new procedures, knowledge,
tools, devices in throughput technology which intermediate between output and inputs,
product innovations relates more with the output usually introduced in order to benefit
the customer (George, 2003). A number of factors do influence innovative value
creation of products and processes within the value chain. These are either internal or
external factors or a combination of both and may fall within the framework of
organization demographics, power configuration and resource availability, product
market orientation and demand as well as technology availability ,culture and business
environment.

8
According to Nabotsa et al., (2008), the origin of ownership, industry maturity,
investment attractiveness, technological opportunities, competition intensity, size of the
company and orientation of export may have great trigger effect on innovative value
creation of a firm.
Paulina and Kenneth (2013) also postulates that, rigorous attention to input parameters
such as skilled capacity, technology, financing and quality control have a great influence
on the firm’s response to innovative value creation. How these factors internally or
externally interact with each other within the business environment greatly determines
whether the firm will successfully realize its goal sustainably, short termly or not.
Ciprian (2002) stated that, Africa has low technological levels though it’s an industrial
reality where new production units are installed with old plants and machinery which are
difficult to use for innovative production as well as slowing the processes. This therefore
necessitated more careful analytical intrigues in order to correct the scenario.
1.1.6 Mwea Irrigation Scheme
Mwea irrigation scheme (MIS) is situated in Mwea East and Mwea West Sub-county,
Kirinyaga County. It is approximately 116 kilometers, North east of capital city Nairobi
under the slopes of Mt Kenya. According to Ngige (2004), the Scheme was first
established in 1953 by the British Government and handed over to the Government of
Kenya in 1963. Currently, the scheme water infrastructure is managed by the NIB
(Government institution) while rice husbandry, marketing and other post husbandry
practices are managed by Kenya’s state department of agriculture in collaboration with
other stakeholders depending on the value chain activity (NRDS, 2008-2018).
Though the demand for value added processed rice products have continuously grown,
the supply side to meet this demand has been inflexible (Mike, 2009). The ever
expanding retail sector and the highly increased urban consumers (Giner, 2009) requires
ready to eat value added meals which provide convenience and lifestyle solutions.
Currently, the unabated wastage of the milled rice by-products as well as the current low
value creation status within the area need to be addressed with the aim of creating new
entrepreneurial opportunities.

9
1.2 Research Problem
High market competition has intensified over the years caused by foreign firms due to
the various economic blocs created by successive governments (Hebert, 2016). Opening
markets implies, sharing the local market with global players who may have competitive
advantage based on such factors like low production costs, better quality, large and
consistent volumes among others (Herbert,2016). According to Tamil (2016) the
turbulent market environment which is neither smooth, automatic nor uniform
necessitate a high innovative value creation activities across value chain stages of
production, processing and marketing for cost advantage over competing firms.
In Mwea irrigation scheme, milled rice has consistently been traded as raw product
compared to the immediate international competitors like Pakistan, India, Thailand
among others who value add their raw milled rice and by-products into exportable rice
snacks, feeds, oil among other ready to eat products (Singaravadivel, 2016). Despite the
many by-products like broken rice, bran, husks and rice germ, majority of these are sold
raw and some are disposed as wastes hence an environmental menace.
Though branded packaging has been embraced by a majority of actors as a means to
value creation, there is still a need for more innovative strategies to ensure
competitiveness. The challenge of producing consumer products that are safe from a
health viewpoint with fair price consideration, high nutrition value, origin of the
product, convenience, quality as well as taste (Blandford, 2000) has pressurized firms to
comply or be edged out from the market.
A number of research on factors influencing innovative value creation have been
conducted on sectors such as leather industry, banking, information and communication
technology, horticultural export sector and manufacturing. When Tamil (2016) carried
out a study in identifying the various rice by products in India, he found their labour
intensiveness and short shelf life as a major drawback. Ugwu et.al, (2014) in their study
on the assessment of value addition in rice production and processing in India and
Nigeria also concluded that, processing and value addition enterprises had shorter
payback period compared to farm production as it would take five to six months.

10
Mwinyikione and William, (2016) in their study on factor influencing value creation in
leather industry found that, price, technology, financing income, research and
development, competitiveness were key factors hindering the success of the industry.
Azetse (2016), in his evaluation of challenges affecting the industrial processing sector
within East Africa found that, government policy, internal and external business
environment, market access ,competency, productivity, technology initiatives, labour
and skills as well as research and development were the general key factors affecting the
manufacturing industry. The extent to which these factors apply to innovative value
creation of milled rice by agro-processors within Mwea irrigation scheme has not been
studied. This therefore necessitated the researcher to find out, “What are the factors
influencing innovative value creation of milled rice by agro-processors within rice value
chain in Mwea irrigation scheme?”
1.3 Research Objective
To assess the factors influencing innovative value creation of milled rice by agro-
processors within rice value chain in Mwea irrigation scheme.
1.4 Value of the Study
The research aimed at determining the factors influencing innovative value creation of
milled rice by agro-processors within the rice value chain in Mwea irrigation scheme.
Various stakeholders in the cereal industry will benefit from the study since they can
identify areas in need of change with reliance on the proposed specific actionable
activities that could improve competitiveness of their enterprises.
For scholars, the study provides information and knowledge on influencing factors to
innovations and innovative value creations of milled rice adopted within the value chain
as well as identify areas of further study. Moreover, the Policy makers will also obtain
knowledge of value creation in rice sector and hence design appropriate policies that
regulate the sector. The evaluation of the competitiveness of innovated products may aid
in assisting the agro-processing entrepreneurs develop result oriented competitive edge
so as to create utility optimization for the customers and hence improve profitability.
11
CHAPTER TWO: LITERATURE REVIEW
2.1 Introduction
This chapter explores the theoretical framework of the study based on Value chain
theory and Rodgers Diffusion of innovation theory. An insight on the factors influencing
innovative value creation in relation to the research area within the value chain has also
be covered ending with the conceptual framework of the study.
2.2 Theoretical Foundation of the Study
This study was informed by Rodgers Diffusion Innovation theory and Value chain
theory as proposed by Porter (1985).
2.2.1 Rodgers Diffusion of Innovation Theory
This theory seeks to explain the how, why, and what rate of new ideas and technology
spread. It was popularized by Everett Rodgers in 1962 (Ismail, 2006). According to
Rodger’s (2003), innovation diffusion is a process in which innovativeness is
communicated across channels through members of a social system over time (Rodgers,
2003). The communication channel, time, social system and innovation itself were
identified as four key elements of innovation diffusion. Rodger’s, (2003) also argued
that, an innovation being perceived as new by an individual may still be an innovation
for them even though it may have been invented a long time ago. He contends that,
innovation is highly related to the decision and persuasion of innovation process and
knowledge (Ismail, 2006).
In minimizing the uncertainties of adopting the innovation, Rodgers (2003) believed in
communicating to the actors on the innovation merits and demerits with the aim of
creating awareness of the consequences, (Ismail, 2006). He classified consequences to
be desirable or undesirable, functional or dysfunctional, direct or indirect and anticipated
versus unanticipated.
12
According to Rodgers (1995), adopter characteristics of the innovators were such as
(Slow process-2.5%), early adopters (gradual growth-13.5%), early majority (34%), late
majority (34%) and the laggards (16%) as classified in the time element. The relevance
of this model in relation to the study is greatly captured on Rodgers (2003) proposed
innovation attributes which he earmarked to reduce diffusion uncertainty. These
consisted of; observability, compatibility, innovation relative advantage, complexity,
triability and adoption rate of the innovation.
2.2.2 Value Chain Theory as Proposed by Porter (1985)
Porter’s (1985) theory is used to explore firm’s competitive advantages through
differentiation or cost leadership strategy. He breaks company’s value chain down into
individual activities with the aim of allowing the firm conceptualize which parts of its
operation creates and doesn’t create value (Ketchen and Hult, 2007). According to
Herget and Morris (1989), goods and services will improve their worth as they go
through the vertical streams of firm’s production process. The profit or margin will be
generated if improved value exceeds the costs.
Porter (1985) distinguished the firm’s support activities and primary activities. Those
involved in physical creation of the product, distribution and sales as well as after sales
service were referred to as primary activities. They mainly consist of sales and after
sales service, market interrelations, outbound logistics, marketing, inbound logistics,
operations and product interrelations (Ireland et al. 2009; Mowen and Hansen, 2011).
Moreover, primary activities are involved in value adding activities which are seen by
customers as improving utility to the product which they purchase (Lanen et al. 2008).
Support activities provide assistance necessary for primary activities. This mainly
involves the technology interrelations (technology development), procurement
interrelations (procurement) as well as infrastructure interrelations such as firms’
infrastructure and human resource management (Lanen et al., 2008).

13
The relationship of this model with the proposed study is that, value chain is maximized
with minimal costs while all the activities of the company are linked efficiently
together, This has always been the ultimate target of a well-planned value chain
(Lynch, 2003). The result of adding together the total value and the cost of creating
value is according to Porter, (1985) the margin.
Total value is referred to as the price the customer is willing to pay (Macmillan and
Tampoe, 2000). The organisation culture according to Johnson et al. (2008) has a great
impact in creating value since culture is the way people perform their activities and
should be difficult to copy especially by competitors. This model however, according to
Morden, (1999), excluded certain key aspects such as market creation, strategy,
customer service and distribution from the main service. The service can also not be
stored as per Porter, (1985) recommendation.
2.3 Factors Influencing Innovative Value Creation
Various factors influence firms’ incentive and ability to innovatively carry out various
product value creation activities (Ebrd, 2014). Some of these factors are internal
reflecting either characteristics of the firm (its size or age for instance) or the decisions
made by the firm (for example, decision to compete in a regional market or to hire
skilled workforce). Other factors are external which shape the general business
environment in which the firm operates (such as customs and trade regulations).
2.3.1 Firm’s Age or Maturity
Companies compete as per their product differentiation and strongly invest in product
innovation soon after the birth of new industries (Aberinthy, 2000). They then shift the
focus of competition to economies of investing more in a range of business processes
and expenses in order to make them more effective and efficient as market matures. This
happens as customer needs become more defined in a better way. Klepper (1996) argues
that, there is more focus on processes innovation than product innovations for mature
companies.
14
The development level and innovation model assist the managers to understand
innovation category and measures for consideration at different times of their
development and different competitive surrounding. However according to Christensen
(2003), disruptive innovations may alter this hence forcing the company to start afresh
since different aptitudes will be needed altogether.
According to EBRD (2014), innovative startups that grow very fast may run out of
funding and exit the market. Moreover not all young small firms may be innovative
value creators. Value creation may be high amongst large established firms compared to
young ones due to financial capability, affordability to research and development as well
as market promotion budgets (EBRD, 2014).
2.3.2 Firm’s Size and Stakeholder Attributes
Upon the increase in size of an organization, it may lose its enthusiasm to innovate and
hence require a more elaborate control mechanism (Miller et al., 1988). This Oftenly
turns them from product innovation to process innovation (Gopalakrishnan et al., 1999).
The stakeholder attribute becomes more pronounced in such a case hence affecting the
management action which may lower the quest for product innovation in a complex and
unpredictable business environment (George, 2003). However, large firms may put
increased resources for value creation efforts. They may also venture in more elaborate
research and development due to their financial capability hence promoting their level of
value created products.
2.3.3 Customer Needs and Expectation
Firms with customer orientation are able to measure their customer satisfaction level
through being responsive to their needs (Nebojsa et al., 2008). According to Hippel’s
(1988), the leading product users face the needs that will appear in the market months
and years after others. They also have an aptitude to express future needs as the function
of their experience (Hippel’s, 1988). This aids the firms to consolidate important
information that help them explore latent needs.

15
However, Christensen (2002) argued that, company’s aptitude to innovate can be limited
by consistent focus on existing customers hence managers deviating from being keen to
serve new customers. Market oriented companies should focus on potential customers
beside existing ones in addition to their latent needs. This is done by collecting market
information anticipatively.
2.3.4 Resource Availability
Resource availability in terms of finances, Information, and expertise usually determine
how a firm will react to various forces influencing it in creating value through
innovative products. Centralized and systematically controlled budget, with clear
defined job and technology exclusion contributes negatively to innovation and value
creation (Hardy and Dougherty, 1997). If information is made available with intimate
sharing and contributors to innovations being well rewarded, the firm’s employees will
be more than willing to add value to the firm’s product and processes.
2.3.5 Product Attractiveness
Product attractiveness to investors will pull support from investors depending on
whether they will recoup returns on the investment or not (Nebojsa et al., 2008). This
influences the type of innovation to adopt in order to guarantee market acceptability and
sustainable income generation. Investors will be wary of making huge investments to
process innovations, information technology, organization structuring, training programs
and consultancy services to avoid disappointments and failures’ hence necessitating risk
assessment before resource commitment is done.
2.3.6 Product Demand
Product demand is also a key determinant of value creation. It determines the rate and
activities of an invention because each rational company that intends to make profit
margin is responsive to economic stimuli (Nebojsa et al., 2008). The demand
characteristics such as; selling potential, demand growth, demand duration,
indefiniteness and elasticity are very core in demand consideration.
16
Customer needs and demand usually determines the variety of innovation to be adopted.
The benefits that innovation brings are proportionate to market size (Cohen, 1995). A
company can influence a great deal of innovation decision if it estimates that, sale
potential will be small and a considerable growth rate cannot be expected.
2.3.7 Market of the Value Created Product
According Guerzone (2007), companies find it profitable to invest in process innovation
when mass markets are in question. This can be mass market for consumer goods or
standardized products. Due to low level of product sophistication, they find it better to
carry out process innovation and use the market size than follow the much complicated
strategies of product differentiation (Nebojsa, 2008). Innovation is also oriented
towards creation of varieties especially in niche markets. The smallness in size for such
markets do not allow process innovation due to its costly nature and inability to recover
fixed costs involved to process products.
Value created products users are conscious of their needs and frequently assists the
processors with feedback on designs which results to innovative solutions. This also
increasingly leads to increamental radical innovations within the responsible firms.
Firms must collect regular market information with the anticipation of analyzing
probable market sources, current customer requirement and future customer orientation.
2.3.8 Technology Availability
Schumpeter (1934) argued that, entrepreneurs are led by technological opportunities.
However, the direction and the rate of technology change due to technology push is
defined by appropriateness of technology in special industry usage but not by demand
(Cohen, 1995; Goldenberg et al, 2001). The dimension of technological opportunity are;
technological importance, technological performances and technically feasibility. The
latter is technological correctness and completeness on an invention as well as
technology indefiniteness that present research and development future planned actions
in solving the current problem (Astebro and Dahlin, 2005).

17
Technology drives scientific knowledge which influences research and innovation.
Importance and performance of these dimensions may lead to disruptive radical
innovations usually a very high return area for entrepreneurs (Scott, 2015). Technology
can also be critical, enabling and strategic Research and development drives technology
which in turn drives innovative measures within a company.
2.3.9 Corporate Culture and Environment
Business climate and culture determines the leadership style, typical behavior, values
and norms which drives or limits the performance of value added products (Scott, 2015).
The major setback is ensuring a balance between judgment and flexibility, focus and
discipline and managing cross functional teams while driving the project to successful
completion (for example; gaps in required skills and experience, inadequate professional
project leaders and turnover of staff). The Belief structures, culture and nature of
specialization may affect top managers in carrying environmental business intelligence
that may have an implication on test marketing its products. According to Hambrick and
Finkelstein (1987), the nature of business environment in which the organization operate
is perceived to restrict or constrain choices available to top managers’ discretion hence
affecting how a firm treats its innovativeness.
2.4 Empirical Review of Innovative Value Creation
Scania (2016) found that, putting the customer first, high level investment in research
and development, efficiency production as well as stakeholder value are core attributes
to great profitability. Jozsef (2015) in studying value creation and capturing within agro-
food small medium enterprises in Hungary observed that, receipt of more improved
goods or services by consumers will contribute to high purchases of the respective goods
and services. Moreover, improved productivity with less cost by producers contributes
to enhanced supply of the respective goods and if both conditions apply simultaneously,
it contributes to increased competitiveness of the enterprise.
18
According to Mwinyikione and William (2016) in their study on the same subject but in
the leather industry in Kenya concluded; price, technology, financing income, research
and development, competitiveness were key factors hindering the success of innovative
value creation in the industry. When evaluating the challenges affecting the industrial
processing sector within East Africa, Azestse (2016) placed government policy,
financing, internal and external business environment, market access in terms of
international, regional and local, management competency, productivity, technology
initiatives, labour and skills, research and development, political climate, ethics and
integrity as core general factors affecting the manufacturing industry.
Though a number of research have been conducted on innovative value creation within a
number of value chains, this has not been carried out within the context of the study. The
recommendations such as the interdependence of final users, multiple buyers of the
firm’s products, optimized beneficiaries through collaboration, enhanced regulations and
standards through certifications and infrastructure by Milena etal., 2015 need to be
evaluated in order to see their success effect on innovative value creation of milled rice
by agro-processors within the rice value chain.
2.5 The Conceptual Framework
The study objective was to determine the factors influencing innovative value creation
of milled rice by agro-processors within rice value chain in Mwea irrigation scheme.
Conceptual framework postulates how the independent variables which falls within the
firm’s age or maturity, firm size, stakeholder attributes, customer needs and
expectations, resource availability, product attractiveness, product demand, market of
the value created product, technology availability as well as corporate culture and
environment influences the value creation of milled rice by improving either the form,
location, time, possession and information value. The value created can also be basic or
advanced.

19
The below figure shows researcher’s own conceptualization of the study area.
Independent
Dependent variable
Figure 2.1: Conceptual Framework
Source: Researcher’s Own conceptualization
Firm’s age
or maturity
Firm’s size
and
stakeholder
attributes
Customer
needs and
expectation
Resource
availability
Corporate culture
and
Environment
Innovative value creation
Basic - Location -Form
Advanced - Time -Ownership/Possession
No Value - Information
Product
demand
Product
attractiveness
Market of the value
created product Technology
availability
20
CHAPTER THREE: RESEARCH METHODOLOGY
3.1 Introduction
This chapter highlights the methodology that was used by the researcher in answering
the research questions. It features the area of study, research design, and target
population, sampling procedures, sample size, data collection instruments as well as the
validity and reliability of instruments. Moreover, it shows the researcher’s data
collection procedures, analysis techniques and ethical considerations.
3.2 Research Design
Research design is a framework, plan and a structure to carry out investigation in order
to get a relationship and answers among study variables or phenomena (Coopers &
Schindler, 2005). In this study, the researcher used a descriptive cross section survey
where data was collected at one point in time from a sample to depict a population. The
researcher’s intention to use this design was mainly based on factors such as the design’s
economic considerations, rapid data collection and its ability to understand a population
from a sample as well as its suitability to support extensive research (Oso and Onen,
2009). Both qualitative and quantitative data were collected to aid in analyzing the
factors that influence value creation of milled rice within rice value chain in Mwea
irrigation scheme.
3.3 Target Population
Target population is that population to which the researcher wants to generalize the
results of the study (Odoyo, 2013). However, due to resource or logistical constraints,
researchers sometimes draw samples from “accessible populations” as long as the
validity of target population is maintained (Mugenda and Mugenda, 2003). The
researcher’s target population consisted of 139 rice agro-processing value chain actors
within Mwea irrigation scheme as per MOA et al., (2017) updated inventory.

21
3.4 Sampling Design
Sampling design is a definite plan for obtaining a sample from a given population. It
lays out the confidence level for the estimate, total number of items for inclusion into the
sample, population parameters interested on for consideration prior to determining the
methods of data collection. The researcher used a mixture of proportionate stratified
sampling and purposive, judgmental technique to determine the agro-processing actors
in this research so as to yield a balanced and a more generalized outcome. According to
Mungai (2013), sample size may not necessarily be calculated but is a matter of
judgment. Judgmental sampling was used in selecting the respondents. The required
sample size is dependent on the statistical analysis employed (Mendenhall & Sincich,
2003) and has a direct impact on the power of research. The researcher proposed a
sample size of 50% of the total population in order to have full representation. However
oversampling of all the 5 large scale processors were considered hence resulting to a
sample size of 72 rice agro-processing actors.
Table 3.1: Target Sample Size
Agro-processing units Target population Percentage (%) Sample
Large scale processors
(>1000 Tonnes/per year
5 100 5
Medium scale processors
(100 -1000Tonnes/per year
10 50 5
Small scale processors
< 100 tonnes per year
100 50 50
Individual group members 4 50 2
Technical experts 20 50 10
Total 139 72
Source: Developed by the researcher as per MOA, ASDSP, and RiceMAPP agro-
processors inventory year 2017.
22
3.5 Data Collection
The researcher used primary data collection method. Due to their simplicity in
administering and cost efficiency (Kothari, 2004), structured questionnaires with closed
questions were used to collect data. In data capturing, the researcher administered the
questionnaire through face to face.
The questionnaire was structured into three sections. The first section was the general
demographic information of the agro-processor. Section B indicated the value creation
activities which the agro-processors undertake in his or her firm. Section C outlined the
various factors influencing innovative value creation of milled rice by agro-processors
within rice value chain in Mwea irrigation scheme. The responses were devised in terms
of Likert scale where scale 1 was the least preferred and 5 as the most preferred.
3.6 Data Analysis
Data analysis is the manipulation, summarizing, ordering and categorizing data with the
aim of answering research question (Odoyo, 2013). The collected data was analyzed
using descriptive statistics techniques and factor analysis method through a Statistical
package for social Sciences (SPSS) computer programme.
Numbers, tables, graphs and figures were used to organize, describe, summarize and
present raw data (Kothari, 2004). These helped in examining the central tendency,
variability (Dispersion), skewness of data and kurtosis. Factor analysis was then
conducted in order to conclusively analyze the factors influencing innovative value
creation of milled rice by agro-processors within rice value chain in Mwea irrigation
scheme.
23
CHAPTER FOUR: DATA ANALYSIS, RESULTS AND DISCUSSION
4.1 Introduction
This chapter presents the findings, interpretation of results based on the study objective,
and discussion of the findings. The objective of the study was to assess the factors
influencing innovative value creation of milled rice by agro-processors within rice value
chain in Mwea irrigation scheme. The chapter begins with general information, followed
by value addition activities and factors influencing innovative value creation of milled
rice, factor analysis and discussion of the finding.
The sample size of this study was 72 rice agro-processing actors, who included large
scale processors, medium scale processors, small scale processors, group representatives
and technical experts. Out of 72 rice agro-processing actors, 67 responses were obtained,
which accounted a response rate of 93.05%. According to Bryman and Bell (2011), a
50% and above response rate is adequate for analysis and the results can be used in
making inferences and conclusions.
4.2 General Information
The general information of the rice agro-processing actors comprised of category of
agro-processor, age bracket, gender, level of education and registration status of the
business.
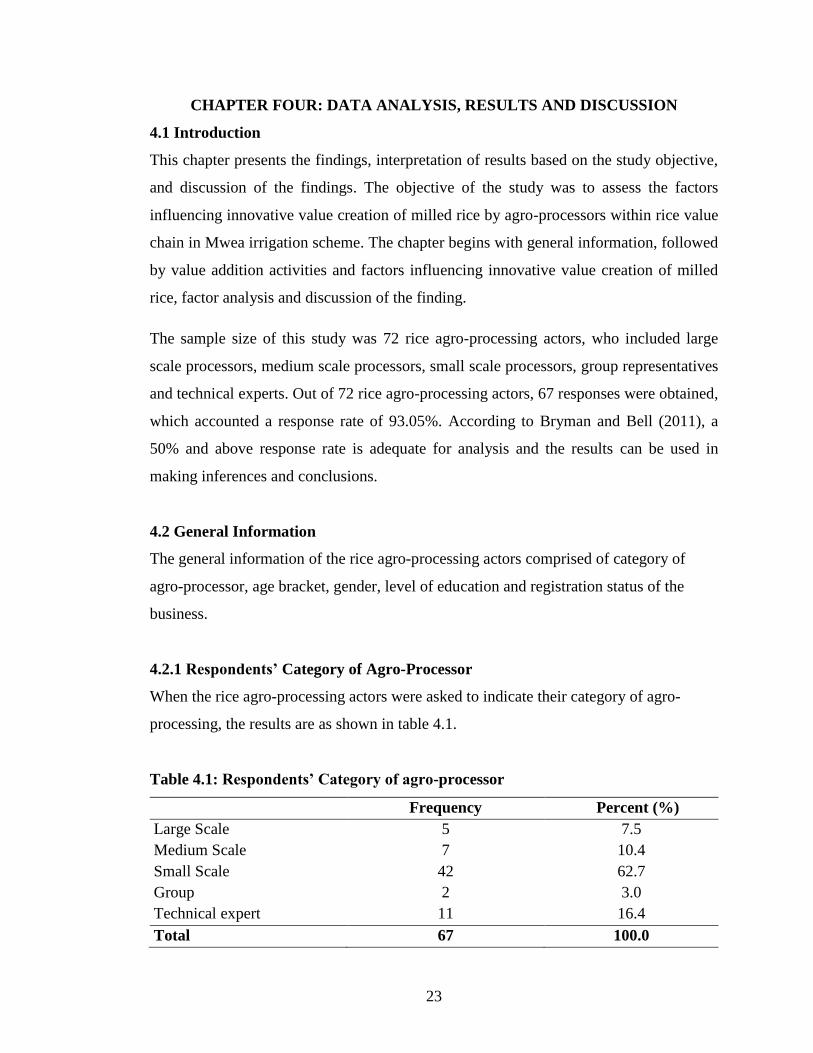
4.2.1 Respondents’ Category of Agro-Processor
When the rice agro-processing actors were asked to indicate their category of agro-
processing, the results are as shown in table 4.1.
Table 4.1: Respondents’ Category of agro-processor
Frequency Percent (%)
Large Scale 5 7.5
Medium Scale 7 10.4
Small Scale 42 62.7
Group 2 3.0
Technical expert 11 16.4
Total 67 100.0
24
From the findings, 62.7% of the rice agro-processing actors indicated that, they were
small scale processors, 16.4% technical experts, 10.4% medium scale processors, 7.5%
large scale processors and 3.0% were groups. This implies that most of the rice agro-
processing actors in this study were small scale processors and hence small medium
enterprises.
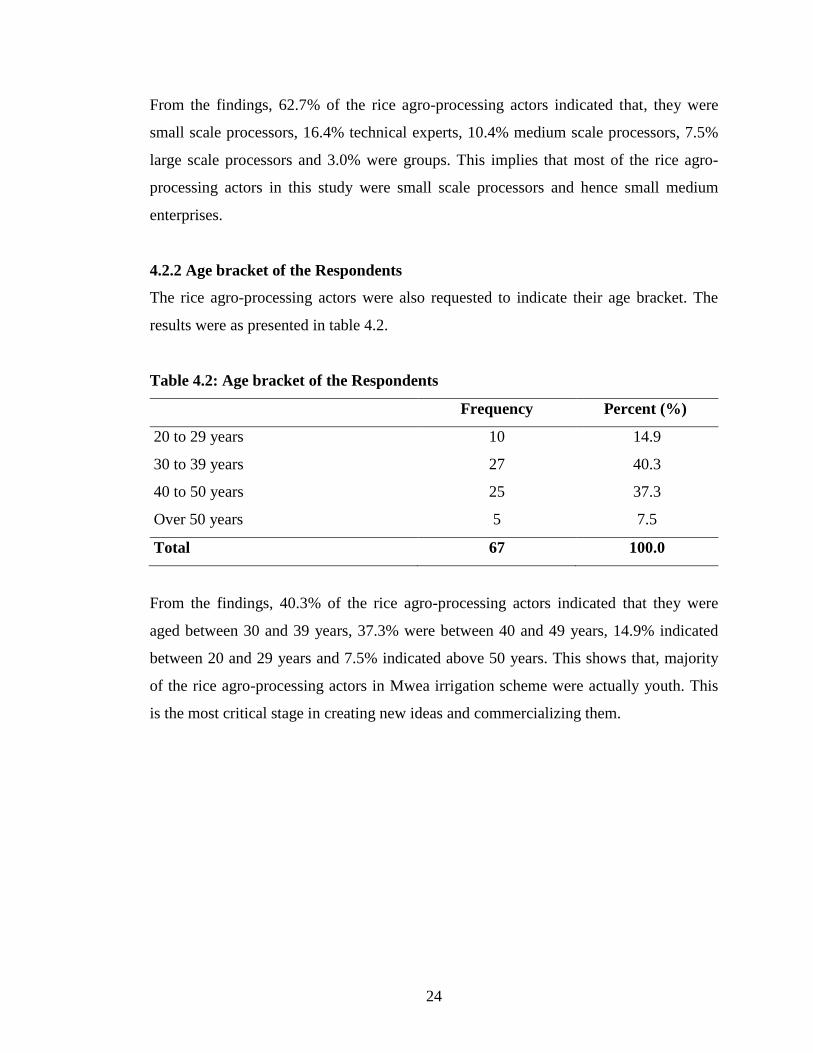
4.2.2 Age bracket of the Respondents
The rice agro-processing actors were also requested to indicate their age bracket. The
results were as presented in table 4.2.
Table 4.2: Age bracket of the Respondents
Frequency Percent (%)
20 to 29 years 10 14.9
30 to 39 years 27 40.3
40 to 50 years 25 37.3
Over 50 years 5 7.5
Total 67 100.0
From the findings, 40.3% of the rice agro-processing actors indicated that they were
aged between 30 and 39 years, 37.3% were between 40 and 49 years, 14.9% indicated
between 20 and 29 years and 7.5% indicated above 50 years. This shows that, majority
of the rice agro-processing actors in Mwea irrigation scheme were actually youth. This
is the most critical stage in creating new ideas and commercializing them.

25
4.2.3 Respondents’ Gender
The rice agro-processing actors were further requested to indicate their gender. The
results were as presented in table 4.3.
Table 4.3: Respondents’ Gender
Frequency Percent (%)
Male 36 53.7
Female 31 46.3
Total 67 100.0
According to the findings, 53.7% of the respondents were male while 46.3% indicated
they were female. This implies that, most of the rice agro-processing actors within the
scheme were of the male gender. However the difference was very insignificant and may
have been inflicted by the barriers women face in enterprise management and
operations.
4.2.4 Respondents’ Level of Education
The rice agro-processing actors were also requested to indicate their level of education.
The results were as shown in table 4.4.
Table 4.4: Respondents’ Level of education
Frequency Percent(%)
Primary 2 3.0
Secondary 29 43.3
Certificate 18 26.9
Diploma 9 13.4
Degree 9 13.4
Total 67 100.0

26
According to the findings, 43.3% of the respondents reported that they had secondary
education, 26.9% had certificates, 13.4% had diplomas, 13.4% again had degrees and
3% indicated that they had primary education. This shows that, most of the rice agro-
processing actors in Mwea irrigation scheme had secondary education as their highest
level of education. It also inferenced that, majority of higher education graduates had not
embraced entrepreneurship despite more education skills being related to good business
management.
4.2.5 Registration Status of the Business
The rice agro-processing actors were also requested to indicate the registration status of
their businesses. The results were as shown in table 4.5.
Table 4.5: Registration status of the business
Frequency Percent (%)
Social Services 11 16.4
Registrar of companies 13 19.4
Not registered 2 3.0
County government 41 61.2
Total 67 100.0
According to the findings, 61.2% of the respondents indicated that their businesses had
been registered by the County Government, 19.4% indicated registrar of companies,
16.4% indicated social services and 3% indicated that their businesses had not been
registered. This implies that, most of the businesses dealing with rice agro-processing in
Mwea irrigation scheme were registered with the County government and hence are
compliant with the legal requirement in doing business activities.

27
4.2.6 Number of Years Worked in Rice Agro-Processing/Value Creation
The rice agro-processing actors were asked to indicate the number of years they had
worked in rice agro-processing/value creation. The results were as shown in table 4.6.
Table 4.6: Number of Years Worked in Rice Agro-Processing/Value Creation
Frequency Percent (%)
Less than 2 years 7 10.4
2 to 3 years 15 22.4
4 to 5 years 20 29.9
More than 5 years 25 37.3
Total 67 100.0
From the findings, 37.3% of the respondents indicated that they had been in rice agro-
processing/value creation businesses for more than 5 years, 29.9% indicated for between
4 and 5 years, 22.4% indicated for between 2 and 3 years and 10.4% indicated for less
than 2 years. This implies that most of the rice agro-processing actors were experienced
and had been in the industry for more than 5 years. The learned business pitfalls as a
result of experience gained for 5 years could have contributed to the sustained value
creation operations (Swartz, 1976).
4.2.7 Continuous Engagement in Value Creation Activities
The respondents were asked to indicate whether their enterprises had continuously
engaged in value creation activities. The results were as presented in table 4.7.
Table 4.7: Continuous Engagement in Value Creation Activities
Frequency Percent (%)
Yes 42 62.7
No 25 37.3
Total 67 100.0

28
According to the findings, 62.7% of the rice agro-processing actors indicated that, their
businesses had continuously engaged in value creation activities because of raw
material availability (husks, bran and rice), clients availability to purchase products,
increased revenue, utilization of other rice by products, financial capability, availability
of machine and equipment and good managerial skills.
However, 37.3% indicated that their businesses had not been continuously engaged in
value creation activities for the last three months due to machine breakdown, financial
difficulties, lack of operators to undertake processing activities, lack of licenses, lack of
processing equipment and poor group integration.
4.2.8 Growing Status of the Enterprise
The rice agro-processing actors were further asked to indicate the current growing status
of their enterprises. The results were as shown in table 4.8.
Table 4.8: Growing Status of the Enterprise
Frequency Percent (%)
Increasing 52 77.6
Decreasing 3 4.5
Static 12 17.9
Total 67 100.0
From the findings, 77.6% of the rice agro-processing actors indicated that their
businesses had been increasing hence growing, 17.9% indicated that they were static
hence neither growing nor declining and 4.5% indicated that the business was declining.
This finding imply that, though the majority of enterprises were actually growing, most
of this growth was actually from the basic value creation but not through secondary or
advanced value. Most of these were actually not done despite their entrepreneurial value.
29
4.3 Innovative Value Creation Activities
The rice agro-processing actors were requested to indicate the types of value creation
activities undertaken or processed by their firms/ groups. The value creation activities
provided included packaging, branding, blending, promotion and advertising,
standardization marks, fortification logos, barcoding, diamond mark of quality, flour,
baking, feed formulation and briquette making.
Packaging in this study refers to the wrapping material around the value created rice
product and byproduct that serves to identify, display, contain, promote, protect,
describe, or otherwise make the product marketable and keep it clean (Baker, 1985).
Blending is mixing or combining different value created rice varieties, grades and
byproducts in order to obtain a product specific of character, quality and consistency as
per the customer or seller requirement (Kotler, 2000).
Advertising is bringing the value created rice product to the attention of potential and
current customers while promotion aims at keeping the product in the minds of the
customer and help to stimulate the demand (Schewe et al., 1983). Signs, brochures,
commercials, direct mailings or email messages as well as personal contacts are the
ways used in advertising. Publicity (media and press releases), advertising, sales and
public relations are some of promotion activities.
Standardization mark is a mandatory mark of quality on all locally manufactured goods
complying with the relevant standards (Kebs, 2016). Moreover, rice flour is a value
created rice product ground from white polished and brown rice (MOA, 2016). It is free
from gluten and is non-allergenic. This flour is used to produce rice pasta, cookies and
other baked products once blend. The barcodes are machines readable codes in the form
of numbers and pattern of parallel lines of varying widths printed on the product and
used especially for stock control (James, 2016).These enable the retail value creation
enterprises to supply their products to supermarkets.
White rice is milled rice whose husk, bran and germ have been removed. This changes
the texture, appearance, flavor of the rice, prevents spoilage and prolongs the shelf life.
The polished rice result to a seed with a bright, white, shiny appearance (Ukr, 2016).
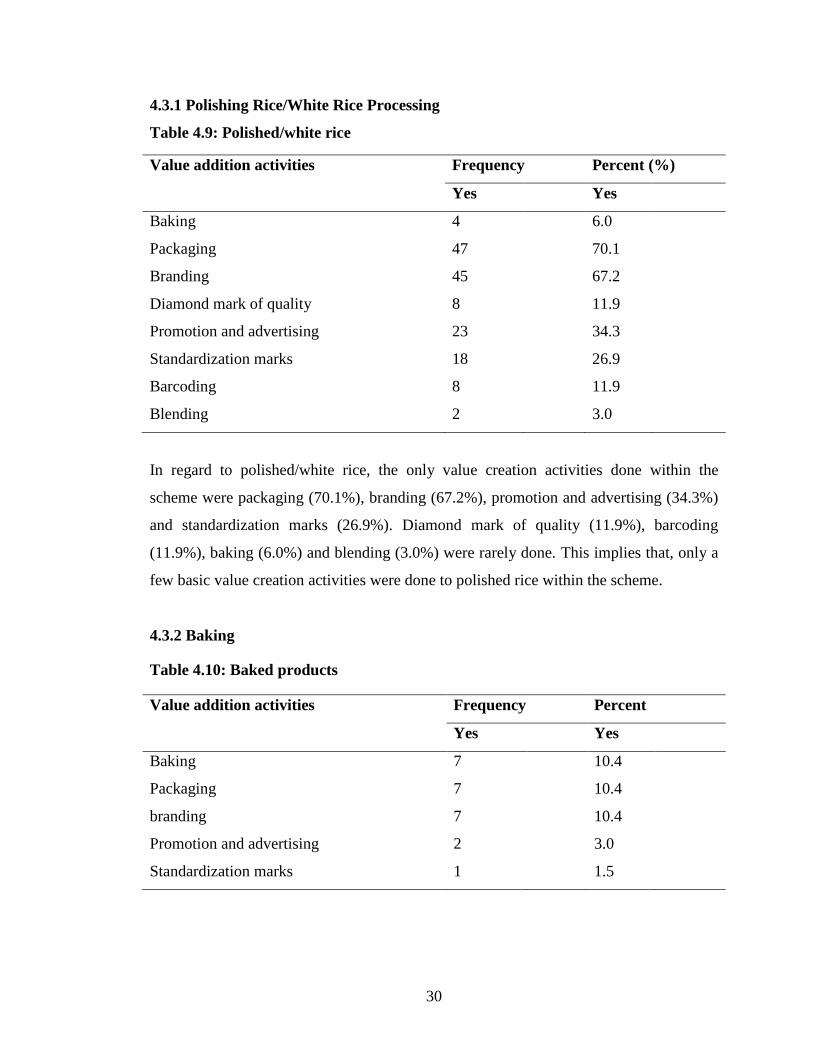
30
4.3.1 Polishing Rice/White Rice Processing
Table 4.9: Polished/white rice
Value addition activities Frequency Percent (%)
Yes Yes
Baking 4 6.0
Packaging 47 70.1
Branding 45 67.2
Diamond mark of quality 8 11.9
Promotion and advertising 23 34.3
Standardization marks 18 26.9
Barcoding 8 11.9
Blending 2 3.0
In regard to polished/white rice, the only value creation activities done within the
scheme were packaging (70.1%), branding (67.2%), promotion and advertising (34.3%)
and standardization marks (26.9%). Diamond mark of quality (11.9%), barcoding
(11.9%), baking (6.0%) and blending (3.0%) were rarely done. This implies that, only a
few basic value creation activities were done to polished rice within the scheme.
4.3.2 Baking
Table 4.10: Baked products
Value addition activities Frequency Percent
Yes Yes
Baking 7 10.4
Packaging 7 10.4
branding 7 10.4
Promotion and advertising 2 3.0
Standardization marks 1 1.5
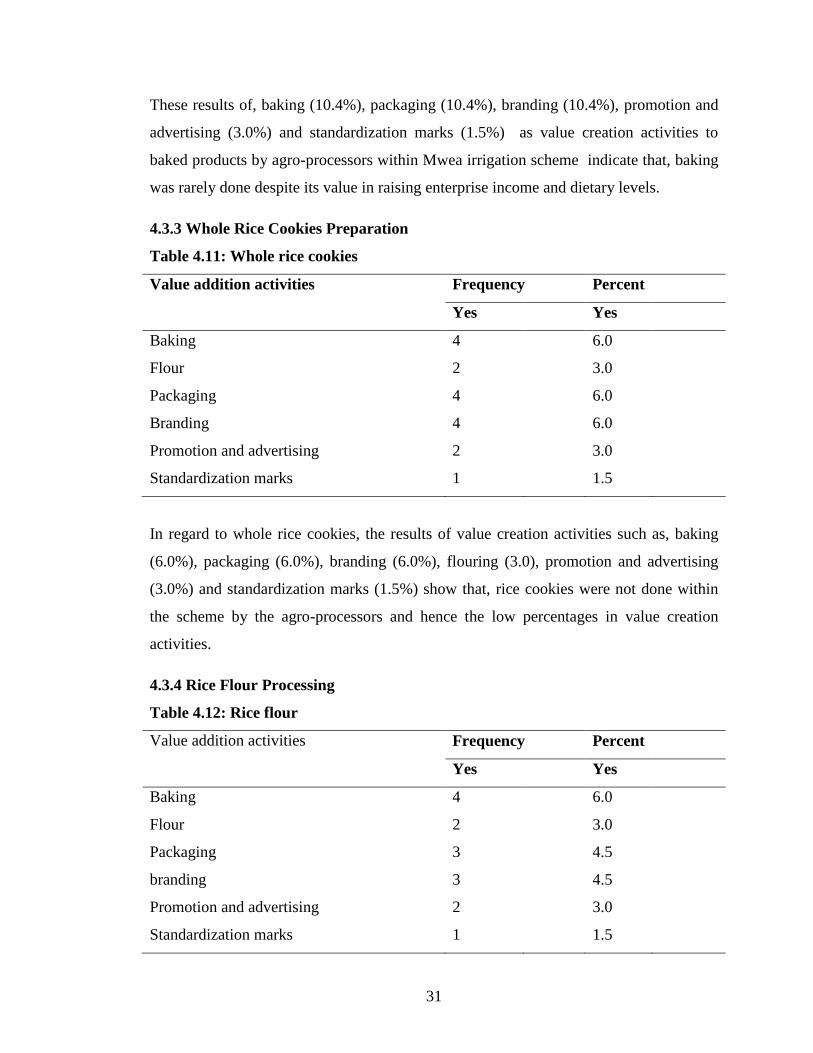
31
These results of, baking (10.4%), packaging (10.4%), branding (10.4%), promotion and
advertising (3.0%) and standardization marks (1.5%) as value creation activities to
baked products by agro-processors within Mwea irrigation scheme indicate that, baking
was rarely done despite its value in raising enterprise income and dietary levels.
4.3.3 Whole Rice Cookies Preparation
Table 4.11: Whole rice cookies
Value addition activities Frequency Percent
Yes Yes
Baking 4 6.0
Flour 2 3.0
Packaging 4 6.0
Branding 4 6.0
Promotion and advertising 2 3.0
Standardization marks 1 1.5
In regard to whole rice cookies, the results of value creation activities such as, baking
(6.0%), packaging (6.0%), branding (6.0%), flouring (3.0), promotion and advertising
(3.0%) and standardization marks (1.5%) show that, rice cookies were not done within
the scheme by the agro-processors and hence the low percentages in value creation
activities.
4.3.4 Rice Flour Processing
Table 4.12: Rice flour
Value addition activities Frequency Percent
Yes Yes
Baking 4 6.0
Flour 2 3.0
Packaging 3 4.5
branding 3 4.5
Promotion and advertising 2 3.0
Standardization marks 1 1.5

32
The response on value creation activities relating to rice flour processing such as, baking
(6.0%), packaging (4.5%), branding (4.5%), flour processing (3.0%), promotion and
advertising (3.0%) and standardization marks (1.5%) imply that, rice flour processing
was not done within the scheme despite the probable innovative baked products that can
be derived from it.
4.3.5 Rice Blending
Table 4.13: Blended rice
Value addition activities Frequency Percent
Yes Yes
Baking 2 3.0
Packaging 24 35.8
branding 21 31.3
Diamond mark of quality 1 1.5
Promotion and advertising 5 7.5
Standardization marks 3 4.5
Barcoding 5 7.5
Grading 1 1.5
In regard to blended rice, packaging (35.8%) and branding (31.3%) were the most
common value creation activities done within the scheme. Promotion and advertising
(7.5%), barcoding (7.5%), standardization marks (4.5%), baking (3.0%), diamond mark
of quality (1.5%) and rice grading (1.5%) were rarely carried out as evidenced by the
low percentages.
4.3.6 Feeds Formulation
Table 4.14: Feeds
Value addition activities Frequency Percent
Yes Yes
Packaging 5 7.5
Branding 5 7.5
Fortification logos 8 11.9
Standardization marks 1 1.5
Barcoding 1 1.5

33
The results of value creation activities relating to feeds such as, installing fortification
logos (11.9%), packaging (7.5%), branding (7.5%), standardization marks (1.5%) and
barcoding (1.5%) indicate that, rice feeds formulation was rarely practiced within the
scheme.
4.3.7 Rice Husk Briquetting
Table 4.15: Rice husk briquettes
Value addition activities Frequency Percent
Yes Yes
Packaging 2 3.0
Branding 1 1.5
Diamond mark of quality 1 1.5
Promotion and advertising 2 3.0
In relation to rice husk briquettes, value creation activity results of , packaging (3.0%),
promotion and advertising (3.0%), branding (1.5%) and diamond mark of quality (1.5%)
implies that, rice husk briquetting was not done within Mwea irrigation scheme despite
its entrepreneurial importance in providing energy to the various valuable activities.
4.3.8 Making of Rice Biscuits
Table 4.16: Rice biscuits
Value addition activities Frequency Percent
Yes Yes
Baking 3 4.5
Packaging 4 6.0
Branding 2 3.0
Promotion and advertising 2 3.0
Standardization marks 1 1.5
The results of value creation activities like, packaging (6.0%), baking (4.5%), branding
(3.0%), promotion and advertising (3.0%) and standardization marks (1.5%) indicate
that, rice biscuits were rarely done within the scheme.

34
4.3.9 Deep Frying of Baked Products
Table 4.17: Deep fried products, Body Powder and Rice Bran Oil
Value addition activities Frequency Percent
Yes Yes
Deep fried products
Baking 9 13.4
Packaging 5 7.5
Branding 3 4.5
Promotion and advertising 2 3.0
Body powder
Fortification logos 1 1.5
Rice bran oil
Promotion and advertising 2 3.0
Rice bran oil: Standardization marks 1 1.5
In regard to deep fried products, the value creation activity results of Baking (13.4%),
packaging (7.5%), branding (4.5%), promotion and advertising (3.0%) implies that,
there is no deep frying of any baked products within the scheme. In relation to body
powder, the value creation activity result of, fortification logos (1.5%) indicate that,
body powder was also not done by agro-processors within Mwea irrigation scheme.
Regarding rice bran oil, value creation activity result of, promotion and advertising
(3.0%) and standardization marks (1.5%) indicate that, rice bran oil was not done within
the scheme and was still at promotion stage despite its organic properties and
entrepreneurial value.

35
4.4 Factors Influencing Innovative Value Creation of Milled Rice
4.4.1 Firms Age of Maturity
The respondents were asked to indicate the extent to which they agreed with the
following statements on firm’s age or maturity. Where 5 was very great extent, 4 was
great extent, 3 was moderate extent, 2 was low extent and 1 was no extent at all.
Table 4.18: Firms Age or Maturity
Mean Std.
Deviation
I have introduced more products since the start of the enterprise 3.0448 .78688
I have introduced more packaged products since start of the
enterprise 3.1045 .85519
I have introduced more blended products since the start of the
enterprise 2.9851 .72806
I have introduced more branded products since the start of the
enterprise 3.1791 .85148
Total processing expenses increased with growth of the
enterprise 3.4328 3.78683
Method of processing has become more complex with more
new products made 2.8507 1.13155
Overall Mean 3.0995
From the findings, the rice agro-processing actors agreed to a moderate extent that total
processing expenses had increased with growth of the enterprise as shown by a mean of
3.4328. They also indicated with a mean of 3.1791 that, more branded products had
moderately been introduced since the start of the enterprise. The rice agro-processing
actors also indicated with means of 3.1045 and 2.9851 that, they had moderately
introduced more packaged products since start of the enterprise and had introduced more
blended products since the start of the enterprise. The method of processing as indicated
with a mean of 2.8507 had also become more complex as more new products were
made. It therefore means that, with an overall increament mean of 3.0995, firm’s coming
of age or maturity sometimes influenced such value creation activities like packaging,
blending, branding on various products within the scheme though it did not in other
times.
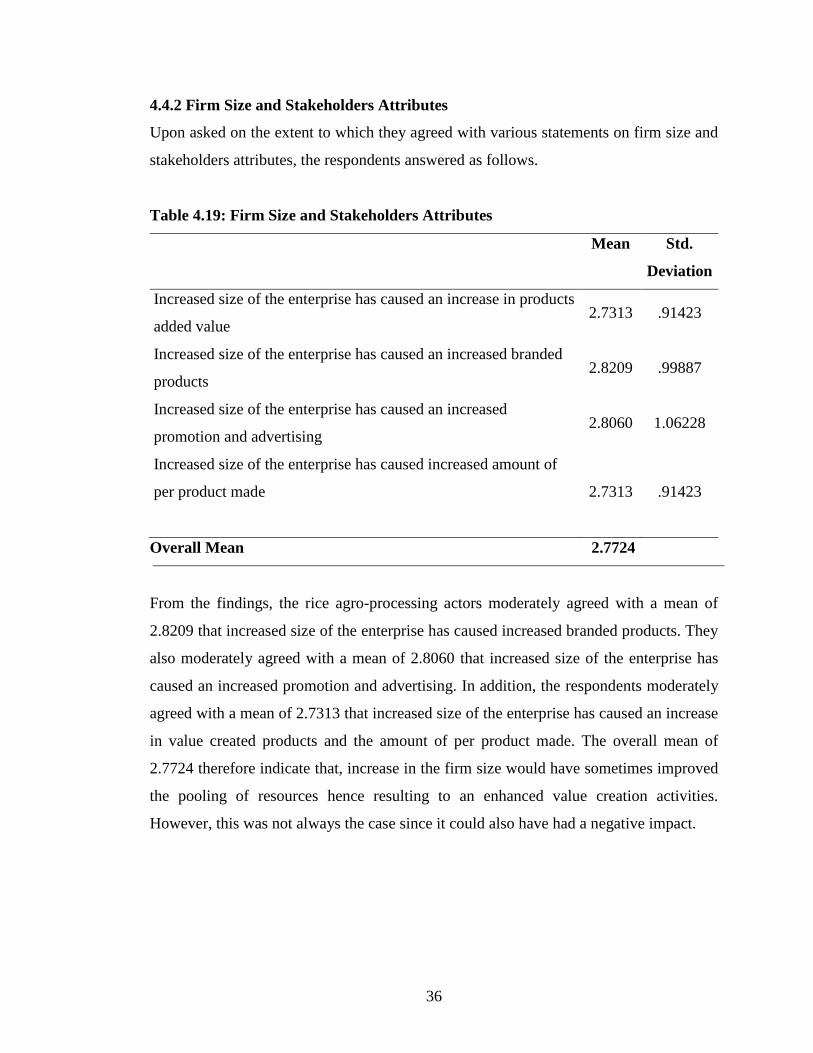
36
4.4.2 Firm Size and Stakeholders Attributes
Upon asked on the extent to which they agreed with various statements on firm size and
stakeholders attributes, the respondents answered as follows.
Table 4.19: Firm Size and Stakeholders Attributes
Mean Std.
Deviation
Increased size of the enterprise has caused an increase in products
added value 2.7313 .91423
Increased size of the enterprise has caused an increased branded
products 2.8209 .99887
Increased size of the enterprise has caused an increased
promotion and advertising 2.8060 1.06228
Increased size of the enterprise has caused increased amount of
per product made
2.7313 .91423
Overall Mean 2.7724
From the findings, the rice agro-processing actors moderately agreed with a mean of
2.8209 that increased size of the enterprise has caused increased branded products. They
also moderately agreed with a mean of 2.8060 that increased size of the enterprise has
caused an increased promotion and advertising. In addition, the respondents moderately
agreed with a mean of 2.7313 that increased size of the enterprise has caused an increase
in value created products and the amount of per product made. The overall mean of
2.7724 therefore indicate that, increase in the firm size would have sometimes improved
the pooling of resources hence resulting to an enhanced value creation activities.
However, this was not always the case since it could also have had a negative impact.

37
4.4.3 Customer Needs and Expectations
When asked on their level of agreement with various statements on Customer needs and
expectations, the agro-processors answered as shown in table 4.20.
Table 4.20: Consideration of Customer Needs and Expectations
Mean Std.
Deviation
New value added products are made with consideration of
suggestions from potential customers 2.9701 .92064
Customers liked buying the new baked products when they
were first manufactured 2.6418 .62040
Customers liked the new packaged products when they were
first manufactured 2.6418 .77267
Customers liked new branded products when they were first
manufactured 2.5970 .83593
Customers liked the new products when they were first
manufactured 2.6119 .81567
Overall Mean 2.6925
From the findings the rice agro-processing actors moderately agreed with a mean of
2.9701 that new value added products are made with consideration of suggestions from
potential customers. They also moderately agreed with means of 2.6119 and 2.6418 that
customers liked the new products when they were first manufactured and customers
liked the new packaged products when they were first manufactured, respectively. They
further moderately agreed with a mean of 2.6418 that customers liked buying the new
baked products when they were first manufactured. Also, rice agro-processing actors
moderately agreed with a mean of 2.5970 that customers liked new branded products
when they were first manufactured. Therefore, overall mean of 2.6925 implies that,
aligning the product to the customer needs and expectations may have enhanced the
likeness and demand of the product hence making it an influencing factor to value
creation. However, this was not always the case if this situation was not adhered to.

38
4.4.4 Customer Needs’ Consideration in the Value Creation Process
The rice agro-processing actors were requested to indicate the extent to which the needs
of the customers were considered before developing the value creation process. The
results were as presented in table 4.21.
Table 4.21: Customer Needs’ Consideration in the Value Creation Process
Mean Std.
Deviation
Branding and packaging 3.1045 .90678
Baking the product into e.g. cookies 3.0000 .71774
Carrying out Promotion/advertising 3.1493 1.01882
Overall mean 3.0846
According to the findings, the rice agro-processing actors indicated with a mean of
3.1493 that the needs of the customers were considered before carrying out
promotion/advertising. They also indicated with a mean of 3.1045 that the needs of the
customers were considered before branding and packaging. Rice agro-processing actors
also agreed with a mean of 3.0000 that, the needs of the customers were considered
before baking the products such as cookies. These findings show that, the needs of the
customers were moderately considered before carrying out promotion/advertising,
branding, packaging and baking the products.
Since these are customer needs consideration indicators, the overall mean of 3.0846
means that, customer needs consideration within the value creation process may
sometimes influence the value creation process of milled rice but sometimes may not if
the prevailing business environment was not conducive.
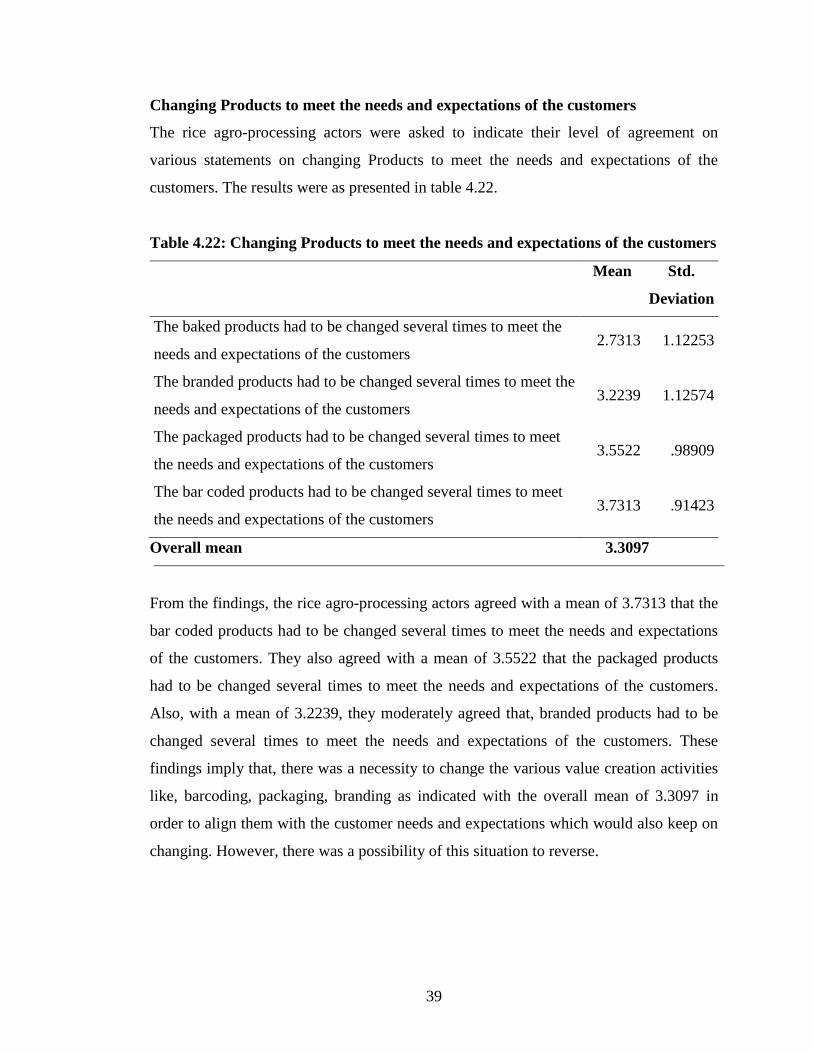
39
Changing Products to meet the needs and expectations of the customers
The rice agro-processing actors were asked to indicate their level of agreement on
various statements on changing Products to meet the needs and expectations of the
customers. The results were as presented in table 4.22.
Table 4.22: Changing Products to meet the needs and expectations of the customers
Mean Std.
Deviation
The baked products had to be changed several times to meet the
needs and expectations of the customers 2.7313 1.12253
The branded products had to be changed several times to meet the
needs and expectations of the customers 3.2239 1.12574
The packaged products had to be changed several times to meet
the needs and expectations of the customers 3.5522 .98909
The bar coded products had to be changed several times to meet
the needs and expectations of the customers 3.7313 .91423
Overall mean 3.3097
From the findings, the rice agro-processing actors agreed with a mean of 3.7313 that the
bar coded products had to be changed several times to meet the needs and expectations
of the customers. They also agreed with a mean of 3.5522 that the packaged products
had to be changed several times to meet the needs and expectations of the customers.
Also, with a mean of 3.2239, they moderately agreed that, branded products had to be
changed several times to meet the needs and expectations of the customers. These
findings imply that, there was a necessity to change the various value creation activities
like, barcoding, packaging, branding as indicated with the overall mean of 3.3097 in
order to align them with the customer needs and expectations which would also keep on
changing. However, there was a possibility of this situation to reverse.

40
4.4.5 Demand of the Value Added Products
The rice agro-processing actors were asked to indicate their level of agreement with
various statements on the demand of the value added products. The results were as
shown in table 4.23.
Table 4.23: Demand of the value added products
Mean Std.
Deviation
Demand of the value added products is currently more than
when product was first launched 2.8955 .93961
Demand of feeds is currently more than when they were first
launched 3.0746 .89296
Demand of bar coded is currently more than when they were
first launched 3.2836 .95037
Demand of packaged is currently more than when they were
first launched 3.3731 1.01258
Demand of baked is currently more than when they were first
launched 3.4627 1.10547
Demand of branded is currently more than when they were first
launched 3.4627 1.11910
Demand of the briquettes is currently more than when they
were first launched 2.7612 .95488
Overall Mean 3.1876
The rice agro-processing actors moderately agreed with means of 3.4627 and 3.4627 that
demand of baked and branded products respectively was more than when they were first
launched. The respondents also moderately agreed with means of 3.3731 and 3.2836 that
demand of packaged and bar coded products, respectively, were more than when they
were first launched. Further, the respondents moderately agreed with means of 3.0746,
2.8955 and 2.7612 that demand of feeds, other value added products and briquettes was
more than when they were first launched.

41
These findings with an overall mean of 3.1876 imply that, despite demand for value
added products such as bar coded products, baked, branded, feeds and packaged product
being currently more than when the products were first launched, their supply probably
could have been inadequate. This actually brings out the demand and entrepreneurial
gap which could have been addressed if good estimation of product market size,
customer needs, probable sales and creation of better business environment were
ensured. Therefore, demand consideration of value created products was a key influence
to value creation activities.
4.4.6 Product Attractiveness
The rice agro-processing actors were requested to indicate the extent to which the named
value creation processes had contributed towards attracting potential customers.
Table 4.24: Value Creation Processes in Attracting Potential Customers
Mean Std. Deviation
Branding 3.2239 .79431
Packaging 3.2090 .72900
Baking 3.0299 .49145
Promotion/advertising 3.3881 .73763
Standardization mark 3.2090 .59128
Diamond mark of quality 3.1343 .57460
Bar coding 3.2090 .59128
Flour milling 3.0746 .40126
Blending 3.0299 .57657
Overall Mean 3.1675
According to the findings, the rice agro-processing actors indicated with a mean of
3.3881 that promotion/advertising contributed towards attracting potential customers for
the value created product to a moderate extent. In addition, they indicated with a mean
of 3.2239 that branding contributed towards attracting potential customers for the value
created product to a moderate extent.

42
Further, the rice agro-processing actors indicated with a mean of 3.2090 that
standardization mark, bar coding and packaging contributed towards attracting potential
customers for the value created product to a moderate extent. Also, the rice agro-
processing actors indicated with a mean of 3.1343 that diamond mark of quality
contributed towards attracting potential customers for the value created product to a
moderate extent.
These finding with an overall mean of 3.1675 imply that, though promotion/advertising,
branding, standardization mark, bar coding and packaging and diamond mark of quality,
baking, blending and flour milling moderately contributed towards attracting potential
customers for the value created product, the earlier frequencies had showed it was only
packaging, branding, blending and some promotion and advertising that were actually
practiced. Therefore, other value creation activities needed further consideration since
their mean was also indicating their moderate potential to create product attractiveness.
This means that, product attractiveness may sometimes influence innovative value
creation of milled rice within the scheme though dependence on the value created
product.
4.4.7 Market of the Value Created Products
When asked to indicate how often market surveys for value created products were
conducted, the agro-processors response results were as presented in table 4.25.
Table 4.21: Market of the Value Created Products
Mean Std.
Deviation
How often is market survey carried out for baked products 3.4627 1.47019
How often is market survey carried out for bar coded products 3.7910 1.09458
How often is market survey carried out for Packaged and branded
products 3.8060 1.18371
How often is market survey carried out for refined bran 3.7910 1.32044
Overall mean 3.7127

43
From the findings, the respondents indicated with a mean of 3.8060 that market survey
for packaged and branded products was often carried out. In addition, they indicated
with a mean of 3.7910 that market survey for bar coded products and refined bran was
often carried out. However, the respondents indicated with a mean of 3.4627 that market
survey for baked products was occasionally carried out. These findings imply that
market surveys for packaged, branded products, bar coded products and refined bran
were often carried out while market surveys for baked products were occasionally
carried out.
These results are also reflected on the extent to which packaged and branded products
have been adopted in the market. The occasional survey is reflected on the absence of
baked value created products in the market. Overall mean of 3.7127 therefore means
that, market survey of the value created products may positively influence value creation
processes of milled rice but sometimes may impact negatively if not frequently and
objectively done.
Market Promotion for Value Added Products
When asked to indicate how frequent market promotion was conducted for various value
created products, the rice agro-processing actors responded as shown in table 4.26.
Table 4.22: Market Promotion for Value Added Products
Mean Std.
Deviation
How frequent is market promotion done for baked products 3.5075 1.65487
How frequent is market promotion done for Deep fried products 3.0896 1.56410
How frequent is market promotion done for packaged and branded
products 3.2239 1.50576
How frequent is market promotion done for bar coded products 3.1343 1.54621
How frequent is market promotion done for polished rice 3.2687 1.48306
Overall Mean 3.2448

44
From the findings, the rice agro-processors indicated with a mean of 3.5075 that market
promotion for baked products was done frequently. They also indicated with a mean of
3.2687 that market promotion for polished rice was occasionally done. Moreover, a
mean of 3.2239 and 3.1343 indicated that, market promotion for packaged and branded
products as well as bar coded ones respectively, was done occasionally. Further, they
indicated with a mean of 3.0896 that market promotion for deep fried products was also
done occasionally.
These finding imply that, there was an occasional market promotion for packaged,
branded, bar coded and deep fried products even though that for baked products was
frequently done. The occasional market promotions is a direct reflection on the low and
non-adoption of the value created product within the scheme compared to those whose
promotions was done frequently. Therefore, the overall mean of 3.2448 indicates that,
market promotion may fairy influence value creation of milled rice if well done but may
fail to do so if not emphasized.
Price of Value created products and Target Market
The rice agro-processing actors were asked to indicate whether the price of value added
products depended on target market. The results were as shown in table 4.27.
Table 4.23: Price of value added products and Target Market
Mean Std.
Deviation
Price of baked products depends on target market which can be
Niche or Mass market 2.2985 1.11484
Price of new packaged depend on target market which can be
Niche or mass market 2.2687 1.14920
Price of bar coded products depends on target market which can
be Niche or Mass market 2.8209 1.17969
Price of branded products depends on target market which can
be Niche or Mass market 2.8657 1.16639
Overall mean 2.5635

45
According to these finding, rice agro-processing actors agreed to a low extent with a
mean of 2.2985 that the price of baked products depends on target market which can be
niche or mass market. Moreover, price of branded products depends on target market
which can be Niche or Mass market as shown by a mean of 2.8657.
In addition, the rice actors moderately agreed with a mean of 2.8209 that, price of bar
coded products depends on target market which can be Niche or Mass market. Also,
they disagreed to a low extent with a mean of 2.2687 that, price of new packaged
products depend on target market which can be Niche or mass market.
These findings show that, the price of branded and bar coded products sometimes
depend on target market which can be niche or mass market. However, the price of
baked and packaged was not dependence on target market which can be Niche or mass
market. This implies that, price is fairly a key determinant of value creation activities
within the scheme but sometimes may have a negative influence.
4.4.8 Human Resource Availability
The rice agro-processing actors were asked to indicate their level of agreement with
various statements on the adequacy of skilled staffs. The results were as shown in table
4.28.
Table 4.24: Adequacy of Human Resource
Mean Std.
Deviation
There is adequate skilled staffs for training/carrying out feed
fortification 2.6716 .97527
There is adequate skilled staffs for training/carrying out Baking
activities 2.5075 .95937
There is adequate skilled staffs for training/carrying out
Packaging and branding 3.0000 .96922
Overall mean 2.7264

46
The respondents moderately agreed with a mean of 3.0000 that there are adequate
skilled staffs for training/carrying out packaging and branding. The respondents also
moderately agreed with a mean of 2.6716 that there are adequate skilled staffs for
training/carrying out feed fortification. Also, the respondents moderately agreed with a
mean of 2.5075 that there are adequate skilled staffs for training/carrying out baking
activities.
These findings imply that there were inadequate skilled staffs for training/carrying out
packaging, branding, feed fortification and baking activities. Since skilled staffs are
indicators of more value creation activities, the inadequacy of human resource skills and
staff therefore had a negative influence on value creation activities within the scheme.
Table 4.25: Offering of capacity/Training by value addition experts
Frequency Percent
No training at all 22 32.8
Quarterly 19 28.4
Two months span 6 9.0
Monthly 17 25.4
Always 3 4.5
Total 67 100.0
From the findings, 32.8% of the rice agro-processing actors indicated that
capacity/training was not offered by value addition experts to their enterprises, 28.4%
were offered on quarterly basis, 25.4% on monthly basis, 9.0% on two months span and
4.5% indicated always. These findings imply that, capacity/training was minimally or
not offered to processors by value addition experts within the scheme.
Adequacy of Financial Capability
The respondents were requested to indicate their current financial capability in various
value addition activities. The results were as presented in table 4.30.

47
Table 4.26: Financial Capability for value Addition Activities
Mean Std.
Deviation
The current financial capability of the enterprise is enough to
support deep frying activities
1.7910 .87969
The current financial capability of the enterprise is enough to
support New baking activities
1.8209 .85148
The current financial capability of the enterprise is enough to
support promotions and advertising
1.8209 .90328
The current financial capability of the enterprise is enough to
support promotions and advertising
1.9552 .80590
The current financial capability of the enterprise is enough to
support bar coding
2.1940 .87454
The current firm’s financial resource is enough to support
successful marketing of formulated feeds
1.8358 .93090
Overall mean 1.9030
From the findings, the rice agro-processing actors disagreed with the statement that the
current financial capability of their enterprises were enough to support bar coding as
shown by a mean of 2.1940. They also disagreed with the statement that the current
financial capability of their enterprises was enough to support promotions and
advertising as indicated by a mean of 1.9552. With a mean of 1.8358 the rice agro-
processing actors disagreed with the statement that the current firm’s financial resource
was enough to support successful marketing of formulated feeds. In addition, they
disagreed with the statement that the current financial capability of their enterprises was
enough to support new baking activities and promotions and advertising as shown by a
mean of 1.8209.
The rice agro-processing actors also disagreed with a mean of 1.7910 that the current
financial capability of their enterprises was enough to support deep frying activities.
With an overall mean of 1.9030 and the above being indicators of value creation
activities, these findings imply that, the current financial capability of the enterprises
was not enough to support value creation activities and hence had a negative influence.
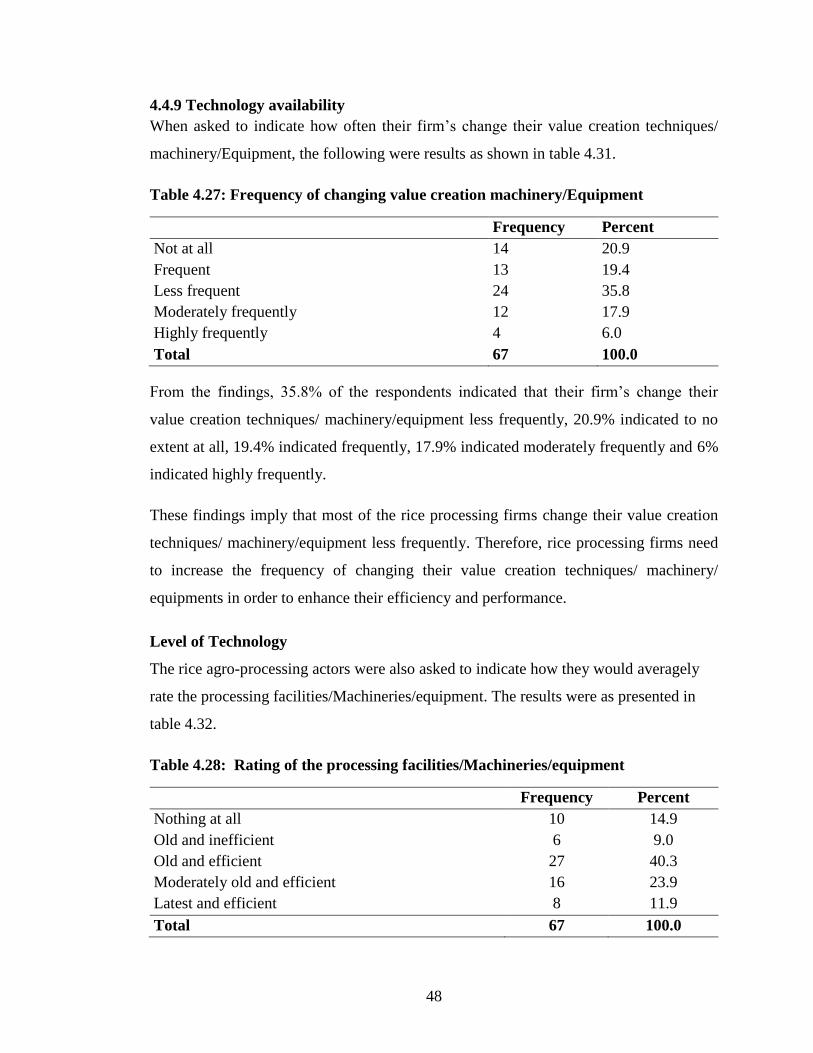
48
4.4.9 Technology availability
When asked to indicate how often their firm’s change their value creation techniques/
machinery/Equipment, the following were results as shown in table 4.31.
Table 4.27: Frequency of changing value creation machinery/Equipment
Frequency Percent
Not at all 14 20.9
Frequent 13 19.4
Less frequent 24 35.8
Moderately frequently 12 17.9
Highly frequently 4 6.0
Total 67 100.0
From the findings, 35.8% of the respondents indicated that their firm’s change their
value creation techniques/ machinery/equipment less frequently, 20.9% indicated to no
extent at all, 19.4% indicated frequently, 17.9% indicated moderately frequently and 6%
indicated highly frequently.
These findings imply that most of the rice processing firms change their value creation
techniques/ machinery/equipment less frequently. Therefore, rice processing firms need
to increase the frequency of changing their value creation techniques/ machinery/
equipments in order to enhance their efficiency and performance.
Level of Technology
The rice agro-processing actors were also asked to indicate how they would averagely
rate the processing facilities/Machineries/equipment. The results were as presented in
table 4.32.
Table 4.28: Rating of the processing facilities/Machineries/equipment
Frequency Percent
Nothing at all 10 14.9
Old and inefficient 6 9.0
Old and efficient 27 40.3
Moderately old and efficient 16 23.9
Latest and efficient 8 11.9
Total 67 100.0

49
From the findings, 40.3% of the respondents rated their processing facilities/
machineries/ equipment as old and efficient, 23.9% rated them moderately old and
efficient, 11.9% rated them as latest and efficient and 9% rated them as old and
inefficient. These findings imply that processing facilities/ machineries/ equipment in
most of the rice processing firms in Mwea Irrigation scheme were old and efficient.
Therefore, rice processing firms in Mwea Irrigation scheme should boost their financial
resources invested in acquisition of latest and more efficient processing facilities/
machineries in order to improve their performance.
4.4.10 Corporate Culture and Environment
The respondents were asked to rate their enterprises in terms of corporate culture and
environment. The results were as shown in table 4.33.
Table 4.29: Corporate Culture and Environment
Mean Std.
Deviation
Please rate the talent management strategy for the processing
firm/group 2.0299 1.19304
Rate the firm’s/group’s Employee retention scheme 2.4328 1.22132
Rate the firm’s/group’s Reward scheme 2.1343 1.16639
Rate the Job progression level for employees of the firm/group 2.1343 1.14012
Rate the Performance based deployment for employees in the
firm 3.2388 1.15588
Overall mean 2.3940
According to the findings, the respondents indicated with a mean of 3.2388 that the
performance based deployment for employees in the firm was good. In addition, the
respondents indicated with a mean of 2.4328 that the firm’s/group’s employee retention
scheme was poor. In addition, the respondents indicated with a mean of 2.1343 that the
firm’s/group’s Reward scheme and job progression level for employees of the
firm/group was poor.

50
Further, the respondents indicated with a mean of 2.0299 that the talent management
strategy for the processing firm/group was poor. This implies that, performance based
deployment for employees in the firm were good but still needed more improvement.
The findings also imply that employee retention schemes, reward schemes and job
progression level in most of the rice processing firms in Mwea Irrigation scheme were
poor. Therefore, more robust measures and strategies were needed if the value creation
of rice was to improve. Since these are corporate culture indicators, the overall mean of
2.3940 shows a negative situation and hence a need for re-evaluation.
4.5 Factor Analysis
Factor analysis is a technique that is used for data reduction. It attempts to identify the
underlying variables that explain a given pattern of correlations within a set of observed
variables. This study used factor analysis to reduce data so as to identify a small number
of factors that explain most of the variance that is observed in a much larger number of
manifest variables or constructs.
The study used Eigen value of one as the initial solution and found the communalities as
shown in appendix III. The study used communalities to indicate the amount of variance
in each variable that is accounted for. The Eigen value of one is the initial
communalities that give the estimate of the variance in each variable accounted for by
all components or factors.
Table 4.30 Total Variance Explained
Component Initial Eigenvalues Extraction Sums of Squared
Loadings
Total % of
Variance
Cumulative
%
Total % of
Variance
Cumulative
%
1 17.296 23.062 23.062 17.296 23.062 23.062
2 5.848 7.797 30.859 5.848 7.797 30.859
3 4.430 5.906 36.766 4.430 5.906 36.766
4 4.105 5.474 42.239 4.105 5.474 42.239
5 3.641 4.855 47.094 3.641 4.855 47.094
6 3.227 4.303 51.397 3.227 4.303 51.397

51
7 2.948 3.931 55.329 2.948 3.931 55.329
8 2.539 3.385 58.714 2.539 3.385 58.714
9 2.338 3.117 61.831 2.338 3.117 61.831
10 2.192 2.923 64.754 2.192 2.923 64.754
11 2.002 2.670 67.424 2.002 2.670 67.424
12 1.796 2.395 69.819 1.796 2.395 69.819
13 1.619 2.158 71.978 1.619 2.158 71.978
14 1.519 2.026 74.003 1.519 2.026 74.003
15 1.403 1.870 75.874 1.403 1.870 75.874
16 1.258 1.678 77.552 1.258 1.678 77.552
17 1.167 1.556 79.108 1.167 1.556 79.108
18 1.119 1.492 80.600 1.119 1.492 80.600
19 1.042 1.389 81.989 1.042 1.389 81.989
20 .969 1.292 83.281
21 .925 1.233 84.514
22 .852 1.137 85.651
23 .770 1.026 86.677
24 .751 1.001 87.678
25 .675 .901 88.579
26 .649 .865 89.444
27 .609 .812 90.256
28 .582 .776 91.032
29 .563 .751 91.784
30 .507 .676 92.459
31 .475 .634 93.093
32 .437 .582 93.675
33 .419 .558 94.233
34 .383 .510 94.743
35 .352 .469 95.212
36 .331 .441 95.654
37 .317 .423 96.076
38 .310 .413 96.489
39 .281 .375 96.864
40 .253 .337 97.201
41 .221 .295 97.496
42 .214 .285 97.781
43 .185 .247 98.028
44 .168 .224 98.252
45 .153 .205 98.457
46 .144 .192 98.649

52
47 .132 .177 98.825
48 .118 .157 98.982
49 .104 .139 99.122
50 .089 .119 99.241
51 .085 .113 99.354
52 .080 .107 99.461
53 .072 .095 99.556
54 .062 .082 99.639
55 .056 .074 99.713
56 .047 .062 99.775
57 .034 .045 99.820
58 .030 .040 99.860
59 .025 .033 99.893
60 .021 .028 99.921
61 .020 .026 99.947
62 .014 .019 99.966
63 .012 .015 99.982
64 .007 .009 99.990
65 .004 .005 99.996
66 .003 .004 100.000
67 1.317E-
015
1.756E-
015 100.000
68 9.928E-
016
1.324E-
015 100.000
69 7.936E-
016
1.058E-
015 100.000
70 5.945E-
016
7.927E-
016 100.000
71 5.632E-
016
7.510E-
016 100.000
72 1.538E-
016
2.050E-
016 100.000
73 2.200E-
017
2.934E-
017 100.000
74 -4.807E-
016
-6.409E-
016 100.000
75 -6.807E-
016
-9.075E-
016 100.000
Extraction Method: Principal Component Analysis.
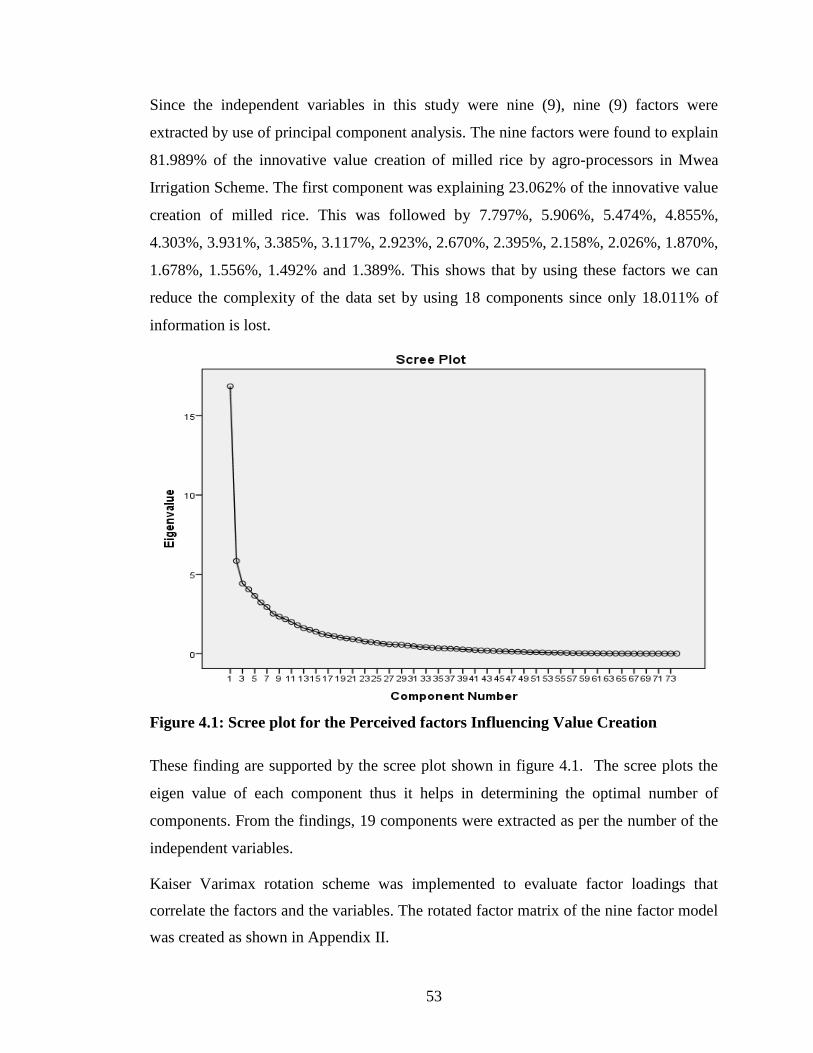
53
Since the independent variables in this study were nine (9), nine (9) factors were
extracted by use of principal component analysis. The nine factors were found to explain
81.989% of the innovative value creation of milled rice by agro-processors in Mwea
Irrigation Scheme. The first component was explaining 23.062% of the innovative value
creation of milled rice. This was followed by 7.797%, 5.906%, 5.474%, 4.855%,
4.303%, 3.931%, 3.385%, 3.117%, 2.923%, 2.670%, 2.395%, 2.158%, 2.026%, 1.870%,
1.678%, 1.556%, 1.492% and 1.389%. This shows that by using these factors we can
reduce the complexity of the data set by using 18 components since only 18.011% of
information is lost.
Figure 4.1: Scree plot for the Perceived factors Influencing Value Creation
These finding are supported by the scree plot shown in figure 4.1. The scree plots the
eigen value of each component thus it helps in determining the optimal number of
components. From the findings, 19 components were extracted as per the number of the
independent variables.
Kaiser Varimax rotation scheme was implemented to evaluate factor loadings that
correlate the factors and the variables. The rotated factor matrix of the nine factor model
was created as shown in Appendix II.
54
The factor loadings were used to group the factors that influence the innovative value
creation in milled rice. Based on the factor loadings of the individual variable; each
factor was given a descriptive name as follows; Factor 1 - firm size and stakeholders
attributes, Factor 2 – product demand, Factor 3 – customers need and expectations,
Factor 4 – market of the value created products, Factor 5 –product attractiveness, Factor
6 – customers need and expectations, Factor 7 –resource availability, Factor 8 –resource
availability, Factor 9 – customers need and expectations, Factor 10 – customers need
and expectations, Factor 11 – product attractiveness, Factor 12 –product demand.
Further, factor 13 was given –product demand, Factor 14 - customers need and
expectations, Factor 15 – technology availability, Factor 16 –product demand, Factor
17– market of the value created products, Factor 18 – product attractiveness and Factor
19 – firms’ age and maturity.
These findings imply that, firm size and stakeholders attributes was the most significant
factor influencing innovative value creation of milled rice, followed by product demand,
customer needs and expectations, market of value created products, product
attractiveness, resource availability, corporate culture and environment, technology
availability and firms age and maturity.
4.6 Discussion of the Findings
The aim of the study was to assess the factors influencing innovative value creation of
milled rice by agro-processor within rice value chain in Mwea irrigation scheme. The
study found that, despite the importance and entrepreneurial value of processed value
created milled rice products in terms of increament of venture’s turnover and returns,
agro-processing firms in Mwea irrigation scheme only carried out, basic value creation
of polished rice through packaging, branding, advertising and standardization marks.
These were also the only activities done to blended rice. However, there was rare to no
secondary or advanced value created products like baking, formulated feeds, rice flour,
rice husk briquettes, rice biscuits, baked deep fried products ,whole rice cookies, body
powder and rice bran oil that were processed within the scheme.

55
This hence indicates that, there was also no value creation activities like, standardization
marks, barcoding, fortification logos, diamond mark of quality, milling of rice flour,
baking, feed formulations and briquetting that were done to the above products.
Based on the factor loadings of individual variable, firm size and stakeholders attributes
was the most significant factor influencing innovative value creation of milled rice,
followed by product attractiveness, market of the value added products, resource
availability, customers’ needs and expectations, corporate culture and environment,
firm’s age and maturity, product demand and technology availability
The results deduced that, firm’s size (increased size) would sometimes cause an increase
in the value created products within the scheme. These findings are contrary to Miller et
al., (1988) findings that, upon increase in size of an organization, it may lose its
enthusiasm to innovate and hence require a more elaborate control mechanism.
However, the moderateness also indicated a probable negative influence to value
creation.
It was found that, branding, packaging, promotion/advertising, standardization marks,
diamond mark of quality, bar coding, flour milling and blending would contribute
towards attracting potential customers for the value created product to a moderate extent.
These findings are in line with Nebojsa et al. (2008) argument that product attractiveness
influences the type of innovation to adopt in order to guarantee market acceptability and
sustainable income generation
The study revealed that, market surveys for packaged, branded products, bar coded
products and refined bran were often carried out while market surveys for baked
products were occasionally carried out. This was reflected on the extent to which
packaged and branded products had been adopted in the market. The occasional survey
was reflected on the absence of baked value created products in the market. According
to Nebojsa (2008), market survey plays a major role in innovation and value creation.
Moreover, the researcher discovered that, most rice processing firms in Mwea Irrigation
Scheme, had inadequate skilled staffs for training/carrying out packaging and branding,
feed fortification and baking activities.

56
There was further revelation that, capacity/training was not adequately offered by value
addition experts to rice processing firms within the scheme hence the low adoption of
value creation activities. The financial capability of most enterprises was also not
enough to support value creation activities such as bar coding, promotions and
advertising, new baking activities, promotions and advertising and deep frying activities.
EBRD, (2014) had earlier indicated that, value creation may be high amongst large
established firms compared to young ones due to financial capability, affordability to
research and development as well as market promotion budgets). The centralization of
budgets by the agro-processors could have also hindered innovativeness to value
creation.
Hardy and Dougherty (1997) had earlier indicated that, centralized and systematically
controlled budget, with clear defined job and technology exclusion contributes
negatively to innovation and value creation.
Other deductions were such that, new value created products were sometimes made in
consideration of feedback from potential customers though this could either have a
positive or negative influence. These findings agree with Nebojsa et al. (2008) argument
that, firms with customer orientation are able to measure their customer satisfaction
level through being responsive to their needs. This is evidenced by moderate
consideration of customer needs before branding and packaging, baking and carrying out
promotion/advertising. These findings agree with Christensen (2002) findings that,
company’s aptitude to innovate can be limited by consistent focus on existing customers
hence managers deviating from being keen to serve new customers.
Other deduction was such that, value created products need to be changed several times
in order to meet the needs and expectations of the customers. According to Hippel’s
(1988), the leading product users face the needs that appear in the market months and
years after others. They also have an aptitude to express future needs as the function of
their experience.

57
Firm’s age or maturity was also realized to influence the value creation processes within
the scheme This was evidenced by the introduction of more value added products since
the start of the enterprises and the method of processing had become more complex with
more new products made. These findings agree with Klepper, (1996) argument that there
is more focus on process innovations than product innovations as the firm age or mature.
The study established that, demand of the value created products was currently more
than when the products were first launched. These findings agree with Nebojsa (2008)
findings that, demand of value created products increases as businesses grow. However,
this demand could only be met by the packaged, branded, blended products of the
polished and blended rice. This showed an entrepreneurial gap which needed to be filled
through value creating more products to enhance supply and meet the demand.
According to Scott (2015), technology can also be critical, enabling and strategic in
value creation. The study established that most of the rice processing firms change their
value creation techniques/ machinery/equipment less frequently. In addition, processing
facilities/ machineries/ equipment in most of the rice processing firms in Mwea
Irrigation scheme were old, but efficient.
It was discovered that, majority of those who carried out agro-processing and value
creation activities were actually the youth ranging from 30-39 years of age. This is the
most critical stage in creating innovative ideas and commercializing them. Moreover,
majority of the agro-processors were actually of the male gender (53.7%) though the
difference was very insignificant and may have been inflicted by the barriers women
face in enterprise management and operations (Swartz, 1976).
The study also revealed that, rice agro-processing actors in Mwea irrigation scheme had
secondary education as their highest level of education. This was an indicator of higher
education graduates having not embraced value creation activities as entrepreneurial
opportunities despite more education skills being related to good business management.
It was discovered that, most businesses dealing with rice agro-processing in Mwea
irrigation scheme had complied with the registration as a legal requirement and majority
(61.2%) had business permits issued by the county government.

58
CHAPTER FIVE: SUMMARY, CONCLUSIONS AND RECOMMENDATIONS
5.1 Introduction
This chapter presents summary of the findings, conclusion, recommendations and areas
for further study. The main objective of the study is to evaluate the factors influencing
innovative value creation of milled rice by agro-processors within rice value chain in
Mwea Irrigation Scheme.
5.2 Summary of the Key Findings
The study found that, despite the importance and entrepreneurial value of processed
value created milled rice products in terms of increament of venture’s turnover and
returns, agro-processing firms in Mwea irrigation scheme only carried out, basic value
creation of polished rice through packaging, branding, advertising and standardization
marks. These were also the only activities done to blended rice. There was also rare to
no secondary or advanced value created products like baking, formulated feeds, rice
flour, rice husk briquettes, rice biscuits, baked deep fried products ,whole rice cookies,
body powder and rice bran oil that were processed within the scheme.
The results deduced that, firm’s size (increased size) would sometimes cause an increase
in the value created products within the scheme. However, the moderateness indicated a
probable negative influence to value creation.
It was inferenced that, products whose market surveys were oftenly carried out, had a
high adoption rate compared to the ones whose survey was occasionally done. This was
evidenced by the often surveys done on packaged, branded products, bar coded
products and refined bran compared to occasional one on baked products.
Other discoveries were such that, most rice agro-processing firms within the scheme,
had inadequate skilled staffs for training/carrying out packaging and branding, feed
fortification and baking activities. Further revelation was that, capacity/training was
inadequately offered by value addition experts hence the low adoption of value creation
activities.
59
The financial capability of most enterprises was also not enough to support value
creation activities like bar coding, promotions and advertising, new baking activities,
promotions and advertising and deep frying activities
Consideration of feedback from potential customers was realized to sometimes have a
positive or negative influence on value creation activities within the scheme. This was
evidenced by moderate consideration of customer needs before branding and packaging,
baking and carrying out promotion/advertising. However, innovated value created
products, sometimes needed to be changed several times in order to meet the needs and
expectations of the customers.
Firm’s age or maturity was also realized to influence the value creation processes within
the scheme as evidenced by the introduction of more value added products since the
start of the enterprises and the method of processing becoming more complex with more
new products made.
The study also established that, demand of the value created products was currently
more than when the products were first launched. However, this demand could only be
met by the packaged, branded, blended products of the polished and blended rice. This
showed an entrepreneurial gap which needed to be filled through value creating more
products to enhance supply and meet the demand. Other inferences were such that, most
of the rice processing firms changed their value creation techniques/machinery
/equipment less frequently. In addition, their processing facilities/machineries/
equipment were old, but efficient.
There was also deduction that, majority of those who carried out agro-processing and
value creation activities were actually the youth ranging from 30-39 years of age.
However, most of them were of the male gender (53.7%). Moreover, secondary was
realized to be their highest level of education (43.3%) an indicator of higher education
graduates having not embraced value creation activities as entrepreneurial opportunities
despite more education skills being related to good business management. Many
businesses had also complied with registration as a legal requirement (61.2%) and had
business permits issued by the county government as evidence.

60
5.3 Theoretical Relationship with the Results of the Study
This study was informed by Rodgers Diffusion Innovation theory and Value chain
theory as proposed by Porter (1985). The study deduced that, it was only the basic
innovative value creation activities and products that had been adopted by the agro-
processors within the scheme and rare on the secondary and advanced value created
products and activities. The adoption depended on the activity or product relative
advantage, information availability, complexity and triability. These are attributes to
diffusion of technology and uncertainty (Rodgers, 2003). Moreover, targeting of the
simple or basic value created products and activities aimed at minimizing the costs of
primary and support activities in order to increase the firm’s ultimate profit margin. This
agrees with Porter (1985) version of identifying enterprise sections that have cost
leadership strategies in differentiated products throughout the value chain.
5.4 Conclusion
Based on the research findings, the study concludes that, agro-processing firms in Mwea
irrigation scheme rarely improve the value of milled rice except through polishing and
blending. The value of blended and polished rice is only enhanced through, branding,
packaging, standardizing, promotion and advertising. Moreover, products such as
fortified feeds, whole rice cookies, rice flour, rice husk briquettes, rice biscuits, and deep
fried baked products are rarely done by the agro-processors. Other conclusion is that,
innovative value creation activities such as packaging, branding, blending, promotion,
and advertising as well as standardization marks are fairly/moderately conducted while
barcoding, feed fortification, diamond mark of quality, milling of rice flour, fortification
logos are never practiced.
The study further concludes that, firm size and stakeholders attributes is the most
significant factor influencing innovative value creation of milled rice within Mwea
irrigation scheme, followed by product attractiveness, market of the value added
products, resource availability, customers’ needs and expectations, corporate culture and
environment, firm’s age and maturity, product demand and technology availability.

61
5.5 Recommendations
The study found that, needs and expectation of the customers in regard to the value
added products kept on changing. The study therefore recommends that, rice processing
firms should frequently adjust their value created products in consistence with the
customers’ needs and expectations. This will significantly improve their customer
loyalty and hence increase repurchases.
Moreover, researcher discovered that, innovative values created products were
minimally processed but value creation activities were being carried out fairly within the
scheme. The study therefore recommends more capacity building to create value
creation skills, technology adjustment as well as promotion and advertising with the aim
of improving the situation.
The study also found that most of the firms frequently experienced run out stocks. The
study therefore recommends the adoption of inventory management systems to enable
demand forecasting. This will help in ensuring that, there is enough inventories while at
the same time preventing overstocking.
The study also found that, some rice processing firms were not carrying out market
surveys for their value added products. The study therefore recommends frequent
carrying out of market surveys so as to identify customers’ needs and expectations and
also asses their product’s demand in the market.
The study established that, rice processing firms were moderately conducting
promotions and advertising for their products. Promotions and advertising provides
information to the current customers and the potential customers highlighting the
benefits of the products. This study therefore recommends that rice processing firms
should conduct promotions and advertising at high rate for their value created products
so as to increase sales volume and hence general growth.

62
The study found that, there were inadequate skills for carrying out, innovative value
creation activities in Mwea Irrigation Scheme. The researcher therefore recommends
that, rice processing firms should consider improving their staff skills through holding
refresher training programmes for different value creation programmes.
The study revealed that, financial capability was one of the major hindrances to the
adoption of some value creation activities. The study recommends that, rice processing
firms should seek for other alternative finance sources such as loans from banks, venture
capital among others in order to meet their finance demands and expand their value
creation activities.
The study also found that, most of the rice processing firms changed their value creation
techniques/ machinery/equipment less frequently and rated them as old, but efficient. As
technology advances techniques/ machinery/equipment increase in efficiency and
effectiveness. This study therefore recommends that rice processing firms should
consider improving and changing their techniques/ machinery/equipment frequently.
5.6 Areas for Further Research
This study was limited to innovative value creation of milled rice by agro-processors
within rice value chain in Mwea irrigation scheme. The study therefore suggests further
studies on innovative value creation in other types of products such as on horticulture
and other cereal product. This will help in identification of more entrepreneurial gaps
worth venturing especially by the various small medium enterprises. It also suggests
further research on why capacity and training on innovative value creation activities is
inadequate and probable measures necessary to address the situation.
63
REFERENCES
Anzetse, W. (2016). Manufacturing in Kenya: Features, challenges and Opportunities.
Andy, F. (2005).C8057; Research Methods. Factor analysis on SPSS
Born, Janet Bachmann, Adding Value to Farm Products. A publication of ATTRA
National Sustainable agriculture information service.1-800-346-9140.
Bryman, A. & Bell, E. (2011). Business Research Methods (3rd
Ed). Oxford: Oxford
University Press.
Carlos A., Da, S. FAO (2011). Innovation policies and institutions to support ago
industry development.
Carrol G. R. (1983). A Stochastic Model of Organization Mortality. Review and
Analysis. 12:303-329.
Dagmar, R. (2001). The Value chain analysis paper.
David P. Anderson, Charles R. Hall - Adding Value to Agricultural Products. L-5361
(RM1-8) 8-00.
Baljeet S., Yadav, R. (India)-124001; Value addition in Food agribusiness chain through
food processing.
EBRD, (2014). Drivers of innovation; Transition report.
George, C. (2003). Factors affecting product innovations; A Literature Review; Vol. 4,
No 1.
Giner C. (2009).New Avenue of Value Creation in the agro-food sector. Working paper
No.13.
Giuseppe, P.et al. (2003); improving the value of rice by-products, 26; 63-/71.
Glenn Israel, (1992); Determining sample size, November 1992.
Herbert, W. (2016); Mapping Capability building-processes among food processing
firms in Kenya. IDS University of Nairobi.
Ir. Corne V. (2005): Rice value chain analysis

64
Ismail, S. (2006); Detailed review of Rodgers’ diffusion of innovation theory and
education technology-related studies based on Rodgers’ theory. Tojet April 2006
ISSN: 1303- 6521 volume 5 Issue 2 article 3
James (2016), Barcoding-Getting it right. Recommendation for best practice in UK.
Kate, H. & John, W. (2006); Managing the Value chain
Kothari C.R (2004). Research methodology; Methods and techniques; (Second revised
edition), New age international publishers
Kumar, S. Sangwan P., Dhankhar R. Mor V., and Bidra S, (2013). Utilization of Rice
Husk and their ash: A Review Volume 1 Issue 5 December 126-129.
Les, R. (2009).A summary of diffusion of innovations; Changeology
Mckinsey (2010); Learn how to use the 7sFramework; Ensuring that, all parts of your
organisation work in harmony.
Porter, M. E (1985); How competitive forces shape strategy.
Mike, B. (2009); How is Value-added Agriculture Explained.
Ministry of Agriculture, (2008-2018); National Rice Development strategy.
MOA, ASDSP and RiceMAPP. (2017). Agro-processors Inventory Year 2017.
Mungai, E. (2013); Social cultural factors and entrepreneurial intentions of
Undergraduate students in public universities in Kenya. Doctoral dissertation,
University of Nairobi Kenya
Mwinyikione M. and William, K. (2013); Is opportunity management a precursor to
leather Value addition initiatives? ISSN 2321-8916.
Nebojsa, et al. (2008); External and Internal factors affecting the product and business
innovation. Series: Economics and Organization Vol.5, No 1, pp. 17-29:
Norhaizan, et al. (2013); By-products of Rice Processing: Overview of Health Benefits
and Applications J Rice Res 1:1
65
Odoyo, J. (2013); Impact of access to agro-processing technologies on growth of
smallholder agro-processing industry in Bureti district. Master’s thesis,
University of Nairobi.
Paulina, M. & Kenneth W. (2013).Factor affecting Value addition in the Leather
Industry in Kenya.Vol.1, No, pp.45-55.
Ray, W. & Gavin W., (2006). Food product innovations, A background paper.
Russell, V. Length, (2001). Some practical guidelines for effective sample size
determination, March 2001
Scott, E. (2015): Creating Innovation Value: Four Key Drivers to Success
Singaravadivel, (2016). Rice processing and value addition in India; Friday, 04 March,
2016, 08: AM
Swartz E. B. (1976). Entrepreneurship .A new female frontier. Journal of contemporary
Business, 5: 47-76.

66
APPENDICES
Appendix I: Questionnaire
Research Topic: Factors influencing Innovative value creation of milled rice by
agro-processors within rice value chain in Mwea irrigation scheme
Kindly answer the following questions freely and honest. You can tick where
appropriate or write incase required to do so. Your answer and time will be highly
appreciated.
SECTION A
1. General Demographic information
i) Category of the Agro-processor
a) Large scale [ ] b) Medium scale [ ] c) Small scale [ ]
d) Group [ ] e) Technical Expert [ ]
ii) What position do you hold in the firm/group……………………………………
iii) What is your age bracket
a) Less than 20 yrs. [ ] b) 20 to 29yrs [ ] c) 30 to 39yrs [ ]
d) 40 to 50yrs [ ] e) Over 50yrs [ ]
iv) Gender [ ] (1=Male 2=Female) [ ]
v) Level of Education a) primary [ ] b) Secondary [ ] c)
Certificate [ ]
d) Diploma [ ] e) Degree [ ] f) Others [ ]
vi). Registration status of the business-Tick a) Social services b) Registrar of
companies c) Not registered d) Others-Specify
If Technical staff, leave it blank

67
SECTION B
Value creation activities
1. Please write what types of value creation activities are undertaken or what products
are processed by your firm/ group. e.g. packaging, branding, Blending, promotion and
advertising, standardization marks, Fortification logos, Barcoding, Diamond mark of
quality, Flour, baking, feed formulation, Briquette making e.t.c
Name of Innovated Product/Value
added product
Value creation made e.g. Baking, Flour, packaging,
Branding, fortification logos, diamond mark of
quality, Promotion and advertising, Standardization
marks etc.
Polished/ White rice
Baked products. e.g. cake, Buns, Rice
milk
Whole rice cookies
Rice flour
Blended rice
Feeds
Rice husk briquettes
Rice husk boards
Rice biscuits
Deep fried products e.g. Mandazi,
doughnuts, spring rolls, crackies
Body powder
Rice bran oil
Rice starch/binding agent
Others.
2. Indicate the number of years you have been in rice agro-processing/Value
creation/training
a) Less than 2 yrs. b) 2 to 3 yrs. c) 4 to 5yrs d) More than 5 yrs

68
3. i) Have the enterprise continously engaged in value creation activities to milled rice
within that period? Yes / No……………………………………..
ii) If yes, how long and why
iii)If No, how long and why
4. What do you think is the current growth status of the enterprise units dealing with
value creation/Value addition of rice and by products
i) increasing ii) Decreasing iii) Static iv) Others-Specify
Section C
Factors influencing Innovative value creation of milled rice
5) Rate the extent to which the above factors have contributed to innovative value
creation of milled rice products. Please circle or strike through as per the scale: Very
great extent =5 Great extent=4 Moderate extent =3 low extent =2 No
extent=1
a) Firm’s age or maturity
No. Statement Very
great
extent
5
Great
extent
4
Moderate
extent
3
Low
extent
2
No
Extent
1
1. I have introduced more Baked products
since the start of the enterprise
I have introduced more whole rice
cookies since start of the enterprise
I have introduced more packaged
products since start of the enterprise
I have introduced More blended rice
brands since the start of the enterprise
I have introduced more branded products
since the start of the enterprise
Others :
2. Total processing expenses increased with
growth of the enterprise
3. Method of processing has become more
complex with more new products made
69
b) Firm size and stakeholder attributes
No. Statement Very great
extent
5
Great
extent
4
Moderate
extent
3
Low
extent
2
No
Extent
1
1 Increased size of the enterprise has
caused an increase in baked products
Increased size of the enterprise has
caused an Increased branded products
Increased size of the enterprise has
caused an Increased promotion and
advertising
Increased size of the enterprise has
caused Increased amount of rice
briquettes made
- Increased size of the enterprise has
caused an increased deep fried
products made
ii) If so, has the number of permits and licenses regulating enterprise increased or
decreased?
iii) Specify the licenses.
c) Customer needs and expectation
No. Statement Very
great
extent
5
Great
extent
4
Moderate
extent
3
Low
extent
2
No
Extent
1
1. New value added products are made with
consideration of suggestions from potential
customers
70
No. Statement Very
great
extent
5
Great
extent
4
Moderate
extent
3
Low
extent
2
No
Extent
1
1 Customers liked buying the new baked
products when they were first manufactured
Customers liked the new packaged products
when they were first manufactured
Customers liked new branded products
when they were first manufactured
Customers liked the new briquettes when
they were first manufactured
Customers liked the new feeds when when
they were first manufactured
Others:
2 Demand of the baked products is currently
more than when product was first launched
Demand of feeds is currently more than
when they were first launched
Demand of the briquettes is currently more
than when they were first launched
Others –specify
3
The new Baked products had to be changed
several times to meet the needs and
expectations of the customers
Others….

71
d) Product attractiveness
What is the extent to which the named value creation processes have contributed
towards attracting potential customers for the value created product.
No. Statement Very great
extent
5
Great
extent
4
Moderate
extent
3
Low
extent
2
No
Extent
1
1. Branded
2. Packaging
3. Baking
4. Promotion/advertising
5. Standardization mark
6. Diamond mark of quality
7. Bar conding
8. Flour milling
9. Blending
10. Others –specify
11. Has the features contributed to
increase in turnover of the value
created product?
e) Product Demand
No
.
Statement Highly
frequently
5
Moderately
frequently
4
Less
frequent
3
Frequent
2
Not at
all
1
1 How frequent do the stocks of
the new rice flour run out
when promoted or advertised
How frequent do the stocks of
the new packaged and
branded products run out

72
Others-specify
2 Has there been demand
fluctuations for the new
packaged and branded
products
Has there been Demand
fluctuation for the new baked
products
Has there been Demand
fluctuation for newly blended
rice
Others-specify
iii) Was the need of the customer considered before developing the value creation
process?
No. Statement-Specify the process Very great
extent
5
Great
extent
4
Moderate
extent
3
Low
extent
2
No
Extent
1
1 e.g. Branding and packaging
2 Baking the product into e.g. cookies
3 Carrying out Promotion/advertising
4 Others-Specify
5
6
73
f) Market of the value Created Products
No
.
Statement Always
5
Monthly
4
Quarterly
3
Yearly
2
None at all
1
1 How often is market survey carried
out for baked products
How often is market survey carried
out for Packaged and branded
products
Others-Specify
2 How frequent is market promotion
done for baked products
How frequent is market promotion
done for Deep fried products
Others-Specify
3 Price of baked products depends on
target market which can be Niche or
Mass market
Price of new packaged and branded
products depend on target market
which can be Niche or mass market,
Others –specify
NB: For experts, indicate what happens for the enterprises you deal with.
74
g) Resource availability
No
.
Statement-Specify the process Very great
extent
5
Great
extent
4
Moderate
extent
3
Low
extent
2
No
Extent
1
1 Are there adequate, skilled staffs for
training/carrying out feed fortification?
Are there adequate, skilled staffs for
training/carrying out Baking activities
Are there adequate, skilled staffs for
training/carrying out Packaging and
branding
Others-
2 Is the current financial capability of the
enterprise enough to support deep
frying activities
Is the current financial capability of the
enterprise enough to support New
baking activities
Is the current financial capability of the
enterprise enough to support
promotions and advertising
Others Specify..
3 Is the current firm’s financial resource
enough to support successful
marketing of formulated feeds……
Others-specify…

75
No
.
Statement Highly
decentralized
5
slightly
decentralized
4
Averagely
Decentralized
3
Centralized
2
No budget
At all
1
1 How is the firm’s
budget controlled
No
.
Statement 1-2
Weeks
span
5
Monthly
4
Two
months
span
3
Quarterly
2
No
training
at all
1
1 How many times on average is
capacity/Training offered by
value addition experts to the
enterprise?
h) Technology availability
No. Statement High
frequently
5
Moderately
Frequent
4
less
frequently
3
Frequent
2
Not at
all
1
1 How often do the firm change
its value creation techniques/
machinery/Equipments
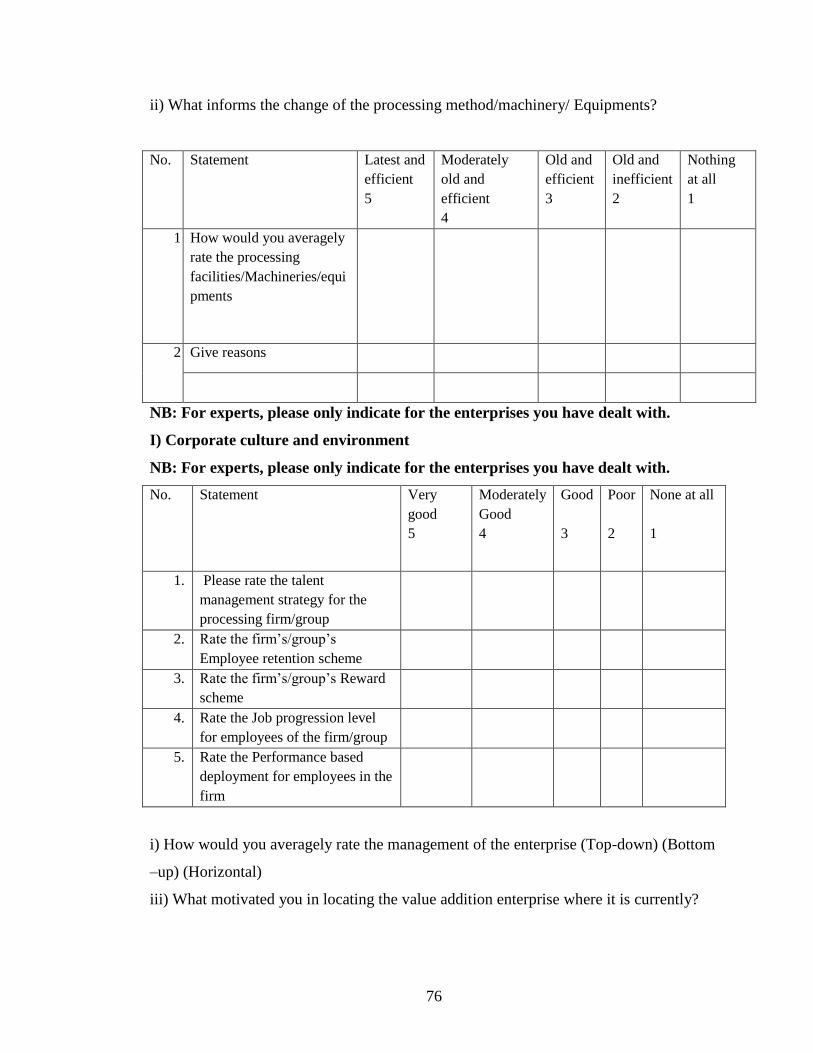
76
ii) What informs the change of the processing method/machinery/ Equipments?
No. Statement Latest and
efficient
5
Moderately
old and
efficient
4
Old and
efficient
3
Old and
inefficient
2
Nothing
at all
1
1. How would you averagely
rate the processing
facilities/Machineries/equi
pments
2. Give reasons
NB: For experts, please only indicate for the enterprises you have dealt with.
I) Corporate culture and environment
NB: For experts, please only indicate for the enterprises you have dealt with.
No. Statement Very
good
5
Moderately
Good
4
Good
3
Poor
2
None at all
1
1. Please rate the talent
management strategy for the
processing firm/group
2. Rate the firm’s/group’s
Employee retention scheme
3. Rate the firm’s/group’s Reward
scheme
4. Rate the Job progression level
for employees of the firm/group
5. Rate the Performance based
deployment for employees in the
firm
i) How would you averagely rate the management of the enterprise (Top-down) (Bottom
–up) (Horizontal)
iii) What motivated you in locating the value addition enterprise where it is currently?
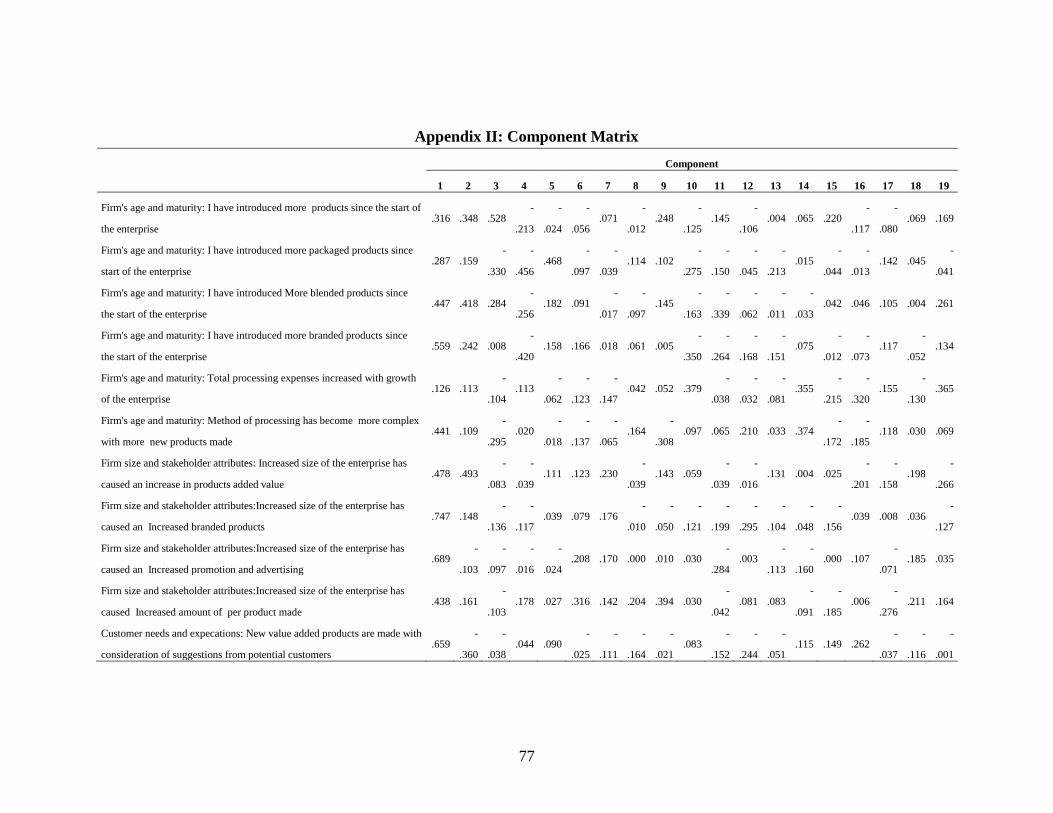
77
Appendix II: Component Matrix
Component
1 2 3 4 5 6 7 8 9 10 11 12 13 14 15 16 17 18 19
Firm's age and maturity: I have introduced more products since the start of
the enterprise .316 .348 .528
-
.213
-
.024
-
.056 .071
-
.012 .248
-
.125 .145
-
.106 .004 .065 .220
-
.117
-
.080 .069 .169
Firm's age and maturity: I have introduced more packaged products since
start of the enterprise .287 .159
-
.330
-
.456 .468
-
.097
-
.039 .114 .102
-
.275
-
.150
-
.045
-
.213 .015
-
.044
-
.013 .142 .045
-
.041
Firm's age and maturity: I have introduced More blended products since
the start of the enterprise .447 .418 .284
-
.256 .182 .091
-
.017
-
.097 .145
-
.163
-
.339
-
.062
-
.011
-
.033 .042 .046 .105 .004 .261
Firm's age and maturity: I have introduced more branded products since
the start of the enterprise .559 .242 .008
-
.420 .158 .166 .018 .061 .005
-
.350
-
.264
-
.168
-
.151 .075
-
.012
-
.073 .117
-
.052 .134
Firm's age and maturity: Total processing expenses increased with growth
of the enterprise .126 .113
-
.104 .113
-
.062
-
.123
-
.147 .042 .052 .379
-
.038
-
.032
-
.081 .355
-
.215
-
.320 .155
-
.130 .365
Firm's age and maturity: Method of processing has become more complex
with more new products made .441 .109
-
.295 .020
-
.018
-
.137
-
.065 .164
-
.308 .097 .065 .210 .033 .374
-
.172
-
.185 .118 .030 .069
Firm size and stakeholder attributes: Increased size of the enterprise has
caused an increase in products added value .478 .493
-
.083
-
.039 .111 .123 .230
-
.039 .143 .059
-
.039
-
.016 .131 .004 .025
-
.201
-
.158 .198
-
.266
Firm size and stakeholder attributes:Increased size of the enterprise has
caused an Increased branded products .747 .148
-
.136
-
.117 .039 .079 .176
-
.010
-
.050
-
.121
-
.199
-
.295
-
.104
-
.048
-
.156 .039 .008 .036
-
.127
Firm size and stakeholder attributes:Increased size of the enterprise has
caused an Increased promotion and advertising .689
-
.103
-
.097
-
.016
-
.024 .208 .170 .000 .010 .030
-
.284 .003
-
.113
-
.160 .000 .107
-
.071 .185 .035
Firm size and stakeholder attributes:Increased size of the enterprise has
caused Increased amount of per product made .438 .161
-
.103 .178 .027 .316 .142 .204 .394 .030
-
.042 .081 .083
-
.091
-
.185 .006
-
.276 .211 .164
Customer needs and expecations: New value added products are made with
consideration of suggestions from potential customers .659
-
.360
-
.038 .044 .090
-
.025
-
.111
-
.164
-
.021 .083
-
.152
-
.244
-
.051 .115 .149 .262
-
.037
-
.116
-
.001

78
Customer needs and expecations: Customers liked buying the new baked
products when they were first manufactured .022 .384 .398 .059 .005 .234
-
.063 .135 .117 .436 .250 .144
-
.219
-
.135 .049 .204 .087 .008
-
.045
Customer needs and expecations: Customers liked the new packaged
products when they were first manufactured .191
-
.245 .599
-
.026
-
.081 .179
-
.372 .262 .021 .258
-
.202 .134
-
.098 .002
-
.050 .039 .267 .021 .029
Customer needs and expecations: Customers liked new branded products
when they were first manufactured .262
-
.260 .493
-
.100
-
.019 .066
-
.404 .277 .029 .278
-
.374 .005
-
.045 .088 .027 .055 .214
-
.005 .011
Customer needs and expecations: Customers liked the new products when
they were first manufactured
-
.081 .031 .228
-
.090 .185 .157
-
.040 .167 .491 .403
-
.002 .122 .156 .384
-
.071 .010
-
.038 .059
-
.219
Customer needs and expecations: Demand of the value added products is
currently more than when product was first launched .700 .158 .092 .075
-
.134 .188
-
.067
-
.039 .056 .005
-
.100 .068 .222
-
.175
-
.032 .030
-
.246
-
.088 .013
Customer needs and expecations: Demand of feeds is currently more than
when they were first launched .488
-
.232
-
.347 .181 .102 .373
-
.233
-
.182
-
.028
-
.142 .023 .230 .036
-
.042
-
.141 .116 .092
-
.027 .107
Customer needs and expecations: Demand of bar coded is currently more
than when they were first launched .353
-
.284
-
.085 .144 .492 .239
-
.041
-
.233 .008
-
.182 .010
-
.044 .058 .304 .134 .208 .014
-
.100
-
.076
Customer needs and expecations: Demand of packaged is currently more
than when they were first launched .362
-
.228
-
.079 .128 .549 .166
-
.103
-
.183
-
.038
-
.114 .093
-
.169 .203 .216
-
.202 .145 .071 .001
-
.091
Customer needs and expecations: Demand of baked is currently more than
when they were first launched .299
-
.259
-
.154 .252 .034 .099
-
.298 .007 .483
-
.028 .181
-
.230
-
.083 .059
-
.200
-
.148 .074 .211 .139
Customer needs and expecations: Demand of branded is currently more
than when they were first launched .382
-
.302
-
.066 .104 .052 .175
-
.282
-
.029 .453
-
.138 .253
-
.270
-
.153
-
.112
-
.157
-
.065
-
.109 .142
-
.027
Customer needs and expecations: Demand of the briquettes is currently
more than when they were first launched .649 .098 .243 .014
-
.096 .170
-
.085
-
.104 .239
-
.009
-
.131 .225 .062
-
.203
-
.099
-
.007
-
.145
-
.168 .106
Customer needs and expecations: The baked products had to be changed
several times to meet the needs and expectations of the customers .396 .239 .023
-
.209
-
.412 .019
-
.087 .255 .204
-
.304
-
.128
-
.086
-
.109 .143 .174 .091 .029
-
.060
-
.046
Customer needs and expecations: The branded products had to be changed
several times to meet the needs and expectations of the customers .225 .081
-
.149
-
.025
-
.337 .337
-
.315 .192 .058
-
.155 .144
-
.223
-
.174 .261 .333 .087
-
.272
-
.236 .160

79
Customer needs and expecations: The packaged products had to be
changed several times to meet the needs and expectations of the customers .157 .021 .256
-
.003
-
.501 .369 .188 .134 .081
-
.262 .124
-
.090 .274 .256
-
.023
-
.231 .065
-
.181
-
.138
Customer needs and expecations: The bar coded products had to be
changed several times to meet the needs and expectations of the customers .062
-
.240 .478
-
.229
-
.158
-
.226 .249 .266 .202
-
.226 .035
-
.019 .176 .217
-
.067
-
.176
-
.001 .093
-
.135
Product proactiveness: Branded .710 -
.129 .050
-
.277 .260 .252
-
.190 .092
-
.111 .040 .088 .076 .074
-
.001
-
.082
-
.046
-
.140
-
.079
-
.024
Product proactiveness: Packaging .707 -
.183 .020
-
.277 .277 .187
-
.190 .145
-
.160
-
.031 .043 .104 .122
-
.016
-
.066 .004
-
.138 .008
-
.002
Product proactiveness: Baking .098 .478 .347 -
.206 .231
-
.201
-
.030
-
.209 .235
-
.014 .389 .192 .096 .064 .005 .055 .119 .057
-
.008
Product proactiveness: Promotion/advertising .551 -
.237 .102
-
.394 .054
-
.009
-
.237 .170
-
.159
-
.086 .114
-
.021 .078
-
.243 .015
-
.069 .087 .200 .049
Product proactiveness: Standardization mark .389 -
.601 .264
-
.201
-
.166
-
.135
-
.141
-
.067
-
.036 .174 .070
-
.074
-
.082
-
.072 .057 .108
-
.062 .116
-
.124
Product proactiveness: Diamond mark of quality .416 -
.459 .161
-
.059
-
.224
-
.051
-
.096 .081
-
.326
-
.022 .301 .138 .125 .061 .044
-
.132
-
.164
-
.027 .041
Product proactiveness: Bar coding .406 -
.551 .114
-
.196
-
.041
-
.094
-
.233 .139
-
.175
-
.122 .177 .038 .199
-
.144 .169
-
.066
-
.025 .259 .068
Product proactiveness: Flour milling -
.033 .128 .300
-
.334 .447
-
.380
-
.211 .112 .171 .103 .211
-
.010 .215 .013 .017 .189
-
.046
-
.115 .054
Product proactiveness: Blending .269 .091 -
.180
-
.217 .606 .116 .318 .017 .025 .177
-
.102
-
.035 .175 .033 .001 .018 .022 .079
-
.043
Product Demand: Has the features contributed to increase in turnover of
the value created product .674
-
.070 .124
-
.243
-
.043 .039
-
.126 .157
-
.054 .154
-
.068
-
.072
-
.140
-
.144 .176
-
.181
-
.122
-
.123
-
.201
Product Demand: How frequent do the stocks of the new rice flour run out
when promoted or advertised .693 .412 .012
-
.205
-
.060
-
.018 .234 .055
-
.140 .136
-
.024 .059 .107
-
.176
-
.026
-
.043 .063 .009 .015

80
Product Demand: How frequent do the stocks of the new packaged
products run out .457 .184
-
.039
-
.395
-
.099 .236 .247 .096
-
.294 .066 .025
-
.185 .025 .156
-
.035
-
.123 .001
-
.131 .022
Product Demand: How frequent do the stocks of the new branded products
run out .457
-
.097
-
.088
-
.341
-
.247
-
.244 .268 .163 .116 .074 .231
-
.280 .033
-
.222
-
.291 .115 .218
-
.037 .047
Product Demand: How frequent do the stocks bar coded products run out .377 -
.018
-
.161
-
.308
-
.274
-
.276 .310 .162 .055 .116 .297
-
.285 .082
-
.170
-
.231 .143 .034
-
.191 .024
Product demand: How frequent is there demand fluctuations for the new
packaged and branded products .222 .295
-
.362 .107 .036 .239 .088 .434
-
.034
-
.090 .265 .353
-
.079 .036
-
.053 .145 .144
-
.042 .009
Product Demand: How frequent is there Demand fluctuation for the new
baked products .079 .499
-
.197
-
.216 .014 .349 .010 .178
-
.122
-
.090 .291 .346
-
.141 .001 .021 .027 .076 .212 .082
Product Demand: How frequent is there Demand fluctuation for newly
blended rice .351 .229
-
.012 .266
-
.232 .269 .079 .439
-
.177
-
.001 .152
-
.062 .041 .098 .125 .429 .076 .063
-
.081
Product Demand: Branding and packaging .701 -
.243
-
.111
-
.104
-
.159 .168
-
.102
-
.200
-
.135 .001
-
.082 .060 .259 .102
-
.126 .108 .083
-
.072
-
.102
Product Demand: Baking the product into e.g. cookies .373 .338 .170 .099 -
.355 .125 .055
-
.429
-
.026
-
.156 .127 .144 .233 .081
-
.120 .097 .136 .043
-
.036
Product Demand: Carrying out Promotion/advertising .739 -
.168
-
.148
-
.124
-
.108 .057
-
.154 .012
-
.044 .146
-
.110
-
.103 .280
-
.116 .061 .020 .159 .034
-
.066
Market of the value created products: How often is market survey carried
out for baked products .605 .444 .012 .475
-
.025 .001
-
.156
-
.148
-
.069 .069 .142
-
.131 .029
-
.139 .107
-
.068
-
.026 .015
-
.079
Market of the value created products:How often is market survey carried
out for bar coded products .450 .282 .120 .359 .191
-
.010
-
.271 .019
-
.297 .133 .240
-
.198
-
.049
-
.148 .030
-
.177 .135
-
.037
-
.010
Market of the value created products:How often is market survey carried
out for Packaged and branded products .432 .413 .097 .451 .018 .011
-
.226
-
.165
-
.060
-
.022 .120
-
.264
-
.161
-
.023 .123
-
.125 .128 .130
-
.089
Market of the value created products:How often is market survey carried
out for refined bran .724 .198
-
.183 .262 .021 .089
-
.096 .007
-
.155
-
.018 .071
-
.079 .140
-
.053
-
.040
-
.140
-
.097
-
.049 .185

81
Market of the value created products: How frequent is market promotion
done for baked products .592 .298
-
.249 .094
-
.109
-
.246
-
.092
-
.062 .007 .161
-
.097 .015 .231 .051 .323
-
.093 .009 .208
-
.063
Market of the value created products: How frequent is market promotion
done for Deep fried products .611 .285
-
.266 .082
-
.097
-
.482
-
.234
-
.021
-
.033
-
.031
-
.201 .142 .033 .042 .073 .089 .031 .061
-
.002
Market of the value created products:How frequent is market promotion
done for packaged and branded products .628 .131
-
.263 .070
-
.184
-
.504
-
.148 .177 .111
-
.076
-
.082 .074 .046 .109 .018 .120
-
.123 .043 .027
Market of the value created products:How frequent is market promotion
done for bar coded products .606 .245
-
.259 .102
-
.245
-
.504
-
.078 .054 .150
-
.078
-
.076 .051 .027 .138 .003 .143
-
.018 .101 .064
Market of the value created products:How frequent is market promotion
done for polished rice .675 .112
-
.132 .135 .020
-
.546
-
.216 .072 .004
-
.033
-
.073 .117 .060 .058
-
.127 .084
-
.060
-
.043
-
.038
Market of the value created products:Price of baked products depends on
target market which can be Niche or Mass market .598 .160
-
.094 .164 .003 .088
-
.101
-
.042 .228 .034
-
.131 .187
-
.051
-
.133
-
.001
-
.232 .097
-
.246
-
.372
Market of the value created products:Price of new packaged depend on
target market which can be Niche or mass market .525
-
.370
-
.266 .247 .079 .019 .099 .008 .298
-
.057 .064 .163 .086
-
.122 .171
-
.162 .243
-
.190
-
.067
Market of the value created products:Price of bar coded products depends
on target market which can be Niche or Mass market .171
-
.296
-
.122 .125 .469
-
.186 .232 .168 .262 .013 .120 .072 .188
-
.100 .313
-
.107
-
.031
-
.260 .236
Market of the value created products:Price of branded products depends on
target market which can be Niche or Mass market .343
-
.421
-
.007 .257
-
.299
-
.014 .136
-
.017 .297
-
.271 .019 .197
-
.016
-
.150 .060 .092 .306
-
.164 .006
Resource availability: There adequate, skilled staffs for training/carrying
out feed fortification .278 .431 .456 .307 .286
-
.150 .056 .106
-
.083
-
.064 .114
-
.133
-
.036 .039 .069 .117 .027
-
.153
-
.075
Resource availability:There adequate, skilled staffs for training/carrying
out Baking activities .270 .245 .506 .212 .390
-
.224 .114 .072
-
.162
-
.152 .082
-
.131 .045
-
.038
-
.018 .051 .004
-
.115 .018
Resource availability:There adequate, skilled staffs for training/carrying
out Packaging and branding .408
-
.339 .184 .249 .279
-
.180
-
.070 .142
-
.186
-
.361 .111 .128
-
.236 .025
-
.044
-
.164 .081 .046
-
.031
Resource availability:There adequate, skilled staffs for training/carrying
out Packaging and branding .168
-
.400 .234 .253 .126
-
.238 .245 .279 .006
-
.375
-
.010 .184
-
.134 .060 .019
-
.057
-
.068 .132
-
.153

82
Resource availability:The current financial capability of the enterprise is
enough to support deep frying activities .467 .066 .532 .356
-
.106 .045 .225
-
.105 .006
-
.095
-
.178 .062
-
.004 .022
-
.018 .037 .045 .189 .155
Resource availability:The current financial capability of the enterprise is
enough to support New baking activities .426
-
.163 .510 .371
-
.064 .057 .431
-
.051
-
.153
-
.027
-
.199 .034 .033 .045
-
.082 .061
-
.034 .083 .098
Resource availability:The current financial capability of the enterprise is
enough to support promotions and advertising .522
-
.282 .284 .457
-
.005
-
.064 .250
-
.031
-
.145 .131
-
.056
-
.107 .078 .045
-
.208
-
.006
-
.056
-
.054 .129
Resource availability:The current financial capability of the enterprise is
enough to support bar coding .186
-
.156
-
.149 .253 .262 .044 .322 .521
-
.120 .181
-
.188 .140
-
.045
-
.028 .083
-
.040
-
.144
-
.028 .039
Resource availability:The current financial capability of the enterprise is
enough to support promotions and advertising .348
-
.183
-
.244 .473 .042 .009 .184 .360 .098 .225 .100
-
.296
-
.159 .116
-
.080 .073
-
.036 .094
-
.095
Technology availability: How often do the firm change its value creation
techniques/ machinery/Equipments .681 .228 .264
-
.126 .050
-
.037
-
.053
-
.154 .000
-
.051 .075 .190
-
.276 .003
-
.157
-
.037
-
.187
-
.158 .007
Technology availability: How would you averagely rate the processing
facilities/Machineries/equipments .515
-
.154 .118
-
.164
-
.121
-
.195
-
.086
-
.277
-
.033 .044 .143 .231
-
.376 .114
-
.274 .095
-
.283
-
.086
-
.115
Corporate culture and environment: Please rate the talent management
strategy for the processing firm/group .508
-
.262 .022
-
.249 .058 .090 .268
-
.344
-
.040 .058 .231
-
.004
-
.059 .242 .231 .097 .057 .160 .063
Corporate culture and environment: Rate the firm’s/group’s Employee
retention scheme .638
-
.191
-
.128
-
.004
-
.049
-
.132 .247
-
.248 .170 .307 .022 .129
-
.078 .028 .171 .034
-
.032
-
.066 .079
Corporate culture and environment: Rate the firm’s/group’s Reward
scheme .627
-
.291
-
.032
-
.091 .020 .092 .363
-
.153 .090 .114 .191 .093
-
.231
-
.090 .189 .024 .088 .008 .111
Corporate culture and environment: Rate the Job progression level for
employees of the firm/group .621
-
.238
-
.097
-
.177
-
.159
-
.003 .204
-
.241
-
.025 .241 .073 .010
-
.149 .209 .193
-
.144 .062 .121 .012
Corporate culture and environment: Rate the Performance based
deployment for employees in the firm .664 .072
-
.045
-
.190 .062
-
.144 .285
-
.104
-
.083 .080
-
.047 .005
-
.347 .042
-
.034
-
.074 .091
-
.051
-
.114
Extraction Method: Principal Component Analysis.
a. 19 components extracted.
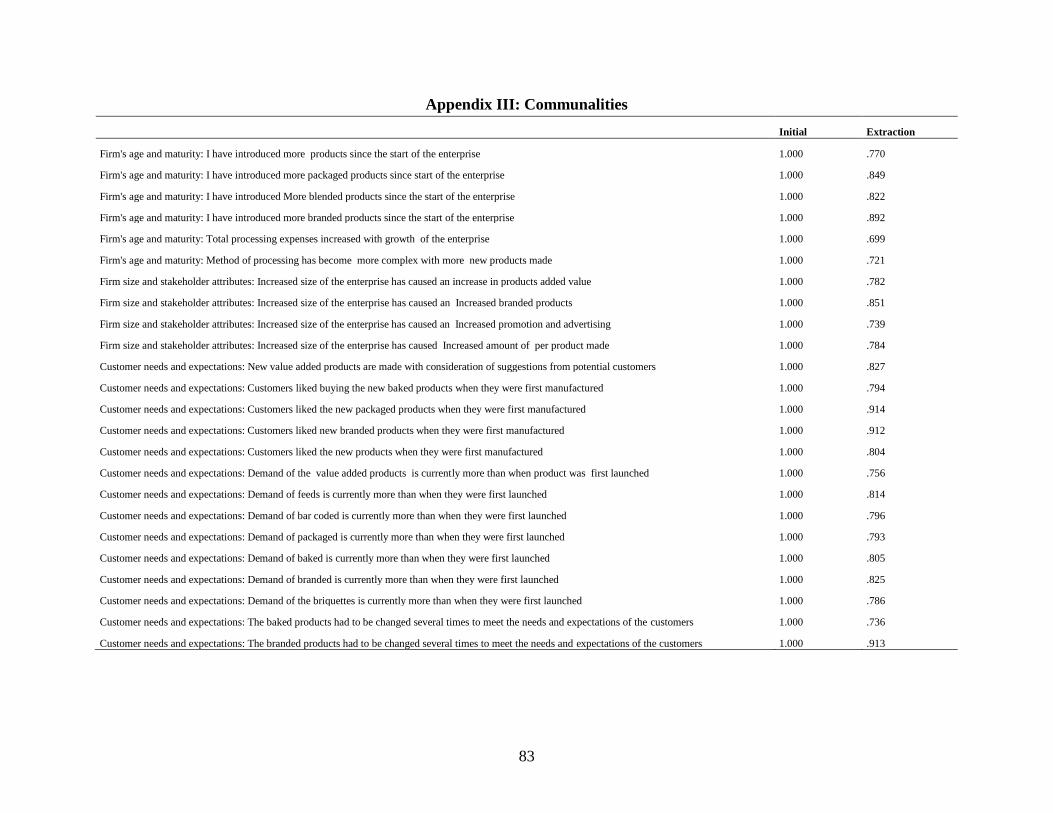
83
Appendix III: Communalities
Initial Extraction
Firm's age and maturity: I have introduced more products since the start of the enterprise 1.000 .770
Firm's age and maturity: I have introduced more packaged products since start of the enterprise 1.000 .849
Firm's age and maturity: I have introduced More blended products since the start of the enterprise 1.000 .822
Firm's age and maturity: I have introduced more branded products since the start of the enterprise 1.000 .892
Firm's age and maturity: Total processing expenses increased with growth of the enterprise 1.000 .699
Firm's age and maturity: Method of processing has become more complex with more new products made 1.000 .721
Firm size and stakeholder attributes: Increased size of the enterprise has caused an increase in products added value 1.000 .782
Firm size and stakeholder attributes: Increased size of the enterprise has caused an Increased branded products 1.000 .851
Firm size and stakeholder attributes: Increased size of the enterprise has caused an Increased promotion and advertising 1.000 .739
Firm size and stakeholder attributes: Increased size of the enterprise has caused Increased amount of per product made 1.000 .784
Customer needs and expectations: New value added products are made with consideration of suggestions from potential customers 1.000 .827
Customer needs and expectations: Customers liked buying the new baked products when they were first manufactured 1.000 .794
Customer needs and expectations: Customers liked the new packaged products when they were first manufactured 1.000 .914
Customer needs and expectations: Customers liked new branded products when they were first manufactured 1.000 .912
Customer needs and expectations: Customers liked the new products when they were first manufactured 1.000 .804
Customer needs and expectations: Demand of the value added products is currently more than when product was first launched 1.000 .756
Customer needs and expectations: Demand of feeds is currently more than when they were first launched 1.000 .814
Customer needs and expectations: Demand of bar coded is currently more than when they were first launched 1.000 .796
Customer needs and expectations: Demand of packaged is currently more than when they were first launched 1.000 .793
Customer needs and expectations: Demand of baked is currently more than when they were first launched 1.000 .805
Customer needs and expectations: Demand of branded is currently more than when they were first launched 1.000 .825
Customer needs and expectations: Demand of the briquettes is currently more than when they were first launched 1.000 .786
Customer needs and expectations: The baked products had to be changed several times to meet the needs and expectations of the customers 1.000 .736
Customer needs and expectations: The branded products had to be changed several times to meet the needs and expectations of the customers 1.000 .913
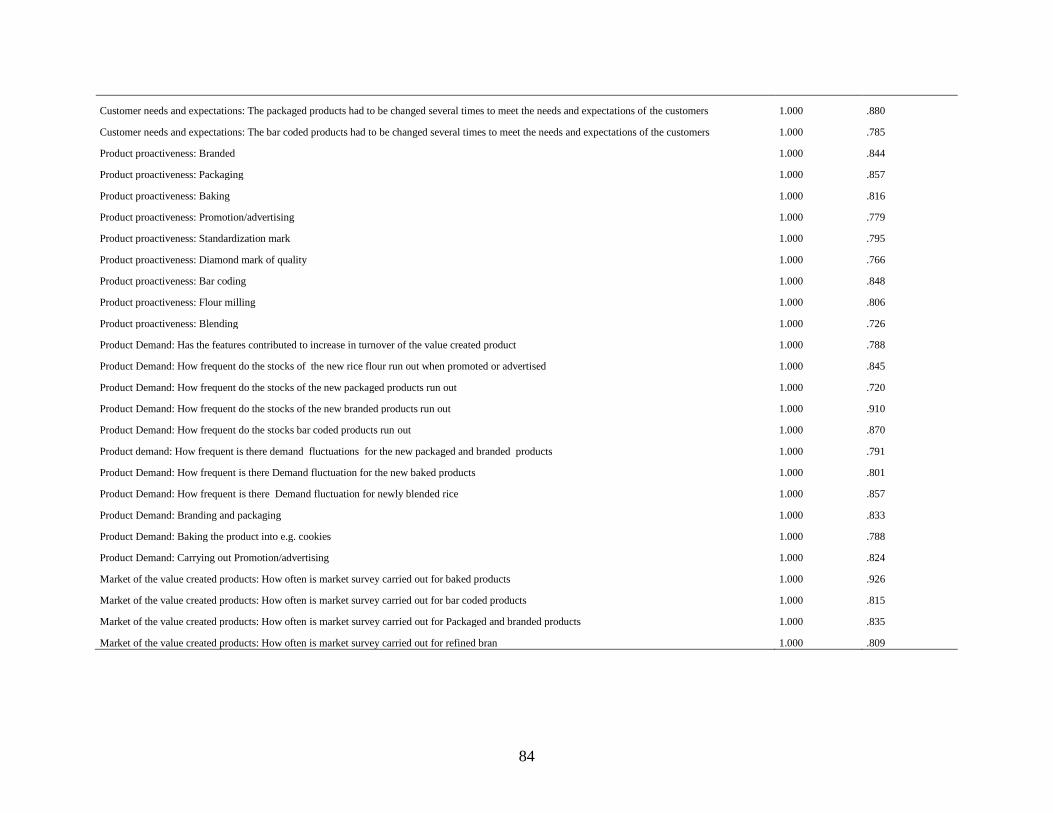
84
Customer needs and expectations: The packaged products had to be changed several times to meet the needs and expectations of the customers 1.000 .880
Customer needs and expectations: The bar coded products had to be changed several times to meet the needs and expectations of the customers 1.000 .785
Product proactiveness: Branded 1.000 .844
Product proactiveness: Packaging 1.000 .857
Product proactiveness: Baking 1.000 .816
Product proactiveness: Promotion/advertising 1.000 .779
Product proactiveness: Standardization mark 1.000 .795
Product proactiveness: Diamond mark of quality 1.000 .766
Product proactiveness: Bar coding 1.000 .848
Product proactiveness: Flour milling 1.000 .806
Product proactiveness: Blending 1.000 .726
Product Demand: Has the features contributed to increase in turnover of the value created product 1.000 .788
Product Demand: How frequent do the stocks of the new rice flour run out when promoted or advertised 1.000 .845
Product Demand: How frequent do the stocks of the new packaged products run out 1.000 .720
Product Demand: How frequent do the stocks of the new branded products run out 1.000 .910
Product Demand: How frequent do the stocks bar coded products run out 1.000 .870
Product demand: How frequent is there demand fluctuations for the new packaged and branded products 1.000 .791
Product Demand: How frequent is there Demand fluctuation for the new baked products 1.000 .801
Product Demand: How frequent is there Demand fluctuation for newly blended rice 1.000 .857
Product Demand: Branding and packaging 1.000 .833
Product Demand: Baking the product into e.g. cookies 1.000 .788
Product Demand: Carrying out Promotion/advertising 1.000 .824
Market of the value created products: How often is market survey carried out for baked products 1.000 .926
Market of the value created products: How often is market survey carried out for bar coded products 1.000 .815
Market of the value created products: How often is market survey carried out for Packaged and branded products 1.000 .835
Market of the value created products: How often is market survey carried out for refined bran 1.000 .809
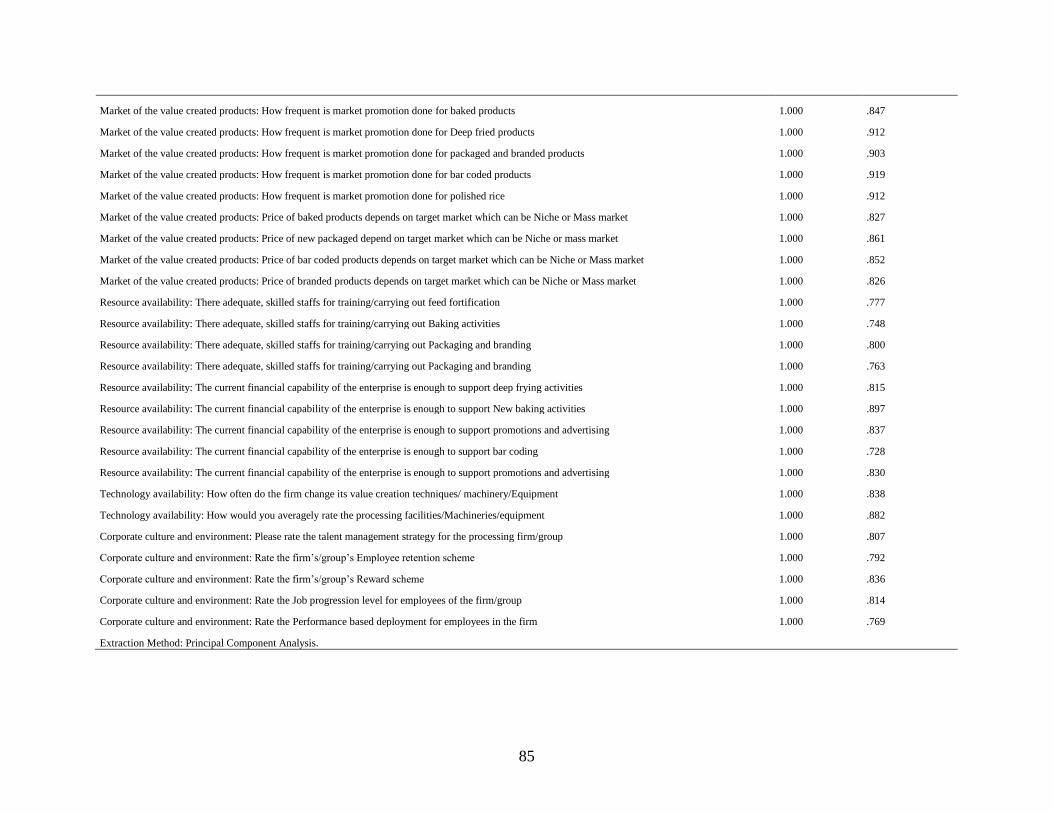
85
Market of the value created products: How frequent is market promotion done for baked products 1.000 .847
Market of the value created products: How frequent is market promotion done for Deep fried products 1.000 .912
Market of the value created products: How frequent is market promotion done for packaged and branded products 1.000 .903
Market of the value created products: How frequent is market promotion done for bar coded products 1.000 .919
Market of the value created products: How frequent is market promotion done for polished rice 1.000 .912
Market of the value created products: Price of baked products depends on target market which can be Niche or Mass market 1.000 .827
Market of the value created products: Price of new packaged depend on target market which can be Niche or mass market 1.000 .861
Market of the value created products: Price of bar coded products depends on target market which can be Niche or Mass market 1.000 .852
Market of the value created products: Price of branded products depends on target market which can be Niche or Mass market 1.000 .826
Resource availability: There adequate, skilled staffs for training/carrying out feed fortification 1.000 .777
Resource availability: There adequate, skilled staffs for training/carrying out Baking activities 1.000 .748
Resource availability: There adequate, skilled staffs for training/carrying out Packaging and branding 1.000 .800
Resource availability: There adequate, skilled staffs for training/carrying out Packaging and branding 1.000 .763
Resource availability: The current financial capability of the enterprise is enough to support deep frying activities 1.000 .815
Resource availability: The current financial capability of the enterprise is enough to support New baking activities 1.000 .897
Resource availability: The current financial capability of the enterprise is enough to support promotions and advertising 1.000 .837
Resource availability: The current financial capability of the enterprise is enough to support bar coding 1.000 .728
Resource availability: The current financial capability of the enterprise is enough to support promotions and advertising 1.000 .830
Technology availability: How often do the firm change its value creation techniques/ machinery/Equipment 1.000 .838
Technology availability: How would you averagely rate the processing facilities/Machineries/equipment 1.000 .882
Corporate culture and environment: Please rate the talent management strategy for the processing firm/group 1.000 .807
Corporate culture and environment: Rate the firm’s/group’s Employee retention scheme 1.000 .792
Corporate culture and environment: Rate the firm’s/group’s Reward scheme 1.000 .836
Corporate culture and environment: Rate the Job progression level for employees of the firm/group 1.000 .814
Corporate culture and environment: Rate the Performance based deployment for employees in the firm 1.000 .769
Extraction Method: Principal Component Analysis.