FACTORS INFLUENCING DRIVERS’ SPEEDING BEHAVIOUR Henriette Wallén Warner @
35
FACTORS INFLUENCING FACTORS INFLUENCING DRIVERS’ SPEEDING DRIVERS’ SPEEDING BEHAVIOUR BEHAVIOUR Henriette Wallén Warner Henriette Wallén Warner @ @
-
Upload
aubrie-watkins -
Category
Documents
-
view
221 -
download
1
Transcript of FACTORS INFLUENCING DRIVERS’ SPEEDING BEHAVIOUR Henriette Wallén Warner @
FACTORS INFLUENCINGFACTORS INFLUENCINGDRIVERS’ SPEEDING DRIVERS’ SPEEDING
BEHAVIOURBEHAVIOURHenriette Wallén WarnerHenriette Wallén Warner
@@

”This must never happen again!” Coroner, 1896

SpeedSpeed
The power modelThe power model(Nilsson, 2000) (Nilsson, 2000)
U-shaped relationshipU-shaped relationship(Solomon, 1964)(Solomon, 1964)

Risk Perception

ISA- Intelligent Speed Adaptation
Technical systems that are intended to help drivers keep the right speed

Different typs of ISA
• informative• warning• intervening• overtaking

ISA- in Sweden
Swedish National Road Administration1999-20024500 vehicles4 cities
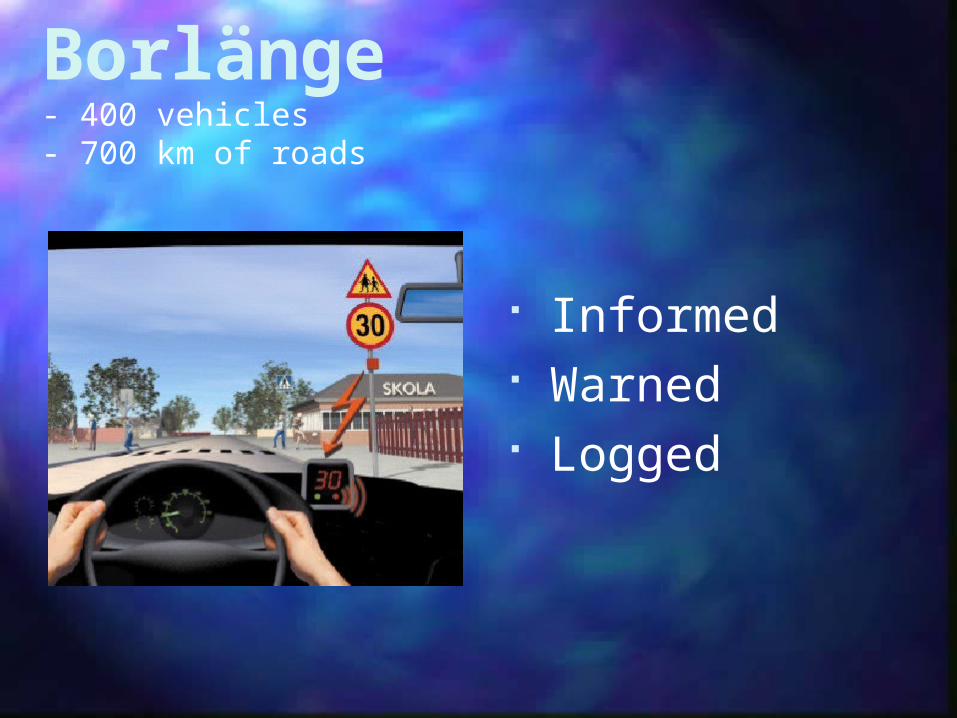
Borlänge- 400 vehicles- 700 km of roads
Informed Warned Logged

Theory of Planned BehaviourTheory of Planned Behaviour(TPB)(TPB)
BehaviourBehaviourNormativa Normativa
BeliefsBeliefsSubjective Subjective
NormNorm IntentionIntention
Perceived Perceived Behavioural Behavioural
ControlControl
AttitudeAttitude
ControlControlBeliefsBeliefs
BehaviouralBehaviouralBeliefsBeliefs
(Ajzen, 1991)(Ajzen, 1991)
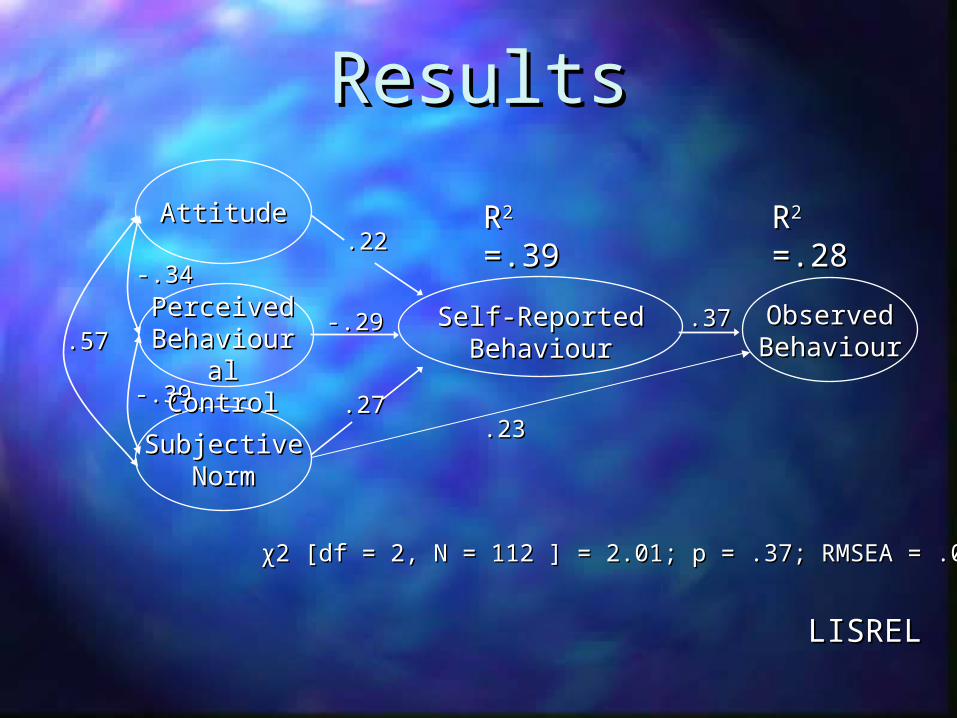
ResultsResults
AttitudeAttitude
SubjectiveSubjectiveNormNorm
Self-ReportedSelf-ReportedBehaviourBehaviour
ObservedObservedBehaviourBehaviour
LISRELLISREL
.22.22
.27.27
.37.37
RR2 2 =.39=.39 RR2 2 =.28=.28
-.29-.29
-.34-.34
-.39-.39
.57.57 Perceived Perceived
Behavioural Behavioural ControlControl
.23.23
χ2 [df = 2, N = 112 ] = 2.01; p = .37; RMSEA = .008χ2 [df = 2, N = 112 ] = 2.01; p = .37; RMSEA = .008

Conclusion
The study demonstrated that the The study demonstrated that the TPB, with some modifications, TPB, with some modifications, can be used to predict and can be used to predict and understand drivers’ intention and understand drivers’ intention and everyday speeding behavioureveryday speeding behaviour
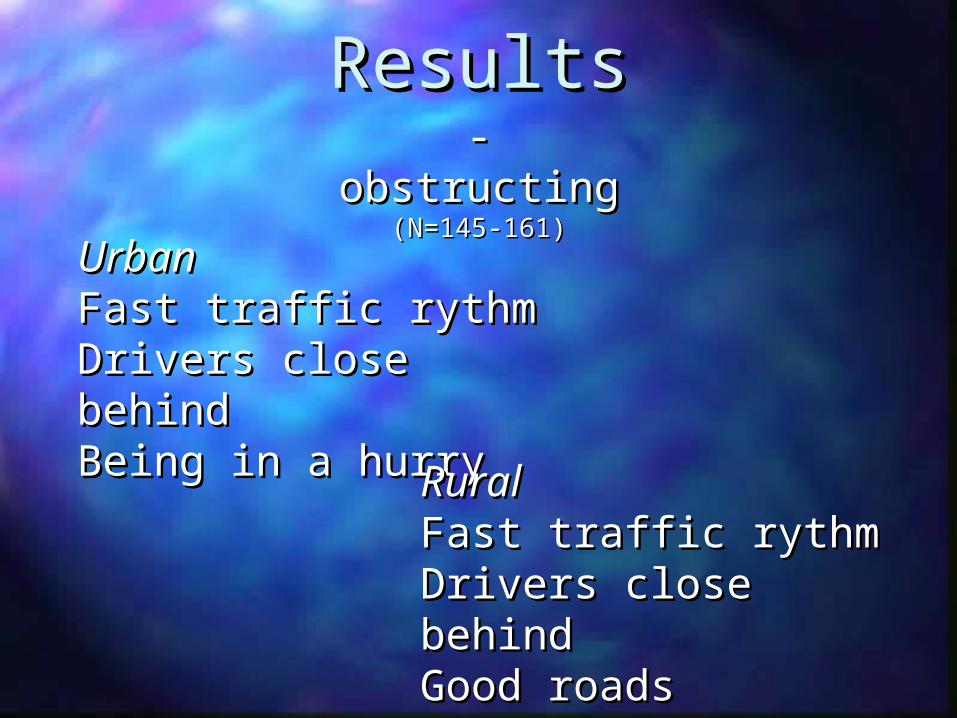
ResultsResults- obstructing- obstructing
(N=145-161)(N=145-161)
UrbanUrbanFast traffic rythmFast traffic rythmDrivers close behindDrivers close behindBeing in a hurryBeing in a hurry
RuralRuralFast traffic rythmFast traffic rythmDrivers close behindDrivers close behindGood roadsGood roads

ResultsResults- facilitating- facilitating
(N=145-161)(N=145-161)
UrbanUrbanIncreased accident riskIncreased accident riskPeople along the roadsPeople along the roadsSpeed reducing measures (humps)Speed reducing measures (humps)
RuralRuralSerious consequencesSerious consequencesPeople living along the roadsPeople living along the roadsLarge penaltiesLarge penalties
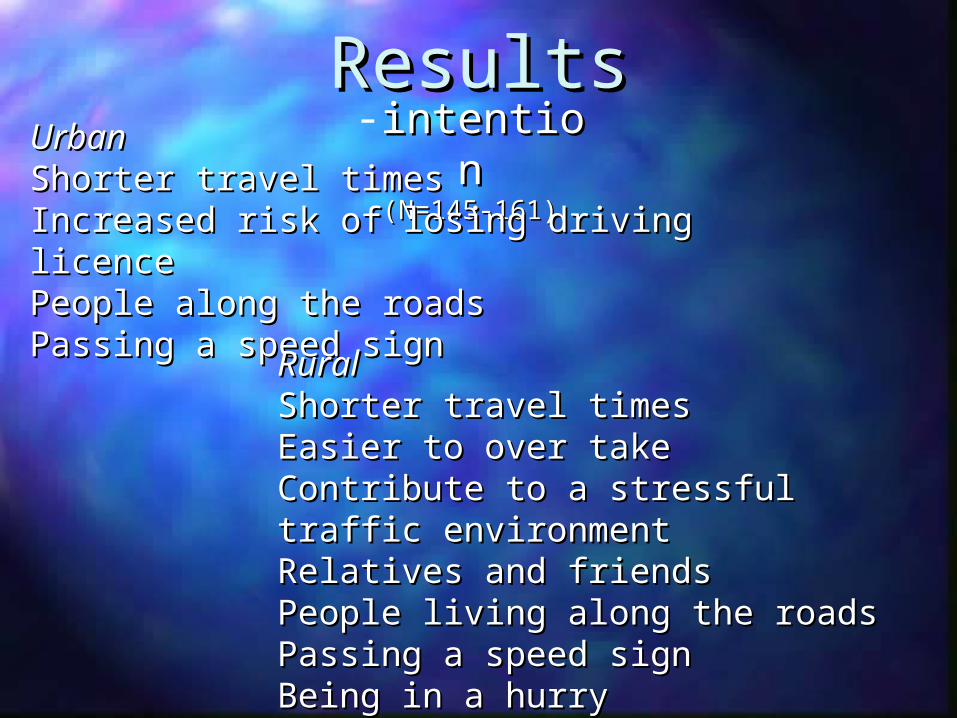
ResultsResults-intentionintention(N=145-161)(N=145-161)
UrbanUrbanShorter travel timesShorter travel timesIncreased risk of losing driving licenceIncreased risk of losing driving licencePeople along the roadsPeople along the roadsPassing a speed signPassing a speed sign
RuralRuralShorter travel timesShorter travel timesEasier to over takeEasier to over takeContribute to a stressful traffic environmentContribute to a stressful traffic environmentRelatives and friendsRelatives and friendsPeople living along the roadsPeople living along the roadsPassing a speed signPassing a speed signBeing in a hurryBeing in a hurry

Countermeasures
• information/education• enforcement (negative or positive)
• physical measures (road or invehicle)
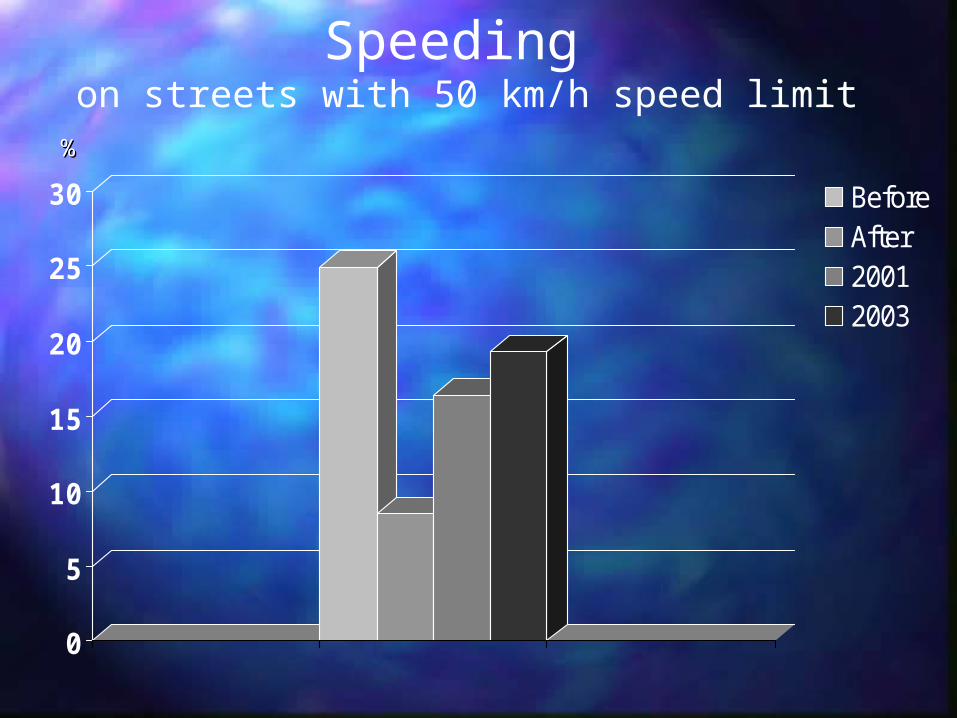
Speeding on streets with 50 km/h speed limit
0
5
10
15
20
25
30 BeforeAfter20012003
%%

ConclusionsConclusions
Initially the informing ISA speed-warning Initially the informing ISA speed-warning device reduces the amount of time device reduces the amount of time drivers spend speedingdrivers spend speeding
- but this effect decreases with time- but this effect decreases with time

Driving Experience
Feeling controlled ***Safety in trafficAttention of pedestriansTravel time in urban areas *Irritation in traffic **Stress in traffic

Driving Behaviour
Feeling of being in the wayLooking at the speedometer ***Need for paying attentionFeeling of frustrationFeeling of time pressureNeed for effortNeed for accelerating/brakingBeing a better driver **

Acceptance of ISA(van der Laan, 1997)
Usefulness
Satisfaction

Where is ISA most desirable?at schools and day nurseries with 30 km/hat schools and day nurseries with 50 km/h housing estates with 30 km/hin urban areas with 30 km/hin housing estates with 50 km/h
in rural areas with 70 km/hin urban areas during night timein rural areas with 90 km/hin rural areas with 110 km/h on highways with 110 km/h
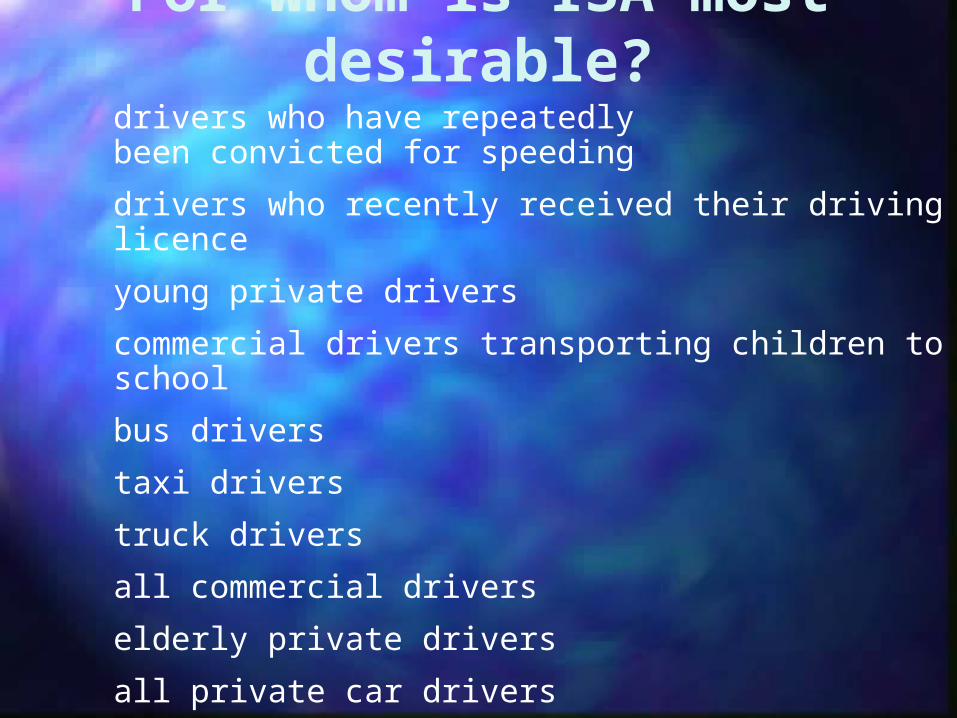
For Whom is ISA most desirable?drivers who have repeatedlybeen convicted for speeding
drivers who recently received their driving licence
young private drivers
commercial drivers transporting children to school
bus drivers
taxi drivers
truck drivers
all commercial drivers
elderly private drivers
all private car drivers
Speed Reducing Measure
Urban areas *
Rural areas

Global Perspective(WHO, 2004)
Globally2004: 1.2 million killedVulnerable road users (especially elderly, children and disabled) in low- and middle-income countries shoulder a large proportion
High income countries27% decrease of road traffic deaths between 2004 and 2020
Low and middle income countries83% increase of road traffic deaths between 2004 and 2020

Sweden (n=37) -25 : 3
25-50 : 2250- : 12
31 men; 6 women
Nigeria (n=28) -25 : 125-50 : 2150- : 428 men; 0 women
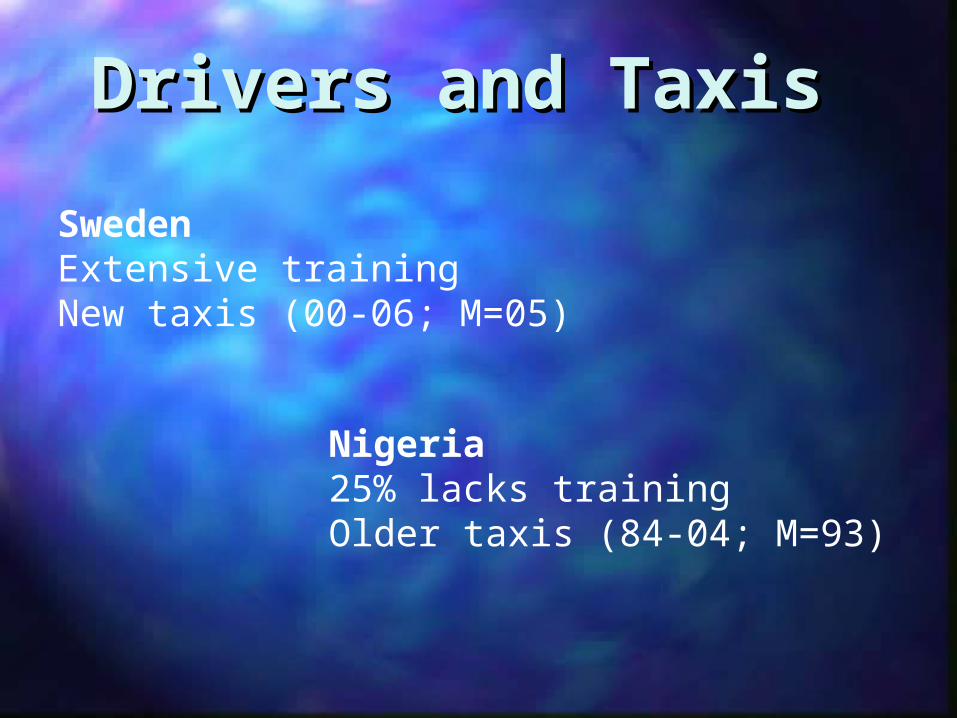
SwedenExtensive trainingNew taxis (00-06; M=05)
Nigeria25% lacks trainingOlder taxis (84-04; M=93)
Drivers and TaxisDrivers and Taxis

Index
Sweden
mean (SD)
Nigeria
mean (SD)
t-value
Hindered: urban areas 1.19
(0.32)
1.15
(0.19)
ns
Hindered: rural areas 1.55
(0.33)
1.49
(0.34)
ns
Driving is:
1=safe; 2=dangerous
1.32
(0.32)
1.98
(0.07)
11.04
Traffic environmentTraffic environment
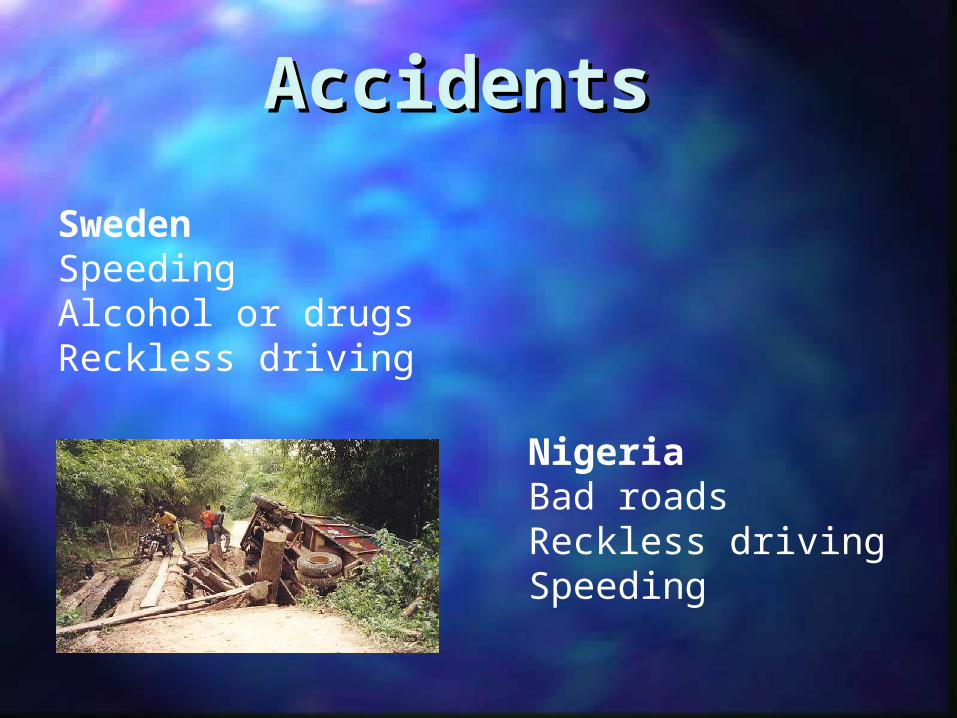
SwedenSpeedingAlcohol or drugs Reckless driving
NigeriaBad roads Reckless drivingSpeeding
AccidentsAccidents

Sweden Nigeria22% 83%
FateFate
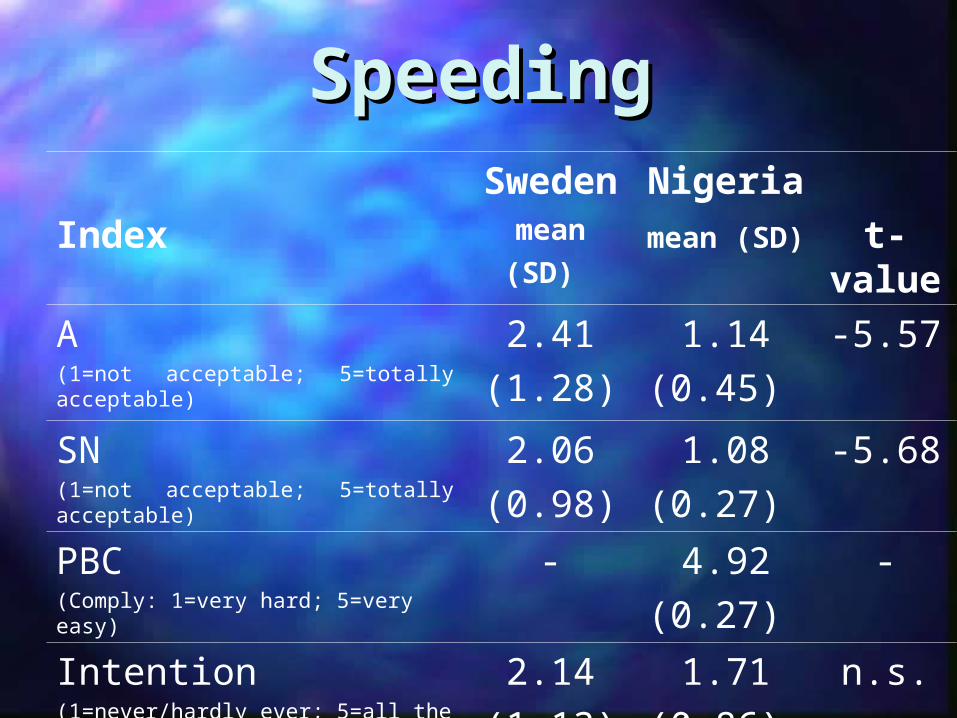
Index
Sweden
mean (SD)
Nigeria
mean (SD)
t-value
A(1=not acceptable; 5=totally acceptable)
2.41
(1.28)
1.14
(0.45)
-5.57
SN(1=not acceptable; 5=totally acceptable)
2.06
(0.98)
1.08
(0.27)
-5.68
PBC(Comply: 1=very hard; 5=very easy)
- 4.92
(0.27)
-
Intention(1=never/hardly ever; 5=all the time)
2.14
(1.13)
1.71
(0.86)
n.s.
SpeedingSpeeding

Index
Sweden
mean (SD)
Nigeria
mean (SD)
t-value
A(1=not acceptable; 5=totally acceptable)
1.14
(0.48)
1.00
(0.00)
n.s.
SN(1=not acceptable; 5=totally acceptable)
1.00
(0.00)
1.04
(0.19)
n.s
PBC(Comply: 1=very hard; 5=very easy)
- 5.00
(0.00)
-
Intention(1=never/hardly ever; 5=all the time)
1.00
(0.00)
1.13
(0.45)
n.s.
Drinking and drivingDrinking and driving

Index
Sweden
mean (SD)
Nigeria
mean (SD)
t-value
A(1=not acceptable; 5=totally acceptable)
1.59
(1.09)
1.25
(0.58)
n.s.
SN(1=not acceptable; 5=totally acceptable)
1.36
(0.64)
1.27
(0.60)
n.s
PBC(Comply: 1=very hard; 5=very easy)
- 4.81
(0.49)
-
Intention(1=never/hardly ever; 5=all the time)
1.41
(0.90)
1.58
(0.88)
n.s.
Not using seat-beltsNot using seat-belts

Index
Sweden
mean (SD)
Nigeria
mean (SD)
t-value
A(1=not acceptable; 5=totally acceptable)
1.65
(0.68)
1.00
(0.00)
-5.84
SN(1=not acceptable; 5=totally acceptable)
1.51
(0.74)
1.04
(0.20)
-3.63
PBC(Comply: 1=very hard; 5=very easy)
- 5.00
(0.00)
-
Intention(1=never/hardly ever; 5=all the time)
1.22
(0.48)
1.17
(0.48)
n.s.
Driving a car with bad tyresDriving a car with bad tyres

Conclusion
The focus of traffic safety research has to shift from
the road users in high-income countries to the road users in low- and middle-income countries

FRÅGOR??
Henriette Wallén WarnerHenriette Wallén Warner
@@