
Factors Influencing Adoption Of The Electricity Prepayment ...
88
FACTORS INFLUENCING ADOPTION OF THE ELECTRICITY PREPAYMENT METERING SYSTEM: A CASE OF MAKADARA AND EMBAKASI DIVISIONS, NAIRORI PROVINCE." \f IIV SIM IVU VIOI.F.T Ml KOSI A RESEARCH PROJECT SUBMITTED IN PARTIAL FULFILMENT FOR Till Rl <>l IRIMI.NT Ol I III: AWARD OFTI1E DECREE OF MASTER OF ARTS IN PRO.IFCT PI.ANNINC AND MANAGEMENT OF THE UNIVERSITY OF NAIROBI. 1 M vium iiiiiji o &32T ibo mm 2010
Transcript of Factors Influencing Adoption Of The Electricity Prepayment ...

FACTORS INFLUENCING ADOPTION OF THE ELECTRICITY PREPAYMENT METERING SYSTEM: A
CASE OF MAKADARA AND EMBAKASI DIVISIONS,NAIRORI PROVINCE."
\ f
IIVSIM IVU VIOI.F.T Ml KOSI
A RESEARCH PROJECT SUBMITTED IN PARTIAL FULFILMENT FOR T ill Rl <>l IRIM I.NT Ol I III: AWARD OFTI1E DECREE OF MASTER OF ARTS IN
PRO.IFCT PI.ANNINC AND MANAGEMENT OF THE UNIVERSITY OF NAIROBI.
1
M v iu m ii i i i j io&32Tibo mm
2010

DECLARATION
11m project proposal is my original work and has not been submitted for an award or degree in any other University.
Signed .... Date.. .....
SIMIN I VIOLET N1IIKOSII.W722(hV2MI8
Tliis Research project has been submitted for examination with my approval as the University Supervisor
l)K. C HRISTOPHER OAKIUI IC II KKR: DEPARTMENT OF EXTRA MURA I STUDIES
ii

DEDICATION
This proposal is a dedication to my father I rcdcrick Ngachi Simiyu (deceased - 2003) who
never hesitated to oiler Ins words of wisdom and good consul. He said "Mum. Education lias
no limit and it has no end. Whatever you achieve is your success, nobody will ever take that
away from you. It is not in vain and it shall never l»e pul to waste - so stiive on!" What u
motivation what an Inspiration! lo my dear children Stelany and Coney - 1 could never have
wanted to give you more, than being the best role model a mother could ever be
iii

ACKNOWLK l)GMKNTS
I wish lo express my profound gratitude to till who supported me in this study. Greatly
acknowledged is my supervisor l)r Christopher Gakuu; o f the University o f Nairobi, for the
scholarly advice, encouragement and guidance. I lis being my research methods lecturer,
gave me a proper insight hence the road map to research. I also applaud all my course
lecturers for preparing me for this work Their advice and encouragement was immeasurable
for it enabled me to forge forward with the determination to succeed.
This research project would not have been possible without the support of I nginecr F.luid
l-into • Project I nginecr Line Construction ami Engineer John Wckesa Project Engineer
Large Power and Prepayment: both of KPLC. 1 heir knowledge on the subject matter
enhanced my insight on the study and this greatly inspired me.
I am forever indebted to my beloved mother - Concepla Naliaka Simiyu, who believes in me
ami has always encouraged me to pursue further studies. Her inspiration, prayers and good
counsel, propel me forward. It is a constant reminder that I can make it. My heartfelt
gratitude and mdebtness gives to my brother Njalalc for the financial support whenever I
reached out: My sister-in-law lahithu and Sella, for the emotional, spiritual and moral
support - it was immeasurable. My sincere thanks lo Margaret Kimani - she is a friend
indeed. The support given to me by each one was continuous and this was very encouraging,
may God immensely hlcss you all.
IV

ABSTRACT
KI’LC implemented a prepayment system in Nairobi (currently on pilot) which was to he
rolled-out countrywide if successful. Prepayment refers to the payment of services to the
utility or service providers before those services arc actually rendered. In this case Iveing pre
paid electricity. The Technology helps customers manage their power budgets, avoid
disconnection for non-payment o f hills meaning no more disconnections and reconnection
fees required ami no more waiting foi reconnection alter payment This technology also
enables customers avoid queuing to pay their bills over the counter No more hills or
erroneous reading and with the convenience of purchase and the instantaneous supply on
loading of cicdit thanks to a 2-lhr and widely distributed vending system made possible,
where credit tokens can be sold by third party vendors or through GSM technology like M
Pesa, customers monitor and control electricity usage. Similar electricity prepayment
models have been cited in several countries in Africa and m the West, which have applied the
technology and adopted it. Countries like South Africa. India. Chinn, in some I IS slates ami
in the I 'k . The purpose of this study was to investigate the factors influencing the adoption of
the electricity prepayment metering system amongst live residents of Makadara ami Embakasi
divisions o f Nairobi province The objectives and research questions of this study were to
establish how ami to what extent the following factors Intlucnccd the adoption of the new
electricity prepayment metering system: Access to information or luck of it. the level of
education, economic stums, the benefits of the prepayment metering system and the Income
levels Using the Descriptive Survey design, the researcher attempted to correlate these
factors and establish how they influenced the consumer's adoptability of the new technology
The aim was also to gauge the success of the prepayment project based on the number of
residents in the pilot phase who had adopted this system. Data was collected using
questionnaires with open-ended and close-ended questions and interviews. The study
revealed that a good percentage of Nairobi's residents would prcfci the electricity
prepayment metering system as opposed to postpaid. However since the population
countrywide is not yet exhausted, with extensive marketing from the power utility - to create
awareness and disseminate information, more customers arc likely to Ive brought on board.
v

TABLE OF CONTENTSPage
DECLARATION...........................................................................................................................iiDEDICATION............................................................................................................................. ivACKNOWLEDGEMENT...........................................................................................................iiia b s t r a c t ...................................................................................................................................vTABLE OF CONTENTS.............................................................................................................viMSI OF TABLES......................................................................................................................viiiLIST OF FIGURES......................................................................................................................ixlist o f a b b r e v ia i io n s a n d a c r o n y m s .................................................................... x
CllAFTER ONE: IN IROIHICTION
1 .1 Background of the Study...................................................................................................I1.2 Statement of the Problem.................................................................................................. 2l | Purpose of the Study.......................................................................................................... 31.4 Research Objectives............................................................... 31.5 Kesearc h Questions............................................................................................................ 3I f> Significance o f the Study....................................................................................................41.7 Assumptions of the study.................................................................................................. 41.8 I imitationsofllic Study................................................................................................... 41.9 Delimitation of the study....................................................................................................51.10 Definition of Significant Terms....................................................................................... 5M l Summary..............................................................................................................................7
CHAPTER TWO; I.ITKKATURF. REVIEW
2.1 Introduction........................................................................................................................X2.2 I listory of Prepayment Metering System.........................................................................X2.J Technology-related studies based on Rogers’ Theory.................................................... 132.4 Innovation Dilfusion theory.......................................................................................... 172.5 four main Elements In the Diffusion of Innovations.....................................................IX2.6 The Innovation-Decision Process.................................................................................. 202.7 Attributes o f Innovations and rate of Adoption.............................................................242.8 Adopter Categories..........................................................................................................272.9 Factors that influence Adoption..................................................................................... 292.10 Prepayment Pilot Project Implementation Strategy..................................................... 302.11 Conceptual Framework.................................................................................................... 32
( IIAPTER I HREF.: RESEARCH METHODOLOGY
3.1 Introduction................................. 341.2 Research Design.............................................................................................................. 343.3 Target Population............................................................................................................ 353.4 Sampling Procedure........................................................................................................35L> Methods o f Data Collection..............................................................................................363.6 OpcnUional definition of variables........................................................................... .373.7 Methods o f Data Analysis.............................................................................................. 393.8 Summary.......................................................................................................................... .39
vi

CHAPTER FOUR: DATA PRESENTATION, ANALYSES AM) INTERPRETATION
4.1 Introduction............................................................................................................................... 414.2 Demographic Profile o f Respondents................................................................................... 4 14.3 Level o f Education....................................................................................................................424.4 Economic status........................................................................................................................434.5 Level o f income .......................................................................................................................434.6 Prepaid Electricity - Awareness..............................................................................................444.7 Benefits/Advantages o f prepaid m eters................................................................................ 444.8 Information on Prepaid meters................................................................................................464.9 Observation on resistance o f prepaid metering system....................................................... 46
CH APTER FIVE: SUMMARY O F FINDINGS, DISCUSSION. RECOM M ENDATIONS AND CONCLUSION
5.1 Introduction............................................................................................................................... 485.2 Summary o f finding................................................................................................................. 485.3 Conclusions................................................................................................................................505.4 Recommendations.....................................................................................................................51REFERENCES.................................................................................................................... 53APPENDICES....................................................................................................................................... 57Appendix 1: Letter o f transmittal.........................................................................................................57Appendix 2: Questionnaires on factors influencing the New Pre-Paid Electricity meter........... 58Appendix 3: Interview Guideline........................................................................................................ 63Appendix 4: User Guide ................................................................................................................. 66
vii

LIST OF TABLESPane
table 3.1 Hie Stratification of the Sample.......................................................................36Table 3.2 The Operationalization o f variables....................................................... ... .39
Table 4 .1 Age o f Respondents......................................................................................... 1
Table 4.2 (tender of Respondents.................................................................................... 42
Table 4.3 Marital Status o f Respondents......................................................................... ,J2
Table 4.4 level ofEdneation............................................................................................. ........
I able 4.3 Economic Status................................................................................................. .........
I able 4.6 l evel of Income........................................................................................ ........43
Table 4.7 Prepaid Electricity......................................................................................................
Table 4.8 HcncfitsMdvanlagcs of the prepaid electricity................................................45
Table 4.9 Level of those who preferred prepaid Electricity.............................................45
Table 4.10 Disadvantages of prepaid meters..................................................................... 45
Table 4.11 Information on prepaid meters..........................................................................46
Table 4.12 Early Adopters and Late Adopters................................................................... 47
Table 5.1 Tlic findings of the study.................................................................................. 4X
viii

LIST OF FIGURESPa«c
Figure I The prepayment system works.......................................................... 14
Figure 2 Din Mounted Split Metering Technology...................................... 15
Figure 3 Concc|><iinl framework.................................................................... 3 ?
IX

LIST OF ABBREVIATIONS AND AC RONYMS
ATM Automated Teller Machines
C'KLC’A Co-operative 1 Icctrica 1 imitada tie Carmen tie Arcco
( 1)1 Credit Dispensing 1 'nil
H D Customer Interface Unit
< VS Common Vending System
i > nu 1 >elhi State Regulator
ED l-lectrioity Dispenser
EDI electronic Data Interchange
ENG hngincer (Refers to one's title)
l l ( 11 ricctricily Regulatory Board
(.'OK Government of Kenya
GPRS General Packet Radio Service
GSM Global System for Mobile CommunicationIIPSF.WII Himachal Pradesh State lilectricity Board
IEC International Flcctro-technical Committee
IS Infomtation Systems
IT 1 n format ion TechnologyI.AN I.ocjiI Area Network
KPI .C Kenya Power and lighting Company
MCD Meter Control l Init
MDGs Millennium Development GoalsM-PISA Brand name for money transfer for SafaricomNDPL New Delhi Power 1 td
SABS South Afrienn Bureau of StamlardsSMS System Master Station
SIS Standard 1 ransfer SysremTAM Technology Acceptance Model TheoryUK United KingdomUSA United Slates of AmericaWAN Wide Area Network
WBSI'.DCI. West Bengal State Plectricity Distribution Company l tdZAP Brand name for money transfer forZnin
x

CHAPTER ONE
INTRODUCTION
l . | Haihgmuml of lIn* study
I hr idea o f prepayment metering system was conceived by KI’I.C in the year 2004. the
management adopted it as a strategic vehicle that could be used in managing some of the
challenges facing the organization, litis strategic business concept was in turn sold to the
Board of Directors and it received their consideration and approval on 2Xlh April 2005.
following the Hoards approval, the general planning of the project started in earnest This
involved gelling the necessary regulatory approvals from the Electricity Regulatory Hoard
(HUH). This was achieved on 5"' Oetolicr 2005 and the approvals from the government of
Kenya (CiOK) - Ministry of Energy on 11th October 2005.
Report on the review of prepayment pilot protect: Eng Rosemary Gitongn 15/02/2010. A
budget of Kslis 118,2 10,000.00 for 25.000 meters along with management systems and other
accessories was approved in respect o f 2008/2000 budget for the pilot project. With the
aforementioned, the first electricity prepayment meter was installed on 29th April. 2009
1.1.1 Prepayment system
Prepayment refers to the payment of services to the utility or service providers before those
services arc actually rendered. In this case credit is purchased beforehand and must be
replenished before its expiry to avoid automatic discontinuation of services offered by the
provider.
1.1.2 Need for Prepayment
In its endeavor to delight its customers, KPLC hail proactively been researching for a
technology that would not only leverage it ns a viable utility but also bench mark it with the
bcsl performing utilities in the developing world. The following were the corporate objectives
iliat drove the company to prepaid system: I'o overcome commercial cycle challenges, loss
Reduction, decongestion ot KPI C Hanking halls, improvement on Customer Service and
dcmnml side management.
I

, I J I he Kenya Power A lighting ( oiu|ianv IJmllcd:
K.IM C is the only utility tluit engages in ihc transmission, distribution, ami retail of electricity
throughout Kenya. It buys electricity, generated from hydro-power, gns/diesel, geothermal
(steamI. and wind sources, in hulk from various independent power producers and distributes
t.t approximately 600,000 customers. Ihc company has a network of transmission and
distribution lines that stretch for approximately 23.000 kilometers. Hie Kenya Power &
I ighting Company is based in Nairobi, Kenya http://www.kplc.co.ke/
The company said the electricity prcpa>ment model had been applied both in Africa and in
the West. A numbet of African countries hud adopted the technology including South Africa,
Sudan, I'an/nniu, Angola, Rwanda, Lesotho. Zambia, Ghana. and Mozambique "Electricity
prepayment technology has also been implemented in developed nations like the UK and in
some US stales This technology won hi help customers manage their power budgets, uvoid
disconnection for non-payment of bills and help them avoid queuing to pay their bills over the
counter.
1.2 Statement of the Problem
The bureaucracy consumers go through when seeking reconnection after their power supply is
disconnected, was typical o f the hustles customers go through with the current post paid
metering system. I he introduction of the prepaid system was a promising indicator that the
long queues at Kenya Power and I ighting Company payment centers could soon lie history.
Congested banking halls, long queues that are lime consuming and all manner of
inconveniences are just hut a few of the problems associated with reconnection and settling of
electricity hills The question arising was, were Ihc customers willing to adopt the pie-paid
electricity metering system? Given the inconveniences/ disadvantages associated with Ihc post
paid metering system and with the rate o f diffusion o f the new technology, how did this
enhance adoptability? This study seeks to establish ihc factors that Influenced the
adoptiou/acce|>tubiUty of the pie-paid metering system. I'o-datc approximately only 25,000
domestic consumers have been connected to the prepaid metering system Gitonga (2010).
This indicates that the majority of the Kenyan electricity consumers are on Ihc postpaid
system, therefore they fall victim to the inconveniences associated with the post-paid system as
indicated above.
2

I j purpose of llic Simly
|1>c intent of ihc study is to investigate the factors influencing the adoption of the pre-paid
electricity meter system in Makaduru and limhakasi divisions of Nairobi province. I hc study
aimed at establishing the extent to which each of the following objectives, influenced the level
of adoptability: Access to information or lack of it. the level of education, economic stains, the
benefits of the pnejuyment metering system and the income levels.
1.4 Research Objectives
I he study had live objectives as listed below
1. To establish how access to information or lack of it. influences the consumer's
perception on adoption o f the electricity prepayment metering system
2. t o investigate how the consumer's level of education, influences their adoption of
the electricity prepayment metering system.
3. To examine the extent to which the economic stums of the consumer influences
their adoption of the electricity prepayment metering system.
4. lo establish tlic level at which tl»e awareness o f the benefiis/advantugcs of the
prepayment metering system influence the consumer's adoption o f the electricity
prepayment metering system
5. lo investigate the extent at which ihc income levels o f the consumer influence Ihcir adoption of the electricity prepayment metering system.
1.5 Ucstuircli Ones!unis
In view of the problem statement, the study aims ul addressing the following research
questions regarding adoption of tlic electricity prepayment metering system.
1. How diws information or lack of it, influence the readiness ol the consumer in
adopting the electricity prepayment metering system?
2. How docs ihc level of education of the consumer influence their adoption of the
electricity prepayment metering system?
3. How would the economic status o f a consumer influence his/her adoption of the
electricity prepayment metering system?
4. How do the benetits/advantages of the electricity prepayment metering system
influence the consumer’s adoption of this system?
5. How do ihc levels of income of the consumer influence their adoption o f the
electricity prepayment metering system?
3

1.6
It j> hoped that the* finds from the .study will enlighten the consumer on matters pertaining to
the new pre-paid meter paying system It is also evident from the study that dissemination of
information enables the consumer lo make informed decisions on prepaid electricity and with
Intense marketing of the product by the service provider, it liicilitnlcs the rate of diffusion and
significantly enhances adoptability. Arising from the study, the highlighted
hencfilvadvnntng.es of the technology will not only dceongcst bunking halls hut also give the
consumer a visual indication of their electricity consumption rate This allows the consumer
manage their own electricity usage, enables them to visually monitor their power consumption
rate and avoid disconnection charges tor non-payment, fhe study establishes thru the
electricity prepayment metering system provides the consumer with a convenient system for
purchasing electricity conveniently.
I."? Assumptions of the Study
1. Hie estates chosen as a pilot to the project represent Nairobi province as a whole
2. I1»c views expressed by the sample population represents the views of the
residents of Nairobi.
3. The results o f the findings shall he a true representation of the views of Nairobi’s
residents on prepaid electricity. r
I.H I .uuii.itunis of the Study
1.8.1 Factors that presented challenges
The study was limited to Nairobi's pilot estates lot pre-paid meters, mainly in Makadara and
Lmbukasi divisions. Being a limited geographical area (compared to the whole population of
Nairobi’s) the results can only be taken as u general overview of Nairobi residents. Secondly,
not all the residents in Nairobi may have been uwarc of the electricity prepayment metering
system prior to installation, their adoption of the technology may have been based on other
factors other than those mentioned in the study. Lastly, electricity prepayment being a new
technology, the level of ignorance on the subject was high. I'hc researcher had some difficulty
in analyzing data collected by questionnaires. Information on this system needed more intense
dissemination to create vast awareness.
Significance «»f the Study
• I

Ihc estate* chosen in the pilot project ns u sample, were representative o f the entire
population (in this case being the residents of Nairobi). Ihc generalization can only be limited
in Nairobi because the project it is still limited to Nairobi To create awareness and .11 part ot
their marketing strategy, s Kl’l ( ' embarked on educating the customers on what the electricity
prepayment concept was all about, on how to purchase credit and where to purchase it (vending
stations) How to read their customer interface unit (CIIJ) and meters, so that they may know
when they need to re purchase their Credit. How to update credit on their CIIJ and meter, on
how to know how much credit they have available at any given time and how to take care of
dteir CHI and meter And on who to contact if they experienced problems with the CIU and
meters (Helplines and call center complaints handling) can now be reached on the following
direct landlinc. 020 - 320IOOO. and mobile numbers 0711 031000 and 0732 111000. The call
center also served as a feedback link between KPLC and the consumer. This enabled the service
provider to address other factors that could be inhibiting the level of adoptability and to address
the customer’s complaints. The consumer was also sprovided with a user- guide/ manual to
enhance their knowledge on prepayment. I lie rcsctuvlicr used personal interviews to triangulate
data collected Dent the questionnaires. Dissemination of information was intensified through
the media f l V and Newspapers) to inform and educate consumers. Learning being a continuous
process, with time people became aware of innovations thus more receptive to change.
1.10 Definition of Significant Terms
1.10.1 Adoption
It is a (enn used to refer to an act o f acceptability to change, Ik? it in the form of new
technology, system or w ay o f life
Adoption is similar to diffusion except that it deals with the psychological processes an
individual goes through, rather than an aggregate market process. In economics it is more often
named "technological change”. Hiffusinn is ihc process by which a new idea or new product is
accepted by the market. I he rale of diffusion is the speed at which the new idea spreads from
one consumer to the next.
, Delimitation of the Study

, 10.2 < on.'BBicr/Custonier
•\ll user* ofelcctricity for Domestic use - Domestic Consumer:
Domestic use Includes, lighting, hcatlng/boiling of water for bathing for instance and cooking.
, I0.J Pro-paid meter (prepayment system)
Refers to consumers wins tlrst have the pre-paid meter gadget installed in their premises or
house It also refers to those consumers who purchase units in the form o f kilowatts, in advance
and loud into the pre-pnid meter for domestic use. Consumers who enjoy the luxury of
controlling their monthly electricity consumption.
1.10.4 Post-paid meter (paying system)
Refers to consumers who mainly would l>c classified in the category of Industrial consumers
Industrial use includes welding, manufacturing o f various goods by mechanical or engineering
works, heating/ hailing for heavy duty purposes for instance processing of foodstuff. It also
refers lo the majority of domestic consumers who have not yet been connected to the prepaid
meter system (Jiven that the project is still in its initial stage, the set target of connecting
250,000 consumers to the pre-paid system by December 2010, is still in progress.
1.10.5 Technology
It is a process by which human beings modify nature to meet their needs and wants. Technology
is otten thought in terms of aitifacts like software or an irrigation system hut it is more Ilian
these tangible products. It includes the entire infrastructure of design, manufacture, operation,
modifications, and repairs o f the technological artifacts. IIht knowledge, engineering, technical
'kills all implored in the development of the artifact are all essential and very crucial In this
case, for instance Actaris Measurements & Systems from South Africa, is a global prepayment
technology provider I lie technology anil the Customer Interface Unit are advanced by ActarU
this is the system that KPLC acquired to further advance this technology
1.10.6 token
I his is credit for reloading, basically referred to as "llmcmc time”
6

1.10.7 Pilot Project
I he sc arc the initial targeted estates for installation of prepaid electricity meters. I hey were
twenty (20) in number, all located in Nairobi and with a targeted population of 25.000 residents.
I he Shi88 million pilot project’s target was to switch 25.000 customers from the postpaid to
the prepaid system by end o f February 2010. I hc project launched in April 2000,had installed
15 317 meters in a number o f city estates by December 22nJ 2000. I hc estates included
tioldcngulc South B. Plainsvicw. River Bank. Villa franca, Imara Duima, and Nynyo
Hmbakasi.
1.11 Summary
I his chapter dealt with the introduction to the study The main objective was to highlight the
factors that would influence the adoption o f the new pre-paid meter paying system This study is
justifiable because once the consumer adopts the pre paid meter paying system, it will not only
dccongest banking hulls but will allow customers to have a visual indication of their electricity
consumption rate, and will also allow them to manage their own electricity usage. It shall enable
the customers to visually monitor their power consumption rate and avoid disconnection
charges lor non-payment, as well as provide a convenient system for them to purchase
electricity conveniently.
7

CH A FFER TW O
LITERATURE REVIEW
2.| Introduction
1 hi* chapter provided iilc.is iluii informed the study. The theoretical hasis of the study and the
maior variables that influenced the adoption o f new technology or innovations were considered.
Ihe researcher attempted to propose the adoption of pre-paid electricity as Opposed to post
piiid, based on models and concepts from past research on diffusion on innovations of new
technology- Hie substantial level o f investigative activity to date into information systems and
technology acceptance and diffusion witnessed the use o f a wide range of exploratory
techniques examining different systems and technologies in countless different contexts. The
aim of this chapter was to provide a comprehensive and systematic review o f the literature
pertaining to such adoption and diffusion issues in order to ascertain the current "state of play"
of the field along a number o f dimensions. Information on a series of variables was extracted
after conducting a review on articles on Innovation adoption, acceptance and diffusion,
published in various reviewed journals especially on detailed review of Rogers’ diffusion of
innovations theory.
2 2 History of Prepayment Metering System
Prepaid electricity metering systems are being used in more than 10 countries worldwide and
more countries are seriously considering its implementation with many trials underway.
2.2.1 Review
In the UK, the system has been in use lor well over 70 years with about f» million meters
installed out of a total o f 45 million electricity and gas meters Further, mechanical prepayment
meters used to lie common In rented accommodation. Disadvantages of these included the
need for regular visits to remove cash, and risk of theft o f the cash in ihe meter. Modern solid*
Mate electricity meters, in conjunction with smart cards, have removed these disadvantages.
The prepayment type of meters wcie commonly used for customers considered lo be a poor
credit risk. Payments were usually cushioned using a system known as PayPoinl network,
where rechargeable tokens (Quantum cards lor natural gas. or plastic "keys" for electricity)
tout,| he loaded w ith whatever money the customer had available, l ater smartcards were then
X

introduced ^ much reliable tokens that allowed two way data exchange between meter and the
utility*
In the United States there are approximately 3.000 electricity utilities and prepayment
electricity services have been offered in recent years by a small number of municipal and c<r-
operative utilities. Only a tew thousand Customers had been served by prepaid metering in the
US but the method was popular with those customers, who liked paying for power when it
wined them, as opposed to when the bill come. 1 hey were also able to see the amount of power
they were using, and adjusted their habits to save when necessary. One of the major obstacles
to prepaid service in the US w as the cost of the customer-site equipment The installed cost of
the meter phis customer display cost more than 20 times the cost o f a conventional watt-hour
meter! However, economic analyses showed that utilities were able to serve some customers
with prepaid service at considerable savings compared to conventional, postpaid service.
Notably, prepayment was not for everyone in N<*rth America, but for many consumers and
suppliers it become a preferred way of doing business, www.abscnctgyiescarch.cnm
In 1993, Cnshpowcr Sudamcricana, Landis A- Qyr's distributor in Argentina, began marketing
the Cashpower prepayment system at a time when some 87% o f the population in Argentina
had access to electricity. During the previous year. Cashpower Siidumcriennn had embarked
upon an intensive marketing study to evaluate the reaction of users und utilities towards
prepayment metering ami prepayment systems. Keypad technology was identified as the most
suitable. During the period I ‘>*>J to 1994, more than 20 co-operatives in Argentina adopted the
Cashpower system, replacing conventional meters with prepayment meters. Towards the end
oi 1994, cooperatives not previously using prepayment technology began implementing it but
opted for a cheaper prepayment system in the form or magnetic card meters. This proved to l»c
a costly mistake. Today, in Argentina, there are approximately ISO co-opcrativcs that have
implemented prepayment systems using keypad technology, while only three or four are still
using the magnetic card concept; and these few ate in the process of changing over. Ihe
implementation of prepayment metering by CIZLCA (Co-operative Electric.! Limltada tie
Carmen do Arcco) provided an interesting example of how prepayment electricity supply
technology was initiated in Argentina CF.I CA had over 5,000 users in the city ol Carmen dc
Aieco, 140km west of Buenos Aires City. Ihe co-operative was characteristic or the private
distribution companies that had actively initiated a prepayment strategy In May 1996, the co
operative implemented a prepayment system in the province of Buenos Aires The main reason
9

for installing prepayment electricity meter* was to find a solution lor the very high rate of
overdue invoices. Delayed payment or non-payment of these invoices averaged nearly 26% of
CUIX*A‘* total monthly turnover at the time. I rom the'outset, consumer icsjumsc was highly
positive, and surprisingly, even chronic late payers adapted well to the new system and became
excellent customers o f the co-operative
In tlx: Indian Power Sector, Prepayment Metering is slowly and gradually gaining a foothold.
Various utilities in India had embarked upon this journey w ith approval from the Regulatory
bodies. New Delhi Power I td (NDPL), West Bengal State Electricity Distribution Co. Ltd
(WBSEDCL). Himachal Pradesh State Electricity Hoard (IIPSEB), had all joined the
prepayment bandwagon. NDPI. was the tirst private utility to introduce the system for
domestic consumers whereas WBSKDCL was the first State Electricity Board to have gone for
prepayment At present many other utilities like IIPSEB and Assum Distribution Company, arc
using the prepayment metering system So far the experiences from the trials have been fairly
successful. They have brought to the fore minor problems o f moving from a conventional
postpaid system to a prepayment system and few major ones such as farill rationalization.
Realizing the benefits o f prepayment system, the Delhi Slate Government made it mandatory
for a ll its offices in the year 2607. As per the order o f Delhi State Government all ( iovernnient
Consumers under Delhi State Government with Single or Three Phase connections and a
maximum load up to 45 k\V were to be shifted from post-paid meters to advanced keypad
based pre paid meters. I lic Delhi Slate Regulator (1)1 RC) also came forward in support of
prepaid meters and announced a 2% rebate on the tarill lor pro-paid consumers.
In ( hina, Shanghai Electric Meter Worts (Shanghai Metering Works) was set up in Jamiurs
W .t The largest scale enterprise, had been grow ing steadily and at present. Shaghai Metering
which consists o f over 15 wholly owned and holding manufacturers is one of the largest
manufacturers of metering instruments in China. It passed the ISO9001 attestation in 1997 and
oilier international technical certificates. Amongst its main products arc such as prepayment
metering systems. I he products arc exported to Europe, United States, I alin America and
ASIA by its reliable quality and reasonable prices. It is in great demand in many countries and
areas and gets favorable comments of the users.
10

2 2.2 KcRM'nul Perspective
llic prepaid programme in South Africa was started in 1992 und since then they have installed
over 4 million prepayment meters. Prior to 1988 Eskom supplied electricity mainly to large
customers like mines and municipalities. Although I skom was at that stage already one of the
l1|(gest electricity generators in the world, they only had alxmt 120 000 customers and all of
them were on billctl accounts. In 1988 Lskom developed the "lileclriclty for All" concept
intended to supply electricity directly to the large masses of domestic customers that did not
have access to electricity at that stage. Some o f the problems to overcome included the
following:
t Many customers had to be supported by the smallest numlter o f Eskom personnel. The
system therefore had to operate with a low level o f management and maintenance. The
standard billctl system simply required too much day-to day management to process
accounts and to maintain connections and disconnections.
2, Many of the areas where potential customers resided had almost no
infrastructure. Ilterc were no fixed addresses lor customers, they did not have
permanent jobs or bank accounts and there were no postal services in those areas. All
these were requirements for a billed system to operate effectively.
J Many customers were illiterate and did not understand (or have the budget) to pay for
fixed charges or bills that arrived only after the electricity had been consumed
l o address these ami other problems, Eskom started the development of the basic prepayment
system that is currently still m use. This system consisted of:
1. Prepayments meters (also called Electricity Dispensers or EDs)
2. Vending Machines where the customer can purchase electricity credit (known ns Credit
Dispensing Units or CD Us)
J. Data Concentrators dial managed the CDUs and collected the transaction data from the
I 'Dlls (Also called System Master Stations or SMSs).
Hie South African liureau ot Standards produced the lust national prepayment meter
specification. SABS specification in 1990 with input from the NRS009 specification and it
5000 ^Placed the old NRS specification completely. I he total contract was steadily increased
*° n ,0,“* °l 200 IKMi meters lor 199.1 and 300 000 per year from 1994 until the year 2000.
II

During I‘>93 Eskom also idemilied the need to standardize the vending systems to be able to
*11 electricity from one system to meters from various manufacturers. Eskom embarked on a
program to standardize the EDs and the vending process and issued an enquiry for a vending
system based on a draft specification and for l-Ds to accompany it. Soon thereafter
development was started in conjunction with Conlog to design and build the new Common
Vending System (CVS).
l o enable the new vending system to transfer credit to all types of meters it was also necessary
to develop a standard transfer medium and protocol to the meters This was also part o f the
project and thus the "Standard Transfer Specification" SIS was horn. This Common
Vending System and the SIS meters form the basis of the prepayment system as it exists today
in Eskom.
The Standard Transfer Specification (STS) has become recognized as the only globally
accepted open standard for prepayment systems, ensuring inter-operability between system
components from different manufacturers of prepayment systems. The application of the
technology is licensed through the STS Association, thus ensuring that the appropriate
encryption key management practices aie applied to protect the security of the prepayment
transactions o f utilities operating STS systems. It has become established as u do facto
worldwide standard for transfer of electricity prepayment tokens since its initial introduction in
South Africa in 1993. And subsequently it’s publication by the International Electrotechnical
Commission as the IEC62055 series o f specifications.
The specifications were further improved over the years and are today adopted as the standard
by electricity utilities in South Africa. South Africa is now seen as a world leader in
prepayment technology and many other countries have adopted their standards as well.
The SANSI52-I specification from the SABS was used as a major source during the
development of the international li e specification for payment meters. Further more, the STS
standard has since been adopted by the IEC . and the SI'S Association is currently working on the development ofSTS2.
2.2.3 l‘re |i.ml iiic lrrin g in Kenvu
I repaid metering systems are known to reduce system load due to the enhanced customer
consciousness In energy conservation. I his formed part of tl»e basis for KPLC’s decision to
12

adopt this technology. Energy systems are the key drivers o f economic and social
development globally, especially electrical energy. To keep up with the rapidly rising demand
for electricity, the Electricity generating companies worldwide planned on tripling their
j-i-ncrating capacities by 2015*2020. Most of the new plunis built would bum fossil oil This
trend led to greatly increased emissions of carbon dioxide and other greenhouse gases which
l*eame u global concern due to climate change. Therefore, measures that would increase the
elite lent use of energy were imperative especially in developing countries which do not readily
attract investors in energy generation due to perceived political risks. I lencc. utilities in these
countries had to embrace Demand Side Management initiatives, which KPI.C did.
findings suggest that the positivist paradigm, empirical and quantitative research, the survey
method and Technology Acceptance Model • I AM theory - have been utilized predominantly
when investigating the topics o f adoption and dilTusion of technology or to study an
assortment of adoption and diffusion related issues. Recently, Information Systems • IS
researchers begun stretching their reach beyond the commonly addressed organization and
user perspectives. For example, studies related specifically to the adoption of technology
within the household context began to emerge (Dwivedi ct al. 2006; Venkatesh and Brown,
2001, 2003; 2005) adding yet farther variability to the body of existing research in terms of
contexts and units ol analysis.
2.3 l eclmoliigy-relalcd studies based on Rogers" Theory
Rogers (19X3) proposes innovation diffusion theory to explain how innovation spreads.
Innovation diffasion is defined as the process by which an innovation is communicated
through certain channels over time among the members of a social system" (Rogers 19X3).
Swanson (1994) also defines innovation from the perspective of an information system as
"innovation in the application o f digital and communications technologies” <p 1072)
Premkumar et al. (1994) study the implementation of electronic data interchanges (EDI) with
innovation dilfusion theory.
Hie fast revolution o f wireless technology brought advent for everything prepaid, from cell*
phone loads to every device or transaction that can be digitalized or electronically
manufactured. The discovery of wireless communication of cellular phones today has always
been a great reward in this century for the ingenuity of human's continuous exploration (dr
H

easy living. Hie cellular plumes and telecommunication and network providers oiler us Ulster
mid efficient ways to stive our lime and human energy in dealing with our monthly routine
sueh hank-to-hank payment* for electric bill, water bill, cash deposit, etc., and amazingly,
everything has been done through text messaging alone.
Ihc understanding o f the new system (Prcpuid electricity metering system) which is modeled
jlong the mobile plume scratch caid system, where one pays for airtime upfront is critical in
the successful implementation o f the project. The technology enabled customers to purchase
power units dubbed ‘Umcme Time' to loud in the same way they do for mobile phone airtime.
In addition, ‘Umcme time' would lie available conveniently from vending units in all estates
and shopping centres” thus ending the bureaucracy consumers go through when seeking
,connection after their power supply is disconnected. I be results of the research will therefore
give an indication to the success factor ot adoption of the new pre-paid meter.
Ilnw the Prepayment system works
propaym ent m eter atcustomer's home
vending sta tion atutility s office or appointed agent
sy stem m aste r station(sms) in stuna plaza data centre
f igure I. The Prepayment system
The system is simple but extremely effective. Prepayment Meters arc installed in customers*
premises hut before electricity can be consumed a credit token must be entered into the meter.
The token is purchased at a conveniently located Vending Station, The token is inserted into
the meter where it is decrypted mid added to the meter credit register. Should the credit expire
the meter automatically disconnects the load and only reconnects when more credit is added.
Ihc tokens that are dispensed by the vending station* are derived online from a centrally
located Master Station (I-clipse Server), providing the utility full management and control of
its sides and service history. The communication between the master station and the* vending
stations is online and may be in the form oflAN/W AN. leased lines, (iSM or (il'KS.
14

Kci|‘i'r*n,cn,s o r *>'n Mounted Split Metering
• \I Communication Cable I
......... ...........................................» *Measurement X Control Unit
(MCU). /..• Meter
iCustomer Interlace Unit (CIU). I.r. Key
rail
Figure 2. Din Mounted Split Metering
11k prepaid technology has contributed to many households cutting their budget in electric
energy consumption, and this technology secures irresponsible tenants tor commercial and
leasing establishments from esc aping front their own power supply.
2.J.I Standard I ransfer Sy stem (S' I'S)
Standard I ransfer System (SIS), which is an open standard, was developed to ensure that
meters front different manufactures could wort, together. Initially all prepayment systems
used proprietary methods to encode and transfer credit from the vending points to the meters,
litis meant different systems and meters front different manufacturers could not communicate,
thereby making a utility to be tied to one supplier. Any utility using an STS vending system
could purchase S I S meters from any supplier. I lie STS specification has now been published
hy the I EC as a Publicly Available Specification I f.Cft 2055-11. Currently S IS is onlyspecified for Keypad systems.
*'J * Selection of lic it rlrltv Prepayment t echnology forkPl.C
During the research tor technology a comparison was made between the two prepayment
systems that were identified by the research team. (SIS) Keypad Prepayment System was
“lenlilicd as the most suitable technology for KPLC as it best addressed it*s objectives, such as
heing cost effective, the dccongcstion of the banking halls and enhancement of case of
15

payntfi'i Itil due to its versatile feature of having various vending channels. These arc vide
sMS (mobile phone). IDS (Credit Debit Card). Internet. Vouchers (scratch cards), third
parties (retail chains, hanks, A I Ms) amongst others.
I lie Split Meter type was identified as the one to lie adopted since it is good in loss reduction
due to its IS00** ‘in,i ,umPcr features, lhe metering of households and company’s electric
consumption has been patterned to the ballooning figures in communication via open
atmosphere. The combination of electric and electronic features o f prepaid kilowatt-hour meter
|i:o been considered one of the breakthroughs in rendering service o f electric company, l o
enhance this the electricity distributor Kenya Power and Lighting Company is set to roll out a
Vendor system by end of February 2010.
2,.tJ I he Vendor system
lhe Prepayment Steering Committee approved a hybrid vending structure for KPLC that Included the following:
Direct vending channels through Kl'l ( ' banking hulls. Some major dealers with national
coverage. Mobile Service Provider products ( ZAP A M-Pesa). Deploying of Cell Phone
vending lot the rural areas and informal settlements, SMS or Scratch Card Vending.
Engagement o f Regional/! ocal vendor (c.g. single shop or other outlet) where the situation
demands and Engagement of several Super Vendors.
KPLC began w ith M-Pesa of Safaricom and the search for other prospective service providers
such as ZAP of /a in and 3rd Party vendors, arc ongoing and it is exacted that other players
will he incorporated. Currently KPLC is looking for agents to sell scratch cards for its pre-pa id
metering system in a move that could create thousands of jobs countrywide. I he move is also
expected to boost the earnings o f micro-entrepreneurs, who arc already acting as agents of the
country's top telecoms operators Safaricom ami Zaln, which have opened negotiations with
KIM C to enable the agents help sell the cards.
fherc arc close to 17,00(1 agents in the mobile phone money transfer business in the country.
KPl.t is also planning to recruit its own agents, a move that should open new employment and
business opportunities for thousands o f Kenyans adding to the more than 100,000 jobs that
mobile telephony is estimated to have created in the past eight years. Official data shows that
airtime vendors last year earned Sh-L6 billion in commissions a figure that could significantly
improve with the sale of electricity scratch cards. "Negotiations with third party vendors such
as Safaricom and Zain arc ongoing We expect to have them on board before long," said a
lr.

p^igrcff repoit on ll,c metering system. Under the new payment system, electricity
omsWW**5 car^ s ^c,ore hand to top up their meters before expiry of their cretin to
avoid automatic disconnection.
ri*c new meters thill use smart cards are bought from KPLC anti loadetl with ttic amount of
cn.,lit purchased. The card is then inserted In the new meters, which subtracts the points
according to consumption. Just like the prepaid mobile phone system, tlic prepaid electricity
meter will switch off power immediately a consumer has exhausted his credit anti on reloading
live card automatically reconnect. Currently, consumers can only access the cards from KPIX
banking halls and three Uchumi Supermarkets, making that addition o f more access points a
critical plank in the success of the pre paid metering now that the power lirm is planning a
massive rollout. I he (tower firm was yet to release details on the amount of commission the
agents would earn or the criteria it used to pick the agents since one might be required to
deposit some money. It was not clear whether the power firm would follow the model of
mobile phone providers where dealers get products - top-up cards and handsets - at a
discount and sell them at the fixed retail price, or by purchasing starter packs at the retail price
and then receiving a connection commission once an initial top-up is made by a new
Milwcribcr. Hut given that the revenues generated from the pre-paid system run into billions of
shillings, the agency deal is expected to generate a high stake battle for the business as
investors look for the handsome pay-offs Business Daily (Nairobi) 8 October 2009, /eddy
Stmbu.
Prepaid Electricity metering system also allows KPI.C to collect money for its services
upfront, hence improving revenues which presumably translates to providence of better
services to its customers. KPI.C will benefit by decongesting its banking halls, collecting its
revenue upfront as well ns reducing its operational costs of disconnection, reconnection ami
meter reading hopefully for the customer this will translate onto better services aimed at
customer satisfaction
Innovation Diffusion Theory
fbe process of adopting new innovations has Irecn studied lor over 30 years, and one of the
most popular adoption models is described by Rogers in his book. Diffusion o f Innovations
(Sherry & Gibson, 2002). Much research from a broad variety of disciplines has used the
model as a Iramcwork. Dooley (1999) and Stuart (2000) mentioned several o f these disciplines
political science, public health, communications, history, economics, technology, and
17

ejuC#tjon, and defined Rogers' theory as u widely
technology diffusion ami adoption.
used theoretical framework in the area of
Rogers' diffusion of innovations theory is the most appropriate for investigating the adoption
,.f technology in higher education ami educational environments (Medlin, 2001; Parisot, 1995).
In fact, much diffusion research involves technological innovations so Rogers (2003) usually
USCJ the won! 'technology" and “innovation" as synonyms, l or Rogers, "a technology is a
design for instrumental action that reduces the uncertainty in the cause-effect relationships
involved in achieving a desired outcome" (p. 1 1 )
It Is composed of two parts: Hardware and Software
Hardware is "the tool that embodies the technology in the form of a material or physical
object," software is "the information h.isc for the tisoP (Rogers. 2001. p 259). Since software
(as a technological innovation) lias a low level of observability, its rate of adoption is quite
slow. In this study the hardware is the pre paid meter component and the software is the
'token' purchased from the power utility KPLC, for purposes of re-loading lienee ensuring
continuous supply of electricity.
Tor Rogers (2<H»3). adoption is a decision of "full use of an innovation as the best course ol
action available" and rejection is a decision "not to adopt an innovation" (p. 177). Rogers
defines diffusion as “the process in which an innovation is communicated thorough certain
channels overtime among the members o f a social system" (p. 5).
A\ expressed in this definition, innovation, communication channels, time, and social system
arc the four key components of the diffusion o f innovations.
-.5 l our main Elements in the Diffusion of Innovations
2.5.1 Innovation
Rogers offered the following description of an innovation: "An innovation is an idea, practice,
or project that is perceived as new by an individual or other unit o f adoption" (Rogers, 2003, p.
• 2) An innovation may have been invented a long time ago, but if individuals perceive it as
new, then it may still be an innovation for them The newness characteristic of an adoption is
more related to the three steps (knowledge, persuasion, and decision) o f the innovation-
18

jccision pioccss will l>c discussed later. In addition. Rogers claimed there is a lack of
diffusion research on technology clusters. I or Rogers (2003). “u technology cluster consists of
o^ of n1„ie distinguishable elements of technolog) that are perceived us being closely
interrelated” (P *•*)•llnccrtninty is an important obstacle to the adoption of innovations. An innovation's
g,"frequences muy create uncertainty: “Consequences are the changes that occur in an
individual or a social system as a result of the adoption or rejection of an innovation” i Rogers,
2003. p. 43b). To reduce the uncertainty of adopting the innovation, individuals should be
informed about its advantages and disadvantages to make them aware Of all its consequences.
Moreover, Rogers claimed that consequences can he classified as desirable versus undesirable
(functional or dysfunctional), direct versus indirect (immediate result or result of the
Immediate result), and anticipated versus unanticipated (recognized and intended or not).
2.5.2 < nmniunicnlion ( hannds
Second element o f the diffusion of innovations process is communication channels f or
Rogers (2003), communication is “a process in which participants create and share information
with one another In order to reach a mutual understanding" (p. 5). Ibis communication occurs
through channels between sources. Rogers slates that "a source is an individual nr an
institution that originates a message. A channel is the means by which a message gets from the
source to the receiver" (p. 204).
Rogers also states that dillusion is a specific kind ol communication and includes these
communication elements: Innovation, two individuals or other units of adoption, and a
communication channel - Mass media and interpersonal communication urc two
communication channels. While mass media channels include a mass medium such as TV,
radio, oi uews|Kipc(, interpersonal channels consist of a two-way communication between two
or more individuals.
On the other hand, “diffusion is a very social process that involves interpersonal
communication relationships" (Rogers. 2003, p. 19). Thus, interpersonal channels are more
powerful to create or change strong attitudes held by an Individual. In interpersonal channels,
the communication may have a characteristic of homophily, that is. “the degree to which two
nr more individuals who interact are similar in certain attributes, such as beliefs, education,
socioeconomic status, arid the like," hilt the diffusion of innovations requires at least some
degree of hctcrophily, which is "the degree to which two or more individuals who interact are
19

iii certain attributes." In luct, “one of the most distinctive problems in the diffusion of
innovations is that the participants arc usually quite heterophilous” (Rogers, 2003. p 19)
Communication channels also can Ik* categorized as loealitc channels and cosmopolite
chonneK that communicate between an individual o f the social system and outside sources.
While interpersonal channels can he local or cosmopolite, almost all mass media channels are
cosmopolite. Because of these communication channels' characteristics, mass media channels
and cosmopolite channels are more significant at the knowledge stage and loealitc channels
and interpersonal channels arc more important at the persuasion stage o f the innovation-
division process (Rogers, 2001).
2.5J I'lmc
According to Rogers (2003). the time aspect is ignored in most behavioral research, lie argues
ihai including the time dimension in diffusion research illustrates one of its strengths, lhc
innovation-diffusion process, adopter categorization, and rate of adoptions all include a time
dimension lhe.se aspects of Rogers'
2.5.4 Social System
The social system is the last element in the diffusion process. Rogers (2003) defined the social
system as “a set of interrelated units engaged in joint problem solving to accomplish a
common goal” (p 23). Since diffusion o f innovations takes place in the social system, it is
influenced by the social stmeture of the social system. For Rogers (2003), structure is "the
patterned arrangements o f the units in a system" (p. 24). lie further claimed that the nature of
the social system affects individuals' innovativeness, which is the main criterion for
categorizing adopters.
I he Innovation-Decision Process
Rogers (2003) described the innovation decision process as "an information-seeking and
information-processing activity, where an individual is motivated to reduce uncertainty about
•he advantages and disadvantages o f an innovation” (p. 172), For Rogers (200)), the
innovation decision process involves live steps. (I) knowledge, (2 ) persuasion, (3) decision,
(4) implementation, and (5) confirmation, fhese stages typically follow each other in a tiine- ordered manner.
different
20

fht - tnowlng " Stage
The inwJWtftot-dccision process starts with tl*c knowledge stage.
In this step, an individual learns alxmt the existence of innovation and seeks information about
(he innovation. ‘'What'.’.” “how?” and "why?” arc the critical questions in the knowledge
p|WV. During this phase, the individual attempts to determine "what the innovation is and how
and why it works" (Rogers, 2003. p. 21). According to Rogers, the questions form three ways
of Know ing, awareness, how-to-know ami principles.
2.6.1 Awareness
Awareness-knowledge represents the knowledge of the innovation's existence.
Ibis type of knowledge can motivate the individual to learn more about the innovation and.
eventually, t*' adopt it. It may also encourage an individual to learn about other two types of
knowledge
2.6.2 I low-Co- know
lire other type o f knowledge, how-to knowledge, contains information about how to use an
innovation correctly. As W'ct/el (I99J) stated, even the faculty who have technical
bockgtounds may not use technology in teaching, if they do not have knowledge of how to use
it correctly. Thus, technology is not used at an expected level, since they need help in how to
use the technology effectively in teaching (Spoils, 1999). Rogers saw this knowledge as an
essential variable In the innovation-decision process. lo increase the adoption chance o f an
innovation, an individual should have a sufficient level o f how-to-knowledge prior to the trial
of this innovation. Thus, this knowledge becomes more critical lor relatively complex
Innovations.
2.6 J I'rinciplcs-knowr ledge
Hie last knowledge type is princlplcs-knowlcdge. This knowledge includes the functioning
principles describing how and why an innovation works An innovation can he adopted
without this knowledge, but the misuse of the innovation may cause its discontinuance. For
Sprague cl ul (1999), the biggest harrier to faculty use of technology in teaching was that
I acuity lock a vision o f why or how to integrate technology in the classroom, lo create new
knowledge, technology education ami practice should provide not only a how-to experience
hut also a know-why experience (Scemann, 2003). In fact, an individual may have all the
21

knowledge, lull this does not mean iImi ihc individual will adopt the innovation
hceai,!* the individual's altitudes also shape the adoption or rejection of the innovation
2 . 6.4 The Persuasion Stage
fhc persuasion step occurs when the Individual has a negative or positive attitude toward the
innovation, but "the formation of a favorable or unfavorable attitude toward an innovation
,lo<» not always lead directly or indirectly to an adoption or rejection” (Rogers, 2003, p. 170).
flic individual shapes his or her attitude alter he or she knows about the innovation, so the
persuasion stage follows the knowledge stage in the innovation-decision process Furthermore.
Roger* states that while the knowledge stage is more cognitive- (or knowing-) centered, the
persuasion stage is more affective- (or feeling-) centered. Thus, the individual is involved
more sensitively the innovation at the persuasion stage. The degree o f uncertainty alrout the
innovation's functioning and the social reinforcement from others (colleagues, peers, etc >
attest the individual's opinions and beliefs about the innovation. Close peers' subjective
evaluations of the innovation that reduce uncertainty about the innovation outcomes are
usually more credible to the individual: "While information about u new innovation is usually
available from outside experts and scientific evaluations, teachers usually seek it from trusted
friends and colleagues whose subjective opinions of a new innovation arc most convincing"
(Sherry , 1997, p 70). Individuals continue i«» search for innovation evaluation information and
messages through the decision stage.
2.6.5 I tic Decision Stage
At the decision stage in the Innovation decision process, the individual chooses to adopt or
reject the innovation. While adoption refers to “ full use of an innovation as the best course of
action available,” rejection means "not to adopt an innovation" (Rogers, 2003, p. 177). If an
innovation hus a partial trial basis, it is usually adopted more quickly Findings of a recent
customer satisfaction study shows that many prefer the prepaid system because it gives them
the power to control their consumption. Rased on this concept, most individuals fust want to
try the innovation in their own situation and then come to an adoption decision. The vicarious
Inal can speed up the innovation-decision process. However, rejection is possible in every
stage ot the innovation-decision process.
Rogers expressed two ty|>cs of rejection: Active rejection and Passive rejection.
?2

I „ (in na t iv e re je c t io n sU iu a io n ,
An individual tries an innovation mul thinks alioiit adopting it. but later he or she decides not to
JMj0pl ,t. A discontinuance decision, which is to reject an innovation
^ner adopting ' l curlier, may l>c considered .is an active type of rejection.
In u/*,vwtr re je c t io n ( o r n o n (u lo jn io n ) />osltlon .
the individual docs not think about adopting the innovation at all. Rogers slated that these two
apes ot rejection have not Ix-cn distinguished and studied enough in past diffusion research In
some cases, the order of the knowlcdge-pcrsuasion-dccision stages can be knowlcdge-
decision-persuasion. I specially in eollcctivistic cultures such as those in l .asicm countries, this
order takes place and group influence on adoption of an innovation enn transform the personal
innovation decision intou collective innovation decision (Rogers. 2003). In any case, however,
the implementation stage follows the decision stage.
2.6.ft t he linpleiuenlutinn Stage
Ai the implcmcnl.ition stage. An innovation is put into practice. However, an innovation brings
the newness in which "some degree of uncertainty is involved in diffusion" (p 6). Uncertainty
about the outcomes of the innovation still can lie a problem at this stage. Thus, tlic
implementor may need technical assistance from change agents and others to reduce the degree
of uncertainty about the consequences. Moreover, the innovation-decision process will end,
since "the innovation loses its distinctive quality as the separate identity of the new idea
disappears" (Rogers, 2003, p. 1X0)
Reinvention usually happens at the implementation stage, so it is an important part of this
stage. Ueinvcnllon is "the degree to which an innovation is changed or modified by a user in
the process of its adoption and implementation" (Rogers. 2003, p. 180). Also, Rogers (2003)
explained tlie difference between invention and innovation While “invention is the process by
wliich a new idea is discovered or created." the adoption of an innovation is the process of
using an existing idea” (Rogers. 2001, p. 181).
Rogers further discussed that the more rcinvention takes place, the more rapidly an innovation
,s adopted urn! becomes institutionalized. As innovations, computers are the tools that consist
many possible opportunities and applications so computer technologies arc more open to vent ion.
23

w
, , , t I Ire Confirmation .Slant
Innovation-decision already has been made, but at the confirmation stage the individual
for support lor his or her decision. According to lingers (2003). this decision can he
ri-vcrsed if the individual is "exposed to conflicting messages about the innovation" (p. 184)
However, the individual lends to stay away from these messages ami seeks supportive
messages that confirm his or her decision. Thus, attitudes become more crucial at the
confirmation stage I Spending on the support for adoption of the innovation and the attitude of
the individual, later adoption or discontinuance happens during this stage.
Discontinuance may occur during this stage in two ways.
I First, the individual rejects the innovation to adopt a better innovation replacing it. I his
type of discontinuance decision is called replacement discontinuance.
2. The other type of discontinuance decision is disenchantment discontinuance. In the latter,
the individual rejects the innovation Itccuuse he or she is not satisfied with ils performance.
Another reason for this type o! discontinuance decision may Ik- that the- innovation does
not meet the needs o f the individual. So. it docs not provide a perceived advantage, which
is the first attribute o f innovations and a Meets the rule of adoption.
2.7 Attributes of Innovations ami rate of Adoption
R**gcrs <2003) described the innovation-diffusion process as “an uncertainty reduction
process" (p. 232), and he proposes attributes of innovations that help to decrease uncertainty
about the innovation.
Attributes of innovations includes five characteristics of innovations, relative advantage,
compatibility, complexity, trialnbility, and observability.
Rogers (2003) staled that "individuals' perceptions of these characteristics predict the rale of
adoption of innovations" (p. ?I9) Also, Rogers noted that although there is a lot of diffusion
research on the characteristics ul the adopter categories, there is a lack of research on the
effects of the perceived characteristics of innovations on the rale of adoption.
Rogcrx (2003) defined the rate of adoption as "the relative speed with which an innovation is
adopted by members of a social system" (p. 2 2 1). I or instance, the number of individuals who
^ P te d the innovation for a period of time can be measured as the rate of adoption of the
innovation. The perceived attributes of an innovation are significant predictors of the rate of
Adoption. Rogers reported that -19-87% of the variance in the rate of adoption o f innovations is
2-1

explained by these live uttilhutcs. In addition to these attributes, the innovation-decision type
(0pbonfll. collective, or authority), communication channels (mass media or interpersonal
channel*). social system (norms or network interconnectedness), and change agents may
jnettase the predictability of the rate of adoption o f innovations. For instance, personal and
optional Innovations usually are adopted faster than the innovations involving an
organizational or collective innovation-decision However, for Rogers, relative advantage is
the strongest predictor o f the rale of adoption of an innovation.
j.7.1 Relative Advantage
Rogers (2003) defined relative advantage as "the degree to which an innovation is perceived as
being better than the idea it supersedes” (p. 229). I lie cost and social status motivation aspects
of innovations are elements o f relative advantage. For instance, while innovators, early
adopters, arul early majority arc more statusmotivated for adopting innovations, the late
majority and laggards perceive status as less significant. Moreover. Rogers categorized
innovations into two types: preventive and incremental (non-preventive) innovations. "A
preventive innovation is a new idea that an individual adopts now in order to lower the
probability o f some unwanted future event’’ (Rogers, 2003. p 233). Preventive innovations
usually have a slow rate o f adoption so their relative advantage is highly uncertain. I lowevcr.
incremental innovations provide beneficial outcomes in a short period. When faculty members
face the new demands placed on them, they will adopt technology (C’asmar, 2001), If teachers
see that technology has value in their instruction, then they will use it (Finley, 2003;
Mi Kcu/ lc, 2001. I'arisen. 1995; Spotts. 1999).
lo integrate technology successfully into teacher education courses, teacher education faculty
should see the need providing helpful experiences for themselves and their students (Schmidt. 1995).
lo increase the rate of adopting innovations and to make relative advantage more effective,
direct or indirect financial payment incentives may he used to support the individuals of a
social system in adopting an innovation. Incentives are part of support and motivation factors.
Another motivation factor in the diffusion process is the compatibility attribute.
2 7 J Compatibility
» some diffusion research, relative advantage and compatibility were viewed as similar,
although they arc conceptually different. Rogers (2003) staled that "compatibility is the degree
25

wliich an innovation Is perceived as consistent with the existing values, past experiences,
„nd needs of potential adopters** (p. 15). A luck o f compatibility in Information Technology
II, with individual needs may negatively affect the individual's IT use (McKenzie, 2001;
She**. 1997).
In her literature review. Hocrup (2001) describes that each innovation influences teachers'
opinions, beliefs, values, and views about teaching. II an innovation is compatible with an
individual’s needs, then uncertainty will decrease and the rate o f adoption of the innovation
will increase. Thus, even miming the innovation is an important part of compatibility. What the
innovation is called should be meaningful to the potential adopter. What the innovation means
also should be clear. I his is pan o f the complexity attribute.
*.7.3 Complexity
Rogers (2003) defined complexity as "the degree to which an innovation is perceived as
iclatively difficult to understand and use" (p. 15). As Rogers stated, opposite to the other
attributes, complexity is negatively correlated with the rate of adoption Thus, excessive
complexity of an innovation is an important obstacle in its adoption.
A technological innovation might confront faculty members with the challenge of changing
their teaching methodology to integrate the technological innovation into their instruction
(I'arisol, 1995), so it might have different levels ol complexity. It hardware and sot)ware arc
us. i-friendly, then they might lx: adopted successfully for the delivery of course materials
(Martin, 2003).
Triiilaliilily
According to Rogers (2003), "trialahility is the degree to which an innovation may he
experimented on a limited basis” (p. 16). Also, trialahility is positively correlated with the rate
ot adoption. The more an innovation is tried, the faster its adoption is. As discussed in the
implementation stage ol the innovation-decision process, reinvention may occur during the
•rial ol the innovation. Then, the innovation may he changed or modified by the potential
adopter Increased reinvent ion may create faster adoption of the innovation. For the adoption
“fan innovation, another important factor is the vicarious trial, which is especially helpful for
later adopters. However, Rogers stated that earlier adopters see the trialahility attribute of
innovations ns more important than Inter adopters.

, 7 5 OI»crv«l»lhl)
IV l“*1 characteristic of innovations is observability. Rogers (2003) defined observability ns
•the degree 10 which the results of an innovation arc visible to others" (p. 16). Role modeling
(0l>peer observation) is the key motivational factor in the adoption and diffusion of technology
(I’arisnt. 1997). Similar to relative advantage, compatibility, and trinlability, observability also
b positively correlated with the rale of adoption of an innovation.
In summary. Rogers (2003) argued that innovations offering more relative advantage,
compatibility, simplicity, trialnbility, and observability will be adopted faster than other
Innovations. Rogers does caution, "getting a new idea adopted, even when it has obvious
advantages, is difficult" (p. 1). so the availability of all of these variables of innovations speed
up the innovation-diffusion process. Research .showed tlmt all these factors influenced faculty
members’ likelihood of adopting a new technology into their teaching (Anderson el a l , 1998;
Bennett. &. Bennett. ?IX>3; Parisol, 1007; Slyke. 1998; Surendra, 2001).
2.8 Adopter C nlcgorien
Rogers (2003) defined the adopter categories as “the classifications of members of a social
system on the basis o f innovativeness" (p. 22). This classification includes innovators, early
adopters, early majority, late majority, and laggards. In each adopter category, individuals arc
similar in terms of their innovativeness: "Innovativeness is the degree to which tin individual
or other unit of adoption is relatively earlier in adopting new ideas than other members of a
system" (Rogers, 2003. p. 22). Braak (2(HI|) described innovativeness as “a rclatively-stnble,
socially-constructed, innovation-dependent characteristic that indicates an individual's
willingness to change his or her familiar practices" (p. 144). for Rogers, innovativeness helped
in understanding the desired and main in the innovation-decision process. Thus, lie categories
the adopters based on innovativeness.
Also, Rogers (2003) noted that incomplete adoption and non-adoption do not form this adopter
classification. Only adopters of successful innovations generate this curve over time. In this
nomial distribution, each category is defined using a standardized percentage of respondents,
l or instance, tire area lying under the left side of the curve and two standard deviations below
•I'c mean includes innovators who adopt an innovation as the lirst 2.3% o f the individuals in a system
27

1 8.1 Innovators
| ,*r K**ilers innovators were willing to experience new ideas. Thus, they should be
pp.pored to cope with unprofitable anil unsuccessful Innovations, and u certain level of
uncertainty about the innovation. Also. Rogers added that innovators arc the gatekeepers
bringing the innovation in from outside o f the system They may not be respected by other
members of the social system because o f their vcntnrcsomcncss mid close relationships outside
the social system. I heir venluresomcncss requires innovators to have complex technical
knowledge.
2.8.2 Early Adopters
Compared to innovators, early adopters arc more limited with the boundaries of the social
system. Rogers (2003) argued that since early adopters are more likely to hold leadership roles
in the social system, other members come to them to gel advice or information about the
innovation. In fact, "leaders play n central role at virtually every stage o f the innovation
pnKCSs. from initiation to implementation, particularly in deploying the resources that carry
innovation forward" (Light, 1098, p. 19). Thus, as role models, early adopters’ attitudes
toward innovations arc more important. I heir subjective evaluations about the innovation
reach other members o f the social system through the interpersonal networks, f.arly adopters’
leadership in adopting the innovation decreases uncertainty about the innovation In the
diffusion process, f inally, "early adopters put their stamp of
approval on a new idea by adopting it" (Rogers, 2003, p, 283).
2-8.3 Larly Majority
Rogers (20(13) claimed that although the early majority have a good interaction with othei
members of the social system, they do not have the leadership role that early adopters have.
However, their interpersonal networks are still important in the innovation-diffusion process.
As figure 2.2 shows, the early majority adopts the innovation just licfore the other half ortheir
peers adopts it As Rogers stated, they are deliberate in adopting an innovation and they are
neither the first nor the last to adopt it. I Inis, their innovation decision usually lakes more time
•ban it takes innovators and early adopters.
28

2 g,4 U«« Majority
snnilnf to the e;irly majority, Ihc late majority includes one-third of all members ot' the social
jystem who wail until most of their peers adopt the innovation. Although they are skeptical
jjjxuit the innovation and its outcomes, economic necessity and peer pressure may lead them to
the adoption of the innovation To reduce the uncertainty of the innovation, interpersonal
networks of close peers should persuade Ihc late majority to adopt it. I hen, "the late majority
leel that it is safe to adopt" (Rogers. 2001, p. 284).
2.8.5 Laggards
As Rogers (2001) staled, laggards have the traditional view and they are more skeptical about
innovations and change agents than the late majority. As the most localized group of the social
system, their interpersonal networks mainly consist of other members of the social system
from the same category Moreover, they do not have a leadership role. Because ot the limited
rcsouices and the lack of awareness-knowledge of innovations, they first want to make sure
that an innovation works before they adopt, Thus, laggards lend to decide ufter looking at
whether the innovation is successfully adopted by other members ot the social system in the
past l>tic to all these characteristics, laggards’ innovation-decision period is relatively long.
In addition to these five categories of adopters. Rogers (2001) further described his live
categories of adopters in two main groups: earlier adopters and later adopters.
I Earlier adopters:
Consist of innovators, early adopters and early majority
2. I liter adopters.
Consist of late majority and laggards
Rogers identities the differences between these two groups iu terms o f socioeconomic status,
personality variables, and communication behaviors, which usually arc positively related to
innovativeness, l or instance, "the individuals or other units in u system who most need the
benefits of n new idea (the less educated, less wealthy, and the like) urc generally the last to
adopt an innovation" (Rogers, 2(MH, p. 295). l or Rogers, there was no significant difference
between the ages of earlier adopters and later adopters, but this categorization and its
characteristics are beyond this study.
2.9 Factors that influence Adoption
l Access to information or lack of it:

Ihis aimed at establishing whether the consumer had any knowledge on the
prepayment electricity or not Information creates awareness which enables the
consumer to understand the concept of the new technology uml make informed decisions on the same.
2 hducalion Level:
How does the consumer's level of education influence his/her adaption of the
electricity prepayment metering system. Lducalion contributes significantly to one's
intelligence.
1 bconomlc status
Depending on a consumer's source of income, this addresses the issue of affordability
and household budgeting. Seeks to determine if it is more viable to pay for electricity
before consumption or after?
A Benefits advantages o f the prepayment system
i )iicc a consumer is aware of lire bcnefits/advan tages of the prepayment system, it
contributes to their decision making- to adopt or not to. Hence their being able to make
informed decisions.
5. l evel ol income
I he consumer's pay package will determine whether they can adopt the prepayment
system or not In Kenya we have different categories of employees, casual or manual
laborers, middle level working class and the executives. I he level ol a consumer’s
income is critical in decisions concerning financial expenditure
2.10 Prepay men I Pilot Project Implementation Strategy
In correlation with Rogers' theories on adoption. KPLC came up with a marketing strategy so
tts lo enhance adoptability, A working committee was constituted, whose primary
responsibility was to ensure the total buy-in o f the new service, by all parties concerned. The
membership was made o f Customer relations, marketing and corporate communication. Other
responsibilities of the working committee included:
I. building positive relations with pilot target groups so as to enlist their full
support for the new product.
10

2. to establish an efficient Iccdbuek uml response system so that customer queries
ami problems ate solved within the shortest time.
T. disseminate vital information to target customers on the benefits of this new
product,
4. conduct surveys where necessary and to find out where the service needs
improvement, or which new services may be required.
5. to keep internal customers posted on this new service and its benefits,
o. get lecdback from internal customers and respond to it.
7. develop the brand name for the new product
S develop advertising as well as door-tn-door campaigns and r»>ad shows tor
brand penetration ami acceptance of the target group of customers.
9. Develop rapport with all stakeholders, to ensure and enlist their support.
10. Prepare presentations to internal, external customers and other stakeholders, to
ensure the product is fully understood and supported by them
The aim was to enhance the general goodwill form all parties concerned, hence guarantee the
smooth transition and acceptance of the new service.
The summarized action plan was to select the target customers, select agents anil vending
points and train the vendors on the system, and how to promote it to users by creating ami
acceptance of an advertising theme. Using the necessary resources. KPI..C would develop the
brochures and posters, determine il the test area has any community leaders or committee, visit
Ihc group/committee and enlist tlieir support for the project. T his exercise would involve some
incentive c.g, free t-shirts and caps. KP1.C in conjunction with the community
Icadcrs/committee was to set up a meeting with the customers, train the installation teams and
call center staff to train the customer in the use of the system. It was paramount that for
customers to buy this idea, they must feel that they will own it and feel privileged to use it.
Ihc messages relayed to them were well thought-out, clear and to the point While this system
brought benefits to both klM.C and it’s customers. KI’I.C was mandated to ensure that the
CUWomcis saw this system as purely for their benefit, least a situation atosc where customers
would form irreversible negative opinions about the project.
I I

fjgtots that iiiHuenrc (lie adoption «I the electricity prepayment metering system
FiUiirr 3. Conceptual framework
2.11 Conceptual Prumtwork
ITie siiuly was guided by Ihe conceptual framework shown above. Il reveals (lie relationship
between the various variables investigated by this study. Ihe factors that influence the
adoption o f the pre-puid meter pitying system arc the independent variables while the adoption/
acceptance o f the prepaid electricity are the dependent variables Moderating variables were
MKh as availability o f the pre paid meters, that is the CIU and its affordability, the purchasing
32

power of the consumer mid the speediness to which one can access or obtain tokens for re-
loading Extraneous variables - include nue o f consumption in kilowatts per household per
jay. rate o f consumption for domestic use only nnd rate o f consumption lor industrial use only.
Inteisening variable would be the rule (in Kenyan shillings) of the generation of electricity per
four per day.
33

CHAPTER THREE
RESEARCH METHODOLOGY
3.1 liitriMliu-iioit
Ibis chapter presented the methodology used to carryout the study in order to achieve the
-.tated objectives. Die chapter gives detuils of the research design, the research population,
research site, sample size, sample design, data collection methods as well as data analyzing.
The residents of Nairobi's pre paid pilot project were the units for analysis • mainly Makodarn
and Fmhakasi Divisions, which was the target population of 2(i<) consumers. Ilie respondents
were 160 in total, comprising 80% of the targeted 200 consumers. Questionnaires and
interviews were used during the survey and data analyzed using descriptive statistics.
3.2 Research Design
I lie researcher also used the Descriptive Survey design to determine the success nr level of
adoption based on the number o f residents in the pilot phase, who had adopted the pie-paid
mctei paying system. I his type of research was both qualitative and quantitative in nature.
According to Crcswell( 1994). a qualitative study is defined ns an inquiry process of
understanding a social or human problem based on building a complex, holistic picture,
formed w ith words, reporting detailed views o! informants, and conducted in a natural setting.
In this case the questionnaire targeted residents of particular estates in Mnkndnra and
Cmhnkasi, to give their views (as they perceive holistic) about the prepayment metering
system, I his was achieved using the qualitative study in the form of a survey. The pilot project
was just a sample o f the target population therefore it was a representation o f a larger
population (residents of Nairobi). Qualitative research involves die study, use ami collection of
a variety of empirical materials, case study, personal experience, introspective, life story
Interview, observational, historical, interaction, and visual tcxts-th.il describe routine and
problematic moments and meaning in un individuals' lives. Conversely, qualitative research
methodology is used when there is a need to understand a social or human problem through
pictures and words in a natural setting.
ibis study was also Quantitative since it was an inquiry into <i social or human problem
adoption of the prepayment metering system, based on testing a theory composed of variables,
VI

rmeasured with numbers, and analyzed with .statistical procedures, in order to determine
whether the predictive generalizations of the theory hold tme. Crcsswell (I90<|). Patton's
jl990) view o f quantitative research is that methodology relies on experimentation methods
ami quantitative measures lor hypothetical lest for generalization. It shows that this
methodology is adopted to draw up hypothetical statements which arc tested via numeric or
(|ii.tntitaltve experimentation and interpretation. It is a scientific approach used in natural
science, suitable for researches that are investigated for test of verification, and comparison
between variables. It is therefore deductive, relying on the use of hypothetical testing in its
verification, via specific data
The strength of quantitative paradigms is grounded on the clearly stating of Research
problems. Independent and dependent variables. Hypothetical projections of the research
objective and a high reliability in data gathering from various sources of data gathering
methods. Also, subjectivity o f results was minimized or absolutely eliminated However, since
quantitative paradigm relies heavily on the use of hypothesis, Qualitative research is an
incorporated understanding o f a social or human problem through pictures and words in a
natural setting case of KPLC Nairobi.
3.3 Target Population
TTw researcher took I he population of 2000 Customers (from the pilot project) from estates
which Iuid been switched to the pre-paid meter (saying system by December 2009 and early
January 2010 Mahadara division comprised 800 customers and Embakasi division 1200
customers. Hie researcher's choice of divisions was based on the high successful rale in
adoption of the prepayment metering system, by consumers from these divisions.
3.4 Sampling Procedure
The target of the service provider KI'LC was to. switch 25.000 customers to the pre-paid
system by end of February 2010, hut by the end of December 2009 and early January 2010
•>nly 15117 customers had been switched to the pro paid meter paying system (jilonga (2010)
Out ol these, 800 were from Makadara Division and 1200 from Embakasi Division, bringing
the researcher's target population to 2000 consumers. In a Descriptive survey, data is collectcJ
fr'Hii a sample, Earlier (1994) cxplnins tlut samples that are deterministic and descriptive in
aalurc arc deemed adequate within 10% of the target population. I he whole idea o f sampling
is that by selecting some o f the elements in u population we tuny draw conclusions about the
35

ctilire population (Cooper 2(M»6 ). I Ikt researcher took a sample si/c of 200 customers which
Wilde 10% I’arlier (1904) of the targeteJ population o f 20IHI customers hy December 22"*
2009. Tl»e study employed use of proportional sampling procedure because the population was
not homogenous. I hc population in the pilot estates was not evenly distributed. In this case
for instance in Makadara division the researcher targeted 800 (0 .1 \ 8(H)) households and in
I rnharknsi division 1200 (0.1 x 1200) households so as to gel 10% Parlier (1994) of the
targeted imputation which added up to 200 households.
Ihc population was divided into strata. Items from each stratum constituted a sample. Since
each stratum was more homogenous than the total population, the researcher was able to get
more precise estimates for each stratum Kothari (1990) Stratification achieves greater
precision when that strain hus been chosen so that members of the same stratum arc as similar
its possible in respect of the characteristics of interest. It is also administratively convenient to
stratify a sample St he interviewers can lie trained to deal specifically with a certain category of
people
Table 3.1 Thr stratification of the saniplr
DIVISION & ESTATE
\ MAKADARA DIVISION1. Golden Gate2. Plains view3. River Dank». I MDAKKASI DIVISION5. Nynyo Linhukasi6. Imam Dnima 7 Villa Franca
IOTA1
n o t SI n o t DS ( % OF TAKCE'I POPULATION)
SAMPLE S
800 10 .80400 10 40too III 30too to 10
1200 10 120600 to 60too 10 40200 to 20
2000 III 2UU
3- Mctliuds of Data C 'ollcetlon
•he researcher used both primary and secondary data collection methods:
Primary Data
Ohxervdiion: In order to obtain data the researcher curried out field observations noting how
"“ ny of the 200 customers had the pre paid meter installed in their houses This was made

cosier given that the prepaid meter is a visible gadget (CllJ) that is installed in the bouse. The
study being qualitative in nature, observation is a methodology used in data collection.
Questionnaires:
These included structured (close-ended) and unstructured (open-ended) questions. I be
structured questionnaire is advantageous when it comes to obtaining o f information A
researcher finds this approach to data collection useful for administrative purposes, since the
questions can be followed with alternative questions and they oiler alternative answers too.
They are also economical in terms o f time and finance. Open ended questions permit greater
depth of response. With unstructured questions, a respondent may give an insight to his
feelings, hack ground, interests or decisions, without holding back. I'll is is because the
questions there-in arc open-ended.
In lrnirvo:
I he interviews were lacc-to-tace while others were carried out through telephone
conversations and via internet by I'-mail. In this ease the most preferred method and the most
effective was the face to-face interview by way of an interview guideline Interviews permit a
more thorough understanding o f the respondents' opinions and provide a desirable
combination of objectivity and depth. Interview guidelines are considered the most appropriate
in studies in education (Horg 1983) lienee the interview guide was designed for data collection.
3.5.1 Pilot resting the research instruments of tlu- study
I lie research Instruments that the researcher used were basically Observation, Questionnaires
and interviews. During the observation process, the researcher was looking for the ('ll I which
is the meter for prepayment. It is n visible gadget which could easily be identified by its
features < >ncc identified, this was then noted down. A trial on sampled questionnaires was
carried out with a few consumers. The aim was to ascertain clarity of the questions and to
modify any if need arose, so as lo achieve a higher response rate and with the aim of meeting
the target population. Most o f the interviews were carried out face to face. This was done with
a formal introduction and then request for an interview Where the consumer declined, the
researcher would then leave a telephone contact or request for the consumer's e-mail address
so as lo mail the questions to them later. The face-to-face interviews were the most effective.
37

3^.2 Validity uf the instruments
Validity refers to the degree to which a test or other measuring device is truly measuring what
jl was intended to measure. A pretest was conducted on u population similar to the target
population in order to assess the validity ot the instrument. Items that were not appropriate for
measuring the variables were modified or discarded to improve the quality o f the research
instrument. Iliis increased its validity. In this case u small group of the population was given
questionnaires to till and any difficulties experienced taken into account then questions were
amended accordingly This assisted in knowing whether the instrument was clear, precise and
comprehensive enough. After pre testing, there were amendments to the questions.
J .S J Reliability
Reliability is synonymous with the consistency of a test, survey, observation or other
measuring device, litis measure was important since it ascertained that the data collected was
consistent and a representative ol what was to be achieved from the research. Reliability is a
measure of the degree to which a research instrument yields consistent results or data, after
repeated trials (Vlugendu 2003). Nachmias (1092) defines it as the extent to which a measuring
instrument contains variable errors, that is errors that appear inconsistently from observation to
observation during any one measurement attempt or that vary each time a given unit is
measured by the same instrument. It is the degree to which an instrument will give similar
results lor the same individuals at different times Conditions under which the measurement
took place were standardized by ensuring that external sources of variation such as Itoredom
aiul fatigue were miniin /.cd to the extent possible. I his was done hy creating a lively and
friendly environment before carrying out the research Carefully designed direction for
measurement with no variation from group to group was established. I his was done using
trained and motivated persons to conduct the research. Methods of calculating reliability were
such as correlation.
1 8
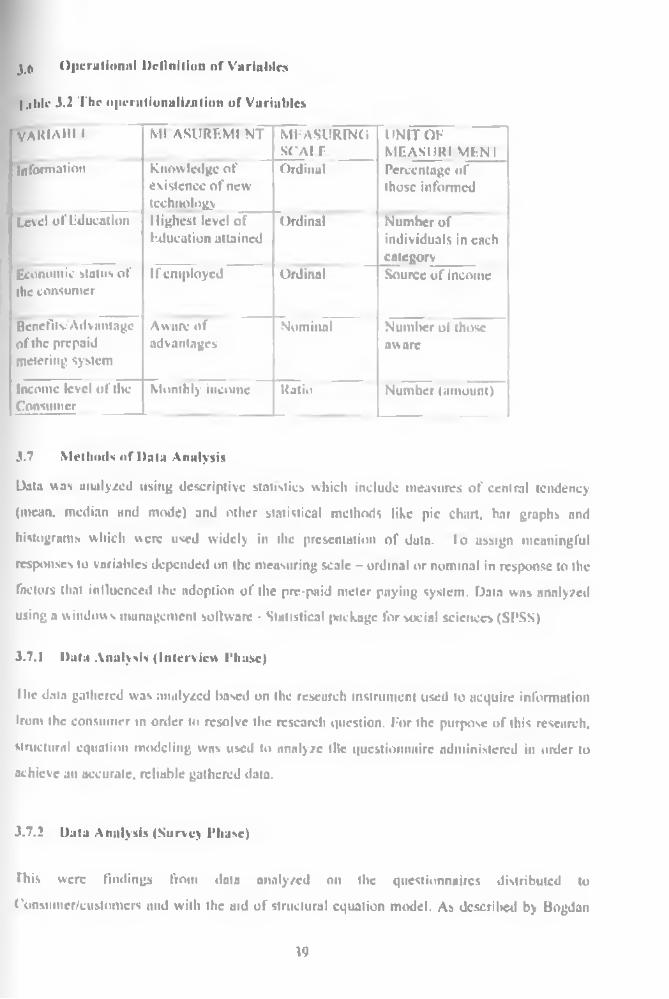
yt> Operational Definition of Variables
I .,Mi- 3.2 The operationalization of Variables
VARIABI 1 MI ASURFMI NT MEASURINGs c a i r
UNIT OF MF.ASURI \1L:N 1
Information Knowledge of existence o f new technology
Ordinal Percentage of those informed
Level of Education Highest level of lulucation attained
Ordinal Number of individuals in each category
Economic status of the consumer
If employed Ordinal Source o f Income
Benefit v’Advantage of the prepaid metering system
Aware of advantages
Nominal Nurnlwr of thoseaware
Income level of the Consumer
Monthly income Ratio Number (amount)
3.7 Methods of Data Analysis
Data was aiutly/ed using descriptive statistics which include measures of central tendency
(mean, median and mode) and other statistical methods like pic chart, bar graphs and
histograms which were used widely in the presentation of data, lo assign meaningful
responses to variables depended on the measuring scale - ordinal or nominal in response to the
factors that influenced the adoption of the pre-pnid meter paying system. Data was analyzed
using a windows management solhvare • Statistical package for social sciences (SPSS)
3.7.1 Data Analysis (Interview Phase)
I lie data gathered was analyzed based on the research instrument used to acquire information
Irom the consumer in order to resolve the research question. For the purpose of this research,
structural equation modeling was used to analyze tile questionnaire administered in older to
achieve an accurate, reliable gathered data.
3.7.2 Data Analysis (Survey Phase)
This were findings from data analyzed on the questionnaires distributed to
('onMimer/customcrs and with the aid of structural equation model. As described by Bogdan
19

„nd Biklcn ( I•>*>«>. ii is “working wilh data, organizing it. breaking it in manageable units,
[ Bpthesr/ing it. searching for patterns, discovering what is important and what is to he learned.
iiihI deciding what you will tell others".
j,8 Summary
this chapter sought to give guidance on data collection, analysis, interpretation and
presentation The method used in data collection determined the Instrument to measure the
validity and reliability ol that data This gave rise to the hypothesis alter data analysis and
finally the conclusion, which is the researcher's recommendation.
40
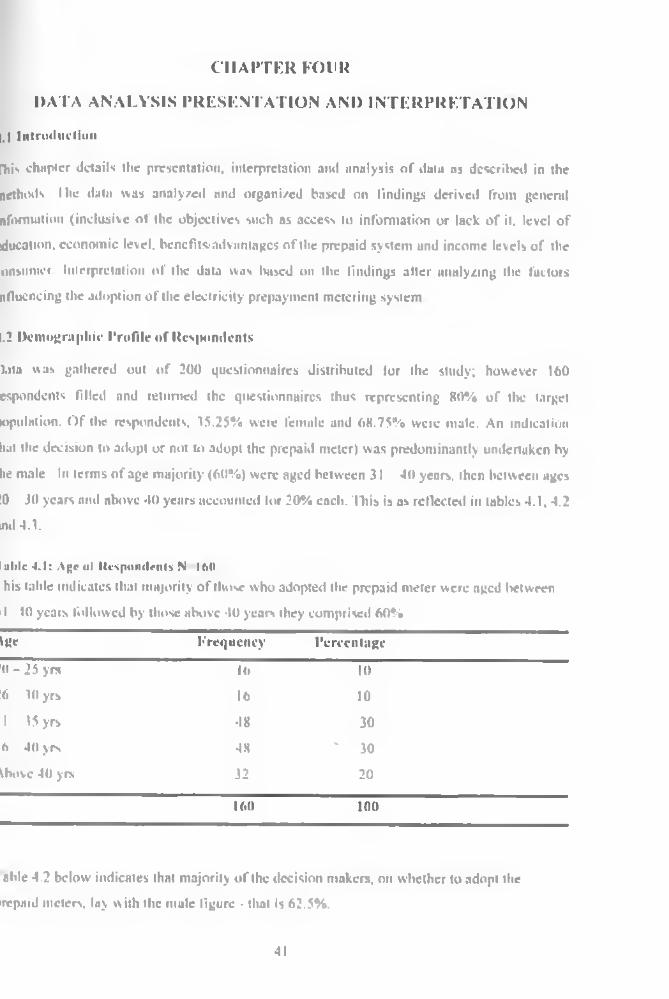
CH A PTER FOUR
DATA ANALYSIS PRESENTATION AND INTERPRETATION
l.| Introduction
phis chapter details the presentation, interpretation and analysis of data as described in the
nctfhodx I he data was analyzed and organized based on findings derived from general
nfomtution (inclusive of the objectives such as access to information or lack of it. level of
ducation. economic level, benefit* advantages of the prepaid system and income levels of the
onsnmer. Interpretation of the data was Itascd on the findings alter analyzing the factors
nfiucncing the adoption of the electricity prepayment metering system
1.2 Demographic Profile of Respondents
).ita was gathered out o f 200 questionnaires distributed lor the study; however 160
espondents filled and returned the questionnaires thus representing 80% of the target
lopolntion. Of the respondents, 35,25% wcie female and 68.75% wctc male. An indication
hat the decision to adopt or not to adopt the prepaid meter) was predominantly undertaken by
he male In terms o f age majority (60%) were aged between 3 1 40 years, then between ages
10 JO years and above 40 years accounted lor 20% each, ‘litis is us reflected in tables 4.1,4.2
ltd 4.3.
I aide 4.1: Age ul Respondents N -160
his table indicates that majority o f those who adopted the prepaid meter were aged Itetween
' I 10 ycats followed by those above 40 years they comprised 60%.
tgc Frequency Percentage
10-25 yrs 16 10
16 30 yrs 16 10
1 35 yrs 48 30
6 40 yrs 48 ' 30
drove 40 yrs 32 20
160 100
able 4.2 below indicates that majority o f the decision makers, on whether to adopt the
'repaid meters, lay with the mule figure - that is 62.5%.
41

lulilr 4.2: (lender of Kcspuinlrnls
(lender Frequency Percentage
100 62.5
female AO 37.5
160 100
Table 4.4 below within marriage.
indicates that majority of those who adopted the prepaid meter were those that was 56.25% of the population.
Table 4.3: Marital Status of Respondents
Marital Stains Frequency Percentage
Married ‘>0 56.25
Single 40 25
Separated 10 6.25
Widowed 20 12.5
160 too
4 J Level of EducationDepicts the tael that the level of education indeed contributed greatly to one's ami
ncceptivcncss to new technology and change. Consumers o f College level of education and
above, that is University level, constituted 81.25% of those who adopted the prepaid meter as
shown in table 4.4 below.
Table 4.4: bevel of Idiinitinn
Level of Fldiiealioii Frequency Percentage
Primary ( class 1-8) 10 6.25
Secondary! form 1-1) 20 12.5
College ( Certificate or Diploma) 30 18.75
University (Degree) 100 62.5
160 100
4.4 Economic statusReflects the economic status which indicates the source o f income and ihc level at which it
influences adoptability. As shown in table 4.5 below, most o f the respondents ■ comprising
•12

[37.50% were employed by the civil serv ice I hey were closely followed by Private sector
employees 21.88% then those employed by state coqior.itions 18 75%, then Mil*employed
consumers were next with 1 2 . then finally the casual employees comprised 9.37%. This
trend showed that those employed in the civil service preferred prepaid electricity.
Table 4.5 I comuuic status
Source of Income Frequency Percentage
Self employed 20 12.5
Casual 15 9.37
Civil Servant 60 37.50
Private Sector employee 35 21.88
State Corporation employee 30 18.75
160 100
4.5 Level uf income
Shows tlmt majority of the consumers with an average monthly income of between Kshs
26,000 40.000 that is 50% of the target population, were receptive to the prepaid meter. The
majority of the consumers spent over 1000 Kshs on electricity, that is 68.75% as reflected in
table 4.6 below.
I aide 4.6 Lev cl of income in Kshs
Average monthly Income in Kshs Frequency
Percentage
1 aming 1 .ess than 5000 15 9.37
Panting 5000 15.000 25 15.62
Earning 16,000 25.000 40 25
Faming 26.000 49.000 „ 50 31.25
Above 50.000 30 18.75
160 100
43
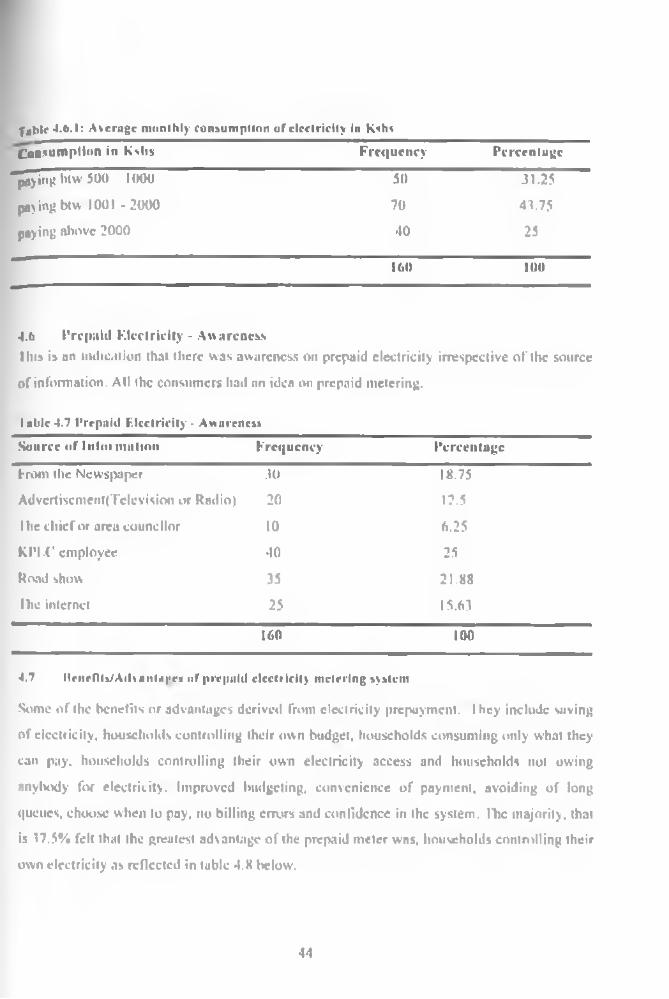
fable 4-6-1: Average monthly consumption of electricity in Kshs
C o n s u m p tio n in Kelts Frequency Percenluge
paying blw 500 1000 50 51.25
paying btw 1001 - 2000 70 44.75
paying above 2000 40 25
160 100
4.6 Prepaid KlcClrIcily - AwarenessHits is an nulic.it ion that there was awareness on prepaid electricity irrespective of the source
of information. All the consumers had an idea on prepaid metering.
table 4.7 Prepaid F.lcclricity - Awareness
Source of 1111011111111011 Frequency Percentage
From the Newspaper .10 18.75
Advcrtiscment(Tdcvision or Radio) 20 12.5
Ihe chief or area councilor 10 6.25
KPI.C employee 40 25
Road show 35 21.88
Ihe internet 25 15.63
160 100
4.7 Itenrnts/Ailsant.ii'es of prepaid electricity metering system
Some of the benefits or advantages derived from electricity prepayment. I hey include vising
of electricity, households controlling their own budget, households consuming only what they
can pay, households controlling their own electricity access and households not owing
anylvody for electricity. Improved budgeting, convenience of payment, avoiding of long
queues, choose when to pay. no billing errors and confidence in the system. ITic majority, that
is 17.5% felt that the greatest advantage of the prepaid meter was. households controlling their
own electricity as reflected in table 4.X M ow.
44

Table 4.8 IK iwtiivAdv uniugrv of the prepaid m elm
Source ol Information Frequency Percentage
Households control their own budget 5 3.13Households consume wlmi they pay for 10 6.25Households control access to their electricity 20 12.5Households w ill not awe anybody electricity 20 12.5Improved budgeting 20 12.5Convenience ol payment 20 12.5Avoiding long queues 10 6.25Choose when to pay .10 18.75No billing errors 15 0.37Confidence in system 10 6.25
K.O 100
When asked whether a prepaid meter was the Irest way of providing electricity, majority agreed as depicted in Cable 1.9 below 02.5% agreed. 21.87% Disagreed and 15.6.1% were neutral
Table 4.0 Level of those who preferred prepaid electricity
Level of Acceptance Frequency Percentage
Agree 100 62.5
Disagree 35 21.87
Neutral 25 15.63
loo too
Alongside the benefits of the electricity prepayment, comes the disadvantage) .is depicted in
fable <1,10 below.
I able 4.10: Disadvantages of prepaid meter
Disadvantage Frequency Percentage
Can not afford to buy prepaid card 15 9.8
1 imited use ol electrical appliances to 25
Consumers cut off llicir electricity supply 2(j 12.5
Units purchased gel finished quickly 10 6.25
Illiteracy o f some consumers 5 13.3
Increases con Diets in households 10 6.5
Prepaid device rejects pin cosies o f‘Timeme" time 25 15.62
Bad customer service 25 15.62
160 100
45

fixun the information in table 4.11. majority of the consumers were privy to the advantages nl
tire prepayment metering system - that is 31.25%. 15.63% were informed prior to installation.
Ii also indicates that much as the consumer would liuvc liked to know the advantages o f the
prepaid meter, they would have also liked to know the disadvantages. None of the consumers
was misinformed about their electricity debts.
4.11 Inform ation on Prepaid me t e n
| iible 4 .11: I y pe of iiifiirmnllon on prepaid meters
I low Frequency Percentage
Household debts and arrears would be cancelled Nil 0
Advantages of prepaid electricity 50 31.25
Disadvantages o f prepaid electricity 30 18.75
No money no electricity, households pay first 40 251 ittle Information prior to installation 25 15.63
Prepaid meters is a form of privatization of service 15 9.38
160 100
4.8 Observation on resistance of prepaid metering system
lltc disadvantages associated with the prepaid meters contributed significantly to the
resistance. Issues related to delay s In purchasing of tokens, lack of adequate information to the
consumer, technical problems associated with prepaid meters, limited use of electrical
appliances ami generally what could be summed as bad customer care by KI’I.C, led to
resistance. One of the major factors that led to adoption was the benefits ol the prepayment
meters. Rogers (2003) in the innovation - decision process, an individual is motivated to reduce
uncertainty about the advantages and disadvantages of an innovation, lit ere fore if an innovation
docs not provide a perceived advantage, any form of doubt affects the rale of adoption and the
disadvantages are fodder to this. Ultimately an individual would require some |tersuasion to
reduce uncertainty and enable them to make a decision to adopt or reject. Ibis is what leads
to adopter categories where individuals are classified either as early adopters or later adopters.
46

I jhlr 4.12 Forty Adopters amt I .me Adopters
Sample si/e as estate Frequency (Fairly Adopters Ity Dec 2009)
% 1'ret | uc lie) %(Fate Adopters* from .Ian 2010)
"(joldengate 27 16.88 8 5piainsview 20 12.5 5 3.13
Kiverbank 9 5.63 1 0.63Embakasi Nyayo 39 24.38 6 3.75Imara Daima 21 13 13 4 2.5
Villa Franca 13 8.13 7 4.38
160 100
Majority of the early adopters in Makadani division were from Goldcngiitc estate, that is
16.88%. late adopters in Mnkadara were from Plains view estate - 3.IJ%. In Emhakasi
division majority of the early adopters were front I mbakasi Nyayo estate - 24.38% and the
late adopters were from Villa I Vanea estate I 18%,
47

CHAPTER FIVE
SUMMARY OK FINDINGS, DISCUSSIONS, CONCLUSIONS AND
RECOMMENDATIONS
5.1 Inlroiluction
riii*. chapter discusses the findings o f the study. Conclusions and recommendations on factors
influencing the adoption of prepaid meters (in Makadara and Emhakasi divisions) were made
base*! on these findings
5.2 Summary of findings
Table S.l The finding* of the stud)
this was based on the objectives of the study
Objective/ Variable Main findings RemarksTo establish how access to infoimutton or lack of it, influences the consumer's adoption of tire prepaid meter
Majority of the respondents 53.13% got the information through advertisement* (Newspapers. I V, Radio and Ro.nl shows) 25% were informed just before installation. Irrespective of the source, all the 160 had information on the prepaid meters nt the time of installation
Advertisement was more effective as a means of disseminating information thus more effective in creating awareness its opposed to using provincial administrator*
To establish the how level of Fducation of the consumer influences the adoption ul the pic paid meter
Those with college level education and above llwt is University, were more receptive to this technology That is 81.25%
the higher one's level of education the more receptive one is to new technology
To establish whether (lie economic stain* of the consumer influences their adoption of the new prc-panl meter
Majority ot the respondent* were civil service employee* t hey comprised 37,50% Casual employees were lowest In aiioptability status 0.37%
Ilie consumers with a more reliable or steady source of income were more receptive to the new technology as opposed to the casuals, whose source of income was unreliable
I n establish whether thebenefit V Advantage* of the prepaid meter influences the consumer's adoption
Amongst the notable advantages, 37.5% felt that being able to control their own electricity consumption was the biggest advantage. 1 lien no electricity debt made ?5% and avoiding long queues 18.75%
Ibe advantages of the prepaid meters served to boost acceptability as opposed to the disadvantages which only slowed down the process.
To establish whether the level of income influences the consumer's adoption of the prepaid meters
1 hose earning above kshv Ib.UOO were the majority in adopting - 75%.
The respondents budgeted for electricity in-line with their monthly earnings.
•18

5.2.1 Discussion of findings
Discussions were based on the on the five (5) objectives o f the study but also included the
respondents' ages, gender, mariutl status and both the early and late adopters.
I he study established that information led to awareness lienee its’ significance. The reason
why the entire 160 respondents’ were connected to the prepaid meter which translated to
100% effectiveness, was due to information. Notably, the means of dissemination determined
the rate at which that information was accepted and retained. Advertisements catered for
53.13% of the respondents’ awareness (rond shows, television adverts and radio) and this was
the leading means of enlightening the consumers on picpaymcnt. Dissemination ol information
by provincial administrators like chiefs and councilors proved the least effective - 6.25 %.
Hits was an indication that people required and relied on information to decide on matters
concerning innovation. In Rogers' theory of innovation, the decision stage talks about
diffusion of innovation, to enable people to decide whether they can accept the innovation or
reject it The way in which information is disseminated, determines the level of diffusion and
ultimately acceptance.
5.2.2 Level of F.dncation
The study established that the level of education contributed to the rcccptivencss of new
technology; that was 81.35%, which was the highest determinant o f adoptability I'liis aspect
was followed by the age factor - 80%, where those aged above 30yrs were more leceptivc to
the innovation I here was nn indication that the lower the respondents’ level o f education, the
less the understanding mid acceptability of Innovation 6.25%. It is clear that the level of
education boosts adoptability.
5.2.3 Economic Status
I be study also investigated whether the economic luctor was likely to iiillucncc the
adoptability o f the prepaid meters, these lacloi s included one’s source of income such as self
employment, casual employee, civil servant or private sector employee, This was a pointer
towards the reliability of one's source of income. Hie casual employees for instance catered
for 9.37% of adoptability, the civil servants were the majority with 37.5%. an indication of n
more secure, steady and reliable source of income hence an indication of affordability.

5.2.4 Iti-iicnis/Aihaiilngrs of the prepaid meter ami disadvantages
I he majority. that is 37.5% tell that the greatest advantage of the prepaid meter was.
households controlling their own electricity. Ihc advantages are a confirmation that the
technology is worth being accepted. According to Rogers (2003), at the confirmation stage the
individual looks lor support lor his or her decision I’ltc advantages offer this support and aide
an individual's decision making. Disadvantages on the other hand serve to discourage anti
contribute to an Individual's attitude towards adoption an innovation. Much as the prepaid
meters come with their disadvantages - 18.75%, given their advantages this may not be a
deterrent to adoption but may only serve to slow it down In the end this gives rise to early
adopters and late adopters. 80.65% were early adopters and only 19.30% of the respondents
from both divisions, were late adopters.
Majority of those connected were married that is 56.25%. Given that the decision of adoption
was made by men, 62.5% then this reveals that majority of those connected were within n
family setting where the head of the household is the main decision maker
5.2.5 l.cvel of income
Those earning above 16,000 kshs were 75% ot the respondents. While those who spent over
HMMl Kshs on electricity were 68.75%. This wns an indication that majority of the respondents
earned over 16,000 kshs per month and could ull'ord to spend over kshs 1000 per month on
electricity. Given live fact lhat they so much yarned to control their own usage o f electricity,
their adoption of the prepaid meter fulfilled their quest.
5.3 Conclusions
Based on the findings, the major factor leading to adoption was access to information. Given
the enlightenment the project is successful given llint all the respondents adopted the prcpml
meter I he level of education was the second determinant. I he indication is that the higher
one's level ol education the better the reception to adoptability. Given that KPI.C intends to
role-out this project countrywide, literacy levels of the target community will he one major
determinant to adoption. The higher one's income, the more sufficiently one was able to
budget for their monthly electricity consumption fourth was the economic status of the
consumer It was observed that the more reliable the source of income ol the consumer, the
greater the level of acceptability. I hc casual employees were the least receptive. I astly the
advantages of the prepaid meters played a key role in their acceptability but disadvantages
50

only « n c d in slowing down ilic whole process, lire age factor was crucial to adoption. It whs
observed that majority of respondents were aged 2b years and above. Majority of those who
adopted the prepaid meters were within family settings.
All factors (for and against prepaid) notwithstanding, there will always be early adopters and
late adopters Most of the users agreed that prepaid metering was tire best way ol providing
electricity therefore the pilot project was a success.
5.1 Recommendations
V I.I Recommendations lo Kl*l.< polio makers
Ihc mam key to success with a target group is, making the product and marketing positioning
clear. Customers would prefer the current meters as so long as they possessed adequate
information about them. KPI (.' would therefore consider carrying out the following:
1. Develop bnx hurcs to be hand delivered to each home. I hey should also l>e handed
out during community discussions.
2. Brochures should be supported with posters, to l»c put up at strategic points in
buildings and other suitable places.
*• Presentation to the community: Ibis may be done by presentation to a community
opinion leader to explain the concept and benefits of the new' service.
•I. I lie vendor or agent must he trained on the features and benefits of ihc system, so
dial he may become a gimd ambassador lor KIM C. lie could Ik* used to promote itxr
service ami KIM C. Brochures must be available at each agent or vendor. If possible,
have some audio-visual presentation at the agent or vendor, for grentci impact.
5. A 21-hour call in or help line service should be set up at KI’LC and communicated in
ihc brochures and posters.
Ibis will enhance the general goodwill form all parties concerned, hence guarantee the smooth
transition and acceptance of the new service.
r>.4.2 Recommendations tor further research
Since the Study focused on factors influencing the adoption of prepaid meters, looking at five
objectives only, the study saw a need for future research on the disadvantages of the
technology. Ihc disadvantages were a setback so ought to be addressed so as to reduce the

k 'd ill resistance, living u pilot project feedback is vcr>' vital. KPI.C may have to consider an
ellicicnt feedback mechanism like Prepayment Project suggestion boxes:
i On-line suggestion box (for those on c mail).
ii. Suggestions hy written or computer box ( lor those not on e-mail)
With such a measure in place, it is easier to correct and improve on an innovation. Mitigating
against those challenges would enhance development For instance with the introduction of the
scratch card model ol purchasing electricity, nil levels of income earners will be considered
hence creation o f an enabling environment for electricity access.
52

REFERENCES
Act in Sociology: A t heoretical Introduction to Sociological method, 297*313.
New York, McGraw-Hill.
Agarwal, K and Prasad (1998); A Conceptual and Operational Definition of Personal
Innovativeness in the Domain of Information Technology Information Systems
Research. Volume 9. Issue, pp. 204*21$.
Alrcck. IM . nnd Settle, R R (1995); The Survey Research llnndbook: Guidelines and
Anderson. IV am hagen, S„ & Campbell. K. ( 1998); Faculty adoption o f touching and
learning technologies: Contrasting earlier adopters and mainstream faculty. The
Canadian Journal of Higher education, 28(23). 71-78.
Asika, N. <1991); Research Methodology in the Behavioural Sciences. Longman Lagos,Nigeria
Bennett, J., & Bennett, L. (2003); A review of liictors that inllucnce the diffusion of
innovation when structuring a faculty training program. Internet and Higher education,
<i. 53*63.
Blankenship, s I (1998); Factors ielated to computer use by teachers in classroom
instruction (Doctoral Dissertation, Virginia Polytechnic Institute and Stntc University,
1998). Pro (Juest Digital Dissertations (UMI No. A AT 9831651).
Modgan, R.< and Uiklcn, S.K (1998); Qualitative Research in Education: An Introduction to
Theory and Methods. (3rd edition) Allyn and Bacon A Viacom Company, Needham
Heights, I ISA.
Cassell, ( Si Symon, G. (1994); Qualitative Research in work contexts. In C. Cassell. & G.
Symon (Lds ). Qualitative methods in organizational research (pp. 1-13).
Cassell, C. A Symon. <i (1994); Qualitative Research in woik contexts.
C'astells. M < 1990); The Rise of the Network Society: Hie Information age, Economy.
Society nnd Culture. Blackwell puhlisltcrs, Inc. Cambridge, MA. USA.
>3

Castillo, Joan Joseph (2009); Non-probability Sampling. Retrieved 74/0I/20W from
I xperiment Resources: rcsoua-es.com/nonpnjliabilitysnmpling.html
Cliava I ranklort Nachmis, David Nachmins(l996); Research methods in social sciences. I ondon: Arnold
Davenport. T (1991); Process Innovation: Re-engineering work through Information
Technology. Harvard Business School press. Boston. Massachusetts, DSA
Davis. F.I)(I989); Perceived Usefulness. Perceived Fuse o f Use and User acceptance of
Information Technology. MIS Quarterly, Vol.l 3, No. 3. pp. 319-340
Dclone. W.ll and Mcleun. L.R <1992). I he Quest for the Dependable Variuhlc,
Information Systems Research, vol. 3 issue I, pp. 60
Dcn/iti, N.K and Lincoln, V.S. (1994); Competing paradigms in Qualitative Research
Handbook o f Qualitative research.
Dutton. J.F. and Durcrich, J.M. (1991); Keeping an Lye on the Mirror: Image and Identity
in Organizational Adaptation. I hc Academy of Management Journal Vol 34. No. 3.
pp. 5I7-S4.
Lasterhy-Smith. M., Thorpe. R and l.ovve. A. (2000); Management Research: An
Introduction. Sage Puhlicntions Ltd. London.
I vans. I'.W and Wruster, T.S (1997); Strategy and the New Economics o f Information.
Harvard Business Review, No.5, pp. 71-82.
Link. A. (1995); How to ask survey questions. Thousand Oaks. CA: SA(il Publications.
Fryer. D. (1991); ’Qualitative methods in occupational psychology: Reflections upon why
they arc so useful but so little used’. The Occupational Psychologist. I t (Special issue
on qualitative methods), 3-6.
51

G. Synion (I'ds.); Qualitative methods in organizational research (pp. 1-13). Ihousand Oaks,
CA: Sage Publications.
Galbriath, I R 1 1973); Designing Complex Organizations Addison-Wesley, Longman
Publishing Co. Inc. Boston. MA.USA.
GHonga Rosemary (2010); Rcpoii on the review of prepayment pilot project.
Goran, (i.l and Clayton, P. (1997; Qualitative Research for the Information Professional; A
Practical Handbook. Library Association Publishing,
Cooper, l) ami Schindler, P. (2006). Business research methods. Boston: McGraw-l lilt,
http://wwiv.kplo.co.ke/
Kothori, C ( I WO), Research methodology: Methods and techniques. New Delhi: New Age
International <P> Limited
Kothari, C R (Dr). (2001); Research mctluHlology m ethods and techniques. (2nd Rev cd.).
New Age International Puhlishers l td.
Mugenda O. and Mugenda A. (20(H); Research Methods: Quantitative and Qualitative
approaches. Nairobi ACTS PRI'SS
Nuchmias. I'. ( I*>‘>2>; Research methods in the social sciences. London; St Martins press
Osuagwu. L. (2006); Business Research Methodology; Principles ami Practice. trd
edilion.CSrcy Resources, I agos, Nigeria.
Patton, M Q (1990); Qualitative hvaluniion and Research Methods (2nd ed.). Newbury
Park. CA: Sage Publications, Inc,
Proceedings of the Academy o f Information and Management Sciences, Volume 1l. Number
2 I as Vegas, 2009
S 5

Rd •«* I licory and Methods. (1 edition) Allyn and Bacon. A Viacom Company.
Needham Heights, USA.
Rogers, I M (2003), Diffusion of'innovations<5th cd.) New York: Free Press.
Strategies for Conducting a Survey. (2nd edition). New York: Irwin Professional
Publishing
The Turkish Online Journal oflahicalionnl Technology TO JII April 2006 ISSN 1303-
(*S2I volume 5 Issue 2 Article 3
Thousand Oaks. (. A: Sage Publications. Uen/in, N.k and Lincoln, V.S. (1994) Competing
paradigms in Qualitative Research. Handbook of Qualitative research.
I rochim, William VI.K.. (2006). Research Methods Knowledge Base. Retrieved
24/01/2010 from: http://www.socialrescarchmethods.net/kb/snmpnon.php
Page 27
■S6

APPENDICES
A p p en d ix I: L e tte r o f Ira iism iltu l
Ms Violet Mukosi Simiyu P.OItox 308 00515 Huniburu - Nairobi 12'*' April 2010
Dear Respondent.
I ant a simian .n the University of Nairobi. College of Education and external studies - * hoot
of continuing and distance education: Department o f extra mural studies, pursuing Master ol
Alts in project Planning and Management. 1 am carrying out a research enlilled ‘ Ihe factors
that mllucncc the adoption o f pre-paid electricity through the prepayment metering system- A
case study of Mukadara and Rmhakusi Divisions Nairobi province, Kenya.*
The pm pose of the study is to investigate the factors that would influence the residents of
Nairobi in their adoption of the I Icctricily Prepayment Metering system. The findings of the
study are geared towards to creating awareness, with the intent of motivating domestic
consumers of electricity to adopt the new pre paid electricity system. This technology will help
the consumcr/cusiontcrs to manage their power budgets, avoid disconnection lor non-payment
of bills and also help them avoid queuing to pay their hills over the counter." at KPI.C’s banking halls.
KIM < will bene lit by dccongesiing its banking halls, collecting its revenue upfront as well as
reducing its operational costs ol disconnection, reconnection and meter reading indeed for
the customer, this will translate into better services aimed at customer satisfaction. ( )nec the
sliuly is complete, the results will Itc shared. Any information given will be treated with
confidentiality. You do not have to write your name on the questionnaire
kindly complete the attached questionnaire and return it as noon ns you complete answering the
questions herein, thanking you in advance.
Yours faithfully.
Violet M. Simiyu
5 7

Appendix 2:
Questionnaires on factors influencing the New Prc-Puid Electricity meterI Verify housing type hy observation
•NOTE': I ick where appropriate 2. Age:
Between 20-2526 -3031 3536- 10Above -to
3. (lender
! Male[ Female
•I. Marital Status
MarriedSingleSeparatedWidowed
5 I evel of Education what is your highest level of education
*NO'l 1C: Indicate the class or form
Primary School EducationSecondary School EducationCompleted CollegeCompleted University
6. Lconomic status please indicate source o f income
Self EmployedCasual EmployeeEmployed in the civil servicePrivate Sector EmployeeEmployed by State Corporation
58

7. On average, how much docs your household pay per month for electricity?
Specify amountRangeDocs not payDon't know
8 I eve I ol income Please estimate the total income per month received from all sources by whoever meets the pie-paid electricity in the household after tax and deductions. This includes salaries, pensions, business, rental units, wages, and money from any form of informal employment.
Less than 5000 killsPel ween 5000 15.000 KshsBetween 16.000 7.5.000 KslisBetween 26,000 40,000 Kshskshs SO,000 and nlioveRefused to discloseDon’t know
•NOTE: Answer “YES” or “NO" where applicable Prepaid electricity
10. Mad you ever heard o f prepaid electricity?
WhenNo electricity connection
11 IV) you have a prepaid electricity meter in your home now?
YesPrepaid w as removedDon’t know
11. Did your household apply for a prepaid electricity meter?
Yes When?No Don’t know
11 .1 If the answer to QI2 was "no” but u prepaid meter was installed in your household) What could be the reason?
Installed without the know ledge of the household headInstalled during the absence o f the householders1 lousehold was not given a choice
50

Household was cohcrscd (read cheated) into acceptance of prepaid meterPrepaid meter not installedDon’t knowOilier (specify)
I I Please tell me if you agree or disagree with the following statement.
"A prepaid meter is the best way o f providing electricity for our household"
•Please give a short explanationAgreeNeutralDisagree
15. Wli.n do you think arc the advantages ot using prepaid electricity meters for your household? Answer YI S or N() then give a short explanation
It will save electricity
1 leaseholds can control their own budgetHouseholds consume wlrnt they payfor1 louscholds can control their own electricity accessHouseholds will not owe anylHKly for electricityDon’t know
No advantage
Other (specify)
lt>. \\ hat do you think are the disadvantages of using prepaid electricity meters for your household? -
•Please give a short explanationCannot alford to buy pre|>aid card
Limited use o f electrical appliances
Consumers cut off their own electricity supplyUnits purchased get finished quickly
60

Illiteracy ot some consumersIncreases conflicts w ithin households
Prepaid device rejects pin codes for umcme timeBad customer service
No disadvantages
Other (specify)
L ’o h m i Iu h i o h
17. Who first consnltcd'infomicd households »nd customers about the provision o f electricity through prepaid meters?
KPLC Don't knowArea Chief ( >thcr( specify)
IX I low were prepaid meters explained to you?
* Please give a short explanationHouseholds debts and arrears would be cancelled1 louscholds would be able to control their own electricity consumptionHouseholds pay before they use electricityNo money, no electricityHouseholds to pay a fixed rate for prepaid for the whole monthNo informationPrepaid meters is a form of privatization of serviceDon’t knowOther (specilV)
I‘». What kind ol information do you think KPIX should have given households about prepaid electricity meters?
No money, no electricityHousehold debts/arrears would not be cancelledPrepaid allows limited use o f electrical appliancesliackyard rooms - Servants Quarters, will need to have own prepaid metersProvide information on advantages and disadvantagesDon’t knowOther (specify I
61

20. Why Jo you think there could l»c resistance to prepaid electricity meters?
Delays in purchasing of TokensInstallation ..| prepaid meters against the will of householdsl ack ot adequate information to consumers on prepaid meters( ut-olls btought by prepaid metersl cchnic.il problems associated with prepaid meters Limited use ol electrical appliancesBad customer care by KPLCDebts aiul arrears that were not cancelledDon't knowOther (specify)
62

Appendix 3:
Interview (aiidcline
I ) Name and location of the Estate
?) When did yon first hear of the prepaid meters pre-pnid electricity?
1) Brief history of the experiences yon have had with KPl.l' when it comes to settling of
your electricity hill
I) Where do you purchase your tokens from or how tin you usually top -up?
5) How many times do you top-up in a month?

<>) Is your household uvvurc on how to conscive electricity?
7| Wh.it electrical appliances do you use in your house daily?
8) What type o f bulbs do you have?
9) What is your experience with the pre-pnid electricity what do you like alxrut it and
what don't you like?
10) Whul is the best experience, in your view about the pre-paid?
II) What is the worst experience, in your view about the prc-|>nid?

12) What are your recommendations on prc-paid electricity?
6S

ENOIX IV
n S E U G E I O E
PRE-PAID POWER
*

p o w n n o i e n g u i d ep a r • (■
pR E-PA ID ELECTRICITY COMES TO KENYAKHLT nnw gives you the power to control your electricity consumption with prepaid power. With a pep-paid meter, paper bills, disconnections and the hassles of reconnections are things you'll never have to deal with You can now buy a crediT slip from any authorised vendor u/ through your mobile phone.
o tF in iD N s a no in ' e r k iw iii
lit »W CAN t GET A IMO-PMI) now UR METER?Al the nuiinvnr Kl'lc *>•»» pmsclaitad the project »»-. to b« usnrratted Irons (h* tudiliorut mai*t to prepayment r o inuMi IMn* tryayo I'^jhiap jint tn mention a few rPYC wsl meet ifir rn»t of ptepjymetst meter m-.rviatiuii tot the protest phase
It PKH-PAID CHEAPER THAN WHAT » PAY NOW?No the chatties wllltie the same rrfrfrottwtMllf Ktsedule. The only difference u that with (vrepoyuxM. ftu, Witltsa paying Vi advance
WILL MYU.U.TRK I IT' HE SHUl UH-ttllliN Illh l KHlIT RUNS OUT?Vit-. , .iu i itltU y will l m vlmi nil Id tu i.i 'iu 'i t.'ifl w hen >s.ui in tu it ra n i o u t. I li/w c v a , Itse m etn i Millgive n w jitilu g w lw it 'lw tre tl- t fu lM te isw ?M tohrs sVCcn ta n O with llili situation A n adv ltaU e tn top
up your Ciedit to a» lu avoid ilra n re ie c tio n
■CIW DO TOBTAIN A <'.HKDIT?You may obtain cneiM horn entiling NPlC pay points e g Mect/Kity t*jv>e aid Siena Pla/a, plus other lulparty wn.Vai sudl as Uclsunil. Zairiand Ul.iivtim<W Pew) SO as 10 VtHAuve DUtchaie convenience V> the (ultranet
II I HAVI AN t ivv ItlSDK ItltL, WILL MS' ELECTRIC! I V IIP SHUTOl K WHEN IHL lfcCHNICJANn a i l S l <S Inci a 11 I HK NKVP MET EH?
ths youl rivnicity Mill iwt he shut odr hnwrsvt. yon shonlrt eealr.ivnm to ' -»» (It* debt pint IP MftvetSKMi olheiwise llie la' will be tr.imfcirrit te, I fif pierxT'»»it system It the Ueiotcr occurs on nMev)i d t poulia-af of eh-, tm rty. a pntn. ii nly«uilpfty>i'«tV( will Pe detlucled and used lo iciluir the
unit aitl»Ncll THE NEW MhritM IS INS I SI LED, WltJ. Tlllt 11*1 I I »•* M.VIc IANS VI t u COME TO READ MY Sll 1 RRv
Nn.meter i.-ad lm )I« s.e s sot y inprepayment tnreefic.j system. rtc-wev't. out KPlCIctimium will te visit inij oj it onset pienilses hum time to tim< ft>«urryOMt nspeawtu as le^ulied t/y lav*.
Hum w in H it «P| C IT< MNIC1AN HI lOI-.NIli ihDr*PIC terhnlrlai. will come ih a (earn ami beat i rnmpany uteishhcaticn l u A He will also have a|n l|i.iyi'HiU rtii'.tn which will isa used Its irplarr the rilitirig credit mater
Will IMP MLITKAI Hd-TlUS l.l-SMK/Hi 11 WAIHO NO ll w tiirtvr will lujt aJIi-r > y Hit <|iyvcir ''m r Wv»>i"
W HA I HAPPENS I i'i MV CURRENT I I Kl INICMYOKKMiIT?Ajcm current nleetrti ity deposit will h# mfuivJrcl *1 you Ivere nv Until
lit >W MUCH POET R CAN I R imYuw i an tniy t \ murhpnsvei M you wbh

UNDERSTANDING THE UNI T’S SCREEN
- (.odd Connected n - Lock Out Condition
X • Entry Rejected8
• Processing
• Nn LOdd m Low Credit Warning /%•*
No Credit
" • • - - Lewd Disconnected ■“Power Level Indicator
v / - Entry•••••

Tokens are available currently from the following vending stations and can also be purchased through MPESA and ZAP 24 hours.
Vendor NameKenya Pcwt>< SI fcjhtirxj Co Kenya Mower A I inhlina Co. Uchumi Capital Ccntit Uchurm N-jnng Hyp*
Sant ( (rare (KPLC O ffice)
Vendor Add m i Hut Inc w Houn
Snma Mar* 8 00a.m. - 4 SOpmClectdclty HiHi'.r alxuirv 4.10pmMombata Road BCO&m - BOOpmNgong Road BOOam. 8.00p.m.1 anij.ru Road nnfa.m. 800pmSaiit» fiitre U 00* m 4.30pm.
8 00* m. 4.30pm.
WHERE TO BUY PRE PAID ELECTRICITY
Purchasing a token
|. Go to the local electricity vendor.2. Supply the operator at the vendor with the meter 10 card or meter serial
number.3. Supply the operator with the amount you wish to purchase.4. You will receive a 20-dig»t token primed on a receipt.
Note:To d is p la y t h e meter seria l n u m b e r , k e y In 100 ' fo l lo w e d b y th e I n t e r 'k ey .
The m e te r w ill d isp la y th e 1 1 -d ig it m e te r seria l n u m b e r , scro lling fr o m r ig h t to le ft ( tw k e ) .
This num ber Is th e sam e a t th e m e ter serial num ber a n d th e num ber o n th e User ID cord u sed to purchase electricity.

PRE PAI D POWER USER GUI DE
Sup tGo lu MPESA timhj select'pay bill'
Step IGo To Zap Menu
Step 2Choose Money Option
Step 3Choose the Nickname option & entei MvPOWtR
Step 2Enter the KFLC prepaid business number SSRRRO and press OK
Step tEnter the I t digit pre payment meter numher that you would like to purchase .i token tor and press OK
Step 4Enter amount
Step ■»Confirm transaction
Step (i
Enter the 4 digit password
Step 7Under icfetewe option enter the full KPLC prepaid 11 digit meter number
7h# customer **dl r r t t h t t a confirmofAm SM S w ith th e foUosvinj a ttr ib u tes
I. Transaction ID - wM >\ is unique tor every transaction
2 Amount pa«l3 KFlC p re p a id m e te r n u m b e r
4. Customers Zap balance.
Enter thr amount you wish to purchase eWcbk Ity token (between KJJvs. 250 and 35.0001 atul press OK
Step 5Enter youi M-I'ESA PIN ind pr«*tt OKConfirm that all live details a<e (m ini and piass OK
You will ireeivc a confirmation SMS horn MHtSA immediately Kf»lC will then generate a token fui your meter and send it to you via sms
HOW TO PURCHASE THROUGH YOUR MOBILE PHONE
Purchasing pre paid electricity token via MPESA is as simple as using your phone.
You will receive a return SMS that contains tho token number whkh you enter into the meter. When the electricity credit is used, dully you purchases mote credit.
T i i R o y o I I M |*LSA T H R O U G H ZAP
" l/wyjr i r w m k - i
f u I n d y )»///• / /
M i'ftt' U lW llxi Iv/k /I
f w i u i f J to Un) m i \
u til /til JW///'fUY f i l i t t
MfUK ”
1

1*111 P AI D P A W M V t l H C U I D I
| |OW T O LOAD YOUR T O K E Ni,
2
3
4
5
6
/
B
Key m the 2 0 <1ig*t number on the token using the keypad and press the enter key
On the screen an "ACCEPT" message will be displayed and yout units will be increased with the amount of elcctnc'ly purchased
If the screers displays a "USED’ message it means that the token has already been used.
If the screen displays an "OLD* message it means, that the token <s old jik! Invalid
If the screen displays a "REiECI" rnessaqe it means that there is something wrong with your token In this case you must contact KPLC Call Centre on the numbers provided
Always check that your merer has enough electricity units left Mils Information is displayed on the screen
A low credit alarm will lx* shown when the credit falls be low JO Kwhrs Please purchase more electricity when this happens to avoid your power yosng off II the token was entered incorrectly the display svtll indicate


pu
t JK
**aq
pX
" ti
aaq\
rn
ur»
"l *
m

PAI D l> 0 W £ R USt f l G U I 0 (
l'll)T- I’O PREPAID TARIFFS'll: I h i i i . n j j i j .//*/'//i .//»/«■ t o p o s t p a n ! n u t f l i t t e r s a t w e l l n s t h e p r e p a i d o n e s :
i l l t h e c h a r g e s a r e t h e t a m e .
II \ It C I . S I IS | \ K 11* I* L) U ( D o m e s t ic L u n s ii ii ic r* }•) a Monthly fixed Charge oI KVi l ittoo*10 £n#n|y charges uf K\h 200 per Unit hjf 0 • iOlitiitsbought.
• <\l.e 10 pet Unit lot >t-MOOUn<tit«>oght.• KSh It) *2 per Unit for Units bought alxive I.SOO
• U na -.tunas ftv K ,to * a tt-H o a r I'kIVhJ• H Tatitt l «. (O o o ir \ t i i Consumers) a used in c o n /u n c th u i w ith M e th o d IT (T he In terruptib le) in tN t ■ use LX) f Wofer t t e u u n j m e tes) a t th e s a m e supply lermJfstsh. th e n th e c o m b in e d S i te d Chtiryr lo t b o th M e th o d s o/CAurgr shall b e K ^h }4<J00
A M S A M i V I l i SThe t Ottoman pay any laxet, levies nr duties Inst* ned from tins* to time by the Government.At present, the following ate levied by the Governmenti VAI • .it 12% ih.«iged to
ol fixed Chargeb) I k-mand t barge litoi applicable to rtomext* i ustomeis)c) Ior sign IxilungeIK., motion Adjustment «i) fuel i o\t and. e ) Inflation Adjustmentf I Taxable value ol electrical energy consumed in a manner required by the Government
u Korol f in tot... ot ion l‘u»|i*mme (WP) levy at of revenue bom Unit vdevm I (K-rgy Hri|otjtory ( • •uirmuion (IHCj levy at 1 Kenya centvikWh
• t i f l h St h e d o le n t V a lue A d tle d Tax A t t C op 4 / 6 e t e m p ts VAT o n su p p ly o t e lec tr ica l energy ro a d n n u ts th h o u s e h o ld where th e i omumpdnn sloes n o t e x c e e d fwo h u n d r e d k l k m t i t t h o u rs tu n its ).
II \ I Y O L S H O U L D K N O W A B O U T V A T «At per the I.III. Schedule III the Value Added lax Act Cap 4/6‘VAI sh.tll be exempt In Use su p p ly o l electrical energy to o domett* houtenoW where the . onsonifiiinn does nor exceed two hundred kilowatt hours IJOOiWh) •
► ' H A I I I M M ' l i N S \N I I I N Y O U C X C K 1C D 200 I ' N I l ‘S I N \ M O N T H ?
VAT chanji'v thall »*• h-vted on oil the elm mm ,ii energy (units) bought from the beginning ol the month
IV II \ I V O T S I I U I ' I . D K N O W A B O U T TAR (PI- D<• 'a. id T»C it a step tariff o.uttwo tokens of the same amount may nor give you tne tame number
nf urslts ilcpa. ..ling on tlw step you xrr .rs amongst other factors• M'l' s vending System u online hem* the system kcept a record of all previous pun hates
and lx t h i n able lit determine the appropriate H e p in the tariff i afr ulatlon

P ‘l f PAI D I ' OWt n 0 S f « GU i D f
t y p i c a l r a r i f f n r ( d o m e s t i c : c o n s u m e r s ) t r a n s a c t i o n s Ol a c u s t o m e r w h o p u r c h a s e sTOKENS 4 T I ME S IN A M O N T H
Charge1*'buy In a month
Fixed Charge 130 00
Total Kwh {33 3X7) 00 60luel •si Fuel Index Chaige i*vh? flirkwhl i.c 783X33.3 360 74
Fore* Fore, < barge (Kih 0 94/kWh) t e 0 94X33 3 31 30inflation
' aaig ifeiE H Inflation Adjustment IKsh 0.08/Kwhl ir008X3)3
366
Rt? ys Rl P Charge |5H) l.e. 0 05X66 SO ) J iEM ooi j
•- i # s sFRt Charge <KihO0)/kWh|i.e 001X3) J 100
VAT VAT (17%) l.e 0 13X130 144011
Total Co»l 100.00foul KwMor
|__ ihemonth__
Charge Kate . •1
fuel 7 8 )1Torex o w l
Inflation o o S l
itP JEMC o o T j
” VAT 13%]
Total Kwh fur the month
97.00 j
i n t buy in a month Concept Ch«rg«i
mFixed Charge 0 00
total Kwh <167X3)r<4/,0X8.1) 1M I011 uelIndexchaige(Kih/fl vkwh)l.e. /83X63 > 498 7 /
Fore* Charge |K»h0 94/kWh> re. 0.94X6) 7 daInflation Adjustment (X»h 008/Kwh) ie. VI0
00RX61 7KIP Charge iV*)ie 0.06X414 10 7071
tKC Chaige IKsh 0.03/VWhl i e 001X63.7 1.91VAI (17%) ic. 0.13X0 000*
Total Cost T.000 00

r Uf . PAl O P Q W £ W U b » « C 0 I 0 r
harge
:*•1CU
>tt»l Kwfi to i i« n Hind i
Comept Charge*
Ford Chary# 0.00total Kwh ?a.ax8.ioi
”• utTbuK* I • 4h78J/fcwft) ,'i z a jm s 7KM ~ Fort* Charge(K*h0.04/kWh) i.e 0.94X28 a 270/
Inflation Adjutlmant dun 0.08/Kwhl ie 0 08X28.8 2 toK » f hw gels*)7«. 0O5X 233.5”
_EtlCChM9e(Kih0.03AWhJ le.O03X2&8 Y tibVAT (11%) le. 0.12X0 _000
Total Cott 500.00Ub.R0
liuy In a mixilli Hat*
UXHI
i.tl k.y»i far ^ month
Filled ChargeCharge*
■ aTotal Kwti<?b 2X8 l) 609.12J
Fual Index Cliaig* <K*h7 BJAwhjIe. 78IX/5 2 588.821Form Charge {Kih 0 94AWh|. e 0 94X7SJ 7069
inflation Adju»tnreiit (Kih 0 08/Kwhl l e 0 OflX/5 2 ” 602HfP Charge 0.05X409 I2 JO 46
fcHC Charge (Kih 0 OVkWhl 1 1 0 01X75 2 2,26vai (!/*,»»• b.uxb (1M x» 1) 111 / 83*20 n r-IO X* »1 )♦ (0.0
dxTOIj)
_ 172.21
Total Co»t 1,680.00201 Od
TmUI Coil Iv f II* muntn<1 Mbwy • ZniMtuy * Uc r JjMO 00
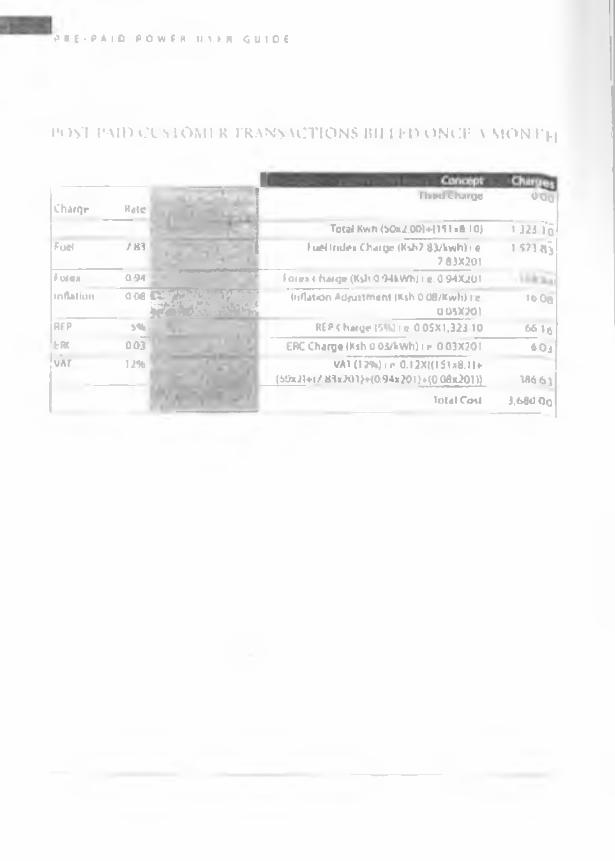
P D E - P A I O P O w f f t II > I- « G U I D E
POST PAID CUSTOMl-:K TRANSACTIONS lill.l FO O N C I: V MON TH
ChaiQr Wole■ n.Bd Charge OQq
■ Total Kwn (SOx/OOWVi1 «6 10) 1 32J.V6feel /.83 Fort index Charge (Kdi? 83/kwh) i e
783X2011571 Oj
»W®x 0 91 lo ir , i huge(Kv)i O.WkWhl i e.01MX20Iinflation 008
|1
Inflation Ad;u»iment |A»h 008/Ktvh) i r0.05X201
ibOa
RFP 5%j REP<.hMO«l«Uic 005X1.323 10 6M $FIX o o F ERC Charge (Kih0 0 i/V\vh)ir 003X201 6 O3
vi\r 12% VA! (1 ?9») i •• 0.12X((151x8.11 ► (50x21+l7.83*2OlMa94x20l>»<0 08x2011) W6 6 )
Total C<nt 3,<>80 Oy

pot cmcigcnry im m ature call:020 5201000, 0711 031000, 0732-111000.
wwwkplc.co kc