Factors associated with social participation amongst ...
14
RESEARCH ARTICLE Open Access Factors associated with social participation amongst elders in rural Sri Lanka: a cross- sectional mixed methods analysis Celeste Marsh 1* , Paul A. Agius 1,2,3 , Gamini Jayakody 5 , Roshan Shajehan 6 , Chandima Abeywickrema 6 , Kelly Durrant 1,2 , Stanley Luchters 1,2,4 and Wendy Holmes 1 Abstract Background: Populations of low and middle-income countries are ageing rapidly; there is a need for policies that support an increase in the duration of old age lived in good health. There is growing evidence that social participation protects against morbidity and mortality, but few studies explore patterns of social participation. Analysis of baseline quantitative and qualitative data from a trial of the impact of Elders’ Clubs on health and well- being in the hill country of Sri Lanka provided an opportunity to better understand the extent of, and influences on, social participation among elders. Methods: We analysed data from 1028 baseline survey respondents and from 12 focus group discussions. Participants were consenting elders, aged over 60 years, living in Tamil tea plantation communities or Sinhala villages in 40 randomly selected local government divisions. We assessed participation in organised social activities using self-reported attendance during the previous year. Multivariable regression analyses were used to explore associations with community and individual factors. The quantitative findings were complemented by thematic analysis of focus group discussion transcripts. Results: Social participation in these poor, geographically isolated communities was low: 63% reported ‘no’ or ‘very low’ engagement with organised activities. Plantation community elders reported significantly less participation than village elders. Attendance at religious activities was common and valued. Individual factors with significant positive association with social participation in multivariable analyses were being younger, male, Sinhala, married, employed, and satisfied with one’s health. Domestic work and cultural constraints often prevented older women from attending organised activities. Conclusions: Elders likely to benefit most from greater social contact are those most likely to face barriers, including older women, the oldest old, those living alone and those in poor health. Understanding these barriers can inform strategies to overcome them. This might include opportunities for both informal and formal social contact close to elders’ homes, consulting elders, providing childcare, improving physical access, advocating with elders’ families and religious leaders, and encouraging mutual support and inter-generational activities. Influences on social participation are interrelated and vary with the history, culture and community environment. Further study is required in other low and middle-income country contexts. Keywords: Social participation, Organised activities, Older adults, Low and middle income countries, Healthy ageing, Active ageing * Correspondence: [email protected] 1 Burnet Institute, Melbourne, Australia Full list of author information is available at the end of the article © The Author(s). 2018 Open Access This article is distributed under the terms of the Creative Commons Attribution 4.0 International License (http://creativecommons.org/licenses/by/4.0/), which permits unrestricted use, distribution, and reproduction in any medium, provided you give appropriate credit to the original author(s) and the source, provide a link to the Creative Commons license, and indicate if changes were made. The Creative Commons Public Domain Dedication waiver (http://creativecommons.org/publicdomain/zero/1.0/) applies to the data made available in this article, unless otherwise stated. Marsh et al. BMC Public Health (2018) 18:636 https://doi.org/10.1186/s12889-018-5482-x
Transcript of Factors associated with social participation amongst ...

RESEARCH ARTICLE Open Access
Factors associated with social participationamongst elders in rural Sri Lanka: a cross-sectional mixed methods analysisCeleste Marsh1* , Paul A. Agius1,2,3, Gamini Jayakody5, Roshan Shajehan6, Chandima Abeywickrema6,Kelly Durrant1,2, Stanley Luchters1,2,4 and Wendy Holmes1
Abstract
Background: Populations of low and middle-income countries are ageing rapidly; there is a need for policies thatsupport an increase in the duration of old age lived in good health. There is growing evidence that socialparticipation protects against morbidity and mortality, but few studies explore patterns of social participation.Analysis of baseline quantitative and qualitative data from a trial of the impact of Elders’ Clubs on health and well-being in the hill country of Sri Lanka provided an opportunity to better understand the extent of, and influenceson, social participation among elders.
Methods: We analysed data from 1028 baseline survey respondents and from 12 focus group discussions.Participants were consenting elders, aged over 60 years, living in Tamil tea plantation communities or Sinhalavillages in 40 randomly selected local government divisions. We assessed participation in organised social activitiesusing self-reported attendance during the previous year. Multivariable regression analyses were used to exploreassociations with community and individual factors. The quantitative findings were complemented by thematicanalysis of focus group discussion transcripts.
Results: Social participation in these poor, geographically isolated communities was low: 63% reported ‘no’ or ‘verylow’ engagement with organised activities. Plantation community elders reported significantly less participationthan village elders. Attendance at religious activities was common and valued. Individual factors with significantpositive association with social participation in multivariable analyses were being younger, male, Sinhala, married,employed, and satisfied with one’s health. Domestic work and cultural constraints often prevented older womenfrom attending organised activities.
Conclusions: Elders likely to benefit most from greater social contact are those most likely to face barriers,including older women, the oldest old, those living alone and those in poor health. Understanding these barrierscan inform strategies to overcome them. This might include opportunities for both informal and formal socialcontact close to elders’ homes, consulting elders, providing childcare, improving physical access, advocating withelders’ families and religious leaders, and encouraging mutual support and inter-generational activities. Influenceson social participation are interrelated and vary with the history, culture and community environment. Further studyis required in other low and middle-income country contexts.
Keywords: Social participation, Organised activities, Older adults, Low and middle income countries, Healthyageing, Active ageing
* Correspondence: [email protected] Institute, Melbourne, AustraliaFull list of author information is available at the end of the article
© The Author(s). 2018 Open Access This article is distributed under the terms of the Creative Commons Attribution 4.0International License (http://creativecommons.org/licenses/by/4.0/), which permits unrestricted use, distribution, andreproduction in any medium, provided you give appropriate credit to the original author(s) and the source, provide a link tothe Creative Commons license, and indicate if changes were made. The Creative Commons Public Domain Dedication waiver(http://creativecommons.org/publicdomain/zero/1.0/) applies to the data made available in this article, unless otherwise stated.
Marsh et al. BMC Public Health (2018) 18:636 https://doi.org/10.1186/s12889-018-5482-x

BackgroundPopulations of low and middle-income countries areageing rapidly as a result of achievements in reducingfertility rates and extending life expectancy [1]. In SriLanka, 13.9% of the population are currently over60 years, and this is projected to increase to 28.6% by2050 [2]. Older people contribute significantly to theeconomy and wellbeing of their families and communi-ties, but poor health and disability can hinder this. Trad-itional family support for elders is affected by smallerfamily sizes, more women working outside the home,and migration [3]. There is a need for health promotinginterventions for elders to lessen the growing demandfor health and long-term care services.There has long been interest in the role of social rela-
tionships in promoting health [4], and the evidence basefor the significance of social participation as a protectivefactor in old age has been growing rapidly [5–9]. Ameta-analysis of the extent to which social relationshipsinfluence mortality risk in high-income countries founda 50% increased likelihood of survival for participantswith stronger social relationships, an influence compar-able with the ‘lifestyle’ risk factors [7].Social participation may influence health and well-
being through a variety of pathways [10]. Social isola-tion can result in the release of stress hormones thataffect blood pressure, blood lipids, and immunity[11–14]. The hormone oxytocin, which reinforces so-cial bonding, is anti-inflammatory and cardio-protective [15]. Social contacts may provide emotionaland practical support, access to information, newskills, peer support in managing chronic conditions[16], greater physical activity, a collective voice foradvocacy, joint income generating opportunities andeasier access to services [10].‘Social participation’ has been conceptualised and mea-
sured from varied perspectives by researchers from dif-ferent disciplines. Social scientists have widely adoptedthe term ‘social capital’ viewing an individual’s social net-work as an asset. Navarro, however, argues that ‘socialcapital’ is part of the neoliberal economic discourse, dis-placing analysis of power and politics [17]. Developmentworkers have long studied ways to facilitate ‘communityparticipation’, including citizen engagement and volun-teerism [18]. Some researchers include both formal orga-nised activities and informal social contact, such aschatting with a neighbour [19]. Disability researchers areinterested in barriers to participation, so often examineparticipation in family and work [20]. In recent years,scales have been developed and validated for measuringsocial participation among groups such as the disabled[21], the mentally ill [22] and older people [23]. Severalresearchers have noted the variation in how social par-ticipation is measured [7, 18, 24].
It is useful to study the factors that might influencethe extent of social participation by elders in differentsettings. These factors may themselves be influenced bythe extent of social participation, and by each other. Forexample, in some settings younger and fitter elders mayhave easier access to social activities than ill or disabledelders [6], while in poor communities their need andability to work may restrict social activities. They canusefully be divided into characteristics of individuals andof their environments [25, 26]. In Fig. 1, we show indi-vidual and community characteristics that might influ-ence elders’ social participation, based on the literature.This study aims to describe the extent and patterns of
social participation in organised social activities amongelders in a rural Sri Lankan setting, and to explore anyassociations with individual and community characteris-tics. We have used the baseline qualitative and quantita-tive data collected as part of a cluster randomisedcontrolled trial (RCT). The trial, which was part of the‘Better Vision, Healthy Ageing (BVHA)’ Program (2012–2016), aimed to assess the impact of community level El-der’s Clubs on the health and wellbeing of elders [Trialregistration: International Development Impact Evalua-tions Registry, ID-533c34a8b8734].
MethodsStudy setting and populationThe study was conducted in two of the five administra-tive divisions of Nuwara Eliya district. This area has apopulation of 316,213, of whom 35,669 (11.3%) are over60 years, across 197 Grama Niladhari (local government)Divisions (GNDs) [27]. Tea plantation communities,mostly Tamil, make up 53% of this population; 41%,mostly Sinhala, live in rural villages; and 6% live in urbancentres [27]. Nuwara Eliya town is 1889 m above sealevel; the climate is cool and damp. Tea plantation resi-dents are a disadvantaged group with poor socio-economic, health and nutrition indicators [28]. Eligibleparticipants were aged 60 years or older and lived in thestudy area.
Study designThis was a mixed methods study; we used the baselinequestionnaire data (Additional file 1) from the trial ascross-sectional survey data for multivariable analyses.The sample size of 1200 and the number of clusterswere determined based on the needs of the cluster RCT.Forty GNDs (clusters) were randomly selected, propor-tionate to population size. GNDs had a median popula-tion of older people of 247 (range: 28–530) living inbetween one and seven villages or tea plantation com-munities. A fixed size random sample of 30 eligible par-ticipants was then drawn from local governmentpopulation registers in each GND, with an additional
Marsh et al. BMC Public Health (2018) 18:636 Page 2 of 14

random replacement sample of 10 to allow for migra-tion, death or declined participation. Relevant findingsfrom twelve focus group discussions (FGDs) were usedto complement the quantitative results.
Ethical considerationsFor reasons of equity and to avoid selection bias a con-senting proxy respondent (family member) answered forelders with impaired cognition, deafness or inability tospeak in the quantitative survey. Signed informed consentwas obtained; participants unable to write gave theirthumbprint, and a witness signed to confirm that the elderunderstood the study. The Program Elders AdvisoryGroup, made up of elders from the area, was consultedabout ethical issues. The study received approval from theEthics Review Committee of the University of Peradeniya,Sri Lanka, and the Alfred Hospital Research Ethics Com-mittee in Melbourne, Australia (Reference No. 149/13).
Quantitative componentStudy proceduresA team of 20 trained data collectors, both Tamil and Sin-hala, undertook data collection between August and No-vember 2013. Community leaders invited sampled elders toan appropriate venue; some home visits were also required.After explaining the purpose of the study, the data collec-tors requested permission to ask the 10 questions of theadapted and translated Abbreviated Mini-Mental Stateexamination (MMSE). Those who scored seven or morewere provided with detailed information about the studyprocesses, benefits and risks, and asked to provide informedconsent. When participants scored less than seven, a familymember was identified as a proxy respondent, and
informed consent was requested from both the proxy andthe elder. Data collectors of the same sex as the elderadministered a comprehensive questionnaire (in Tamil orSinhala) including questions about their demographic,health, social behaviour, health behaviours, and economicdata. Anthropometry and blood pressure were alsoassessed. The questionnaire had been translated intoSinhala and Tamil and back-translated to check for accur-acy and lack of ambiguity. The translated questionnaireshad been modified after pre-testing with a group of Tamilelders and a group of Sinhala elders.
Data managementEach participant was assigned a unique identificationnumber. The data were double-entered into EpiData ver-sion 1.4.2 (EpiData Data Entry, Data Management andbasic Statistical Analysis System, Odense Denmark: Epi-Data Association). Data were compared and validatedusing the in-built report within the EpiData software.Where appropriate, missing unit record data was com-pared with matching hardcopy questionnaire responsesand corrected accordingly. Initial data cleaning andscreening for analysis was undertaken using the Statastatistical software package Version 13.1 (Stata Corp,College Station, TX: StataCorp LP, USA).
Study measures
Outcome - level of social participation We askedabout frequency of participation in eight organised socialactivities (Table 2) during the previous year (daily, weekly,monthly, six monthly and once a year or less). We derivedan overall score ‘events per year’ (EPY) for each elder, and
Fig. 1 Conceptual model: influences on social participation
Marsh et al. BMC Public Health (2018) 18:636 Page 3 of 14

categorised these as: ‘none or very low’ (attending fewerthan three events in a year); ‘low’ (less than monthly at-tendance); ‘medium’ (monthly to weekly attendance); and‘high’ (weekly attendance or more). We chose to includeonly organised social activities in our analyses because in-fluences on organised and informal social activities havebeen found to differ [19, 29] and organised social activitiesare more amenable to intervention.
Independent factors The choice of covariates for theanalysis was theoretically driven [19, 30, 31].
Sociodemographic factorsWe asked elders their date of birth and grouped age: 60–69 years; 70–79 years; and 80 years or older. Ethnicity wasrecorded as Tamil or Sinhala. Elders were categorised as‘married’ and ‘not married’ (widowed, never married, di-vorced or separated). Household composition comprisedfour groups: ‘living alone’; ‘living only with spouse’; ‘livingwith three or less additional household members (not in-cluding spouse only)’; and ‘living with four or more add-itional household members’. Elders were asked about thenumber of years at school. We categorised this as ‘no for-mal schooling’, ‘some primary schooling (1-5 years)’, and‘some secondary schooling (6-12 years)’. Elders reportedwhether they were engaged in paid work or not.
DisabilityWe categorised elders as ‘independent in activities ofdaily living (ADLs)’ if they could eat, dress, wash, usethe toilet, take care of their appearance, walk, and get inand out of bed without assistance. Elders were otherwiseclassified as ‘requiring help with at least one ADL’. TheADL scale was adapted from the Katz Scale [32].
Fear of fallingParticipants rated their level of concern about falling atsocial events on a four-point scale [33]. We created abinary variable: ‘not concerned’ (‘not at all’ or ‘somewhatconcerned’) and ‘concerned’ (‘fairly’ or ‘very concerned’).
VisionTo develop a binary self-reported vision variable, we usedresponses to the question: “In general, would you say yoursight is ‘excellent’, ‘good’, ‘poor’ or ‘blind” and re-categorised this as: ‘poor or blind’ and ‘good or excellent’.
DepressionWe employed the 7-item Geriatric Depression Scale(GDS-7), which has been validated in an urban Asiansetting [34]. We used a cut-off score for depression ofthree or above.
Self-reported healthThe question “How satisfied are you with your health” an-swered on a five point scale from ‘not at all’ to ‘extremely’ isincluded in the Quality of Life Instrument for the YoungElderly in Sri Lanka (QLI-YES) [35]. Those who responded‘not at all’, ‘a little’ or ‘somewhat’ were compared with thosewho responded ‘very much’ or ‘extremely’.
Satisfaction with social contactThe QLI-YES includes the question “How satisfied areyou with your contact with family and friends?” Thosewith ‘low satisfaction’ levels (those responding ‘not at all’, ‘alittle’ or ‘somewhat’) were compared with those with ‘highsatisfaction’ (those responding ‘very much’ or ‘extremely’).
Sociability traitWe used a scale developed and validated by Cheek andBuss [36], which measures the sociability trait, or prefer-ence to be with other people. This has five positive itemsscored on a Likert scale from 1(strongly disagree) to 5(strongly agree). Scores for each item were aggregated toderive a composite measure of sociability.
Statistical analysesWe used contingency table analyses to provide prevalenceestimates of social participation and selected variablesmodelled in multivariable analyses. In univariable analyses,standard errors and associated 95% confidence intervalsaround prevalence estimates took account of the GNDclustering. Generalized linear latent and mixed modelling(gllamm) [37], was used to estimate multi-level propor-tional odds logistic regression models exploring correlatesof social participation, with a random intercept for sam-pled GNDs and study participant level covariates esti-mated as fixed factors. Where the proportional oddsassumption was not met for specific factor effects in pro-posed models (i.e. the independent effects of a factor var-ied across levels of social participation), gllamm modellingspecified covariate specific threshold logit regressionmodels in order to relax the proportional odds constraint.Brant tests [38] and likelihood ratio tests between nestedgllamm models (less constrained models relaxing the pro-portional odds assumption for selected factors) were usedto provide statistical inference on whether data met theproportional odds regression assumption. Multivariableproportional odds regression analyses treated GNDs asrandom factors and therefore modelled the dependency inthe sampled divisional clusters directly, providing effectestimates and standard errors for exposures, which tookaccount of GND specific variance in rates of social partici-pation. Random intercept variances from gllamm modelswere used to estimate both unconditional and conditional(i.e. after estimation controlling for covariates) intraclasscorrelations (ICC) for level-2 units in order to describe
Marsh et al. BMC Public Health (2018) 18:636 Page 4 of 14

the level of GND specific heterogeneity in social participa-tion. For polytomous exposures, post-estimation Waldtests were undertaken to test for joint effects and statis-tical differences between exposure groups. A completecase approach was taken and statistical significanceassessed at the 5% level.
Qualitative componentThe baseline study included 12 Focus Group Discussions(FGDs) each with 8–10 elders (total 110). We conductedhalf the FGDs in tea plantation communities, with Tamilretired tea plantation workers, and half in Sinhala ruralor peri-urban village communities. We selected partici-pants for each group to be from the same community,speak the same language, and to include a range of agesover 60 years, and both married and widowed elders. Allinvited elders agreed to take part. The FGDs took placein a temple, dispensary, village hall, or in the home of anelder. Gender may influence discussion dynamics so weconducted four groups with only women, four with onlymen, and four were mixed. Each group had a facilitatorand a note-taker. The trained facilitators were the fourProgram Officers (community development workers)and two field staff who spoke the same language as theparticipants and were familiar with the communities. Acomprehensive question guide about health and well-being was developed based on review of the literature,which included questions about social participation. Thelocal team refined the guide to ensure that the questionswere appropriate and relevant. The questions about so-cial participation included the types of social activitieselders participated in, benefits perceived and barriersthey experience.The elders gave written informed consent. Facilitators
advised the participants that the discussion would beconfidential and requested them not to talk about whatwas discussed with non-participants. The FGDs lastedabout one hour. They were audio recorded with permis-sion from the participants.
Qualitative data analysisThe recordings were transcribed verbatim and translatedinto English. The data were organised under themes andsub-themes that emerged from the data, and sum-marised. The interpretation was checked by the Sri Lan-kan researchers and facilitators. We have illustrated thefindings with verbatim quotes.
ResultsFor baseline interviews, 1141 elders were enrolled (Fig. 2).Figure 2 shows the exclusion pathway from baseline inter-views (n = 1141) to the final sample for analysis (n = 1028).The response rate was 88%. The average number of eldersinterviewed in each of the randomly selected GNDs
was 28.3 (SD = 1.8). For 6% of the sample, a family memberanswered on behalf of the elder. Of those interviewed, threescored below seven on the cognitive screening assessmentusing the abbreviated MMSE and did not have a proxy an-swer questions on their behalf and therefore did not meetthe study inclusion criteria. Of the 1132 elders (99.2%) whoprovided a response on the social participation outcomemeasure; 35 had discrepancies between the two parts of thesocial participation question and were excluded from theanalysis. The remaining 1028 participants all had completedata for covariates and constitute our population for theanalysis. Cases included in the multivariable regressionmodel showed marginally higher levels of social participa-tion to those excluded on the basis of incomplete or unreli-able data (OR = 1.58), however, this difference was notstatistically significant (Wald χ2(1) = 2.02, p = 0.16).
Quantitative sample characteristicsThere were 543 women (53%) and 485 men (47%). Theaverage age was 68 years (SD = 6.4; Table 1). The major-ity of elders (56%) lived in Tamil plantation communi-ties; 33% lived in Sinhala villages; and 11% lived inmixed Tamil and Sinhala communities adjacent to teaplantations. Almost half (49%) the elders lived in house-holds of four or more; only 60 (6%) were living alone.Two thirds of the sample (n = 628) were married; 312(30%) were widowed (11% of the men and 48% of thewomen), 85 (8%) had never married and three had di-vorced or separated. About one quarter of the samplehad received no formal schooling (n = 254); 82% of thesewere women (n = 205). The mean number of years ofschooling was 4.1 years (SD = 3.5). Of all elders in thesample, 284 (27.6%) took part in paid work. Just overhalf of the elders reported low satisfaction with health(54%). Most of the elders (85.9%) were independent inADLs such as washing and dressing. Over half the sam-ple reported poor vision or blindness (54.5%). The meanscore for ‘sociability trait’ was 20.2 (SD = 0.08).
Patterns of social participationParticipation in organised social activities was generallylow, with more than half the sample (n = 652, 63%)reporting ‘no’ or ‘very little’ (< 3 EPY) engagement in thepast year (Table 1). Of those who reported taking part inat least one organised social activity, the median numberof EPY was 13 (IQR = 12–64).The unconditional intraclass correlation coefficient
(ICC) for elders’ social participation indicated that thelevel of between GND heterogeneity in levels of partici-pation among elders was moderate to high (ρ=0.42). Theconditional ICC, from multivariable modelling, reducesto an estimated ρ=0.10.Table 2 describes the frequency of participation by ac-
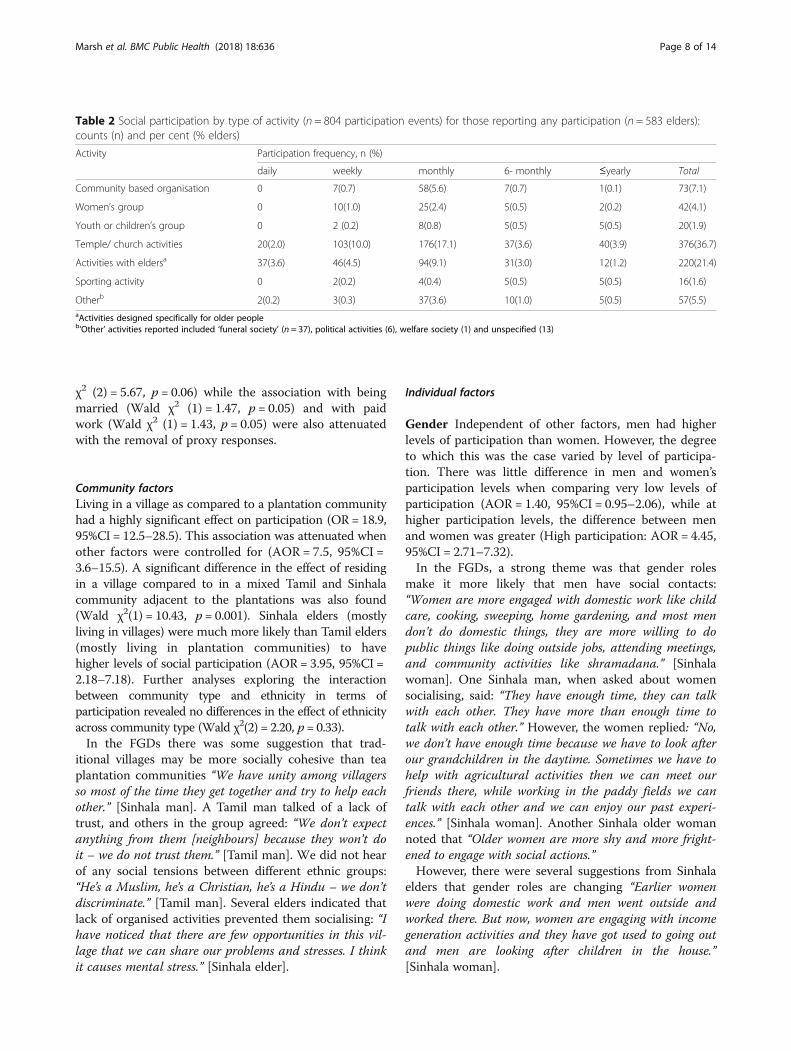
tivity type and shows religious activities were the most
Marsh et al. BMC Public Health (2018) 18:636 Page 5 of 14

common, with the majority of elders taking part on aver-age once a month. Only 16 elders reported taking partin any sporting activity. Other organised activities men-tioned were ‘Funeral society’ (37), ‘Political activities’ (6),and ‘Welfare society’ (1). Thirteen elders reported an un-specified ‘other’ activity.In the FGDs, both Sinhala and Tamil elders talked of
valuing participation in community affairs: “It’s important,it will give peace of mind and happiness.” [Tamil man].When asked about the types of social activities they par-ticipate in, they referred most commonly to religious ac-tivities: “Earlier we got married, we produced and raisedour children and didn’t have much time for these religiousactivities, so this is a good time to follow these religious ac-tivities in our life.” [Sinhala man]; “In our temple, if any-thing happens, they call me. I am good at art, therefore Iget opportunities to perform and this makes me happy.”[Tamil man]. Many elders felt they gain respect when theyparticipate in religious rituals: “We can observe ‘sil’ (reli-gious alms giving) and we can get respect from others, andas older people we are always thinking about religiousthings like alms-giving and meditation and participate inthose activities.” [Sinhala man]. Several elders talked abouttheir special role at ceremonies such as funerals and wed-dings: “As women who are living in this village we attendto puberty ceremonies, funerals, alms-givings and we helpin such kind of activities.” [Sinhala woman].Helping others was a common theme. Shramadana ac-
tivities (sharing one’s time and energy for the welfare ofall) are common in Sri Lanka and were conducted by
both Sinhala and Tamil elders. Alms-giving, visiting thesick and sweeping temples were also often mentioned.The elders also talked about helping their neighbours byproviding meals, helping them to take medicines, andconsoling them when bereaved. Inter-generational activ-ities were important to several elders as a way of passingon their knowledge and skills: “I was teaching kavadifolk dance to five students – those are good culturalthings – it should not be destroyed – the current gener-ation is more interested in Indian dance. They don’t haveour skills now.” [Tamil man]. Other social activities men-tioned included going on excursions, especially to reli-gious sites, gardening, political activities, and gettingtogether with friends.
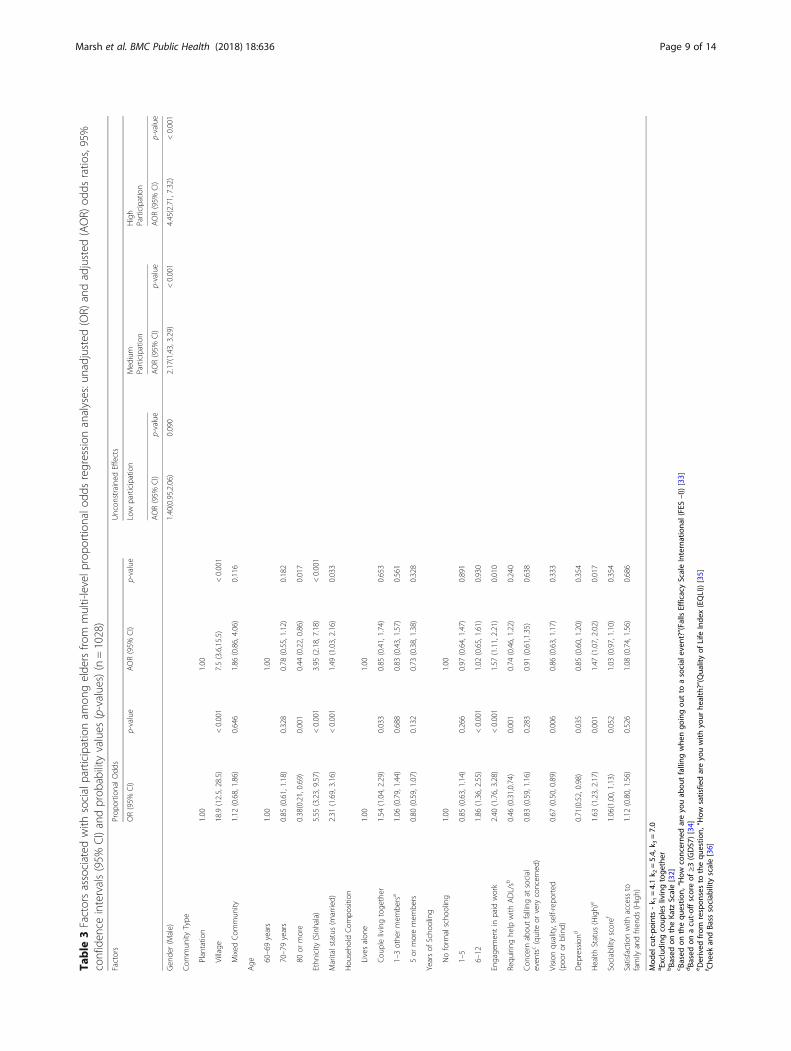
Factors associated with taking part in organised activitiesIn exploring the extent to which the multivariable modelwas specified correctly (i.e. testing the proportional oddsassumption), a Brant test from normal proportional oddsregression analyses showed that the assumption of pro-portional odds for the specified model was not reason-able given the data (χ2(40) = 75.7; p = 0.001) and thatgender (χ2(2) = 24.2, p < 0.001) exhibited a non-proportional effect. This was supported statistically bylikelihood ratio testing from gllamm modelling, whichshowed that partial relaxation of effect proportionality (i.e.for gender) showed significantly better fit than the fullyconstrained model (LR χ2(2) = 22.1, p < 0.001).Factors found to have significant positive univariable
and multivariable associations with social participation
Fig. 2 Baseline Data Flow Chart
Marsh et al. BMC Public Health (2018) 18:636 Page 6 of 14

included: living in a village, Sinhala ethnicity, youngerage, male gender, being married, employed in paid work,and being satisfied with one’s health (Table 3). Beingaged over 80 years was negatively associated with takingpart in organised social activities.Several other variables including vision, education level,
requiring assistance with ADLs, household compositionand depression had significant univariate associations withsocial participation, however, the effect was not significantin the adjusted model (vision: Wald χ2(1) = 0.86, p = 0.33;assistance with ADLs: Wald χ2(1) = 0.74, p = 0.24;educational level: Wald χ2(2) = 0.07, p = 0.96; householdcomposition: Wald χ2(3) = 1.29, p = 0.73; depression: Waldχ2 (1) = 0.71, p = 0.35). ‘Satisfaction with social contact’(Wald χ2(1) = 1.08, p = 0.69), ‘sociability’ (Wald χ2(1) =1.03, p = 0.35) and ‘fear of falling at social events’(Wald χ2(1) = 0.91, p = 0.64) were not significantlyassociated with social participation.When elders with proxy respondents were excluded
from the analyses, two univariate associations droppedbelow the significance level (p = 0.05); assistance withADLs (OR = 0.64, 95% CI = 0.4–1.04) and age (> 80 years:OR = 0.56, 95%CI = 0.29–1.10). In the adjusted model,the association with age remained non-significant (Wald
Table 1 Descriptive characteristics and social participationamong elders, in Nuwara Eliya, Sri Lanka (n = 1028). Counts (n)and percent (%)
Factors n (%)
Community Factors
Community Type
Plantation 573 (56)
Village 339 (33)
Mixed communities adjacent to the plantations 116 (11)
Sociodemographic Factors
Gender
Female 543 (53)
Male 485 (47)
Age (years)
60–69 691 (67)
70–79 267 (26)
80 or more 70 (7)
Ethnicity
Tamil 691 (67)
Sinhalese 337 (33)
Marital status
Married 628 (61)
Unmarrieda 400 (39)
Household composition
Lives alone 60 (6)
Couple living together 133 (13)
Living with 1–3 others (excluding couples) 336 (33)
5 or more members in household 499 (48)
Education (years of Schooling)
No formal schooling 254 (25)
1–5 479 (47)
6–12 295 (29)
Engagement in paid work
Yes 284 (28)
No 744 (72)
Activities of Daily Living (ADL)b
Independent 883 (86)
Requiring some help 145 (14)
Concern about falling at social eventsc
None-little 795 (77)
Somewhat -Very 233 (23)
Vision quality (self-reported)
Poor vision or blind 560 (54)
Good or excellent vision 468 (46)
Depressiond
Yes 361 (35)
No 667 (65)
Table 1 Descriptive characteristics and social participationamong elders, in Nuwara Eliya, Sri Lanka (n = 1028). Counts (n)and percent (%) (Continued)
Factors n (%)
Self-reported health statuse
Low 551 (54)
High 477 (46)
Family connectedness and traits
Sociability scalef mean total score (SD) 20.2 (0.1)
Satisfaction with contact with familyg
Low 261 (25)
High 767 (75)
Social participation (Outcome measure)
Participation frequency (events per year)
No/very low participation (< 3) 652 (63)
Low participation (3–11) 132 (13)
Medium participation (12–51) 111 (11)
High participation (52+) 133 (13)aIncludes those who reported ‘never married’, ‘separated’, ‘widowed’or ‘divorced’bBased on the Katz Scale [32]cBased on the question, “How concerned are you about falling when goingout to a social event?”(Falls Efficacy Scale International (FES –I)) [33]dBased on a cut-off score of ≥3 (GDS7) [34]eDerived from responses to the question, “How satisfied are you with yourhealth?”(Quality of Life Index (EQLI)) [35]fCheek and Bass sociability scale [36]gDerived from responses to question, “How satisfied are you with your contactwith family and friends?” (Quality of Life Index (EQLI) [35]
Marsh et al. BMC Public Health (2018) 18:636 Page 7 of 14
χ2 (2) = 5.67, p = 0.06) while the association with beingmarried (Wald χ2 (1) = 1.47, p = 0.05) and with paidwork (Wald χ2 (1) = 1.43, p = 0.05) were also attenuatedwith the removal of proxy responses.
Community factorsLiving in a village as compared to a plantation communityhad a highly significant effect on participation (OR = 18.9,95%CI = 12.5–28.5). This association was attenuated whenother factors were controlled for (AOR = 7.5, 95%CI =3.6–15.5). A significant difference in the effect of residingin a village compared to in a mixed Tamil and Sinhalacommunity adjacent to the plantations was also found(Wald χ2(1) = 10.43, p = 0.001). Sinhala elders (mostlyliving in villages) were much more likely than Tamil elders(mostly living in plantation communities) to havehigher levels of social participation (AOR = 3.95, 95%CI =2.18–7.18). Further analyses exploring the interactionbetween community type and ethnicity in terms ofparticipation revealed no differences in the effect of ethnicityacross community type (Wald χ2(2) = 2.20, p= 0.33).In the FGDs there was some suggestion that trad-
itional villages may be more socially cohesive than teaplantation communities “We have unity among villagersso most of the time they get together and try to help eachother.” [Sinhala man]. A Tamil man talked of a lack oftrust, and others in the group agreed: “We don’t expectanything from them [neighbours] because they won’t doit – we do not trust them.” [Tamil man]. We did not hearof any social tensions between different ethnic groups:“He’s a Muslim, he’s a Christian, he’s a Hindu – we don’tdiscriminate.” [Tamil man]. Several elders indicated thatlack of organised activities prevented them socialising: “Ihave noticed that there are few opportunities in this vil-lage that we can share our problems and stresses. I thinkit causes mental stress.” [Sinhala elder].
Individual factors
Gender Independent of other factors, men had higherlevels of participation than women. However, the degreeto which this was the case varied by level of participa-tion. There was little difference in men and women’sparticipation levels when comparing very low levels ofparticipation (AOR = 1.40, 95%CI = 0.95–2.06), while athigher participation levels, the difference between menand women was greater (High participation: AOR = 4.45,95%CI = 2.71–7.32).In the FGDs, a strong theme was that gender roles
make it more likely that men have social contacts:“Women are more engaged with domestic work like childcare, cooking, sweeping, home gardening, and most mendon’t do domestic things, they are more willing to dopublic things like doing outside jobs, attending meetings,and community activities like shramadana.” [Sinhalawoman]. One Sinhala man, when asked about womensocialising, said: “They have enough time, they can talkwith each other. They have more than enough time totalk with each other.” However, the women replied: “No,we don’t have enough time because we have to look afterour grandchildren in the daytime. Sometimes we have tohelp with agricultural activities then we can meet ourfriends there, while working in the paddy fields we cantalk with each other and we can enjoy our past experi-ences.” [Sinhala woman]. Another Sinhala older womannoted that “Older women are more shy and more fright-ened to engage with social actions.”However, there were several suggestions from Sinhala
elders that gender roles are changing “Earlier womenwere doing domestic work and men went outside andworked there. But now, women are engaging with incomegeneration activities and they have got used to going outand men are looking after children in the house.”[Sinhala woman].
Table 2 Social participation by type of activity (n = 804 participation events) for those reporting any participation (n = 583 elders):counts (n) and per cent (% elders)
Activity Participation frequency, n (%)
daily weekly monthly 6- monthly ≤yearly Total
Community based organisation 0 7(0.7) 58(5.6) 7(0.7) 1(0.1) 73(7.1)
Women’s group 0 10(1.0) 25(2.4) 5(0.5) 2(0.2) 42(4.1)
Youth or children’s group 0 2 (0.2) 8(0.8) 5(0.5) 5(0.5) 20(1.9)
Temple/ church activities 20(2.0) 103(10.0) 176(17.1) 37(3.6) 40(3.9) 376(36.7)
Activities with eldersa 37(3.6) 46(4.5) 94(9.1) 31(3.0) 12(1.2) 220(21.4)
Sporting activity 0 2(0.2) 4(0.4) 5(0.5) 5(0.5) 16(1.6)
Otherb 2(0.2) 3(0.3) 37(3.6) 10(1.0) 5(0.5) 57(5.5)aActivities designed specifically for older peopleb‘Other’ activities reported included ‘funeral society’ (n = 37), political activities (6), welfare society (1) and unspecified (13)
Marsh et al. BMC Public Health (2018) 18:636 Page 8 of 14
Table
3Factorsassociated
with
socialparticipationam
ongelde
rsfro
mmulti-levelp
ropo
rtionalo
ddsregression
analyses:unadjusted(OR)
andadjusted
(AOR)
odds
ratio
s,95%
confiden
ceintervals(95%
CI)andprob
ability
values
(p-values)(n=1028)
Factors
Prop
ortio
nalO
dds
Uncon
strained
Effects
OR(95%
CI)
p-value
AOR(95%
CI)
p-value
Low
participation
Med
ium
Participation
High
Participation
AOR(95%
CI)
p-value
AOR(95%
CI)
p-value
AOR(95%
CI)
p-value
Gen
der(M
ale)
1.40(0.95,2.06)
0.090
2.17(1.43,3.29)
<0.001
4.45(2.71,7.32)
<0.001
Com
mun
ityType
Plantatio
n1.00
1.00
Village
18.9(12.5,28.5)
<0.001
7.5(3.6,15.5)
<0.001
Mixed
Com
mun
ity1.12
(0.68,1.86)
0.646
1.86
(0.86,4.06)
0.116
Age 60
–69years
1.00
1.00
70–79years
0.85
(0.61,1.18)
0.328
0.78
(0.55,1.12)
0.182
80or
more
0.38(0.21,0.69)
0.001
0.44
(0.22,0.86)
0.017
Ethn
icity
(Sinhala)
5.55
(3.23,9.57)
<0.001
3.95
(2.18,7.18)
<0.001
Maritalstatus(m
arried)
2.31
(1.69,3.16)
<0.001
1.49
(1.03,2.16)
0.033
Hou
seho
ldCom
positio
n
Livesalon
e1.00
1.00
Cou
plelivingtoge
ther
1.54
(1.04,2.29)
0.033
0.85
(0.41,1.74)
0.653
1–3othe
rmem
bersa
1.06
(0.79,1.44)
0.688
0.83
(0.43,1.57)
0.561
5or
moremem
bers
0.80
(0.59,1.07)
0.132
0.73
(0.38,1.38)
0.328
Yearsof
Scho
oling
Noform
alscho
oling
1.00
1.00
1–5
0.85
(0.63,1.14)
0.266
0.97
(0.64,1.47)
0.891
6–12
1.86
(1.36,2.55)
<0.001
1.02
(0.65,1.61)
0.930
Engage
men
tin
paid
work
2.40
(1.76,3.28)
<0.001
1.57
(1.11,2.21)
0.010
Requ
iring
help
with
ADL/sb
0.46
(0.31,0.74)
0.001
0.74
(0.46,1.22)
0.240
Con
cern
abou
tfalling
atsocial
even
tsc(quite
orvery
concerne
d)0.83
(0.59,1.16)
0.283
0.91
(0.61,1.35)
0.638
Vision
quality,self-rep
orted
(poo
ror
blind)
0.67
(0.50,0.89)
0.006
0.86
(0.63,1.17)
0.333
Dep
ressiond
0.71(0.52,0.98)
0.035
0.85
(0.60,1.20)
0.354
Health
Status
(High)
e1.63
(1.23,2.17)
0.001
1.47
(1.07,2.02)
0.017
Sociability
scoref
1.06(1.00,1.13)
0.052
1.03
(0.97,1.10)
0.354
Satisfactionwith
access
tofamily
andfrien
ds(High)
1.12
(0.80,1.56)
0.526
1.08
(0.74,1.56)
0.686
Mod
elcut-po
ints
-k 1
=4.1k 2
=5.4,
k 3=7.0
a Excluding
coup
leslivingtoge
ther
bBa
sedon
theKa
tzScale[32]
c Based
onthequ
estio
n,“How
concerne
dareyo
uab
outfalling
whe
ngo
ingou
tto
asocial
even
t?”(Falls
EfficacyScaleInternationa
l(FES–I))[33]
dBa
sedon
acut-offscoreof
≥3(GDS7)[34]
e Derived
from
respon
sesto
thequ
estio
n,“How
satisfie
dareyo
uwith
your
health?”(Qua
lityof
Life
Inde
x(EQLI))[35]
f Che
ekan
dBa
sssociab
ility
scale[36]
Marsh et al. BMC Public Health (2018) 18:636 Page 9 of 14

Marital status Being married was positively associatedwith social participation (AOR = 1.49, 95%CI = 1.03, 2.16).When asked in the FGDs how society reacts towardssomeone when their spouse dies, one Tamil widow said:“They just isolate us and will not let us come for goodthings and events in the village.”, but several recognisedthe loneliness of widowhood: “The most important thing iswe should not allow them to feel that they are alone. Wehave to console them and we have a responsibility to dothose things.” [Sinhala woman].
Age Compared to those aged 60–69 years, elders aged80 years and older were less likely to participate (AOR =0.44, 95%CI = 0.22–0.86). Those aged 70–79 years alsoshowed lower levels of participation (AOR = 0.78,95%CI = 0.55–1.12) but this difference was not statisti-cally significant (p = 0.182). There was no difference inparticipation between elders aged 70–79 and those aged80 years and older (Wald χ2(1) = 2.76, p = 0.097).
Employment and financial status Being employed waspositively associated with higher levels of participation(AOR = 1.57, 95%CI = 1.11–2.21). While financial statuswas not assessed in the multivariable analyses, duringthe FGDs many elders talked about their poverty, whichprevents them participating in their communities: “Andolder people don’t have enough money. Earlier they hada lot of money, but now they don’t have even a singlecent in their hands. Then they think about that and asksupport from children and they are very helpless if theirchildren don’t give money to them.” [Sinhala woman].
Health Being satisfied with one’s health (AOR = 1.47,95%CI = 1.07–2.02) was positively associated with higherlevels of participation. Poor health and disabilities, in-cluding vision impairment, were often mentioned by theelders in the FGDs as a cause of social isolation: “Some-times we can’t go to meet our friends because now wehave got some illnesses.” [Sinhala woman] and “In thenight we can’t go and meet them because of our visionproblems.” [Tamil man].
Inter-generational relationships Some elders men-tioned family conflict and lack of autonomy as factors thatrestrict their participation: “In some houses some familymembers do not allow elders to attend a meeting or go to atemple. They have compelled elders to stay at home. Butchildren go on trips and come back. When elders see thatthey get upset and it is also a kind of domestic violence.”[Sinhala woman].“We have more freedom than in our earl-ier life, but some elders don’t have freedom like us.” [Sin-hala man]. One older woman noticed a generation gap:“Sometimes there is a generation gap between youngstersand us. Sometimes their ideas do not match with our
ideas. That is a problem sometimes when we do social ac-tivities.” [Sinhala woman].
DiscussionDesigning interventions that aim to increase social par-ticipation among older people in low-income settings isa relatively new strategy in international public health.The number of studies of social participation amongolder people in high-income countries has increased ex-ponentially during the past decade, but we have foundfew from low or middle-income countries. Local studiessuch as this would be useful to government officials andcivil society in planning interventions to increase socialparticipation.There were several key findings. First, in general, el-
ders participated very little in organised activities butparticipation was higher in the rural villages than in theplantation communities. Second, context has a large in-fluence on patterns of social participation. Third, weidentified several characteristics of individuals associatedwith higher levels of participation: male gender, beingmarried, being employed, having good health, and beingin the ‘younger’ old age group.
Community level factors associated with socialparticipationClearly, participation in organised social activities de-pends on the availability of such activities. Tea planta-tion workers and their families live in poor and crowdedconditions. The Tamil elders today are second or thirdgeneration descendants of workers brought by the Brit-ish from India. The migration disrupted their traditionalvillage culture, which was based on family and commu-nal agriculture with many cooperative activities. Planta-tion residents lacked schools and other communitystructures and facilities, and were isolated from eachother and from nearby towns and villages, without trans-port. On the other hand, communal life has remainedimportant in the traditional Sinhala rural villages,centred around the temple and religious rituals. Thesedifferent histories help to explain the difference in avail-ability of organised opportunities for social interactionand the observed strong association of community typewith social participation, independent of ethnicity. Otherplantation communities in poor countries are likely tohave similarly limited opportunities for socialising andmay need different approaches to encourage and enablesocial contact among elders. We have found that whencommunity Elders’ Clubs are established many of the el-ders in both types of communities are keen to engage,especially in relation to activities that contribute to theircommunities [10].A recent meta-analysis of studies in high-income
countries identified contextual factors associated with
Marsh et al. BMC Public Health (2018) 18:636 Page 10 of 14

elders’ social participation outside the home includingfriendliness of neighbours, perceived social support,land-use diversity, street walkability, civil protection andtransportation services [25]. These factors are also likelyto play a role in low and middle-income countries; anenabling environment is important if elders with disabil-ities are to participate in their communities. There is agrowing movement for age-friendly communities andcities, but most documented experience is from high-income countries [39]. Elders themselves, with youngpeople and local government, can get together to maketheir community more ‘elder friendly’ [40]. In both cul-tural groups, religious activities were especially valuedby elders and this was also found in a Jamaican study,the authors noting the significant potential for faith-based organisations in promoting active ageing [41].
Individual characteristics associated with socialparticipationThe consequences of gender inequality and differentgender roles help to explain why older men take part inorganised activities more than older women in bothtypes of community. Although women have had higherstatus in Sinhala Buddhist culture than in many SouthAsian cultures [42], men tend to have greater autonomythan women, and greater access to money for social ac-tivities. In the Tamil culture women generally have lowerstatus than men, and this has been reinforced by planta-tion life and conditions [43]. In the FGDs, both men andwomen noted women’s heavy burden of domestic workas a reason for not being able to attend social activities.It is also possible that older women’s desire for socialcontact may be met more through informal activities,chatting with their friends while undertaking domestictasks such as shopping, caring for grandchildren, andfetching water or firewood.Studies in Sri Lanka [44], Pakistan [30], Australia [29],
the Netherlands [19] and the UK [45], have also foundthat older women tend to participate less than oldermen in organised activities, but more than men in infor-mal activities. However, the study in Jamaica found thatmen were more likely to visit and be visited by friends[41]. Studies investigating the link between social partici-pation and health and wellbeing in older people suggestthat men and women may also benefit differently [4, 46].It is important that gender is taken into account when
planning opportunities for social interaction, thatwomen are consulted and encouraged, and that arrange-ments are made for childcare. Further studies are neededof how to foster older women’s participation and the ex-tent to which informal socialising protects their healthand wellbeing, compared to taking part in organisedactivities.
Widowed elders may be less likely than married eldersto take part in social activities because they have moredomestic responsibilities, may have less money, be morereluctant to go out to organised activities on their own,or may fear societal disapproval. Tamil widows may beostracised and their lives viewed as being over [43]. APakistan study also found that being widowed was asso-ciated with less social participation [30] and married Ja-maican elders were more likely to attend organisedsocial activities, attributed to increased access to re-sources and larger social networks [41].That the minority of elders who undertake paid work
had greater rates of social participation is likely linked tobetter income, education, health, status, and contacts.Amongst those living with disabilities in Brazil, thoseemployed had higher social participation [31]. This islikely to be context dependent: a German study of olderpeople’s social participation found that full-time employ-ment was negatively associated with both organised andinformal social participation [47], but in the Netherlands,no association was found [19].Studies of older people from Jamaica and high-income
countries have found greater social participation amongthose with more education [19, 41]. Gesthuizen has sug-gested that schooling socialises children, influences theirnorms and values, and encourages them to become in-terested in communal and societal matters [48].It is difficult to speculate on the reasons why, in this
setting, the association between education and socialparticipation was attenuated when other factors werecontrolled for. Schools were being introduced to theplantation sector when these elders were children, andthe quality of education was comparatively poor. Theyounger elders were more likely than the older ones tohave attended school, and for more years. The generallylower education level amongst these plantation elderscompared to those in high-income countries could playa role in the observed findings.Other researchers have also found that ‘the oldest old’
are less likely to participate in organised social activities[30, 44]. Possible explanations include poverty, transportdifficulties, a need to be accompanied, ageism, with-drawal from social life, and lack of autonomy. However,among older people in Jamaica, Willie-Tyndale et al. didnot find an association with age [41]. This may be be-cause their measurement of social participation included‘visiting friends regularly and being regularly visited byfriends’ as well as ‘meetings of organised social groups’.It might be that the oldest old are more likely to have in-formal social contacts than to attend organised activities.The relationship between health status and participa-
tion is complex. Social participation contributes to betteroutcomes for health and well-being, but poor physical ormental health may restrict participation [19, 41, 49].
Marsh et al. BMC Public Health (2018) 18:636 Page 11 of 14

Health status is also on the causal pathway for other var-iables that may influence social participation, such aspoverty, depression, widowhood [50], and vision impair-ment. We investigated self-reported satisfaction withhealth (a predictor of morbidity and mortality [51, 52]),independence in ADLs, depression and self-reported vi-sion. These were all strongly associated with social par-ticipation, but the association was reduced afteradjustment for other variables. This might in part be be-cause health and disability act as intermediate variables.The reporting of multiple chronic conditions was nega-tively associated with frequency of social participationamong Pakistani elders [30].The positive associations for paid work and for marital
status were attenuated when data from proxy respon-dents were excluded. This likely reflects the relativelygreater importance of these factors in terms of participa-tion for elders in this group, who were more likely to beolder and need help with ADLs than those who an-swered for themselves.Studies of older people with impaired vision from
high-income countries have also found that reduced vi-sion restricts social interactions [53–56]. However, it isdifficult to compare the impact of vision loss in richercountries, where treatment is more available and fewlack access to glasses, with that in low-income countries[57]. That the negative association of poor vision withsocial participation was not significant when adjusted forother factors may be the result of over-adjustment [58].Prevalence of vision impairment increases with age andis higher among women [59]. The prevalence of visionimpairment in these communities is high, and there aremany barriers to access to affordable treatment. Thosewith poor vision may be less physically active, less ableto attend for health care, and less able to managechronic conditions. Increased social participation couldbe a benefit of improving equitable access to low-cost,cost-effective cataract surgery and spectacles [57]. Forthose whose vision loss cannot be treated, low vision ser-vices are also needed to facilitate their social contact andparticipation [60, 61].Poor health and disability are significant risk factors
for depression; conversely depression can result in illnessand disability [62–64]. We did not find significant asso-ciation between social participation and depression.There have been many studies of the links between men-tal health and social ties in older age in high-incomecountries [65, 66]. Most find that social support and so-cial participation are protective, especially for olderwomen [46], although it is difficult to identify the direc-tion of causality [65]. Some studies found that social par-ticipation may even increase the risk of depression forolder women, with the suggestion that a larger socialnetwork increases opportunities for stressful as well as
supportive relationships [66]. It is possible that our find-ing reflects effects in both directions.Several of the factors that influence social participation
in old age are likely to change for different generationsof elders, for example, as a result of changes to mortal-ity, fertility, migration, and the economy [19]. It is im-portant to consider cohort effects when planning socialinterventions for elders, and to monitor rates of socialparticipation at intervals. Smaller families, migration andgreater female participation in the workforce reduce op-portunities for social contact for elders; community or-ganisations could play an important role in addressingthis [10, 41, 67].
Strengths and limitationsStrengths of this study included the use of mixedmethods, the large, community-based probability sam-ple, and administration of the study by the local BVHAprogram team.This analysis also has several limitations. While very
few of the elders declined to participate, some on thesample list could not be found, and the additional ran-dom sample list was then used. Compared to 2011 cen-sus data for the district, our sample was somewhatyounger, with half as many in the 80+ age group andmore in the ‘young-old’ age group. This may be becausethe oldest age group often needed a home visit by thedata collectors, and some may have been missed. It mayalso be that census workers missed some of the workingyoung-old group. This means that our estimates for ratesof social participation may be high. Although the ques-tionnaire used validated scales, we cannot be sure howSri Lankan elders from a poor and isolated area under-stood the questions. Six per cent of the elders required afamily member to answer on their behalf; we cannot besure of the validity of their answers. We asked about fre-quency of participation in organised activities, but notthe extent or quality of social relationships. Comparisonwith other studies is complicated by different definitionsof ‘social participation’, and by varied patterns of socialsupport in different cultural contexts.
ConclusionsThe evidence that social participation contributes tohealth and wellbeing through a range of pathways isstrong. Understanding the factors that are associatedwith social participation is important to ensure a greaterproportion of populations can benefit. The WHO WorldReport on Ageing and Health emphasises that publichealth policy must serve to break down the many bar-riers to the social participation of older people and pro-vides many relevant recommendations [1]. Older peoplethemselves can contribute to overcoming the barriers toparticipation experienced by themselves and their peers.
Marsh et al. BMC Public Health (2018) 18:636 Page 12 of 14

We found that those most likely to benefit fromgreater social contact are those most likely to face bar-riers: older women, the oldest old, the poorest and thosein poor health. Our findings emphasise that the factorsassociated with social participation are interrelated andvary in different contexts. They show the importance ofgathering information locally when planning to enableand encourage older people to participate socially.
Additional file
Additional file 1: English version of the Baseline Questionnaire used forthe quantitative component of the study. (PDF 443 kb)
AbbreviationsADL: Activity of Daily Living; AOR: Adjusted Odds Ratio; BVHA: Better Visionand Healthy Ageing; EPY: Events per Year; FGD: Focus Group Discussion;GDS-7: 7-item Geriatric Depression Scale; gllamm: Generalised linear latentand mixed modelling; GND: Grama Niladhari (local government) Divisions;ICC: Intraclass correlations; IQR: Interquartile Range; MMSE: Mini-Mental Stateexamination; OR: Odds Ratio; QLI-YES: Quality of Life Instrument for theYoung Elderly in Sri Lanka
AcknowledgementsWe would like to thank the elders of Walapane and Nuwara Eliya whoparticipated in the survey and focus group discussions, and the ProgramOfficers and management of Program partners: PALM Foundation,Sarvodaya, Plantation Human Development Trust, and Berendina. The BetterVision Healthy Ageing Program Elders Advisory Group and the TechnicalAdvisory Group gave helpful advice in planning the study. Dr. Mariam Tokhicontributed to conceptualizing the analysis.
FundingWe are grateful to The Fred Hollows Foundation for funding support. TheFred Hollows Foundation did not have a role in the design, collection,analysis, and interpretation of data; in the writing of the manuscript; or inthe decision to submit the manuscript for publication. The authors gratefullyacknowledge the contribution to this work of the Victorian OperationalInfrastructure Support Program received by the Burnet Institute.
Availability of data and materialsRequests for access to the study data can be made from the correspondingauthor, and will be considered for approval by the Program PublicationsCoordinating Committee.
Authors’ contributionsWH conceptualised and designed the study with input from RS, CA, PA, SL,GJ, and KD. WH and RS led the process of data collection. CM and PAconceived and undertook the data analysis with input from WH and SL. Themanuscript was drafted by CM, WH and PA and critically reviewed by SL, KD,RS, CA and GJ. All authors and the Program Publications CoordinatingCommittee read and approved the final manuscript.
Ethics approval and consent to participateSigned informed consent was obtained; participants unable to write gavetheir thumbprint, and a witness signed to confirm that the elder understoodthe study. The study received approval from the Ethics Review Committee ofthe University of Peradeniya, Sri Lanka, and the Alfred Hospital ResearchEthics Committee in Melbourne, Australia.
Competing interestsThe authors declare that they have no competing interests.
Publisher’s NoteSpringer Nature remains neutral with regard to jurisdictional claims inpublished maps and institutional affiliations.
Author details1Burnet Institute, Melbourne, Australia. 2Department of Epidemiology andPreventive Medicine, Monash University, Melbourne, Australia. 3Judith LumleyCentre, La Trobe University, Melbourne, Australia. 4International Centre forReproductive Health, Department of Obstetrics and Gynecology, GhentUniversity, Ghent, Belgium. 5Central Province Health Department, Kandy, SriLanka. 6PALM Foundation, Nuwara Eliya, Sri Lanka.
Received: 10 May 2017 Accepted: 19 April 2018
References1. World Health Organization. World report on ageing and health. Geneva:
WHO; 2015.2. United Nations DoEaSA, Population division: world population prospects:
the 2015 revision. In: Key Findings and Advance Tables. New York; 2015.3. Kaluthantiri KDMS. Ageing and the changing role of the family in Sri Lanka.
PhD. University of Adelaide; 2014.4. House JS, Landis KR, Umberson D. Social relationships and health. Science.
1988;241(4865):540–5.5. Seeman TE. Health promoting effects of friends and family on health
outcomes in older adults. Am J Health Promot. 2000;14(6):362–70.6. Bennett KM. Social engagement as a longitudinal predictor of objective and
subjective health. Eur J Ageing. 2005;2(1):48–55.7. Holt-Lunstad J, Smith TB, Layton JB. Social relationships and mortality risk: a
meta-analytic review. PLoS Med. 2010;7(7):e1000316.8. Newall N, McArthur J, Menec VH. A longitudinal examination of social
participation, loneliness, and use of physician and hospital services. Journalof aging and health. 2015;27(3):500–18.
9. Cao J, Rammohan A. Social capital and healthy ageing in Indonesia. BMCPublic Health. 2016;16(1):631.
10. Holmes WR, Joseph J. Social participation and healthy ageing: a neglected,significant protective factor for chronic non communicable conditions. GlobHealth. 2011;7(1):43.
11. Grant N, Hamer M, Steptoe A. Social isolation and stress-related cardiovascular,lipid, and cortisol responses. Ann Behav Med. 2009;37(1):29–37.
12. McEwen BS, Gianaros PJ. Central role of the brain in stress and adaptation:links to socioeconomic status, health, and disease. Ann N Y Acad Sci. 2010;1186(1):190–222.
13. Cacioppo JT, Hawkley LC, Ernst JM, Burleson M, Berntson GG, Nouriani B,Spiegel D. Loneliness within a nomological net: an evolutionary perspective.J Res Pers. 2006;40(6):1054–85.
14. Uchino BN, Cacioppo JT, Kiecolt-Glaser JK. The relationship between socialsupport and physiological processes: a review with emphasis on underlyingmechanisms and implications for health. Psychol Bull. 1996;119(3):488.
15. Gutkowska J, Jankowski M. Oxytocin revisited: its role in cardiovascularregulation. J Neuroendocrinol. 2012;24(4):599–608.
16. Portillo MC, Regaira E, Pumar-Méndez MJ, Mujika A, Vassilev I, Rogers A,Wensing M, Foss C, Knutsen IR, Todorova E. Voluntary organizations andcommunity groups as new partners in diabetes self-management andeducation: a critical interpretative synthesis. The Diabetes Educator. 2015;41(5):550–68.
17. Navarro V. Commentary: is capital the solution or the problem? Int JEpidemiol. 2004;33(4):672–4.
18. Brodie E, Cowling E, Nissen N, Paine AE, Jochum V, Warburton D.Understanding participation: a literature review. National Council forVoluntary Organisations. 2009;
19. Van Groenou MB, Deeg DJH. Formal and informal social participation of the‘young-old’ in the Netherlands in 1992 and 2002. Ageing & Society. 2010;30(03):445–65.
20. World Health Organization: International classification of functioning,disability and health (ICF). Geneva: WHO; 2001.
21. Van Brakel WH, Anderson AM, Mutatkar R, Bakirtzief Z, Nicholls PG, Raju M,Das-Pattanayak RK. The participation scale: measuring a key concept inpublic health. Disabil Rehabil. 2006;28(4):193–203.
22. Brütt AL, Schulz H, Andreas S. Psychometric properties of an instrument tomeasure activities and participation according to the ICF concept inpatients with mental disorders. Disabil Rehabil. 2015;37(3):259–67.
23. Fang J, Power M, Lin Y, Zhang J, Hao Y, Chatterji S. Development of shortversions for the WHOQOL-OLD module. The Gerontologist. 2011;52(1):66–78.
Marsh et al. BMC Public Health (2018) 18:636 Page 13 of 14
24. Thiyagarajan J A, Prince M, Webber M. Social support network typologiesand health outcomes of older people in low and middle income countries–a 10/66 dementia research group population-based study. InternationalReview of Psychiatry. 2014;26(4):476–85.
25. Vaughan M, LaValley MP, AlHeresh R, Keysor JJ. Which features of theenvironment impact community participation of older adults? A systematicreview and meta-analysis. J aging health. 2016;28(6):957–78.
26. Lindstrom M, Merlo J, Ostergren P. Individual and neighbourhooddeterminants of social participation and social capital: a multilevel analysisof the city of Malmo, Sweden. Soc Sci Med. 2002;54(12):1779–91.
27. Department of Census & Statistics, Ministry of Policy Planning and EconomicAffairs. Census of population and housing. Sri Lanka: Colombo; 2012.
28. Jayawardena P: Eradicating child malnutrition in Sri Lanka, looking beyondhealth. In: Policy Insights. Colombo: institute of Policy Studies; 2011.
29. Baum FE, Bush RA, Modra CC, Murray CJ, Cox EM, Alexander KM, Potter RC.Epidemiology of participation: an Australian community study. J EpidemiolCommunity Health. 2000;54(6):414–23.
30. Ahmad K, Hafeez M. Factors affecting social participation of elderly people:a study in Lahore. J Anim Plant Sci. 2011;21(2):283e289.
31. Silva F, Sampaio RF, Ferreira FR, Camargos VP, Neves JA. Influence ofcontext in social participation of people with disabilities in Brazil. RevPanam Salud Publica. 2013;34(4):250–6.
32. Katz S. Assessing self-maintenance: activities of daily living, mobility, andinstrumental activities of daily living. J Am Geriatr Soc. 1983;31(12):721–7.
33. Delbaere K, Close JC, Mikolaizak AS, Sachdev PS, Brodaty H, Lord SR. Thefalls efficacy scale international (FES-I). A comprehensive longitudinalvalidation study. Age Ageing. 2010;39(2):210–6.
34. Broekman BF, Niti M, Nyunt MSZ, Ko SM, Kumar R, Ng TP. Validation of abrief seven-item response bias-free geriatric depression scale. Am J GeriatrPsychiatry. 2011;19(6):589–96.
35. de Silva SHP, Jayasuriya AR, Rajapaksa LC, de Silva AP, Barraclough S.Development and validation of a measure of quality of life for the young elderlyin Sri Lanka. Asia Pacific Journal of Public Health. 2016;28(1_suppl):115S–25S.
36. Cheek JM, Buss AH. Shyness and sociability. J Pers Soc Psychol. 1981;41(2):330.37. Rabe-Hesketh S, Pickles A, Taylor C. Generalized linear latent and mixed
models. Stata Tech Bull. 2000;53:47–57.38. Brant R. Assessing proportionality in the proportional odds model for
ordinal logistic regression. Biometrics. 1990:1171–8.39. Alley D, Liebig P, Pynoos J, Banerjee T, Choi IH. Creating elder-friendly
communities: preparations for an aging society. J Gerontol Soc Work. 2007;49(1–2):1–18.
40. World Health Organization: Global age-friendly cities: a guide. Geneva:WHO; 2007.
41. Willie-Tyndale D, Holder-Nevins D, Mitchell-Fearon K, James K, Laws H,Waldron NK, Eldemire-Shearer D. Participation in social activities and theassociation with socio-demographic and health-related factors amongcommunity-dwelling older adults in Jamaica. Journal of cross-culturalgerontology. 2016;31(4):427–47.
42. Herath SMK: Economic liberation and the changing role of Sinhalesewomen in Sri Lanka. Doctor of Philosophy in Sociology. Waterloo, Canada:The University of Waterloo; 1997.
43. Philips A. Rethinking culture and development: marriage and genderamong the tea plantation workers in Sri Lanka. Gend Dev. 2003;11(2):20–9.
44. Østbye T, Malhotra R, Chan A. Thirteen dimensions of health in elderly srilankans: results from a national Sri Lanka aging survey. J Am Geriatr Soc.2009;57(8):1376–87.
45. Wilkie R, Peat G, Thomas E, Croft P. The prevalence of person-perceivedparticipation restriction in community-dwelling older adults. Qual Life Res.2006;15(9):1471–9.
46. Takagi D, Kondo K, Kawachi I. Social participation and mental health:moderating effects of gender, social role and rurality. BMC Public Health.2013;13(1):1.
47. Klumb PL, Baltes MM. Time use of old and very old Berliners: productiveand consumptive activities as functions of resources. J Gerontol Ser BPsychol Sci Soc Sci. 1999;54(5):S271–8.
48. Gesthuizen M. How socially committed are the Dutch low-educated?Historical trends, life-course changes, and two explanations for educationaldifferences. Eur Sociol Rev. 2006;22(1):91–105.
49. Anaby D, Miller WC, Eng JJ, Jarus T, Noreau L, Group PR. Can personal andenvironmental factors explain participation of older adults? Disabil Rehabil.2009;31(15):1275–82.
50. Stahl ST, Schulz R. Changes in routine health behaviors following late-lifebereavement: a systematic review. J Behav Med. 2014;37(4):736–55.
51. Zhao J, Yiengprugsawan V, S-a S, Kelly M, Bain C, Sleigh A. Self-reportedhealth and subsequent mortality: an analysis of 767 deaths from a largeThai cohort study. BMC Public Health. 2014;14(1):860.
52. Latham K, Peek CW: Self-rated health and morbidity onset among latemidlife US adults. J Gerontology Series B: Psychological Sciences and SocialSciences 2012:gbs104.
53. Desrosiers J, Wanet-Defalque M-C, Témisjian K, Gresset J, Dubois M-F,Renaud J, Vincent C, Rousseau J, Carignan M, Overbury O. Participation indaily activities and social roles of older adults with visual impairment.Disabil Rehabil. 2009;31(15):1227–34.
54. Alma MA, Van der Mei SF, Groothoff JW, Suurmeijer TP. Determinants ofsocial participation of visually impaired older adults. Qual Life Res. 2012;21(1):87–97.
55. Lamoureux EL, Pallant JF, Pesudovs K, Rees G, Hassell JB, Keeffe JE. Theeffectiveness of low-vision rehabilitation on participation in daily living andquality of life. Invest Ophthalmol Vis Sci. 2007;48(4):1476–82.
56. Cimarolli VR, Boerner K, Reinhardt JP, Horowitz A, Wahl H-W, Schilling O,Brennan-Ing M. A population study of correlates of social participation inolder adults with age-related vision loss. Clin Rehabil. 2017;31(1):115–25.
57. Holmes W, Shajehan R, Kitnasamy S, Abeywickrama C, Arsath Y, Gnanaraj F,Inbaraj S, Jayakody G, Durrant K, Luchters S. Impact of vision impairmentand self-reported barriers to vision care: the views of elders in Nuwara Eliyadistrict, Sri Lanka. Global public health. 2016:1–14.
58. Schisterman EF, Cole SR, Platt RW. Overadjustment bias and unnecessaryadjustment in epidemiologic studies. Epidemiology (Cambridge, Mass).2009;20(4):488.
59. Pascolini D, Mariotti SP: Global estimates of visual impairment: 2010. British JOphthalmology 2011:bjophthalmol-2011-300539.
60. Lamoureux EL, Hassell JB, Keeffe JE. The determinants of participation inactivities of daily living in people with impaired vision. Am J Ophthalmol.2004;137(2):265–70.
61. Berger S, McAteer J, Schreier K, Kaldenberg J. Occupational therapyinterventions to improve leisure and social participation for older adultswith low vision: a systematic review. Am J Occup Ther. 2013;67(3):303–11.
62. Suttajit S, Punpuing S, Jirapramukpitak T, Tangchonlatip K,Darawuttimaprakorn N, Stewart R, Dewey M, Prince M, Abas MA.Impairment, disability, social support and depression among older parentsin rural Thailand. Psychol Med. 2010;40(10):1711–21.
63. Jang Y, Haley WE, Small BJ, Mortimer JA. The role of mastery and socialresources in the associations between disability and depression in later life.The Gerontologist. 2002;42(6):807–13.
64. Chen R, Wei L, Hu Z, Qin X, Copeland JR, Hemingway H. Depression in olderpeople in rural China. Arch Intern Med. 2005;165(17):2019–25.
65. Kawachi I, Berkman LF. Social ties and mental health. J Urban health. 2001;78(3):458–67.
66. Fuller-Iglesias HR. Social ties and psychological well-being in late life: themediating role of relationship satisfaction. Aging Ment Health. 2015;19(12):1103–12.
67. HelpAge International. Older people in community development: the roleof older people’s associations in enhancing local development. Chiang Mai:HelpAge International; 2009.
Marsh et al. BMC Public Health (2018) 18:636 Page 14 of 14