Factors Affecting Teacher Satisfaction in an Urban … · Factors Affecting Teacher Satisfaction in...
103
Factors Affecting Teacher Satisfaction in an Urban School District by Michael A. Halpert A Dissertation Presented in Partial Fulfillment of the Requirements for the Degree Doctor of Education Approved February 2011 by the Graduate Supervisory Committee: Dee Ann Spencer, Chair Nicholas Appleton Donna Macey ARIZONA STATE UNIVERSITY May 2011
Transcript of Factors Affecting Teacher Satisfaction in an Urban … · Factors Affecting Teacher Satisfaction in...

Factors Affecting Teacher Satisfaction in an
Urban School District
by
Michael A. Halpert
A Dissertation Presented in Partial Fulfillment of the Requirements for the Degree
Doctor of Education
Approved February 2011 by the Graduate Supervisory Committee:
Dee Ann Spencer, Chair
Nicholas Appleton Donna Macey
ARIZONA STATE UNIVERSITY
May 2011

ii
ABSTRACT
The purpose of this study was to distinguish factors that influence the
satisfaction levels of teachers in urban school districts. This work also
distinguished factors that directly impacted teachers’ level of satisfaction towards
their work and their attitude towards the administration of their schools.
Forty-one teachers from two kindergarten through eighth grade schools in
the southwest region of the United States were given a modified version of the
2007/08 Schools and Staffing Survey, a federally recognized survey on the
satisfaction levels of teachers in America, combined with a select number of
questions created by the researcher in this study to address the research questions
of this study. Data were collected and analyzed through Survey Monkey, an
online data portal, and imported into SPSS for data analysis. Both descriptive and
inferential statistics were compiled to provide answers to the research questions
established for this study.
Results from this study indicated that although a majority of teachers
sampled were satisfied with their teaching positions (78%), kindergarten through
fourth grade teachers were more satisfied than teachers in the older grades. For
the whole group, salary was the most influential factor; however, the teachers
with 11 to 15 years of experience were the only ones who chose salary as their
primary choice to increase their satisfaction. This study found that the levels of
satisfaction per subgroup (teachers’ years of experience, level of education,
gender, age, type of certification, and grade level) were different than the group

iii
needs as a whole. This study revealed that the needs of the whole group and the
needs of the subgroups can differ, consequently individual differences of the staff
need to be taken into consideration. To view the staff as a whole may discredit the
needs of the individual. Even though data indicated that a significant number of
teachers felt supported by their administration, this study revealed the need for
administrative staff to address specific issues of subgroups in their schools.

iv
To my family, friends, and colleagues Who helped me reach my goal in completing this dissertation
And begin the next chapter of my life.

v
ACKNOWLEDGEMENTS
There are many people to thank in a task such as completing a terminal
degree. I would like to thank Dr. Dee Spencer who not only assisted me in finding
the voice to write this work, but also demonstrated pure commitment to me and
the work I have accomplished. She is highly dedicated and a person who insists
the best from the people she guides through this process. Dr. Appleton, thank you,
for imparting your knowledge in a way that reaches beyond the classroom. Dr.
Macey, you are a leader who enables others to develop with trust and confidence.
I would like to thank my wife, who has been there holding down many
fronts as I stole time to achieve this significant goal in my life. She has endured,
she has laughed, and I am sure she has cried, all in the attempt to put me in a
place to give the best I could to this seemingly forever task. I also want to thank
the people who have been there for me throughout all my endeavors in life: my
mother, father, sister, grandmother, and family. I also want to thank Eli and our
“player to be named later” as you provided me with inspiration to never give up.
To my friends and colleagues, you cannot know how your contributions were
greatly valued and appreciated. To all—thank you, thank you, thank you.

vi
TABLE OF CONTENTS
Page LIST OF TABLES ...................................................................................................x LIST OF FIGURES ............................................................................................... xi CHAPTER 1 INTRODUCTION .......................................................................................1 Growing to Become an Effective Teacher .............................................5 Teacher Satisfaction and Leadership .....................................................6 Purpose of This Study ............................................................................6 Research Questions ................................................................................7 Research Methods ..................................................................................7 Definition of Terms................................................................................8 Assumptions, Delimitations, and Limitations of the Study ...................8 Significance of the Study .....................................................................10 Summary of the Chapters.....................................................................11 2 REVIEW OF THE LITERATURE ...........................................................12 Historical and Societal Influences on Teacher Satisfaction .................12 External Influences on Teacher Satisfaction ........................................17 Intrinsic Factors on Teacher Satisfaction .............................................19 Future Possibilities Based on Research ...............................................33
vii
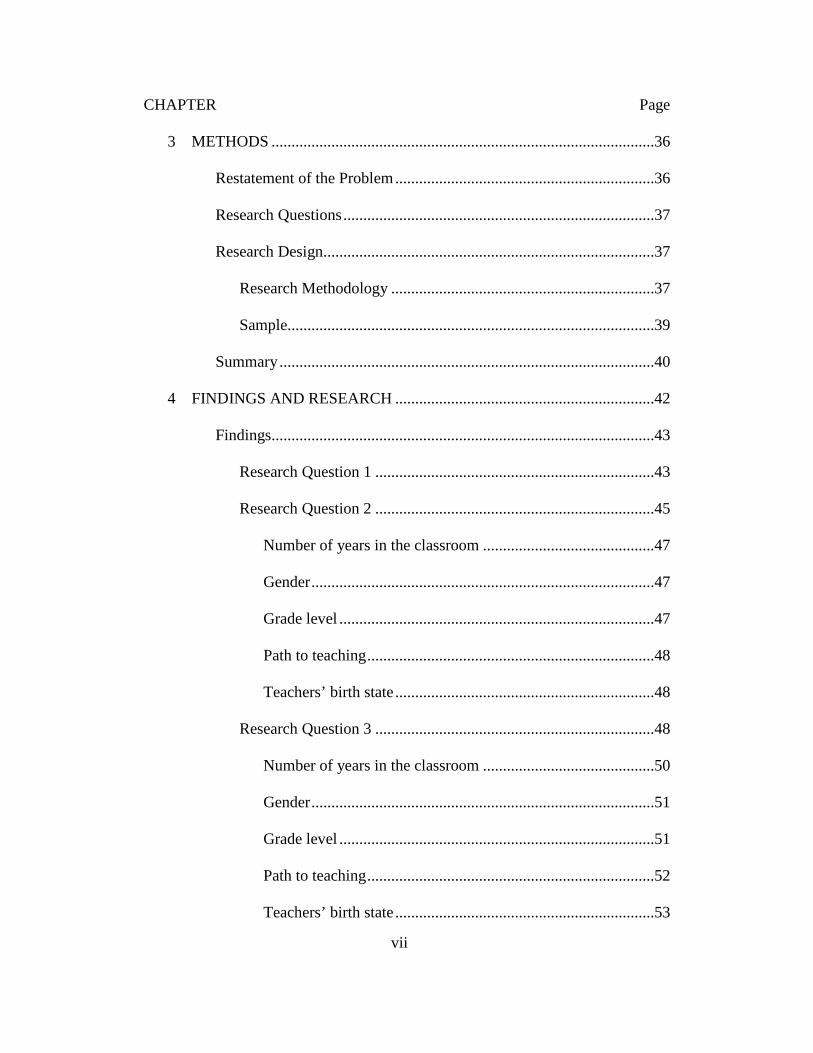
CHAPTER Page 3 METHODS ................................................................................................36 Restatement of the Problem .................................................................36 Research Questions ..............................................................................37 Research Design...................................................................................37 Research Methodology ..................................................................37 Sample............................................................................................39 Summary ..............................................................................................40 4 FINDINGS AND RESEARCH .................................................................42 Findings................................................................................................43 Research Question 1 ......................................................................43 Research Question 2 ......................................................................45 Number of years in the classroom ...........................................47 Gender ......................................................................................47 Grade level ...............................................................................47 Path to teaching ........................................................................48 Teachers’ birth state .................................................................48 Research Question 3 ......................................................................48 Number of years in the classroom ...........................................50 Gender ......................................................................................51 Grade level ...............................................................................51 Path to teaching ........................................................................52 Teachers’ birth state .................................................................53

viii
CHAPTER Page Research Question 4 ......................................................................54 Number of years in the classroom ...........................................54 Gender ......................................................................................56 Grade level ...............................................................................57 Path to teaching ........................................................................58 Teachers’ birth state .................................................................59 Satisfied teachers versus dissatisfied teachers .........................59 Other analysis conducted .........................................................60 Research Question 5 ......................................................................62 Summary ..............................................................................................64 5 SUMMARY, CONCLUSIONS, AND RECOMMENDATIONS.............66 Summary ..............................................................................................68 Discussion of Findings .........................................................................69 Conclusions ..........................................................................................75 Recommendations ................................................................................77 REFERENCES ......................................................................................................79 APPENDIX A SCHOOLS AND STAFFING SURVEY ..................................................83 B EMAIL TO PARTICIPANTS ...................................................................91

ix
LIST OF TABLES
Table Page
1. Percentage of Teachers by Grades .............................................................40
2. Percentage of Teachers Satisfied by Subgroups ........................................46
3. Variables That Would Increase Participants’ Level of Satisfaction ..........49
4. First-Choice Factors That Would Increase Satisfaction Levels the Most According to the Number of Years in the Classroom .................51
5. Administrative Support and Number of Years Teaching ..........................55
6. Administrative Support and Gender ..........................................................56
7. Administrative Support and Grade Taught ................................................57
8. Administrative Support and Path to Certification ......................................58
9. Administrative Support and Teacher’s Birth State ....................................59
10. Mean, Standard Deviation, and Sample Size .............................................61
11. Factors That Influence Satisfaction Levels and Satisfaction Level of Teachers .................................................................................63

x
LIST OF FIGURES
Figure Page
1. Satisfaction with being a teacher ...............................................................44

1
CHAPTER 1
INTRODUCTION
“As a result of high turnover, high-need urban and rural schools are
frequently staffed with inequitable concentrations of under-prepared,
inexperienced teachers who are left to labor on their own to meet the needs of
their students” (National Commission on Teaching and America’s Future, 2009,
p. 9). This research is focused on identifying factors that have led to high rates of
teacher turnover resulting in significant staffing deficits in the teaching force and
teachers’ levels of satisfaction towards their profession. As research by Edey and
Huston (2004) indicated, teachers who had lower levels of satisfaction were more
likely to leave their school in the first three years, as opposed to teachers who had
higher levels of satisfaction and were more likely to remain in the school in the
following three years. Understanding the needs of teachers while they are still in
the classroom prevents another generation of teachers from leaving our nation’s
schools, a loss so very difficult to reverse.
Teachers at the beginning of their careers and teachers in urban schools
leave teaching at a higher rate than more experienced teachers. The consequences
of teachers leaving the field inevitably follows with teachers who lack the
experience of the teachers they are replacing. Consequences are also inevitable in
the loss of revenue based on hiring, training, and retaining of new teachers.
Schools must continue to rebuild their staff without experienced and effective
veteran teachers who are the ones most needed in lower performing schools. As
Futernick (2007, p. 53) stated, “It has now become increasingly apparent that

2
teachers with no pedagogical training and scant subject knowledge cannot
accomplish what a fully credentialed, 10-year veteran teacher can accomplish.”
Teachers enter the profession for a variety of reasons. Reasons can range from
having a teacher who contributed to their development, to a person having an
affinity for the content, to enjoying the satisfaction of working with children.
Spencer (1997) wrote,
The single most powerful recruiter of teachers are schools themselves.
People who have had positive experiences in school can prolong that
experience by becoming teachers. Observing teachers for many years from
a student perspective serve as a basis for making a career decision to
teach. (p. 814)
Recruiting teachers into the field is one component of a strong teacher workforce,
but what occurs upon entry is another component.
The high rate of teacher attrition and lack of retention has and continues to
hurt the educational system. Schools and districts, especially those in urban and
poverty areas, recruit, train, and lose teachers as quickly as they enter the field.
This constant counterproductive cycle is not only costing more than money to
retrain teachers, it is also impacting the achievement of students. The National
Commission on Teaching and America’s Future (National Commission on
Teaching and America’s Fugure, 2009) has estimated that the national cost of
public school teacher turnover could be over $7.3 billion a year. These data
indicate that recruiting is one aspect of a positive workforce, but retaining staff is
another aspect just as vital. Teachers are leaving for specific reasons and to retain

3
these teachers, there needs to be a body of knowledge that seeks to understand
their exodus. There is a responsibility on behalf of the field of education to
discover why teachers are leaving and to learn what can be done to address their
needs.
Richard Ingersoll, when asked about his interest and the reason he
dedicated much of his research to teacher job satisfaction, referred to addressing
the challenge of teacher attrition: “I had a thousand questions in my head”—
spawned a body of research focused on teacher turnover, particularly what is
behind it and how to get ahead of it (Dillon, 2009, p. 1). The high attrition rate is a
symptom of other issues in the field of education. To understand teacher attrition,
the causes of the problem have to be understood. Past research has indicated a
connection between the satisfaction level of teachers and their tenure in the field.
As a result of teachers staying in the classroom, the level of skill teachers acquire
as they gain more experience will develop; student achievement will rise; and the
resources lost to recruitment, materials, and other expenditures will be saved and
can be reallocated to other areas that can directly impact student achievement.
Embedded in the educational system are many influences that impact
teachers. Some of these influences are the result of state and federal policy, some
are dependent on the school administration, and some are dependent on
individuals and how they interact within their school environment. Many of the
factors that teachers encounter, such as educational funding, political views on
education, district level influence, and administrative impact, are out of their
control, having minimal ability to change these factors.

4
In contrast to factors that cannot be controlled for teachers, there are those
factors that can be controlled. Those factors include the educational environment,
the ways teachers are treated in their work, and how their needs are met by the
school and district administration. School administrators are in positions to
establish work environments that increase teacher satisfaction towards their jobs
(Rinehart & Short, 1993). These areas are where research needs to be focused..
When the focus is centered on the issues that lead teachers to become dissatisfied
and leave the school or field, there will be clear direction to address their needs.
Dr. Ken Futernick wrote in his work, A Possible Dream: Retaining California
Teachers so all Students Can Learn (2007), “The very process of asking teachers
about their schools and soliciting their help in making these schools better places
to work is not just a step toward solving the problem, it is an important part of the
solution” (p. xii).
The needs of teachers vary and what will increase one teacher’s level of
satisfaction may not be the same for another. To truly understand the needs of
teachers, they have to be asked. Futernick (2007) wrote that teachers need to be
asked what they need and to express their opinions before they decide to leave.
Relying on exit interviews to determine the needs of teachers is already past the
point of being able to meet their needs.
Wanting to be heard is a need teachers have expressed throughout the
history of teaching. In the most recent work done in The American Teacher:
Collaborating for Student Success by MetLife (2010), 30% of the teachers
surveyed responded positively to the statement: “Thinking about the current

5
debate on education, teachers’ voices in general have been adequately heard.”
Researchers in the MetLife study also indicated that relatively there has been no
change in the way teachers respond to being heard since a previous study they
conducted in 1984. The MetLife survey also indicated that 59% of the teachers
surveyed were very satisfied with their work but 20% of the teachers surveyed
were fairly likely to move to another career in the next five years. Not feeling as
though they are being heard may result in a lower level of satisfaction teachers
feel towards their jobs and may lead them to look for work in other fields.
Growing to Become an Effective Teacher
Developing into an effective teacher is something which takes time. One’s
skills develop from reflection, coaching, and professional development. For
growth to occur, the individual teacher has to be dedicated to staying with their
work over a period of time. Teachers need assistance in developing and applying
their (a) talents and skills in their roles and norms of a school, (b) in-depth
knowledge and skills in instruction, and (c) continual reflection on their
interactions with their students. Teachers who are satisfied with their school and
environment stay in their positions and become more and more successful each
year they teach. Increased job satisfaction may enhance teacher performance,
quality of work life, organizational effectiveness, and student performance
(Rinehart & Short, 1993). When this happens consistently, student learning will
greatly increase. When teachers are leaving within their first five years of
teaching, the time needed to develop into an effective teacher cannot develop.
Finding common patterns that generalize to other schools or educational

6
institutions, the teaching workforce as a whole will benefit. The consequences of
finding the common patterns that increase a teacher’s level of satisfaction could
lead to a longer tenure in a school or district.
In the contemporary system of education there is a great reliance on
funding, which goes toward capital, maintenance, and operations as well as
teacher salaries. There is also a great deal of money that is spent not only trying to
retain current teachers, but also recruiting teachers to replace retired teachers, or
teachers who decide to no longer be a part of the educational system. As funding
in the educational setting decreases, there will be less room to rely on salary and
other factors that past research has indicated as influential on teachers’ level of
satisfaction. Education could do great things with funds that are used to replace
dissatisfied teachers.
Teacher Satisfaction and Leadership
As funding decreases greater attention will need to be placed on meeting
intrinsic needs of staff members to maintain an effective teacher workforce.
Because administrators have the ability to influence the situations and experiences
teachers have in their classrooms, their leadership has been found to be an
effective factor influlencing the level of satisfaction that teachers hold towards
their jobs..
Purpose of This Study
The purpose of this study was to identify factors that distinguish the
satisfaction levels of teachers in urban school districts. This work distinguised

7
factors that directly impacted teachers’ level of satisfaction towards their work
and their attitude towards the administration of their schools.
Research Questions
Research Question 1: What is the current level of satisfaction of the
participants in this study?
Research Question 2: Do teachers of specific subgroups (years of
experience, level of education, gender, age, type of certification, grade level)
report the same or differing levels of satisfaction than members of other
subgroups?
Research Question 3: Do teachers of specific subgroups (years of
experience, level of education, gender, age, type of certification, grade level)
report the same or differing factors that would directly increase their level of
satisfaction towards their teaching?
Research Question 4: How do teachers in this study view their
administration?
Research Question 5: Do satisfied teachers indicate the same needs as
dissatisfied teachers?
Research Methods
Teachers in two kindergarten through eighth grade schools in the
southwest region of the United States participated in the study by answering
survey questions on an online data portal (Survey Monkey). The survey questions
were selected from the 2007/08 School and Staffing Survey and combined with a
select number of questions created by the researcher in this study to address the

8
research questions of this study. The data collected through Survey Monkey and
imported into SPSS were analyzed. Descriptive and inferential statistics were
completed to provide answers to the research questions established for this study.
Definition of Terms
Teacher satisfaction: The overall collective belief of teachers based on the
culmination of all previous experiences in the educational setting, positive and
negative, toward their position as a teacher.
Subgroup: A group of teachers who are a part of a smaller cohort by
specific characteristics they hold. For this study, the subgroups were teachers’
years of experience, level of education, gender, age, type of certification, and
grade level (kindergarten through the 8th grade).
Assumptions, Delimitations, and Limitations of the Study
The underlying assumptions of this study were that all teachers are
different and subsequently have different experiences and opinions. No general
understanding of a group of people can replace the knowledge and information
that can be gained through more in-depth, specific questioning of the individuals
within the group. Consistent with previous research, the predictors that lead to
either a greater sense of satisfaction or a decrease in dissatisfaction for one group
of teachers does not necessarily generalize to others. Although the concept of
satisfaction can be quite subjective, the perception of the specific teacher
responding to the survey was the vital information for this study. This study did
not seek to determine the differences in responses from one point in the year to

9
another, but is representative of a snapshot of the teachers’ level of satisfaction at
the time they were surveyed.
Previous research had to be filtered through the contemporary world
occurring at the time of the study. In the case of this particular research,
participants’ responses were collected at a time of fiscal abundance compared to
the state education was experiencing during the analysis portion of this research.
Not more than six months after data were collected for this study, an economic
recession occurred in the United States as well as globally. As a result of major
cutbacks in the educational system federally and locally, many teachers faced
RIFS, significant cutbacks, and a change in presidential administration. Many
teachers have become “locked” in their schools as there are not an abundant
number of jobs to seek in other industries. Being locked equates to a closed job
market and ineffective teachers or teachers who are not satisfied with their work,
not having the ability to seek alternate jobs in other industries.
Because of the diversity of the teachers in this specific southwest region of
the United States, the results of this study may or may not be able to be compared
to other studies of the same nature. The state in which this study took place is one
which is synonymous for individuals who transplant their lives from many other
parts of the country. Because of the large number of transplants, there is a high
level of diversity among the individuals who live within the state. Many of these
individuals travel great lengths to find teaching positions, and as a result the
teachers bring with them varying backgrounds and different sets of beliefs. These
sets of beliefs transfer into the classroom and make up its own subculture. This
10
diverse population of teachers bring with them varying sets of needs into their
teaching positions.
Significance of the Study
Past research indicates there are common characteristics and needs of
satisfied teachers. Finding descriptors of those who are satisfied is one approach
to addressing the needs of the teachers in the schools and can be used to increase
the level of satisfaction so they do not leave the field. Research can be
accomplished that not only looks for descriptors and factors that are influential to
teachers, but also to act as a direct method to increase satisfaction levels. In
addition, this work distinguished the influence the administration or leadership of
the school has on the teachers’ level of satisfaction.
Research has also indicated that many of the factors are dependent on the
socioeconomic level of the school, personal characteristics of the teachers being
studied, and a multitude of other variables. If this research is able to distinguish
variables that are more influential than others, district level and building level
administrators can focus their attention on specific factors that affect teachers’
level of satisfaction and yield greater results. The attention and support can be
differentiated according to the needs of the teachers in a specific school, rather
than universal knowledge based on research of other teachers under different
circumstances.
Research has indicated that the administration of a school has a direct
impact on the level of satisfaction of those in their schools. Administrators have
the ability to create, delete, and modify components of the environment teachers

11
encounter in their daily interactions. Administrators control the professional
development, the structure for collegial interactions, and the support teachers need
to accomplish the jobs they are responsible for achieving. Past research has also
indicated that administrative leadership can have more influence on a teacher’s
level of satisfaction than other variables occurring in the educational setting. If
this study is able to show that leadership is more influential than other factors,
more can be done to meet the needs of the teachers in the classroom.
Summary of the Chapters
Chapter 2 reviews the literature on teacher satisfaction as to historical,
societal, external, and intrinsic influences. High attrition, low retention rates, and
student achievement are also discussed. The contents of chapter 3 define the
methods used in this study to collect the data. Teachers accessed via Survey
Monkey, an internet-based collection website. the survey developed through the
use of Schools and Staffing Survey. Both descriptive and inferential statistics
were developed, including the use of SPSS. Chapter 4 reports the results as a
whole and by subgroups (years of experience, level of education, gender, age,
type of certification, and grade level). Within chapter 5 is a summary of the
findings per research question and a summary of the conclusions, comparing the
descriptive and inferential statistics between the whole group and subgroups.

12
CHAPTER 2
REVIEW OF THE LITERATURE
This comprehensive review of the literature is organized to demonstrate
the historical, societal, and individual influences, which have and continue to
shape the satisfaction levels of teachers and the state of the teaching workforce.
The first section, titled “Historical and Societal Influences on Teacher
Satisfaction,” of this literature review provides a general framework concerning
the historical and societal impact on teaching as a workforce. The second section,
titled “External Influences on Teacher Satisfaction,” explores the direct external
factors teachers experience in the field of education. The third section of this
review, titled “Intrinsic Factors on Teacher Satisfaction,” addresses the individual
characteristics of teachers and their responses from external influences. The final
section, titled “Future Possibilities Based on Research,” addresses the
consequences of teacher dissatisfaction such as high attrition and low retention
rates, as well as, and most importantly, student achievement. In general the
following sums up much of what is behind the issue of teacher satisfaction and its
impact on retention and attrition levels. “The problem isn’t that too few are
coming in, but too many are leaving” (Dillon, 2009).
Historical and Societal Influences on Teacher Satisfaction
The present state of teaching as a workforce has been shaped through
factors such as purpose of education, the advancement of technology, gender
roles, and the success of the students in the classrooms of the American schools.
In fact, many of the issues past educators have faced are similar, if not the same,

13
as the challenges present educators are facing in their work. Low professional
prestige, low salaries, and subpar ratings on satisfaction with their profession are
challenges the teaching workforce has faced since the inception of public
schooling and still face in contemporary education. In her work on “Teachers’
Work in Historical and Social Context,” Dr. Dee Spencer (2001, p. 20) wrote of
the female gender dominance in the field of education as a result of historical
influences. Although periods of time have indicated males were prominent figures
as educators, their time was limited as education became a requisite for all
children and a greater need for a larger teacher workforce grew. Moving away
from past societal beliefs such as a woman’s place is in the home and males were
the more highly educated, the role females played in the home and as part of the
workforce changed as well.
Since the 17th and 18th centuries, the family dynamics and advancement
of technology has by necessity provided the workforce for American schools. The
Preindustrial Period of American history was characterized by a family unit all
working in accord to meet their individual needs. Spencer indicated that as the
role of females entailed supplemental income for the household teaching was a
way to provide these funds while maintaining the role they played within their
homes. Females became ideally suited to address the needs of their contemporary
schools. Teaching was a way for women to work outside the home, but still stay
within the overall goal of taking care of their own family.
The advancement of technology was a prime force that impacted the
dynamic of the American family and the roles of the people within the American

14
family. “The center of the labor moved out of the household and into the factory
setting. The transition of society from an agricultural to an industrial base also
created changes in the educational system” (Spencer, 1997, p. 805). Because men
typically took positions in factories and other jobs that were better paying to
support their families, women again were primed to be the perfect gender to be in
the classrooms. Again, the educational system reflected the changes in history and
societal factors.
At the same time the impact of advanced technology occurred, schools
were decentralized and a mass expansion took place. With this expansion came a
greater need for teachers. To meet these needs, which were based on historical
and societal influences, women were again asked to do the work within the
schools. Women, because men typically chose occupations which were more
lucrative, became vital to the teacher workforce. Although women were the
perfect fit for teaching positions, the cycle of low salaries and teacher shortages
perpetuated the gender dominance of females in the workforce. Women being
ideal for teaching and earning supplemental income for their families perpetuated
the low salaries that have always plagued educators. Teacher salaries were low as
the prestige of the field was low, thus salaries reflected the societal beliefs.
The population boom in the early 20th century led to another shortage of
teachers. It was at this time the National Education Association established a
special commission to address the challenges educators were facing. The thread of
low salaries has been seen throughout the history of education. The commission
indicated that low teacher salaries were not attracting the people who could work

15
with students in the American schools. As the National Education Association
established a commission to understand the issues education was facing, other
bodies were also seeking answers the field of education was facing at this time.
In the late 20th century student learning in all levels of education had been
believed to be decreasing at an alarming rate. It was also believed that American
education was lagging behind other countries in math and science content areas.
In 1981, President Reagan commissioned the Secretary of Education, Terrel H.
Bell, to look into the problems that were occurring in the field of education. The
comprehensive report, A Nation at Risk: The Imperative for Education Reform,
was the result. The report from the Secretary of Education indicated five main
concerns, which if addressed, would change the state of education (National
Center for Education Evaluation [NCEE], 1983). The following are the five
recommendations from Bell (StateUniversity.Com, n.d.).
1. Four years of English, three years of mathematics, three years of
science, three years of social studies for all high school students.
2. More rigorous and measurable standards must be adopted.
3. The school year should be extended.
4. Teaching needed to be improved with enhanced teacher preparation
and professionalism.
5. Accountability should be added to education.
A Nation at Risk was a significant set of reports that again attempted to
address the crisis which was occurring at the time (A Nation at Risk, 1983). This
study reported that about 13% of all 17-year-olds in the United States were

16
considered functionally illiterate. Functional illiteracy rates among minority youth
ran as high as 40% . Between 1975 and 1980, remedial mathematics courses in
public four-year colleges increased by 72% and constituted one-quarter of all
mathematics courses taught in those institutions. Over half the population of
gifted students did not match their tested ability with comparable achievement in
school. Many 17-year-olds did not possess the “higher order” intellectual skills
needed for entrance into the workforce. The findings of the report led to the need
for further investigation as well as a plan of action to help make the necessary
changes. Also noted was the lack of teachers who were highly qualified and had
the ability to lead students to greater levels of achievement.
It was at this time that American Education was facing a perception issue
that the work commissioned by President Reagan was attempting to address.
Americans were believed to be behind significantly compared to other countries
in the areas of math and science. In opposition to the work of the commission,
David Berliner and Bruce Biddle’s work, The Manufactured Crisis (1995),
demonstrated much of the panic in education was based on false claims and
unsubstantiated claims on American education. They addressed the educational
myths of low student achievement and a lack of achievement compared to
counterparts in other nations. Even in the face of this work, the attention was still
on a shortage of qualified teachers. The American teaching workforce remained
lacking qualified teachers. Finding qualified teachers is still an issue in
contemporary education.

17
External Influences on Teacher Satisfaction
The historical and societal influences have consistently impacted the state
of the teaching workforce. These influences have and will always have an impact
on the teachers in the school. In addition to historical and societal influences,
additional external factors, which directly impact teachers, also have a significant
influence on the teaching workforce. External factors such as the political
canvass, educational funding, the district the teacher works within, as well as the
administration or leadership of the school also play large roles in the satisfaction
levels of teachers.
Thomas McItyre (1982) surveyed 469 special education teachers to
understand where their high rates of burnout originated. Within the framework of
locus of control, the determination of where experiences are perceived to occur,
McIntyre found teachers who perceived events through an external orientation, as
opposed to internal, that is, they are able to control events, are more likely to
experience burnout. No statistically significant correlations were found between
burnout with teaching positions with grade level taught, type of child taught, level
of education, student load, size of district, and marital status. External factors are
influential towards the experiences teachers have in the classroom.
Because external events are so powerful in the perceptions of teachers in
their work, the factors that are within control of people around the school are vital
to maintaining or increasing the satisfaction levels of teachers. Anderman, Smith,
and Belzer (1991) evaluated the relationship between teachers’ perception of
school leadership, school culture, and teachers’ satisfaction and commitment. The
18
researchers were looking for different principal behaviors that foster different
cultures or “environments” within the school. They were also looking for
leadership behaviors that increased teachers’ satisfaction and commitment.
Anderman et al. found a relationship between how teachers perceived their school
culture and their perceived satisfaction and commitment. Recognition was the
strongest predictor of satisfaction. When the environment in the school is one that
stresses integrity and growth, teachers are more likely to be satisfied.
Ronit Bogler (2001) conducted a study to examine the influence of two
different types of leadership styles and their influence on teacher job satisfaction.
In addition, Bogler also looked at the decision-making process of principals and
its effect on teacher job satisfaction and personal beliefs about their occupation.
Bogler examined two leadership styles and their influence on teacher satisfaction.
The first was transformational leadership, which is characterized by support of
teachers, as well as creativity and initiative in their job duties. Leaders who are
said to be transformational are said to be charismatic, take personal consideration
in understanding their followers, and have the intellectual ability to stimulate
followers. The other form of leadership, transactional leadership, is characterized
by stability and situational management of organizational issues. Each style of
leadership dictates a certain climate and response from teachers. Bogler sought to
examine if a specific style would lead to greater levels of job satisfaction for a
teacher. Bogler also looked to determine if the method a principal utilized in
situations where decisions had to be made yielded a difference on the levels of

19
satisfaction for teachers. Finally, Bogler looked at teachers’ personal beliefs about
their career as a determinant of their level of satisfaction.
After surveying 745 teachers, Bogler (2001) reported that the more
teachers perceived their occupation as a profession, the more they perceived their
principals to be transformational leaders. The more the principal was
participatory, and the less they exhibited transactional leadership, the greater the
job satisfaction. A teacher’s job satisfaction increased when they perceived their
principal’s leadership to be transformational as opposed to transactional. Most
importantly, Bogler referred to the high rates of satisfied teachers who hold a high
value on teaching as a profession. Teachers’ occupation perceptions strongly
affected their level of job satisfaction. This finding indicates that there are
variables that increase a teacher's job satisfaction to a greater degree; and there are
those variables, to some degree, that cannot be controlled that influence a
teacher’s level of job satisfaction.
Intrinsic Factors on Teacher Satisfaction
Although a multitude of studies starting with the report from the NEA has
indicated salary as the prime factor that would increase the satisfaction levels of
teachers in the field of education, additional research has indicated salary as being
one component of an overall effort to transition the field of teaching to a higher
level of prestige and satisfaction levels. Taking into consideration the intrinsic and
extrinsic variables associated with teacher job satisfaction, Kim and Loadman
(1994) investigated the factors of job satisfaction, but as predictors rather than
characteristics. Looking at the National Database for Pre-service Teachers survey

20
data from the base year 1988 and followups from 1988 through 1992, researchers
have indicated several predictors that were related to teacher job satisfaction.
Whether intrinsic or extrinsic, the following predictors were found significant for
the researchers: salary, opportunities for career advancement, professional
development, professional challenge, professional autonomy, interactions with
colleagues, and interactions with students. These findings were meant to be used
to enhance the knowledge base and insight to keep teachers satisfied in their
careers and to stay in the field of education.
The National Center for Education Statistics (1997) conducted a report to
assess the working condition of teachers and further the knowledge base from the
work of Choy et al. (1993) who investigated the factors related to teacher
dissatisfaction and teacher turnover. Using the 1993-94 Schools and Staffing
Survey (SASS), the researchers gathered information they hoped to use for the
creation of policy in the school setting, consequently increasing the level of
satisfaction teachers experienced in U.S. schools. Factors examined included
school and workplace characteristics, the teacher’s background, salary, and other
benefits.
The researchers approached the topic in two directions: to find the
characteristics that influence levels of teacher satisfaction and, secondly,
distinguish the descriptors of teachers with low, medium, or high levels of
satisfaction in their job. The team grouped the variables into one of four clusters;
school characteristics, teacher background, workplace conditions, and teacher
compensation. Results indicated several factors that had a direct influence on

21
teacher satisfaction. More administrative support and leadership, good student
behavior, a positive school atmosphere, and teacher autonomy were all associated
with higher levels of teacher satisfaction. The report also indicated salary was
slightly related to teacher satisfaction. Background variables, although related to
teacher satisfaction, were not nearly as significant as the workplace conditions
such as administrative support, parental involvement, and teacher control over
classroom procedures.
When the team investigated the descriptors of teachers’ current levels of
satisfaction, they divided the sample into one of three categories (low, medium, or
high satisfaction). They found that 34% of teachers interviewed indicated they
were not sure if they would return to teaching if they had the chance. Thirty-two
percent indicated they would certainly become a teacher again if they had to do it
all over again, and the remaining 35% surveyed indicated they were moderately
satisfied with their career choice.
Research has indicated that to understand the state of the teaching
workforce the teachers have to be asked their opinions. In a later administration of
the 2007/08 Schools and Staffing Survey (National Center for Education
Statistics, 2010), in which 9,800 public schools, 180 Bureau of Indian Education
funded schools, 2,940 private schools, and 5,250 public school districts,
researchers were able to establish a current state of the educational workforce and
their perceptions of their work.
Klecker and Loadman (1997) conducted research from findings of
previous work in which years of experience was found to be a factor influencing

22
teacher satisfaction. Research was conducted to find the influence of years of
teaching experience across seven factors of job satisfaction including salary and
fringe benefits, opportunities for professional development, level of
personal/professional development, level of professional autonomy/decision-
making authority, general work conditions, interactions with colleagues, and
interactions with students. The years of teaching ranged from zero years of
experience to 26 years and were divided into six categories: 5 or fewer, 5 to 10
years, 11 to 15 years, 16 to 20 years, 21 to 25 years, and 26 years or more.
To answer their research question, Klecker and Loadman (1997) used the
National Follow-up Survey of Teacher Education Graduates Job Satisfaction
Subscale. The authors surveyed 4,076 teachers, attempting to provide insight into
the variables that are most influential to classroom satisfaction by the number of
years a teacher had been in the classroom. Results indicated that teacher
satisfaction was rated highest for their interactions with their students and
working conditions were rated as the lowest category of job satisfaction. When
looking at the years of experience, they found no statistical difference on teachers
rating job satisfaction in relation to salary and fringe benefits, working conditions,
or interactions with their students. There were no differences found in teacher
satisfaction after the first five years of teaching.
Sylvia Robinson (1998) conducted a review of the historical literature of
clinical supervision and teacher job satisfaction to address some of the issues that
lead teachers to leave the field or stay and be dissatisfied with their students. She
compared the interactions of the role and effect of clinical supervision and its

23
influence on teacher job satisfaction through four clinical models as well as the
research on teacher job satisfaction. Robinson’s goal was to evaluate models
improving teaching practices and indirectly improving teachers’ job satisfaction,
resulting in greater instructional practices and more effective student learning.
What is the relationship between supervisor and teacher job satisfaction
and what benefits can be obtained? Robinson (1998) extrapolated several
findings: “Administrators who are responsible for supervising teachers have the
ability to enhance job satisfaction in the intrinsic reward areas of professional
challenge, professional autonomy, and interaction with colleagues through their
actions during clinical supervisory practices” (p. 9). Feedback, rewards, and
support can also be provided by administrators as a part of clinical supervision.
The author found a link between clinical supervision and teacher empowerment
that would positively influence teachers’ job satisfaction.
Craig Mertler (2001) also studied teacher satisfaction. From a sample of
996 elementary, middle, and high school teachers, Mertler examined teachers’
current level of satisfaction in their career as well as assessed their level of
motivation for their work. The results of his work led to several pieces of
information concerning the levels of the teachers who were surveyed. Seventy-
seven teachers indicated they were satisfied with their jobs as teachers. No
significant differences were found in satisfaction between males and females, nor
by the ethnicity of the teachers. In addition, no significance was found in the areas
of school levels or different school settings. Potentially the most significant
results of the survey were the relation of teacher satisfaction to the age of the

24
participants. Teachers ranging from 26 to 30 years of age as well as 56 years of
age and older reported the highest levels of satisfaction with their jobs. Teachers
who fell into the 31 to 35 age category reported the lowest satisfaction.
Researchers reported teachers in their 20s and 30s indicated a desire to enter the
teaching profession again if given the opportunity.
Determining that teachers in the early part of their careers, as well as the
later portion of their careers, were more satisfied than the “middle aged” teachers,
the researchers looked to the consequences of the dissatisfied teachers. Twenty-
three percent of the teachers reported they were dissatisfied with their careers.
And although this indicates that 77% of teachers are satisfied, they pointed to the
number of students the dissatisfied teachers interacted with on a daily basis.
With a different tool for analysis than his previous research, Craig Mertler
(2002) evaluated the levels of teacher satisfaction among middle and high school
teachers. Using the Teacher Motivation and Job Satisfaction Survey, Mertler
surveyed 710 middle and high school teachers. Survey questions included
teachers’ overall level of job satisfaction, the extent to which teachers were
motivated, and the effects of various school and non-school based factors and
performance incentives. Slightly more than 75% of the teachers reported being
satisfied with their career. Gender, not ethnicity, was shown to be significantly
related to job satisfaction. Males reported a higher level of satisfaction than
females, and teachers earlier in their careers indicated a higher level of
satisfaction than teachers who were in the middle of their careers. Teachers in the
26 to 30 year old category as well as teachers 36 to 40 years old reported being

25
more satisfied than teachers of other subgroups. Teachers with 1 to 5 years of
teaching experience, 21 to 25 years of experience, and 31 to 35 years of
experience reported more satisfaction than other subgroups. Teachers who had 6
to10 years of teaching experience reported the lowest levels of satisfaction. The
participants surveyed reported, in general, they were motivated in the schools.
Jan Richards (2003) also looked specifically at characteristics of satisfied
teachers. Richards’ research design included three varying levels of teachers
classified by their years of experience in the classroom. From the results of her
previous work, she felt she could make more of a contribution to the topic if she
included teachers with various levels of experience in the classroom. The question
Richards attempted to answer was to determine the most highly valued behaviors
principals exhibit in their work with teachers on their campus.
Richards designated years of experience into three divisions: 1 to 5, 2 to
10, and 11-plus years of experience. Richards attempted to capture the voices of
the teachers in their respected categories. Her questions included topics on the
perception of teachers at different stages of their careers, change in their beliefs as
they stayed in the field, and change throughout their career as the result of the
impact of the principal. Throughout her interviews, Richards distinguished themes
from the teachers: the power of caring, the power of respect, and the power of
praise and acknowledgement.
The data also provided the themes that were the most significant to all
categories of teachers. Ranked highest to lowest the teachers indicated that they
valued the importance of (a) supportive teachers and parents in matters of student

26
discipline, (b) respect for teachers as professionals, and (c) an open-door policy.
In addition, teachers also indicated they valued fair, honest, and trustworthy
behavior on the part of their principals. The need for support with parents in
matters of discipline increased with the number of years of experience.
Various factors within the schools affect different groups of teachers in
different ways. “
As beginning teachers continue to leave the profession within the first
several years of entering, educators must identify factors which cause
teachers to remain in the profession, as well as factors related to attrition if
the current teacher shortage is to be remedied. (Inman & Marlow, 2004,
p. 1)
These researchers set out to determine the factors which contribute to teachers’
high levels of attrition in the field. To determine these factors they categorized
their sample of teachers into two groups. Group one consisted of new teachers
who had been in the field no longer than three years. Group two consisted of
teachers who had been in the field for four to nine years. Inman and Marlow
reported beginning teachers leave within the first three years.
The purpose of the data was to provide the researchers with more
information to deal with the high rates of young professionals leaving the field.
The data indicated that salary was the only external factor for beginning teachers
to stay in the profession. The teachers with four to nine years of experience
indicated salary as the most significant factor in staying in the profession.
Teachers perceived job security as the highest ranked employment factor. The

27
results of this study seem to draw a distinction between the different needs of
teachers at various levels of their careers.
For her dissertation, Laila Marie Papin (2005) chose to examine the
elements that promote teacher satisfaction in inner-city public school in Phoenix,
Arizona. The goals of this study were to increase teacher satisfaction and decrease
teacher turnover. Using the Minnesota Satisfaction Questionnaire, there were 385
teachers in grades kindergarten through eighth grade, including specials areas,
who were questioned about satisfaction with their careers. In addition to
understanding the topic of teacher satisfaction, Papin also wanted to use the
information to determine special areas of concern for the district the teachers were
employed. There was no correlation between teacher satisfaction and gender or
grade level. A negative correlation was found between teacher satisfaction and
age, salary, and teaching experience. Satisfaction was apparent with intrinsic
aspects of their jobs. Teachers were dissatisfied with extrinsic issues although
salary did not correlate with teacher satisfaction. Gender nor grade level of the
teacher did not influence teacher satisfaction. Teachers earning a higher salary
were not more satisfied than those earning less. Those with more experience were
less satisfied than those with less experience.
Loeb, Darling-Hammond, and Luczak (2005) also looked at the factors
affecting teacher satisfaction, but focused her attention on beginning teachers.
Beginning teachers were more likely to suffer from dissatisfaction with teaching
than experienced teachers. The authors investigated a low-income school in
California to better understand the differences between high-income schools and

28
those characteristics of low-income schools. Using the California survey data, the
authors used a multiple regression and a t-test to analyze the school
characteristics. In total, the most significant piece of data found by the authors
was that school conditions were the greatest predictor of teacher turnover. In
addition, 22% of the teachers surveyed indicated they believed there was a serious
issue with teacher turnover. Teachers who taught in schools with higher
populations of African American and Latino students, as well as schools with
greater populations of ELL students, reported more difficulty filling vacant
teaching positions.
Perrachione, Rosser, and Peterson (2008) conducted a study to understand
the internal and external needs of teachers. The results from their study suggested
that three intrinsic factors (personal teaching efficacy, working with students, and
job satisfaction) were perceived to significantly influence satisfaction and
retention, while two extrinsic motivators (low salary and role overload) did not
have any effect. Researchers from this study also indicated that teachers’ level of
satisfaction was tied to the profession of education as opposed to work-related
duties.
Teacher satisfaction is a subjective concept. To address the subjectivity
researchers have developed instrumentation to better understand this complex
topic. Clarke and Keating (1995) created a 10-question survey to study the factors
influencing individuals as well as perceptions of their work setting. Their results
of the study indicated that for a sample of 114 teachers pay was not an indicator
of teacher satisfaction, but did find that teacher-student interaction was the

29
greatest indicator of teacher satisfaction. The data indicated that administrative
support was also a key indicator of teacher satisfaction in their work.
Because teachers are among many who experience high rates of burnout,
the UCLA Center for Mental Health in Schools (1998) sponsored a study to
investigate the state of mental health of classroom teachers. Many teachers were
experiencing burnout from their work resulting in greater numbers of teachers
leaving the field. In UCLA’s attempts to find more effective methods for teachers
to deal with their stress, they
suggested more effective ways to deal with teacher burnout, which would
improve student achievement in the classroom, as well as enhancing teachers’
ability to stay in the field longer. “If schools bring a mental health perspective
they will be more able to deal with issues of burnout, which may lead to
frustration, later leading to issues with moral and mental health” (p. 43). The
authors wrote that there were ways to minimize burnout such as reducing
environmental stressors, increasing personal capabilities, and enhancing job
supports to achieve a better state of teachers’ mental health. The researchers
concluded that, although there are many successful strategies to help teachers
become more conscious of their mental health, there is no one better coping skill
or method to deal with their stress than another.
In their work, Modeling Teachers Satisfaction: Findings from 892
Teaching Staff at 71 Schools, Dinham and Scott (1997) expanded on previous
research conducted in the area of teacher satisfaction and found similar results as
many previous researchers. The purpose of this study was to develop an

30
instrument suitable for identifying and quantifying the sources and factors
contributing to teacher satisfaction and dissatisfaction. Intrinsic factors such as
student achievement, positive relationships with students, self-growth, and
mastery of professional skills were factors that influenced the level of teacher
satisfaction positively. Extrinsic factors such as rapid pace and nature of
educational change, increased expectations, and lack of support for
implementation of change policies were found to be negative influences on the
teachers’ level of satisfaction. The researchers felt they were able to expand on
the previous body of knowledge by identifying what they called a third “band” of
factors. The researchers indicated that these factors were neither intrinsic nor
extrinsic sources of satisfaction, but were school-based factors. The factors
included school leadership, climate, decision-making, school reputation, and
school infrastructure. These factors were said to be factors that had the most
potential for change.
The researchers (Dinham & Scott, 1997) surveyed exiting teachers to find
what were the influences that pushed them to resign. Respondents indicated that it
was the increase in the strength of their dissatisfiers that had “tipped the balance”
and precipitated the “resignation decision” (p. 2). More specifically, the
researchers found that relative dissatisfaction of teachers increased over time due
to social and educational change. Fifty percent of the respondents rated
themselves as satisfied, including 4% who rated themselves as highly satisfied.
Forty-two percent of the respondents rated themselves as dissatisfied, including
7% who rated themselves as highly dissatisfied. Major dissatisfiers were those

31
seen to detract from the facilitation of student achievement and teacher
effectiveness. The status of teachers and increased administrative workloads were
indicated as the most dissatisfying factor.
Farber (1982) conducted a study to identify factors leading to teacher
burnout in suburban New York and New Jersey. Utilizing the Teacher Attitudes
Survey, Farber found that the major factor influencing teacher satisfaction were
experiences with students. Teachers felt sensitive to and involved with their
students as well as competent at their job. Minor factors influencing teacher
satisfaction were collegial relationships, families, and friends. Data suggested that
student discipline problems were not the prime concern of suburban teachers in
New York and New Jersey. Eight-six percent of the teachers reported a lack of
administrative support in the schools in which they worked, excessive paperwork,
unsuccessful meetings, and a lack of advancement opportunities. There were few
subgroup differences with regard to satisfaction (sex, marital status, number of
years teaching, and number of years at present school). Subgroups that were
significant were age, grade level taught, and school-wide student population with
age being the most significant factor.
Ingersoll and Alsalam (1997) conducted a review using 1990-1991 data
from the Schools and Staffing Survey to address concerns of inadequacies present
in the educational system. Researchers set out to determine the relationship
between characteristics of professionalism and its relationship to levels of teacher
commitment. The authors looked at the profession of teaching through the
sociological context of professionalization to answer various questions of the

32
impact of training, professionalization, and working conditions, including what
characteristics would influence the level and success of teachers in the
educational system. The researchers attempted to use this approach in the hope to
find characteristics/professional traits that, if increased, would result in
improvements in the motivation and commitment of teachers, which, in turn
would lead to improvements in teachers’ performance. The increase in motivation
and commitment would ultimately lead to improvements in student learning.
The researchers reported several findings from their work. Males were
found to be less committed than females, teachers with graduate degrees reported
less commitment than teaches without, and teachers with more teaching
experience indicated less commitment than those with less. Distinct differences
were found in teacher commitment from teacher-to-teacher and school-to-school
variables. No effect was found on continuing education and staff participation in
seminars sponsored by professional organizations. Teacher autonomy, faculty
policy making, assistance for teachers, and end-of-career salaries had a
relationship to teacher commitment. Some aspects of professionalization were
related to teacher commitment and some were not. Research also indicated
schools with higher levels of the characteristics of professionalization had higher
levels of teacher commitment. Finally, the research indicated that only if teaching
staffs reported that new teachers were effectively assisted in matters of discipline,
instruction, and adjustment to the school environment, their commitment
appeared to improve.

33
Future Possibilities Based on Research
Edey and Huston (2004) conducted a study to analyze the high rates of
attrition and retention problems in the San Diego schools. Their belief was that
teacher satisfaction was a direct cause of the high rates of teachers leaving their
schools and the field of teaching. While conducting their research, with the help
of 272 teachers, they found that years of experience in the classroom made a
difference on the level of satisfaction for teachers. The researchers also indicated
new teachers were more likely to leave within the first three years of their
teaching. Satisfaction levels result in teachers staying in the schools and staying in
their field.
Although the topic of the research by Ingersoll and Smith (2003) was
teacher retention and attrition, they pointed to the significance of teacher
satisfaction as a key component to decreasing the attrition and retention levels of
teachers in the classroom. The study initially examined the current state of teacher
needs, teacher shortages, but also addressed the commitment level of teachers to
stay in the field of education. They also implemented programs such as alternative
certification programs, financial incentives, loan forgiveness, and housing
assistance.
Ingersoll and Smith (2003) also surveyed teachers who left after their first
year of teaching to determine the reasons for their exodus. Their results indicated
there were many different reasons why teachers leave the field, but they found
four significant major areas. The factors which Ingersoll and Smith were able to
single out were administrative support, poor discipline for students, poor student

34
motivation, and a lack of participation in school decision-making. These findings
were not out of the ordinary in the context to other studies, but they did add to the
support of the main reasons why teachers leave.
Arends and Rigazio-DiGilio (2000) sought to determine the best practices
for state and local policy development and the development and implementation
of teacher induction programs to increase the retention rates of beginning
teachers. In addition, the researchers attempted to summarize the current trends
concerning the future of teacher induction. Suggestions by the researchers
indicated several individual possibilities for schools to increase the level of
retention of their teachers and what schools need to do to obtain the results. The
larger purpose of this study was set to find ways to increase the level of
satisfaction for teachers, resulting in greater retention rates for the teachers in the
specific districts.
To help teachers start off their careers on the right foot, programs have
been implemented to help teachers deal with the stress and the unknowns of
teaching. Dana Selzer (2000) conducted a study of 553 teachers who were in their
first year of teaching. The author wrote of the limitations of the typical plans and
programs which are meant to help new teachers acclimate into their new career as
traditional programs do not take into consideration individual needs as beginners
who were less likely to be involved in activities that supported their professional
development. By looking into the experiences of the new teachers, the author was
able to demonstrate that there are specific behaviors that increase the level of
satisfaction beginning teachers experience in their first years as well as to

35
demonstrate what increases the satisfaction they experience. Although the
teachers did have issues with the lack of individual attention given to them by
their administration, there was still a high level of teacher satisfaction among the
beginning teachers. When surveyed, the teachers indicated that they considered
assistance from fellow educators and protection from difficult teaching situations
as the most helpful support they could have to persevere through their first year of
teaching. They considered lack of administrative support, lack of orientation to
policies and procedures, and their working conditions as the most detrimental to
their satisfaction. Selzer attempted to gain insight into the worlds of beginning
teachers to help them become acclimated and to do more than endure their new
career.
Bivona (2002) investigated the influences of teachers’ attitudes toward
their perceptions of teaching. Using a sample of 20 teachers, Bivona found
teacher morale to be positive. More than half of the teachers planned to remain in
teaching. Teachers with more than 10 years of experience had much more positive
attitudes towards teaching than did less experienced teachers.
The research on teacher satisfaction points to the need to understand the
individuals and their needs while in the classroom and at the beginning as well as
throughout their career. Many factors have been found to be influential factors
affecting the satisfaction levels of teachers, some more influential than others.
Research indicates teachers need to be asked and asked continually as to what will
satisfy their needs as teachers to keep them in the classrooms with their students.

36
CHAPTER 3
METHODS
This study examined the current level of satisfaction teachers hold towards
their jobs, as well as the factors that would directly increase their level of
satisfaction. In addition, this study included the opinions of participants towards
the administration of their school. To accomplish this task, the data were analyzed
from two perspectives: a collective sample of all teachers who participated in this
study, as well as disaggregated by subgroups based on the characteristics the
individual teachers indicated through their participation.
This work sought to determine if specific factors that previous research
has indicated as more influential than others would increase a teacher’s level of
satisfaction more than others. Data are also presented concerning the participants’
beliefs towards their administration.
Restatement of the Problem
Past research has shown there are differing needs of teachers. Past
research has also indicated salary as a prime factor to increase teachers’ level of
satisfaction towards their work. Although salary may be influential, research has
shown there are a multitude of other factors that are also influential. Many of the
factors impacting teachers’ level of satisfaction come from external factors such
as historical and societal influences, as well as federal and political sources.
Although many of the factors that impact teacher
satisfaction there are many factors that can be controlled at the local level. This
study sought to find the factors most influential to the participants in this study.

37
Research Questions
Research Question 1: What is the current level of satisfaction of
participants in this study?
Research Question 2: Do teachers of specific subgroups (years of
experience, level of education, gender, age, type of certification, grade level)
report the same or differing levels of satisfaction than members of other
subgroups?
Research Question 3: Do teachers of specific subgroups (years of
experience, level of education, gender, age, type of certification, grade level)
report the same or differing factors that would directly increase their level of
satisfaction towards their teaching?
Research Question 4: How do teachers in this study view their
administration?
Research Question 5: Do satisfied teachers indicate the same needs as
dissatisfied teachers?
Research Design
Research Methodology
The data for this study were obtained through the administration of a
combination of self-created survey questions and questions from the Schools and
Staffing Survey (NCES, 2010), a federally recognized survey given by the federal
government to address the current state of teachers in the United States (see
Appendix A). The Schools and Staffing Survey was originally created by the
National Center for Education Statistics in the early 1980s and revised in 1985 to

38
bring additional focus to elementary and secondary school systems. Topics
addressed on the Schools and Staffing Survey, as well as in this study, were as
follows:
1. Teacher demand and shortage
2. Administrator characteristics
3. School programs
4. General school conditions
5. Principal and teacher perceptions of school climate and problems
in their schools
6. Teacher compensation
The schools and staffing surveys comprise of four core components: the
School Questionnaire, the Teacher Questionnaire, the Principal Questionnaire,
and the School District Questionnaire. Survey questions from The Teacher
Questionnaire, in addition to self-created survey questions (part of Appendix A),
which were used for this study. Data collected from participants were evaluated as
a whole, meaning data indicated by all participants, as well as separated by the
subgroup the teachers indicated on the survey.
Based on questions from the Schools and Staffing survey, teachers were
asked to answer questions of their general level of satisfaction as well as to
provide personal demographic data and factors that would directly influence their
personal level of satisfaction towards being a teacher. Surveys were distributed to
teachers via Survey Monkey, an internet-based data collection website. Data

39
obtained from this survey were analyzed through the statistics package SPSS to
answer specified research questions.
Sample
Appendix B displays the email sent to prospective participants on June 8,
2008. Those who participated accessed the website via Survey Monkey and
marked their responses. The respondents consisted of 41 teachers in the southwest
region of the United States participated in this study in the 2007/08 school year.
All teachers in this study worked in two urban school districts which shared
similar demographic information, including student ethnicity, gender, ELL
population, and race. In addition, the schools in this study were of similar
socioeconomic status and close in proximity to one another. Both school districts
were structured as kindergarten through eighth grade schools, not unified with the
high schools in the area. Both districts were comprised of greater than 85% of
their students receiving free or reduced lunch from the federal government.
Out of the 41 teachers who participated in this study, 10% taught
kindergarten. Fifteen percent of the sample taught first through third grade, 13%
of the sample were fourth grade teachers, 18% of the teachers were fifth grade
teachers, 13% of the population was comprised of sixth grade teachers, 5% of the
sample were seventh grade teachers, and 26% of the teachers were eighth grade
teachers (see Table 1).

40
Table 1
Percentage of Teachers by Grades
Grade
Proportion of Teachers (N = 41)
Kindergarten
10% First through third grade 15% Fourth grade 13% Fifth grade 18% Sixth grade 13% Seventh grade 5% Eighth grade 26%
Twenty-seven percent of the teachers in this study entered through an
alternative certification path whereas 73% of the teachers surveyed entered into
education through a traditional path. Of the participants surveyed, 28% of the
teachers were male and 72% of the teachers were female. Ninety-five percent of
the teachers were Caucasian, which included 5% of the teachers being Native
Hawaiian or other Pacific Islander. Five percent were Hispanic.
The number of years the participants had been in the classroom ranged
from one year to 25 years. Sixty percent of the teachers were in their first five
years of teaching. Eighteen percent of the teachers in this study had been in the
classroom from 6 to 10 years, 13% of the teachers had been teaching for 11 to 15
years, 5% had been in the classroom for 16 to 20 years, and 5% of the teachers
had been in the classroom for 21 to 25 years.

41
Summary
The purpose of this study was to distinguish the factors influencing
teachers’ level of satisfaction towards their job. The survey used in this study
consisted of questions from the Schools and Staffing survey and researcher
created questions based on the core topics of the Schools and Staffing Survey.
Surveys were distributed through an online data collection program and then
analyzed through the SPSS data package. The responses of 41 teachers were
analyzed and then further disaggregated through subgroups that participants
indicated through demographic data. The results are reported in chapter 4.
42
CHAPTER 4
FINDINGS AND RESEARCH
This chapter presents the results obtained through this study on the factors
affecting teachers’ level of satisfaction towards their work. Sections are organized
by research questions to provide a comprehensive understanding of the data
derived from this study. Based on data collected from the participants, this study
sought to answer the following research questions:
Research Question 1: What is the current level of satisfaction of
participants in this study?
Research Question 2: Do teachers of specific subgroups (years of
experience, level of education, gender, age, type of certification, grade level)
report the same or differing levels of satisfaction than members of other
subgroups?
Research Question 3: Do teachers of specific subgroups (years of
experience, level of education, gender, age, type of certification, grade level)
report the same or differing factors that would directly increase their level of
satisfaction towards their teaching?
Research Question 4: How do teachers in this study view their
administration?
Research Question 5: Do satisfied teachers indicate the same needs as
dissatisfied teachers?

43
The survey results of this study were analyzed as whole group responses
as well as by subgroup responses. Subgroup data were then compared to the
whole group data
for any differences. The focus of the research was to determine (a) the needs of
the respondents that would directly increase their level of satisfaction towards
their teaching position, (b) the differences in the ways satisfied teachers
responded about their beliefs towards their administration as compared to teachers
who were dissatisfied, and (c) finally the future expectations they have towards
staying in the field of teaching. In addition, to determine possible methods to
increase the satisfaction levels of the teachers within the schools, this research
attempted to gather information concerning the role the administration plays in
the school.
Findings
Research Question 1
Research Question 1 asked, “What is the current state of satisfaction of
participants in this study?” Two questions in the survey sought to find the current
state of satisfaction of participants at the time of this study. The first question, “As
a whole, are you satisfied as a teacher?” was asked of participants to give an
overall answer as to whether they were satisfied as teachers. Seventy-eight
percent of the teachers in this study were satisfied as teachers, with a mean score
of 1.78 and a standard deviation of .423.
Participants were asked to respond to the second satisfaction question, “I
am generally satisfied with being a teacher at this school,” from choices that

44
reflected an ordinal direction. Participants had the choice of answering with
strongly agree, somewhat agree, somewhat disagree, and strongly disagree. The
histogram in Figure 1 reflects the data relating to the responses of teachers for this
particular study. With a mean score of 3.03 and a standard deviation of one, 78%
of the teachers indicated they somewhat agree or strongly agree with the
question.
Figure 1. Satisfaction with being a teacher

45
Research Question 2
Research Question 2 asked, “Do teachers of specific subgroups (years of
experience, level of education, gender, age, type of certification, grade level)
report the same or differing levels of satisfaction than members of other
subgroups? When data were viewed by subgroups, the results were as follows
(see Table 2).

46
Table 2
Percentage of Teachers Satisfied by Subgroups Years of Experience
Gender
Path to Cert
Grade Level
State teacher
was born
1-5
83%
Male
16%
Traditional
79%
k-4
90%
from state
100%
6-10
71%
Female
84%
Alternative
73%
5-6
23%
not
from state
70%
11-15
60% 7-8 17%
16-20
100%
21-25
50%
Note. whole group = 78%

47
Number of years in the classroom. Satisfaction levels were viewed
according to the number of years the teachers had been in the classroom.
Compared to 78% of all the teachers across the grade levels, participants who had
been in the classroom between 1 and 5 years indicated different results. Eighty-
three percent of the teachers in the first through fifth grade indicated they were
satisfied as teachers. Teachers who had taught between 6 and 10 years indicated a
level of satisfaction of 71%. Teachers with 11 to 15 years of experience stated a
level of satisfaction of 60%, and teachers with 16 to 20 years of experience
indicated a level of satisfaction of 100%. Fifty percent of the teachers who had
been in the classroom for 21 to 25 years indicated a level of satisfaction towards
their work.
Gender. Data were also analyzed by gender. Data indicated that 90% of
the females were satisfied, whereas 45% of the male teachers reported being
satisfied with their field. When these numbers are compared to 78% percent of the
teachers who were satisfied when viewed as a whole group, these data revealed
important differences by gender, females being far more satisfied than males.
Grade level. Data showed that 93% of the teachers who taught
kindergarten through fourth grade were satisfied, whereas fifth and sixth grade
teachers’ results indicated 23% of the teachers were satisfied. Of the seventh and
eighth grade teachers, only 17% of the teachers indicated they were satisfied. The
satisfaction levels when viewed by grade level taught were markedly different
than the results of the whole group. Data demonstrated a significant drop in
satisfaction in higher grades as compared to lower grades.
48
Path to teaching. Minimal differences were found between teachers based
on the path they took to get into the field of education. Teachers who entered the
field through an alternative track indicated a level of 73% satisfaction.
Traditionally certified teachers indicated a 79% level of satisfaction towards their
field.
Teachers’ birth state. One hundred percent of teachers from the state of
Arizona were satisfied with their teaching positions, whereas 70% of teachers
from states other than Arizona were satisfied with their jobs.
Research Question 3
The third research question asked, “Do teachers of specific subgroups
(years of experience, level of education, gender, age, type of certification, grade
level) report the same or differing factors that would directly increase their level
of satisfaction towards their teaching?” The third research question was designed
to find specifically what teachers themselves indicated as variables directly
increasing their current level of satisfaction. The most influential factors that
increased teachers’ level of satisfaction are outlined in Table 3.
Whole group data indicated that 36% of the participants in this study
believed a 10% increase in salary would be the most influential factor to increase
their level of satisfaction. Although 33% of the whole group responded that salary
would increase their level of satisfaction the most, 25% of the sample indicated
that class size would increase their level of satisfaction. Close behind salary and
class size, 23% of the respondents indicated a supportive administration would

49
Table 3
Variables That Would Increase Participants’ Level of Satisfaction Years of Experience
Gender
Path to
certification
Grade level
State teacher
was born
1-5
adminis-trative support
Male
supportive
admin-istration
and salary equally
Traditional
10%
increase in salary
k-4
reduction in class
size
from state
10%
increase in salary
6-10
discipline
Female
10%
increase in salary
Alternative
adminis-trative support
5-6
10%
increase in salary
not
from state
adminis-trative support
11-15
10% increase in salary
7-8 10% increase in salary
16-20
class size and salary
21-25
class size
and administrative
support equally
Note. whole group = 10% increase in salary

50
increase their level of satisfaction. Student discipline was reported by 18% of
participants as the variable that would increase their level of satisfaction the most.
Higher quality of professional development was indicated by 3% of the group,
whereas school conditions and resources were variables no one in the group
indicated as increasing their level of satisfaction.
Number of years in the classroom. When data were broken down by
various subgroups, differences in responses were found when compared to the
whole group. Although the whole-group indicated salary and class size as their
top two variables that would increase their level of satisfaction, when data were
broken down by the number of years in the classroom, there was a variety of
factors teachers indicated as the most influential to increase their levels of
satisfaction (see Table 4). Teachers with 1 to 5 years of experience indicated
administrative support as their number one factor to increase their level of
satisfaction. Teachers who had been in the classroom for 6 to 10 years indicated
discipline issues as their most influential, salary as their second most influential,
and class size equally as their third factor that would increase their level of
satisfaction the most. Participants who had been in the classroom for 11 to 15
years indicated salary as the most influential, discipline issues as their second
most influential, and class size as their third most influential factor. Teachers who
had been in the classroom for 16 to 20 years indicated class size and salary as the
only factors that would increase their level of satisfaction. Teachers who had been
in the classroom for 21 to 25 years indicated class size and administrative support
as the only factors that would increase their level of satisfaction (see Table 4).

51
Table 4
First-Choice Factors That Would Increase Satisfaction Levels the Most According to the Number of Years in the Classroom
Years of experience
First
Choice
1-5
administrative support
6-10
discipline issues
11-15
Salary
16-20
class size and salary equally
21-25
class size and administrative support equally
Gender. Males reported that a supportive administration and salary were
equally the most influential factors that would increase their level of satisfaction.
Males indicated discipline and class size as their third and fourth choices that
would increase their level of satisfaction the most. Females reported differently
than males. Females reported salary and class size as the most influential factors
that would increase their level of satisfaction. Discipline and administrative
support equally were the third and fourth most influential factors to increase their
level of satisfaction.
Grade level. Kindergarten through fourth grade teachers responded
differently than fifth and sixth grade teachers, and seventh and eighth grade
teachers as well. Kindergarten through eighth grade teachers reported class size as

52
the factor that would increase their level of satisfaction the most. Salary was
reported as their second most influential factor, and administrative support as their
third most influential factor to increase their level of satisfaction. Fifth and sixth
grade teachers reported salary as their most influential factor to increase their
level of satisfaction, and a reduction in class size as their second most influential
factor. The third factor that fifth and sixth grade teachers reported as their most
influential was a supportive administration. Seventh and eighth grade teachers
indicated administrative support as their number one factor that would increase
their level of satisfaction the most. The second factor that would increase their
level of satisfaction was discipline. The third factor that seventh and eighth grade
teachers indicated as influential on their level of satisfaction was a 10% increase
in salary.
Path to teaching. When reviewing the subgroup of pathway to teacher
certification, there were differences in the way teachers who entered the
profession through a traditional track responded than teachers who were
alternatively certified. Alternatively certified teachers indicated administrative
support as the most influential factor to increase their level of satisfaction,
discipline as their second most influential factor, and class size as their third most
influential factor. Traditionally certified teachers indicated similar, but different,
results than teachers who were alternatively certified. Traditionally certified
teachers indicated a 10% increase in salary as their most influential factor to
increase their level of satisfaction while class size was their second most
influential factor, and discipline and administrative support equally were their

53
third most influential factors. When the question was broken down by the grade
level the participants taught, there were also different results indicated.
Teachers’ birth state. The subgroup “teaching in the state you’re from”
was also compared against the whole group data. Teachers who were teaching in
the state they were from indicated salary as their number one factor that would
increase their level of satisfaction the most. The second factor that teachers who
were teaching in the state they were from indicated as the most influential was a
reduction in class size, whereas they indicated student discipline as the third
factor that would increase their level of satisfaction the most. Teachers who were
not from the state they were currently teaching in reported different results than
their counterparts. Teachers not from the state they were currently teaching in
reported administrative support as their most influential factor to increase their
level of satisfaction and salary as the second most influential factor. The third
factor that teachers from another state than the one they were currently teaching in
reported a reduction in class size as their third most influential factor to increase
their level of satisfaction.
There were differences in reporting from the participants in this study.
When viewed as a whole group, salary, a reduction in class size, and a supportive
administration were the most influential factors to increase their levels of
satisfaction. When data reported by the participants were broken down into
subgroups and analyzed, different results were found.

54
Research Question 4
Data were analyzed as a whole group as well as subgroups for the fourth
research question, “How do teachers in this study view their administration?”
Whole group data indicated that 75% of the participants did somewhat agree or
strongly agree that their administration was supportive and encouraging. When
asked if their principal enforced school rules for student conduct and backed them
up when they needed it, 70% of the participants responded to either somewhat
agree or strongly agree with the statement. When asked if the principal knew
what kind of school he or she wanted and if they had communicated that view,
70% of the respondents indicated either somewhat agree or strongly agree with
the statement. When teachers were asked to respond to the statement, “In this
school, staff members are recognized for a job well done,” 55% of the teachers
responded to either somewhat agree or strongly agree with the statement. Results
indicated differences in beliefs when data were disaggregated by subgroup.
Number of years in the classroom. When the data were analyzed per
subgroup, “Years in the Classroom” strongly indicated that teachers who had been
in the classroom the longest felt the least amount of support from their leadership
compared to teachers new to the profession, as seen in Table 5.

55
Table 5
Administrative Support and Number of Years Teaching
Whole Group
Years 1-5
Years 6-10
Years 11-15
Years 16-20
Years 21-25
The school administration’s behavior toward the staff is supportive and encouraging.
75% 43% 15% 10% 5% 3%
My principal enforces school rules for student conduct and backs me up when I need it.
70% 40% 15% 8% 5% 3%
The principal knows what kind of school he or she wants and has communicated it to the staff.
72% 38% 15% 10% 5% 3%
In this school, staff members are recognized for a job well done.
55% 28% 13% 8% 5% 3%

56
Gender. When the data were analyzed between the whole group and the
subgroup “gender,” there were differences in the responses as displayed in Table
6.
Table 6
Administrative Support and Gender
Whole Group
Male
Female
The school administration’s behavior toward the staff is supportive and encouraging.
75% 82% 73%
My principal enforces school rules for student conduct and backs me up when I need it.
70% 54% 76%
The principal knows what kind of school he or she wants and has communicated it to the staff.
72% 45% 82%
In this school, staff members are recognized for a job well done.
55% 36% 62%
Depending on the specific leadership question, differences were found between
gender, although females indicated they felt more support from their
administration.

57
Grade level. Responses from participants when viewed by grade level
indicated a decrease in positive attitudes towards their administration in higher
grade levels as shown in Table 7.
Table 7
Administrative Support and Grade Taught
Whole Group
K-4
5-6
7-8
The school administration’s behavior toward the staff is supportive and encouraging.
75% 87% 67% 67%
My principal enforces school rules for student conduct and backs me up when I need it.
70% 87% 75% 42%
The principal knows what kind of school he or she wants and has communicated it to the staff.
72% 93% 75% 42%
In this school, staff members are recognized for a job well done.
55% 80% 50% 25%

58
Path to teaching. Data were also disaggregated by the subgroup “path to
teaching certification.” Little differences were indicated in this particular
subgroup as revealed in Table 8.
Table 8
Administrative Support and Path to Certification
Whole Group
Alternative
path to certification
Traditional
path to certification
The school administration’s behavior toward the staff is supportive and encouraging.
75% 73% 76%
My principal enforces school rules for student conduct and backs me up when I need it.
70% 55% 76%
The principal knows what kind of school he or she wants and has communicated it to the staff.
72% 64% 76%
In this school, staff members are recognized for a job well done.
55% 45% 59%

59
Teachers’ birth state. Data disaggregated by the subgroup “Are you from
the state you are working in?” indicated less of a positive attitude towards their
administration compared to teachers who were from a different state as shown in
Table 9.
Table 9
Administrative Support and Teacher’s Birth State
Whole Group
Yes
No
The school administration’s behavior toward the staff is supportive and encouraging.
75% 25% 50%
My principal enforces school rules for student conduct and backs me up when I need it.
70% 28% 43%
The principal knows what kind of school he or she wants and has communicated it to the staff.
72% 28% 44%
In this school, staff members are recognized for a job well done.
55% 23% 28%
Satisfied teachers versus dissatisfied teachers. Data were also
disaggregated by the level of satisfaction indicated by the participants in this
study. Seventy-eight percent of the teachers indicated they were satisfied as a
whole in the field of education, 22% were not. When teachers were asked the
question, “The school administration’s behavior towards staff is supportive and
encouraging,” 81% of the satisfied teachers indicated either somewhat agree or
strongly agree that they were supported by the administration of the school. Fifty-

60
six percent of the dissatisfied teachers felt supported and encouraged by the
administration of their school. When asked the question, “My principal enforces
school rules for student conduct and backs me up when I need it,” 81% of the
satisfied teachers felt school rules were enforced by their principal. When
dissatisfied teachers were asked if they felt their principal enforced school rules,
33% indicated they felt school rules were enforced. Participants were also asked
questions regarding school leadership as to the school mission and vision.
When teachers were asked the question, “The principal knows what kind
of school he or she wants and has communicated it to staff,” 77% of the satisfied
teachers indicated they felt the communication from the principal was present.
When dissatisfied teachers were asked, 50% of the dissatisfied teachers felt the
message was present. When participants were asked the question, “In this school
staff members are recognized for a job well done,” 61% of satisfied teachers
indicated the principal had recognized teacher accomplishments. Thirty-three
percent of the dissatisfied teachers indicated they were recognized for a job well
done.
Other analysis conducted. Multiple linear regressions were conducted in
this study to assess the impact of leadership on satisfaction levels.

61
Table 10
Mean, Standard Deviation and Sample Sizes
Variables Mean
Std. Deviation N
I am generally satisfied with being a teacher at this school.
3.08 .957 39
The principal knows what kind of school he or she wants and has communicated it to the staff.
2.95 1.025 39
The school administration’s behavior toward the staff is supportive and encouraging.
3.05 1.025 39
Table 10 shows descriptive data for this multiple regression analysis. The
regression equation was significantly related to the injury index, R² = 0.629,
adjusted R² = 0.608, F(2, 36) = 30.530, p < 0.01. The multiple correlation
coefficient was 0.793, indicating that approximately 63% of the variance in
teacher satisfaction in the sample could be accounted for by the linear
combination of the two administrator factors. In other words, the two independent
variables, “The principal knows what kind of school he or she wants and has
communicated it to the staff” and “The school administration’s behavior toward
the staff is supportive and encouraging” account for 63% of the variance in
teacher satisfaction as defined by the dependent variable “I am generally satisfied
with being a teacher at this school.” This suggests that teachers’ perceptions of
administrator behavior and communication strongly influence teachers’ level of
general satisfaction with being a teacher at their current school.

62
Research Question 5
The data were used to answer the fifth research question, “Do satisfied
teachers indicate the same needs as dissatisfied teachers?” Satisfied teachers
indicated a reduction in class size would increase their level of satisfaction the
most. Satisfied teachers indicated salary and administrative support as the second
and third variable that would increase their level of satisfaction after a reduction
in class size. When dissatisfied teachers were asked what would increase their
level of satisfaction the most, they responded an impact on student discipline and
administrative support would be equally their first choice to increase their level of
satisfaction the most. Dissatisfied teachers indicated salary as their third choice.
Although both satisfied teachers and dissatisfied teachers indicated different first,
second, and third choices, both groups had the same variables in their top three
choices. As a whole group, participants indicated salary as the most influential on
their level of satisfaction, a reduction in class size as the second most influential
variable, and administrative support as their third most influential factor. This also
does fit with the responses of the participants when viewed as a whole group.
Although there are similarities in the top choices of participants when viewed as a
whole group and satisfaction levels, differences can be found when actual
percentages of the choices are viewed. See Table 11 for more descriptive factors
that would increase teachers satisfaction levels the most.

63
Table 11
Factors That Influence Satisfaction Levels and Satisfaction Level of Teachers
Whole Group
Satisfied Teachers
Dissatisfied Teachers
Student discipline 18% 13% 33%
Reduction in class size 25% 29% 11%
Supportive administration 23% 19% 33%
A 10% salary increase 33% 28% 22%
School conditions/resources 0% 0% 0%
Higher quality in professional development
3% 3% 0%
Data were analyzed to determine the projected length of time teachers
would stay in their classroom or in the field of education. Fifty-two percent of
satisfied teachers indicated they would stay in the field as long as they were able
to, whereas zero percent of the dissatisfied teachers indicated they would stay as
long as they could. Sixteen percent of the satisfied teachers indicated they planned
on staying in the field until they were eligible for benefits from the job. Eleven
percent of the dissatisfied teachers responded they would stay in the field until
they were eligible for benefits. Six percent of the teachers indicated they would
stay until a more desirable job came along, whereas 22% of the dissatisfied
teachers indicated they would stay in the field until a more desirable job came
along. Nineteen percent of the satisfied teachers indicated they were undecided as
to whether they would remain in teaching, whereas 33% of the dissatisfied

64
teachers indicated they were undecided at the time of the study. Overall, 23% of
the participants were undecided as to whether they would remain in the field of
teaching. None of the satisfied teachers planned on definitely leaving the field,
whereas 22% of the dissatisfied teachers definitely planned on leaving the field.
Fifty-two percent of the satisfied teachers indicated they would stay as
long as possible. Sixteen percent of the satisfied teachers indicated they would
stay as long as it would take to receive retirement benefits. Nineteen percent of
the teachers indicated they were undecided as to whether they would stay in the
classroom or field of education. None of the satisfied teachers definitively
planned on leaving education. Dissatisfied teachers indicated different results
when surveyed.
None of the dissatisfied teachers planned on remaining in the field of
education, although 11% of the dissatisfied teachers planned on remaining in the
field until they could receive retirement or social security benefits. Twenty-two
percent of the dissatisfied teachers would leave if a more desirable job came
along. Twenty-two percent of the dissatisfied teachers definitively planned on
leaving the classroom. Thirty-three percent of the dissatisfied teachers were
undecided as to whether they would stay in the classroom or in the field of
education.
Summary
Tables 1 through 11 and Figure 1 give the reader concise, descriptive
summaries to the narratives on the findings to the research questions set forth in
this study. Seventy-eight percent of the 41 respondents to the Schools and

65
Staffing survey indicated strongly agree or somewhat agree to the question, “I am
generally satisfied with being a teacher at this school.” However, when looking at
first-choice factors that would increase satisfaction levels according to the number
of years in the classroom, the findings reveal differences among the subgroups.
The findings and conclusions to overall agreement to satisfaction, but differences
among the subgroups are discussed in the next chapter.

66
CHAPTER 5
SUMMARY, CONCLUSIONS, AND RECOMMENDATIONS
This chapter includes a brief review of what the literature indicates about
teacher satisfaction, a description of the participants, a brief review of the
methodology and analysis that were conducted, and finishes with conclusions that
can be drawn from the results of this study.
Although contemporary education is facing significant budget issues and
teacher cutbacks, the field of education continually explores the best options to
keep quality, effective teachers in the classroom. There is a large group of
teachers who continue to exit the field because of dissatisfaction towards their
jobs. Keeping satisfied, effective teachers in the classrooms has and will continue
to be a priority in the field of education.
Dissatisfied teachers are leaving for many reasons. Past research has found
there are intrinsic and extrinsic factors that influence the state of satisfaction
teachers feel toward their careers. Research indicates there are more than salary
issues, more than collegiality with staff, more than administrative support, and
more than being recognized for valued work. There are issues differing for so
many of our teachers that a continuous check is necessary with the ones who have
the most needs to be satisfied (Futernick, 2007). Research has also shown there
are effective methods to retain teachers. Induction and mentoring programs are
among those that have been found to be effective, but these programs are typically
meant to address beginning teachers. Other groups within the school are begin

67
ignored and need a voice to bring issues to the forefront to obtain the satisfaction
levels required to achieve the results all schools are looking to accomplish.
There is a push to support administrators to exit teachers who have not
been found to be effective in raising student achievement; however, whether a
teacher is able to stay in the schools should be left to administrative discretion.
Through evaluation and other methods, administrators have a significant impact
on keeping teachers in the schools. Bogler (2001) addressed the impact
administrators have on teachers in their schools, “The more the principal was
participatory in schools activities and development, the greater the job
satisfaction.” The principal is only one piece that can be truly influential in the
level of teacher satisfaction, but it is a significant influence.
On the federal platform teachers are being asked to indicate their
challenges and needs. The Schools and Staffing Survey is one survey that is
distributed at designated intervals to better understand the conditions and factors
that are influential to teachers in their profession. This study established the
questionnaire for the study based on a federally recognized survey and then
acclimated the questions to meet the needs of specific research questions.
Although this work can be used to further the understanding as a whole in the area
of teacher satisfaction, the real use can be found by giving back the data to the
administrators and district level administrators who make decisions for these
specific teachers.
Research has shown there are many variables that impact satisfaction
levels, but this study acted to intentionally ask what would change satisfaction

68
levels as opposed to replicating characteristics in a school with teachers who
exemplify a satisfied culture of educators. At the local level, school districts are
establishing teacher mentoring programs to help teachers acclimate to their new
worlds as well as new teacher programs to assist teachers in acclimating to their
new surroundings. These programs have been shown through research to be
helpful, but they do not address other niches of teachers who are dissatisfied with
their work. More is still needed to address the other teachers who are finding
dissatisfaction in their careers.
This research topic was chosen to address specific issues that have the
potential to be the most influential components to the low retention and high
attrition level that has been occurring in the educational system in the United
States. One of the main reasons why teachers leave the field is job satisfaction
(Ingersoll, 2001). There are many facets of the retention and attrition problem,
teacher satisfaction as one of the most significant. Based on a comprehensive
literature review this research focuses on whole-group responses compared to
subgroup responses, as well as administrative influence, as main factors that
influence teacher satisfaction levels.
Summary
The purpose of this study was to collect data that would lead to a better
understanding of the factors affecting the satisfaction levels of teachers.
Specifically, this study set out to find the factors that are most influential in the
eyes of the participants to increase their level of satisfaction as well as to
understand the relationship between teacher satisfaction and school leadership.
69
Increased job satisfaction leads to teacher retention, keeping quality teachers in
the classroom (Protheroe, Lewis, & Paik, 2002).
Forty-one teachers from two school districts in the greater Phoenix,
Arizona region completed an online survey based on the Schools and Staffing
Survey to determine their current state of satisfaction towards their jobs and to
determine factors they indicated as being factors that would directly impact their
level of satisfaction towards their job as a teacher in the field of education.
Teachers worked within two kindergarten through eighth grade school districts
that have greater than 85% of their students receiving free or reduced lunch from
the federal government. Responses from participants were analyzed as whole
group responses and disaggregated by the characteristics indicated by the
participants in the survey.
Discussion of Findings
The first research question looked at the current state of satisfaction of
participants in this study? To determine the overall level of satisfaction of the
participants in this study, descriptive statistics were completed. Data indicated
78% of all the participants were satisfied with their jobs, consistent with previous
research data.
The second research question, “Do teachers of different subgroups (years
of experience, level of education, gender, age, type of certification, grade level)
indicate differing levels of satisfaction when compared to one another or to the
group of participants as a whole?” was analyzed through the SPSS data package.

70
Data indicated that different perspectives could be taken when viewing data from
a whole group perspective to a subgroup perspective.
Whole group satisfaction levels were compared to subgroup satisfaction
levels. Satisfaction levels seemed to significantly decline in the upper grades.
Teachers in younger grades indicated greater satisfaction levels than teachers in
the older grades. Consistent with previous research, satisfaction levels seemed to
decline as teachers continued with their careers. The data reflected research
completed by Doan and Peters (2009). Beginning teachers may be leaving early in
their careers, but there are other subgroups that have needs to be met. Teachers
with six or more years of classroom experience faced frustrations, questioned
their career choices, and looked for growth opportunities outside of the
profession. A greater percentage of females seemed more satisfied than males.
Little difference in satisfaction was reported between teachers who followed
different paths to teaching certification. Satisfaction levels seemed to decline the
more years a teacher had been in the classroom, declines that are inconsistent with
previous research done by Craig Mertler (2001) who found 26 to 30 year old
teachers and 56 years of age and older to report the highest levels of satisfaction.
Teachers who teach in the same state they are from report higher levels (100%) to
teachers who are teaching in a state they are not from (70%).
Data can be deceiving if not thoroughly examined. Simply looking at the
total satisfaction levels of participants does not necessarily draw the same picture.
Conclusions from this study seem to indicate there were different issues occurring

71
in the schools surveyed. By looking at subgroups, it is possible to focus
specifically on groups who are more dissatisfied than others.
The third research question, “Do teachers of specific subgroups (years of
experience, level of education, gender, age, type of certification, grade level)
report the same or differing factors that would directly increase their level of
satisfaction towards their teaching?” was also analyzed through the SPSS
statistical package. Whole group responses indicated salary, class size, and
administrative support being the most influential. Salary as the main factor to
increase satisfaction levels was inconsistent with various past studies. Klecker and
Loadman (1997) reported from their study that salary alone was not enough to
alter the satisfaction level of participants. Researchers found no statistical
difference between job satisfaction levels in relation to salary, fringe benefits,
working conditions, and interactions with students. Data were found consistent
with the other research. Inman and Marlow (2004) reported from their work that
salary was the only external factor indicated as a reason to stay in the profession
for the beginning teachers. Although when data were viewed by subgroup, there
were similarities in the needs of all participants, as each subgroup indicated
different factors that would increase their level of satisfaction the most. Results
follow the previous research that an increase in salary will not solely raise a
teacher’s level of satisfaction towards their job.
Results of this study may also indicate that needs change depending on the
characteristics the teachers hold. For example, teachers in their first five years of
teaching indicate administrative support, salary, and class size as the factors

72
which would most influence their level of satisfaction, whereas teachers who have
been in the classroom for 21 to 15 years indicate a reduction in class size and
administrative support being the sole factors that would increase their level of
satisfaction towards their position.
Males and females also reported different needs and factors that would
increase their level of satisfaction towards their jobs. Salary was the first factor
that females indicated as the most influential, whereas males reported
administrative support as their most influential factor. Differences were also
found when data was broken down by grade level. Class size was the most
important factor for kindergarten through fourth grade teachers, whereas seventh
and eighth grade teachers indicated administrative support as their number one
factor to increase their level of satisfaction. The differences in needs according to
the age of the teacher and years of experience seemed to indicate there are
different needs dependent on the teachers being surveyed.
The pathway to certification was also compared to the whole group
responses. Teachers who were teaching in the state they were from reported salary
as the most influential factor to increase their level of satisfaction, whereas
teachers not from the state they were teaching reported administrative support as
their most important factor to increase their level of satisfaction towards their job.
The fourth research question asked, How do teachers view their
administration? To answer this research question, participants were asked to
respond to questions that related to the principal or leadership of the school and
their belief towards their leadership. Again, whole group responses were

73
compared to the reporting of the teachers when viewed through the various
subgroups they were a part of. The four survey questions that related to school
leadership were as follows.
1. The school administration’s behavior toward the staff is supportive
and encouraging.
2. My principal enforces school rules for student conduct and backs
me up when I need it.
3. The principal knows what kind of school he or she wants and has
communicated it to the staff.
4. In this school, staff members are recognized for a job well done.
When evaluating the responses concerning leadership questions by years
of experience, teachers in the first five years of teaching indicated significantly
higher ratings than all other teachers. For the subgroup “gender,” females reported
positive ratings compared to the males in the study for all leadership questions
except the first question, “The school administration’s behavior toward the staff is
supportive and encouraging.”
Data from this study indicated that responses of teachers in the
kindergarten through fourth grades were stronger to statements related to the
principal or leadership of the school than the other two subgroups containing the
fifth through eighth grade teachers. For the administrative question number one,
“The school administration’s behavior toward the staff is supportive and
encouraging,” participants when viewed as a whole group reported a 75% belief
rating. When broken down further, kindergarten through fourth grade teachers had

74
the highest approval rating when compared to the fifth, sixth, and seventh, and
eighth grade teachers. Data indicated teachers in the earlier grades were more
satisfied than teacher in the older grades. For all four of the leadership questions,
teachers who were from a different state than the one in which they were teaching
indicated more positive feedback concerning the leadership in their schools.
The fifth research question asked, Do satisfied teachers indicate the same
needs as dissatisfied teachers? To accomplish this task, the needs of each group
has to be known. Satisfied teachers indicate a reduction in class size as the factors
which would increase their level of satisfaction the most whereas dissatisfied
teachers indicate discipline and administrative support are the most influential
factors which would increase their level of satisfaction the most. This finding was
also evident when a regression was conducted on administration and teachers’
beliefs about involvement. Results from the linear regression indicated that the
more teachers felt their administration were supportive and involved, the greater
the level of satisfaction they reported.
From investigating the differences between satisfied and dissatisfied
teachers one would assume dissatisfied teachers are looking to leave the
classroom. Over half of the teachers who indicated they were satisfied as teachers
would stay in the classroom as long as they can, zero percent of dissatisfied
teachers indicated they would stay as long as possible. Five percent of dissatisfied
teachers definitely plan to leave the classroom. Nineteen percent of satisfied
indicated they are undecided as to whether they would stay in the classroom.
Similarly, 23% of dissatisfied teachers (roughly the same percentage as satisfied

75
teachers) indicated they are undecided if they would stay in the classroom. For the
purposes of this study, 78% of the teachers in this study were satisfied, meaning
there are actually more satisfied teachers, 6 at risk of leaving the field than there
are dissatisfied teachers, two. In total, 20% of the teachers in this study are at risk
of being lost to another field or job.
Conclusions
Conclusions from this study can be drawn for all research questions. The
initial purpose of this study was to discern the total level of satisfaction of the
participants in this study. Seventy-eight percent of teachers are satisfied with their
jobs, leaving 22% of teachers dissatisfied. In the case of this study, 22% or 9
teachers are dissatisfied.
Concerning subgroups, data indicates group responses are slightly or even
significantly different when viewed as subgroups. It appears that looking
specifically at subgroups can reveal other perspectives to assess and make
changes in policy and procedures to enhance the level of satisfaction of teachers.
Administrators who have more on their plate than can be handled at times can
utilize research to address hidden groups who may be experiencing high levels of
dissatisfaction than others in the school. Specifically, for all survey questions in
this study, teachers of kindergarten through the fourth grade are more satisfied
than teachers in the older grades. From a professional developmental standpoint,
an administrator might see they are more confident in content and style of
teachers of younger students, but may need to develop greater levels of skills to
address the needs of older teachers. School leaders may also see there is a need to
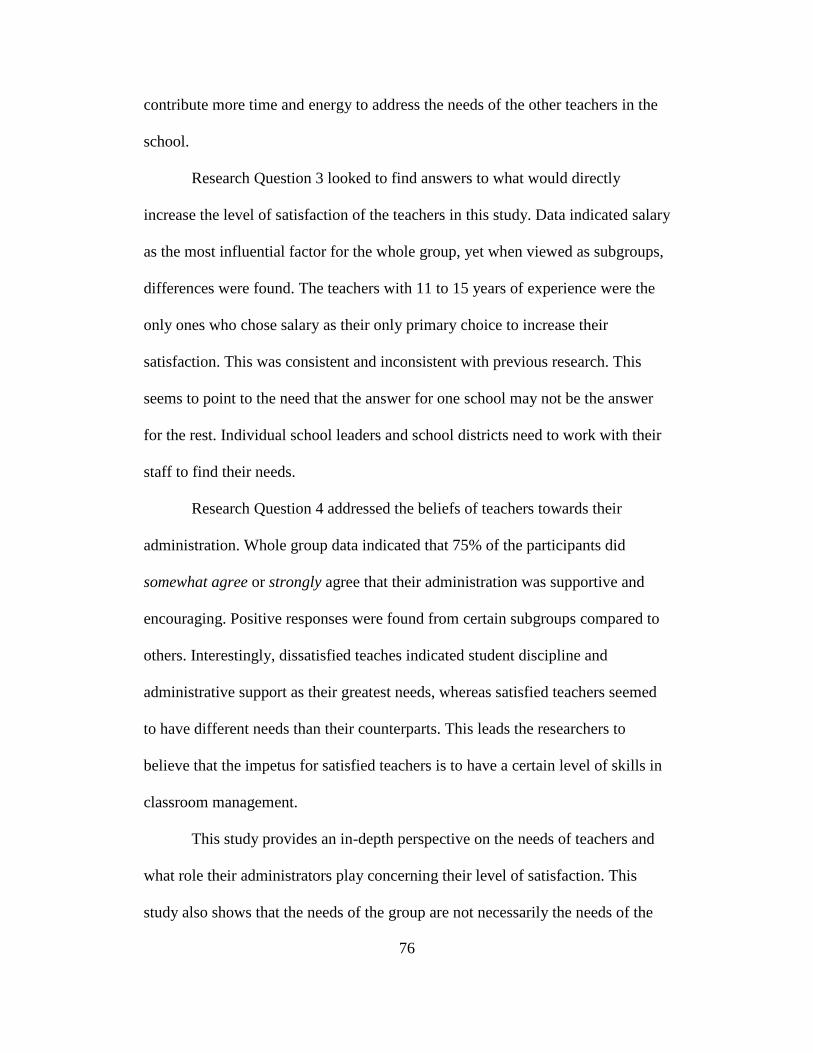
76
contribute more time and energy to address the needs of the other teachers in the
school.
Research Question 3 looked to find answers to what would directly
increase the level of satisfaction of the teachers in this study. Data indicated salary
as the most influential factor for the whole group, yet when viewed as subgroups,
differences were found. The teachers with 11 to 15 years of experience were the
only ones who chose salary as their only primary choice to increase their
satisfaction. This was consistent and inconsistent with previous research. This
seems to point to the need that the answer for one school may not be the answer
for the rest. Individual school leaders and school districts need to work with their
staff to find their needs.
Research Question 4 addressed the beliefs of teachers towards their
administration. Whole group data indicated that 75% of the participants did
somewhat agree or strongly agree that their administration was supportive and
encouraging. Positive responses were found from certain subgroups compared to
others. Interestingly, dissatisfied teaches indicated student discipline and
administrative support as their greatest needs, whereas satisfied teachers seemed
to have different needs than their counterparts. This leads the researchers to
believe that the impetus for satisfied teachers is to have a certain level of skills in
classroom management.
This study provides an in-depth perspective on the needs of teachers and
what role their administrators play concerning their level of satisfaction. This
study also shows that the needs of the group are not necessarily the needs of the

77
individuals. For teacher attrition rates to be effected, teachers need to be kept in
contact and continually asked what they need to stay motivated and effective. It is
vital we understand these needs in order to continually gather information that
will increase the level of satisfaction of the teachers in our schools. There are
significant effects that occur as a result of job satisfaction. In their work on
teacher satisfaction, Protheroes, Lewis, and Paik (2002) state that increased
satisfaction levels equate to higher retention levels and better quality teachers in
the classroom.
Recommendations
From this research, there was a certain level of understanding of the
teachers who participated in this study. This study accomplished its goal of asking
teachers to find their voice as to what their needs are as teachers and being a part
of the educational system. Previous research indicated many needs and many of
those needs were different than what other research has indicated. There was
much learned from this study, but the lesson which stood out the most was the
need to ask all teachers what is important to them.
• Each school in each district is unique and should be treated as such.
School leadership should ask and ask consistently what the needs of their
teachers are and what can be done to address their needs.
• Utilize data as parameters for hiring of new teachers.
• Focus in on specific subgroups as to change the satisfaction of the teachers
in their schools.

78
• Work individually with school and district leaders to investigate the needs
of their teachers.
The purpose of this research was to show that data viewed from a whole
group perspective does not equate to the same findings as when they are viewed
from a subgroup perspective. To truly understand the staff of a school, the
individual differences of the staff need to be taken into consideration. To view the
staff as a whole may discredit the needs of the individual. In addition, there are
many advantages to learning and coming to understand staff needs by subgroups
as opposed to viewing them as a whole.
Some of the advantages to studying teachers as part of groups can indicate
to the administrative staff how to address specific issues in the school. In addition,
learning the needs of teachers by subgroups can be used for information during
the hiring process. To know teachers who have taught for a specific numbers of
years and are more likely to stay in the school can provide insight when one is
considering a position between two candidates, as to who will be a more positive
candidate for the staff of the school.
Finally, this research addresses the need to blend research and common
practices. Research is vital, but research is only a piece of the puzzle to truly
address the needs of teachers. To truly use the information past researchers have
discovered, the individuals who are using the work, has to use the information in
accordance with the staff being addressed. By asking the individuals who are in
need of assistance, there is knowledge being acquired that cannot be found by
asking others.
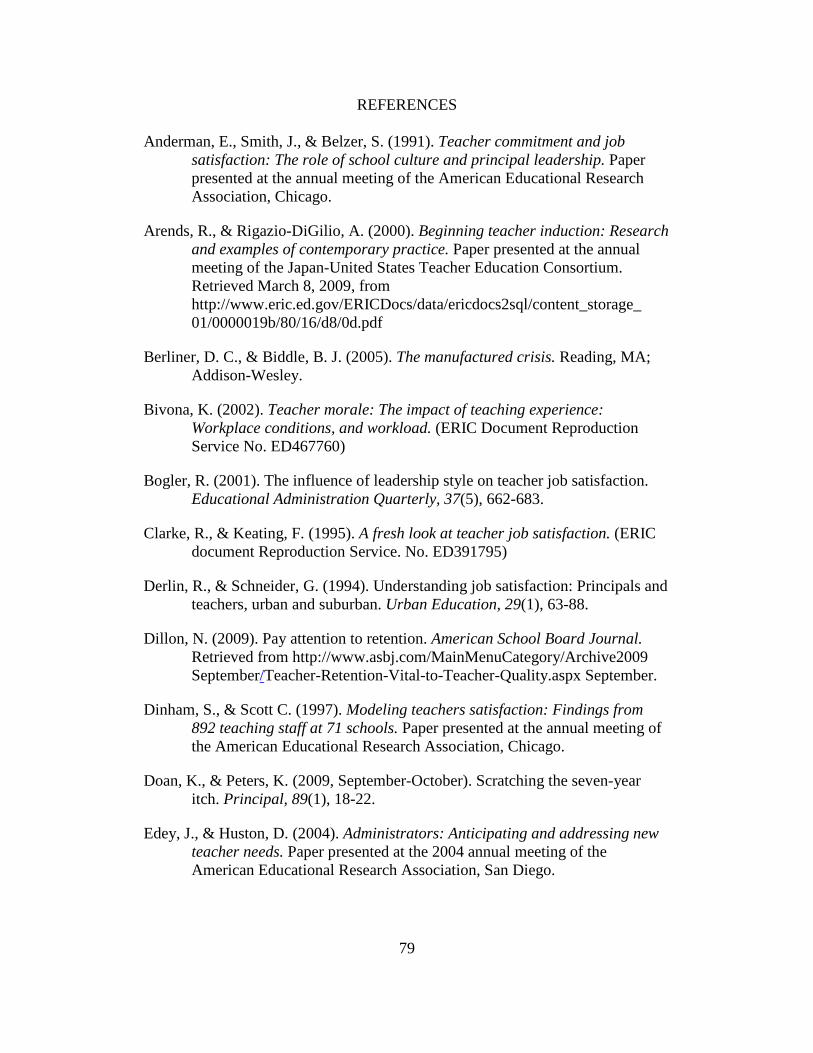
79
REFERENCES
Anderman, E., Smith, J., & Belzer, S. (1991). Teacher commitment and job satisfaction: The role of school culture and principal leadership. Paper presented at the annual meeting of the American Educational Research Association, Chicago.
Arends, R., & Rigazio-DiGilio, A. (2000). Beginning teacher induction: Research and examples of contemporary practice. Paper presented at the annual meeting of the Japan-United States Teacher Education Consortium. Retrieved March 8, 2009, from http://www.eric.ed.gov/ERICDocs/data/ericdocs2sql/content_storage_ 01/0000019b/80/16/d8/0d.pdf
Berliner, D. C., & Biddle, B. J. (2005). The manufactured crisis. Reading, MA; Addison-Wesley.
Bivona, K. (2002). Teacher morale: The impact of teaching experience: Workplace conditions, and workload. (ERIC Document Reproduction Service No. ED467760)
Bogler, R. (2001). The influence of leadership style on teacher job satisfaction. Educational Administration Quarterly, 37(5), 662-683.
Clarke, R., & Keating, F. (1995). A fresh look at teacher job satisfaction. (ERIC document Reproduction Service. No. ED391795)
Derlin, R., & Schneider, G. (1994). Understanding job satisfaction: Principals and teachers, urban and suburban. Urban Education, 29(1), 63-88.
Dillon, N. (2009). Pay attention to retention. American School Board Journal. Retrieved from http://www.asbj.com/MainMenuCategory/Archive2009 September/Teacher-Retention-Vital-to-Teacher-Quality.aspx September.
Dinham, S., & Scott C. (1997). Modeling teachers satisfaction: Findings from 892 teaching staff at 71 schools. Paper presented at the annual meeting of the American Educational Research Association, Chicago.
Doan, K., & Peters, K. (2009, September-October). Scratching the seven-year itch. Principal, 89(1), 18-22.
Edey, J., & Huston, D. (2004). Administrators: Anticipating and addressing new teacher needs. Paper presented at the 2004 annual meeting of the American Educational Research Association, San Diego.

80
Farber, B. (1982). Stress and burnout: Implications for teacher motivation. Paper presented at the annual meeting of the American Educational Research Association, New York.
Futernick, K. (2007). A possible dream: Retaining California teachers so all students can learn. Sacramento: California State University.
Houchins, D., Shippen, M., & Cattret, J. (2004). The retention and attrition of juvenile justice teachers. Education and Treatment of Children, 27(4), 374-393.
Ingersoll, R. M. (1997). The status of teaching as a profession: 1990-91 (NCES 97-104). Washington, DC: U.S. Department of Education.
Ingersoll, R. (2001). Teacher turnover, teacher shortages, and the organization of schools. Seattle, WA: University of Washington, Center for the Study of Teaching and Policy.
Ingersoll, R., & Smith, T. (2003). The wrong solution to the teacher shortage. Educational Leadership, 60(8), 30-33.
Inman, D., & Marlow, L. (2004, summer) Teacher retention: Why do beginning teachers remain in the profession? Education, 124(4), 605-614.
Kim, I., & Loadman, W. (1994). Predicting teacher job satisfaction. Columbus, OH: Ohio State University. (ERIC Document Reproduction Service No. ED383707)
Klecker, B., & Loadman, W. E. (1997). Exploring teacher job satisfaction across years of teaching experience. Paper presented at the annual meeting of the Mid-Western Educational Research Association, Chicago, IL. (ERIC Document Reproduction Service No. ED413316)
Loeb, S., Darling-Hammond, L., & Luczak, J. (2005). How teaching conditions predict teacher turnover in California schools. Peabody Journal of Education, 80(3), 44-70.
McIntyre, Thomas. (1982). Factors related to burnout: A review of research. (ERIC Document Reproduction Number ED218908)
MetLife. (2010). The MetLife Survey of the American teacher: Collaborating for student success. Retrieved from http://www.metlife.com/about/corporate-profile/citizenship/metlife-foundation/metlife-survey-of-the-american-teacher.html
Mertler, Craig A. (2001, October 24-27). Teacher motivation and job satisfaction in the new millennium (2001-10-01 Reports Research 143

81
Speeches/Meeting Papers 150). Paper presented at the annual meeting of the Mid-Western Educational Research Association, Chicago, IL.
Mertler, C. (2002, fall). Job Satisfaction and perception and motivation among middle and high school teachers. American Secondary Education, 31(1), 43-53.
Millicent, A., & Sewell, J. (1999, May-June). Stress and burnout in rural and urban secondary school teachers. The Journal of Educational Research, 92(5), 287-293.
A Nation at risk. (1983, April). [archived information] Retrieved from http://www.ed.gov/pubs/NatAtRisk/risk.html.
National Center for Education Statistics. (1997). Job satisfaction among America’s teachers: Effect of workplace conditions, background, characteristics, and teacher compensation. Washington DC: U.S. Department of Education.
National Center for Education Statistics (2010, May 27). Condition of education (Congressionally mandated report). Retrieved from http://nces.ed.gov/programs/coe/list/sa_list.asp
National Center for Education Statistics. (2010, updated). Schools and staffing survey (SASS). Retrieved from http://nces.ed.gov/surveys/sass/
National Commission on Teaching and America’s Future. (2009). Policy brief: The high cost of teacher turnover. Retrieved from http://www.nctaf.org/resources/research_and_reports/nctaf_research_reports/documents/NCTAF/CostofTeacherTurnover.pdf
National Council for Excellence in Education. (1983). A nation at risk: The imperative for education reform. Washington, DC: U.S. Department of Education.
Papin, L. (2005). Teacher retention and satisfaction among inner-city educators. Doctoral dissertation, Arizona State University, Tempe, Arizona.
Perrachione, B. A., Rosser, V. J., & Petersen, G. J. (2008). Why do they stay? Elementary teachers’ perceptions of job satisfaction and retention. The Professional Educator, 32(2), 1-18.
Protheroe, N., Lewis, A., & Paik, S. (2002). Promoting teacher quality. Retrieved January 18, 2003, from www.ers.org/spectrum/win02a/htm.
Richards, J, (2003, April 21-25). Principal behaviors that encourage teachers: Perceptions of teachers in their 2nd to 5th year of teaching. Paper

82
presented at the annual meeting of the American Educational Research Association, Chicago, Illinois.
Rinehart, J., & Short, P. (1993). Job satisfaction and empowerment among teacher leaders, reading recovery teachers, and regular classroom teachers. Education, 114(4), 570-561.
Robinson, S, (1998). Diversifying supervision for maximum professional growth. Is a well-supervised teacher a satisfied teacher? Paper presented at the annual meeting of the Mid-south Educational Research Association, New Orleans.
Spencer, Dee Ann. (1997). Teaching as women’s work. In Bruce Biddle, Thomas Good, & Ivor F. Goodson (Eds.), International handbook of teachers and teaching. Dordrecht: Kluwer Academic Publishers.
Spencer, Dee Ann. (2001). Teacher’s work in historical and social context. In Virginia Richardson (Ed.), The handbook of research on teaching (4th ed.). Washington DC: American Education Research Association.
StateUniversity.Com. (n.d.). School reform—A nation at risk, reform in action, greater goals, better teachers and more accountability. Retrieved from http://education.stateuniversity.com/pages/2400/School-Reform.html.
UCLA Center for Mental Health in Schools. (1998). Understanding and minimizing staff burnout (an introductory packet). Los Angeles, CA: Center for Mental Health in Schools, Sponsored Center’s Clearinghouse.

83
APPENDIX A
SCHOOLS AND STAFFING SURVEY

84
1. Which grade level do you currently teach? If you teach a split class of more than one grade level, please check the oldest grade level.
O Kindergarten O 5th O 10th O 1st O 6th O 11th O 2nd O 7th O 12th
O 3rd O 8th O 4th O 9th 2. During your most recent FULL WEEK of teaching at your school, what is the total number of students enrolled in your class? O 0-10 O 41-80 O 11-20 O 81-120 O 21-30 O 121-160
O 31-40 3. Did you enter teaching through an alternative certification program? (An alternative program is a program that was designed to expedite the transition of non-teachers to a teaching career, for example, a state, district, or university alternative certification program.) O YES O NO 4. This school year, are you a Highly Qualified Teacher (HQT) according to your state’s requirements? (Generally, to be Highly Qualified, teachers must requirements related to 1) a bachelor’s degree, (2) full state certification, and 3) demonstrated competency in the subject area(s) taught. The HQT requirement is a provision under No Child Left Behind (NCLB). O YES O NO 5. In the past 12 months, have you participated in any professional developmental activities specific to and concentrating on the content of the subject(s) you teach? O YES O NO

85
6. Overall, how useful were these activities to you? O Not useful O Somewhat useful O Useful
O Very useful O not applicable 7. In the past 12 months, have you participated in any professional development activities that focused on student discipline and management in the classroom? O YES O NO 8. Overall, how useful were these activities to you? O Not useful O Somewhat useful O Useful
O Very useful O not applicable 9. In the past 12 months, have you participated in any professional development on how to teach students with disabilities? O YES O NO 10. Overall, how useful were these activities to you? O Not useful O Somewhat useful O Useful
O Very useful O not applicable
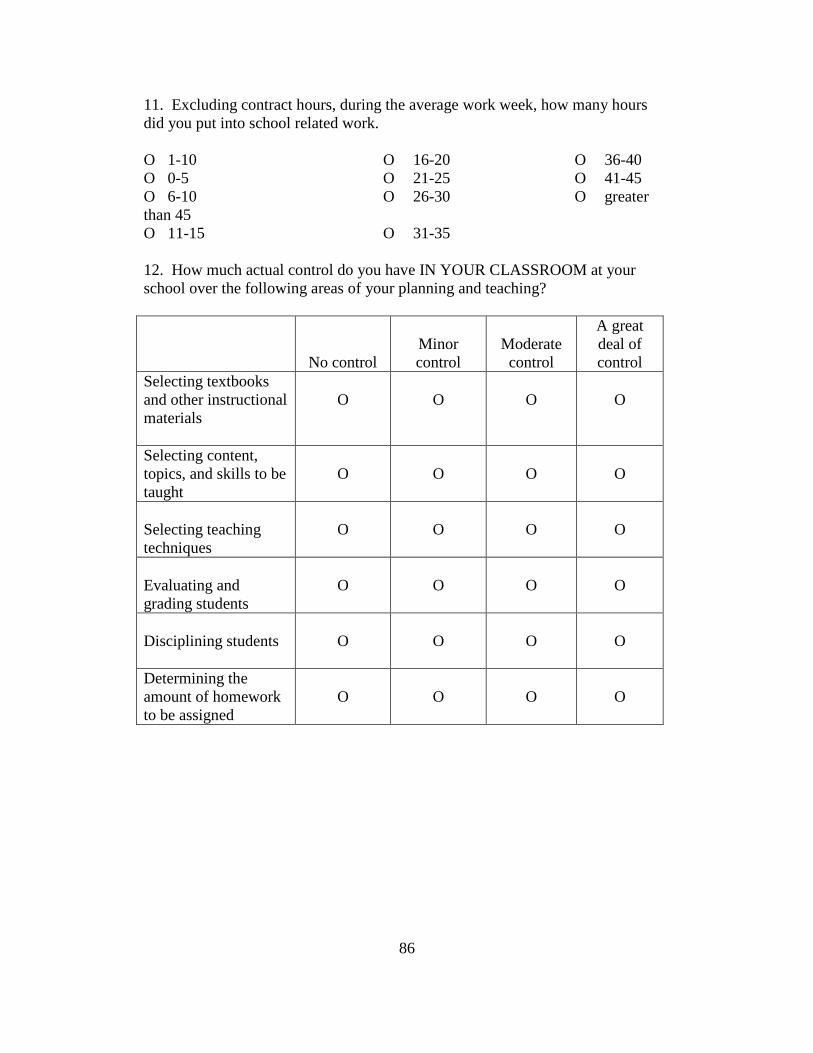
86
11. Excluding contract hours, during the average work week, how many hours did you put into school related work. O 1-10 O 16-20 O 36-40 O 0-5 O 21-25 O 41-45 O 6-10 O 26-30 O greater than 45
O 11-15 O 31-35 12. How much actual control do you have IN YOUR CLASSROOM at your school over the following areas of your planning and teaching?
No control
Minor control
Moderate control
A great deal of control
Selecting textbooks and other instructional materials
O
O
O
O
Selecting content, topics, and skills to be taught
O
O
O
O
Selecting teaching techniques
O
O
O
O
Evaluating and grading students
O
O
O
O
Disciplining students
O
O
O
O
Determining the amount of homework to be assigned
O
O
O
O

87
13. To what extent do you agree or disagree with each of the following statements?
Strongly agree
Somewhat
agree
Somewhat disagree
Strongly disagree
The school administration’s behavior toward the staff is supportive and encouraging.
O
O
O
O
I am satisfied with my teaching salary.
O
O
O
O
The level of student misbehavior in this school (such as noise, horseplay or fighting in the halls, cafeteria, or student lounge) interferes with my teaching.
O
O
O
O
I receive a great deal of support from parents for the work I do.
O
O
O
O
Necessary materials such as textbooks, supplies, and copy machines are available as needed by the staff.
O
O
O
O
Routine duties and paperwork interfere with my job of teaching.
O
O
O
O
My principal enforces school rules for student conduct and backs me up when I need it.
O
O
O
O
Rules for student behavior are consistently enforced by teachers in this school, even for students who are not in their classes.
O
O
O
O

88
Most of my colleagues share my beliefs and values about what the central mission of the school should be.
O
O
O
O
The principal knows what kind of school he or she wants and has communicated it to the staff.
O
O
O
O
There is a great deal of cooperative effort among the staff members.
O
O
O
O
In this school, staff members are recognized for a job well done.
O
O
O
O
I worry about the security of my job because of the performance of my students on state and/or local tests.
O
O
O
O
State or district content standards have a positive influence on my satisfaction with teaching.
O
O
O
O
I am given the support I need to teach students with special needs.
O
O
O
O
The amount of student tardiness and class cutting in this school interferes with my teaching.
O
O
O
O
I am generally satisfied with being a teacher at this school.
O
O
O
O

89
14. To what extent do you agree or disagree with each of the following statements?
Strongly agree
Somewhat
agree
Somewhat disagree
Strongly disagree
The stress and disappointments involved in teaching at this school aren’t really worth it.
O
O
O
O
I like the way things are run at this school.
O
O
O
O
Think about transferring to another school.
O
O
O
O
15. How long do you plan to remain in teaching? O As long as I am able O Until I am eligible for retirement benefits from this job O Until I am eligible for retirement benefits from a previous job
O Until I am eligible for Social Security benefits O Until a specific life event occurs (e.g., parenthood, marriage) O Until a more desirable job opportunity comes along O Definitely plan to leave as soon as I can O Undecided at this time 16. Has a student ever threatened to injure you? O YES O NO 17. DURING THE CURRENT SCHOOL YEAR, do you, or will you, earn additional compensation from working in any job OUTSIDE this school system? O YES O NO 18. As a whole, are you satisfied as a teacher? O YES O NO

90
19. Which variable would increase your current level of satisfaction the most? O Student Discipline O Reduction of the number of students in your classes O Supportive Administration
O A 10% salary increase O School conditions/resources O Higher quality of professional development 20. Are you male or female? O Male O Female 21. What is your race/nationality? O White O Black or African-American O Asian
O Native Hawaiian or Other Pacific Islander O American Indian or Alaska Native O Hispanic 22. Are you from the state you are currently working in? O YES O NO 23. How many years have you taught? O 1-5 O 6-10 O 11-15
O 16-20 O 21-25

91
APPENDIX B
EMAIL TO PARTICIPANTS

92

93