10 Strategic 'Must Make' Decisions Affecting You and Your ...

Factors Affecting Hedging Decisions Using Evidence
from the Cotton Industry
byOlga Isengildina and M. Darren Hudson
Suggested citation format:
Isengildina, O., and M. D. Hudson. 2001. “Factors Affecting Hedging Decisions Using Evidence from the Cotton Industry.” Proceedings of the NCR-134 Conference on Applied Commodity Price Analysis, Forecasting,and Market Risk Management. St. Louis, MO. [http://www.farmdoc.uiuc.edu/nccc134].

Factors Affecting Hedging Decisions
Using Evidence from the Cotton Industry
Olga Isengildina
and
M. Darren Hudson*
Paper presented at the NCR-134 Conference on Applied Commodity PriceAnalysis, Forecasting, and Market Risk Management
St. Louis, Missouri, April 23-24, 2001
Copyright 2001 by Olga Isengildina and M. Darren Hudson. All rights reserved.Readers may make verbatim copies of this document for non-commercial
purposes by any means, provided that this copyright notice appears on all such copies.
*Post Doctoral Associate ([email protected]), Department of Agricultural andApplied Economics, University of Georgia, and Assistant Professor([email protected]), Department of Agricultural Economics, Mississippi StateUniversity

1
Factors Affecting Hedging DecisionsUsing Evidence from the Cotton Industry
Practitioner’s Abstract
Few farmers utilize futures and options markets to price their crops despite significanteducational efforts. This study seeks to analyze producer hedging behavior within theframework of the overall marketing behavior. Producer marketing behavior is modeled as asimultaneous choice between cash sales, cooperative marketing and forward contracts, andhedging. A multinomial logit model is used for empirical estimation using data from a surveyadministered to a sample of cotton producers from across the U.S. The most important factorsthat explain the use of forward pricing by cotton producers are producer preferences, farmsize, use of crop insurance, risk aversion, income from government payments and off-farmincome. Risk aversion, off-farm income, crop insurance and some producer perceptions areimportant in the choice of the form of forward pricing (direct hedging vs. cooperativemarketing and forward contracts).
Keywords
Hedging behavior, futures hedging, indirect hedging, cotton marketing, multinomial logitmodel, marketing strategies
Introduction
U.S. farm commodity programs shifted course with the passage of the 1996 FederalAgriculture Improvement and Reform (FAIR) Act. The FAIR Act decreased much of thegovernment’s price support and exposed producers to a potentially greater degree of price riskthan previously experienced. In the new risk management environment, Congress perceived aneed to educate producers about various risk management tools. In 1998, the RiskManagement Agency (RMA) funded over $3 million in educational grants to assist farmers andranchers in becoming active risk managers (Ag. Fact Book, 1998). Despite significant effortsto educate farmers about risk management tools, few producers use these tools. Some recentsurveys (Asplund, Forster, and Stout, 1989; and Goodwin and Schroeder, 1994) demonstratedthat less than 10 percent of producers use hedging to manage their price risk (Table 1).
Previous studies outlined a number of factors that affect producers’ hedging decisions.However, one limitation of the previous studies is that hedging was typically viewed in relativeisolation and no account was taken of other marketing alternatives available to producers. Thatis, previous hedging studies typically viewed marketing as a dichotomy between cash sales andhedging with no consideration of alternative marketing methods. However, importantcountervailing forces may exist that affect the choice of a particular marketing strategy. Thatis, it may be argued that the choice of marketing strategy is not limited to the choice between

2
cash sales and forward pricing, but also includes the choice of the form in which forwardpricing may take place. Producers may have significant motivations to use forward pricing.However, hedging with futures and options is not the only method of forward pricing. Otherforms of forward pricing include forward contracting and marketing through pools.Substitution between alternative means of forward pricing may result in the lower use ofhedging. Thus, it appears that the inclusion of the alternative marketing strategies may provideadditional insight on producer hedging behavior.
The overall objective of this study is 1) to examine producer hedging behavior in theframework of their overall marketing behavior, 2) to determine the motivating factors in thechoice of a primary marketing strategy by cotton producers, and 3) to identify thecharacteristics of cotton producers that are more likely to use direct hedging to forward pricetheir crop. Marketing alternatives considered in this study include cash sales, indirect hedgingand direct hedging. Cash sales consist of the transactions made in the cash market. Indirecthedging combines marketing through pools (cooperative marketing) and forward contracting.And direct hedging includes taking positions in the futures and/or options markets.
The remainder of the paper is organized as follows. The next section contains theconceptual framework, which includes the discussion of various marketing alternativesavailable to farmers, and factors that affect their marketing behavior. The research methodused to analyze producer marketing behavior is addressed in the following section. Discussionof the data includes empirical evidence on the use of various marketing strategies based on theresults of the producer survey conducted throughout cotton producing states. Finally, thispaper presents the results of the analysis and concludes with possible implications andsuggestions for future research.
Conceptual Framework
This study examines producer marketing behavior as producer’s choice of a preferredmarketing alternative, which is based on a set of producer characteristics:
Choice = f (Education, Training, RiskAversion, Leverage, (1) Size, GovPayments, OffIncome, CrInsurance, Attitude1, Attitude2, Attitude3)
The dependent variable in this choice model reflects several marketing alternatives consideredin this analysis: cash sales, cooperative marketing and forward pricing, and direct hedging.Selling a crop in the cash market is the most basic marketing tool available to farmers. Thisstrategy is easy to use for producers and has significant liquidity advantages because theproducer receives cash for his crop at the time of sale. However, marketing on a cash basis isoften considered a risky alternative because a producer does not have any control over themarket price and is fully exposed to market price changes that occur between the time ofplanting and sale. Alternatively, producers may use some form of forward pricing in order to

3
reduce their price risk exposure. Forms of forward pricing included in this analysis consist offorward contracting and marketing through pools (cooperatives) and hedging in the futures andoptions markets. Historically, these have been the most widely used forward pricing strategies;therefore, they should be representative of the marketing alternatives available to cottonproducers.
Explanatory variables hypothesized to influence the choice of a primary marketingstrategy may be summarized in three categories: (1) characteristics of the farm operator andthe farm: operator’s human capital, farm size and financial condition; (2) operator use ofalternative risk-reduction techniques: diversification of farm enterprises, participation ingovernment commodity programs, and the use of crop insurance; and (3) non-economicfactors. The first set of determinants was advanced by the proponents of the technologyadoption literature (Wozniak, 1984; Huffman, 1980; and Khaldi, 1975). Adoption theory isrelevant for producer marketing decisions because the producer is faced with a choice ofwhether to use a conventional method of selling the crop in the cash market, or to adopt one ofthe alternative forward pricing techniques. Education and marketing-specific training are usedas a proxy for human capital and innovative ability/willingness to adopt alternative marketingmethods. Education and hours of marketing training are expected to be directly related to theuse of forward pricing strategies because higher levels of human capital are likely to facilitatesuccessful use of these instruments.
Level of risk aversion was included to measure the potential effects of different levelsof risk preference. The impact of risk aversion on the choice of marketing strategy depends onthe producer’s perception about the risk reducing qualities of this strategy. If forward pricingis expected to reduce risk, this variable will have a positive effect on the use of forward pricingtechniques. Similarly, if cash marketing is expected to increase risk, this variable will have anegative impact on the choice of cash sales.
Economies of size are often associated with forward pricing (Tronstad, 1991; Goodwinand Schroeder, 1994; Asplund, Forster, and Stout, 1989). Previous research suggests thatlearning about alternative marketing strategies have significant lumpy costs. Because largerfarms can spread these lumpy costs over more production and enjoy a potentially larger netprice enhancement per unit of production, they are more likely to use these alternativemarketing strategies. Similar arguments can be made regarding the use of futures and optionscontracts because such strategies may involve using particular equipment necessary to obtainmarket information, subscriptions to market information and market advisory services, andtransactions costs associated with trading activities. Additionally, some large farms oftenemploy hired labor, which means that managers may have more time to devote to themarketing function and combine both production and marketing duties (this factor isparticularly important for some labor intensive commodities, such as cotton). This variable isexpected to have a positive effect on the use of forward pricing, consistent with the economiesof size hypothesis.

4
Financial characteristics of the farm have also been shown to play a role in the use offorward pricing techniques. One of the most important components of the financialcharacteristics of the farm is leverage (Brorsen, 1995; Turvey and Baker, 1989; Collins,1997). This study uses long-term debt-to-asset ratio as a proxy for leverage. It is hypothesizedthat this is a more general measure of leverage because it excludes the short-term componentthat varies from year to year depending on the capital needs for operating expenses. Optimalhedge models suggest a positive impact of leverage on the use of forward pricing becauseforward pricing may provide an additional source of liquidity. However, Asplund, Forster,and Stout (1989) argue that leverage and forward pricing may be negatively correlated if afarm operator’s use of debt and leverage indicates his lack of risk aversion. This relationshipmay indicate producer’s lack of desire to reduce risk through forward pricing. This argumentcreates some ambiguity on the expected sign of leverage.
A second set of variables is included to reflect the interaction of marketing methodswith other factors that affect income risk. Forward pricing is not the only method of riskreduction. Alternative methods considered in this analysis include obtaining income from offfarm sources, participating in government commodity programs, and purchasing cropinsurance. If off-farm income is considered within the risk-balancing framework (Turvey,1989; Gabriel and Baker, 1980), it is expected to substitute for hedging. This propositionsuggests an inverse relationship between off-farm income and hedging. However, as Asplund,Forster, and Stout (1989) point out, off-farm work activities by farm family members may becomplementary to hedging if they are used as a response to income/price variability. In thiscase, the use of forward pricing and off-farm income may be positively correlated because bothwould be used as strategies to reduce risk.
Participation in government commodity programs is another alternative way to reducerisk exposure. The majority of the previous literature (Turvey and Baker, 1990; Sakong,Hayes, and Hallam, 1993; Hanson, Myers, and Hilker, 1999) suggest an inverse relationshipbetween government programs and forward pricing because government programs, in essence,provide a free put option for a producer. Other studies (Featherstone et al., 1988; Collins,1985; Gabriel and Baker, 1980) have analyzed the impact of government programs from therisk-balancing standpoint. These authors argued that risk reducing and income augmentingpolicies may induce choices that increase financial risk (i.e., higher leverage). If leverage isdirectly related to hedging (as suggested by Turvey and Baker, 1990; Collins, 1997; andBrorsen, 1995), these findings suggest an indirect positive effect of government payments onforward pricing. Thus, the total impact of government payments consists of a negative directimpact and a positive indirect impact. Because the magnitude of these effects is not known,the direction of the total impact is ambiguous.
Another alternative to minimize risk is crop insurance. The effects of the cropinsurance on forward pricing decisions have not been studied extensively. Coble, Heifner andZuniga (2000) observed that yield insurance products exhibit complementary relationship withhedging, while revenue insurance products act as substitutes to hedging at some levels of

5
coverage. Therefore, the direction of the impact of this variable is ambiguous because itdepends on the type of the insurance purchased and the level of coverage.
The third set of variables included in this analysis is non-economic variables. Thelimited significance of some previous empirical studies of hedging has led some authors(Musser, Patrick and Eckman, 1996) to suggest that there may be a large random componentassociated with forward pricing or some alternative non-economic explanation. Shapiro andBrorsen (1988) found that the most important factor related to hedging in their study wasfarmers perception of whether hedging can increase income stability. Furthermore, Penningsand Leuthold (2000) found that farmers’ behavioral attitudes related to market orientation, riskexposure, market performance, and entrepreneurial behavior played an important role in theiruse of futures contracts. Therefore, several variables measuring producer perceptions ofvarious marketing strategies were included in this analysis.
One of the non-economic variables included in this study reflected producer assessmentof their personal marketing skills. It is hypothesized that producers with perceived high levelof marketing abilities would be more comfortable using futures and options. A variablereflecting producer’s personal preferences for various marketing channels was also included inthis analysis. Finally, a variable intended to measure producer perceptions of marketefficiency was included. If producers believe that markets are efficient, there should be noconsistent premiums to market timing strategies. Otherwise, premiums would exist and act asan additional motivation to using forward pricing. These variables were introduced in the formof responses to Likert-scale questions. These responses were coded such that the strongestagreement received a highest value and strongest disagreement received a lowest value.
Empirical Model and Estimation Procedure
Because the choice of a primary marketing strategy is mostly discrete (as most farmersuse a single marketing channel), a multinomial logit model was used for estimation. Theestimated model had a following functional form:
Prob (Choice = j) = β0 + β1*Education + β2 *Training + (2)β3*RiskAversion + β4*Leverage + β5 * Size +β6 *GovPayments +β7 *OffIncome +β8 *CrInsurance +β9 *Attitude1 + β10 *Attitude2+ β11 *Attitude3 + ε
Where the choice parameter j is 0 if the majority of the crop was sold in the cash market, is1 ifmost of the crop was marketed through a pool or a forward contract, and equal 2 if most of thecrop was priced through futures and/or options markets.
Marketing through pools and forward contracting is combined in this analysis becausethese two strategies contain the features of indirect hedging. That is, when producers sell their

6
crop through pools or forward contracts, they do not directly take a position in thefutures/options markets. Rather, the other party that entered into this contractual agreementwith producer likely hedges this purchase and the producer thereby receives the benefits of thehedge indirectly. According to pool regulations and many forward contracts, a producer underthese arrangements is guaranteed a minimum price without forfeiting the opportunity to obtaina higher price, if it becomes available. Another reason for combining marketing through poolsand forward contracting is the statistical qualities of the model to be estimated. Within amultinomial logit model, the number of parameters proliferates with the number of choices(Greene, 1997). Therefore, similar strategies were combined to conserve degrees of freedom.
Taking a position in the futures and/or options markets is combined under a directhedging option because these tools, although different, have many similar characteristics. It isimportant to note that the direct hedging option included all positions taken by producers in thefutures and options markets, which include both hedging and speculation. No distinctionbetween hedging and speculation was made in this study. Independent variables included inthe empirical model are defined in Table 2.
The empirical model is estimated using a multinomial logit technique. The multinomiallogit model is a general extension of a binomial logit model because it permits estimation ofqualitative choice when more than two alternatives are involved. A general form of amultinomial logit model is given by:
∑=
==j
k
Zk
Zj
e
ejYiob
0
)(Pr (3)
Where there are J alternative choices, ij xZj 'β= , ik xZk 'β= (Greene, 1997). The model
estimates are used to determine the probability of choice j, given xi. Equation 3 is estimatedusing the maximum likelihood procedures, which yield consistent and efficient parameterestimators (Pindyck and Rubinfeld, 1991).
The model implies that J log-odds ratios can be computed:
EixP
Pkji
ik
ij +−+=
∑ )(ln ' ββα (4)
Where Pij is the probability that the ith cotton producer will choose a jth marketing strategy, lnPij/Pik is the natural log of the probability of choice j relative to the probability of choice k, αis the intercept, x is a matix of producer i’s characteristics, β is a matrix of parameters thatreflect the impact of changes in x on the probability of choosing jth or kth marketing strategy,and Ei is the normally distributed error term with its mean equal to zero. However, coefficientestimates of this model are difficult to interpret. Greene points out that there is at least somepotential for confusion, because for any particular xk, kj xP ∂∂ / need not have the same sign as
βjk, as can be seen from equation (3).
7
The marginal effects of the attributes on probabilities of choice are determined bydifferentiating equation 3:
[ ]ββββδ −=
−=
∂
∂= ∑
=jj
j
kkkjj
i
j
j PPPx
P
0
(5)
Therefore, every subvector of β enters every marginal effect, both through the probabilitiesand through the weighted average that appears in δj. These marginal effects are computedfrom the parameter estimates and used in the discussion of model results.
Data
The data for this study is obtained from a mail survey, which was administered duringthe spring and early summer of 2000 throughout the cotton growing states of the U.S. Thequestionnaire elicited cross sectional data for 1999 crop year. Respondents of the surveyrepresented a random sample of cotton producers in the respective states. The surveygenerated about seven percent response rate, which resulted in 108 usable observations. Thesurvey data were tested for a possible presence of the non-response bias using the “wave”technique (Ratneshwar and Stewart, 1989). Although no statistical evidence of the non-response bias in the sample was detected, the small sample size is a source of concern.
According to the survey data, in 1999, farm operations had an average of 1,459 acresof land, which included cotton as well as other enterprises. Producers owned about 38 percentof this farmland. These farm operations had an average market value of farm assets of$837,000, with about 40 percent in the 100,000 to 599,999 category. These were relativelylarge farms compared to national averages across all farms of 487 acres of land per farm and$507,426 of market value of assets (1997 Census of Agriculture). The average age of theparticipants of the survey was 50.5 years. This is similar to the participants of Asplund,Forster, and Stout’s (1989) survey (51 years) and to the national average of 54.3 yearsreported by 1997 Census of Agriculture. Summary statistics of the independent variables usedin empirical estimation are presented in Table 2.
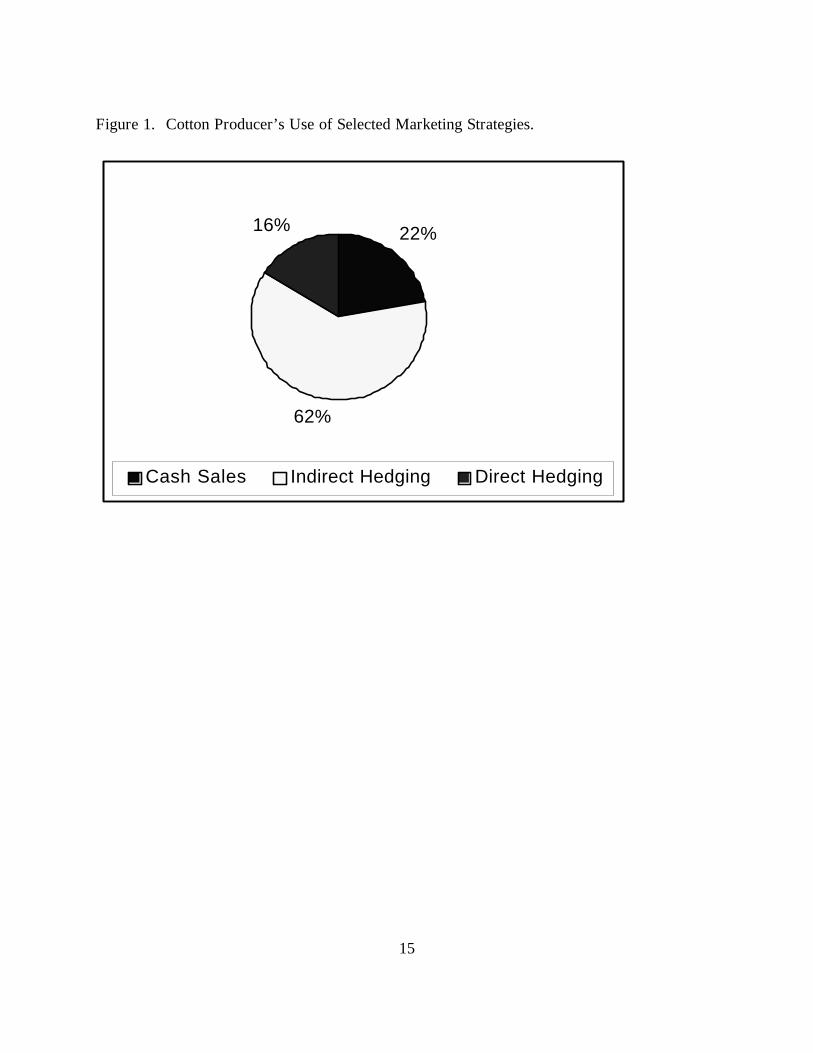
The survey reveals that about 22 percent of producers sold most of their crop in thecash market, about 62 percent used indirect hedging strategies and about 16 percent of cottonproducers used futures and options markets to price most of their crop in 1999 (Figure1). Thesurvey also demonstrates that about 65 percent of cotton producers marketed their cottonthrough a single marketing channel. The other 35 percent of producers utilized somecombination of several marketing strategies, typically marketing the majority of their cropthrough one primary source. Therefore, the discrete choice modeling approach taken in thisstudy to analyze marketing behavior of cotton producers appears justified.

8
Estimation Results
Overall, the estimated model is highly significant in explaining producers’ selection ofpreferred marketing strategies with a Chi-squared value of 75, which is statistically significantat the 0.01 level. Another measure of the goodness of fit is the model’s likelihood ratio index,which was equal to 0.62. This measure is somewhat analogous to the R-squared in theconventional regression models (Greene, 1997). Another indication of the goodness of fit isthe model’s predictive power. The predictive power of the model is examined by comparingthe actual choices of the primary marketing strategies to the ones predicted by the model. Themodel correctly predicted about 78 percent of marketing choices for the sample of producersused in this analysis. The model correctly predicted about 63 percent of the cash sales, 88percent of indirect hedging, and about 59 percent of direct hedging observations as a primarymarketing tool. Thus, the predictive power of the model appears satisfactory.
The results of model estimation are presented in Table 3. Estimated coefficients of themultinomial logit model reflect the effect of changes in independent variables on the log of theratios of the probabilities (equation 4). Thus, coefficients presented in Table 3 reflect theeffect of changes in independent variables on the probability of selecting indirect hedging(pools or forward contracts) or direct hedging (with futures and/or options) relative to a basescenario of selling cotton in the cash market (choice k in equation 4).
The results indicate that the probability of selecting indirect hedging over cash selling isdirectly related to farm size and agreement with Attitude1 (“A marketing pool nets me a higherprice than I can get myself”) and Attitude2 (“I prefer to use other means of risk managementrather than hedging”), and inversely related to income from government payments and off-farm income. The probability of selecting direct hedging over cash sales is directly related torisk aversion, farm size, and purchases of additional levels of crop insurance, and inverselyrelated to income from government payments and agreement with Attitude2.
Because estimated coefficients of the multinomial logit model are somewhat difficult tointerpret, another set of results is presented in the form of marginal effects evaluated at themeans of independent variables (Table 4). Marginal effects denote the effect of a change in theindependent variable on the probability of choice in dependent variable (equation 5). Themarginal effects demonstrate that, at the means of all independent variables, the probability ofchoosing cash sales is 14 percent, the probability of choosing indirect hedging is 78 percent,and the probability of choosing direct hedging as a primary marketing tool is 8 percent. Thus,the model overestimated the probability of choosing indirect hedging, and underestimated theprobability of choosing cash sales and direct hedging as primary marketing tools.
Table 4 illustrates that the probability of choosing cash sales as a primary marketingstrategy is directly related to off-farm income, and income from government payments, andinversely related to agreement with Attitude1 and farm size. Risk aversion, crop insurance,and agreement with Attitude1 are marginally significant (at 20 percent level) and inversely

9
related to the probability of choosing cash sales. The probability of choosing indirect hedgingas a primary marketing strategy is positively affected by agreement with Attitude1 andAttitude2, and negatively affected by off-farm income and income from government payments.The choice of direct hedging is negatively correlated with agreement with Attitude1 andAttitude2. Farm size and crop insurance are marginally significant (at 20 percent level) andhave a positive effect on the probability of choosing direct hedging.
The statistical significance of the marginal effects of some variables discussed abovewas fairly low because of the small sample size. However, the relationships revealed by thesemarginal effects are consistent with those identified by parameter estimates. Also, theserelationships are consistent with theory and support the hypotheses proposed in the conceptualframework. Therefore marginally significant variables are included in the discussion.
Agreement with Attitude1 is significant in the choice of all selected marketingstrategies. This question is designed to measure producer perceptions of their marketingabilities relative to the pools. Only 16 percent of producers rate their marketing abilitieshigher than that of the pools. Consequently, this variable indicates that because producers donot think highly of their personal marketing abilities, they prefer to purchase marketingservices from pools. These results also suggest that the belief that marketing pools obtainhigher prices for their members makes them more attractive than alternative marketingstrategies. These price premiums may be associated with better marketing practices as well asother advantages of marketing through a pool, which may include quantity and qualitypremiums resulting from marketing larger lots and/or better combinations of quality as well assavings on transaction costs, including manager’s time and money allocated on collectingmarket information, and additional liquidity available at harvest time when crop is relinquishedto a pool.
Agreement with Attitude2 (“I prefer to use other means of risk management rather thanhedging”) is also significant in the choice of all selected marketing strategies. This variableindicates the effect of producer preferences on his/her marketing decisions. The marginaleffects of this variable indicate that a one unit increase in the level of agreement with Attitude2results in a six percent decrease in the probability of choosing cash sales, an 11 percentdecrease in the probability of choosing direct hedging, and an 18 percent increase in theprobability of choosing indirect hedging as a primary marketing tool. This evidence suggeststhat the preferred marketing choice of cotton producers is indirect hedging (this category isprimarily composed of pool sales, but forward contracting is also an important marketingmethod).
Percent off-farm income is significant in the choice of cash sales and indirect hedgingas primary marketing tools. It appears that producers that have a large share of their totalincome coming from off-farm sources may be less inclined to use indirect hedging and morelikely to choose cash sales as their primary marketing tool. This result is consistent withShapiro and Brorsen’s (1988) findings. This evidence suggests that drawing income from

10
diversified sources substitutes for the use of forward pricing methods, indirect hedging inparticular. This result also provides evidence for the risk-reducing characteristics of off-farmincome.
According to the marginal effects, income from government payments is directlyrelated to the probability of choosing cash sales and inversely related to the probability ofchoosing indirect hedging as a primary marketing tool. Parameter estimates also suggest thatincome from government payments had a negative impact on the probability of choice of directhedging as a primary marketing strategy. These results confirm the hypothesis about risk-reducing properties of government payments, and suggest that because producers’ income isprotected in part by government payments, they are less inclined to use forward pricingstrategies and more likely to choose cash sales as their primary marketing tool.
Cotton acreage, included as a measure of farm size, is negatively related to theprobability of choosing cash sales and positively related to the probability of choosing directhedging as a primary marketing method. This evidence supports the economies of sizehypothesis, which is consistent with the previous studies (Goodwin and Schroeder, 1994;Asplund, Forster, and Stout, 1989; and Shapiro and Brorsen, 1988).
Producers that purchased additional crop insurance above the minimal level required toremain eligible for government payments are 11 percent more likely to choose cash sales and 9percent more likely to choose direct hedging as their primary marketing tool. This findingindicates a complimentary relationship between crop insurance and the use of direct hedging.About 80 percent of the sample of producers in this analysis purchased MPCI, which is a yieldinsurance product. Thus, this result is consistent with Coble, Heifner, and Zuniga’s (2000)findings, that indicate a complimentary relationship between yield insurance products anddirect hedging. This result may also imply that producers who purchase crop insurance aregenerally more risk averse, therefore they are more likely to use forward pricing techniquessuch as hedging.
Coefficients suggest that risk aversion is positively associated with the probability ofchoosing direct hedging as a primary marketing strategy. According to marginal effects, riskaversion is also marginally significant in influencing the probability of choosing cash sales as aprimary marketing strategy. The signs of the estimated coefficients suggest that risk aversionleads producers away from cash sales to alternative marketing strategies, direct hedging inparticular. These findings are consistent with expectations and imply that producers considercash sales a relatively risky method of marketing. They also confirm the view that forwardpricing (direct hedging in particular) is used as a risk reducing marketing method.
This analysis found no evidence that level of producer education, marketing specifictraining, long-term debt, and agreement with Attitude3 (“I believe that market timing strategiescan increase revenues”) have significant impact on hedging behavior. The lack of significanceof marketing specific training is consistent with Shapiro and Brorsen’s (1988) findings. This

11
evidence implies that additional marketing specific training is not effective in alteringproducer marketing practices.
Levels of formal education and leverage are also insignificant in determining the choiceof a primary marketing strategy by cotton farmers. This result contradicts previous studies byShapiro and Brorsen (1988), Goodwin and Schroeder (1994), and Asplund, Forster, and Stout(1989). This result may be caused by the measurement limitations of the variables used in thisstudy. Another variable that is not statistically significant in the estimated model is theagreement with Attitude3 (“I believe that market timing strategies can increase revenues”).Considering that 78 percent of respondents agreed or strongly agreed with this statement, thisfinding suggests that price premiums expected from market timing strategies are not strongmotivators of producer marketing behavior. This outcome could have resulted from the factthat few producers believe in their individual marketing abilities (only 16 percent of producersdisagreed with Attitude1 “A marketing pool nets me a higher price than I can get myself”).
Summary and Conclusions
This study is designed to analyze producer hedging decisions in the context of theiroverall marketing behavior. This approach involves examination of producer marketingbehavior as a choice between alternative marketing strategies (cash sales, indirect hedging, anddirect hedging). This study extends the previous models of hedging behavior by overcomingthe dichotomy of forward pricing versus cash sales. This analysis disaggregates forwardpricing decisions into direct (futures and options) and indirect (pools and forward contracts)hedging and examines all three marketing alternatives simultaneously. The results of themultinomial logit model estimation suggest that, at the means of independent variables, theprobability of choice of cash sales is 14 percent, the probability of choosing indirect hedging is78 percent, and the probability of choosing direct hedging as a primary marketing tool is 8percent. These results appear to perform well in explaing the empirical evidence reported inthe previous studies (Table 1) and the results of the survey reported in this study (Figure 1).The findings of this study highlight the importance of indirect hedging for cotton marketing,marketing through pools in particular. About 50 percent of cotton producers marketed theircotton through pools. Such a high share of marketing through pools is not typical for othercommodities and may reflect some unique aspects of cotton marketing including economic andnon-economic factors.
Disaggregation of forward pricing into direct and indirect hedging alternativespermitted determination of the specific impacts of motivating factors on the choice of particularmarketing alternatives. For example, purchases of additional levels of crop insurance and riskaversion were significant for direct hedging decisions but not for indirect hedging decisions.Similarly, off-farm income had a significant influence on the indirect hedging decisions, butnot on direct hedging decisions.

12
The results of a multinomial logit model identified a number of factors that affect theprobability of choosing one of the selected marketing strategies by cotton producers. The mostimportant factors that explain the use of forward pricing by cotton producers are producerpreferences, farm size, crop insurance, risk aversion, income from government payments andoff-farm income. To the extent that the sample is representative, this study provides someinteresting implications. For example, producer preferences were one of the most importantfactors affecting hedging behavior (consistent with Shapiro and Brorsen, 1988), while someeconomic variables were not statistically significant.
This study also identified certain producer characteristics, which increase theprobability of choice of certain marketing strategies. For example, owners of large farms,producers that are more risk averse, individuals that purchased additional levels of cropinsurance, farmers that receive a fairly small share of their income in the form of governmentpayments and those who did not indicate any personal preference of other forms of riskmanagement and don’t believe in price premiums associated with marketing through pools willbe more likely to use direct hedging as their primary strategy. These results can be used byeducators to better tailor their training programs to the specific needs of the audiences theyaddress. Targeting learning about other forms of marketing such as pools and forwardcontracts, in addition to futures/options, also appears warranted given the conditions andpreferences expressed by producers.
Another set of results may be of interest to policy makers. This study reveals anegative impact of income from government programs on the use of forward pricingtechniques. This finding suggests that as long as government payments remain in place,producer use of forward pricing is likely to remain low. Since the passage of the 1996 FAIRAct, Congress discussed the need to assist farmers and ranchers in becoming active riskmanagers. Numerous grants have been funded to support educational programs focusing onvarious risk management tools including crop insurance and futures and options. However,efforts to support producer’s income and encourage use of futures and options appearcontradictory based on the evidence presented in this study as well as prior theoretical models.
References
Agriculture Fact Book 1998: Chapter 7-D.(http://www.usda.gov/news/pubs/fbook98/ch7d.htm.) Accessed 6/19/00.
Asplund, N.M., D.L. Forster, and T.T. Stout. “Farmers’ Use of Forward Contracting andHedging.” Review of Futures Markets, 8 (1989): 24-37.
Brorsen, B.W. “Optimal Hedge Ratios with Risk-Neutral Producers and Nonlinear BorrowingCosts.” American Journal of Agricultural Economics 77 (1995): 174-181.

13
Coble, K.H., Heifner, R.G., and M. Zuniga. “Implications of Crop Yield and RevenueInsurance for Producer hedging Demand.” Working Paper, Department of AgriculturalEconomics, Mississippi State University, 2000.
Collins, R.A. “Expected Utility, Debt-Equity Structure, and Risk Balancing.” AmericanJournal of Agricultural Economics 67 (1985): 627-629.
Collins, R.A. “Toward a Positive Economic Theory of Hedging.” American Journal ofAgricultural Economics 79 (1997): 488-499.
Featherstone, A.M., C.B. Moss, T.G. Baker, and P.V. Preckel. “The Theoretical Effects ofFarm Policies on Optimal Leverage and the Probability of Equity Losses.” AmericanJournal of Agricultural Economics 70 (1988): 572-579.
Gabriel, S.C., and C.B. Baker. “Concepts of Business and Financial Risk.” AmericanJournal of Agricultural Economics 62 (1980): 560-564.
Goodwin, B.K., and T.C. Schroeder. “Human Capital, Producer Education Programs, andthe Adoption of Forward Pricing Methods.” American Journal of Agricultural Economics76 (1994): 936-947.
Greene, W.H. Econometric Analysis. Third edition, Prentice Hall, NJ, 1997.
Hanson, S. D., R.J. Myers, and J.H. Hilker. “Hedging with Futures and Options under aTruncated Cash Price Distribution.” Journal of Agricultural and Applied Economics 31, 3(1999): 449-459.
Huffman, W. E. “Farm and Off-Farm Work Decisions: The Role of Human Capital,”Review of Economics and Statistics 62 (1980): 14-23.
Khaldi, N. “Education and Allocative Efficiency in U.S. Agriculture,” American Journal ofAgricultural Economics 57 (1975): 650-657.
Musser, W.N., G.F. Patrick, and D.T. Eckman. “Risk and Grain Marketing Behavior ofLarge-Scale Farmers.” Review of Agricultural Economics 18 (1996): 65-77.
Patrick, G.F., W.N. Musser, and D.T. Eckman. “Forward Marketing Practices and Attitudesof Large-Scale Midwestern Grain Producers.” Review of Agricultural Economics 20(1998): 38-53.
Pennings, J.M.E., and R.M. Leuthold. “The Role of Farmers’ Behavioral Attitudes andHeterogeneity in Futures Contracts Usage.” American Journal of Agricultural Economics82 (2000): 908-919.

14
Pindyck, R.S., and Rubinfeld, D.L. Economentric Models and Economic Forecasts. Thirdedition, McGraw-Hill, Inc., 1991.
Ratneshwar, S., and D. Stewart. “Research Nonresponse in Mail Surveys: An IntegrativeReview.” Applied Marketing Research 29, 3 (1989): 37-46.
Saking, Y., D.J. Hayes, and A. Hallam. “Hedging Production Risk with Options.” AmericanJournal of Agricultural Economics 75 (1993): 408-415.
Shapiro, B.I.,, and B.W. Brorsen. “Factors Influencing Farmers= Decisions of Whether orNot to Hedge.” North Central Journal of Agricultural Economics 10 (1988): 145-53.
Tronstad, R. “The Effects of Firm Size and Production Cost Levels on Dynamically Optimalafter-tax Cotton Storage and Hedging Decisions.” Southern Journal of AgriculturalEconomics (1991): 165-179.
Turvey, C.G., and T.G. Baker. “Optimal Hedging under Alternative Capital Structures andRisk Aversion.” Canadian Journal of Agricultural Economics 37 (1989): 135-143.
Turvey, C. G., and T.G. Baker. “A Farm-Level Financial Analysis of Farmers’ Use ofFutures and Options Under Alternative Farm Programs.” American Journal ofAgricultural Economics 72 (1990): 946-957.
Turvey, C. G. “The Relationship between Hedging with Futures and the Financing Functionof Farm Management.” Canadian Journal of Agricultural Economics 37 (1989): 629-638.
Wozniak, G.D. “The Adoption of Interrelated Innovations: A Human Capital Approach.”Review of Economics and Statistics 66 (1984): 70-79.
15
Figure 1. Cotton Producer’s Use of Selected Marketing Strategies.
22%
62%
16%
Cash Sales Indirect Hedging Direct Hedging

16
Table 1. Empirical Futures Use.
Authors Location Year Commodity Fut. Use(% of
producers)
Asplund, Forster and Stout Ohio 1987 Crop 7.00
Goodwin and Schroeder Kansas 1992 WheatCornSorghumSoybeans
5.9110.731.845.22
Patrick, Musser, Eckman Indiana 1995 SoybeansCorn
8.1016.2

17
Table 2. Summary Statistics for Variables Used in the Empirical Estimation.
Variable Definition Mean StandardDeviation
Education 1=less than high school, 2=high schooldiploma or GED, 3=college, and 4=graduate school
2.71 0.70
Training Hours of training attended 4.73 9.73
RiskAversion Self-assessment of the willingness to takerisks relative to others on a scale from 1to 10 with 10 being the most risky
5.72 1.96
Leverage The proportion of the market value of thefarm assets that was borrowed in 1999
0.18 0.20
Size Cotton acres (thousands) 0.74 0.68
GovPayments Percent gross farm income fromgovernment paymentsa
0.27 0.15
OffIncome Off-farm income/gross farm income 0.20 0.25
CrInsurance 1 if producer bought additional levels ofcrop insurance above CAT coverage, 0otherwise
0.64 0.48
Attitude1 A marketing pool nets me a higher pricethan I can get myselfb
3.48 1.08
Attitude2 I prefer to use other means of riskmanagement rather than hedgingb
3.59 0.91
Attitude3 I believe that market timing strategies canincrease revenuesb
3.91 0.69
a Includes disaster payments, loan deficiency payments, producer option payments, and AMTA(transfer) payments.b Likert-scale questions from 1 to 5 with 5 indicating the highest level of agreement.

18
Table 3. Maximum Likelihood Estimates of the Probability of Using Indirect Hedging andDirect Hedging Relative to the Base Scenario of Selling Cotton in the Cash Market.a
Indirect Hedging Direct Hedging
Intercept -7.919***(3.176)
-3.342(4.229)
Education 0.330(0.437)
0.340(0.626)
Training 0.060(0.070)
0.024(0.073)
RiskAversion 0.204(0.162)
0.375**(0.231)
Leverage 0.170(1.636)
2.180(2.210)
Size 1.360*(0.887)
2.018***(0.978)
GovPayments -5.545***(2.422)
-5.708*(3.640)
OffIncome -2.971***(1.390)
0.647(1.358)
CrInsurance 0.821(0.683)
1.967**(1.129)
Attitude1 0.958***(0.338)
0.139(0.463)
Attitude2 0.680**(0.402)
-0.940**(0.492)
Attitude3 0.527(0.447)
0.266(0.642)
Chi-squaredLikelihood ratio index
74.824***0.62
aNumbers in parentheses are asymptotical standard errors. The *, **, and *** indicate coefficientsasymptotically significant at 15, 10, and 5 percent levels, respectively.

19
Table 4. Marginal Effects of Market Strategy Choice Model Evaluated at the Means ofIndependent Variables.a
CashIndirectHedging
DirectHedging
Intercept 0.910***(0.399)
-1.157***(0.495)
0.247(0.280)
Education -0.040(0.053)
0.036(0.066)
0.004(0.040)
Training -0.007(0.008)
0.009(0.008)
-0.002(0.002)
RiskAversion -0.027(0.020)
0.118(0.025)
0.015(0.015)
Leverage -0.433(0.195)
-0.106(0.236)
0.149(0.139)
Size -0.173**(0.093)
0.109(0.099)
0.064(0.047)
GovPayments 0.675***(0.309)
-0.601*(0.386)
-0.075(0.237)
OffIncome 0.335**(0.181)
-0.472***(0.238)
0.137(0.116)
CrInsurance -0.113(0.086)
0.019(0.107)
0.093(0.070)
Attitude1 -0.107***(0.044)
0.156***(0.052)
-0.049*(0.031)
Attitude2 -0.064(0.049)
0.176***(0.066)
-0.111***(0.043)
Attitude3 -0.061(0.052)
0.074(0.067)
-0.013(0.041)
P of choice atmean 0.141 0.779 0.080
Actual Choice 24 67 17
CorrectlyPredicted 15 59 10
aNumbers in parentheses are asymptotical standard errors. The *, **, and *** indicate coefficientsasymptotically significant at 15, 10, and 5 percent levels, respectively.