Response to Illinois AG motion for stay relief.final for ...
Upload
coby-redingCategory
view
214download
0
Factors Affecting Farmland Markets
Bruce J. Sherrick University of Illinois
The Changing Landscape of Ag Banking in IllinoisIBA Ag Banking Conference
Sept. 7-8, 2006 – Springfield Illinois
visit us at: http://www.farmdoc.uiuc.edu/

Outline:
• Background, Ag B/S and Lender Shares
• Valuation and Income info – how linked?
• Investment performance of farmland
• Illinois land market updated survey information: who, why, what and how…
• Contemporary issues for farmland markets

U.S. Ag Sector Balance Sheet summary
Item ($millions)1970 1980 1990 2000 2006f
Farm assets 278,864 983,305 840,609 1,203,215 1,671,637Real estate 202,417 782,819 619,149 946,428 1,395,800Non real estate 76,447 200,486 221,459 256,787 275,837
Farm debt 48,753 166,824 137,962 177,637 218,717
Real estate 27,506 89,692 74,732 91,109 122,929 Nonreal estate 21,247 77,131 63,230 86,529 95,788
Equity 230,112 816,481 702,647 1,025,578 1,452,920 Selected Ratios:
Debt/equity 21.2% 20.4% 19.6% 17.3% 15.1%Debt/assets 17.5% 17.0% 16.4% 14.8% 13.1%Real estate value/equity 88.0% 95.9% 88.1% 92.3% 96.1%Real estate value/assets 72.6% 79.6% 73.7% 78.7% 83.5%Real estate debt to D 56.4% 53.8% 54.2% 51.3% 56.2%
US Totals, source USDA

Ag Sector Balance Sheet - keys
• Farmland represents 83.5% of farm assets and about 56% of farm debt (8/2006)
• Low aggregate leverage relative to other sectors (currently approx. 13.1% ag. D/A and shrinking slowly)
• Some shifting among debt providers, little shift between debt and equity
• Active equity market absence

Debt shares by Lender through time
Ag Real Estate Debt Shares
0.0%
5.0%
10.0%
15.0%
20.0%
25.0%
30.0%
35.0%
40.0%
45.0%
50.0%
1960
1964
1968
1972
1976
1980
1984
1988
1992
1996
2000
2004
Year
mar
ket
shar
e Farm Credit System
Farm Service Agency
Commercial banks
Life insurance co.
Individuals and others

Debt shares by Lender through time
Ag Non Real Estate Debt Shares
0.0%
10.0%
20.0%
30.0%
40.0%
50.0%
60.0%
1960
1964
1968
1972
1976
1980
1984
1988
1992
1996
2000
2004
Year
mar
ket
shar
e Farm Credit System
Farm Service Agency
Commercial banks
Individuals and others

“Illinois farmland will only experience about 4-5% average
appreciation in 2005” -Bruce Sherrick, 2004
History repeated… again“We have two great sources of profit in farming: first, rise in
the value of the land; and second, profit on the production of farm crops. The first has been the chief source.”
“I was wrong. Again.” -Bruce Sherrick, 2004, 2005, 2006, etc.
- George Morrow, 1886
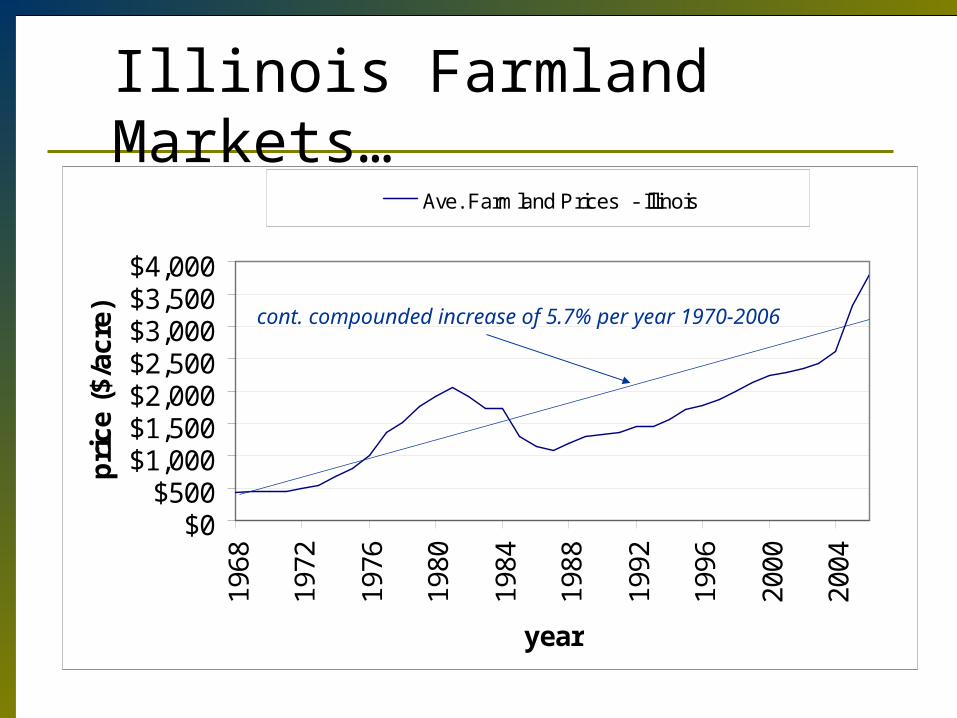
Illinois Farmland Markets…
$0$500
$1,000$1,500$2,000$2,500$3,000$3,500$4,000
1968
1972
1976
1980
1984
1988
1992
1996
2000
2004
year
pri
ce (
$/ac
re)
Ave. Farmland Prices - Illinois
source:USDA
cont. compounded increase of 5.7% per year 1970-2006
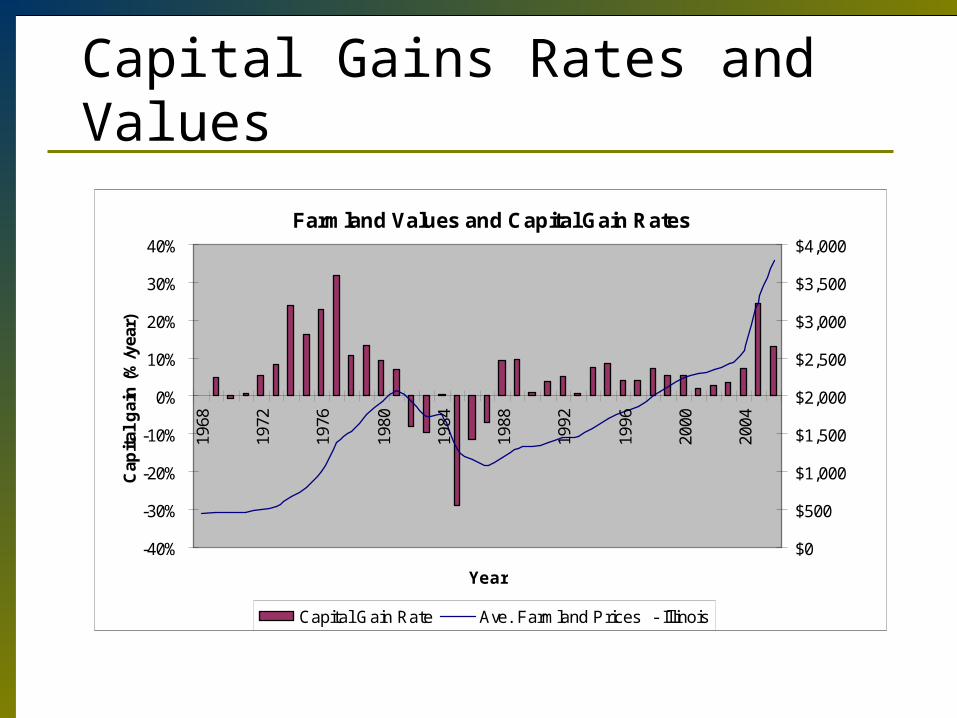
Capital Gains Rates and Values
Farmland Values and Capital Gain Rates
-40%
-30%
-20%
-10%
0%
10%
20%
30%
40%
1968
1972
1976
1980
1984
1988
1992
1996
2000
2004
Year
Cap
ital
gai
n (
%/y
ear)
$0
$500
$1,000
$1,500
$2,000
$2,500
$3,000
$3,500
$4,000
Capital Gain Rate Ave. Farmland Prices - Illinois

Components of return to Farmland
-40%-30%-20%-10%
0%10%20%30%40%
19
68
19
72
19
76
19
80
19
84
19
88
19
92
19
96
20
00
20
04
Capital Gain Rate Current Income Total Return - Illinois

Factors affecting farmland values
• Thin Markets – highly inelastic local demand• Performance relative to other investments• Composition of returns changing (farming, vs.
recreation, development and 1031 influence)• Recent income levels, interest rates• Changing lease markets, absentee ownership

• Thin – average of under 1% annual sales, arm’s length, available competitively, actual farmland intended usage– limited option to expand with contiguous/proximate
land through purchase– increases importance of lease markets in value
determination– “lumpy” land sales relative to leasing…leads to some exceptional localized events and
difficulty in assessing “average” value
Farmland Turnover -- Illinois

History of Farmland Returns as Investment
• Long progression of capital gains, one period of losses – data period important when assessing performance
• Capital Gains Rates (annual geometric):– 1950-2000: 5.6%– 1970-2000: 5.7%– 1980-2000: 2.0%– 1970-2006 Q2: 5.7% (est.)– 2004-2005 Illinois average increase 28% (USDA)– 2005-2006 Illinois forecast increase 15% (USDA)
• Plus: current income in 3-5% range from rent/operations
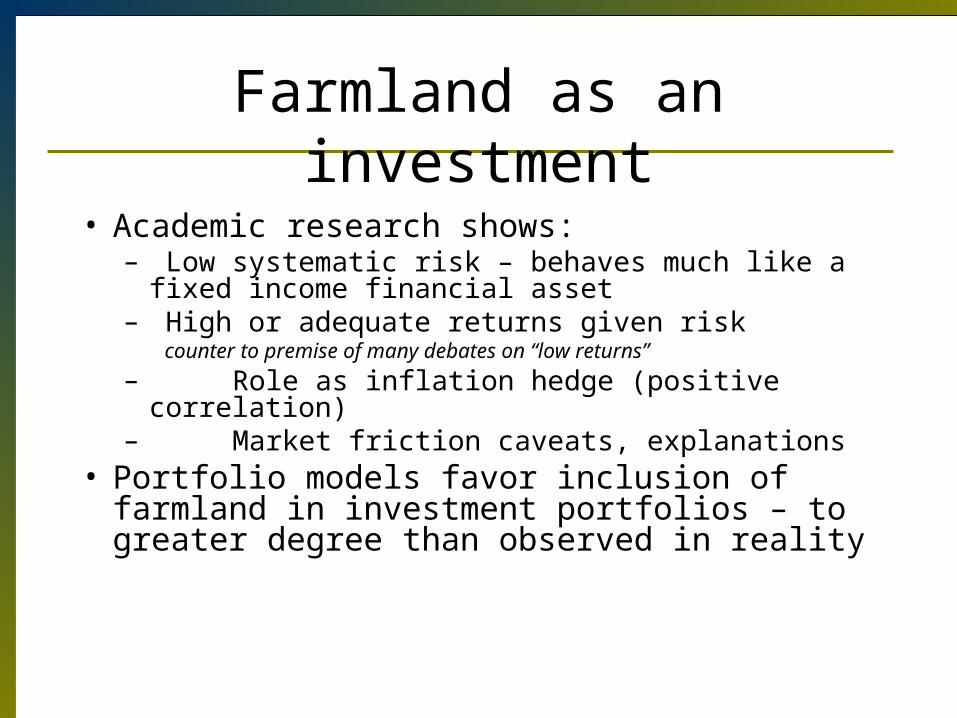
Farmland as an investment
• Academic research shows: – Low systematic risk – behaves much like a fixed
income financial asset – High or adequate returns given risk
counter to premise of many debates on “low returns”
– Role as inflation hedge (positive correlation)– Market friction caveats, explanations
• Portfolio models favor inclusion of farmland in investment portfolios – to greater degree than observed in reality

Correlations with Illinois Farmland Returns, 1970-2005
-40% -30% -20% -10% 0% 10% 20% 30% 40% 50% 60%
PPI
CPI
TBsm3m
All REITS
EAFE
S&P500
Aaa
Correlation with other financial assets’ returns
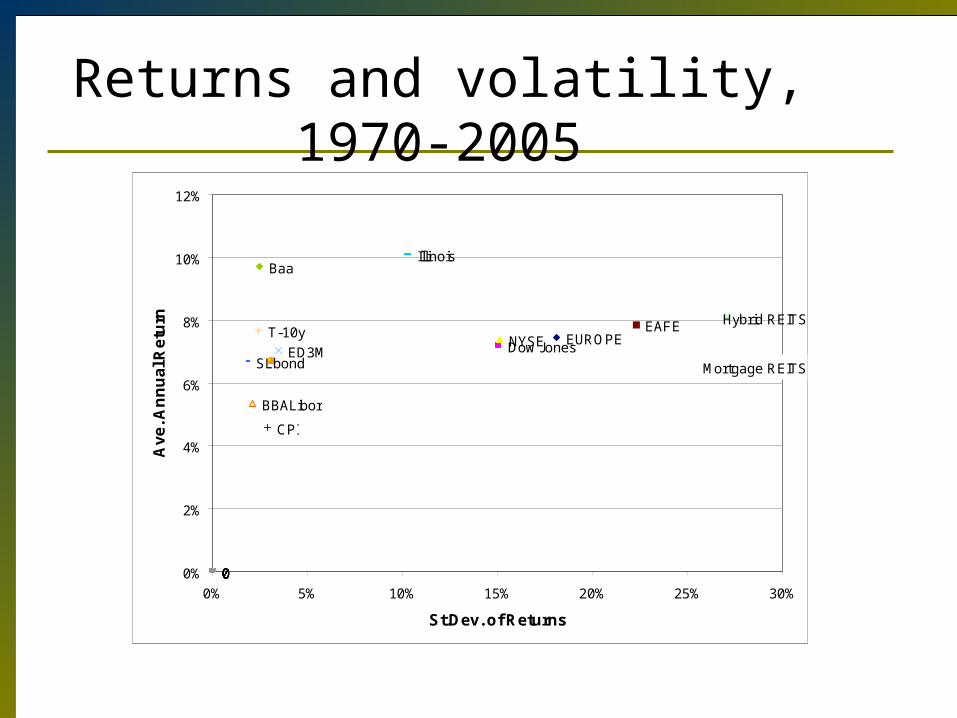
Returns and volatility, 1970-2005
EUROPEDow JonesNYSE
EAFE
Illinois
Hybrid REITS
BBALibor
ED3M
00
T-10y
SLbond
0
Baa
000
CPI
Mortgage REITS
0%
2%
4%
6%
8%
10%
12%
0% 5% 10% 15% 20% 25% 30%
St.Dev. of Returns
Av
e. A
nn
ua
l Re
turn

Relatively smooth returns seriesAnual Return
-1.00
-0.80
-0.60
-0.40
-0.20
0.00
0.20
0.40
0.60
0.80
1970 1974 1978 1982 1986 1990 1994 1998 2002
Year
Re
turn
Illinois PPI CPI TBsm3m All REITSEAFE S&P500 Aaa Equity REITS Mortgage REITSHybrid REITS BBALibor ED3M

… and fairly attractive levelsAverage Holding Period Rate of Return - held until present
-40.0%
-30.0%
-20.0%
-10.0%
0.0%
10.0%
20.0%
30.0%
40.0%
19
70
19
72
19
74
19
76
19
78
19
80
19
82
19
84
19
86
19
88
19
90
19
92
19
94
19
96
19
98
20
00
20
02
20
04
Date Purchased
Av
e R
etu
rn -
he
ld u
nti
l 20
04
Illinois PPI CPI TBsm3m All REITS EAFE S&P500

So what drives the Farmland market?
• Within Illinois, considerable risk differences, esp. North to South
• Risk-adjustment within class?– cash rent series by county (FBFM)– cash gross returns by county (farmdoc)– test fraction of expected return paid in form of
cash rent
• Strong evidence of within-class response

Farmland as an investment• Traditional Capitalization arguments: considerable
difference in rent and productivity lead to…..
Illinois
Pope0.05
Jefferson0.06
Franklin0.07
Clay0.08Marion
0.09
Williamson0.09
Hardin0.09
Perry0.09
Wayne0.10
Alexander0.11
Johnson0.11
Hamilton0.12
Washington0.12
Randolph0.13
Massac0.13
Bond0.14
Fayette0.14
Jackson0.15
Richland0.15
Lake0.16
Pulaski0.16
Union0.17
Clinton0.17
Saline0.17
White0.24
Cook0.25
Monroe0.25
Lawrence0.26
Effingham0.27
Edwards0.30
Jasper0.31
Madison0.31
Crawford0.35
Saint Clair0.35
Wabash0.36
Gallatin0.39
Brown0.40
Adams0.41
Calhoun0.42
Schuyler0.43
Will0.47
Cumberland0.48
Du Page0.48
Pike0.49
Clark0.51
Jersey0.52
Hancock0.54
Montgomery0.54
Kankakee0.54
Fulton0.56
Mason0.56
Winnebago0.57
McHenry0.57
Macoupin0.60
Ford0.60
Boone0.61
Greene0.62
Shelby0.62
Livingston0.62 Iroquois
0.63
Kendall0.63
Jo Daviess0.63
Scott0.65
Grundy0.67
Stephenson0.68
Vermilion0.69
Whiteside0.70
Rock Island0.72
Peoria0.72
Lee0.73
Marshall0.73
Cass0.74
McDonough0.75
Ogle0.76
Henry0.76
Kane0.77
Edgar0.77
Mercer0.77
Coles0.78
La Salle0.78
Carroll0.78
Knox0.79Henderson
0.79
Putnam0.80
Woodford0.80
Douglas0.80
Stark0.81
Menard0.81
Champaign0.82
Bureau0.83
Tazewell0.83
McLean0.83
De Kalb0.84
De Witt0.84
Christian0.85
Warren0.85
Logan0.85
Morgan0.86 Moultrie
0.87
Macon0.87Sangamon
0.88
Piatt0.89
Illinois Economic Productivity Index0.00 to 0.130.13 to 0.250.25 to 0.430.43 to 0.570.57 to 0.690.69 to 0.780.78 to 0.830.83 to 0.90
Illinois
Alexander
Calhoun
CookDu Page
Hardin
Jersey
Lake
Perry
Pope
Putnam
41
52
54
55
57
60
60
60
60
61
62
64
65
65
67
67
68
68
69
7071
72
74
76
78
86
88
90
90
9393
94
101 102
103
103
105
105
107
108108
108
109
109
110110
111
112
117
117
119
121
121
122
122
123
123
125
126126
126
127
127 127
127
128
129
129
129
130
130
130
133
133
134
134
134
134
135136
136137
137
137
139
139
140
140
140
141
141
142
Rent per acre0 to 2020 to 4040 to 6060 to 8080 to 100100 to 120120 to 140140 to 160

Farmland as an investment• Nothing much in aggregate…. Swamped by other effects
So, U of I Study of factors influencing farmland values finds following significant items (Huang, Sherrick, Miller, Gomez, 2006)
•Size of tract (-)
•SPR (+++)
•Distance to Chicago (++)
•Distance to metro location (++)
•Ruralness indicators (--)
•CPI (++)
•Population (+)
•Income (+)
•Livestock activities (+/-)
Illinois
Alexander
Calhoun
CookDu Page
Hardin
Jersey
Lake
Perry
Pope
Putnam
858
927
931
1046
1052
1080
1085
1088
1107
1111
1120
1177
1187
1227
1243
1251
1263
1276
1294
1308
1311
1362
1384
1405
1407 1407
1425
1430
1467
1492
1526
15341563
1577
1588
1649
1653
1672
1691
1694
1806
1814
1820
1820
1884
1916
1946
2014
2094
2098
2138
2147
2163
2174
2188
2189
2199
2257
2274
2281
2308
2342
2382
2428
2523
2557
2557
2566
2577
2625
2654
2676
2693
2737
2753
2783
2787
2789
2884
2935
2955
29643083
3124
3151
3313
3384
3718
3738
3865
3898
4289
Price per acre0 to 600600 to 12001200 to 18001800 to 24002400 to 30003000 to 36003600 to 42004200 to 4800

Land Market Information – ISPFMRA annual survey

ISPFMRA2005-2006 Land Value Trends
Area
PrimeFarmland
GoodFarmland
AverageFarmland
RecreationalLand
Northern Region
(1 & 2)
+12% +13% +18% +25%
Central Region
(3, 4, 5, 6, & 7)
+8% +5% +9% +16%
Southern Region
(8, 9, & 10)
N/A +9% +13% +13%

ISPFMRA 2006 -- Survey says…
Ave Cash RentPer Acre
(Typical of all leases in region)
7000 8% Up 10% 170 0% 175
Good Productivity 6000 9% Up 10% 155 3% 150
Average Productivity 4500 18% Up 10% 135 0% 130
Transitional Tracts 18000 12% Steady
Transitional to Active Development 50000 11% Up 10%
Ave. Cash rent/acre on
recently negotiated
% Change from prior year
Region 1 - Northeastern Illinois Farm Classification
Total Value Per Acre (Typical)
% Change in $/acre from prior
year
Change in rate of land turnover (up, steady,down) and
%

ISPFMRA 2006 -- Survey says…
Ave Cash RentPer Acre
(Typical of all leases in region)
Excellent Productivity $4,500 - $5,000 Up 7% 180 0 180
Good Productivity $3,200 - $4,000 Up 7% 166 0 170
Average Productivity $2,000 - $3,000 Up 7% 120 0 120
Transitional Tracts $8,000 - $16,000 Up 7% N/A
Ave. Cash rent/acre on
recently negotiated
% Change from prior
year
Region 6 - Central IllinoisFarm
ClassificationTotal Value Per Acre (Typical)
% Change in $/acre from prior year

ISPFMRA 2006 -- Survey says…
Ave Cash RentPer Acre
(Typical of all leases in region)
Good Productivity 3425 up 10% steady 120-150
Average Productivity 1669 up 14% steady 70-90
Recreational Land 1615 up 14% up 5% n/a
Region 10 - Southern Illinois Farm Classification
Total Value Per Acre (Typical)
% Change in $/acre from prior year
Change in rate of land turnover
(up, steady,down) and %

Estate sales prevail ..
Sellers of Farmland, Illinois, 2005.
1
17
6
43
22
11
0 10 20 30 40 50
Others
Individuals
Institutions
Estate sales
Retired farmers
Active farmers
Percent

Reasons for Selling Farmland, Illinois, 2005.
1
5
4
37
4
7
42
0 10 20 30 40 50
Other
Close-out undivided interest
Re-orient investment
Received a good price
Forced liquidation
Need cash
Settle estate
Percent
Estate settlement leads motivations..

Investors remain main buyers..
Type of Farmland Buyers, Illinois, 2005.
2
10
1
10
36
10
31
0 10 20 30 40
Other
Recreational buyers
Institutions
Local investors
Non-local investors
Relocating farmers
Local farmers
Percent
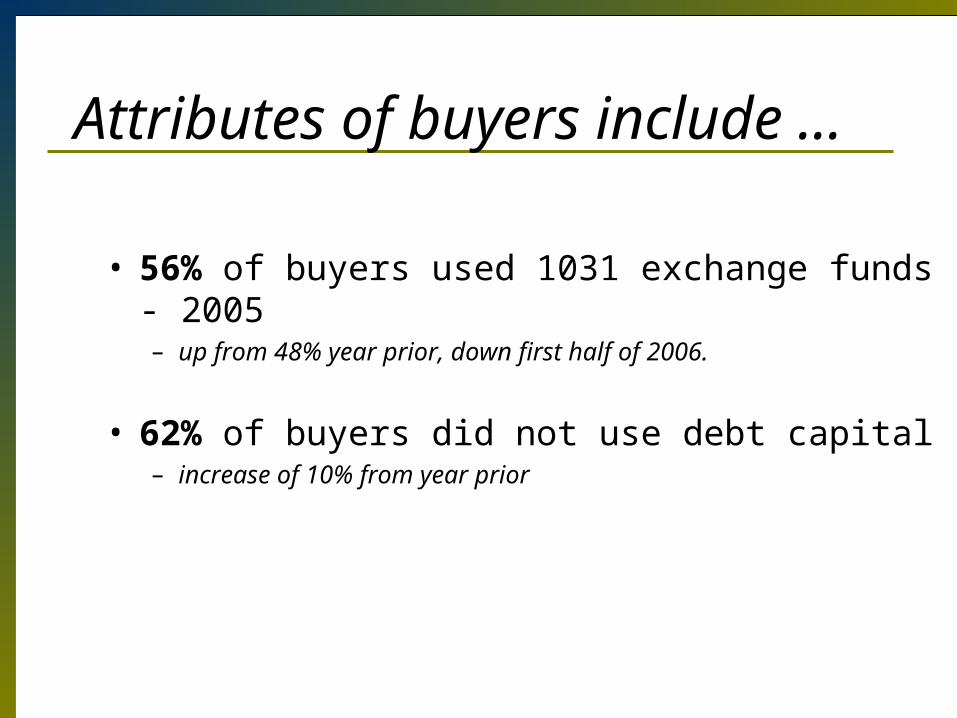
Attributes of buyers include …
• 56% of buyers used 1031 exchange funds - 2005– up from 48% year prior, down first half of 2006.
• 62% of buyers did not use debt capital– increase of 10% from year prior
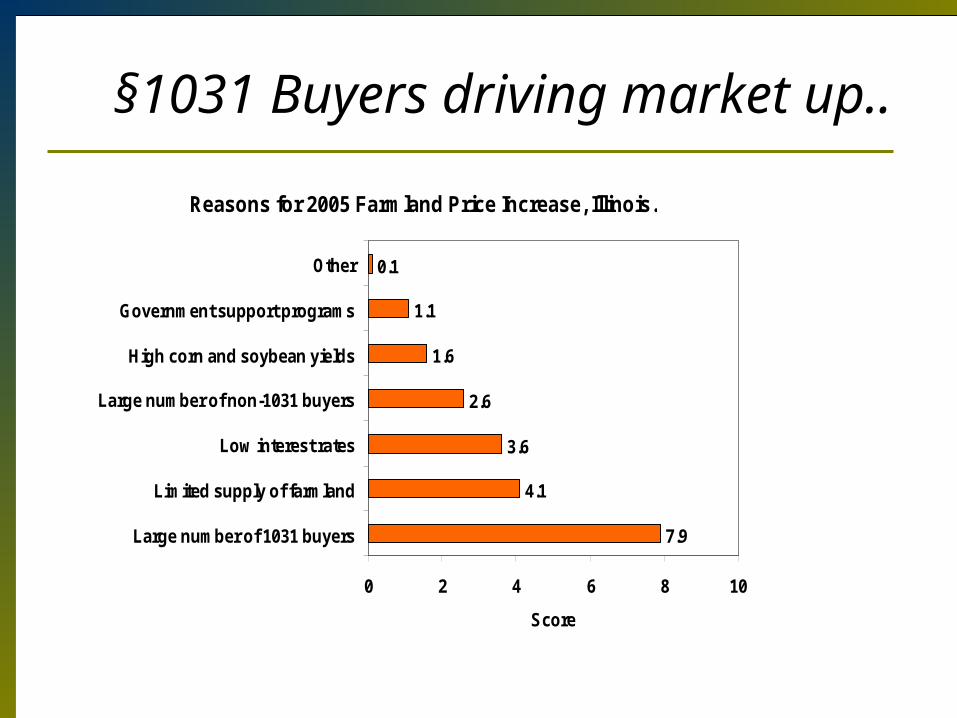
§1031 Buyers driving market up..
Reasons for 2005 Farmland Price Increase, Illinois.
7.9
4.1
3.6
2.6
1.6
1.1
0.1
0 2 4 6 8 10
Large number of 1031 buyers
Limited supply of farmland
Low interest rates
Large number of non-1031 buyers
High corn and soybean yields
Government support programs
Other
Score

Location of 1031 Buyers, Illinois, 2005.
Chicago Area57%
St Louis7%
Outside Illinois
6%
Local Area24%
Other Illinois Area6%
Chicago impacts dominate..

Price Increase Expected in 2006
Expected Change in Farmland Price During 2006, Illinois.
1
4
17
61
15
2
0 10 20 30 40 50 60 70
Decrease more than 10%
Decrease between 6 and 10%
Decrease between 0 and 5%
Increase between 0 and 5%
Increase between 6 and 10%
Increase more than 10%
Percent of Respondents

Stable Trend expected for 2007
Expected Change in Farmland Price During 2007, Illinois.
0
2
31
61
4
2
0 10 20 30 40 50 60 70
Decrease more than 10%
Decrease between 6 and 10%
Decrease between 0 and 5%
Increase between 0 and 5%
Increase between 6 and 10%
Increase more than 10%
Percent of Respondents

Cash rent and custom farming returns thought to be higher..
Lease type Excellent Good Average Fair
Traditional crop share 120 110 95 78
Cash rent 150 135 120 103
Custom farming 160 145 130 100
Land Quality
Table 1. Per Acre Farm Incomes that Landlords Receive for Different Lease Types and Land Qualities, 2005.
------------------ $ per acre ---------------------

Cash Rent variability by quality..
Lease type Excellent Good Average Fair
High 1/3 190 175 150 125
Mid 1/3 170 150 130 110
Low 1/3 150 130 110 90
Land Quality
Table 2. Per Acre Cash Rents for Top 1/3, Mid 1/3, and Low 1/3Cash Rent Leases by Land Quality, 2005.
----------------- $ per acre ----------------------
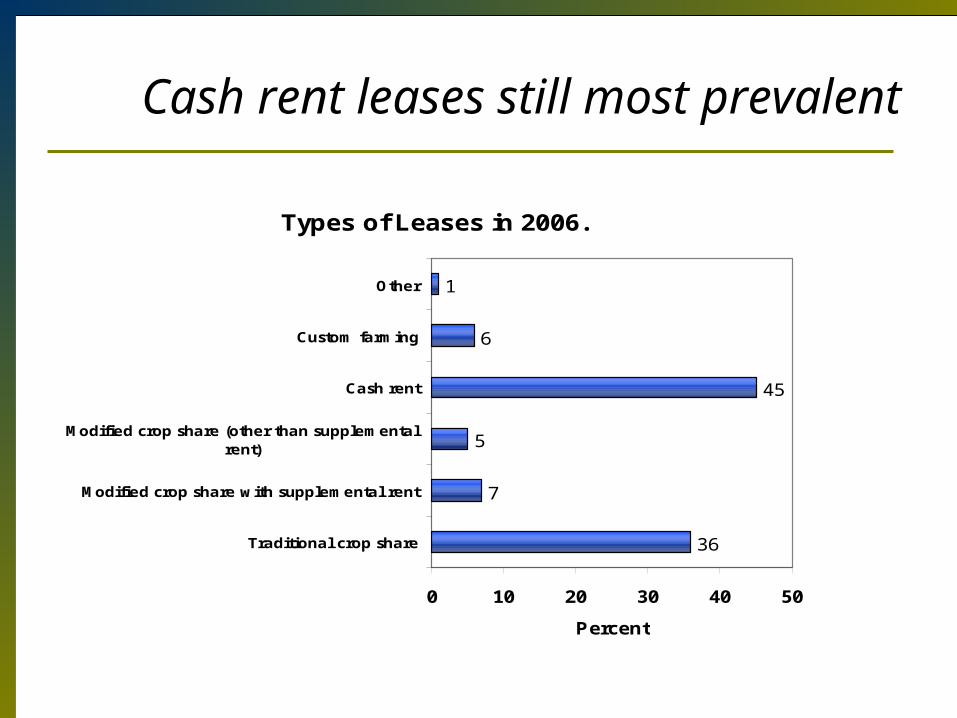
Cash rent leases still most prevalent
Types of Leases in 2006.
36
7
5
45
6
1
0 10 20 30 40 50
Traditional crop share
Modified crop share with supplemental rent
Modified crop share (other than supplementalrent)
Cash rent
Custom farming
Other
Percent
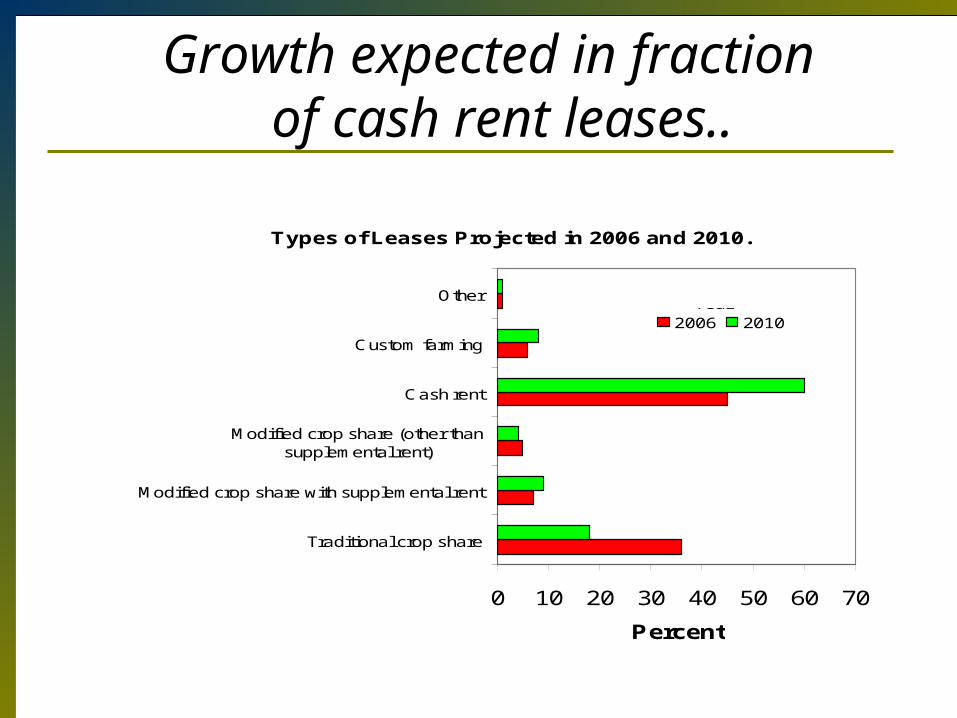
Growth expected in fraction of cash rent leases..
Types of Leases Projected in 2006 and 2010.
0 10 20 30 40 50 60 70
Traditional crop share
Modified crop share with supplemental rent
Modified crop share (other thansupplemental rent)
Cash rent
Custom farming
Other
Percent
2006 2010Year

Contemporary Issues:
• Role of government (payments average 24% of income, 32% pre-, regulation, and changing program design and emphasis)
% farm income from government direct payments
0%
10%
20%
30%
40%
50%
60%
70%
1970 1975 1980 1985 1990 1995 2000 2005
Year
Sh
are
• Energy Bill or Farm Bill? Food v. Farm programs? • Property Tax Updates• Term Structure impacts • What’s on the “Horizon” with competition• Basel II and other badly kept secrets

Questions/Comments?
Thanks!visit farmdoc on the web at: http://www.farmdoc.uiuc.edu/